
International Journal of Management, Accounting and Economics
Vol. 8, No. 5, May, 2021
ISSN 2383-2126 (Online)
© Author(s), All Rights Reserved www.ijmae.com
296
Original Research
Personality or Quality: Influencing Factors in
Customers' Intention to Revisit Beauty Salons in
Iran
Mohammad Karami1 Department of Business Administration, Faculty of Business and Economics,
Near East University, Nicosia, Cyprus
Shokoufeh Karami Department of Business Administration, Amin Institute of Higher Education,
Isfahan, Iran
Naser Elahinia Department of Business Administration, Faculty of Business and Economics,
Eastern Mediterranean University, Famagusta, Cyprus
Abstract
In the last two decades, research on investigating factors influencing the
consumer repurchase intention has advanced and become an important topic in
the marketing society and literature. The objective of this paper is to compare
the weight of service providers’ personality traits and service quality
performances they provide to uncover the primary factor influencing a clients’
intention to revisit their beauty salon in a long-term relationship. The
SERVQUAL model of service quality and Mini-Marker model of personality
were employed to substantiate the hypothesized relationship. Based on 453 valid
respondents from beauty salons’ visitors, empirical finding remarkably indicate
that the hairstylist’s personality was the primary reason for clients to revisit
beauty salons. The results demonstrate that the factors such as agreeableness,
intellect, conscientiousness and extraversion respectively have been prioritized
as the most effective reasons for re-visitation in the view of customers. From the
service quality side, the dimension of tangibility is ranked as the first reason to
revisit the beauty salon. Overall, the outcome of this study can be applied to
beauty salons’ management process in the line with building a strong long-term
customer relationship and in return sustain profitability.
Keywords: SERVQUAL, Big-Five personality traits, Mini-Marker model,
repurchase intention, beauty salon, Iran.
1 Corresponding Author’s Email: [email protected]

International Journal of Management, Accounting and Economics
Vol. 8, No. 5, May, 2021
ISSN 2383-2126 (Online)
© Author(s), All Rights Reserved www.ijmae.com
297
Introduction
The beauty sector is one of the most flourishing service industries in many countries
including Iran (Statista, 2020). The growing number of beauty salons, training schools,
and hairstylists and the increase in demand for a variety of services in Iran, support the
growth and importance of this market (statistics center of Iran, 2019). Therefore, to have
a successful business, this market must be seriously studied and explored. Similar to other
service sectors, beauty salons are also a customer-oriented market (Brady & Cronin,
2001). Building a strong long-term customer relationship will enhance the capability of
satisfying the needs of both salon and clients, helping beauty salons to be more successful
in the market (Hellier et al., 2003; Stankevich, 2017).
In the service sector, there are factors such as quality of provided services and service
provider personality that create and improve the long-term relationship by influencing
customer choice and repurchase intention (Lin et al., 2001; Webber et al., 2012). In the
case of beauty salons, knowing the factors behind the clients’ willingness to revisit their
beauty salon is very important to both salon owners and managers. By identifying the
factors that lead to a particular revisit intention of hair salon and hairstylists, we can better
understand why and how the people act in a certain way. In so doing, marketers can easily
design appropriate strategies to compete successfully by maintaining the customers as a
valuable source.
There are issues that have yet to be addressed in research studies investigating the
factors influencing customer willingness to revisit and repurchase in the service
industries. First, most of the research on service industries empirically (Lin et al., 2001;
Webber et al., 2012) studied the importance of service provider personality and provided
service quality as the two effective factors influencing customer decision making toward
repurchasing. No empirical research has been conducted to weigh these factors in order
to realize the primary factor influencing customer repurchase decision making in a single
study. Second, despite some of these studies investigated factors affecting customer
willingness to choose in various service industries (e.g., Ferguson et al,, 2005; Schneider
et al., 2009; Webber 2011), no similar study, using a sample from Iran, has been carried
out measuring these factors in the beauty sector. Third, most research studied customer
willingness to choose have focused on one-time interaction (Pugh, 2001; Tan et al., 2004)
and short-term relationships (Robert et al., 1987; Gutek et al., 1999; Rogelberg et al.,
1999). Whereas our research focuses on longer-term engagements between a service
provider and his/her customer (Webber el at., 2012) focusing on hair stylists and hair
salons.
Therefore, this paper aims to compare the weight of “provided service quality” and
‘service provider personality” as the two of the main factors that influence customers’
decision-making process to choose and revisit their favorite hairstylist and beauty salons.
To reach this goal the SERVQUAL (Parasuraman et al., 1988) and Mini-Marker
Personality Traits (Saucier, 1994) models were used to answer the research question:
"From the clients’ point of view, which of the “service quality” or “hairstylist’s
personality” factors is considered as the heavier factor that influences customer choice
to have a continual visit."

International Journal of Management, Accounting and Economics
Vol. 8, No. 5, May, 2021
ISSN 2383-2126 (Online)
© Author(s), All Rights Reserved www.ijmae.com
298
In the first section of this research, previous studies and investigations relating to
service quality, personality, and repurchase intention is reviewed. Research hypothesis is
also designed at this stage. During the second section, research methodology including
sample and data collection techniques is explained. In the third section, results from a
survey questionnaire are analyzed and presented. Finally, discussions, managerial
implication, limitation, conclusion of the study are discussed in the last section of the
paper.
Literature review and hypothesis development
The Big-Five personality traits
Personality can be referred to the characteristics of the person that account for
consistent patterns of feeling, thinking, behaving, and acting (Cervone & Pervin, 2015).
For years, the structure, characteristics, process, and progress of human behavior have
been explained by different personality theories (e.g. cognitive theory, psychoanalytic
theory, trait theory, phenomenological theory, learning theory, and the theory of social
cognitive). Sine this study employed personality traits to evaluate the service providers’
personality; it addresses only the structure of service providers’ personality. Among
mentioned theories, the trait theory particularly emphasizes exploring the fundamental
structure of personality. Trait theorists, who believe traits are the essential units of
personality, assume that each person has broad talents and capabilities which called traits
that cause him/her to behave and act in a specific way (Pervin, 1993).
To explain human personality, Eysenck’s early research developed the Big-Two model
using neuroticism and extraversion dimensions as the stem of personality. Later, the
psychoticism was added as the third dimension of personality model (Eysenck &
Eysenck, 1975). The basics of the Big-Five model ( FFM) began from Norman's (1963)
paper who suggested the five dimensions include agreeableness, extraversion, emotional
stability, conscientiousness, and culture as the new classification of personality attributes
using factor analyzing technique. In another attempt, focused on the Eysenck and Norman
suggestion, Costa and McCrae (1985) reported that the fundamental units of human
personality were neuroticism, extraversion, openness, agreeableness, and
conscientiousness. To measure these factors, they also developed six subcategories of
each Big Five personality trait called the NEO Personality Inventory.
Over the years, the personality theorists showed that the five dimensions include
extraversion, neuroticism, conscientiousness, agreeableness, and openness to experience
are the robust and basic dimensions to express the human personality (Costa & McCrae,
1985; Digman, 1990; McCrae & John, 1992; Pervin, 1993; Cellar et al., 1996; Salgado,
1997). For short, these dimensions are also called OCEAN given the first alphabet of each
( John, 1990; Pervin, 1993).
The extraversion factor (also called surgency) mainly describes the intensity of activity
level, the capacity to enjoy and interpersonal interaction. Being talkative, energetic,
active, social, optimistic, and oriented are well-known characteristics associated with this
factor (Pervin, 1993). Agreeableness represents the degree to which a person can get
along with others by being good-natured, forgiving, compassionate, cooperative,

International Journal of Management, Accounting and Economics
Vol. 8, No. 5, May, 2021
ISSN 2383-2126 (Online)
© Author(s), All Rights Reserved www.ijmae.com
299
understanding, and trusting (Pervin, 1993). Frequently, being kind, unselfish, generous,
warm, forgiving, and trustful are the traits associated with this dimension (McCrae &
John, 1992; Pervin, 1993). The conscientiousness factor of personality chiefly evaluates
the degree to which a person is responsible, dependable, persistent, and achievement
oriented. Commonly, traits related to conscientiousness are being responsible, planning,
hardworking, careful, focused, organized, and self-disciplined (Barrick & Mount, 1991;
McCrae & John, 1992). The neuroticism factor or emotional stability mainly evaluates
the level of emotional instability of a person. Traits associated with this dimension usually
known as being worried, moody, depressed, touchy, and unstable (Barrick & Mount,
1991; McCrae & John, 1992). Openness to experience (also called Intellect or Culture)
is the dimension of personality that appraises the level of having wide interests and being
imaginative and insightful (Pervin, 1993). Having creativity, imagination, intelligence
and curiosity are traits commonly associated with the openness dimension (Barrick &
Mount, 1991; McCrae &John, 1992; Pervin, 1993).
Over time, different questionnaires such as NEO Personality Inventory (NEO-PI) or
NEO-PIR (McCrae & Costa, 1992) have been developed to measure the five constructs
on personality trait theory. In research, the bipolar and unipolar adjective markers have
been proposed by Goldberg (1992). A brief version of Goldberg unipolar adjective
markers with reasonable reliability and validity, called “Mini- Marker”, was developed
by Saucier (1994). The dimensions of Mini-Marker Personality Traits are extroversion
(Ext), agreeableness (Agr), conscientiousness (Con), neuroticism (Neu) , and intellect
(Int). These are employed in this study to represent the personality traits. The ranges and
components of personality dimensions have varied from study to study. Table 1 presents
the higher and lower level of each component of Mini-Marker (Saucier, 1994).
Table 1. Mini-Marker personality traits dimensions
Lower End Dimensions Higher End
Silent, Unenergetic,
Unsociable, Unassertive,
Inactive, Unadventurous
Extraversion Talkative, Energetic, Sociable,
Assertive, Active, Adventurous
Unselfish, Cold ,Rude,
Distrustful, Unkind, Stingy,
Disagreeable, Inflexible,
Unfair
Agreeableness
Selfish, Warm, Polite, Trustful,
Kind, Generous, Agreeable,
Flexible, Fair
Disorganized, Unreliable,
Lazy, Frivolous, Impractical,
Rash, Careless, Negligent
Conscientiousness
Organized, Reliable,
Hardworking, Serious,
Practical, Cautious, Thorough,
Conscientious
Calm, Tense, Unstable,
Moody, Unemotional,
Insecure, Disconnected
Neuroticism
Angry, Relaxed, Stable
Steady, Emotional,
Secure, Connected
Unintelligent, Uncreative,
Imperceptive, Unsophisticated Intellect
Intelligent, Creative, Curios,
perceptive, Sophisticated
Source: Saucier (1994)

International Journal of Management, Accounting and Economics
Vol. 8, No. 5, May, 2021
ISSN 2383-2126 (Online)
© Author(s), All Rights Reserved www.ijmae.com
300
Service quality
The service quality has been progressively recognized as a crucial factor in the success
of any business (Hossain & Leo, 2009; Kim-Soon et al., 2014). Since service quality is
known as a multidimensional construct, the definition and number of dimensions have
always been varied from researcher to researcher (Rezaei et al., 2011; Haghighat, 2017).
In the last decade, researchers have been defining quality from a customer’s
perspective due to the growth and increased importance of the service sector in these days
(Lin el at. 2001). In reviewing marketing literature, it is clear that among all classifications
of service quality dimensions, proposed by other researchers, a widely used definition of
service quality is to meet customers’ expectations (e.g. Sasser et al., 1978; Gronroos,
1978; Lehtinen & Lehtinen, 1982), the work of Parasuraman, et al. (1985, 1988). The
research developed an instrument based on a gap model (Parasuraman, et al, 1985) called
SERVQUAL. This model suggests the perception of service quality derived from the gap
between customers’ expectations and their perceptions of actual performance (Pikkemaat
& Peters, 2006).
Both SERVQUAL versions, the original (Parasuraman, et al, 1988) and revised
version (Parasuraman, et al, 1991, 1994) contain five dimensions namely tangibles (Tan),
reliability (Rel), responsiveness (Res), assurance (Ass), and empathy (Emp). In
SERVQUAL, the dimension of tangibles evaluates the degree of the appearance of
personnel and a company’s physical facilities. The reliability factor assesses the ability
of an organization or firm to deliver the service that was already promised. The
responsiveness measures the willingness to assist customers and provide a quick service.
The assurance dimension represents the ability of employees to inspire confidence,
showing also their level of knowledge. Finally, empathy evaluates the individualized
attention that the organizations provide to their customers (Parasuraman, et al, 1988). The
SERVQUAL remains the leading instrument to measure service quality (Roslan et al.,
2015; Gencer & Akkucuk, 2017), even though it has been criticized by certain scholars
(e.g. Carman, 1990; Cronin & Taylor, 1992; Teas, 1993; Landrum et al., 2007).
Repurchase intention
Repurchase intention is an objective, observable and simple predictor of future
purchasing behavior that defines the degree to which customers are willing to purchase
and use the same product or service over time (Jones & Taylor, 2007; Lin & Liang, 2011).
Furthermore, the author’s defined a repurchase intention as to a likelihood or willingness
of consumers, having already completed an initial buy and then decided to use and
purchase from the same service unit or company in the future (Kuan et al., 2008). The
repurchase intention is also defined as loyalty toward a commercial brand (Chaudhuri &
Holbrook, 2001). From the customer view, it is reported that a repurchase intention might
be the result of customer commitment and attitude towards repurchasing a specific
product (Samand, 2014). Based on context, in this study ‘revisit intention’ is used as
‘repurchase intention’.
Service provider personality and repurchase intention
International Journal of Management, Accounting and Economics
Vol. 8, No. 5, May, 2021
ISSN 2383-2126 (Online)
© Author(s), All Rights Reserved www.ijmae.com
301
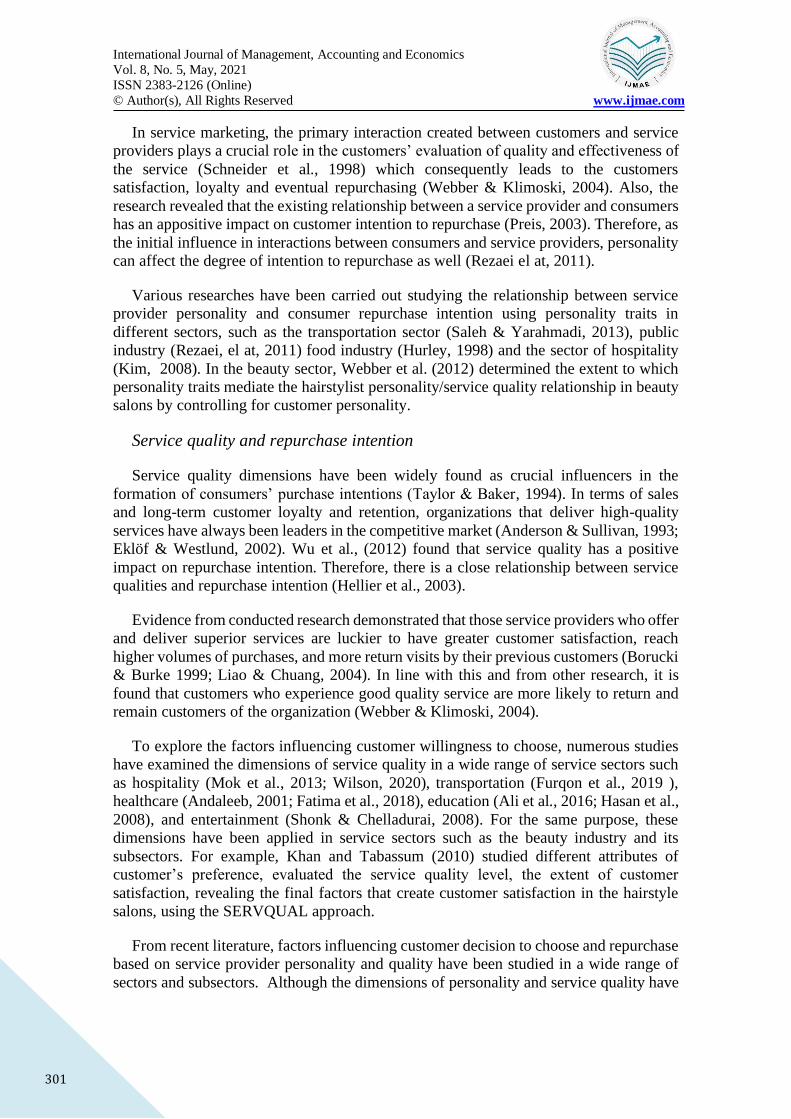
In service marketing, the primary interaction created between customers and service
providers plays a crucial role in the customers’ evaluation of quality and effectiveness of
the service (Schneider et al., 1998) which consequently leads to the customers
satisfaction, loyalty and eventual repurchasing (Webber & Klimoski, 2004). Also, the
research revealed that the existing relationship between a service provider and consumers
has an appositive impact on customer intention to repurchase (Preis, 2003). Therefore, as
the initial influence in interactions between consumers and service providers, personality
can affect the degree of intention to repurchase as well (Rezaei el at, 2011).
Various researches have been carried out studying the relationship between service
provider personality and consumer repurchase intention using personality traits in
different sectors, such as the transportation sector (Saleh & Yarahmadi, 2013), public
industry (Rezaei, el at, 2011) food industry (Hurley, 1998) and the sector of hospitality
(Kim, 2008). In the beauty sector, Webber et al. (2012) determined the extent to which
personality traits mediate the hairstylist personality/service quality relationship in beauty
salons by controlling for customer personality.
Service quality and repurchase intention
Service quality dimensions have been widely found as crucial influencers in the
formation of consumers’ purchase intentions (Taylor & Baker, 1994). In terms of sales
and long-term customer loyalty and retention, organizations that deliver high-quality
services have always been leaders in the competitive market (Anderson & Sullivan, 1993;
Eklöf & Westlund, 2002). Wu et al., (2012) found that service quality has a positive
impact on repurchase intention. Therefore, there is a close relationship between service
qualities and repurchase intention (Hellier et al., 2003).
Evidence from conducted research demonstrated that those service providers who offer
and deliver superior services are luckier to have greater customer satisfaction, reach
higher volumes of purchases, and more return visits by their previous customers (Borucki
& Burke 1999; Liao & Chuang, 2004). In line with this and from other research, it is
found that customers who experience good quality service are more likely to return and
remain customers of the organization (Webber & Klimoski, 2004).
To explore the factors influencing customer willingness to choose, numerous studies
have examined the dimensions of service quality in a wide range of service sectors such
as hospitality (Mok et al., 2013; Wilson, 2020), transportation (Furqon et al., 2019 ),
healthcare (Andaleeb, 2001; Fatima et al., 2018), education (Ali et al., 2016; Hasan et al.,
2008), and entertainment (Shonk & Chelladurai, 2008). For the same purpose, these
dimensions have been applied in service sectors such as the beauty industry and its
subsectors. For example, Khan and Tabassum (2010) studied different attributes of
customer’s preference, evaluated the service quality level, the extent of customer
satisfaction, revealing the final factors that create customer satisfaction in the hairstyle
salons, using the SERVQUAL approach.
From recent literature, factors influencing customer decision to choose and repurchase
based on service provider personality and quality have been studied in a wide range of
sectors and subsectors. Although the dimensions of personality and service quality have

International Journal of Management, Accounting and Economics
Vol. 8, No. 5, May, 2021
ISSN 2383-2126 (Online)
© Author(s), All Rights Reserved www.ijmae.com
302
been rarely or mediatory examined for hairstylist profession and beauty salons (Khan &
Tabassum, 2010; Webber et al., 2012), these dimensions have not yet been studied and
compared to each other to determine the primary factor influencing the clients’ intention
to revisit their beauty salons in a long-term relationship. Therefore, this study
hypothesizes:
H: “Service quality” and “service provider personality” do not equally influence the
client’s decision to revisit the beauty salon.
Methodology
Instrument and measures
The instrument of this study was developed and administered based on guidelines and
fundamental structures for designing an effective international marketing instrument
(Brisling et al., 1973; Singh, 1995). The questionnaire was originally designed in English
and then translated into Persian due to the language of respondents, and again translated
back into English by a native Persian speaker in order to ensure that it corresponded with
the English version (Brisling et al., 1973). The survey questionnaire consisted of items
for measuring the dimensions of service quality, service provider personality, as well as
demographic questions.
Sample and data collection
An empirical study was conducted in the summer of 2020, using data collected from
clients of beauty salons in Esfahan, Iran, by self-administered questionnaires. The target
population consisted of clients who had not changed their hairstylists and beauty salons
within the previous six months. In total, 550 questionnaires were distributed to potential
respondents, approached by an assistant through Google form using a convenient
sampling technique over a three month period. After receiving 500 questionnaires which
shows a satisfactory response rate of 91 %, those participants who had changed their
hairstylists and salons in last six months were eliminated from the analysis. Therefore, 47
questionnaires were removed (9.4%) and 453 valid questionnaires were used for further
analysis (90.6%). The characteristics of the respondents are summarized in Table 2.
A majority (60.4 per cent) of the respondents were female. In terms of education, 44.2
per cent of the respondents held a bachelor degree, 27.2 per cent held a master degree,
12.8 per cent had a high school diploma, 6.8 per cent held a PhD degree, and 2.2 per cent
had under diploma education. The majority (44.8 per cent) of respondents were between
20-29 years old. Furthermore, most of the respondents were single (64.2 per cent). More
than 90.6 per cent of the respondents had not changed their hairstylist and beauty salons
within the previous six months.

International Journal of Management, Accounting and Economics
Vol. 8, No. 5, May, 2021
ISSN 2383-2126 (Online)
© Author(s), All Rights Reserved www.ijmae.com
303
Table 2. Respondents’ profile
Profile Category Frequency (N=500) Percentage (%)
Gender Male 198 39.6
Female 302 60.4
Age
<20 11 2.2
20-29 224 44.8
30-39 176 35.2
40-49 48 9.6
>50 41 8.2
Education
Under Diploma 11 2.2
Diploma 64 12.8
Associated Degree 34 6.8
Bachelor 221 44.2
Master 136 27.2
PhD 34 6.8
Marital Status Single 321 64.2
Married 179 35.8
Continual Visiting Yes 47 9.4
No 453 90.6
Service quality
Respecting the views of Cronin and Taylor (1992) and Brady et al. (2005), the present
study measured service quality with a “performance” measure rather than a “gap”
measure. For the present study, the SERVQUAL model developed by Parasuraman, et al.
(1988) is adopted for evaluation of service quality using 13 items categorized into five
dimensions namely:
• reliability (3 items),
• responsiveness (2 items),
• assurance (2 items),
• empathy (2 items), and
• tangibles (4 items).
Respondents were asked to state their perception of the salon service quality with
respect to each of the items using a five-point Likert-type scale for their responses from
1 = strongly disagree to 5 = strongly agree.
Big-Five personality traits
As previously discussed, the Big-Five personality dimensions were considered in the
service provider personality measure of this study. Borrowing from Mini-Marker
Personality Traits (Saucier, 1994), 16 items consisting of:

International Journal of Management, Accounting and Economics
Vol. 8, No. 5, May, 2021
ISSN 2383-2126 (Online)
© Author(s), All Rights Reserved www.ijmae.com
304
• extraverted (3 items),
• agreeableness (4 items),
• conscientiousness (4 items),
• emotional stability (3 items), and
• intellect (2 items)
were used to measure the scales of personality dimensions adopting five-point Likert-
type scale (1 = strongly disagree to 5 = strongly agree).
Data analysis
In order to detect whether using parametric or non-parametric analysis, the skewness
and kurtosis of the variables is used to check the normality of the data. The results showed
that most of the variables are fairly normal since the skewness and kurtosis of the
variables were within rules of being ±3.3 as the upper threshold suggested by Sposito et
al. (1983). Moreover, although the normality of the variables in terms of skewness and
kurtosis can be approved, their distribution might not be statistically normal. Therefore,
the Kolmogorov-Smirnov test was utilized to statistically test the normality of data. Since
the result of the test showed the probability value of the test below 0.001, the distribution
of the data was not statistically normal. Therefore, non-parametric tests were used for the
rest of the analysis.
To compare the influencer factors for customers to choose their hairstylist (five
personality factors and five quality factors) the Friedman test, as the non-parametric test,
was used. Moreover, the post-hoc analysis of Bonferroni (Dunn-Bonferroni) test was
implemented for the pairwise comparison of the factors to a better understanding of which
factors are statistically different from another. In order to test the hypothesis, the
Wilcoxon Signed-Rank test as the non-parametric test was utilized. All the analyses in
this study were carried out by SPSS V. 25 with the confidence levels of 95%.
Results
Descriptive analysis
The descriptive statistics of the data including the mean, standard deviation, skewness,
and kurtosis values is provided in Table 3.
It can be observed that among all the variables, Neuroticism (Neu-1) had the lowest
mean of 3.17, and Empathy (Emp-1) had the highest mean at 4.30. The maximum and
minimum standard deviations (S.D.) were 0.98 and 0.68 respectively.

International Journal of Management, Accounting and Economics
Vol. 8, No. 5, May, 2021
ISSN 2383-2126 (Online)
© Author(s), All Rights Reserved www.ijmae.com
305
Table 3. Descriptive statistics of questionnaire variables
Variables Mean S.D. Sk. Ku.
Ext-1 3.86 0.85 -0.46 0.03
Ext-2 4.10 0.77 -1.14 2.25
Ext-3 4.08 0.80 -1.00 1.50
Agr-1 4.07 0.71 -0.89 2.29
Agr-2 3.64 0.78 -0.12 0.11
Agr-3 3.45 0.85 -0.17 -0.02
Agr-4 3.70 0.81 -0.18 -0.02
Con-1 3.72 0.97 -0.69 0.26
Con-2 3.63 0.90 -0.31 0.14
Con-3 3.97 0.82 -0.96 1.59
Con-4 3.94 0.78 -0.42 -0.12
Neu-1 3.28 0.88 0.12 0.07
Neu-2 3.17 0.89 -0.18 -0.10
Neu-3 3.68 0.80 -0.07 -0.46
Int-1 3.68 0.84 -0.25 -0.10
Int-2 3.72 0.86 -0.33 0.17
Rel-1 4.01 0.93 -1.38 2.32
Rel-2 4.17 0.74 -0.89 1.16
Rel-3 4.19 0.75 -1.08 1.69
Res-1 4.19 0.68 -0.64 0.81
Res-2 4.02 0.68 -0.67 1.25
Ass-1 3.98 0.84 -0.97 1.41
Ass-2 4.17 0.71 -1.17 3.21
Emp-1 4.30 0.76 -1.59 4.47
Emp-2 4.22 0.74 -1.38 4.06
Tan-1 4.05 0.75 -0.57 0.83
Tan-2 3.71 0.98 -0.62 -0.09
Tan-3 3.48 0.97 -0.15 -0.61
Tan-4 3.93 0.82 -0.90 1.44 Note: Ext = extroversion; Agr = agreeableness; Con = conscientiousness; Neu = neuroticism, and Int = intellect; Tan = tangibles; Rel = reliability; Res = responsiveness e Ass = assurance; Emp = empathy S.D. = standard deviation; Sk. = Skewness; Ku. = Kurtosis.
The results of the reliability test in Table 4 reveal that the value of Cronbach’s α of
constructs is ranged from 0.65 to 0.87 which confirms the acceptable range (George &
Mallery, 2003). Moreover, most of the reliability values are greater than 0.7 (usual
acceptance level respecting Nunnally, 1981). Therefore, the reliability of each construct
is considerably acceptable and is worthy of further analysis. However, the Neuroticism
variable is removed due to the alpha Cronbach of below 0.6.

International Journal of Management, Accounting and Economics
Vol. 8, No. 5, May, 2021
ISSN 2383-2126 (Online)
© Author(s), All Rights Reserved www.ijmae.com
306
Table 4. Reliability of variables
Variables alpha Cronbach
Personality
Extraversion 0.870
Agreeableness 0.824
Conscientiousness 0.774
Neuroticism -
Intellect 0.649
Quality
Reliability 0.673
Responsiveness 0.704
Assurance 0.851
Empathy 0.876
Tangibles 0.845 Note: - Dropped due to low alpha Cronbach
Statistical analysis
The Friedman test as the non-parametric test was utilized to answer which of the
factors of service quality and hairstylist personality is considered as the stronger factor
that influences customer choice to have continual visiting. The result of this analysis
(Table 5) revealed that there was a statistically significant difference in the factors
influencing customers’ choice (χ2 (8) = 253.978, p = 0.000). The most important factor
was Agreeableness (Mean Rank = 6.49) and the least important factor was Empathy
(Mean Rank = 3.20). As can be seen, all the factors of quality and the Extraversion factor
of personality have the same median value (2.0) that indicates an equal level of influence
for the customers.
Table 5. The Mean Rank comparison between all the factors of quality and personality
Factor Mean Rank * Percentiles
25th 50th (Median) 75th
Agreeableness 6.49 2.00 2.25 2.75
Intellect 6.36 2.00 2.50 3.00
Conscientiousness 5.90 1.75 2.25 2.50
Tangibles 5.80 1.80 2.20 2.80
Extraversion 4.75 1.33 2.00 2.33
Assurance 4.27 1.50 2.00 2.00
Responsiveness 4.23 1.50 2.00 2.00
Reliability 4.00 1.33 2.00 2.00
Empathy 3.20 1.00 2.00 2.00
χ2 (df) = 253.978 (8), p = 0.000 *** Note * = Friedman statistic; χ2 (df) = Chi-square value (degrees of freedom); *** = p-value <0.001
The results of the Friedman test for each of the quality and personality factors
separately, showed that among the quality factors Tangibles (Mean Rank = 3.92) and
International Journal of Management, Accounting and Economics
Vol. 8, No. 5, May, 2021
ISSN 2383-2126 (Online)
© Author(s), All Rights Reserved www.ijmae.com
307
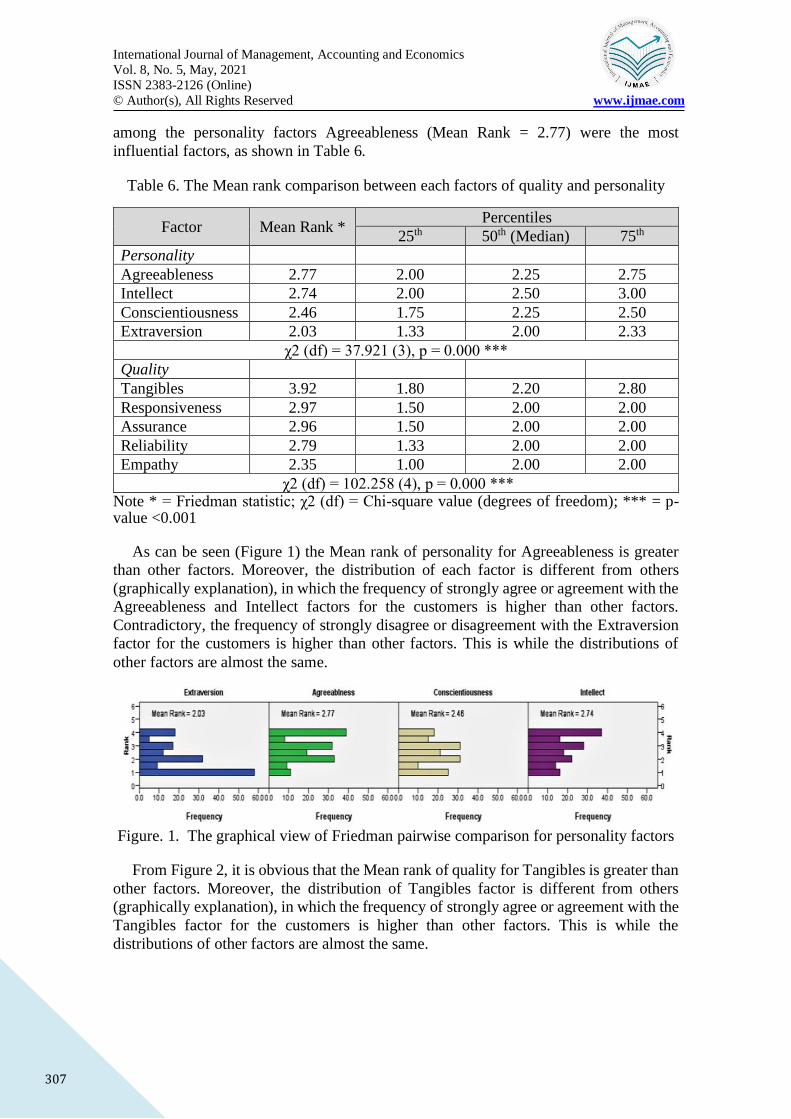
among the personality factors Agreeableness (Mean Rank = 2.77) were the most
influential factors, as shown in Table 6.
Table 6. The Mean rank comparison between each factors of quality and personality
Factor Mean Rank * Percentiles
25th 50th (Median) 75th
Personality
Agreeableness 2.77 2.00 2.25 2.75
Intellect 2.74 2.00 2.50 3.00
Conscientiousness 2.46 1.75 2.25 2.50
Extraversion 2.03 1.33 2.00 2.33
χ2 (df) = 37.921 (3), p = 0.000 ***
Quality
Tangibles 3.92 1.80 2.20 2.80
Responsiveness 2.97 1.50 2.00 2.00
Assurance 2.96 1.50 2.00 2.00
Reliability 2.79 1.33 2.00 2.00
Empathy 2.35 1.00 2.00 2.00
χ2 (df) = 102.258 (4), p = 0.000 *** Note * = Friedman statistic; χ2 (df) = Chi-square value (degrees of freedom); *** = p-value <0.001
As can be seen (Figure 1) the Mean rank of personality for Agreeableness is greater
than other factors. Moreover, the distribution of each factor is different from others
(graphically explanation), in which the frequency of strongly agree or agreement with the
Agreeableness and Intellect factors for the customers is higher than other factors.
Contradictory, the frequency of strongly disagree or disagreement with the Extraversion
factor for the customers is higher than other factors. This is while the distributions of
other factors are almost the same.
Figure. 1. The graphical view of Friedman pairwise comparison for personality factors
From Figure 2, it is obvious that the Mean rank of quality for Tangibles is greater than
other factors. Moreover, the distribution of Tangibles factor is different from others
(graphically explanation), in which the frequency of strongly agree or agreement with the
Tangibles factor for the customers is higher than other factors. This is while the
distributions of other factors are almost the same.

International Journal of Management, Accounting and Economics
Vol. 8, No. 5, May, 2021
ISSN 2383-2126 (Online)
© Author(s), All Rights Reserved www.ijmae.com
308
Figure. 2. The graphical view of Friedman pairwise comparison for quality factors
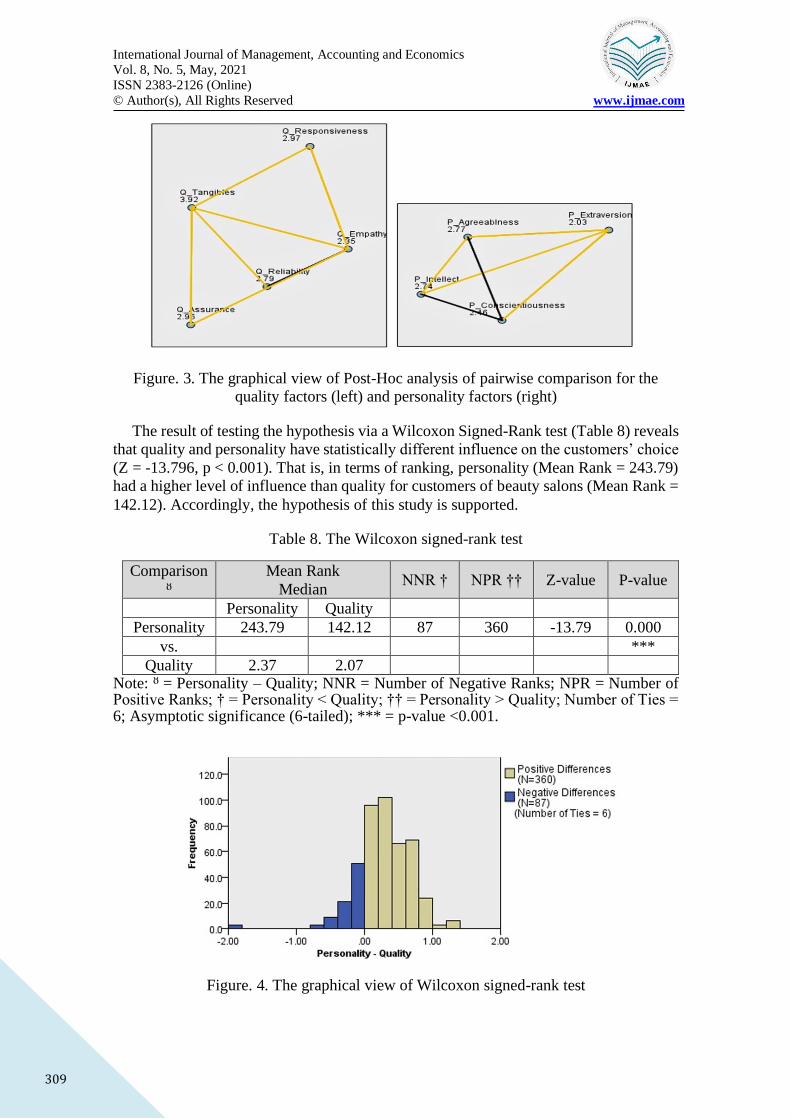
The results of Post-Hoc analysis of Bonferroni (Dunn-Bonferroni) test for the pairwise
comparison of the factors of the quality and personality are shown in Table 7 and Figures
3. These results illustrate that Tangibles had a statistically significant difference with
other quality factors (p < 0.001). The Empathy had significant difference with Assurance
(p < 0.050) and Responsiveness (p < 0.001). Among the personality factors, Extraversion
had a statistically significant difference with other factors (p < 0.050, 0.001).
Table 7. The Post-Hoc analysis of pairwise comparison for the quality and personality
factors
Pair of factors Z-value * Adj. P-value
Quality
Empathy-Reliability 0.440 0.155
Empathy-Assurance 0.603 0.009 **
Empathy-Responsiveness 0.619 0.007 **
Empathy-Tangibles -1.566 0.000 ***
Reliability-Assurance -0.162 1.000
Reliability-Responsiveness -0.179 1.000
Reliability-Tangibles -1.126 0.000 ***
Assurance-Responsiveness 0.017 1.000
Assurance-Tangibles -0.964 0.000 ***
Responsiveness-Tangibles -0.947 0.000 ***
Personality
Extraversion- Conscientiousness -0.437 0.020 **
Extraversion-Intellect -0.715 0.000 ***
Extraversion-Agreeableness -0.742 0.000 ***
Conscientiousness-Intellect -0.278 0.367
Conscientiousness-Agreeableness 0.305 0.242
Intellect-Agreeableness 0.026 1.000
Note: * = Bonferroni (Dunn-Bonferroni) test; Asymptotic significance (2-tailed); ** = p-
value < 0.05; *** = p-value < 0.001. Significance values have been adjusted by the
Bonferroni correction for multiple tests
International Journal of Management, Accounting and Economics
Vol. 8, No. 5, May, 2021
ISSN 2383-2126 (Online)
© Author(s), All Rights Reserved www.ijmae.com
309
Figure. 3. The graphical view of Post-Hoc analysis of pairwise comparison for the
quality factors (left) and personality factors (right)
The result of testing the hypothesis via a Wilcoxon Signed-Rank test (Table 8) reveals
that quality and personality have statistically different influence on the customers’ choice
(Z = -13.796, p < 0.001). That is, in terms of ranking, personality (Mean Rank = 243.79)
had a higher level of influence than quality for customers of beauty salons (Mean Rank =
142.12). Accordingly, the hypothesis of this study is supported.
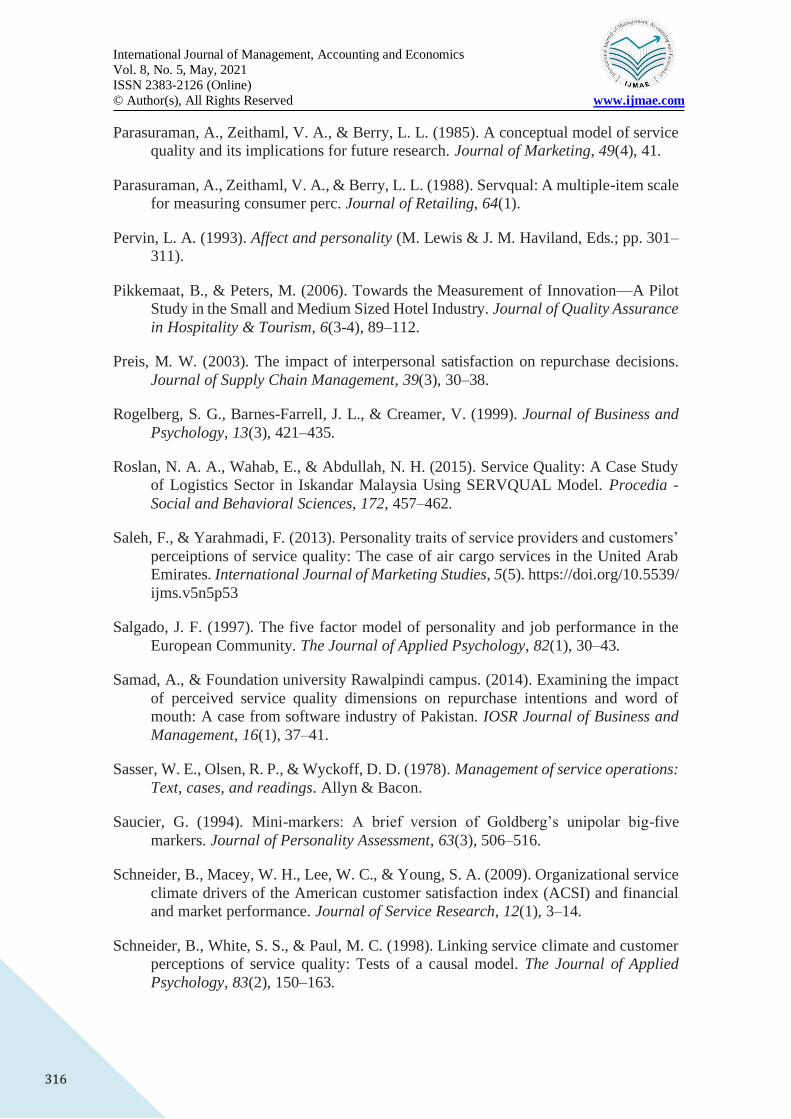
Table 8. The Wilcoxon signed-rank test
Comparison
ᴽ
Mean Rank
Median NNR † NPR †† Z-value P-value
Personality Quality
Personality 243.79 142.12 87 360 -13.79 0.000
vs. ***
Quality 2.37 2.07 Note: ᴽ = Personality – Quality; NNR = Number of Negative Ranks; NPR = Number of Positive Ranks; † = Personality < Quality; †† = Personality > Quality; Number of Ties = 6; Asymptotic significance (6-tailed); *** = p-value <0.001.
Figure. 4. The graphical view of Wilcoxon signed-rank test

International Journal of Management, Accounting and Economics
Vol. 8, No. 5, May, 2021
ISSN 2383-2126 (Online)
© Author(s), All Rights Reserved www.ijmae.com
310
Furthermore, the number of positive ranks (N = 360) is greater than negative ranks (N
= 87), meaning that the number of the personality ranks mines number of the quality ranks
are greater than zero, therefore, personality > quality (see Figure 4).
Discussion
There are many factors influencing customer choice and repurchase intention in the
service sector. In service marketing, conducted research showed that service provider
personality and level of service quality plays an important role in the customers
repurchase intention (Bettencourt et al., 2001; Webber et al., 2012). Unfortunately, no
research has been carried out to simultaneously weigh the effect of the service provider
personality and provided service quality on customer decision-making towards
repurchasing in the service marketing. Further, no similar study has been conducted to
compare these factors in the beauty services, focusing on longer-term relationship
between a service provider and customers. This study aims to address this gap in the
relevant research literature by comparing the weight of both service provider personality
and provided service quality in the beauty salons.
The finding revealed that, for the customers, the service provider personality is a
stronger factor than provided service quality to their revisit intention. Specifically, the
results showed that the agreeableness, intellect, conscientiousness, and extraversion
factors have respectively been prioritized as the most effective re-visitation reasons in the
view of customers. Therefore, personality traits such as kindness, generosity,
agreeableness, trustworthiness, intellectuality, and creativity are heavier to influence
customer decision making than other factors such as energetic and hardworking factors.
From the service quality side, although the result demonstrated that tangibility
components such as salon appearances, attractiveness, and quality of materials are ranked
as the first re-visitation reasons, the service quality factors such as responsiveness,
assurance, empathy, and reliability have been also highlighted as effecting factors that
can influence the client decision to revisit. Despite all quality factors' important roles,
empathy has received a lower score among all variables.
Managerial implications
All marketing decisions are based on assumptions and knowledge of consumer
behavior toward the market (Hawkins et al., 1998). To facilitate a better understanding of
factors influencing customer repurchasing intention, the finding of this research can be
used as a reference for beauty salon managers and hairstylists in Iran.
It has been largely highlighted that attracting a new customer, expends five to eight
times more effort than maintaining a current customer. Furthermore, existing customers
are considered as a vital value to the success of any business due to the power that they
have to attract new customers (Schneider et al., 1998). Building a strategy to have the
sustaining effective customer relationship is crucial for the service providers. Since this
research shows that customers paid more attention to the service provider personality than
provided service quality in beauty salons, one approach to building strong effective
customer relationships would be to hire, and also promote hairstylists who have a high
level of agreeableness and intellect than conscientiousness and extraversion traits

International Journal of Management, Accounting and Economics
Vol. 8, No. 5, May, 2021
ISSN 2383-2126 (Online)
© Author(s), All Rights Reserved www.ijmae.com
311
respectively. Although the role of all five personality traits is effective, hiring hairstylists
who are kind, warm, honest, unselfish, carious, and creative can significantly facilitate
the success of the beauty salon.
But it must not be forgotten that service quality has already been recognized as a
prerequisite for all service organizations (Chang et al., 2020). Therefore, like other service
providers, it is critical for beauty salon owners to provide the best quality responses to
customer expectations in the service operations. In line with this and in order to increase
prosperity, the finding of this research recommends that beauty salon managers should
focus more on the tangible assets compared to other service quality dimensions.
Limitations and further suggestions
Like any research, there are a few limitations in this study. Firstly, due to the cost and
time restriction, the prohibition of beauty salon activities during pandemic (COVID-19),
coupled with the data collection period in Iran, this study adopted a non-random sampling
method (convenient sampling) rather than a random sampling method. Future work with
random sampling methods such as a stratified sampling method (category of age, gender
or culture) on various beauty salons is expected.
Secondly, since all the items of the questionnaire and the dimensions of variables are
extracted from the previous related studies in service industries, it caused this study to
meet low reliability of questionnaire which consequently eliminated a dimension from
the analysis. Therefore, it is still necessary to appropriately modify the items and
dimensions to reach an adequate level of reliability in future research. Thus, it is
recommended to adopt different views of both personality traits and service quality
dimensions (Sureshchandar et al., 2002; Kim et al., 2004) for similar research in the
future.
Finally, this paper is carried out using a small sample size from a big city in Iran.
Therefore, it is suggested that for future works the sample size covers multiple beauty
salons from different cities to reach an intensive validity of generalization.
Conclusion
The growing number of beauty salons, training schools, hairstylists and increasing
demand for a variety of services, cater to the growth and importance of this industry
(statistics centre of Iran, 2019). Understanding the reasons behind the client's choice is
very important to salon owners and marketers as much as it is to other social scientists.
There are many factors, such as quality of services and service provider personality that
influence customer choice and affect repurchase intention in the service sector. This paper
is to weigh the service provider personality and provided service quality as two different
factors influencing purchase intention using the Mini-Marker model of personality and
the SERVQUAL model of service quality. Based on 453 valid respondents who had never
changed their beauty salon in the last 6 months in Esfahan city, Iran, the empirical finding
indicated that the service provider personality is the initiate and main reason for clients
to revisit the beauty salon. The results suggest that the salons’ managers must focus more
on service provider personality and tangible assets of service quality’s dimensions to

International Journal of Management, Accounting and Economics
Vol. 8, No. 5, May, 2021
ISSN 2383-2126 (Online)
© Author(s), All Rights Reserved www.ijmae.com
312
build strong(er) customer relationship. It is expected from the researcher to work on
random sampling technique, high level of reliability of questionnaire, and larger sample
size in the future works.
References
Ali, F., Zhou, Y., Hussain, K., Nair, P. K., & Ragavan, N. A. (2016). Does higher
education service quality effect student satisfaction, image and loyalty?: A study of
international students in Malaysian public universities. Quality Assurance in
Education, 24(1), 70–94.
Andaleeb, S. S. (2001). Service quality perceptions and patient satisfaction: a study of
hospitals in a developing country. Social Science & Medicine (1982), 52(9), 1359–
1370.
Anderson, E. W., & Sullivan, M. W. (1993). The antecedents and consequences of
customer satisfaction for firms. Marketing Science, 12(2), 125–143.
Barrick, M. R., & Mount, M. K. (1991). The big five personality dimensions and job
performance: A meta-analysis. Personnel Psychology, 44(1), 1–26.
Bettencourt, L. A., Gwinner, K. P., & Meuter, M. L. (2001). A comparison of attitude,
personality, and knowledge predictors of service-oriented organizational
citizenship behaviors. The Journal of Applied Psychology, 86(1), 29–41.
Borucki, C. C., & Burke, M. J. (1999). An examination of service-related antecedents to
retail store performance. Journal of Organizational Behavior, 20(6), 943–962.
Brady, M. K., & Cronin, J. J., Jr. (2001). Customer orientation: Effects on customer
service perceptions and outcome behaviors. Journal of Service Research, 3(3), 241–
251.
Brady, M., Knight, G., Croninjr, J., Tomas, G., Hult, M., & Keillor, B. (2005). Removing
the contextual lens: A multinational, multi-setting comparison of service evaluation
models. Journal of Retailing, 81(3), 215–230.
Carman, J. M. (1990). Consumer perceptions of service quality: an assessment of
T. Journal of retailing, 66(1), 33.
Cellar, D. F., De Grendel, D. J. G., Klawsky, J. D., & Miller, M. L. (1996). The validity
of personality, service orientation, and reading comprehension measures as
predictors of Flight Attendant training performance. Journal of Business and
Psychology, 11(1), 43–54.
Cervone, D., & Pervin, L. A. (2015). Personality: Theory and research. John Wiley &
Sons.
Chang, W.-J., Liao, S.-H., Chung, Y.-C., & Chen, H.-P. (2020). Service quality,
experiential value and repurchase intention for medical cosmetology clinic:

International Journal of Management, Accounting and Economics
Vol. 8, No. 5, May, 2021
ISSN 2383-2126 (Online)
© Author(s), All Rights Reserved www.ijmae.com
313
moderating effect of Generation. Total Quality Management & Business
Excellence, 31(9–10), 1077–1097.
Chaudhuri, A., & Holbrook, M. B. (2001). The chain of effects from brand trust and brand
affect to brand performance: The role of brand loyalty. Journal of Marketing, 65(2),
81–93.
Cosmetics Industry - Statistics & Facts. (n.d.). Www.Statista.com. Retrieved December
2, 2020, from https://www.statista.com/topics/3137/cosmetics-industry/.
Costa, P. T., & Mccrae, R. R. (1985). The NEO personality inventory : manual form S
and form R. Psychological Assessment Resources.
Costa, P. T., & Mccrae, R. R. (1992). Revised NEO Personality Inventory (NEO PI-RTM)
and NEO Five-Factor Inventory (NEO-FFI) : professional manual. Psychological
Assessment Resources. Publications Ltd.
Cronin, J. J., join(' ’., & Taylor, S. A. (1992). Measuring service quality: A reexamination
and extension. Journal of Marketing, 56(3), 55.
Cross-Cultural Research Methods by Richard W. brislin, Walter J. lonner and Robert M.
thorndike. New York: John Wiley & sons, 1973, 351 pp. $16.95, reviewed by H. b.
m. murphy. (1975). Transcultural Psychiatric Research Review, 12(1), 7–10.
Dwyer, F. R., Schurr, P. H., & Oh, S. (1987). Developing buyer-seller relationships.
Journal of Marketing, 51(2), 11.
Eklöf, J. A., & Westlund, A. H. (2002). The pan-European customer satisfaction index
programme—current work and the way ahead. Total Quality Management, 13(8),
1099–1106.
Eysenck, H. J., & Eysenck, S. B. G. (1964). Manual of the Eysenck Personality inventory.
Hodder & Stoughton.
Fatima, T., Malik, S. A., & Shabbir, A. (2018). Hospital healthcare service quality, patient
satisfaction and loyalty: An investigation in context of private healthcare systems.
International Journal of Quality & Reliability Management, 35(6), 1195–1214.
Ferguson, R. J. (2005). Contractual governance, relational governance, and the
performance of interfirm service exchanges: The influence of boundary-spanner
closeness. Journal of the Academy of Marketing Science, 33(2), 217–234.
Furqon, C., Sultan, M. A., & Putri, S. I. (2019). Quality function deployment analysis on
transportation services. Proceedings of the 1st International Conference on
Economics, Business, Entrepreneurship, and Finance (ICEBEF 2018).
Gencer, Y. G., & Akkucuk, U. (2018). Measuring aftersales productivity by multi
attribute decision making methods: An application in the automotive sector.
International Journal of ADVANCED and APPLIED SCIENCES, 5(9), 88–95.

International Journal of Management, Accounting and Economics
Vol. 8, No. 5, May, 2021
ISSN 2383-2126 (Online)
© Author(s), All Rights Reserved www.ijmae.com
314
Goldberg, L. R. (1992). The development of markers for the Big-Five factor structure.
Psychological Assessment, 4(1), 26–42.
Gronroos, C. (1978). A service‐orientated approach to marketing of services. European
Journal of Marketing, 12(8), 588–601.
Gutek, B. A., Bhappu, A. D., Liao-Troth, M. A., & Cherry, B. (1999). Distinguishing
between service relationships and encounters. The Journal of Applied Psychology,
84(2), 218–233.
Haghighat, N. (2017). Airline service quality evaluation: A review on concepts and
models. Economics, Management and Sustainability, 2(2), 31–47
Hasan, H. F. A., Ilias, A., Rahman, R. A., & Razak, M. Z. A. (2009). Service quality and
student satisfaction: A case study at private higher education institutions.
International Business Research, 1(3). https://doi.org/10.5539/ibr.v1n3p163
Hawkins, D. I., Best, R. J., & Coney, K. A. (1998). Consumer behavior : building
marketing strategy : seventh edition /Consumer behavior : building marketing
strategy. seventh. Ji Xie Gong Ye Chu Ban She.
Hellier, P. K., Geursen, G. M., Carr, R. A., & Rickard, J. A. (2003). Customer repurchase
intention: A general structural equation model. European Journal of Marketing,
37(11/12), 1762–1800.
Hossain, M., & Leo, S. (2009). Customer perception on service quality in retail banking
in Middle East: the case of Qatar. International Journal of Islamic and Middle
Eastern Finance and Management, 2(4), 338–350.
Hurley, R. F. (1998). Customer service behavior in retail settings: A study of the effect
of service provider personality. Journal of the Academy of Marketing Science,
26(2), 115–127.
Iran Statistical Yearbook 2018-2019. (n.d.). www.Amar.org.Ir. Retrieved 2019, from
https://www.amar.org.ir/english/Iran-Statistical-Yearbook/Statistical-Yearbook-
2018-2019.
John, O. P. (1990). The" Big Five" factor taxonomy: Dimensions of personality in the
natural language and in questionnaires. Handbook of personality: Theory and
research.
Jones, T., & Taylor, S. F. (2007). The conceptual domain of service loyalty: how many
dimensions? Journal of Services Marketing, 21(1), 36–51.
Khan, P., & Tabassum, A. (2010). Service quality and customer satisfaction of the beauty-
care service industry in Dhaka: a study on high-end women’s parlors. Journal of
Business in Developing Nations, 12, 33.

International Journal of Management, Accounting and Economics
Vol. 8, No. 5, May, 2021
ISSN 2383-2126 (Online)
© Author(s), All Rights Reserved www.ijmae.com
315
Kim, H. J. (2008). Hotel service providers’ emotional labor: The antecedents and effects
on burnout. International Journal of Hospitality Management, 27(2), 151–161.
Kim, M.-K., Park, M.-C., & Jeong, D.-H. (2004). The effects of customer satisfaction and
switching barrier on customer loyalty in Korean mobile telecommunication
services. Telecommunications Policy, 28(2), 145–159.
Kim-Soon, N., Rahman, A., & Visvalingam, L. (2014). SERVQUAL: Can It Be Used to
Differentiate Guest’s Perception of Service Quality of 3 Star from a 4 Star Hotel.
International Business Research, 7(7).
Kuan, H.-H., Bock, G.-W., & Vathanophas, V. (2008). Comparing the effects of website
quality on customer initial purchase and continued purchase at e-commerce
websites. Behaviour & Information Technology, 27(1), 3–16.
Lehtinen, U., & Lehtinen, J. R. (1982). Service quality: a study of quality dimensions.
Helsinki: Service Management Institute. Unpublished working paper, Finland OY.
Liao, H., & Chuang, A. (2004). A multilevel investigation of factors influencing
employee service performance and customer outcomes. Academy of Management
Journal, 47(1), 41–58.
Lin, J. C., & Liang, H. (2011). The influence of service environments on customer
emotion and service outcomes. Managing Service Quality, 21(4), 350–372.
Lin, N.-P., Chiu, H.-C., & Hsieh, Y.-C. (2001). Investigating the relationship between
service providers’ personality and customers’ perceptions of service quality across
gender. Total Quality Management, 12(1), 57–67.
McCrae, R. R., & Costa, P. T., Jr. (1992). Discriminant validity of NEO-PIR facet scales.
Educational and Psychological Measurement, 52(1), 229–237.
Mok, C., Sparks, B., & Kadampully, J. (2013). Service quality management in hospitality,
tourism, and leisure. Routledge.
Norman, W. T. (1963). Toward an adequate taxonomy of personality attributes:
Replicated factor structure in peer nomination personality ratings. Journal of
Abnormal and Social Psychology, 66(6), 574–583.
Nunnally, J. C. (1978). Psychometric Theory 2nd ed.
Parasuraman, A. (1994). Alternative scales for measuring service quality: A comparative
assessment based on psychometric and diagnostic criteria. Journal of Retailing,
70(3), 201–230.
Parasuraman, A., Berry, L. L., & Zeithaml, V. A. (1991). Refinement and reassessment
of the SERVQUAL scale. Journal of Retailing, 67(4).
International Journal of Management, Accounting and Economics
Vol. 8, No. 5, May, 2021
ISSN 2383-2126 (Online)
© Author(s), All Rights Reserved www.ijmae.com
316
Parasuraman, A., Zeithaml, V. A., & Berry, L. L. (1985). A conceptual model of service
quality and its implications for future research. Journal of Marketing, 49(4), 41.
Parasuraman, A., Zeithaml, V. A., & Berry, L. L. (1988). Servqual: A multiple-item scale
for measuring consumer perc. Journal of Retailing, 64(1).
Pervin, L. A. (1993). Affect and personality (M. Lewis & J. M. Haviland, Eds.; pp. 301–
311).
Pikkemaat, B., & Peters, M. (2006). Towards the Measurement of Innovation—A Pilot
Study in the Small and Medium Sized Hotel Industry. Journal of Quality Assurance
in Hospitality & Tourism, 6(3-4), 89–112.
Preis, M. W. (2003). The impact of interpersonal satisfaction on repurchase decisions.
Journal of Supply Chain Management, 39(3), 30–38.
Rogelberg, S. G., Barnes-Farrell, J. L., & Creamer, V. (1999). Journal of Business and
Psychology, 13(3), 421–435.
Roslan, N. A. A., Wahab, E., & Abdullah, N. H. (2015). Service Quality: A Case Study
of Logistics Sector in Iskandar Malaysia Using SERVQUAL Model. Procedia -
Social and Behavioral Sciences, 172, 457–462.
Saleh, F., & Yarahmadi, F. (2013). Personality traits of service providers and customers’
perceiptions of service quality: The case of air cargo services in the United Arab
Emirates. International Journal of Marketing Studies, 5(5). https://doi.org/10.5539/
ijms.v5n5p53
Salgado, J. F. (1997). The five factor model of personality and job performance in the
European Community. The Journal of Applied Psychology, 82(1), 30–43.
Samad, A., & Foundation university Rawalpindi campus. (2014). Examining the impact
of perceived service quality dimensions on repurchase intentions and word of
mouth: A case from software industry of Pakistan. IOSR Journal of Business and
Management, 16(1), 37–41.
Sasser, W. E., Olsen, R. P., & Wyckoff, D. D. (1978). Management of service operations:
Text, cases, and readings. Allyn & Bacon.
Saucier, G. (1994). Mini-markers: A brief version of Goldberg’s unipolar big-five
markers. Journal of Personality Assessment, 63(3), 506–516.
Schneider, B., Macey, W. H., Lee, W. C., & Young, S. A. (2009). Organizational service
climate drivers of the American customer satisfaction index (ACSI) and financial
and market performance. Journal of Service Research, 12(1), 3–14.
Schneider, B., White, S. S., & Paul, M. C. (1998). Linking service climate and customer
perceptions of service quality: Tests of a causal model. The Journal of Applied
Psychology, 83(2), 150–163.

International Journal of Management, Accounting and Economics
Vol. 8, No. 5, May, 2021
ISSN 2383-2126 (Online)
© Author(s), All Rights Reserved www.ijmae.com
317
Shonk, D. J., & Chelladurai, P. (2008). Service quality, satisfaction, and intent to return
in event sport tourism. Journal of Sport Management, 22(5), 587–602.
Singh, J. (1995). Measurement issues in cross-national research. Journal of International
Business Studies, 26(3), 597–619.
Sposito, V. A., Hand, M. L., & Skarpness, B. (1983). On the efficiency of using the
sample kurtosis in selecting optimal lpestimators. Communications in Statistics:
Simulation and Computation, 12(3), 265–272.
Stankevich, A. (2017). Explaining the consumer decision-making process: Critical
literature review. Journal of International Business Research and Marketing, 2(6),
7–14.
Sureshchandar, G. S., Rajendran, C., & Anantharaman, R. N. (2002). The relationship
between service quality and customer satisfaction – a factor specific approach.
Journal of Services Marketing, 16(4), 363–379.
Tan, H. H., Foo, M. D., & Kwek, M. H. (2004). The effects of customer personality traits
on the display of positive emotions. Academy of Management Journal, 47(2), 287–
296.
Taylor, S. A., & Baker, T. L. (1994). An assessment of the relationship between service
quality and customer satisfaction in the formation of consumers’ purchase
intentions. Journal of Retailing, 70(2), 163–178.
Teas, R. K. (1993). Expectations, performance evaluation, and consumers’ perceptions of
quality. Journal of Marketing, 57(4), 18.
Webber, S. S. (2011). Dual organizational identification impacting client satisfaction and
word of mouth loyalty. Journal of Business Research, 64(2), 119–125.
Webber, S. S., & Klimoski, R. J. (2004). Client-project manager engagements, trust, and
loyalty. Journal of Organizational Behavior, 25(8), 997–1013.
Webber, S. S., Payne, S. C., & Taylor, A. B. (2012). Personality and trust fosters service
quality. Journal of Business and Psychology, 27(2), 193–203.
Wilson, N. (2020). The impact of service quality and corporate reputation toward loyalty
in the Indonesian hospitality sector. Jurnal Muara Ilmu Ekonomi Dan Bisnis, 4(1),
1.
Wu, H.-C., Liao, L.-C. C., & Tsai, T.-F. (2012). A study of relationships among consumer
cognition of spa hotel brand, service quality, experience, and repurchase intention.
2012 International Conference on Innovation Management and Technology
Research.

International Journal of Management, Accounting and Economics
Vol. 8, No. 5, May, 2021
ISSN 2383-2126 (Online)
© Author(s), All Rights Reserved www.ijmae.com
318
Appendices
English questionnaire
Respondent's Detail
Age
Below 20 20-29 30-39 40-49 Above 50
Gender
Male Female
Education
Under Diploma
Diploma Associated Degree Bachelor Master PhD
Marital Statues
Single Married
Continual Visiting
I have not changed my hairstylist and beauty salon in last 6 months.
Yes No
1 2 3 4 5
Strongly Disagree Disagree Neutral Agree Strongly Agree
Construct Measures
Big-Five Personality Trait – Modified Mini-Marker scale (Saucier, 1994) and
identified personality trait into 5 categories with 16 items.
My hair stylist is…
Extraversion
Active and Energetic
Social and talkative
Self -Assertive
Agreeableness
Kind and Warm
Generous
Agreeable and Unselfish
Trustful and Honest
Conscientiousness
Organized and Planful
Reliable
Hardworking
Serious and Focused
Neuroticism
Emotional
Relaxed and Calm
Stable and Not Moody
Intellect
Creative and Smart
Curios and Eager
International Journal of Management, Accounting and Economics
Vol. 8, No. 5, May, 2021
ISSN 2383-2126 (Online)
© Author(s), All Rights Reserved www.ijmae.com
319
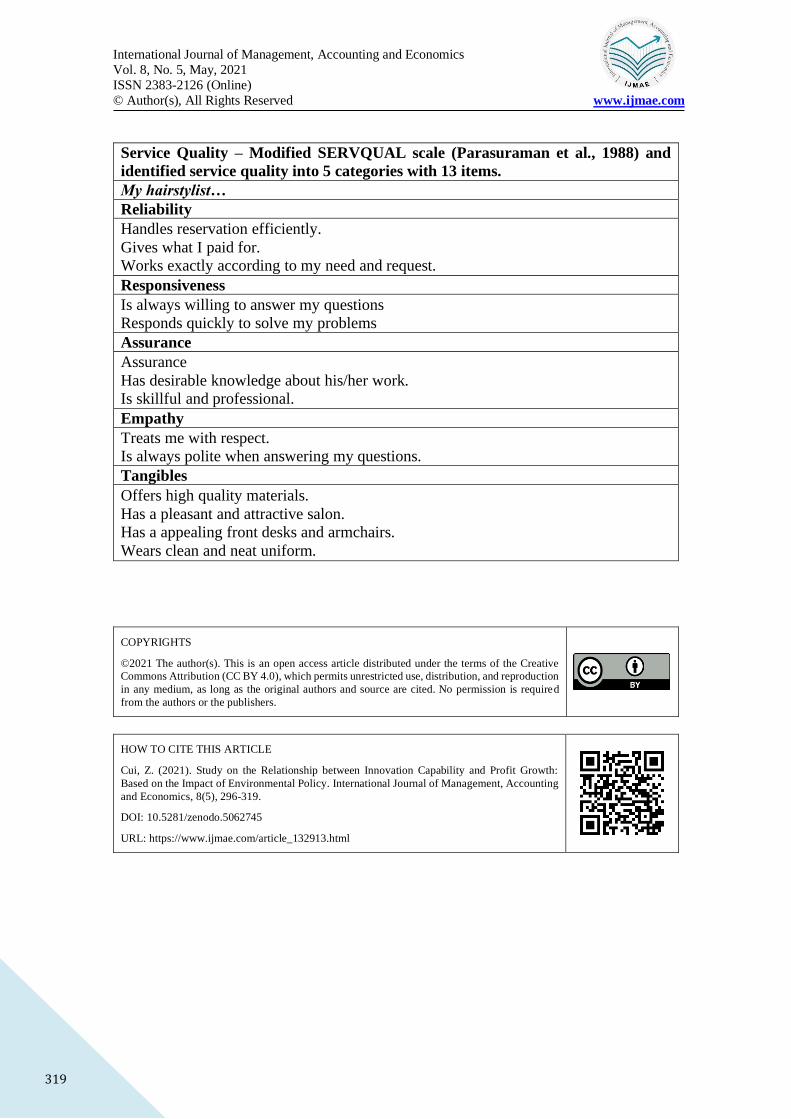
Service Quality – Modified SERVQUAL scale (Parasuraman et al., 1988) and
identified service quality into 5 categories with 13 items.
My hairstylist…
Reliability
Handles reservation efficiently.
Gives what I paid for.
Works exactly according to my need and request.
Responsiveness
Is always willing to answer my questions
Responds quickly to solve my problems
Assurance
Assurance
Has desirable knowledge about his/her work.
Is skillful and professional.
Empathy
Treats me with respect.
Is always polite when answering my questions.
Tangibles
Offers high quality materials.
Has a pleasant and attractive salon.
Has a appealing front desks and armchairs.
Wears clean and neat uniform.
COPYRIGHTS
©2021 The author(s). This is an open access article distributed under the terms of the Creative
Commons Attribution (CC BY 4.0), which permits unrestricted use, distribution, and reproduction
in any medium, as long as the original authors and source are cited. No permission is required
from the authors or the publishers.
HOW TO CITE THIS ARTICLE
Cui, Z. (2021). Study on the Relationship between Innovation Capability and Profit Growth:
Based on the Impact of Environmental Policy. International Journal of Management, Accounting
and Economics, 8(5), 296-319.
DOI: 10.5281/zenodo.5062745
URL: https://www.ijmae.com/article_132913.html


