Perinatal Quality Collaboratives:
State and National Successes Elliott K. Main, MD Medical Director, CMQCC Clinical Professor, Obstetrics and Gynecology University of California, San Francisco, and Stanford University, Medical School

: Transforming Maternity Care
Describe the national initiatives to improve safety and performance in OB
Understand the power of perinatal collaboratives
Describe the California experience with perinatal collaboartives
Present the California Maternal Data Center and how it can be used to drive maternal QI efforts.
Objectives:
2

: Transforming Maternity Care
California HealthCare Foundation Centers for Disease Control California Department of Public Health,
Maternal Child Health Branch (Title V)
Acknowledgement of Support:
Presenter Disclosure(s): No conflicts
3

: Transforming Maternity Care
CPQCC and CMQCC
California Perinatal Quality Care Collaborative (CPQCC) Expertise in data capture from hospitals Established Perinatal Data Center in 1996, works with VON Data use agreements in place with 130 hospitals with NICUs Model of working with state agencies to provide data of value California Maternal Quality Care Collaborative (CMQCC) Expertise in maternal data analysis Developer of QI toolkits: Early Elective Delivery, OB Hemorrhage,
Preeclampsia, Primary Cesarean Host of collaborative learning sessions Established Maternal Data Center in 2011

: Transforming Maternity Care
California Perinatal Quality Care Collaborative
Multi-stakeholder (providers, state agencies, public groups like MOD)
Pioneered partnering with state agencies to use state data for QI
Lead neonatal quality and safety collaboratives (>10 QI initiatives since 1996)
Data submission from 131 of 136 Level 2 and Level 3 NICUs in CA (~17,000 infants), started as a branch of VON

: Transforming Maternity Care
California Perinatal Quality Care Collaborative QI Initiatives since 2000
Antenatal Steroids Postnatal Steroids Neonatal Hospital Acquired Infection Prevention Improving Initial Lung Function VLBW Nutritional Support Parts 1&2 Perinatal Group B Streptococcus Severe Hyperbilirubinemia Prevention Perinatal HIV Prevention Delivery Room Management of the VLBW Care and Management of the Late Preterm Infant

: Transforming Maternity Care
California Maternal Quality Care Collaborative
CMQCC is a multi-stakeholder organization that drives improvement in maternal and infant outcomes through rapid-cycle data analytics and collaborative actions.
Development and validation of perinatal quality metrics and QI tools
Lead (with partners) maternal quality and safety collaboratives
QI implementation to scale: all 260 CA maternity hospitals
All driven by the California Maternal Data Center
: Transforming Maternity Care
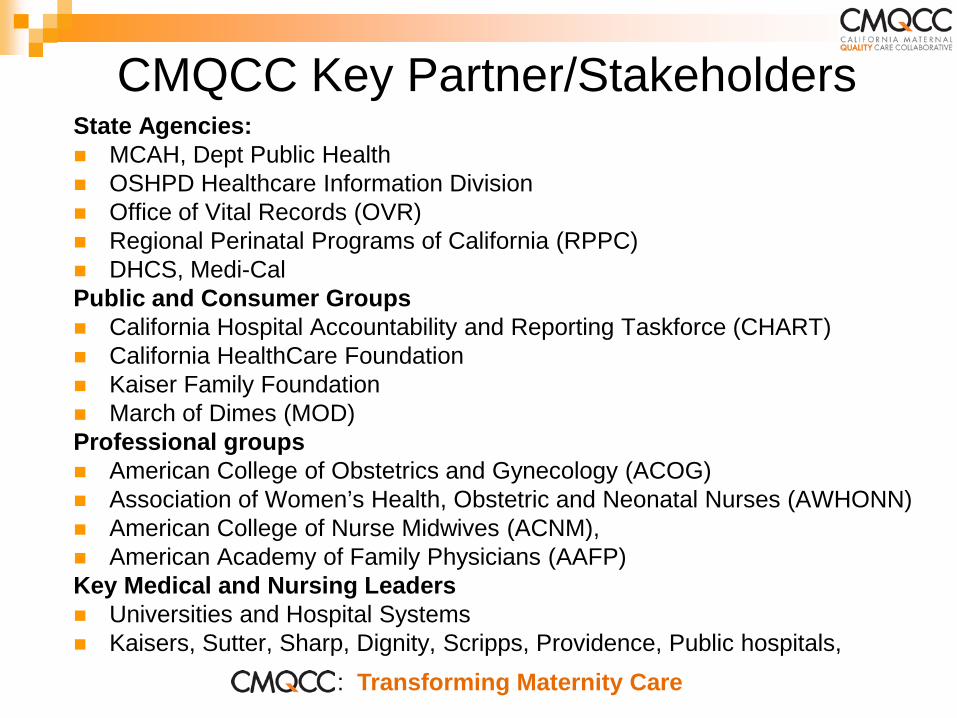
CMQCC Key Partner/Stakeholders State Agencies: MCAH, Dept Public Health OSHPD Healthcare Information Division Office of Vital Records (OVR) Regional Perinatal Programs of California (RPPC) DHCS, Medi-Cal Public and Consumer Groups California Hospital Accountability and Reporting Taskforce (CHART) California HealthCare Foundation Kaiser Family Foundation March of Dimes (MOD) Professional groups American College of Obstetrics and Gynecology (ACOG) Association of Women’s Health, Obstetric and Neonatal Nurses (AWHONN) American College of Nurse Midwives (ACNM), American Academy of Family Physicians (AAFP) Key Medical and Nursing Leaders Universities and Hospital Systems Kaisers, Sutter, Sharp, Dignity, Scripps, Providence, Public hospitals,

: Transforming Maternity Care
CMQCC Key Partner/Stakeholders (con’t)
Hospital Associations: California Hospital Association / HQI Regional Hospital Associations Payers Aetna Anthem Blue Cross Blue Shield Cigna Health Net Purchasers CALPERS (State and local government employees and retirees) Medi-Cal (for managed care plans) Pacific Business Group on Health/ Silicon Valley Employers Forum Cover California (ACA entity)

: Transforming Maternity Care
<<Considerations>>
Importance of including as many stakeholders as possible in the collaborative
Creating value for each stakeholder—thinking thru “what can the collaborative do for each stakeholder category?”
: Transforming Maternity Care
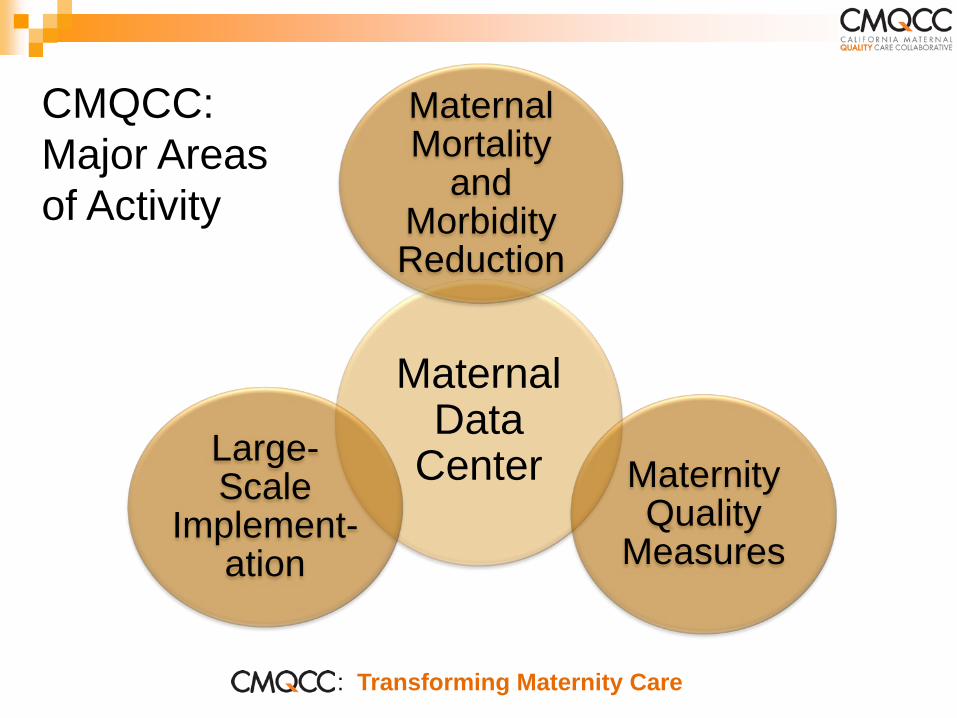
Maternal Mortality
and Morbidity Reduction
Maternity Quality
Measures
Large-Scale
Implement-ation
CMQCC: Major Areas of Activity
Maternal Data
Center

: Transforming Maternity Care
<<Considerations>>
Important for Quality Collaboratives to do BOTH performance and safety projects
Maximize stakeholder engagement Builds recognition and respect
: Transforming Maternity Care
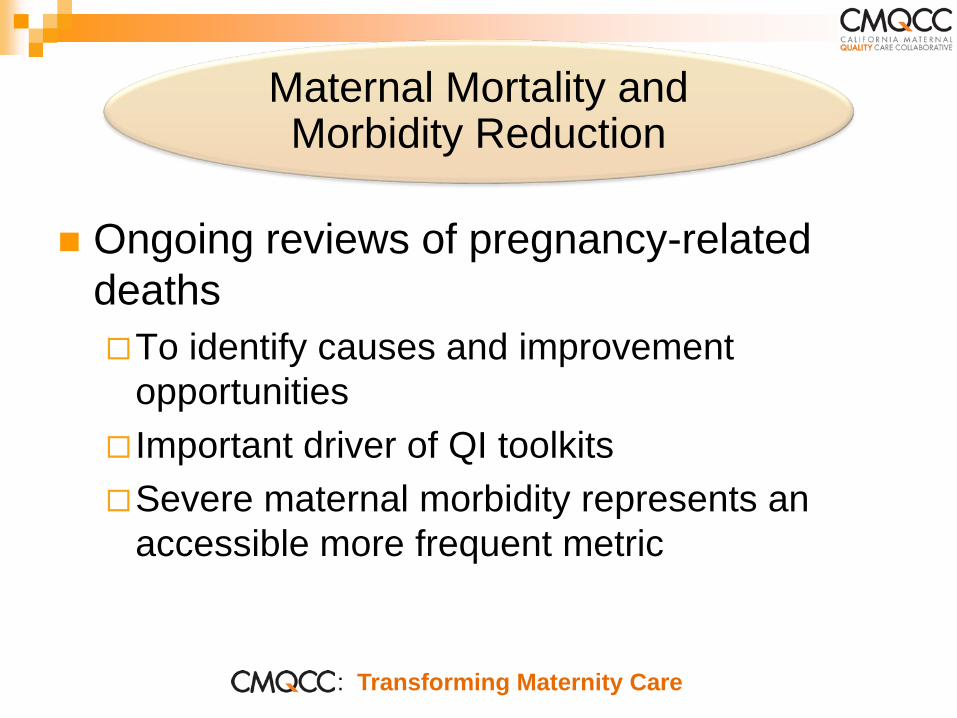
Ongoing reviews of pregnancy-related deaths To identify causes and improvement
opportunities Important driver of QI toolkits Severe maternal morbidity represents an
accessible more frequent metric
Maternal Mortality and Morbidity Reduction

Maternal Mortality Ratios in Selected Countries over the Past 30 Years
0
5
10
15
20
25
Mat
erna
l Mor
talit
y Ra
tio
(per
100
,000
bir
ths)
1980 1990
2000 2008
Hogan et al, Lancet 2010; 375:
14
ç
ç

© CDPH MCAH California Pregnancy-Associated Mortality Review Project, March, 2013
Maternal Mortality Rate, California and United States; 1999-2010
11.1
7.7
10.0
14.6
11.8 11.7
14.010.9
9.7
11.6
9.2
16.9
8.9
15.1
13.1
12.19.99.9
9.8
13.3
12.7
15.5 16.816.6
0.0
2.0
4.0
6.0
8.0
10.0
12.0
14.0
16.0
18.0
1999 2000 2001 2002 2003 2004 2005 2006 2007 2008 2009 2010
Year
California Rate
United States Rate
SOURCE: State of California, Department of Public Health, California Birth and Death Statistical Master Files, 1999-2010. Maternal mortality for California (deaths ≤ 42 days postpartum) was calculated using ICD-10 cause of death classification (codes A34, O00-O95,O98-O99) for 1999-2010. United States data and HP2020 Objective were calculated using the same methods. U.S. maternal mortality rates are published by the National Center for Health Statistics (NCHS) through 2007 only. Rates for 2008-2010 were calculated using NCHS Final Birth Data (denominator) and CDC Wonder Online Database for maternal deaths (numerator). Accessed at http://wonder.cdc.gov/ucd-icd10.html on Apr 17, 2013 8:00:39 PM. Produced by California Department of Public Health, Center for Family Health, Maternal, Child and Adolescent Health Division, April, 2013.
HP 2020 Objective – 11.4 Deaths per 100,000 Live Births
Mat
erna
l Dea
ths
per 1
00,0
00 L
ive
Birt
hs


CA-PAMR: Chance to Alter Outcome Grouped Cause of Death; 2002-2004 (N=145)
Grouped Cause of Death Chance to Alter Outcome Strong / Good (%)
Some (%)
None (%)
Total N (%)
Obstetric hemorrhage 69 25 6 16 (11) Deep vein thrombosis/ pulmonary embolism 53 40 7 15 (10)
Sepsis/infection 50 40 10 10 (7) Preeclampsia/eclampsia 50 50 0 25 (17) Cardiomyopathy and other cardiovascular causes 25 61 14 28 (19)
Cerebral vascular accident 22 0 78 9 (6)
Amniotic fluid embolism 0 87 13 15 (10) All other causes of death 46 46 8 26 (18) Total (%) 40 48 12 145 7

• California Pregnancy Associated Mortality Reviews – Missed triggers/risk factors: abnormal vital signs, pain,
altered mental status/lack of planning for at risk patients – Underutilization of key medications and treatments – Difficulties getting physician to the bedside – “Location of care” issues involving Postpartum, ED and PACU
• University of Illinois Regional Perinatal Network - Failure to identify high-risk status - Incomplete or inappropriate management
Dominance of Provider QI Opportunities: Hemorrhage and Preeclampsia
CDPH/CMQCC/PHI. The California Pregnancy-Associated Mortality Review (CA-PAMR): Report from 2002 and 2003 Maternal Death Reviews. 2011 (available at: CMQCC.org)
Geller SE etal. The continuum of maternal morbidity and mortality: Factors associated with severity Am J Obstet Gynecol 2004; 191: 939 44
Present in >95% of cases
Present in >90% of cases

Maternal Mortality and Severe Morbidity Approximate distributions, compiled from multiple studies
Cause Mortality (1-2 per 10,000)
ICU Admit (1-2 per 1,000)
Severe Morbid (1-2 per
100)
VTE and AFE 15% 5% 2%
Infection 10% 5% 5%
Hemorrhage 15% 30% 45%
Preeclampsia 15% 30% 30%
Cardiac Disease 25% 20% 10%

California Pregnancy-Associated Mortality Review (CA-PAMR)
Quality Improvement Review Cycle
1. Identification of cases
2. Information collection, review by multidisciplinary
committee
3. Cause of Death, Contributing Factors and Quality Improvement (QI) Opportunities identified
4. Strategies to improve care and reduce
morbidity and mortality
5. Evaluation and Implementation of QI strategies and tools Toolkits
Developed: •Hemorrhage •Preeclampsia
6


CMQCC OB Hemorrhage Care Guidelines www.CMQCC.org
These tools are adapted for each hospital's circumstances
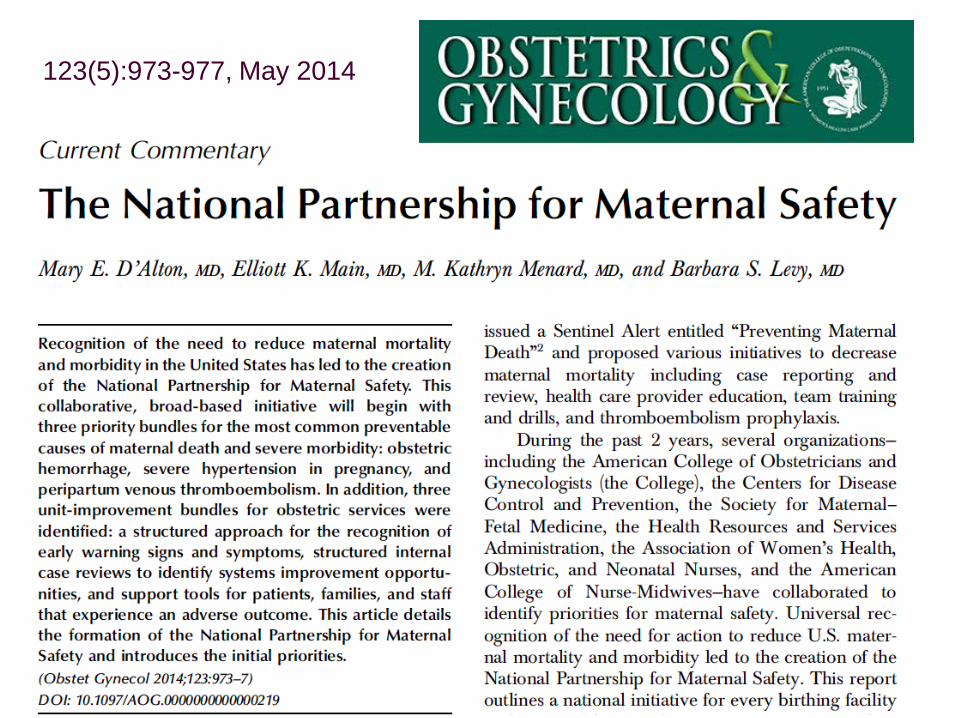
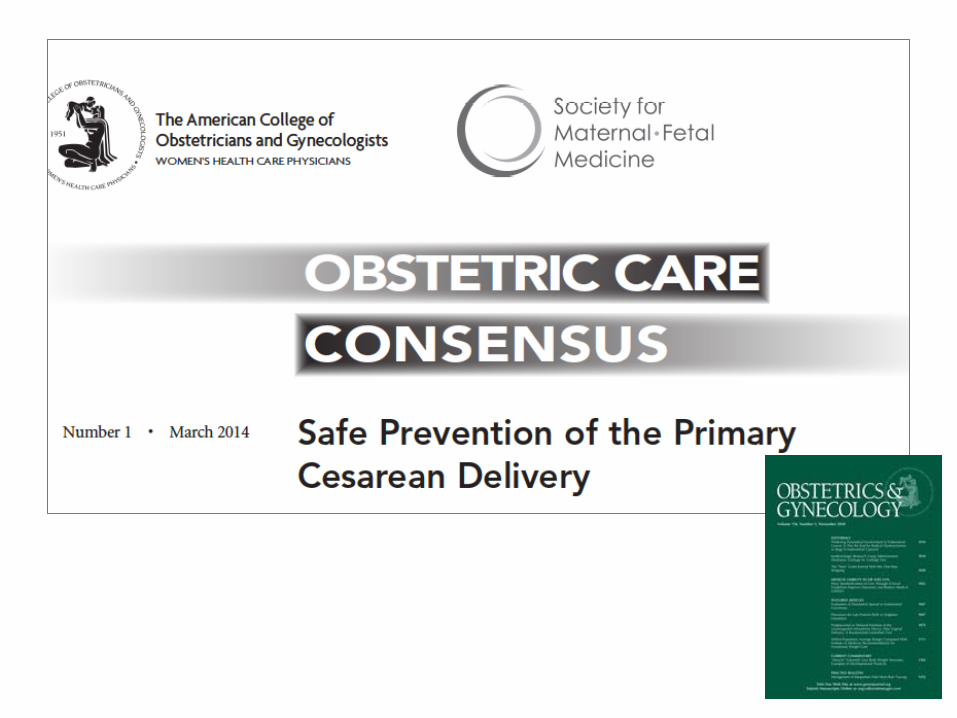
123(5):973-977, May 2014
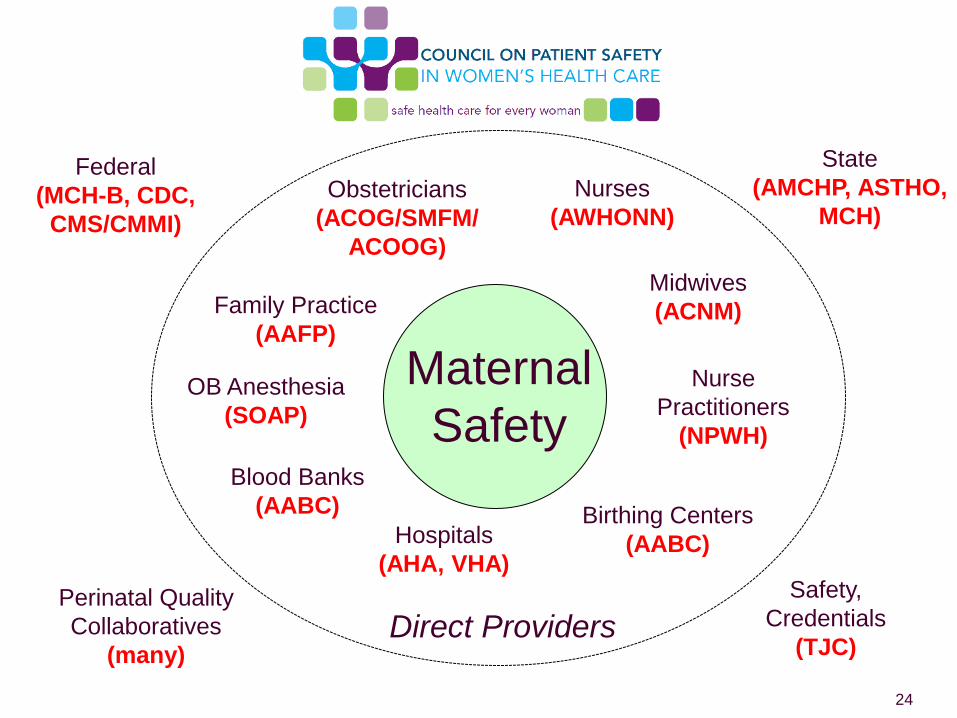
Maternal Safety
Obstetricians (ACOG/SMFM/
ACOOG)
Nurses (AWHONN)
Family Practice (AAFP)
Midwives (ACNM)
Hospitals (AHA, VHA)
OB Anesthesia (SOAP)
Birthing Centers (AABC)
Safety, Credentials
(TJC)
Blood Banks (AABC)
Perinatal Quality Collaboratives
(many)
Federal (MCH-B, CDC,
CMS/CMMI)
State (AMCHP, ASTHO,
MCH)
Direct Providers
Nurse Practitioners
(NPWH)
24
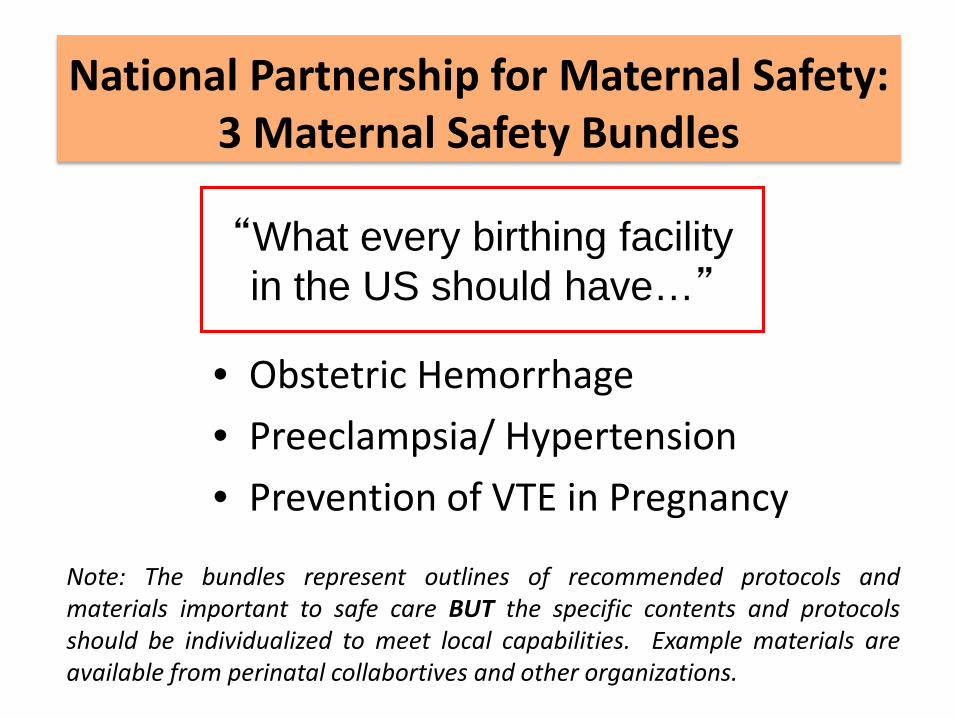
National Partnership for Maternal Safety: 3 Maternal Safety Bundles
• Obstetric Hemorrhage
• Preeclampsia/ Hypertension
• Prevention of VTE in Pregnancy
“What every birthing facility in the US should have…”
Note: The bundles represent outlines of recommended protocols and materials important to safe care BUT the specific contents and protocols should be individualized to meet local capabilities. Example materials are available from perinatal collabortives and other organizations.

: Transforming Maternity Care

Importance of Protocols and Checklists creating standardized approaches esp. for Emergencies
Importance of Drills and Debriefs
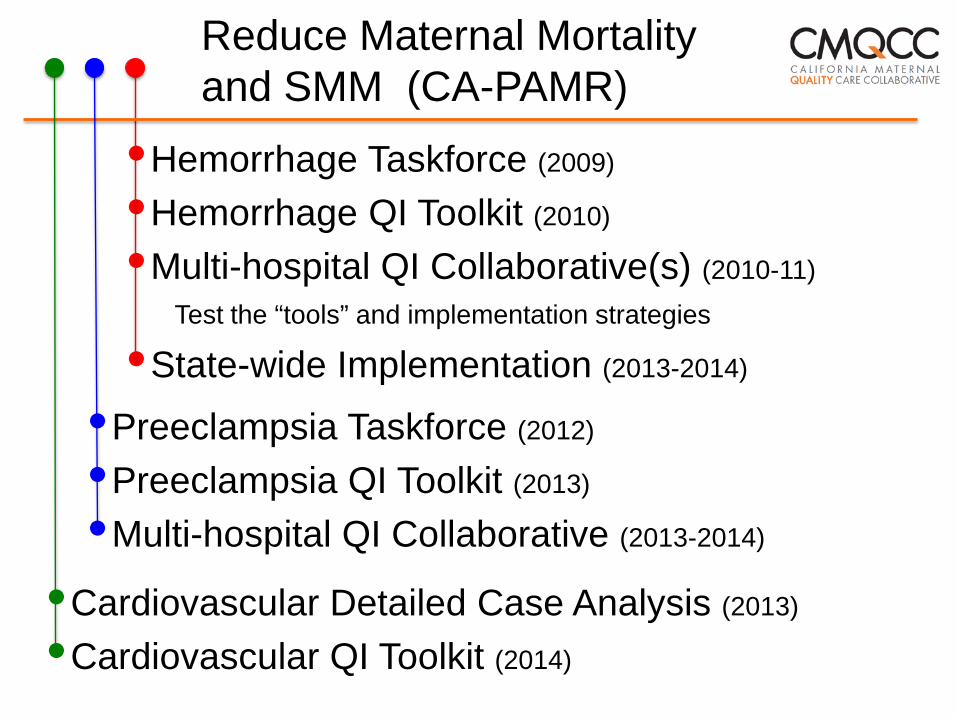
Reduce Maternal Mortality and SMM (CA-PAMR)
•Hemorrhage Taskforce (2009)
•Hemorrhage QI Toolkit (2010)
•Multi-hospital QI Collaborative(s) (2010-11)
Test the “tools” and implementation strategies
•State-wide Implementation (2013-2014)
•Preeclampsia Taskforce (2012)
•Preeclampsia QI Toolkit (2013)
•Multi-hospital QI Collaborative (2013-2014)
•Cardiovascular Detailed Case Analysis (2013)
•Cardiovascular QI Toolkit (2014)
© CDPH MCAH California Pregnancy-Associated Mortality Review Project, March, 2013
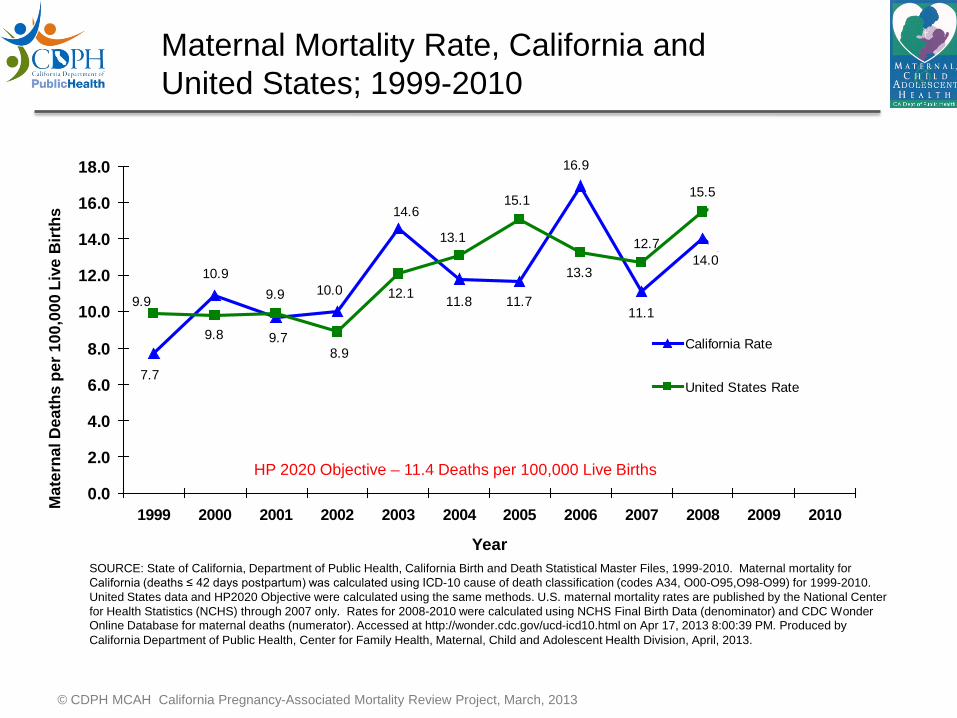
Maternal Mortality Rate, California and United States; 1999-2010
11.1
7.7
10.0
14.6
11.8 11.7
14.010.9
9.7
11.6
9.2
16.9
8.9
15.1
13.1
12.19.99.9
9.8
13.3
12.7
15.5 16.816.6
0.0
2.0
4.0
6.0
8.0
10.0
12.0
14.0
16.0
18.0
1999 2000 2001 2002 2003 2004 2005 2006 2007 2008 2009 2010
Year
California Rate
United States Rate
SOURCE: State of California, Department of Public Health, California Birth and Death Statistical Master Files, 1999-2010. Maternal mortality for California (deaths ≤ 42 days postpartum) was calculated using ICD-10 cause of death classification (codes A34, O00-O95,O98-O99) for 1999-2010. United States data and HP2020 Objective were calculated using the same methods. U.S. maternal mortality rates are published by the National Center for Health Statistics (NCHS) through 2007 only. Rates for 2008-2010 were calculated using NCHS Final Birth Data (denominator) and CDC Wonder Online Database for maternal deaths (numerator). Accessed at http://wonder.cdc.gov/ucd-icd10.html on Apr 17, 2013 8:00:39 PM. Produced by California Department of Public Health, Center for Family Health, Maternal, Child and Adolescent Health Division, April, 2013.
HP 2020 Objective – 11.4 Deaths per 100,000 Live Births
Mat
erna
l Dea
ths
per 1
00,0
00 L
ive
Birt
hs

: Transforming Maternity Care
Development of national quality measures with endorsement by NQF
Support for collection and reporting of NQF and other quality measures
Toolkits and Collaboratives for reducing: Early Elective Delivery (EED) First-birth Low-risk (NTSV) Cesarean birth
Improving Maternal Quality Measures

JC Core Measure Set
• #0469 Elective delivery prior to 39 weeks • #0470 Episiotomy rate • #0471 NTSV Cesarean rate, aka “low-risk” first births • #0472 Prophylactic antibiotics for Cesarean birth (< 1hr) • #0473 DVT prophylaxis for women having a Cesarean birth
• #0475 Hepatitis B Vaccine for all newborns • #0476 Rate of antenatal steroids for under 34 week births • #0477 Infants under 1500g (VLBW) not delivered at Level III • #0480 Exclusive breastfeeding at hospital discharge • #0716 Healthy Term Newborn (aka Unexpected Newborn Complications)
• #1402 Newborn Hearing Screening • #1746 Intrapartum GBS antibiotic prophylaxis
OB/ Mom
OB/ Baby
=Measures that are highest value (Quality + Savings)==CMS
NQF National Consensus Standards for Perinatal Care 2013 (12 OB measures)
Leapfrog Group Measures
QITools
QITools

: Transforming Maternity Care
CMQCC Perinatal QI Toolkits Adopted Nationally
: Transforming Maternity Care
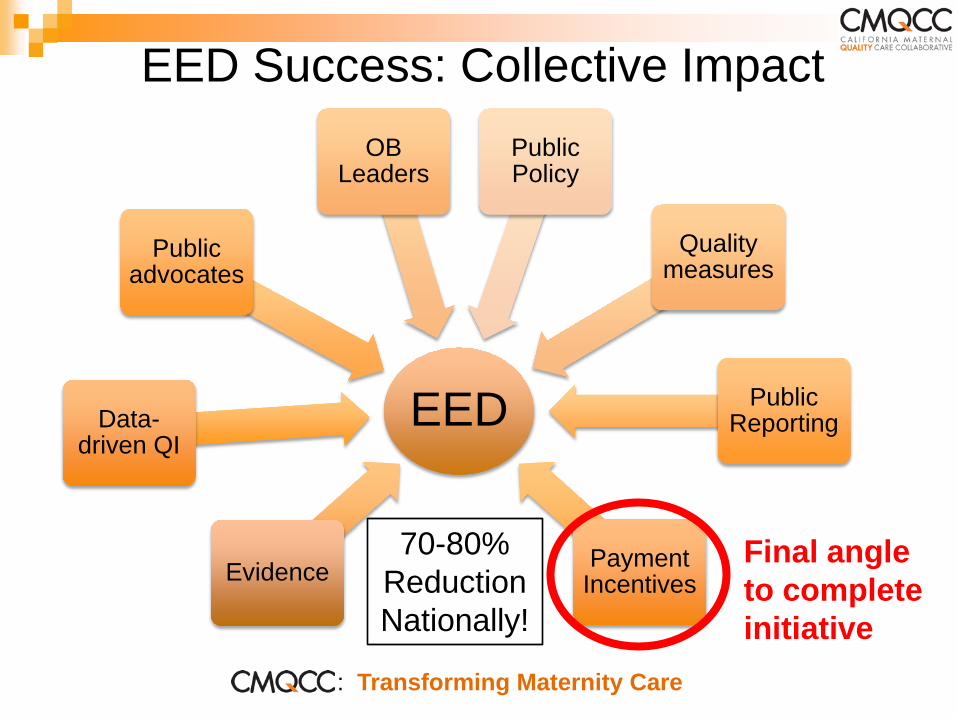
EED
Evidence
Data-driven QI
Public advocates
OB Leaders
Public Policy
Quality measures
Public Reporting
Payment Incentives
EED Success: Collective Impact
Final angle to complete initiative
70-80% Reduction Nationally!

0%
10%
20%
30%
40%
50%
60%
70%
80%
1 6 11
16
21
26
31
36
41
46
51
56
61
66
71
76
81
86
91
96
101
106
111
116
121
126
131
136
141
146
151
156
161
166
171
176
181
186
191
196
201
206
211
216
221
226
231
236
241
246
251
Total CS Rate Among 251 California Hospitals 2011-2012
(Source: CMQCC--California Maternal Data Center combining primary data from OSHPD and Vital Records)
Range: 15.0—71.4% Median: 32.5% Mean: 32.8%
34
Large Variation Among Hospitals!

0%
10%
20%
30%
40%
50%
60%
70%
80%
1 6 11
16
21
26
31
36
41
46
51
56
61
66
71
76
81
86
91
96
101
106
111
116
121
126
131
136
141
146
151
156
161
166
171
176
181
186
191
196
201
206
211
216
221
226
231
236
241
246
Low-Risk First-Birth (Nuliparous Term Singleton Vertex) CS Rate (endorsed by NQF, TJC PC-02, CMS, HP2020)
Among 249 California Hospitals: 2011-2012 (Source: CMQCC--California Maternal Data Center
combining primary data from OSHPD and Vital Records)
Range: 10.0—75.8% Median: 27.0% Mean: 27.7% National
Target =23.9%
July 24, 2013
36% of CA hospitals meet national target
35
Extreme Hospital Level Variation! Pilot

: Transforming Maternity Care
CMQCC Data-Driven QI: NTSV CS
37
32.9% 33.6%
31.2% 31.8%
28.3%
24.3% 25.0% 23.4%
15%
18%
20%
23%
25%
28%
30%
33%
35%
2011 2012 2013 Jan-14 Feb-14 Mar-14 Apr-14 May-14
Pilot Hospital: PBGH / RWJ CS Collaborative
NTSV CS Rate
National Target for NTSV CS = 23.9%
QI Project Started: Jan 16
Keys for Success: 1. Evidence-based
QI Plan based on rapid-cycle data
2. Local leadership 3. Hospital-Provider
alignment 4. Modest incentives
(shared savings)
: Transforming Maternity Care
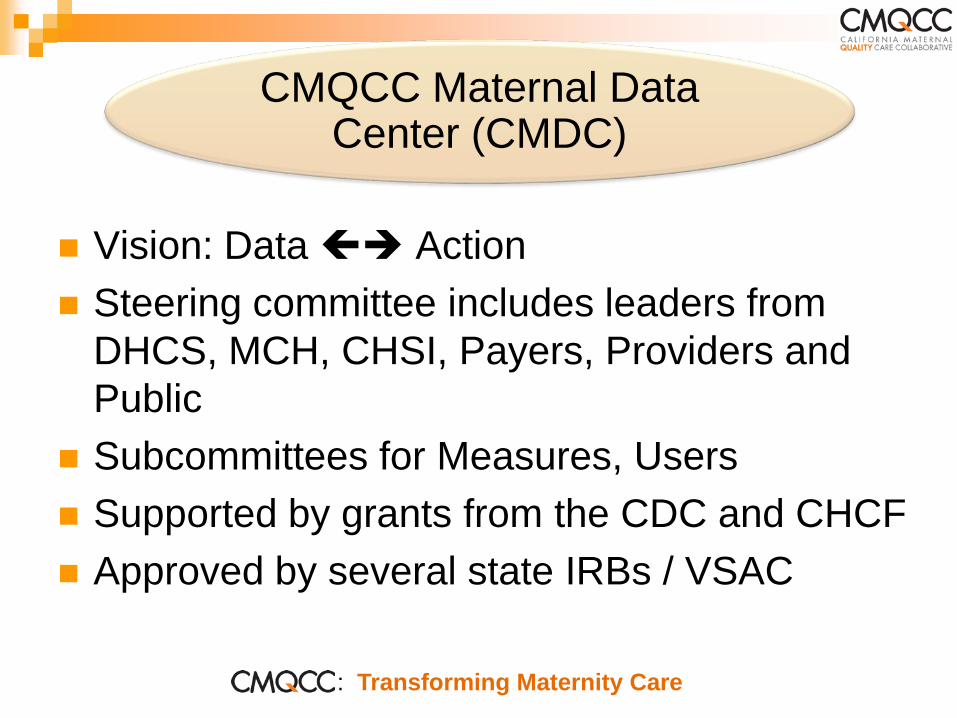
Vision: Data Action Steering committee includes leaders from
DHCS, MCH, CHSI, Payers, Providers and Public
Subcommittees for Measures, Users Supported by grants from the CDC and CHCF Approved by several state IRBs / VSAC
CMQCC Maternal Data Center (CMDC)

: Transforming Maternity Care
What is the CMDC?
A Rapid-Cycle one-stop shop to support hospitals’ obstetric quality improvement initiatives and service line management Overall hospital obstetric performance measures (>40)
Benchmarking statistics--to compare your hospital to regional, state, and like-hospital peers
Facilitating reporting to Leapfrog, HEN, and CMS IQR
Provider-level statistics—to assess variation within a hospital
Low-burden/High-value

: Transforming Maternity Care
PDD--Discharge Diagnosis File (ICD9 codes)
Birth Certificate File (Clinical Data)
Automatically Link Birth Data to PDD file (Deterministic+ Probabilistic)
CMQCC Maternal Data Center
CMQCC Data Center
REPORTS Benchmarks against other hospitals
Sub-measure reports
Immediately calculates all the Measures CHART REVIEW
(If needed) <39wk EED
Antenatal Steroids Process measures
Limited manual data entry for these measures
Q MONTH: Upload electronic files for ALL CA births
Mantra: “If you use it, they will improve it”
2) Q 6 MOS: Upload mothers and infants PDD: ALL (from OSHPD)
1) Q MONTH: Upload mothers and infants PDD: Partic. hospitals
Support Data QI

Sample Hospital

: Transforming Maternity Care
<<Considerations>>
Important to move beyond reporting metrics to addressing WHY?
Need to have timely data (months old rather than years old)
Need a base of the entire population and then build projects requiring special data collection on that foundation

: Transforming Maternity Care
Beyond Reporting Rates (Numerator/Denominator)
Automated Measure analysis using nested sub-measures to guide and focus your QI journey
Drill-down to the patient level with Case Review Worksheets to understand quality improvement opportunities—for both clinical quality and data quality
Trend analyses of both measures and sub-measures
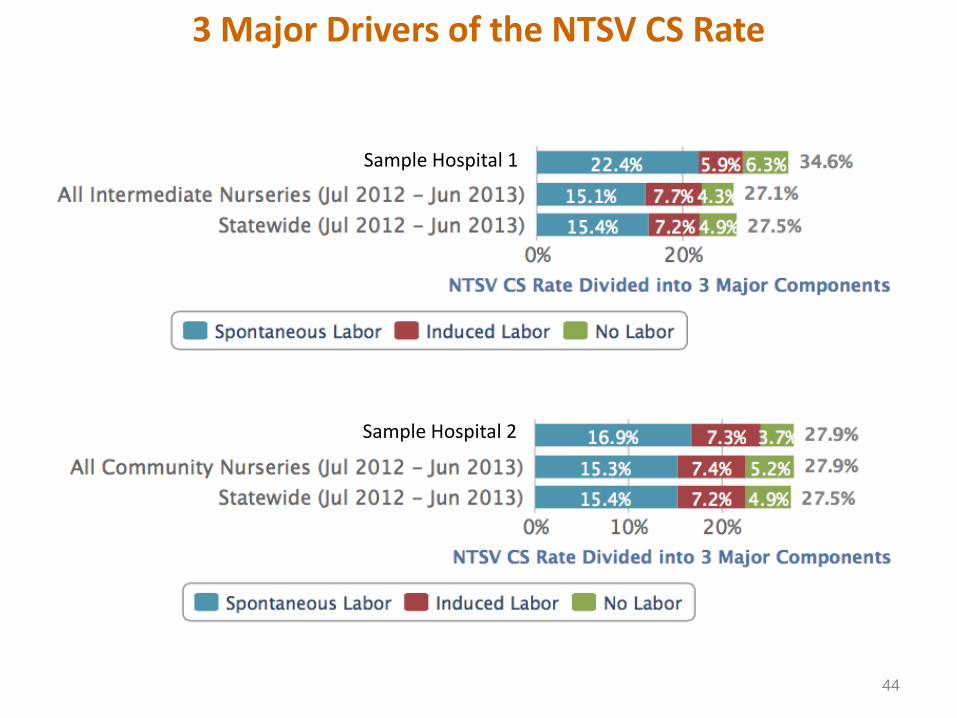
44
3 Major Drivers of the NTSV CS Rate
Sample Hospital 1
Sample Hospital 2

Comparison Rates for the 3 Major NTSV Drivers
Sample Hospital 1
Sample Hospital 1

Comparison Rates for the 3 Major NTSV Drivers Sample Hospital 2
Sample Hospital 2

Are there confounding factors needing risk adjustment? A Bay Area Story
NTSV CS=24.0%
Sample Hospital
Sample Hospital

Are there confounding factors needing risk adjustment? A Central Valley Story
NTSV CS=25.9%
Sample Hospital
Sample Hospital
: Transforming Maternity Care
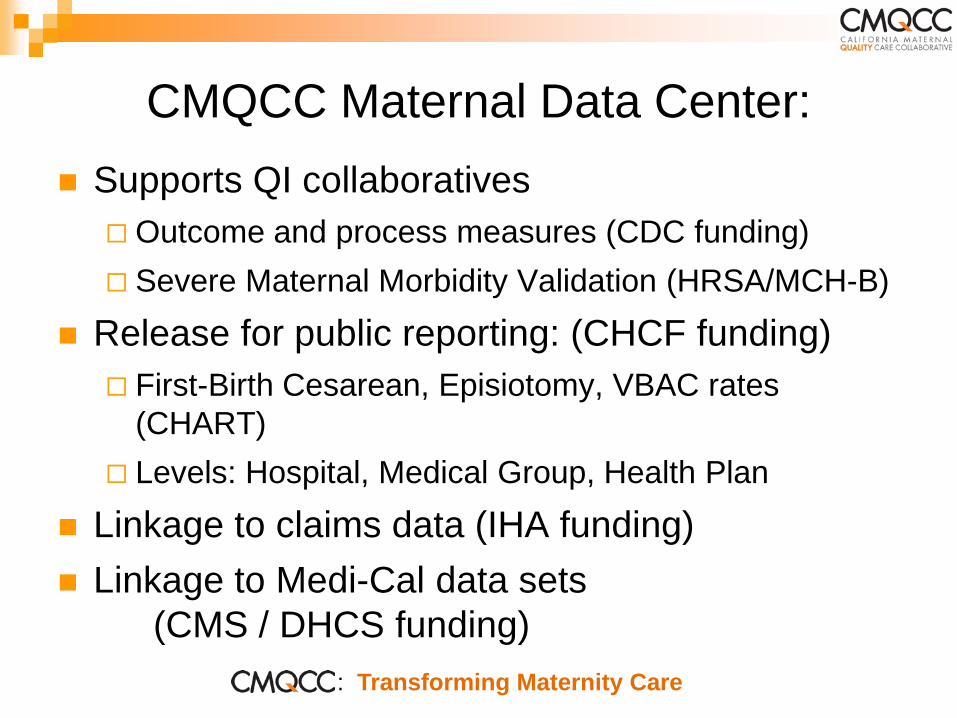
CMQCC Maternal Data Center: Supports QI collaboratives
Outcome and process measures (CDC funding) Severe Maternal Morbidity Validation (HRSA/MCH-B)
Release for public reporting: (CHCF funding) First-Birth Cesarean, Episiotomy, VBAC rates
(CHART) Levels: Hospital, Medical Group, Health Plan
Linkage to claims data (IHA funding) Linkage to Medi-Cal data sets
(CMS / DHCS funding)

Timing for Treatment of Gravidas with sBP≥160 or dBP≥110
Sample hospital from CMQCC Preeclampsia Collaborative 2013
Col
labo
rativ
e St
art
: Transforming Maternity
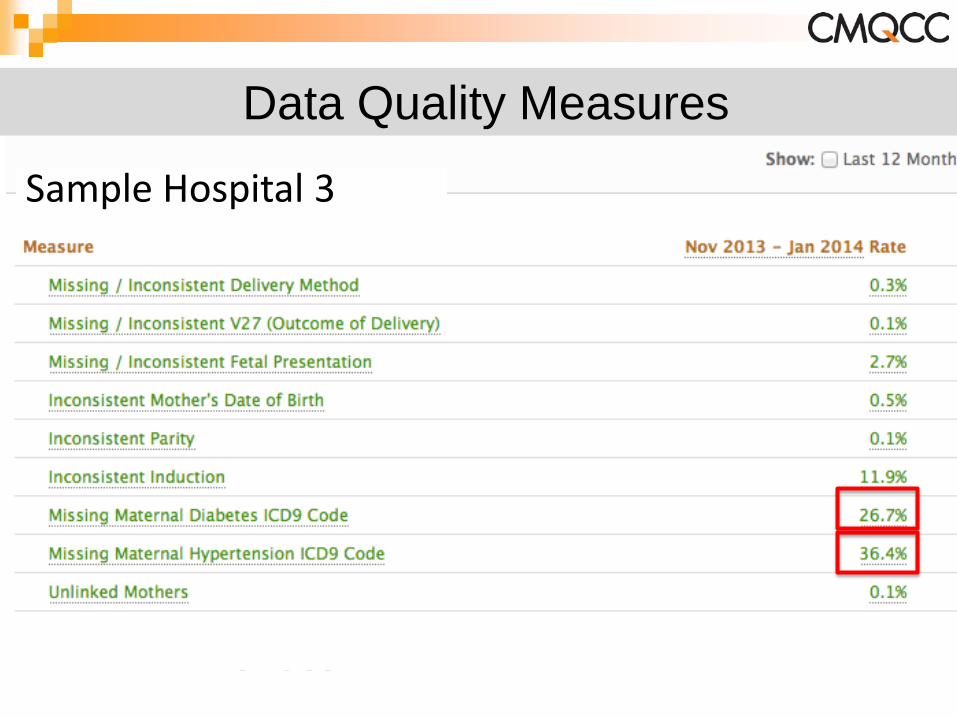
Data Quality Measures
Sample Hospital 3

: Transforming Maternity Care
Merck for Mothers Implementation of hemorrhage and preeclampsia
safety bundles in all California hospitals Set up a state-wide implementation model
Cal-SIM (maternity domain) Consensus maternity performance measures Incentives focused on identified metrics CMQCC to do data collection and QI support
Large-Scale Implementation Projects

: Transforming Maternity Care
Merck for Mothers: Large-scale QI Model
QI Mentors (paired MD and RN) To support a group of 6-8 hospitals thru
implementation of both bundles Grouped by system, referral network, or size Mentor training in early October (North and South)
Identified metrics (CMDC capture and report) Comprehensive web support Key partners
California Hospital Association Patient Safety First (Anthem Blue Cross) ACOG, AWHONN, ACNM, RPPC
: Transforming Maternity Care
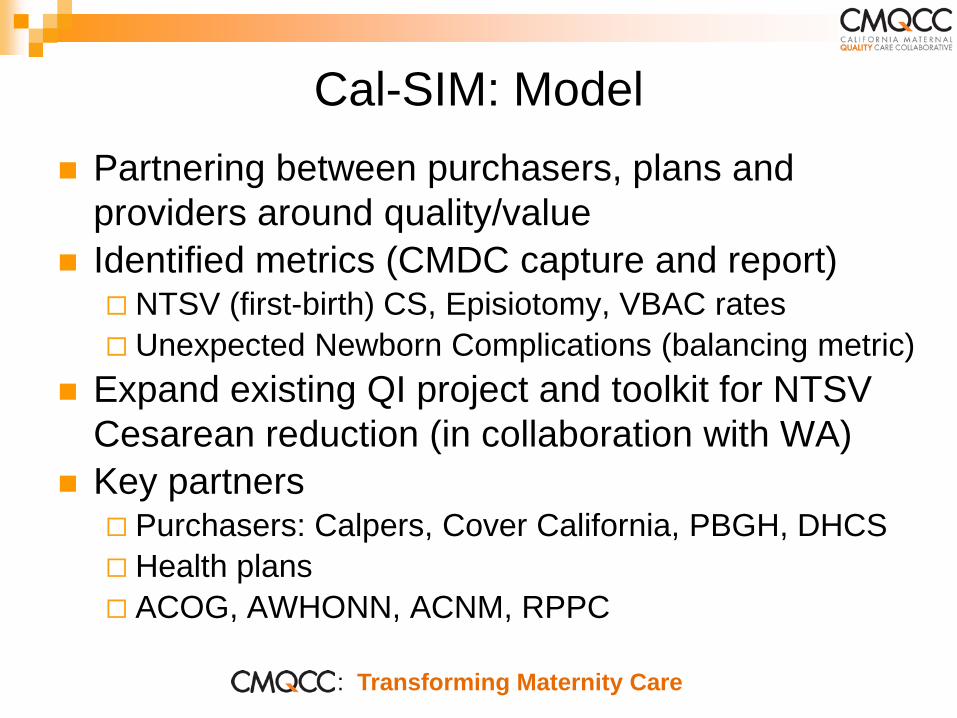
Cal-SIM: Model Partnering between purchasers, plans and
providers around quality/value Identified metrics (CMDC capture and report)
NTSV (first-birth) CS, Episiotomy, VBAC rates Unexpected Newborn Complications (balancing metric)
Expand existing QI project and toolkit for NTSV Cesarean reduction (in collaboration with WA)
Key partners Purchasers: Calpers, Cover California, PBGH, DHCS Health plans ACOG, AWHONN, ACNM, RPPC

: Transforming Maternity Care
Maternal Mortality
and Morbidity Reduction
Maternity Quality
Measures
Large-Scale
Implement-ation
CMQCC: Highlights
Maternal Data
Center
•Hemorrhage •Preeclampsia •Cardiovascular •VTE prevention •Violent deaths •Severe Morbidity
•EED •NTSV CS •Unexpected Neonatal Complications
•Merck for Mothers •Cal-SIM
•Preterm Birth Prevention

: Transforming Maternity Care
A model for Rapid-cycle Improvement Maternity care has unusually large variation in
care, even after risk adjustment Examine the drivers for successful projects:
multi-organization collaboration alignment of goals
Central role for data-driven QI / State-wide data system Not just reporting hospital rates and provider rates Multiple tools to allow intelligent analysis to allow
providers to answer why their rate is high

: Transforming Maternity Care
OB
Evidence
Data-driven QI
Public advocates
OB Leaders
Public Policy
Quality measures
Public Reporting
Payment Incentives
Collaborative Action: Collective Impact