
Performance Measurement Series:Analyzing, Using and Reporting Data
June 6, 2012
YWCA Great Lakes Alliance Region
Shelly M. SchnuppCapacity Building Consultant
Three Part Series:
1. Establishing the Basis for Program Performance Tracking and Measurement
April 17, 2012 9am CT
2. Defining Performance Indicators and Measures May 1, 2012 9am CT
3. Analyzing, Using and Reporting DataJune 6, 2012 9am CT

SESSION 1 Review Laying the groundwork for
measurement….
SESSION 1 Review Laying the groundwork for
measurement…. Organizational measurement systems and the
role of program performance measurement The Importance of program logic in establishing
the basis for measurement Outputs vs. outcomes Mission-driven chain of results Selecting outcomes to measure Resources and examples
Organizational measurement systems and the role of program performance measurement
The Importance of program logic in establishing the basis for measurement
Outputs vs. outcomes Mission-driven chain of results Selecting outcomes to measure Resources and examples
SESSION 2 ReviewMaking measurement real….
SESSION 2 ReviewMaking measurement real….
Framing indicators Sources of data Validity, reliability and other criteria for
establishing effective measures Measurement problems and challenges Resources and examples
Framing indicators Sources of data Validity, reliability and other criteria for
establishing effective measures Measurement problems and challenges Resources and examples

5
SESSION 3 Making Outcomes Data Useful
Analyzing, using and reporting outcomes dataBenchmarkingDisaggregating dataTrendsData PresentationData Management Tools

Special Guest
Bruce Wantuch,
Management Consultant

Steps for Analyzing Program Outcomes Data
1. Begin with the Basics
2. Delve Deeper into Client and Service Characteristics
3. Make Sense of the Numbers
Analyzing Outcomes Data
Calculations + Human Judgment
Analysis is as much about thinking as it is about calculating.
Urban Institute, 2004

1. Beginning with the Basics
Calculate overall outcomes for all clients Compare the latest overall outcomes with
outcomes from previous time periods Compare the latest overall outcomes with
pre-established targets Compare the latest overall outcomes with
outcomes for other, similar program and/or to outside standards
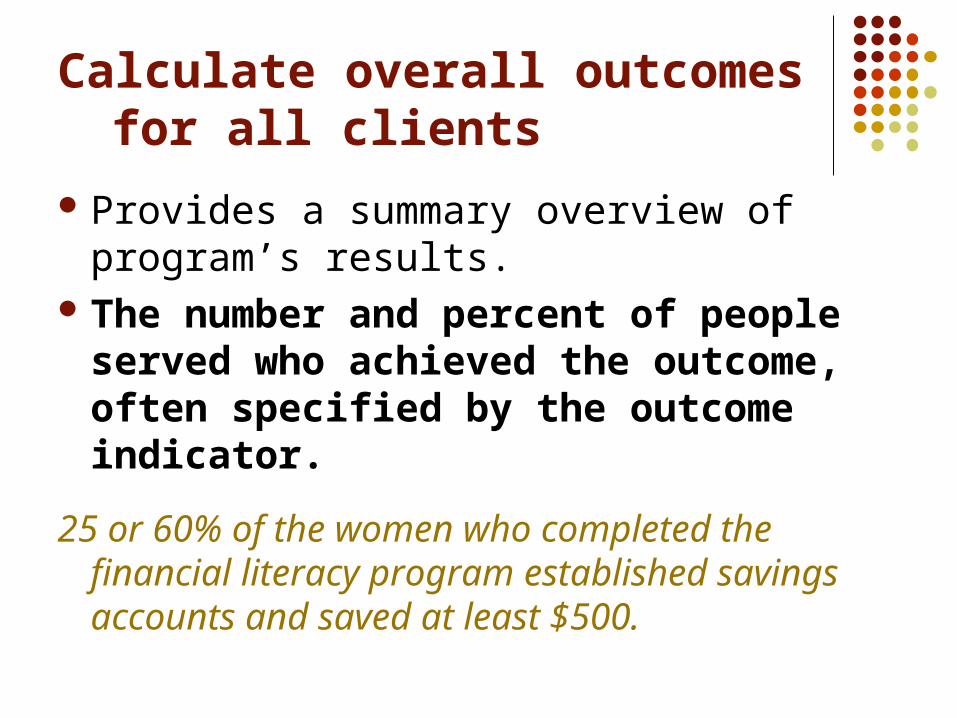
Calculate overall outcomes for all clients
Provides a summary overview of program’s results.
The number and percent of people served who achieved the outcome, often specified by the outcome indicator.
25 or 60% of the women who completed the financial literacy program established savings accounts and saved at least $500.

Basic Calculation Issues Determining the Relevant Clients
Who should be included in the denominator? 75 or 60% of the 125 women who completed the
financial literacy program established savings accounts and saved at least $500.
75
125 = .60
OR 75 or 25% of the 300 women who participated in the
financial literacy program established savings accounts and saved at least $500.
75
300 = .25

Benchmarking: Compare the latest overall outcomes with outcomes from previous time periods Comparisons provide context for interpreting outcomes
information. Trends over time can help identify influencing factors. % of girls who increased technology skills
2006 2007 2010 2011

Compare the latest overall outcomes with pre-established targets
Sufficient program delivery allows for establishing performance targets.
35% of women in transitional housing, who complete the program, are expected to move into permanent housing within one year.
Are we meeting expectations? Exceeding or falling short?

Compare the latest overall outcomes with those from similar programs
From programs in same or other communities.
Be cautious about how and when outcomes are measured by others, quality of data.

2. Delving Deeper
Break out and compare client outcomes by demographics, characteristics Age, gender, race/ethnicity, income Program entry status
White women vs. women of color
Women with vs. without high school diploma

Delving Deeper
Break out and compare outcomes by service characteristics
Different service locations Different service providers, caseworkers Different specific interventions Various levels of service engagement

Delving Deeper Compare breakouts with previous reporting
periods or targets.
% of girls who increased technology skills
Location 1
Location 2
2006 2007 2010 2011

3. Making Sense of the Numbers
Identify which numbers should be highlighted
Seek explanations Use and communicate the findings

Explaining the Data
Find factors that explain data-- changes and trends
EXTERNAL Changes in external conditions Social or political changes Changes in client needs, challenges
INTERNAL Unexpected changes in staff, funding leadership Problems with program design

Using the Data
Identify special issues needing attention – missed targets, trends, anomalies
Identify client groups that need attention – disparities based on gender? race? age group?
Identify services procedures that are working– or need improvement
Identify training and technical assistance needs Celebrate good outcomes! Hold regular “how are we doing” meetings
Presenting and Reporting Data
Provide clear context Include numbers and percentages Reports data trends when possible Be cautious about assigning cause Use charts and graphics
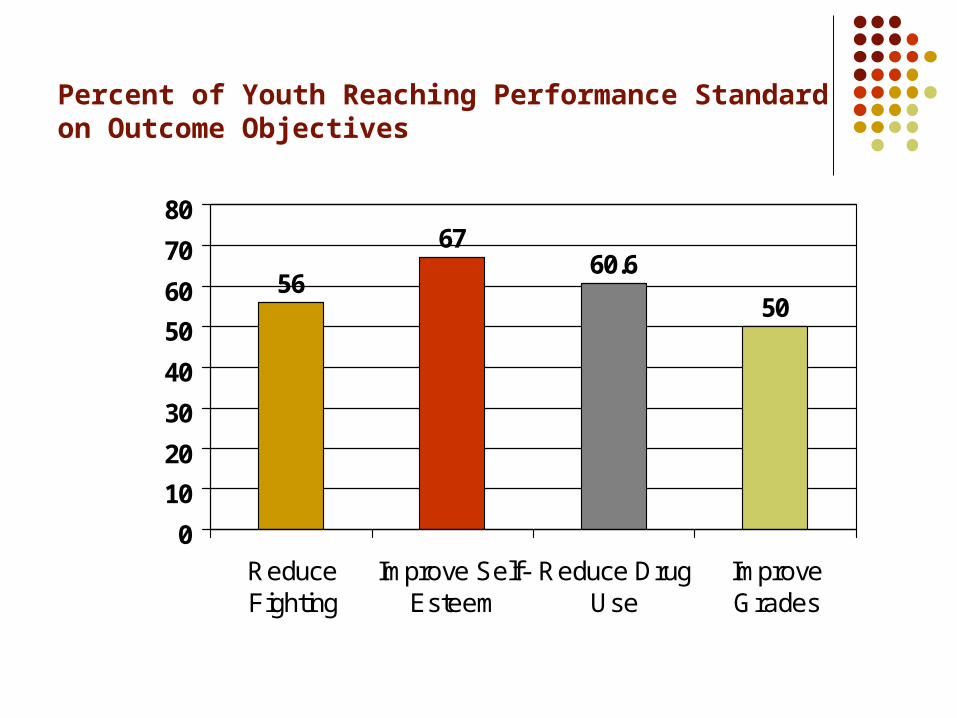
Percent of Youth Reaching Performance Standard on Outcome Objectives
56
6760.6
50
0
10
20
30
40
50
60
70
80
ReduceFighting
Improve Self-Esteem
Reduce DrugUse
ImproveGrades
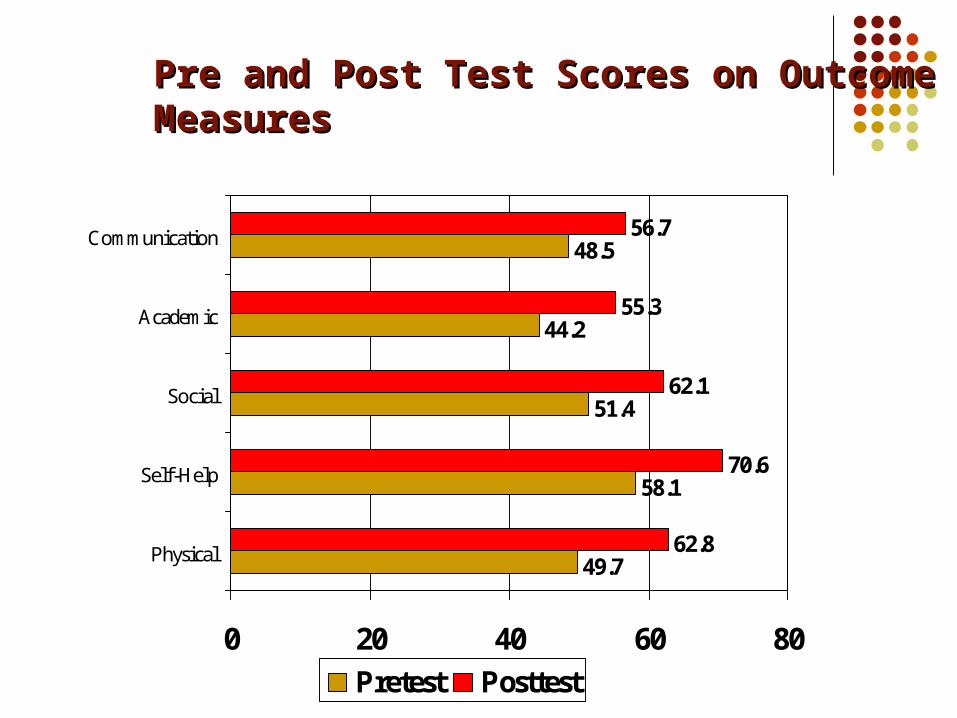
49.7
58.1
51.4
44.2
48.5
62.8
70.6
62.1
55.3
56.7
0 20 40 60 80
Physical
Self-Help
Social
Academic
Communication
Pretest Posttest
Pre and Post Test Scores on Outcome Pre and Post Test Scores on Outcome MeasuresMeasures

Presenting and Reporting Data Tailor to various audiences:
Board of Directors and Staff Funders of the program Potential funders, supporters Program clients, stakeholders
Use to promote organization Prospective Board members Supporters Volunteers Prospective program clients
Managing Data Bruce Wantuch,
Management Consultant
Identify obstacles to effective service delivery
Identify an internal resource to manage the data collection process
Assess computer hardware and network Decide what software package will be used
to house the data collected How to pay for the additional cost of data
collection and management
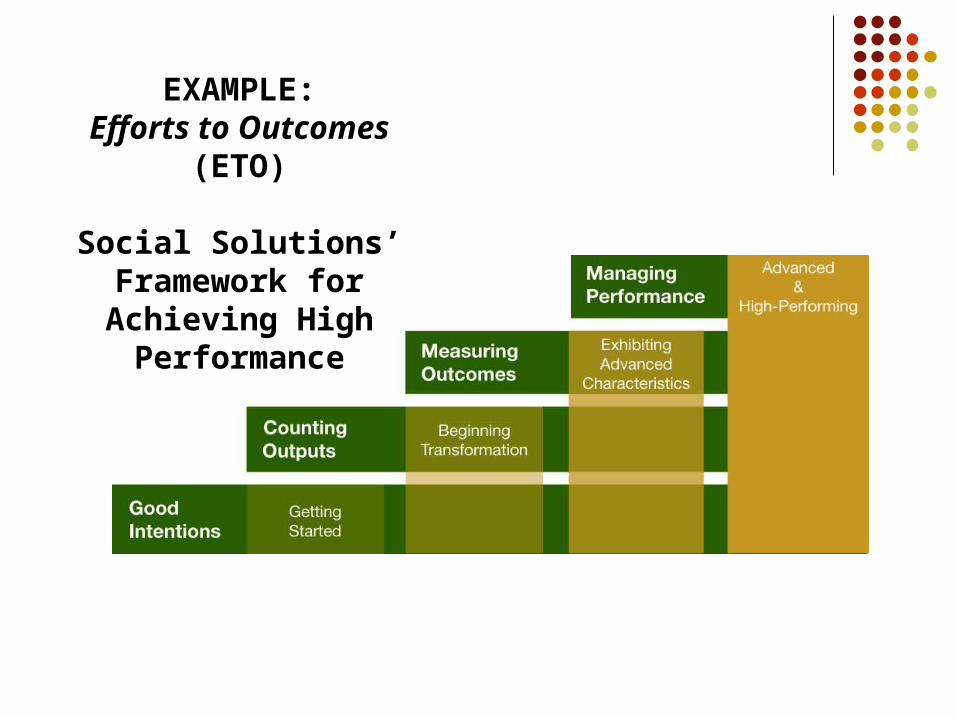
EXAMPLE:Efforts to Outcomes
(ETO)
Social Solutions’ Framework for Achieving
High Performance

YWCA of XXXX
Mission
Eliminating racism. Empowering women.
ProgramsCenter for Racial Justice and ActivismEconomic EmpowermentSexual Violence and Support ServicesEarly Childhood Services

YWCA of XXXX
Why ETO?
Obstacles to effective service delivery:Tracking methods inconsistent between programsOutcomes depended on funding source tracking requirementsAnecdotal information about customer makeupService integration challenges between programsLacked the ability to evaluate programs
Needs:Determining who customers are and how they are being servedDetermining whether services are effective and appropriate
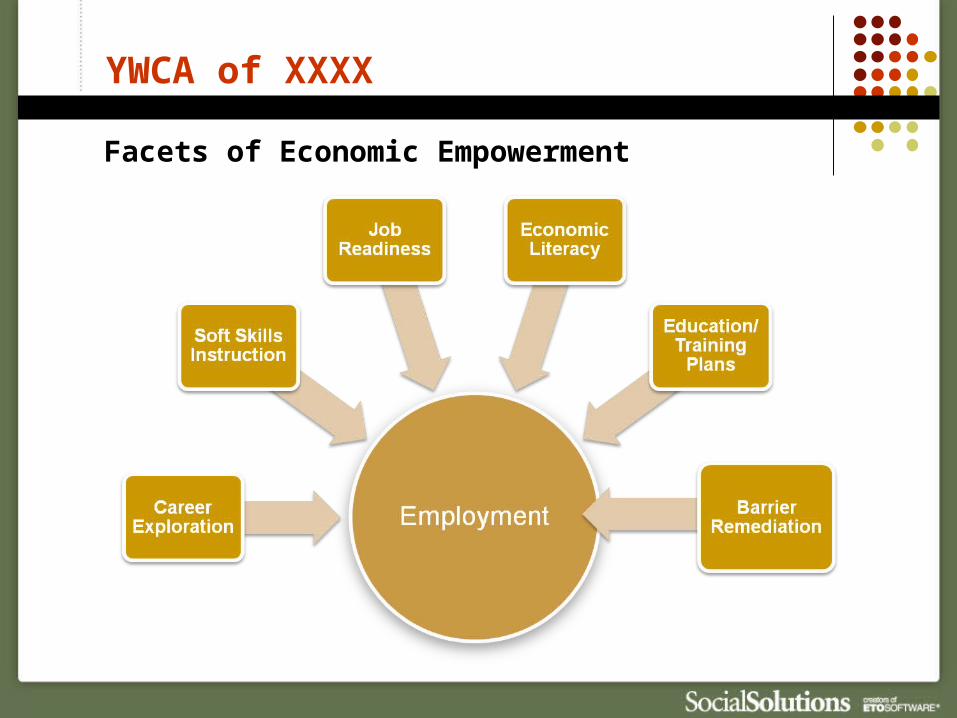
YWCA of XXXX
Facets of Economic Empowerment
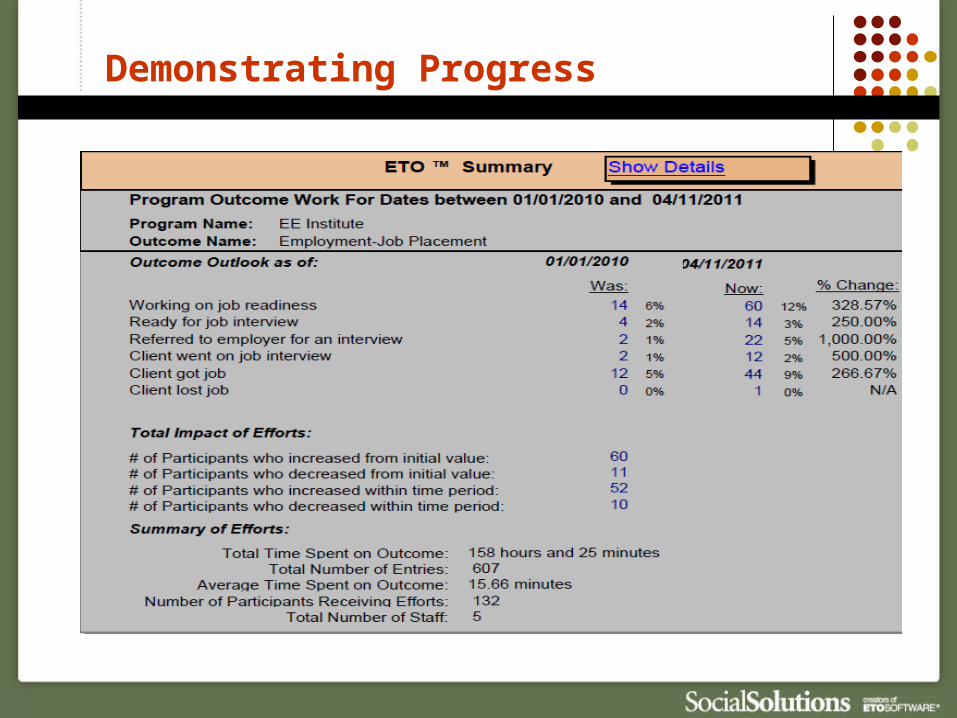
Demonstrating Progress
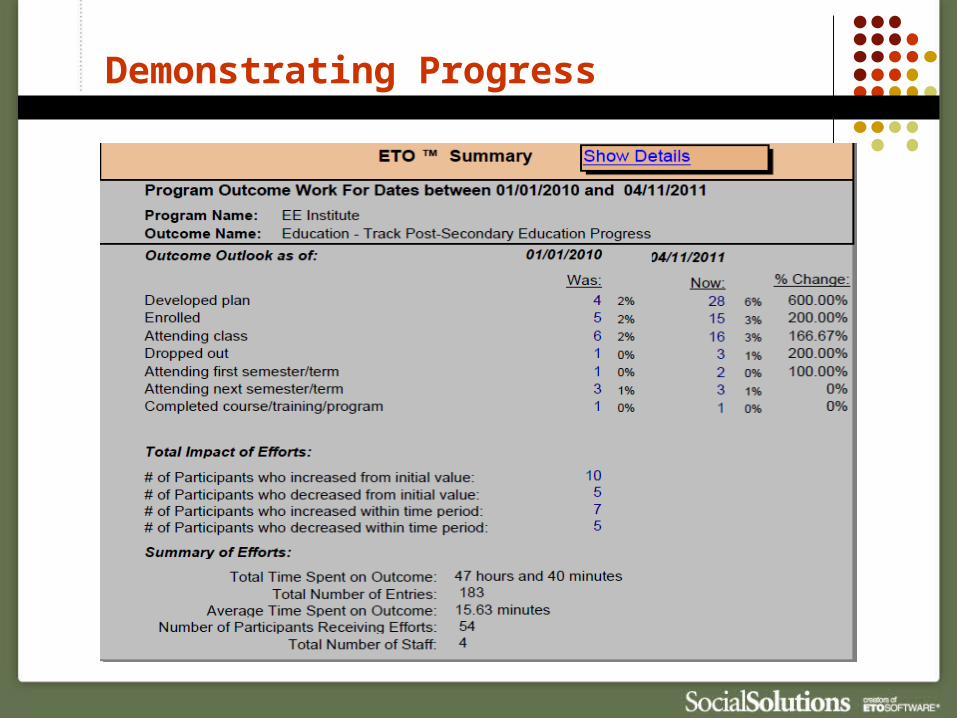
Demonstrating Progress

Demonstrating Progress

Demonstrating Progress
Chart Values:1. Strongly Disagree2. Disagree3. Agree4. Strongly Agree

Critical Capabilities in ETO
Efforts – used to depict individual progress towards program and funder outcomes
Efforts – used to depict individual progress towards program and funder outcomes
Assessments – help show program results by providing a before and after snaphotAssessments – help show program results by providing a before and after snaphot

Barriers to Outcomes Measurement— typical excuses
But some things can’t be measured. Pre-and post tests are too cumbersome. Our clients will simply tell us what we want to
hear. We never had to do it before now. There’s not enough time.

Pitfalls to Avoid
1. Don't balk at data collection because it seems too "scientific."
2. There is no "perfect" design. It's far more important to do something, than to wait until every last detail has been tested.
3. Consider including interviews. Surveys don't capture "the story," and the story is a powerful depiction of the benefits of your services.
4. Don't interview just the successes. You'll learn a great deal about the program by understanding its failures, dropouts, etc.
5. Don't throw away data once a report has been generated. Results can provide precious information later when trying to understand changes in the program.
Resources to Assist with Measuring Outcomes
Urban Institute www.urban.org Has developed “outcomes taxonomy” for fourteen service
areas Published series on outcome management for nonprofit
organizations Performance Measurement: Getting Results
by Harry Hatry, 2nd ed. 2006 Offers tips on indicator development, sources of data,
customer survey design, trained observer ratings design, etc.
Measuring Performance in Public and Nonprofit Organizations by Theodore Poister, 2003

Resources to Assist with Measuring Outcomes
The Grantsmanship Center www.tgci.com Offers guides to program evaluation
United Way www.unitedway.org/outcomes Offers outcome measurement resources, guides
W.K. Kellog Foundation www.wkkf.org Publishes Logic Model Development Guide and Evaluation
Handbook
Performance Management Network, inc. www.pmn.net search: logic models Instruction on logic models framework and development


