
Perfect Storm for Commodities05 December 2013
War Room

HiddenLevers War Room
Open Q + A
Macro Coaching
Archived webinars
CE Credit
Idea Generation
Presentation deck
Product UpdatesScenario Updates
I. Market Update
II. Perfect Storm for Commodities
III. Scenarios
IV. Winners + Losers
War Room

HiddenLevers
MARKET UPDATE

Market Update
QE Taper Tantrums
Q3 US GDP = 3.6%Iran Détente
Nasdaq 4k

Macro Snapshot
Employment, manufacturing, equities, and bond spreads trending in the right direction – why won’t CPI get with the program?

PERFECT STORM FOR COMMODITIESHiddenLevers

Commodities Past
Real commodities prices flat since 1870’s – 0% real growth
Commodities markets appear highly cyclical over 200 years, and we look to be at a top
source: Business Insider

Commodities Present: Oil & Energy
sources: EIA, DOT
US oil production has recovered rapidly, while total vehicle miles are well below 2007 peak.
But global demand and risk premium have kept oil up 4.6% YTD.
Supply is up… And demand is flat.
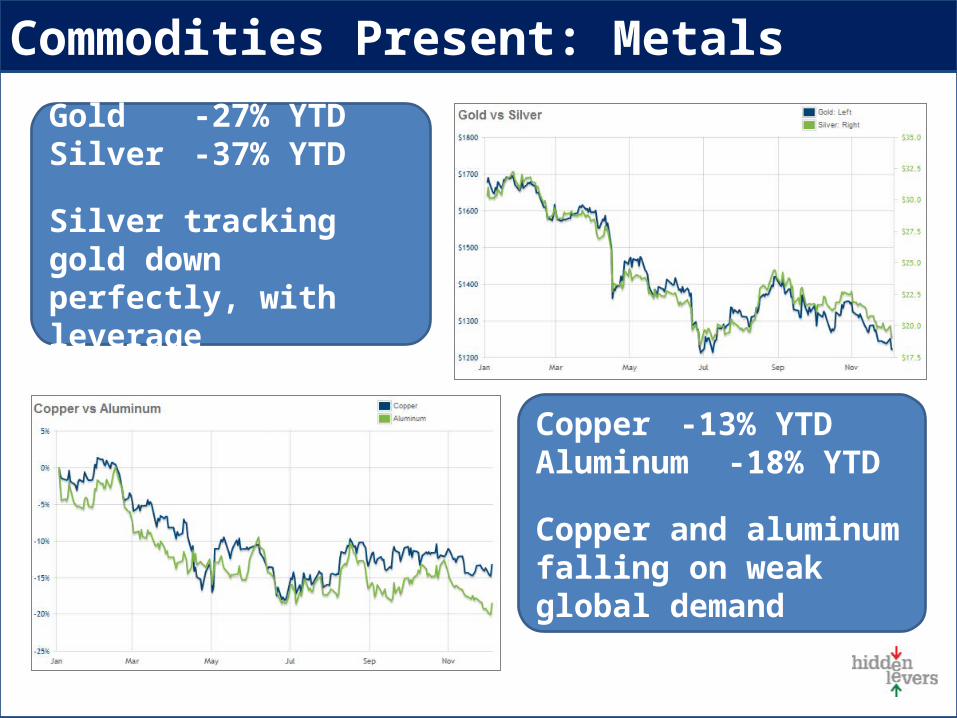
Commodities Present: Metals
Gold -27% YTD Silver -37% YTD
Silver tracking gold down perfectly, with leverage
Copper -13% YTD Aluminum -18% YTD
Copper and aluminum falling on weak global demand

Commodities Present: Agriculture
source: HiddenLevers, UN, Financial Times
-16% YTD-27% since July 2012
Long term trend
Agriculture commodities down since mid 1990s
Double digit declines in 2014 + 2015 expected
triple topReasons for continuing drop
- Favorable weather- Falling input costs- Larger harvests- Bumper crop in corn

Commodities Future: Deflation?
CPI has generallyfollowedS&P 500 –divergencestarted mid-2012
US CPI had a lagged correlation with S&P 500 until breakdown in mid-2012, despite Fed efforts. Are commodities and CPI predicting deflation?

precious metals out of favor Food prices deflating into 2015
US oil demand declining
Perfect Storm for Commodities – Recap
Top of Commodities Super Cycle

HiddenLevers
COMMODITIES DEFLATION – SCENARIOS

Scenario: Commodities bounce back
EM/BRICS recovery is key
Signals rising world wide
inflation
source: HiddenLevers
Equities now a leading indicator economy
USD weakness helps spur
commodities
Will this trend pick up?

Scenario: Equities decoupling continues
US economy pickup doesn’t increase
commodity demand
QE continuing means decoupling story in
tact
source: HiddenLevers
QE meltup + deflation in other risk assets
Tech growth in US is not like manufacturing
growth in EM
Decoupling is the current dynamic
1996-1999
S&P + 125%
Oil - 55%
Copper - 55%

Scenario: Equities follow Commodities down
Industrial metals and S&P have long
history
source: HiddenLevers
Deflation spiral on all risk assets
Fed taper will kick this off
2008 Crisis
S&P - 52%
Oil - 76%
Copper - 64%

GoodCommodities Bounce Back
BadDecoupling
continues
UglyEquities
follow Commodities
Scenarios: Perfect Storm for Commodities
EM recovery would lead to rising inflation and a commodities bounce.
Commodities could decouple from equities if tech-led growth continues
Fed has failed to raise CPI – could be prelude to stronger deflation, with commodities and equities down together

HiddenLevers
WINNERS + LOSERS
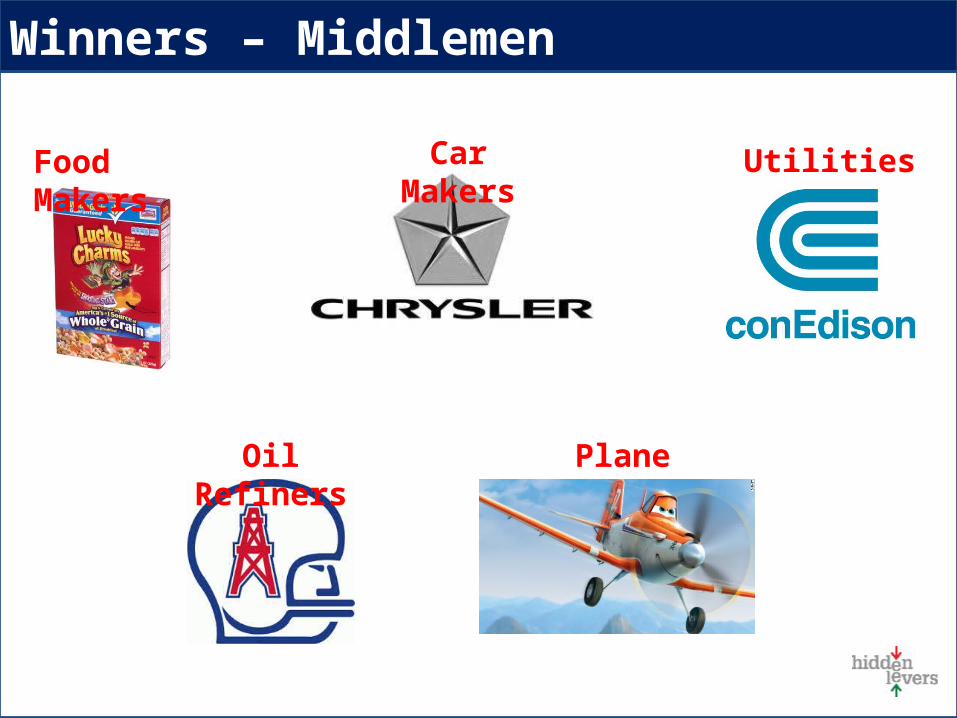
Winners – Middlemen
Food Makers Car Makers Utilities
Oil Refiners Plane Makers

Winners – Lower input costs
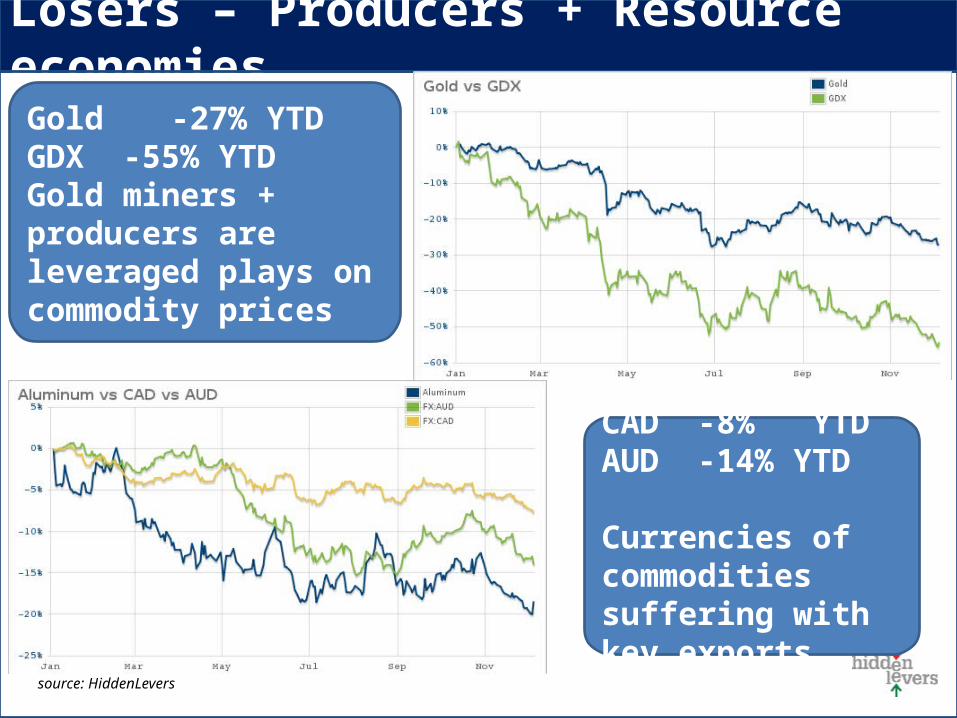
Losers – Producers + Resource economies
source: HiddenLevers
Gold -27% YTDGDX -55% YTDGold miners + producers are leveraged plays on commodity prices
CAD -8% YTD AUD -14% YTD
Currencies of commodities suffering with key exports

Find it on HiddenLevers
Scenario Library
Risk Profiles for
securities
Macro Themes
Economic Data
Center
source: Burtynski
War RoomGold Crash
Commodities
Industry groupings
War RoomBRICS

• Scenario email alerts
• Scenario progress visualization
• Mobile site improvements
Coming soon:
- Dashboard page
- Product development survey
Product Update


