PENNSYLVANIA RESIDENTS’ OPINIONS ON AND ATTITUDES TOWARD DEER AND
DEER MANAGEMENT
Conducted for the Pennsylvania Game Commission
by Responsive Management
2012
PENNSYLVANIA RESIDENTS’ OPINIONS ON AND ATTITUDES TOWARD DEER AND
DEER MANAGEMENT
2012
Responsive Management National Office Mark Damian Duda, Executive Director
Martin Jones, Senior Research Associate Tom Beppler, Research Associate
Steven J. Bissell, Ph.D., Qualitative Research Associate Andrea Criscione, Research Associate Patrick Doherty, Research Associate Amanda Ritchie, Research Associate Carol L. Schilli, Research Associate
Tim Winegord, Survey Center Manager Alison Lanier, Business Manager
130 Franklin Street Harrisonburg, VA 22801
Phone: 540/432-1888 Fax: 540/432-1892 E-mail: [email protected]
www.responsivemanagement.com

Acknowledgments
Responsive Management would like to thank Coren Jagnow, Chris Rosenberry, Joseph Neville, and Cal DuBrock of the Pennsylvania Game Commission for their input, support, and guidance
on this project.

Pennsylvania Residents’ Opinions on and Attitudes Toward Deer and Deer Management i
EXECUTIVE SUMMARY INTRODUCTION AND METHODOLOGY This study was conducted for the Pennsylvania Game Commission (PGC) to determine
Pennsylvania residents’ opinions on and attitudes toward deer and deer management, including
their participation in deer-related and other wildlife-related activities, their opinions on
management efforts and management goals, their opinions on methods for managing deer, and
their concerns about deer nuisance problems. The study entailed a telephone survey of
Pennsylvania residents 18 years old and older.
For the survey, telephones were selected as the preferred sampling medium because of the
almost universal ownership of telephones among Pennsylvania residents (both landlines and cell
phones were called). Additionally, telephone surveys, relative to mail or Internet surveys, allow
for more scientific sampling and data collection, provide higher quality data, obtain higher
response rates, are more timely, and are more cost-effective. Telephone surveys also have fewer
negative effects on the environment than do mail surveys because of reduced use of paper and
reduced energy consumption for delivering and returning the questionnaires.
The telephone survey questionnaire was developed cooperatively by Responsive Management
and the PGC. Responsive Management conducted pre-tests of the questionnaire to ensure proper
wording, flow, and logic in the survey.
The sample of Pennsylvania residents was obtained from SSI and Database 101, firms that
specialize in providing scientific survey samples. A sample of at least 400 completed interviews
was obtained for each of the 22 Wildlife Management Units (WMUs) in Pennsylvania so that
results would be statistically valid within each WMU. Although the lowest geographical unit for
analysis was the WMU, the sampling within the WMUs was obtained on a census block level so
that the sample of each WMU would exactly match that WMU’s actual population. Each WMU
was divided into 12 age/gender categories, and each of those categories were weighted within the
WMU. While the unweighted sample that was obtained for each WMU closely matched the
actual population, the internal weighting within each WMU simply ensured that the sample
would exactly match the actual population.

ii Responsive Management
Because the WMU boundaries cross county lines and cross, in many places, zip code boundary
lines, a Geographic Information System (GIS) specialist properly categorized each sample
telephone number into its proper WMU. This GIS matching was done to both landlines and cell
phones and accounted for the fact that cell phones may have area codes that do not match
residency (because cell phones’ area codes are based on location of purchase, not location of
residency of the owner).
For statewide results when the 9,212 completed interviews from all 22 WMUs were put together,
the WMUs were weighted so that they would be in their proper proportions based on the overall
state population. The overall sample thereby obtained was representative of all Pennsylvania
residents 18 years old and older.
Telephone surveying times are Monday through Friday from 9:00 a.m. to 9:00 p.m., Saturday
from noon to 5:00 p.m., and Sunday from 5:00 p.m. to 9:00 p.m., local time. The survey was
conducted in November and December 2011. The software used for data collection was
Questionnaire Programming Language (QPL). The survey questionnaire was programmed so
that QPL branched, coded, and substituted phrases in the survey based on previous responses to
ensure the integrity and consistency of the data collection. Responsive Management obtained a
total of 9,212 completed interviews among the 22 WMUs.
The analysis of data was performed using Statistical Package for the Social Sciences as well as
proprietary software developed by Responsive Management. The results were weighted by
demographic characteristics within each WMU so that the sample was representative of residents
of that WMU as a whole, based on 12 categories of age/gender. In addition, the WMUs were
weighted when statewide data were shown so that each WMU properly represented its share of
the state’s total population of residents 18 years old and older.
Throughout this report, findings of the telephone survey are reported at a 95% confidence
interval (or higher). For the entire sample of Pennsylvania residents 18 years old and older, the
sampling error is at most plus or minus 1.02 percentage points. Sampling error was calculated
Pennsylvania Residents’ Opinions on and Attitudes Toward Deer and Deer Management iii
based on a sample size of 9,212 and a population size of 10,090,675 residents 18 years old and
older.
PARTICIPATION IN VIEWING DEER A majority of Pennsylvania residents (56%) spent time viewing or watching deer around
their home in the past 12 months. Additionally, 22% of Pennsylvania residents took a trip of
at least 1 mile to view deer.
• Of those who took a deer viewing trip, about a third used a spotlight to view the deer at
night.
Satisfaction is high with opportunities to view or watch deer in Pennsylvania: 66% say that
they are somewhat or very satisfied, while 10% say that they are very or somewhat
dissatisfied; the remainder are neutral.
OPINIONS ON DEER IN GENERAL AND THE SIZE AND HEALTH OF THE DEER HERD
In general, Pennsylvania residents’ feelings about deer are positive: 49% say (without any
caveats) that they like having deer around, and another 28% say that they like having deer
around even though they worry about problems that the deer may cause. Only 6% say that
they generally regard deer as a nuisance.
In general, deer-related issues are not within the top half of the rating scale among
Pennsylvania residents. On a scale of 0 to 10, with 0 being not at all important and 10 being
extremely important, the mean rating among Pennsylvania residents is 4.09, and the median
rating is “4.”
Two other ratings questions asked respondents to rate their concern about deer-related issues.
The first question asked about respondents’ concerns about the quality of deer habitat in
Pennsylvania, and the mean rating (5.85) and median rating (6) are above the midpoint. The
second question asked about respondents’ concerns about the health of the deer population,
iv Responsive Management
with even greater concern than the previous question: the mean rating (6.23) and the median
rating (7) are both well above the midpoint.
A majority of Pennsylvania residents (54%) say the deer population in their area is just right.
Otherwise, they are fairly evenly split, with 20% saying the deer population is too high, and
18% saying it is too low.
OPINIONS ON MANAGEMENT EFFORTS AND MANAGEMENT GOALS The survey asked about three deer population management goals. For all three, a large
majority agree with the management goal: 91% agree with managing for healthy and
sustainable deer populations, 89% agree with managing the deer for a healthy and sustainable
forest habitat, and 84% agree with managing for safe, acceptable levels of deer-human
conflicts. The ecological goals are both slightly higher than the human-centered goal.
Pennsylvania residents who said that the deer population in their area is too high or too low
were asked to indicate the reasonable number of years it should take to achieve an acceptable
deer population. A relatively large percentage of respondents to this question did not know
what a reasonable time would be: 34% indicated “don’t know.” Otherwise, the most
common answer is 5 years (21% gave this answer). The mean is 4.77 years, and the median
is 4 years.
• Because management plans typically look at a time frame of about 10 years to effect
change, the survey specifically asked if these respondents would be willing to wait
more than 10 years to achieve an acceptable deer population: just over half of
Pennsylvania residents (53%) indicated that they would be willing to wait that long.
However, 42% indicated an unwillingness to wait that long.
Pennsylvania Residents’ Opinions on and Attitudes Toward Deer and Deer Management v
OPINIONS ON METHODS FOR MANAGING DEER, INCLUDING HUNTING Just under two-thirds of Pennsylvania residents (63%) support lethal methods to manage deer
populations in Pennsylvania (38% strongly support, and 25% moderately support);
nonetheless, 29% oppose (20% strongly oppose, and 9% moderately oppose).
• The survey asked about four methods of controlling deer populations (three of them
lethal). The most support is for legal, regulated hunting (85% of respondents support
this method, while 12% oppose), distantly followed by fertility/birth control (46%
support, 45% oppose), professionals or sharpshooters (39% support, 54% oppose), and
trapping and killing (24% support, 72% oppose). In each case, the remainder are
neutral or do not know.
Pennsylvania residents who live in a single-family home were asked if they personally hunt
on their property: 10% indicate that they do. Additionally, 15% allow others to hunt on their
property. In total, 17% hunt on their property and/or allow others to do so (it is not simply a
sum because some did both).
• Those who live in a single-family home but who do not allow hunting were asked for
their reasons for prohibiting hunting. Most commonly, they say it is because their
property is too small/too near neighbors (48% of these respondents) and/or that they
live in an urban or suburban neighborhood where hunting is not feasible (also 48%).
These top two reasons are distantly followed by concerns about safety (10%) and a
general opposition to hunting (9%).
• Those same respondents who do not allow hunting on their property were asked about
their likelihood of ever allowing others to hunt deer on their property; they
overwhelmingly say this is very unlikely (94%), and another 2% say somewhat
unlikely. They were then asked if there is anything that would make them more likely
to allow deer hunting; an overwhelming majority (97%) say that there is nothing that
would make them more likely to allow deer hunting.
o Follow-up questions were given to those respondents who do not allow hunting on
their property but who indicated that there might be something that would encourage
them to allow hunting. They were first asked in an open-ended question what would
make them more likely to allow deer hunting on their property. The top two
vi Responsive Management
responses were if the hunter followed specific instructions and restrictions and if the
homeowner had more land or lived in a more rural area.
o Along with that open-ended follow-up question, a series of questions were also asked
of these same respondents wherein four items were read to these respondents to see if
any of the four items would make them more likely to allow hunting. The top items
are if those who hunted on the property followed specific instructions and restrictions
(interestingly, similar to the open-ended responses) and if those who hunted the
property had completed an advanced hunter safety course.
CONCERNS ABOUT DEER AND DEER NUISANCE PROBLEMS Seven questions asked about respondents’ level of concern about issues associated with deer.
For each issue, respondents rated their level of concern about it using a 10-point scale, with
10 being the most concerned.
• The most concern was for tick-borne diseases (mean rating of 7.4) and deer-vehicle
accidents (7.0), followed by two more whose means are just under those top two: the
health of the deer population (6.2) and the quality of deer habitat (5.9).
• At the bottom are concern about deer impacts on habitat and other wildlife (even
though this can be considerable) (3.9) and the two impacts to residents’ landscaping:
deer damage to plants and landscaping (2.5) and deer droppings in the yard (1.7).
Just under two-thirds of Pennsylvania residents (61%) have seen deer on their property in the
past 12 months, with a quarter of residents (26%) saying that they saw them frequently.
The survey asked about specific nuisance problems with deer that Pennsylvania residents
may have experienced, and 12% indicated that they experienced problems with deer at their
primary place of residence in the past 12 months. Another question asked about deer-vehicle
collisions, and 13% indicated that they or another household member had been in a vehicle
collision with a deer (only about 1 in 20 respondents to this question indicated that either the
driver or passengers were injured). Finally, 4% indicated that they or a household member
had been diagnosed with a tick-borne disease.

Pennsylvania Residents’ Opinions on and Attitudes Toward Deer and Deer Management vii
FEEDING WILDLIFE AND HUNTING DEER Several questions asked about feeding wildlife.
• Among Pennsylvania residents overall, 8% fed deer or put out attractants, 10%
indicated that neighbors had done so, and just under half (44%) fed birds.
o The most typical feeds or attractants put out by respondents are salt/mineral blocks
and corn (just under half of those who put out feed/attractants put out these), with
apples put out by 18% of these respondents.
There is no consensus on whether it is okay for private citizens to feed or attract deer in
Pennsylvania: 44% agree that this is okay, but a similar percentage (47%) disagree. The rest
are neutral. While the agree responses are about evenly divided between strong and
moderate agreement, most of the disagreement is strong disagreement.
A quarter of Pennsylvania residents (25%) consider themselves to be a hunter (even though
not all of them hunt every year), about three-fourths of whom have a 2011 Pennsylvania
hunting license.
• Among Pennsylvania residents whose primary place of residence is a single-family
home, 10% indicated that they personally hunt on their property.
• Just under three-fourths of Pennsylvania residents (72%) have family members or
friends who hunt.
SOURCES OF INFORMATION Most commonly, Pennsylvania residents say that the best way to provide them with
information about deer in Pennsylvania is through direct mail (39% gave this response). This
is distantly followed by four other sources: email (17%), newspaper (16%), the Internet
(14% saying an Internet site other than the PGC and 4% saying the agency website; note that
some said both), and TV (11%).
Just under half of Pennsylvania residents (45%) use social media such as Facebook (the most
common of the social media), YouTube, or Twitter.
viii Responsive Management
TABLE OF CONTENTS Introduction and Methodology ........................................................................................................1
Use of Telephones for the Survey ...........................................................................................1 Questionnaire Design ..............................................................................................................1 Survey Sample.........................................................................................................................1 Telephone Interviewing Facilities ...........................................................................................3 Interviewing Dates and Times.................................................................................................3 Telephone Survey Data Collection and Quality Control.........................................................3 Data Analysis...........................................................................................................................4 Nonparametric Analysis ..........................................................................................................5 Interpreting the Nonparametric Analysis Results....................................................................9 Sampling Error ......................................................................................................................11 Additional Information About the Presentation of Results in the Report .............................12
Statewide Results ...........................................................................................................................14 Participation in Viewing Deer ...............................................................................................14 Opinions on Deer in General and the Size and Health of the Deer Herd..............................35 Opinions on Management Efforts and Management Goals ..................................................61 Opinions on Methods for Managing Deer, Including Hunting .............................................76 Concerns About Deer and Deer Nuisance Problems...........................................................122 Feeding Wildlife and Hunting Deer ....................................................................................172 Sources of Information ........................................................................................................197 Demographic Data...............................................................................................................208
Results for WMU 1A...................................................................................................................229 Participation in Viewing Deer .............................................................................................230 Opinions on Deer in General and the Size and Health of the Deer Herd............................235 Opinions on Management Efforts and Management Goals ................................................243 Opinions on Methods for Managing Deer, Including Hunting ...........................................247 Concerns About Deer and Deer Nuisance Problems...........................................................261 Feeding Wildlife and Hunting Deer ....................................................................................274 Sources of Information ........................................................................................................282
Results for WMU 1B ...................................................................................................................286 Participation in Viewing Deer .............................................................................................287 Opinions on Deer in General and the Size and Health of the Deer Herd............................292 Opinions on Management Efforts and Management Goals ................................................300 Opinions on Methods for Managing Deer, Including Hunting ...........................................304 Concerns About Deer and Deer Nuisance Problems...........................................................318 Feeding Wildlife and Hunting Deer ....................................................................................331 Sources of Information ........................................................................................................339
Pennsylvania Residents’ Opinions on and Attitudes Toward Deer and Deer Management ix
TABLE OF CONTENTS (continued) Results for WMU 2A...................................................................................................................343
Participation in Viewing Deer .............................................................................................344 Opinions on Deer in General and the Size and Health of the Deer Herd............................349 Opinions on Management Efforts and Management Goals ................................................357 Opinions on Methods for Managing Deer, Including Hunting ...........................................361 Concerns About Deer and Deer Nuisance Problems...........................................................375 Feeding Wildlife and Hunting Deer ....................................................................................388 Sources of Information ........................................................................................................396
Results for WMU 2B ...................................................................................................................400 Participation in Viewing Deer .............................................................................................402 Opinions on Deer in General and the Size and Health of the Deer Herd............................407 Opinions on Management Efforts and Management Goals ................................................415 Opinions on Methods for Managing Deer, Including Hunting ...........................................419 Concerns About Deer and Deer Nuisance Problems...........................................................433 Feeding Wildlife and Hunting Deer ....................................................................................446 Sources of Information ........................................................................................................454
Results for WMU 2C ...................................................................................................................458 Participation in Viewing Deer .............................................................................................459 Opinions on Deer in General and the Size and Health of the Deer Herd............................464 Opinions on Management Efforts and Management Goals ................................................472 Opinions on Methods for Managing Deer, Including Hunting ...........................................476 Concerns About Deer and Deer Nuisance Problems...........................................................490 Feeding Wildlife and Hunting Deer ....................................................................................503 Sources of Information ........................................................................................................511
Results for WMU 2D...................................................................................................................515 Participation in Viewing Deer .............................................................................................516 Opinions on Deer in General and the Size and Health of the Deer Herd............................521 Opinions on Management Efforts and Management Goals ................................................529 Opinions on Methods for Managing Deer, Including Hunting ...........................................533 Concerns About Deer and Deer Nuisance Problems...........................................................547 Feeding Wildlife and Hunting Deer ....................................................................................560 Sources of Information ........................................................................................................568
Results for WMU 2E ...................................................................................................................572 Participation in Viewing Deer .............................................................................................573 Opinions on Deer in General and the Size and Health of the Deer Herd............................578 Opinions on Management Efforts and Management Goals ................................................586 Opinions on Methods for Managing Deer, Including Hunting ...........................................590 Concerns About Deer and Deer Nuisance Problems...........................................................604 Feeding Wildlife and Hunting Deer ....................................................................................617 Sources of Information ........................................................................................................625

x Responsive Management
TABLE OF CONTENTS (continued) Results for WMU 2F....................................................................................................................629
Participation in Viewing Deer .............................................................................................630 Opinions on Deer in General and the Size and Health of the Deer Herd............................635 Opinions on Management Efforts and Management Goals ................................................643 Opinions on Methods for Managing Deer, Including Hunting ...........................................647 Concerns About Deer and Deer Nuisance Problems...........................................................661 Feeding Wildlife and Hunting Deer ....................................................................................674 Sources of Information ........................................................................................................682
Results for WMU 2G...................................................................................................................686 Participation in Viewing Deer .............................................................................................688 Opinions on Deer in General and the Size and Health of the Deer Herd............................693 Opinions on Management Efforts and Management Goals ................................................701 Opinions on Methods for Managing Deer, Including Hunting ...........................................705 Concerns About Deer and Deer Nuisance Problems...........................................................719 Feeding Wildlife and Hunting Deer ....................................................................................732 Sources of Information ........................................................................................................740
Results for WMU 3A...................................................................................................................744 Participation in Viewing Deer .............................................................................................746 Opinions on Deer in General and the Size and Health of the Deer Herd............................751 Opinions on Management Efforts and Management Goals ................................................759 Opinions on Methods for Managing Deer, Including Hunting ...........................................763 Concerns About Deer and Deer Nuisance Problems...........................................................777 Feeding Wildlife and Hunting Deer ....................................................................................790 Sources of Information ........................................................................................................798
Results for WMU 3B ...................................................................................................................802 Participation in Viewing Deer .............................................................................................804 Opinions on Deer in General and the Size and Health of the Deer Herd............................809 Opinions on Management Efforts and Management Goals ................................................817 Opinions on Methods for Managing Deer, Including Hunting ...........................................821 Concerns About Deer and Deer Nuisance Problems...........................................................835 Feeding Wildlife and Hunting Deer ....................................................................................848 Sources of Information ........................................................................................................856
Results for WMU 3C ...................................................................................................................860 Participation in Viewing Deer .............................................................................................861 Opinions on Deer in General and the Size and Health of the Deer Herd............................866 Opinions on Management Efforts and Management Goals ................................................874 Opinions on Methods for Managing Deer, Including Hunting ...........................................878 Concerns About Deer and Deer Nuisance Problems...........................................................892 Feeding Wildlife and Hunting Deer ....................................................................................905 Sources of Information ........................................................................................................913

Pennsylvania Residents’ Opinions on and Attitudes Toward Deer and Deer Management xi
TABLE OF CONTENTS (continued) Results for WMU 3D...................................................................................................................917
Participation in Viewing Deer .............................................................................................918 Opinions on Deer in General and the Size and Health of the Deer Herd............................923 Opinions on Management Efforts and Management Goals ................................................931 Opinions on Methods for Managing Deer, Including Hunting ...........................................935 Concerns About Deer and Deer Nuisance Problems...........................................................949 Feeding Wildlife and Hunting Deer ....................................................................................962 Sources of Information ........................................................................................................970
Results for WMU 4A...................................................................................................................974 Participation in Viewing Deer .............................................................................................975 Opinions on Deer in General and the Size and Health of the Deer Herd............................980 Opinions on Management Efforts and Management Goals ................................................988 Opinions on Methods for Managing Deer, Including Hunting ...........................................992 Concerns About Deer and Deer Nuisance Problems.........................................................1006 Feeding Wildlife and Hunting Deer ..................................................................................1019 Sources of Information ......................................................................................................1027
Results for WMU 4B .................................................................................................................1031 Participation in Viewing Deer ...........................................................................................1033 Opinions on Deer in General and the Size and Health of the Deer Herd..........................1038 Opinions on Management Efforts and Management Goals ..............................................1046 Opinions on Methods for Managing Deer, Including Hunting .........................................1050 Concerns About Deer and Deer Nuisance Problems.........................................................1064 Feeding Wildlife and Hunting Deer ..................................................................................1077 Sources of Information ......................................................................................................1085
Results for WMU 4C .................................................................................................................1089 Participation in Viewing Deer ...........................................................................................1090 Opinions on Deer in General and the Size and Health of the Deer Herd..........................1095 Opinions on Management Efforts and Management Goals ..............................................1103 Opinions on Methods for Managing Deer, Including Hunting .........................................1107 Concerns About Deer and Deer Nuisance Problems.........................................................1121 Feeding Wildlife and Hunting Deer ..................................................................................1134 Sources of Information ......................................................................................................1142
Results for WMU 4D.................................................................................................................1146 Participation in Viewing Deer ...........................................................................................1147 Opinions on Deer in General and the Size and Health of the Deer Herd..........................1152 Opinions on Management Efforts and Management Goals ..............................................1160 Opinions on Methods for Managing Deer, Including Hunting .........................................1164 Concerns About Deer and Deer Nuisance Problems.........................................................1178 Feeding Wildlife and Hunting Deer ..................................................................................1191 Sources of Information ......................................................................................................1199
xii Responsive Management
TABLE OF CONTENTS (continued) Results for WMU 4E .................................................................................................................1203
Participation in Viewing Deer ...........................................................................................1204 Opinions on Deer in General and the Size and Health of the Deer Herd..........................1209 Opinions on Management Efforts and Management Goals ..............................................1217 Opinions on Methods for Managing Deer, Including Hunting .........................................1221 Concerns About Deer and Deer Nuisance Problems.........................................................1235 Feeding Wildlife and Hunting Deer ..................................................................................1248 Sources of Information ......................................................................................................1256
Results for WMU 5A.................................................................................................................1260 Participation in Viewing Deer ...........................................................................................1261 Opinions on Deer in General and the Size and Health of the Deer Herd..........................1266 Opinions on Management Efforts and Management Goals ..............................................1274 Opinions on Methods for Managing Deer, Including Hunting .........................................1278 Concerns About Deer and Deer Nuisance Problems.........................................................1292 Feeding Wildlife and Hunting Deer ..................................................................................1305 Sources of Information ......................................................................................................1313
Results for WMU 5B .................................................................................................................1317 Participation in Viewing Deer ...........................................................................................1318 Opinions on Deer in General and the Size and Health of the Deer Herd..........................1323 Opinions on Management Efforts and Management Goals ..............................................1331 Opinions on Methods for Managing Deer, Including Hunting .........................................1335 Concerns About Deer and Deer Nuisance Problems.........................................................1349 Feeding Wildlife and Hunting Deer ..................................................................................1362 Sources of Information ......................................................................................................1370
Results for WMU 5C .................................................................................................................1374 Participation in Viewing Deer ...........................................................................................1376 Opinions on Deer in General and the Size and Health of the Deer Herd..........................1381 Opinions on Management Efforts and Management Goals ..............................................1389 Opinions on Methods for Managing Deer, Including Hunting .........................................1393 Concerns About Deer and Deer Nuisance Problems.........................................................1407 Feeding Wildlife and Hunting Deer ..................................................................................1420 Sources of Information ......................................................................................................1428
Results for WMU 5D.................................................................................................................1432 Participation in Viewing Deer ...........................................................................................1434 Opinions on Deer in General and the Size and Health of the Deer Herd..........................1439 Opinions on Management Efforts and Management Goals ..............................................1447 Opinions on Methods for Managing Deer, Including Hunting .........................................1451 Concerns About Deer and Deer Nuisance Problems.........................................................1465 Feeding Wildlife and Hunting Deer ..................................................................................1478 Sources of Information ......................................................................................................1486
About Responsive Management ................................................................................................1490
Pennsylvania Residents’ Opinions on and Attitudes Toward Deer and Deer Management 1 Introduction and Methodology
INTRODUCTION AND METHODOLOGY This study was conducted for the Pennsylvania Game Commission (PGC) to determine
Pennsylvania residents’ opinions on and attitudes toward deer and deer management, including
their participation in deer-related and other wildlife-related activities, their opinions on
management efforts and management goals, their opinions on methods for managing deer, and
their concerns about deer nuisance problems. The study entailed a telephone survey of
Pennsylvania residents 18 years old and older. Specific aspects of the research methodology are
discussed below.
USE OF TELEPHONES FOR THE SURVEY For the survey, telephones were selected as the preferred sampling medium because of the
almost universal ownership of telephones among Pennsylvania residents (both landlines and cell
phones were called). Additionally, telephone surveys, relative to mail or Internet surveys, allow
for more scientific sampling and data collection, provide higher quality data, obtain higher
response rates, are more timely, and are more cost-effective. Telephone surveys also have fewer
negative effects on the environment than do mail surveys because of reduced use of paper and
reduced energy consumption for delivering and returning the questionnaires.
QUESTIONNAIRE DESIGN The telephone survey questionnaire was developed cooperatively by Responsive Management
and the PGC, based on the research team’s familiarity with deer management issues, as well as
natural resources and outdoor recreation in general. Responsive Management conducted
pre-tests of the questionnaire to ensure proper wording, flow, and logic in the survey.
SURVEY SAMPLE The sample of Pennsylvania residents was obtained from SSI and Database 101, firms that
specialize in providing scientific survey samples. A sample of at least 400 completed interviews
was obtained for each of the 22 Wildlife Management Units (WMUs) in Pennsylvania so that
results would be statistically valid within each WMU (see WMU map that follows). Although
the lowest geographical unit for analysis was the WMU, the sampling within the WMUs was
obtained on a census block level so that the sample of each WMU would exactly match that
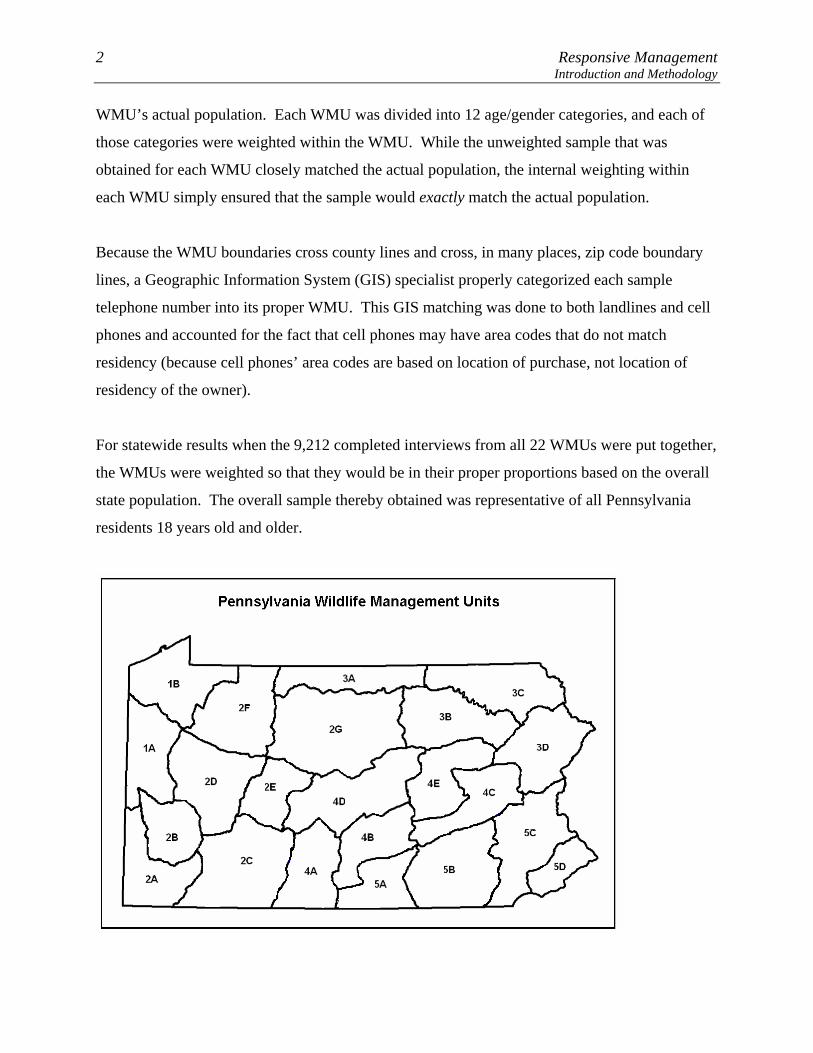
2 Responsive Management Introduction and Methodology
WMU’s actual population. Each WMU was divided into 12 age/gender categories, and each of
those categories were weighted within the WMU. While the unweighted sample that was
obtained for each WMU closely matched the actual population, the internal weighting within
each WMU simply ensured that the sample would exactly match the actual population.
Because the WMU boundaries cross county lines and cross, in many places, zip code boundary
lines, a Geographic Information System (GIS) specialist properly categorized each sample
telephone number into its proper WMU. This GIS matching was done to both landlines and cell
phones and accounted for the fact that cell phones may have area codes that do not match
residency (because cell phones’ area codes are based on location of purchase, not location of
residency of the owner).
For statewide results when the 9,212 completed interviews from all 22 WMUs were put together,
the WMUs were weighted so that they would be in their proper proportions based on the overall
state population. The overall sample thereby obtained was representative of all Pennsylvania
residents 18 years old and older.

Pennsylvania Residents’ Opinions on and Attitudes Toward Deer and Deer Management 3 Introduction and Methodology TELEPHONE INTERVIEWING FACILITIES A central polling site at the Responsive Management office allowed for rigorous quality control
over the interviews and data collection. Responsive Management maintains its own in-house
telephone interviewing facilities. These facilities are staffed by interviewers with experience
conducting computer-assisted telephone interviews on the subjects of outdoor recreation and
natural resources.
To ensure the integrity of the telephone survey data, Responsive Management has interviewers
who have been trained according to the standards established by the Council of American Survey
Research Organizations. Methods of instruction included lecture and role-playing. The Survey
Center Managers and other professional staff conducted a project briefing with the interviewers
prior to the administration of this survey. Interviewers were instructed on type of study, study
goals and objectives, handling of survey questions, interview length, termination points and
qualifiers for participation, interviewer instructions within the survey questionnaire, reading of
the survey questions, skip patterns, and probing and clarifying techniques necessary for specific
questions on the survey questionnaire.
INTERVIEWING DATES AND TIMES Telephone surveying times are Monday through Friday from 9:00 a.m. to 9:00 p.m., Saturday
from noon to 5:00 p.m., and Sunday from 5:00 p.m. to 9:00 p.m., local time. A five-callback
design was used to maintain the representativeness of the sample, to avoid bias toward people
easy to reach by telephone, and to provide an equal opportunity for all to participate. When a
respondent could not be reached on the first call, subsequent calls were placed on different days
of the week and at different times of the day. The survey was conducted in November and
December 2011.
TELEPHONE SURVEY DATA COLLECTION AND QUALITY CONTROL The software used for data collection was Questionnaire Programming Language (QPL). The
survey data were entered into the computer as each interview was being conducted, eliminating
manual data entry after the completion of the survey and the concomitant data entry errors that
may occur with manual data entry. The survey questionnaire was programmed so that QPL

4 Responsive Management Introduction and Methodology
branched, coded, and substituted phrases in the survey based on previous responses to ensure the
integrity and consistency of the data collection.
The Survey Center Managers and statisticians monitored the data collection, including
monitoring of the actual telephone interviews without the interviewers’ knowledge, to evaluate
the performance of each interviewer and ensure the integrity of the data. The survey
questionnaire itself contains error checkers and computation statements to ensure quality and
consistent data. After the surveys were obtained by the interviewers, the Survey Center
Managers and/or statisticians checked each completed survey to ensure clarity and completeness.
Responsive Management obtained a total of 9,212 completed interviews among the 22 WMUs; a
tabulation that follows shows the number of completed interviews in each WMU. This
tabulation also shows the WMU weighting factors for statewide data, which are discussed in the
next section.
Completed Interviews and Weighting Factors for Each WMU
WMU Number of Completed Interviews
Weighting Weighted
% of Sample
WMU Number of Completed Interviews
Weighting Weighted
% of Sample
1A 430 662.86 2.8 3C 434 352.23 1.5 1B 411 730.28 3.0 3D 415 674.95 2.8 2A 415 541.75 2.2 4A 424 186.66 0.8 2B 429 3067.24 13.0 4B 413 288.12 1.2 2C 411 868.57 3.5 4C 416 665.15 2.7 2D 405 598.59 2.4 4D 414 777.14 3.2 2E 406 237.06 1.0 4E 422 544.88 2.3 2F 405 221.65 0.9 5A 407 762.24 3.1 2G 428 248.97 1.1 5B 429 2,572.85 10.9 3A 416 119.96 0.5 5C 435 3,342.43 14.4 3B 407 835.39 3.4 5D 440 5,353.40 23.3
Total Number of Completed Interviews = 9,212 Weighting Produces a Total of 10,090,675 to Match State Population (18 Years and Older)
DATA ANALYSIS The analysis of data was performed using Statistical Package for the Social Sciences as well as
proprietary software developed by Responsive Management. The results were weighted by
demographic characteristics within each WMU so that the sample was representative of residents
of that WMU as a whole, based on 12 categories of age/gender. In addition, the WMUs were

Pennsylvania Residents’ Opinions on and Attitudes Toward Deer and Deer Management 5 Introduction and Methodology weighted when statewide data were shown so that each WMU properly represented its share of
the state’s total population of residents 18 years old and older. The WMU weighting factor and
the weighted percentage that each WMU made up of the total statewide sample is shown in the
above tabulation for each WMU. A tabulation showing all WMU results together is presented
after each graph in the statewide section of this report. Following the statewide section of the
report, each WMU is presented in its own section.
On questions that asked respondents to provide a number (e.g., number of years), the graphs may
show ranges of numbers rather than the precise numbers. Nonetheless, in the survey each
respondent provided a precise number, and the dataset includes this precise number, even if the
graphs only show ranges of numbers. Note that the calculation of means and medians used the
precise numbers that the respondents provided.
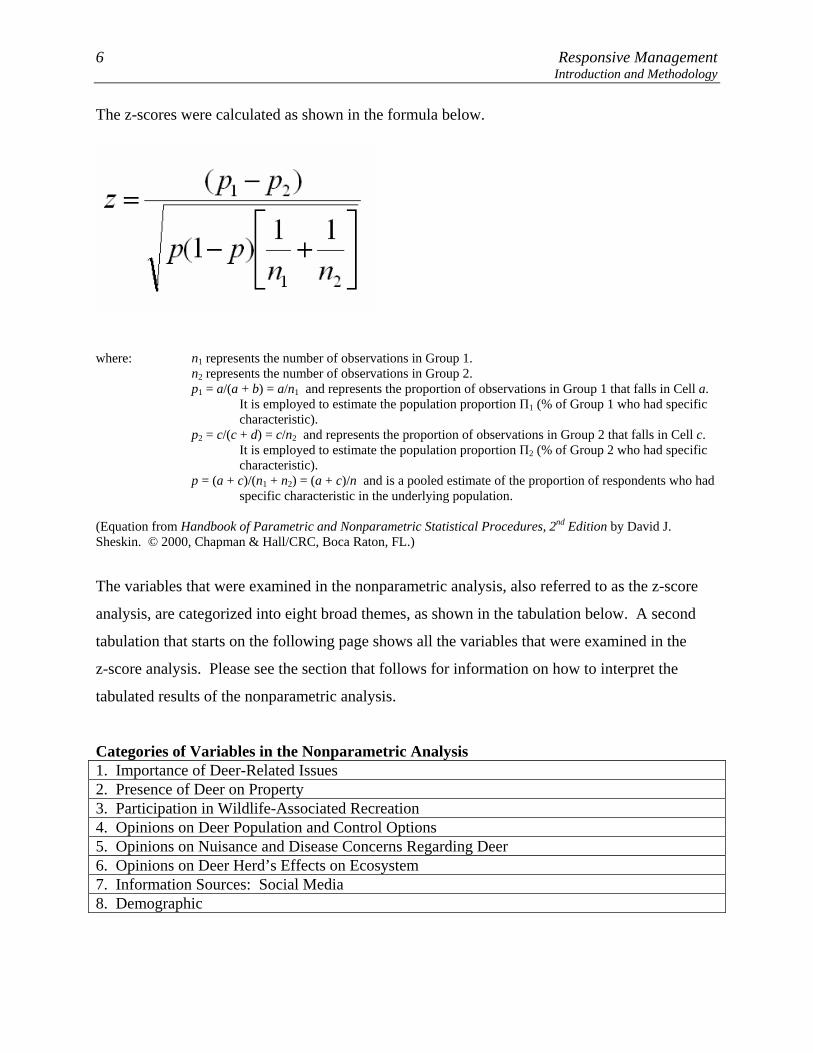
NONPARAMETRIC ANALYSIS For this report, a nonparametric analysis conducted on the statewide data as a whole examined
how the various responses related to behavioral, participatory, and demographic characteristics.
Responses for selected questions were tested by means of z-scores for relationships to various
characteristics (i.e., the characteristics as revealed by responses to other questions, including a
series of demographic questions). A positive z-score means that the response and characteristic
are positively related; a negative z-score means that the response and characteristic are
negatively related.
The z-score shows the strength of the relationship between the characteristic and the response to
the question. Those z-scores that have an absolute value of 3.30 or greater indicate a relationship
that is so strong that it would happen by chance only 1 out of 1,000 times (p < 0.001). Those
z-scores that have an absolute value of 2.58 to 3.29 indicate a relationship that is so strong that it
would happen by chance only 1 out of 100 times (p < 0.01). Finally, those z-scores that have an
absolute value of 1.96 to 2.57 indicate a relationship that is so strong that it would happen by
chance only 5 out of 100 times (p < 0.05).
6 Responsive Management Introduction and Methodology
The z-scores were calculated as shown in the formula below.
where: n1 represents the number of observations in Group 1.
n2 represents the number of observations in Group 2. p1 = a/(a + b) = a/n1 and represents the proportion of observations in Group 1 that falls in Cell a.
It is employed to estimate the population proportion Π1 (% of Group 1 who had specific characteristic).
p2 = c/(c + d) = c/n2 and represents the proportion of observations in Group 2 that falls in Cell c. It is employed to estimate the population proportion Π2 (% of Group 2 who had specific characteristic).
p = (a + c)/(n1 + n2) = (a + c)/n and is a pooled estimate of the proportion of respondents who had specific characteristic in the underlying population.
(Equation from Handbook of Parametric and Nonparametric Statistical Procedures, 2nd Edition by David J. Sheskin. © 2000, Chapman & Hall/CRC, Boca Raton, FL.)
The variables that were examined in the nonparametric analysis, also referred to as the z-score
analysis, are categorized into eight broad themes, as shown in the tabulation below. A second
tabulation that starts on the following page shows all the variables that were examined in the
z-score analysis. Please see the section that follows for information on how to interpret the
tabulated results of the nonparametric analysis.
Categories of Variables in the Nonparametric Analysis 1. Importance of Deer-Related Issues 2. Presence of Deer on Property 3. Participation in Wildlife-Associated Recreation 4. Opinions on Deer Population and Control Options 5. Opinions on Nuisance and Disease Concerns Regarding Deer 6. Opinions on Deer Herd’s Effects on Ecosystem 7. Information Sources: Social Media 8. Demographic

Pennsylvania Residents’ Opinions on and Attitudes Toward Deer and Deer Management 7 Introduction and Methodology Variables Run in the Nonparametric Analysis
1. Considers deer-related issues as a 9 or 10 in importance as compared to other issues in his/her life 1. Does not consider deer-related issues as a 9 or 10 in importance as compared to other issues in his/her life 2. Has seen deer frequently on his/her property in the past 12 months 2. Does not indicate having seen deer frequently on his/her property in the past 12 months 3. Has spent time viewing or watching deer around home in the past 12 months 3. Does not indicate having spent time viewing or watching deer around home in the past 12 months 3. Has taken a trip more than a mile from home for the primary purpose of viewing or watching deer in the past
12 months 3. Does not indicate having taken a trip more than a mile from home for the primary purpose of viewing or
watching deer in the past 12 months 3. Has used a spotlight to view deer at night on a trip to watch deer in the past 12 months 3. Does not indicate having used a spotlight to view deer at night on a trip to watch deer in the past 12 months 3. Is very or somewhat satisfied with opportunities to view or watch deer in Pennsylvania 3. Does not indicate being very or somewhat satisfied with opportunities to view or watch deer in Pennsylvania 3. Fed birds or make birdfeed available on his/her property in the past 12 months 3. Does not indicate having fed birds or made birdfeed available on his/her property in the past 12 months 3. Fed deer intentionally or put out attractants in the past 12 months 3. Does not indicate having fed deer intentionally or having put out attractants in the past 12 months 3. Has a valid 2011 Pennsylvania general hunting license 3. Does not indicate having a valid 2011 Pennsylvania general hunting license 3. Considers himself/herself to be a hunter 3. Does not indicate considering himself/herself to be a hunter 3. Indicates that he/she or a family member hunts 3. Does not Indicate that he/she or any of his/her family members hunt 4. Considers the deer population in his/her area to be too high 4. Does not consider the deer population in his/her area to be too high 4. Strongly or moderately agrees that deer populations should be managed for healthy and sustainable forest
habitat 4. Does not strongly or moderately agree that deer populations should be managed for healthy and sustainable
forest habitat 4. Strongly or moderately agrees that deer populations should be managed for healthy and sustainable deer
populations 4. Does not strongly or moderately agree that deer populations should be managed for healthy and sustainable
deer populations 4. Strongly or moderately agrees that deer populations should be managed for safe and acceptable levels of deer-
human conflicts 4. Does not strongly or moderately agree that deer populations should be managed for safe and acceptable levels
of deer-human conflicts 4. Strongly or moderately supports lethal methods to manage deer populations in Pennsylvania 4. Does not strongly or moderately support lethal methods to manage deer populations in Pennsylvania 4. Strongly or moderately supports legal, regulated hunting as a method of controlling deer populations in
Pennsylvania 4. Does not strongly or moderately support legal, regulated hunting as a method of controlling deer populations in
Pennsylvania 4. Strongly or moderately supports professionals or sharpshooters as a method of controlling deer populations in
Pennsylvania 4. Does not strongly or moderately support professionals or sharpshooters as a method of controlling deer
populations in Pennsylvania 4. Strongly or moderately supports trapping and killing as a method of controlling deer populations in
Pennsylvania 4. Does not strongly or moderately support trapping and killing as a method of controlling deer populations in
Pennsylvania 4. Strongly or moderately supports fertility or birth control as a method of controlling deer populations in
Pennsylvania 4. Does not strongly or moderately support fertility or birth control as a method of controlling deer populations in
Pennsylvania

8 Responsive Management Introduction and Methodology
Variables Run in the Nonparametric Analysis (continued) 5. Rates concern about tick-borne diseases in Pennsylvania as a 9 or a 10 5. Does not rate concern about tick-borne diseases in Pennsylvania as a 9 or a 10 5. Rates concern about deer droppings in their yard as a 9 or a 10 5. Does not rate concern about deer droppings in their yard as a 9 or a 10 5. Rates concern about deer damage to plants and landscaping in their yard as a 9 or 10 5. Does not rate concern about deer damage to plants and landscaping in their yard as a 9 or 10 5. Rates concern about deer-vehicle accidents in Pennsylvania as a 9 or 10 5. Does not rate concern about deer-vehicle accidents in Pennsylvania as a 9 or 10 5. Indicates having experienced a problem with deer at his/her primary place of residence in the past 12 months 5. Does not indicate having experienced any problems with deer at his/her primary place of residence in the past
12 months 5. Indicates that he/she or another person living in the immediate household has been in a vehicle collision with
or an accident involving a deer on Pennsylvania's roads or highways in the past 12 months 5. Does not indicate that he/she or another person living in the immediate household has been in a vehicle
collision with or an accident involving a deer on Pennsylvania's roads or highways in the past 12 months 5. Indicates that he/she or another person living in the immediate household has been diagnosed by a physician
with a tick-borne disease in the past 12 months 5. Does not indicate that he/she or another person living in the immediate household has been diagnosed by a
physician with a tick-borne disease in the past 12 months 5. Strongly or moderately agrees that it is OK for private citizens to feed or attract deer in Pennsylvania 5. Does not strongly or moderately agree that it is OK for private citizens to feed or attract deer in Pennsylvania 6. Rates concern about deer impacts on the habitat and other wildlife in Pennsylvania as a 9 or 10 6. Does not rate concern about deer impacts on the habitat and other wildlife in Pennsylvania as a 9 or 10 6. Rates concern about the quality of deer habitat in Pennsylvania as a 9 or 10 6. Does not rate concern about the quality of deer habitat in Pennsylvania as a 9 or 10 6. Rates concern about the health of the deer population in Pennsylvania as a 9 or 10 6. Does not rate concern about the health of the deer population in Pennsylvania as a 9 or 10 7. Uses social media, such as Facebook, Twitter, or YouTube 7. Uses Facebook 7. Does not indicate using Facebook (including not using any social media) 7. Does not indicate using social media, such as Facebook, Twitter, or YouTube 8. Primary place of residence is a single-family home 8. Primary place of residence is not a single-family home 8. Has lived at his/her primary place of residence for more than the median number of years 8. Has lived at his/her primary place of residence for the median number of years or less 8. Considers place of residence to be an urban or suburban area 8. Does not consider place of residence to be an urban or suburban area 8. Has more than median number of people living in his/her household 8. Has the median number or fewer people living in his/her household 8. Is more than median age 8. Is the median age or younger 8. Is male 8. Is female 8. Lives in WMU 1A 8. Lives in WMU 1B 8. Lives in WMU 2A 8. Lives in WMU 2B 8. Lives in WMU 2C 8. Lives in WMU 2D 8. Lives in WMU 2E 8. Lives in WMU 2F 8. Lives in WMU 2G 8. Lives in WMU 3A 8. Lives in WMU 3B 8. Lives in WMU 3C 8. Lives in WMU 3D

Pennsylvania Residents’ Opinions on and Attitudes Toward Deer and Deer Management 9 Introduction and Methodology Variables Run in the Nonparametric Analysis (continued)
8. Lives in WMU 4A 8. Lives in WMU 4B 8. Lives in WMU 4C 8. Lives in WMU 4D 8. Lives in WMU 4E 8. Lives in WMU 5A 8. Lives in WMU 5B 8. Lives in WMU 5C 8. Lives in WMU 5D
INTERPRETING THE NONPARAMETRIC ANALYSIS RESULTS The z-score analysis always looks at two groups: those with the characteristic compared to those
without the characteristic. As an example, when the analysis is run on gender, it looks at males
versus not males (i.e., females). When the analysis is run on a WMU, it looks at, for instance,
those who live in WMU 1A versus those who do not live in WMU 1A (i.e., collectively those
who live in any other WMU). It then does a like analysis on those who live in WMU 1B versus
those who do not live in WMU 1B.
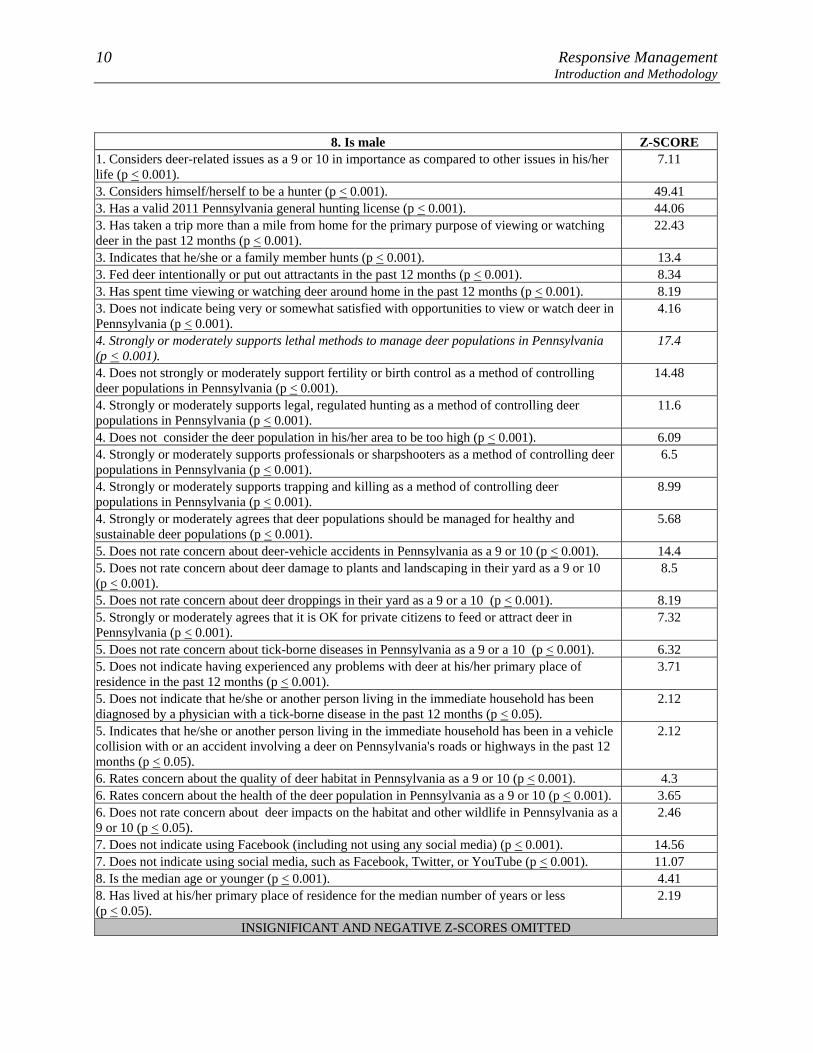
The first row in bold in each z-score tabulation is the characteristic under consideration. In the
example that follows, “Being male” is the characteristic under consideration. The rows under the
bold row are all the characteristics (i.e., the responses to questions) that are correlated with being
male. Therefore, each row under the bold row are responses that males were more likely to give
than were females. The following paragraphs more fully explain how to interpret the tabulations.
When examining the correlations that are found in the z-score tabulations, it is important to keep
several points in mind. Most importantly, a correlation means simply that a response to a
particular question is correlated to giving another response. For instance, based on the z-score
tabulation on the following page that is presented as an example, being male is correlated with
supporting lethal methods to manage deer populations in Pennsylvania (p < 0.001) (see the
italicized row in the example). This simply means that males are more likely to support lethal
methods than are females. This does not mean that all males support lethal methods to manage
deer, as some do not. Likewise, some females support lethal methods. The finding simply
means that males are more likely to support lethal methods than are females.
10 Responsive Management Introduction and Methodology
8. Is male Z-SCORE 1. Considers deer-related issues as a 9 or 10 in importance as compared to other issues in his/her life (p < 0.001).
7.11
3. Considers himself/herself to be a hunter (p < 0.001). 49.41 3. Has a valid 2011 Pennsylvania general hunting license (p < 0.001). 44.06 3. Has taken a trip more than a mile from home for the primary purpose of viewing or watching deer in the past 12 months (p < 0.001).
22.43
3. Indicates that he/she or a family member hunts (p < 0.001). 13.4 3. Fed deer intentionally or put out attractants in the past 12 months (p < 0.001). 8.34 3. Has spent time viewing or watching deer around home in the past 12 months (p < 0.001). 8.19 3. Does not indicate being very or somewhat satisfied with opportunities to view or watch deer in Pennsylvania (p < 0.001).
4.16
4. Strongly or moderately supports lethal methods to manage deer populations in Pennsylvania (p < 0.001).
17.4
4. Does not strongly or moderately support fertility or birth control as a method of controlling deer populations in Pennsylvania (p < 0.001).
14.48
4. Strongly or moderately supports legal, regulated hunting as a method of controlling deer populations in Pennsylvania (p < 0.001).
11.6
4. Does not consider the deer population in his/her area to be too high (p < 0.001). 6.09 4. Strongly or moderately supports professionals or sharpshooters as a method of controlling deer populations in Pennsylvania (p < 0.001).
6.5
4. Strongly or moderately supports trapping and killing as a method of controlling deer populations in Pennsylvania (p < 0.001).
8.99
4. Strongly or moderately agrees that deer populations should be managed for healthy and sustainable deer populations (p < 0.001).
5.68
5. Does not rate concern about deer-vehicle accidents in Pennsylvania as a 9 or 10 (p < 0.001). 14.4 5. Does not rate concern about deer damage to plants and landscaping in their yard as a 9 or 10 (p < 0.001).
8.5
5. Does not rate concern about deer droppings in their yard as a 9 or a 10 (p < 0.001). 8.19 5. Strongly or moderately agrees that it is OK for private citizens to feed or attract deer in Pennsylvania (p < 0.001).
7.32
5. Does not rate concern about tick-borne diseases in Pennsylvania as a 9 or a 10 (p < 0.001). 6.32 5. Does not indicate having experienced any problems with deer at his/her primary place of residence in the past 12 months (p < 0.001).
3.71
5. Does not indicate that he/she or another person living in the immediate household has been diagnosed by a physician with a tick-borne disease in the past 12 months (p < 0.05).
2.12
5. Indicates that he/she or another person living in the immediate household has been in a vehicle collision with or an accident involving a deer on Pennsylvania's roads or highways in the past 12 months (p < 0.05).
2.12
6. Rates concern about the quality of deer habitat in Pennsylvania as a 9 or 10 (p < 0.001). 4.3 6. Rates concern about the health of the deer population in Pennsylvania as a 9 or 10 (p < 0.001). 3.65 6. Does not rate concern about deer impacts on the habitat and other wildlife in Pennsylvania as a 9 or 10 (p < 0.05).
2.46
7. Does not indicate using Facebook (including not using any social media) (p < 0.001). 14.56 7. Does not indicate using social media, such as Facebook, Twitter, or YouTube (p < 0.001). 11.07 8. Is the median age or younger (p < 0.001). 4.41 8. Has lived at his/her primary place of residence for the median number of years or less (p < 0.05).
2.19
INSIGNIFICANT AND NEGATIVE Z-SCORES OMITTED
Pennsylvania Residents’ Opinions on and Attitudes Toward Deer and Deer Management 11 Introduction and Methodology Secondly, a finding that a characteristic is correlated to another response does not mean that a
majority of those with that characteristic give that particular response; it simply means that those
with that characteristic are more likely to give the particular response than are those without that
characteristic (even in a situation where less than a majority of both groups give the particular
response). For instance, being male is correlated with having a valid Pennsylvania hunting
license (the third row below the bold header row). However, less than a majority of males have a
hunting license. Indeed, less than a majority of both males and females have a hunting license.
The finding, therefore, simply means that males are more likely, compared to females, to have a
hunting license; it does not mean that a majority of males have a hunting license. Indeed, it
would be incorrect to say, “Most males have a hunting license,” as that is not what the z-score
tabulation shows.
The z-score tabulations are presented in the report following the graph of each pertinent question
in the statewide results. Each tabulation has the variables grouped into the eight overall
categories. Within each category, the variables are ranked according to the strength of the
correlation.
SAMPLING ERROR Throughout this report, findings of the telephone survey are reported at a 95% confidence
interval (or higher). For the entire sample of Pennsylvania residents 18 years old and older, the
sampling error is at most plus or minus 1.02 percentage points. This means that if the survey
were conducted 100 times on different samples that were selected in the same way, the findings
of 95 out of the 100 surveys would fall within plus or minus 1.02 percentage points of each
other. Sampling error was calculated using the formula described on the following page, with a
sample size of 9,212 and a population size of 10,090,675 residents 18 years old and older.

12 Responsive Management Introduction and Methodology
Sampling Error Equation
( )( )96.1
1
25.25.
⎟⎟⎟⎟
⎠
⎞
⎜⎜⎜⎜
⎝
⎛
−
−=
p
s
p
NN
N
B
Derived from formula: p. 206 in Dillman, D. A. 2000. Mail and Internet Surveys. John Wiley & Sons, NY.
Note: This is a simplified version of the formula that calculates the maximum sampling error using a 50:50 split (the most conservative calculation because a 50:50 split would give maximum variation).
ADDITIONAL INFORMATION ABOUT THE PRESENTATION OF RESULTS IN THE REPORT In examining the results, it is important to be aware that the questionnaire included several types
of questions:
• Open-ended questions are those in which no answer set is read to the respondents; rather, they can respond with anything that comes to mind from the question.
• Closed-ended questions have an answer set from which to choose. • Single or multiple response questions: Some questions allow only a single response,
while other questions allow respondents to give more than one response or choose all that apply. Those that allow more than a single response are indicated on the graphs with the label, “Multiple Responses Allowed.”
• Scaled questions: Many closed-ended questions (but not all) are in a scale, such as excellent-good-fair-poor.
• Series questions: Many questions are part of a series, and the results are primarily intended to be examined relative to the other questions in that series (although results of the questions individually can also be valuable). Typically, results of questions in a series are shown on a single graph.
Some graphs show an average, either the mean or median (or both). The mean is simply the sum
of all numbers divided by the number of respondents. Because outliers (extremely high or low
numbers relative to most of the other responses) may skew the mean, the median may be shown.
The median is the number at which half the sample is above and the other half is below. In other
words, a median of 150 means that half the sample gave an answer of more than 150 and the
other half gave an answer of less than 150.
Where: B = maximum sampling error (as decimal) NP = population size (i.e., total number who could be surveyed) NS = sample size (i.e., total number of respondents surveyed)
Pennsylvania Residents’ Opinions on and Attitudes Toward Deer and Deer Management 13 Introduction and Methodology Most graphs show results rounded to the nearest integer; however, all data are stored in decimal
format, and all calculations are performed on unrounded numbers. For this reason, some results
may not sum to exactly 100% because of this rounding on the graphs. Additionally, rounding
may cause apparent discrepancies of 1 percentage point between the graphs and the reported
results of combined responses (e.g., when “strongly support” and “moderately support” are
summed to determine the total percentage in support).

14 Responsive Management Overall Results
STATEWIDE RESULTS PARTICIPATION IN VIEWING DEER
A majority of Pennsylvania residents (56%) spent time viewing or watching deer around
their home in the past 12 months; this graph is accompanied by a map of the results by
WMU, as well. Additionally, 22% of Pennsylvania residents took a trip of at least 1 mile to
view deer.
• Of those who took a deer viewing trip, about a third (32%) used a spotlight to view the
deer at night.
• A crosstabulation found that those who consider themselves to be a hunter, compared
to those who do not, are more likely to have spent time viewing or watching deer
around home in the past 12 months (73% of hunters versus 51% of non-hunters).
Likewise, hunters are more likely than non-hunters to have taken a trip to view deer
(54% to 11%).
Satisfaction is high with opportunities to view or watch deer in Pennsylvania: 66% say that
they are somewhat or very satisfied, while 10% say that they are very or somewhat
dissatisfied; the remainder are neutral. A map is also included showing results regarding
dissatisfaction by WMU.

Pennsylvania Residents’ Opinions on and Attitudes Toward Deer and Deer Management 15 Overall Results
Q10. Have you spent time viewing or watching deer around your home in the past 12 months?
Less than 1%
43
56
0 20 40 60 80 100
Yes
No
Don't know
Percent (n=9212)

16 Responsive Management Overall Results
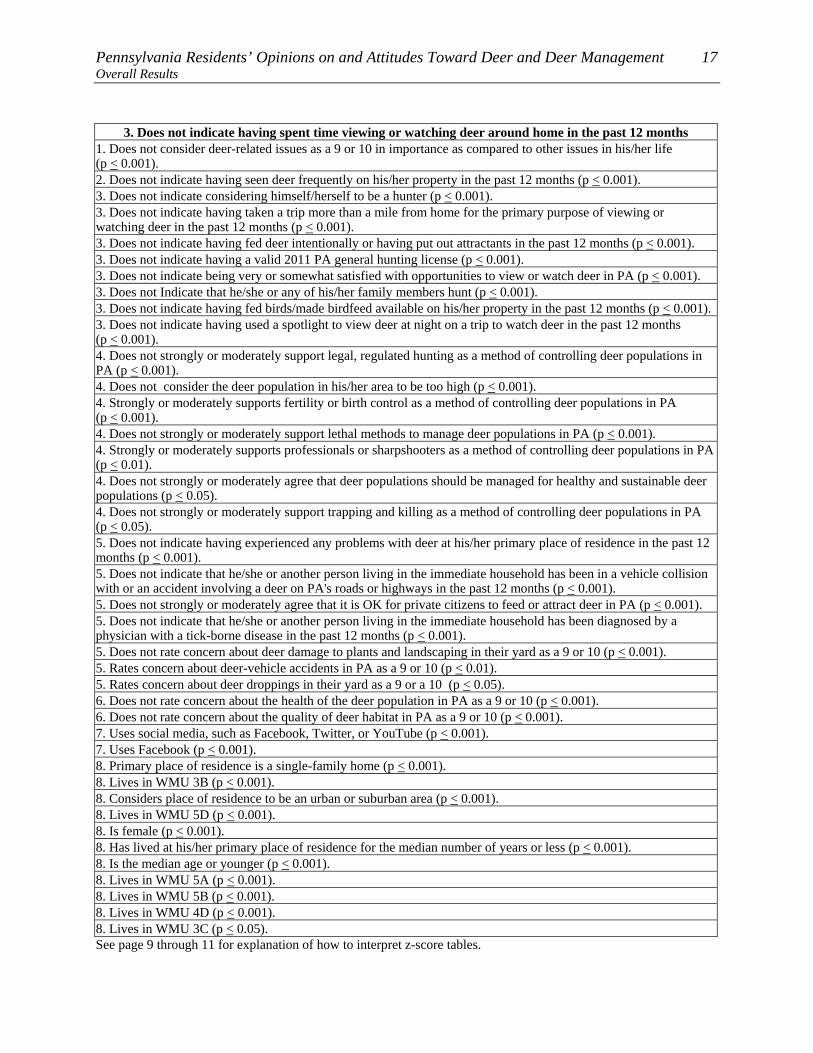
3. Has spent time viewing or watching deer around home in the past 12 months
1. Considers deer-related issues as a 9 or 10 in importance as compared to other issues in his/her life (p < 0.001). 2. Has seen deer frequently on his/her property in the past 12 months (p < 0.001). 3. Considers himself/herself to be a hunter (p < 0.001). 3. Has taken a trip more than a mile from home for the primary purpose of viewing or watching deer in the past 12 months (p < 0.001). 3. Fed deer intentionally or put out attractants in the past 12 months (p < 0.001). 3. Has a valid 2011 PA general hunting license (p < 0.001). 3. Is very or somewhat satisfied with opportunities to view or watch deer in PA (p < 0.001). 3. Indicates that he/she or a family member hunts (p < 0.001). 3. Fed birds or make birdfeed available on his/her property in the past 12 months (p < 0.001). 3. Has used a spotlight to view deer at night on a trip to watch deer in the past 12 months (p < 0.001). 4. Strongly or moderately supports legal, regulated hunting as a method of controlling deer populations in PA (p < 0.001). 4. Considers the deer population in his/her area to be too high (p < 0.001). 4. Does not strongly or moderately support fertility or birth control as a method of controlling deer populations in PA (p < 0.001). 4. Strongly or moderately supports lethal methods to manage deer populations in PA (p < 0.001). 4. Does not strongly or moderately support professionals or sharpshooters as a method of controlling deer populations in PA (p < 0.01). 4. Strongly or moderately agrees that deer populations should be managed for healthy and sustainable deer populations (p < 0.05). 4. Strongly/moderately supports trapping and killing as a method of controlling deer populations in PA (p < 0.05). 5. Indicates having experienced a problem with deer at his/her primary place of residence in the past 12 months (p < 0.001). 5. Indicates that he/she or another person living in the immediate household has been in a vehicle collision with or an accident involving a deer on PA's roads or highways in the past 12 months (p < 0.001). 5. Strongly or moderately agrees that it is OK for private citizens to feed or attract deer in PA (p < 0.001). 5. Indicates that he/she or another person living in the immediate household has been diagnosed by a physician with a tick-borne disease in the past 12 months (p < 0.001). 5. Rates concern about deer damage to plants and landscaping in their yard as a 9 or 10 (p < 0.001). 5. Does not rate concern about deer-vehicle accidents in PA as a 9 or 10 (p < 0.01). 5. Does not rate concern about deer droppings in their yard as a 9 or a 10 (p < 0.05). 6. Rates concern about the health of the deer population in PA as a 9 or 10 (p < 0.001). 6. Rates concern about the quality of deer habitat in PA as a 9 or 10 (p < 0.001). 7. Does not indicate using social media, such as Facebook, Twitter, or YouTube (p < 0.001). 7. Does not indicate using Facebook (including not using any social media) (p < 0.001). 8. Primary place of residence is not a single-family home (p < 0.001). 8. Does not consider place of residence to be an urban or suburban area (p < 0.001). 8. Is male (p < 0.001). 8. Lives in WMU 2A (p < 0.001). 8. Has lived at his/her primary place of residence for more than the median number of years (p < 0.001). 8. Is more than median age (p < 0.001). 8. Lives in WMU 2G (p < 0.001). 8. Lives in WMU 2D (p < 0.001). 8. Lives in WMU 1A (p < 0.001). 8. Lives in WMU 2F (p < 0.001). 8. Lives in WMU 3A (p < 0.001). 8. Lives in WMU 1B (p < 0.01). 8. Lives in WMU 2C (p < 0.05). 8. Lives in WMU 2B (p < 0.05). 8. Has more than median number of people living in his/her household (p < 0.05). See page 9 through 11 for explanation of how to interpret z-score tables.
Pennsylvania Residents’ Opinions on and Attitudes Toward Deer and Deer Management 17 Overall Results
3. Does not indicate having spent time viewing or watching deer around home in the past 12 months 1. Does not consider deer-related issues as a 9 or 10 in importance as compared to other issues in his/her life (p < 0.001). 2. Does not indicate having seen deer frequently on his/her property in the past 12 months (p < 0.001). 3. Does not indicate considering himself/herself to be a hunter (p < 0.001). 3. Does not indicate having taken a trip more than a mile from home for the primary purpose of viewing or watching deer in the past 12 months (p < 0.001). 3. Does not indicate having fed deer intentionally or having put out attractants in the past 12 months (p < 0.001). 3. Does not indicate having a valid 2011 PA general hunting license (p < 0.001). 3. Does not indicate being very or somewhat satisfied with opportunities to view or watch deer in PA (p < 0.001). 3. Does not Indicate that he/she or any of his/her family members hunt (p < 0.001). 3. Does not indicate having fed birds/made birdfeed available on his/her property in the past 12 months (p < 0.001).3. Does not indicate having used a spotlight to view deer at night on a trip to watch deer in the past 12 months (p < 0.001). 4. Does not strongly or moderately support legal, regulated hunting as a method of controlling deer populations in PA (p < 0.001). 4. Does not consider the deer population in his/her area to be too high (p < 0.001). 4. Strongly or moderately supports fertility or birth control as a method of controlling deer populations in PA (p < 0.001). 4. Does not strongly or moderately support lethal methods to manage deer populations in PA (p < 0.001). 4. Strongly or moderately supports professionals or sharpshooters as a method of controlling deer populations in PA(p < 0.01). 4. Does not strongly or moderately agree that deer populations should be managed for healthy and sustainable deer populations (p < 0.05). 4. Does not strongly or moderately support trapping and killing as a method of controlling deer populations in PA (p < 0.05). 5. Does not indicate having experienced any problems with deer at his/her primary place of residence in the past 12 months (p < 0.001). 5. Does not indicate that he/she or another person living in the immediate household has been in a vehicle collision with or an accident involving a deer on PA's roads or highways in the past 12 months (p < 0.001). 5. Does not strongly or moderately agree that it is OK for private citizens to feed or attract deer in PA (p < 0.001). 5. Does not indicate that he/she or another person living in the immediate household has been diagnosed by a physician with a tick-borne disease in the past 12 months (p < 0.001). 5. Does not rate concern about deer damage to plants and landscaping in their yard as a 9 or 10 (p < 0.001). 5. Rates concern about deer-vehicle accidents in PA as a 9 or 10 (p < 0.01). 5. Rates concern about deer droppings in their yard as a 9 or a 10 (p < 0.05). 6. Does not rate concern about the health of the deer population in PA as a 9 or 10 (p < 0.001). 6. Does not rate concern about the quality of deer habitat in PA as a 9 or 10 (p < 0.001). 7. Uses social media, such as Facebook, Twitter, or YouTube (p < 0.001). 7. Uses Facebook (p < 0.001). 8. Primary place of residence is a single-family home (p < 0.001). 8. Lives in WMU 3B (p < 0.001). 8. Considers place of residence to be an urban or suburban area (p < 0.001). 8. Lives in WMU 5D (p < 0.001). 8. Is female (p < 0.001). 8. Has lived at his/her primary place of residence for the median number of years or less (p < 0.001). 8. Is the median age or younger (p < 0.001). 8. Lives in WMU 5A (p < 0.001). 8. Lives in WMU 5B (p < 0.001). 8. Lives in WMU 4D (p < 0.001). 8. Lives in WMU 3C (p < 0.05). See page 9 through 11 for explanation of how to interpret z-score tables.

18 Responsive Management Overall Results
Q10. Have you spent time viewing or watching deer around your home in the past 12 months?
73
27
49
51
0 20 40 60 80 100
Yes
No
Percent
Consider themselves ahunter (n=3285)Do not consider themselvesa hunter (n=5906)
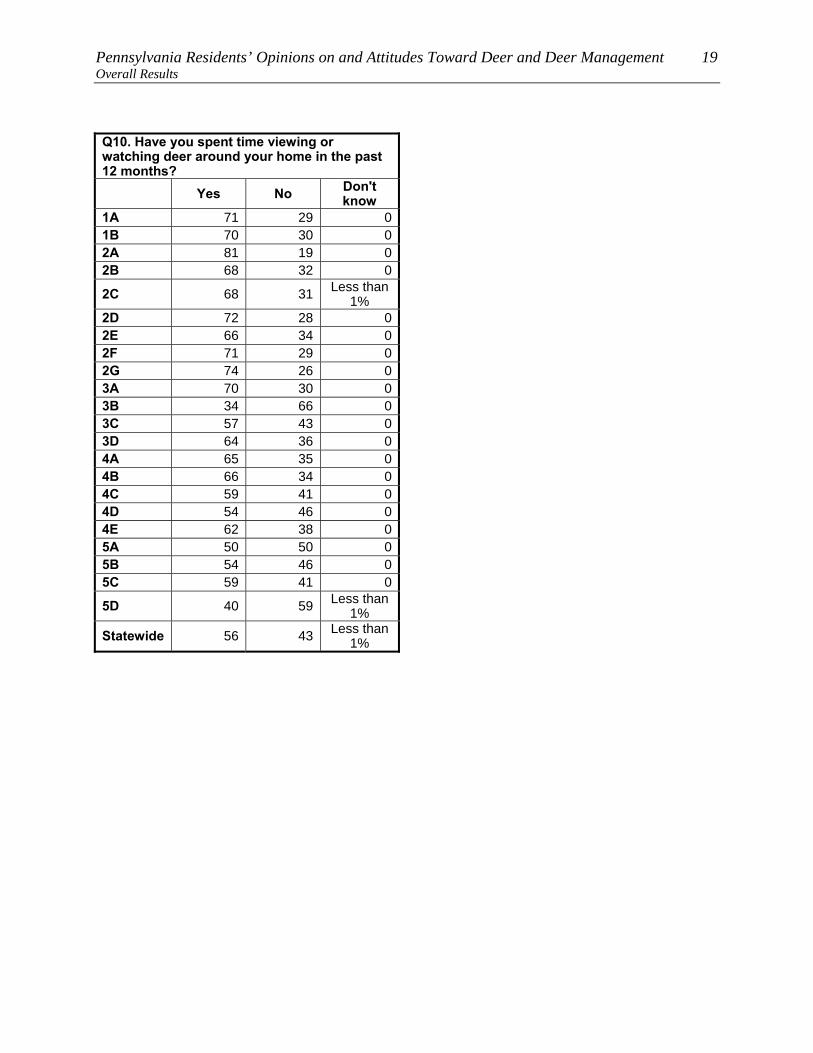
Pennsylvania Residents’ Opinions on and Attitudes Toward Deer and Deer Management 19 Overall Results
Q10. Have you spent time viewing or watching deer around your home in the past 12 months? Yes No Don't
know 1A 71 29 01B 70 30 02A 81 19 02B 68 32 0
2C 68 31 Less than 1%
2D 72 28 02E 66 34 02F 71 29 02G 74 26 03A 70 30 03B 34 66 03C 57 43 03D 64 36 04A 65 35 04B 66 34 04C 59 41 04D 54 46 04E 62 38 05A 50 50 05B 54 46 05C 59 41 0
5D 40 59 Less than 1%
Statewide 56 43 Less than 1%
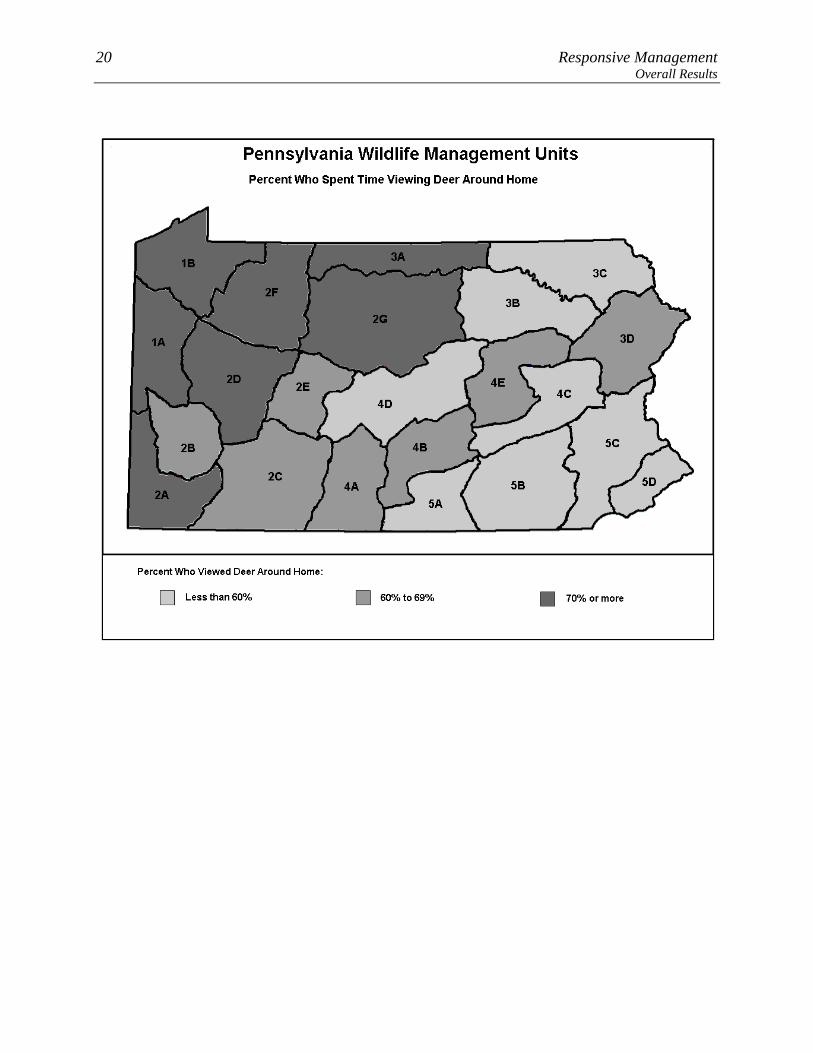
20 Responsive Management Overall Results

Pennsylvania Residents’ Opinions on and Attitudes Toward Deer and Deer Management 21 Overall Results
Q11. Have you taken a trip at least 1 mile from your home for the primary purpose of viewing or
watching deer in the past 12 months?
22
78
0 20 40 60 80 100
Yes
No
Percent (n=9212)

22 Responsive Management Overall Results
3. Has taken a trip more than a mile from home for the primary purpose of viewing or watching deer in the
past 12 months 1. Considers deer-related issues as a 9 or 10 in importance as compared to other issues in his/her life (p < 0.001). 2. Has seen deer frequently on his/her property in the past 12 months (p < 0.001). 3. Has a valid 2011 PA general hunting license (p < 0.001). 3. Considers himself/herself to be a hunter (p < 0.001). 3. Has spent time viewing or watching deer around home in the past 12 months (p < 0.001). 3. Fed deer intentionally or put out attractants in the past 12 months (p < 0.001). 3. Indicates that he/she or a family member hunts (p < 0.001). 3. Fed birds or make birdfeed available on his/her property in the past 12 months (p < 0.001). 3. Is very or somewhat satisfied with opportunities to view or watch deer in PA (p < 0.05). 4. Does not strongly or moderately support fertility or birth control as a method of controlling deer populations in PA (p < 0.001). 4. Does not consider the deer population in his/her area to be too high (p < 0.001). 4. Strongly or moderately supports legal, regulated hunting as a method of controlling deer populations in PA (p < 0.001). 4. Strongly or moderately supports lethal methods to manage deer populations in PA (p < 0.001). 4. Strongly or moderately supports trapping and killing as a method of controlling deer populations in PA (p < 0.001). 4. Strongly or moderately agrees that deer populations should be managed for healthy and sustainable deer populations (p < 0.001). 4. Does not strongly or moderately support professionals or sharpshooters as a method of controlling deer populations in PA (p < 0.001). 5. Strongly or moderately agrees that it is OK for private citizens to feed or attract deer in PA (p < 0.001). 5. Does not rate concern about deer-vehicle accidents in PA as a 9 or 10 (p < 0.001). 5. Does not rate concern about deer damage to plants and landscaping in their yard as a 9 or 10 (p < 0.001). 5. Does not indicate having experienced any problems with deer at his/her primary place of residence in the past 12 months (p < 0.001). 5. Does not rate concern about deer droppings in their yard as a 9 or a 10 (p < 0.001). 5. Indicates that he/she or another person living in the immediate household has been in a vehicle collision with or an accident involving a deer on PA's roads or highways in the past 12 months (p < 0.01). 6. Rates concern about the quality of deer habitat in PA as a 9 or 10 (p < 0.001). 6. Rates concern about the health of the deer population in PA as a 9 or 10 (p < 0.001). 6. Does not rate concern about deer impacts on the habitat and other wildlife in PA as a 9 or 10 (p < 0.01). 8. Is male (p < 0.001). 8. Does not consider place of residence to be an urban or suburban area (p < 0.001). 8. Is the median age or younger (p < 0.001). 8. Lives in WMU 2G (p < 0.001). 8. Primary place of residence is not a single-family home (p < 0.001). 8. Lives in WMU 3A (p < 0.001). 8. Has more than median number of people living in his/her household (p < 0.001). 8. Lives in WMU 4B (p < 0.001). 8. Lives in WMU 4A (p < 0.001). 8. Lives in WMU 2E (p < 0.001). 8. Lives in WMU 2F (p < 0.001). 8. Lives in WMU 4E (p < 0.01). See page 9 through 11 for explanation of how to interpret z-score tables.

Pennsylvania Residents’ Opinions on and Attitudes Toward Deer and Deer Management 23 Overall Results
3. Does not indicate having taken a trip more than a mile from home for the primary purpose of viewing or watching deer in the past 12 months
1. Does not consider deer-related issues as a 9 or 10 in importance as compared to other issues in his/her life (p < 0.001). 2. Does not indicate having seen deer frequently on his/her property in the past 12 months (p < 0.001). 3. Does not indicate having a valid 2011 PA general hunting license (p < 0.001). 3. Does not indicate considering himself/herself to be a hunter (p < 0.001). 3. Does not indicate having spent time viewing or watching deer around home in the past 12 months (p < 0.001). 3. Does not indicate having fed deer intentionally or having put out attractants in the past 12 months (p < 0.001). 3. Does not Indicate that he/she or any of his/her family members hunt (p < 0.001). 3. Does not indicate having fed birds or made birdfeed available on his/her property in the past 12 months (p < 0.001). 3. Does not indicate being very or somewhat satisfied with opportunities to view or watch deer in PA (p < 0.05). 4. Strongly or moderately supports fertility or birth control as a method of controlling deer populations in PA (p < 0.001). 4. Considers the deer population in his/her area to be too high (p < 0.001). 4. Does not strongly or moderately support legal, regulated hunting as a method of controlling deer populations in PA (p < 0.001). 4. Does not strongly or moderately support lethal methods to manage deer populations in PA (p < 0.001). 4. Does not strongly or moderately support trapping and killing as a method of controlling deer populations in PA (p < 0.001). 4. Does not strongly or moderately agree that deer populations should be managed for healthy and sustainable deer populations (p < 0.001). 4. Strongly or moderately supports professionals or sharpshooters as a method of controlling deer populations in PA(p < 0.001). 5. Does not strongly or moderately agree that it is OK for private citizens to feed or attract deer in PA (p < 0.001). 5. Rates concern about deer-vehicle accidents in PA as a 9 or 10 (p < 0.001). 5. Rates concern about deer droppings in their yard as a 9 or a 10 (p < 0.001). 5. Rates concern about deer damage to plants and landscaping in their yard as a 9 or 10 (p < 0.001). 5. Indicates having experienced a problem with deer at his/her primary place of residence in the past 12 months (p < 0.001). 5. Does not indicate that he/she or another person living in the immediate household has been in a vehicle collision with or an accident involving a deer on PA's roads or highways in the past 12 months (p < 0.01). 6. Does not rate concern about the quality of deer habitat in PA as a 9 or 10 (p < 0.001). 6. Does not rate concern about the health of the deer population in PA as a 9 or 10 (p < 0.001). 6. Rates concern about deer impacts on the habitat and other wildlife in PA as a 9 or 10 (p < 0.01). 8. Is female (p < 0.001). 8. Considers place of residence to be an urban or suburban area (p < 0.001). 8. Is more than median age (p < 0.001). 8. Lives in WMU 5D (p < 0.001). 8. Primary place of residence is a single-family home (p < 0.001). 8. Lives in WMU 2B (p < 0.001). 8. Has the median number or fewer people living in his/her household (p < 0.001). 8. Lives in WMU 5C (p < 0.001). 8. Lives in WMU 3C (p < 0.001). 8. Lives in WMU 3B (p < 0.01). 8. Lives in WMU 5A (p < 0.01). 8. Lives in WMU 3D (p < 0.05). See page 9 through 11 for explanation of how to interpret z-score tables.
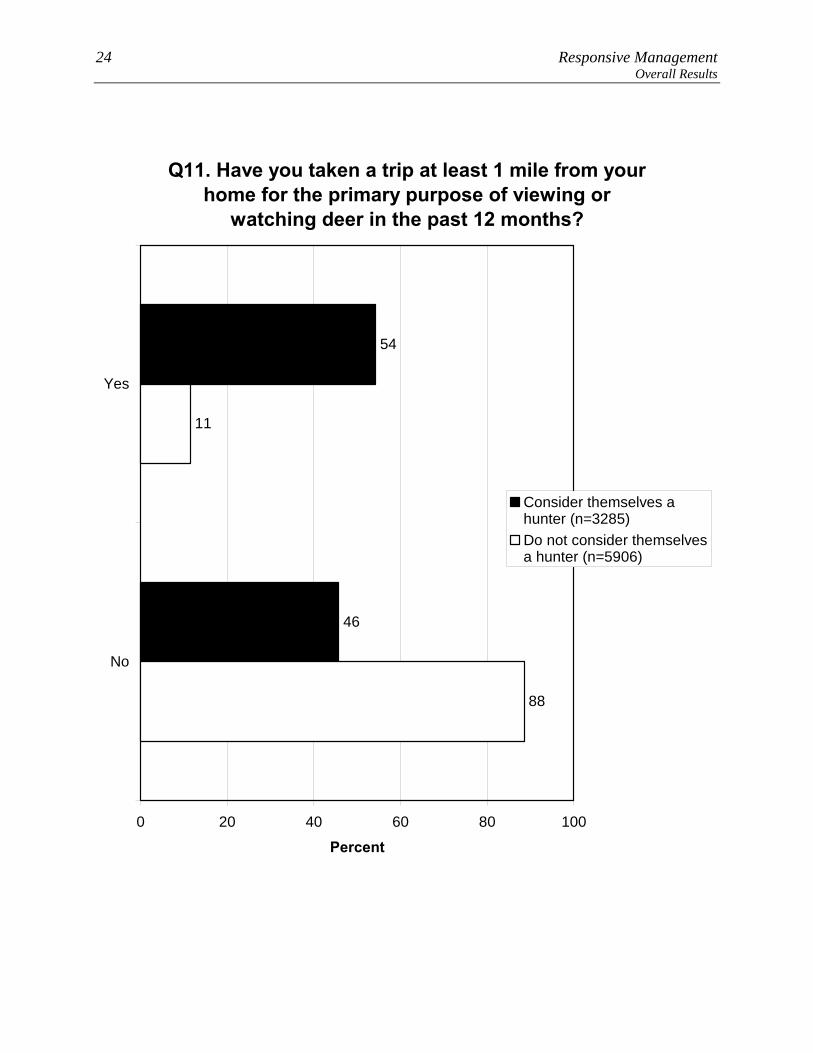
24 Responsive Management Overall Results
Q11. Have you taken a trip at least 1 mile from your home for the primary purpose of viewing or
watching deer in the past 12 months?
54
46
88
11
0 20 40 60 80 100
Yes
No
Percent
Consider themselves ahunter (n=3285)Do not consider themselvesa hunter (n=5906)

Pennsylvania Residents’ Opinions on and Attitudes Toward Deer and Deer Management 25 Overall Results
Q11. Have you taken a trip at least 1 mile from your home for the primary purpose of viewing or watching deer in the past 12 months?
Yes No Don't know
1A 30 70 01B 27 73 02A 29 71 02B 16 84 02C 32 68 02D 31 69 02E 39 61 02F 37 63 0
2G 43 56 Less than 1%
3A 43 57 03B 23 77 03C 20 79 13D 25 75 04A 39 61 0
4B 39 60 Less than 1%
4C 26 74 04D 31 69 04E 36 64 05A 23 77 05B 30 70 05C 20 80 05D 11 89 0
Statewide 22 78 Less than 1%
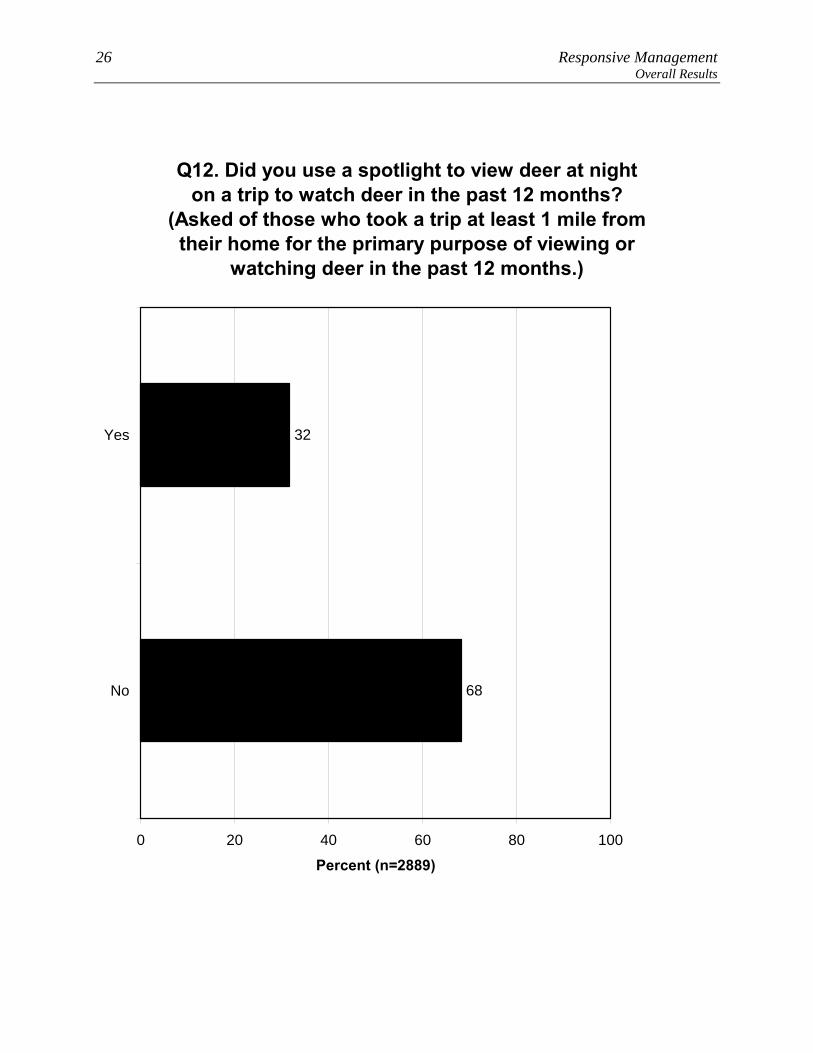
26 Responsive Management Overall Results
Q12. Did you use a spotlight to view deer at night on a trip to watch deer in the past 12 months?
(Asked of those who took a trip at least 1 mile from their home for the primary purpose of viewing or
watching deer in the past 12 months.)
32
68
0 20 40 60 80 100
Yes
No
Percent (n=2889)
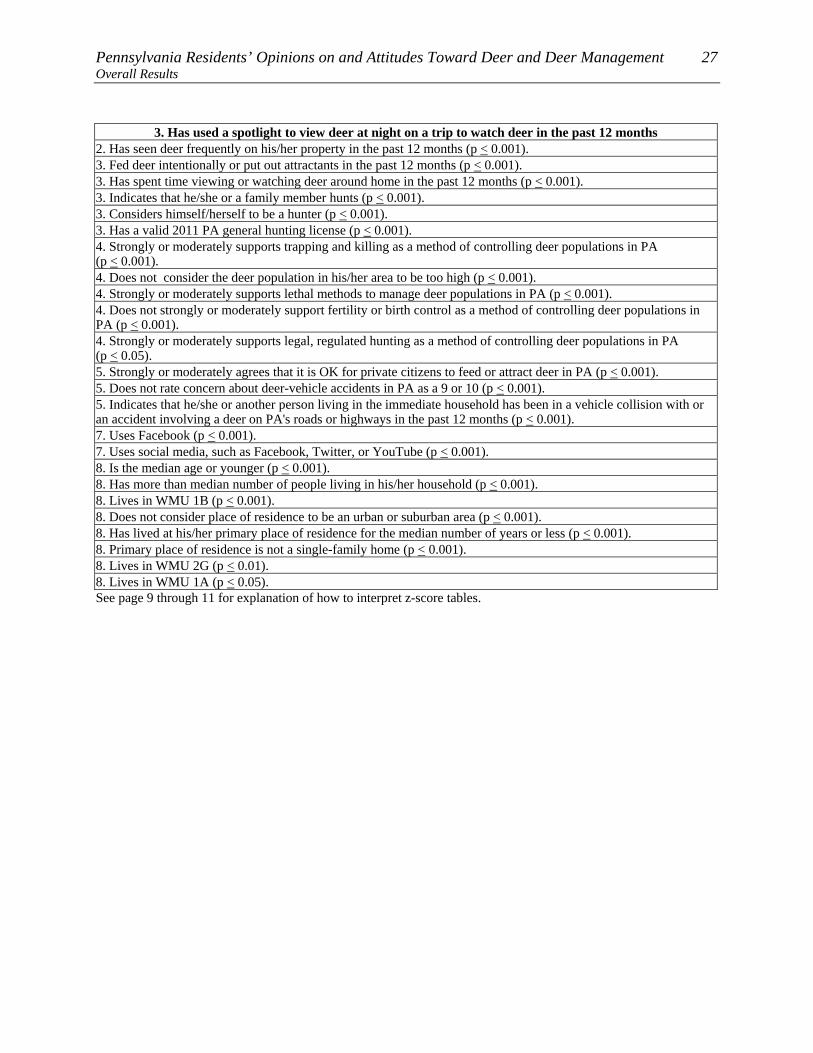
Pennsylvania Residents’ Opinions on and Attitudes Toward Deer and Deer Management 27 Overall Results
3. Has used a spotlight to view deer at night on a trip to watch deer in the past 12 months 2. Has seen deer frequently on his/her property in the past 12 months (p < 0.001). 3. Fed deer intentionally or put out attractants in the past 12 months (p < 0.001). 3. Has spent time viewing or watching deer around home in the past 12 months (p < 0.001). 3. Indicates that he/she or a family member hunts (p < 0.001). 3. Considers himself/herself to be a hunter (p < 0.001). 3. Has a valid 2011 PA general hunting license (p < 0.001). 4. Strongly or moderately supports trapping and killing as a method of controlling deer populations in PA (p < 0.001). 4. Does not consider the deer population in his/her area to be too high (p < 0.001). 4. Strongly or moderately supports lethal methods to manage deer populations in PA (p < 0.001). 4. Does not strongly or moderately support fertility or birth control as a method of controlling deer populations in PA (p < 0.001). 4. Strongly or moderately supports legal, regulated hunting as a method of controlling deer populations in PA (p < 0.05). 5. Strongly or moderately agrees that it is OK for private citizens to feed or attract deer in PA (p < 0.001). 5. Does not rate concern about deer-vehicle accidents in PA as a 9 or 10 (p < 0.001). 5. Indicates that he/she or another person living in the immediate household has been in a vehicle collision with or an accident involving a deer on PA's roads or highways in the past 12 months (p < 0.001). 7. Uses Facebook (p < 0.001). 7. Uses social media, such as Facebook, Twitter, or YouTube (p < 0.001). 8. Is the median age or younger (p < 0.001). 8. Has more than median number of people living in his/her household (p < 0.001). 8. Lives in WMU 1B (p < 0.001). 8. Does not consider place of residence to be an urban or suburban area (p < 0.001). 8. Has lived at his/her primary place of residence for the median number of years or less (p < 0.001). 8. Primary place of residence is not a single-family home (p < 0.001). 8. Lives in WMU 2G (p < 0.01). 8. Lives in WMU 1A (p < 0.05). See page 9 through 11 for explanation of how to interpret z-score tables.

28 Responsive Management Overall Results
3. Does not indicate having used a spotlight to view deer at night on a trip to watch deer in the past 12
months 2. Does not indicate having seen deer frequently on his/her property in the past 12 months (p < 0.001). 3. Does not indicate having fed deer intentionally or having put out attractants in the past 12 months (p < 0.001). 3. Does not indicate having spent time viewing or watching deer around home in the past 12 months (p < 0.001). 3. Does not Indicate that he/she or any of his/her family members hunt (p < 0.001). 3. Does not indicate considering himself/herself to be a hunter (p < 0.001). 3. Does not indicate having a valid 2011 PA general hunting license (p < 0.001). 4. Does not strongly or moderately support trapping and killing as a method of controlling deer populations in PA (p < 0.001). 4. Considers the deer population in his/her area to be too high (p < 0.001). 4. Does not strongly or moderately support lethal methods to manage deer populations in PA (p < 0.001). 4. Strongly or moderately supports fertility or birth control as a method of controlling deer populations in PA (p < 0.001). 4. Does not strongly or moderately support legal, regulated hunting as a method of controlling deer populations in PA (p < 0.05). 5. Does not strongly or moderately agree that it is OK for private citizens to feed or attract deer in PA (p < 0.001). 5. Rates concern about deer-vehicle accidents in PA as a 9 or 10 (p < 0.001). 5. Does not indicate that he/she or another person living in the immediate household has been in a vehicle collision with or an accident involving a deer on PA's roads or highways in the past 12 months (p < 0.001). 7. Does not indicate using Facebook (including not using any social media) (p < 0.001). 7. Does not indicate using social media, such as Facebook, Twitter, or YouTube (p < 0.001). 8. Is more than median age (p < 0.001). 8. Has the median number or fewer people living in his/her household (p < 0.001). 8. Considers place of residence to be an urban or suburban area (p < 0.001). 8. Primary place of residence is a single-family home (p < 0.001). 8. Has lived at his/her primary place of residence for more than the median number of years (p < 0.001). 8. Lives in WMU 3D (p < 0.001). 8. Lives in WMU 5A (p < 0.001). 8. Lives in WMU 5D (p < 0.01). 8. Lives in WMU 3B (p < 0.01). 8. Lives in WMU 2B (p < 0.01). 8. Lives in WMU 3C (p < 0.01). 8. Lives in WMU 4D (p < 0.05). 8. Lives in WMU 5C (p < 0.05). See page 9 through 11 for explanation of how to interpret z-score tables.

Pennsylvania Residents’ Opinions on and Attitudes Toward Deer and Deer Management 29 Overall Results
Q12. Did you use a spotlight to view deer at night on a trip to watch deer in the past 12 months? (Asked of those who took a trip at least 1 mile from their home for the primary purpose of viewing or watching deer in the past 12 months.) Yes No 1A 47 531B 65 352A 42 582B 22 782C 40 602D 41 592E 44 562F 44 562G 46 543A 37 633B 22 783C 24 763D 20 804A 36 644B 39 614C 40 604D 27 734E 38 625A 21 795B 36 645C 25 755D 16 84Statewide 32 68

30 Responsive Management Overall Results
Q13. How satisfied are you with opportunities to view or watch deer in Pennsylvania?
41
25
20
5
5
3
0 20 40 60 80 100
Very satisfied
Somewhatsatisfied
Neither satisfiednor dissatisfied
Somewhatdissatisfied
Very dissatisfied
Don't know
Percent (n=9212)
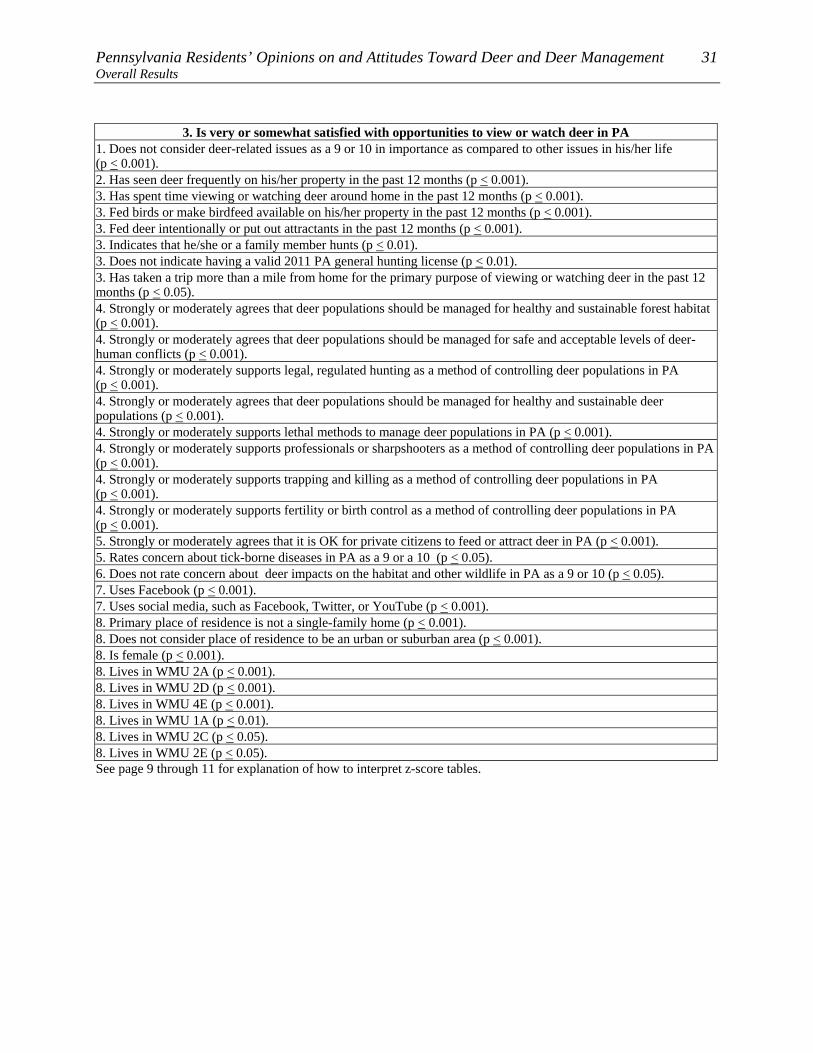
Pennsylvania Residents’ Opinions on and Attitudes Toward Deer and Deer Management 31 Overall Results
3. Is very or somewhat satisfied with opportunities to view or watch deer in PA 1. Does not consider deer-related issues as a 9 or 10 in importance as compared to other issues in his/her life (p < 0.001). 2. Has seen deer frequently on his/her property in the past 12 months (p < 0.001). 3. Has spent time viewing or watching deer around home in the past 12 months (p < 0.001). 3. Fed birds or make birdfeed available on his/her property in the past 12 months (p < 0.001). 3. Fed deer intentionally or put out attractants in the past 12 months (p < 0.001). 3. Indicates that he/she or a family member hunts (p < 0.01). 3. Does not indicate having a valid 2011 PA general hunting license (p < 0.01). 3. Has taken a trip more than a mile from home for the primary purpose of viewing or watching deer in the past 12 months (p < 0.05). 4. Strongly or moderately agrees that deer populations should be managed for healthy and sustainable forest habitat (p < 0.001). 4. Strongly or moderately agrees that deer populations should be managed for safe and acceptable levels of deer-human conflicts (p < 0.001). 4. Strongly or moderately supports legal, regulated hunting as a method of controlling deer populations in PA (p < 0.001). 4. Strongly or moderately agrees that deer populations should be managed for healthy and sustainable deer populations (p < 0.001). 4. Strongly or moderately supports lethal methods to manage deer populations in PA (p < 0.001). 4. Strongly or moderately supports professionals or sharpshooters as a method of controlling deer populations in PA(p < 0.001). 4. Strongly or moderately supports trapping and killing as a method of controlling deer populations in PA (p < 0.001). 4. Strongly or moderately supports fertility or birth control as a method of controlling deer populations in PA (p < 0.001). 5. Strongly or moderately agrees that it is OK for private citizens to feed or attract deer in PA (p < 0.001). 5. Rates concern about tick-borne diseases in PA as a 9 or a 10 (p < 0.05). 6. Does not rate concern about deer impacts on the habitat and other wildlife in PA as a 9 or 10 (p < 0.05). 7. Uses Facebook (p < 0.001). 7. Uses social media, such as Facebook, Twitter, or YouTube (p < 0.001). 8. Primary place of residence is not a single-family home (p < 0.001). 8. Does not consider place of residence to be an urban or suburban area (p < 0.001). 8. Is female (p < 0.001). 8. Lives in WMU 2A (p < 0.001). 8. Lives in WMU 2D (p < 0.001). 8. Lives in WMU 4E (p < 0.001). 8. Lives in WMU 1A (p < 0.01). 8. Lives in WMU 2C (p < 0.05). 8. Lives in WMU 2E (p < 0.05). See page 9 through 11 for explanation of how to interpret z-score tables.
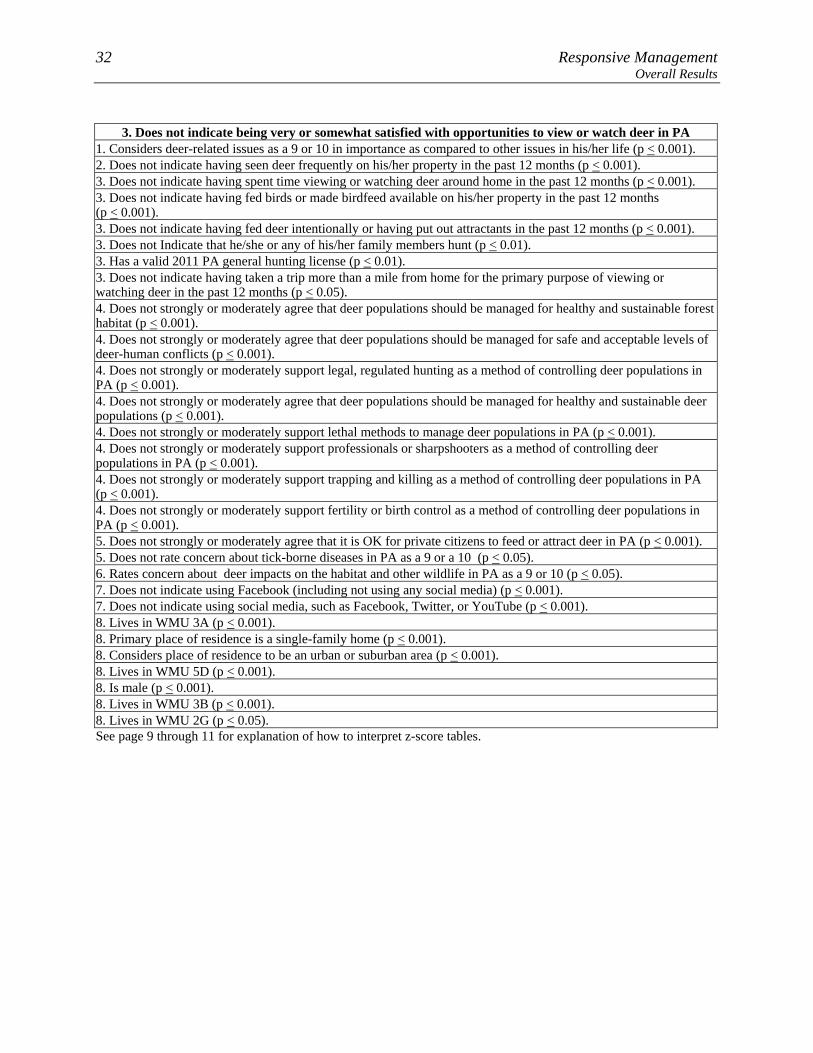
32 Responsive Management Overall Results
3. Does not indicate being very or somewhat satisfied with opportunities to view or watch deer in PA
1. Considers deer-related issues as a 9 or 10 in importance as compared to other issues in his/her life (p < 0.001). 2. Does not indicate having seen deer frequently on his/her property in the past 12 months (p < 0.001). 3. Does not indicate having spent time viewing or watching deer around home in the past 12 months (p < 0.001). 3. Does not indicate having fed birds or made birdfeed available on his/her property in the past 12 months (p < 0.001). 3. Does not indicate having fed deer intentionally or having put out attractants in the past 12 months (p < 0.001). 3. Does not Indicate that he/she or any of his/her family members hunt (p < 0.01). 3. Has a valid 2011 PA general hunting license (p < 0.01). 3. Does not indicate having taken a trip more than a mile from home for the primary purpose of viewing or watching deer in the past 12 months (p < 0.05). 4. Does not strongly or moderately agree that deer populations should be managed for healthy and sustainable forest habitat (p < 0.001). 4. Does not strongly or moderately agree that deer populations should be managed for safe and acceptable levels of deer-human conflicts (p < 0.001). 4. Does not strongly or moderately support legal, regulated hunting as a method of controlling deer populations in PA (p < 0.001). 4. Does not strongly or moderately agree that deer populations should be managed for healthy and sustainable deer populations (p < 0.001). 4. Does not strongly or moderately support lethal methods to manage deer populations in PA (p < 0.001). 4. Does not strongly or moderately support professionals or sharpshooters as a method of controlling deer populations in PA (p < 0.001). 4. Does not strongly or moderately support trapping and killing as a method of controlling deer populations in PA (p < 0.001). 4. Does not strongly or moderately support fertility or birth control as a method of controlling deer populations in PA (p < 0.001). 5. Does not strongly or moderately agree that it is OK for private citizens to feed or attract deer in PA (p < 0.001). 5. Does not rate concern about tick-borne diseases in PA as a 9 or a 10 (p < 0.05). 6. Rates concern about deer impacts on the habitat and other wildlife in PA as a 9 or 10 (p < 0.05). 7. Does not indicate using Facebook (including not using any social media) (p < 0.001). 7. Does not indicate using social media, such as Facebook, Twitter, or YouTube (p < 0.001). 8. Lives in WMU 3A (p < 0.001). 8. Primary place of residence is a single-family home (p < 0.001). 8. Considers place of residence to be an urban or suburban area (p < 0.001). 8. Lives in WMU 5D (p < 0.001). 8. Is male (p < 0.001). 8. Lives in WMU 3B (p < 0.001). 8. Lives in WMU 2G (p < 0.05). See page 9 through 11 for explanation of how to interpret z-score tables.
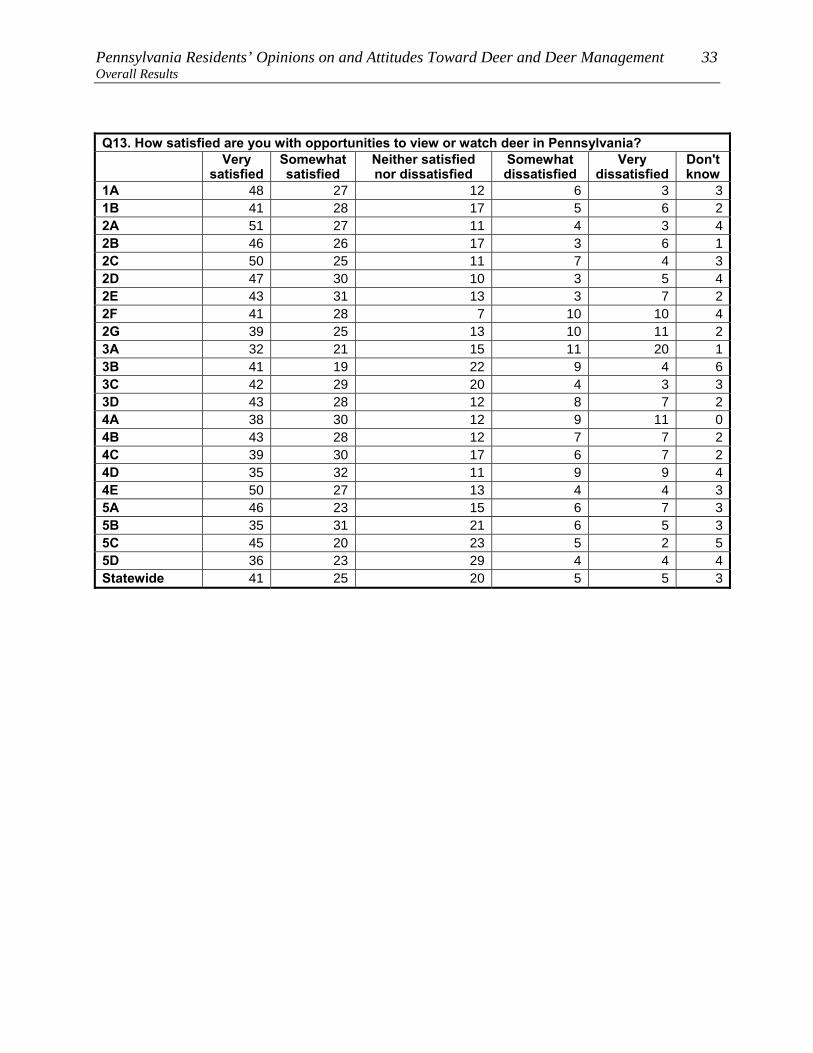
Pennsylvania Residents’ Opinions on and Attitudes Toward Deer and Deer Management 33 Overall Results
Q13. How satisfied are you with opportunities to view or watch deer in Pennsylvania?
Very satisfied
Somewhat satisfied
Neither satisfied nor dissatisfied
Somewhat dissatisfied
Very dissatisfied
Don't know
1A 48 27 12 6 3 31B 41 28 17 5 6 22A 51 27 11 4 3 42B 46 26 17 3 6 12C 50 25 11 7 4 32D 47 30 10 3 5 42E 43 31 13 3 7 22F 41 28 7 10 10 42G 39 25 13 10 11 23A 32 21 15 11 20 13B 41 19 22 9 4 63C 42 29 20 4 3 33D 43 28 12 8 7 24A 38 30 12 9 11 04B 43 28 12 7 7 24C 39 30 17 6 7 24D 35 32 11 9 9 44E 50 27 13 4 4 35A 46 23 15 6 7 35B 35 31 21 6 5 35C 45 20 23 5 2 55D 36 23 29 4 4 4Statewide 41 25 20 5 5 3

34 Responsive Management Overall Results
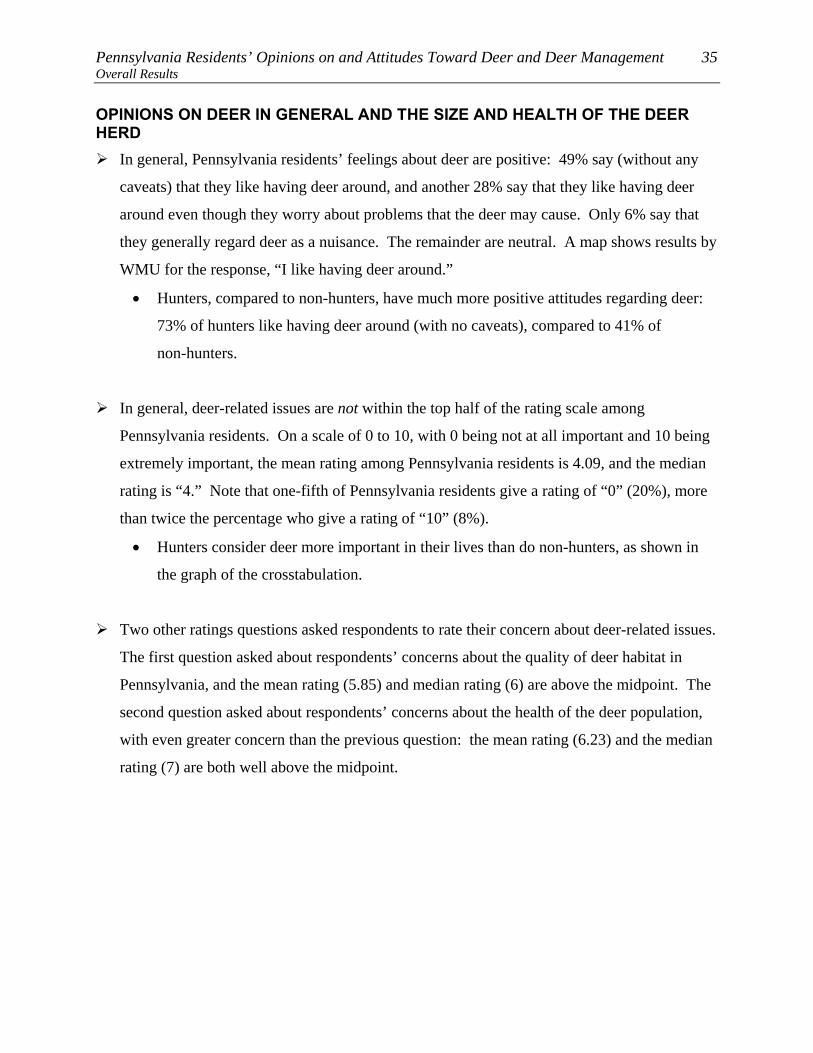
Pennsylvania Residents’ Opinions on and Attitudes Toward Deer and Deer Management 35 Overall Results OPINIONS ON DEER IN GENERAL AND THE SIZE AND HEALTH OF THE DEER HERD
In general, Pennsylvania residents’ feelings about deer are positive: 49% say (without any
caveats) that they like having deer around, and another 28% say that they like having deer
around even though they worry about problems that the deer may cause. Only 6% say that
they generally regard deer as a nuisance. The remainder are neutral. A map shows results by
WMU for the response, “I like having deer around.”
• Hunters, compared to non-hunters, have much more positive attitudes regarding deer:
73% of hunters like having deer around (with no caveats), compared to 41% of
non-hunters.
In general, deer-related issues are not within the top half of the rating scale among
Pennsylvania residents. On a scale of 0 to 10, with 0 being not at all important and 10 being
extremely important, the mean rating among Pennsylvania residents is 4.09, and the median
rating is “4.” Note that one-fifth of Pennsylvania residents give a rating of “0” (20%), more
than twice the percentage who give a rating of “10” (8%).
• Hunters consider deer more important in their lives than do non-hunters, as shown in
the graph of the crosstabulation.
Two other ratings questions asked respondents to rate their concern about deer-related issues.
The first question asked about respondents’ concerns about the quality of deer habitat in
Pennsylvania, and the mean rating (5.85) and median rating (6) are above the midpoint. The
second question asked about respondents’ concerns about the health of the deer population,
with even greater concern than the previous question: the mean rating (6.23) and the median
rating (7) are both well above the midpoint.

36 Responsive Management Overall Results
A majority of Pennsylvania residents (54%) say the deer population in their area is just right.
Otherwise, they are fairly evenly split, with 20% saying the deer population is too high, and
18% saying it is too low. Two maps are included showing results by WMU for the responses
“too high” and “too low.”
• Statewide, those Pennsylvania residents who own their home are slightly more likely to
say that the deer population is too high, relative to those who do not own their home.
• Those Pennsylvania residents who consider themselves a hunter are far more likely to
say that the deer population in their area is too low, compared to those who do not
consider themselves to be a hunter.
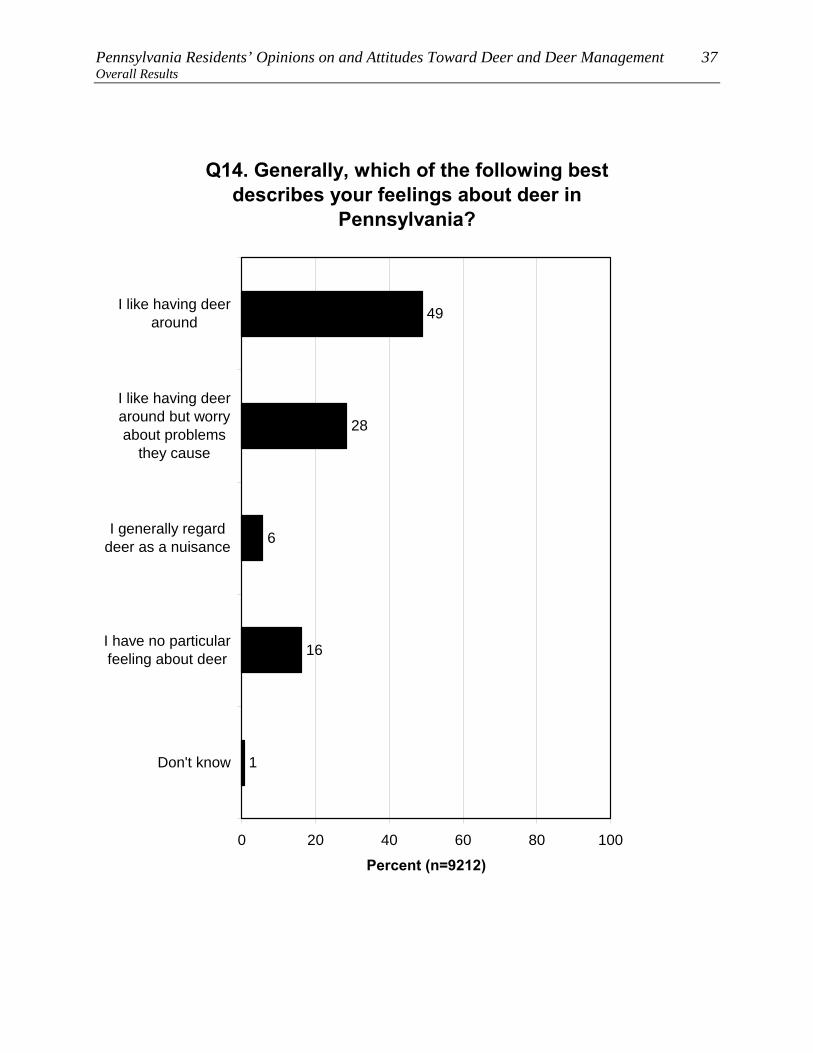
Pennsylvania Residents’ Opinions on and Attitudes Toward Deer and Deer Management 37 Overall Results
Q14. Generally, which of the following best describes your feelings about deer in
Pennsylvania?
49
28
6
16
1
0 20 40 60 80 100
I like having deeraround
I like having deeraround but worryabout problems
they cause
I generally regarddeer as a nuisance
I have no particularfeeling about deer
Don't know
Percent (n=9212)

38 Responsive Management Overall Results
Q14. Generally, which of the following best describes your feelings about deer in
Pennsylvania?
73
16
3
7
1
7
33
41
19
1
0 20 40 60 80 100
I like having deeraround
I like having deeraround but worryabout problems
they cause
I generally regarddeer as anuisance
I have noparticular feeling
about deer
Don't know
Percent
Consider themselves ahunter (n=3285)Do not consider themselvesa hunter (n=5906)

Pennsylvania Residents’ Opinions on and Attitudes Toward Deer and Deer Management 39 Overall Results
Q14. Generally, which of the following best describes your feelings about deer in Pennsylvania?
I like
having deer
around
I like having deer around but worry about problems
they cause
I generally regard deer as
a nuisance
I have no particular
feeling about deer
Don't know
1A 54 26 6 13 11B 58 28 5 9 12A 48 30 7 15 12B 41 34 8 16 12C 58 21 4 16 12D 55 26 4 15 02E 59 21 5 14 12F 66 20 2 11 02G 73 11 3 12 03A 72 14 3 12 03B 60 19 3 18 03C 54 20 6 19 13D 57 25 4 14 04A 66 16 3 14 14B 70 16 2 11 04C 61 24 2 13 04D 68 17 1 12 24E 61 26 3 10 05A 63 17 1 18 05B 54 26 4 15 15C 42 37 8 13 05D 37 32 8 22 1Statewide 49 28 6 16 1
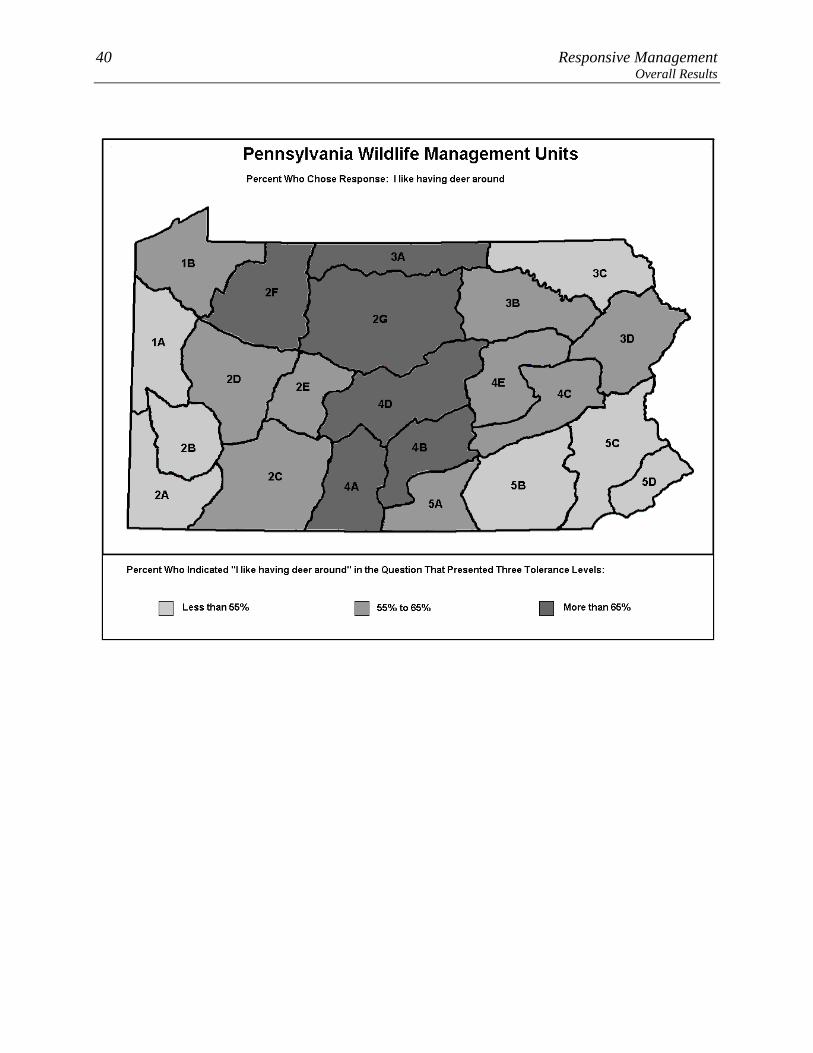
40 Responsive Management Overall Results

Pennsylvania Residents’ Opinions on and Attitudes Toward Deer and Deer Management 41 Overall Results
Q15. Compared to other issues in your life, how important to you, personally, are deer-related
issues on a scale of 0 to 10 where 0 is not at all important and 10 is extremely important?
9
8
6
8
2
7
6
6
19
8
20
2
0 20 40 60 80 100
10
9
8
7
6
5
4
3
2
1
0
Don't know
Percent (n=9212)
Mean = 4.09Median = 4

42 Responsive Management Overall Results
1. Considers deer-related issues as a 9 or 10 in importance as compared to other issues in his/her life
2. Has seen deer frequently on his/her property in the past 12 months (p < 0.001). 3. Considers himself/herself to be a hunter (p < 0.001). 3. Has a valid 2011 PA general hunting license (p < 0.001). 3. Has taken a trip more than a mile from home for the primary purpose of viewing or watching deer in the past 12 months (p < 0.001). 3. Fed deer intentionally or put out attractants in the past 12 months (p < 0.001). 3. Has spent time viewing or watching deer around home in the past 12 months (p < 0.001). 3. Fed birds or make birdfeed available on his/her property in the past 12 months (p < 0.001). 3. Indicates that he/she or a family member hunts (p < 0.001). 3. Does not indicate being very or somewhat satisfied with opportunities to view or watch deer in PA (p < 0.001). 4. Does not strongly or moderately agree that deer populations should be managed for healthy and sustainable forest habitat (p < 0.001). 4. Does not strongly or moderately support fertility or birth control as a method of controlling deer populations in PA (p < 0.001). 4. Does not strongly or moderately support professionals or sharpshooters as a method of controlling deer populations in PA (p < 0.001). 4. Does not consider the deer population in his/her area to be too high (p < 0.001). 4. Does not strongly or moderately agree that deer populations should be managed for safe and acceptable levels of deer-human conflicts (p < 0.001). 4. Does not strongly or moderately support lethal methods to manage deer populations in PA (p < 0.001). 4. Does not strongly or moderately agree that deer populations should be managed for healthy and sustainable deer populations (p < 0.001). 4. Does not strongly or moderately support legal, regulated hunting as a method of controlling deer populations in PA (p < 0.01). 5. Rates concern about tick-borne diseases in PA as a 9 or a 10 (p < 0.001). 5. Strongly or moderately agrees that it is OK for private citizens to feed or attract deer in PA (p < 0.001). 5. Does not indicate having experienced any problems with deer at his/her primary place of residence in the past 12 months (p < 0.01). 5. Rates concern about deer droppings in their yard as a 9 or a 10 (p < 0.05). 5. Rates concern about deer-vehicle accidents in PA as a 9 or 10 (p < 0.05). 5. Indicates that he/she or another person living in the immediate household has been in a vehicle collision with or an accident involving a deer on PA's roads or highways in the past 12 months (p < 0.05). 6. Rates concern about the quality of deer habitat in PA as a 9 or 10 (p < 0.001). 6. Rates concern about the health of the deer population in PA as a 9 or 10 (p < 0.001). 6. Rates concern about deer impacts on the habitat and other wildlife in PA as a 9 or 10 (p < 0.001). 7. Does not indicate using social media, such as Facebook, Twitter, or YouTube (p < 0.001). 7. Does not indicate using Facebook (including not using any social media) (p < 0.001). 8. Is more than median age (p < 0.001). 8. Is male (p < 0.001). 8. Has lived at his/her primary place of residence for more than the median number of years (p < 0.001). 8. Does not consider place of residence to be an urban or suburban area (p < 0.001). 8. Lives in WMU 3A (p < 0.001). 8. Lives in WMU 4A (p < 0.001). 8. Primary place of residence is not a single-family home (p < 0.01). 8. Lives in WMU 2E (p < 0.01). 8. Has the median number or fewer people living in his/her household (p < 0.01). 8. Lives in WMU 2A (p < 0.05). See page 9 through 11 for explanation of how to interpret z-score tables.
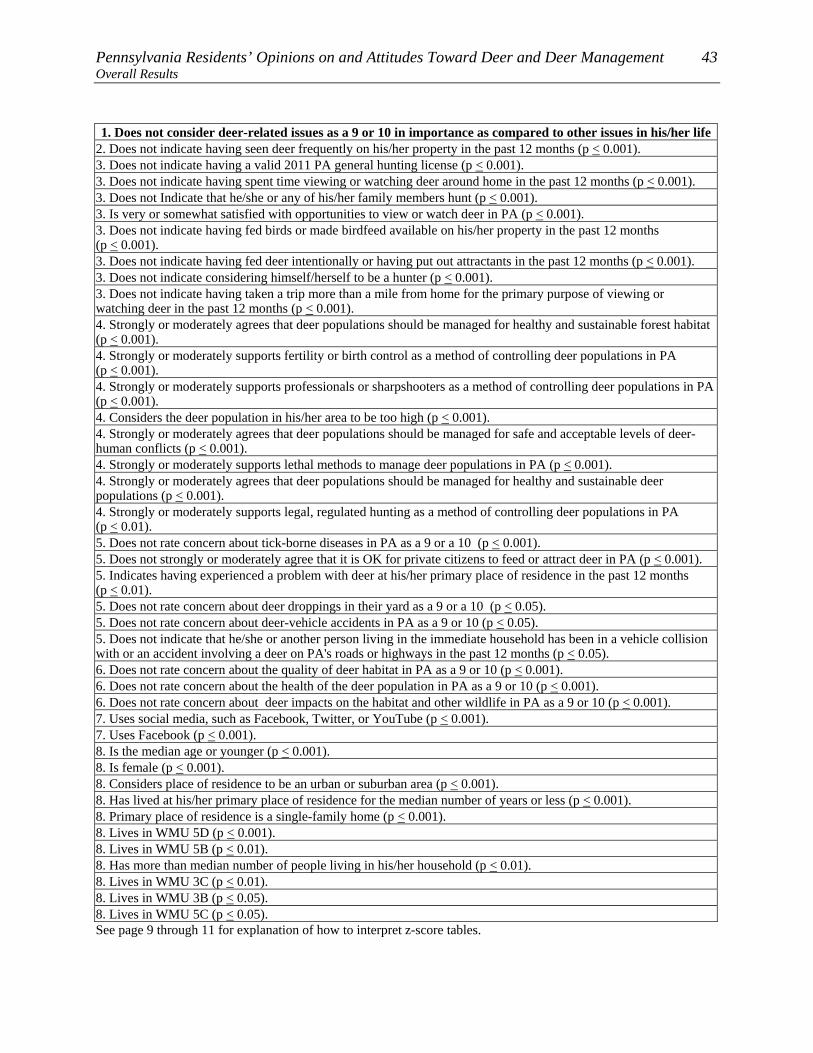
Pennsylvania Residents’ Opinions on and Attitudes Toward Deer and Deer Management 43 Overall Results 1. Does not consider deer-related issues as a 9 or 10 in importance as compared to other issues in his/her life
2. Does not indicate having seen deer frequently on his/her property in the past 12 months (p < 0.001). 3. Does not indicate having a valid 2011 PA general hunting license (p < 0.001). 3. Does not indicate having spent time viewing or watching deer around home in the past 12 months (p < 0.001). 3. Does not Indicate that he/she or any of his/her family members hunt (p < 0.001). 3. Is very or somewhat satisfied with opportunities to view or watch deer in PA (p < 0.001). 3. Does not indicate having fed birds or made birdfeed available on his/her property in the past 12 months (p < 0.001). 3. Does not indicate having fed deer intentionally or having put out attractants in the past 12 months (p < 0.001). 3. Does not indicate considering himself/herself to be a hunter (p < 0.001). 3. Does not indicate having taken a trip more than a mile from home for the primary purpose of viewing or watching deer in the past 12 months (p < 0.001). 4. Strongly or moderately agrees that deer populations should be managed for healthy and sustainable forest habitat (p < 0.001). 4. Strongly or moderately supports fertility or birth control as a method of controlling deer populations in PA (p < 0.001). 4. Strongly or moderately supports professionals or sharpshooters as a method of controlling deer populations in PA(p < 0.001). 4. Considers the deer population in his/her area to be too high (p < 0.001). 4. Strongly or moderately agrees that deer populations should be managed for safe and acceptable levels of deer-human conflicts (p < 0.001). 4. Strongly or moderately supports lethal methods to manage deer populations in PA (p < 0.001). 4. Strongly or moderately agrees that deer populations should be managed for healthy and sustainable deer populations (p < 0.001). 4. Strongly or moderately supports legal, regulated hunting as a method of controlling deer populations in PA (p < 0.01). 5. Does not rate concern about tick-borne diseases in PA as a 9 or a 10 (p < 0.001). 5. Does not strongly or moderately agree that it is OK for private citizens to feed or attract deer in PA (p < 0.001). 5. Indicates having experienced a problem with deer at his/her primary place of residence in the past 12 months (p < 0.01). 5. Does not rate concern about deer droppings in their yard as a 9 or a 10 (p < 0.05). 5. Does not rate concern about deer-vehicle accidents in PA as a 9 or 10 (p < 0.05). 5. Does not indicate that he/she or another person living in the immediate household has been in a vehicle collision with or an accident involving a deer on PA's roads or highways in the past 12 months (p < 0.05). 6. Does not rate concern about the quality of deer habitat in PA as a 9 or 10 (p < 0.001). 6. Does not rate concern about the health of the deer population in PA as a 9 or 10 (p < 0.001). 6. Does not rate concern about deer impacts on the habitat and other wildlife in PA as a 9 or 10 (p < 0.001). 7. Uses social media, such as Facebook, Twitter, or YouTube (p < 0.001). 7. Uses Facebook (p < 0.001). 8. Is the median age or younger (p < 0.001). 8. Is female (p < 0.001). 8. Considers place of residence to be an urban or suburban area (p < 0.001). 8. Has lived at his/her primary place of residence for the median number of years or less (p < 0.001). 8. Primary place of residence is a single-family home (p < 0.001). 8. Lives in WMU 5D (p < 0.001). 8. Lives in WMU 5B (p < 0.01). 8. Has more than median number of people living in his/her household (p < 0.01). 8. Lives in WMU 3C (p < 0.01). 8. Lives in WMU 3B (p < 0.05). 8. Lives in WMU 5C (p < 0.05). See page 9 through 11 for explanation of how to interpret z-score tables.

44 Responsive Management Overall Results
Q15. Compared to other issues in your life, how important to you, personally, are deer-related
issues on a scale of 0 to 10 where 0 is not at all important and 10 is extremely important?
6
5
5
15
5
12
11
7
19
3
10
21
23
10
10
8
5
1
6
4
6
19
7
0 20 40 60 80 100
10
9
8
7
6
5
4
3
2
1
0
Don't know
Percent
Consider themselves ahunter (n=3285)Do not consider themselvesa hunter (n=5906)
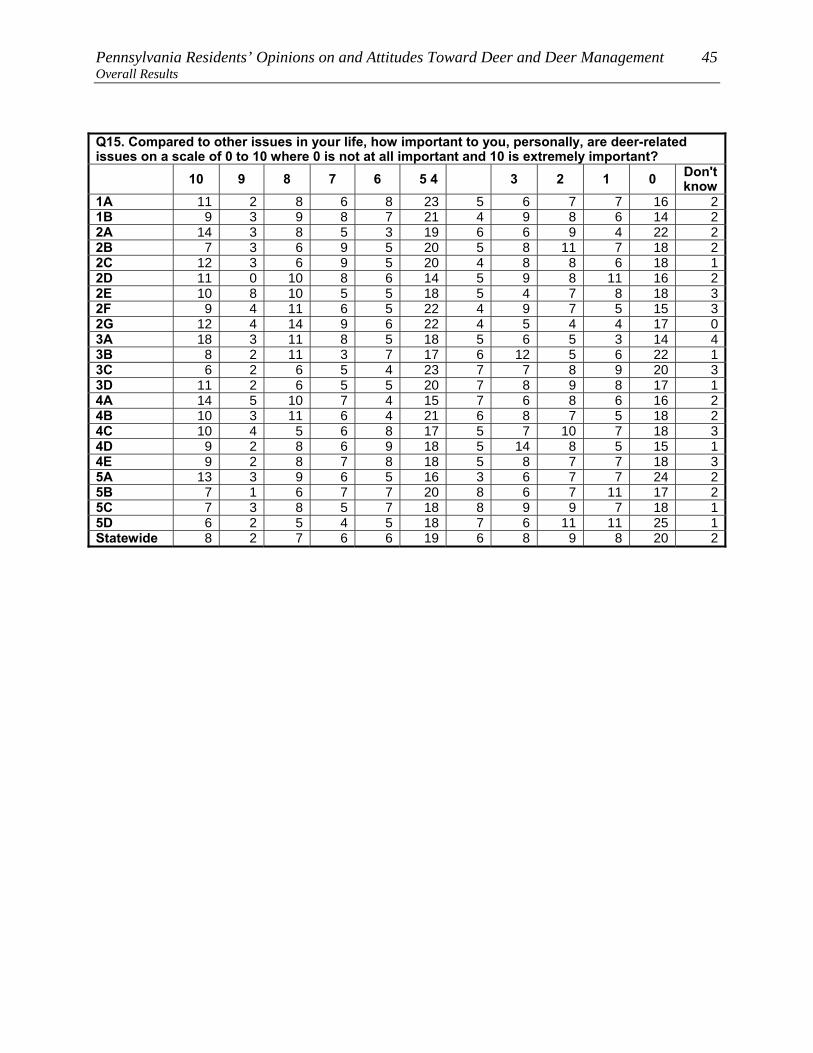
Pennsylvania Residents’ Opinions on and Attitudes Toward Deer and Deer Management 45 Overall Results
Q15. Compared to other issues in your life, how important to you, personally, are deer-related issues on a scale of 0 to 10 where 0 is not at all important and 10 is extremely important?
10 9 8 7 6 5 4 3 2 1 0 Don't know
1A 11 2 8 6 8 23 5 6 7 7 16 21B 9 3 9 8 7 21 4 9 8 6 14 22A 14 3 8 5 3 19 6 6 9 4 22 22B 7 3 6 9 5 20 5 8 11 7 18 22C 12 3 6 9 5 20 4 8 8 6 18 12D 11 0 10 8 6 14 5 9 8 11 16 22E 10 8 10 5 5 18 5 4 7 8 18 32F 9 4 11 6 5 22 4 9 7 5 15 32G 12 4 14 9 6 22 4 5 4 4 17 03A 18 3 11 8 5 18 5 6 5 3 14 43B 8 2 11 3 7 17 6 12 5 6 22 13C 6 2 6 5 4 23 7 7 8 9 20 33D 11 2 6 5 5 20 7 8 9 8 17 14A 14 5 10 7 4 15 7 6 8 6 16 24B 10 3 11 6 4 21 6 8 7 5 18 24C 10 4 5 6 8 17 5 7 10 7 18 34D 9 2 8 6 9 18 5 14 8 5 15 14E 9 2 8 7 8 18 5 8 7 7 18 35A 13 3 9 6 5 16 3 6 7 7 24 25B 7 1 6 7 7 20 8 6 7 11 17 25C 7 3 8 5 7 18 8 9 9 7 18 15D 6 2 5 4 5 18 7 6 11 11 25 1Statewide 8 2 7 6 6 19 6 8 9 8 20 2
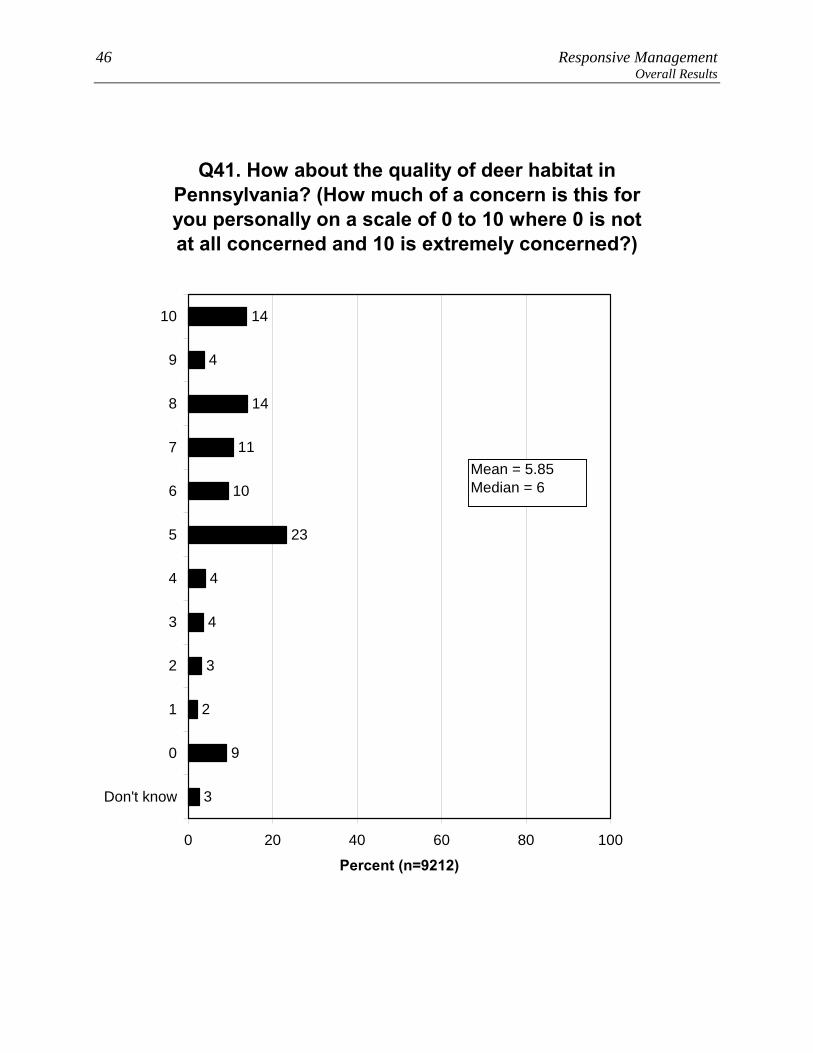
46 Responsive Management Overall Results
Q41. How about the quality of deer habitat in Pennsylvania? (How much of a concern is this for you personally on a scale of 0 to 10 where 0 is not at all concerned and 10 is extremely concerned?)
3
4
4
14
4
14
11
10
23
2
9
3
0 20 40 60 80 100
10
9
8
7
6
5
4
3
2
1
0
Don't know
Percent (n=9212)
Mean = 5.85Median = 6
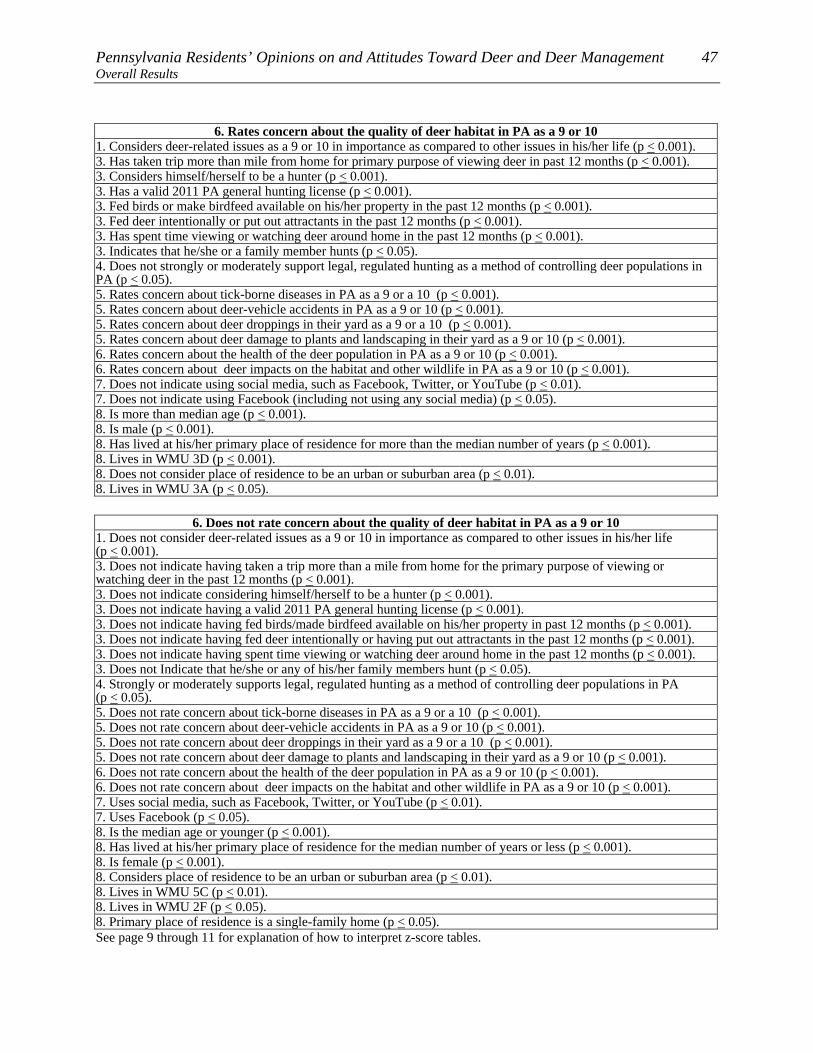
Pennsylvania Residents’ Opinions on and Attitudes Toward Deer and Deer Management 47 Overall Results
6. Rates concern about the quality of deer habitat in PA as a 9 or 10 1. Considers deer-related issues as a 9 or 10 in importance as compared to other issues in his/her life (p < 0.001). 3. Has taken trip more than mile from home for primary purpose of viewing deer in past 12 months (p < 0.001). 3. Considers himself/herself to be a hunter (p < 0.001). 3. Has a valid 2011 PA general hunting license (p < 0.001). 3. Fed birds or make birdfeed available on his/her property in the past 12 months (p < 0.001). 3. Fed deer intentionally or put out attractants in the past 12 months (p < 0.001). 3. Has spent time viewing or watching deer around home in the past 12 months (p < 0.001). 3. Indicates that he/she or a family member hunts (p < 0.05). 4. Does not strongly or moderately support legal, regulated hunting as a method of controlling deer populations in PA (p < 0.05). 5. Rates concern about tick-borne diseases in PA as a 9 or a 10 (p < 0.001). 5. Rates concern about deer-vehicle accidents in PA as a 9 or 10 (p < 0.001). 5. Rates concern about deer droppings in their yard as a 9 or a 10 (p < 0.001). 5. Rates concern about deer damage to plants and landscaping in their yard as a 9 or 10 (p < 0.001). 6. Rates concern about the health of the deer population in PA as a 9 or 10 (p < 0.001). 6. Rates concern about deer impacts on the habitat and other wildlife in PA as a 9 or 10 (p < 0.001). 7. Does not indicate using social media, such as Facebook, Twitter, or YouTube (p < 0.01). 7. Does not indicate using Facebook (including not using any social media) (p < 0.05). 8. Is more than median age (p < 0.001). 8. Is male (p < 0.001). 8. Has lived at his/her primary place of residence for more than the median number of years (p < 0.001). 8. Lives in WMU 3D (p < 0.001). 8. Does not consider place of residence to be an urban or suburban area (p < 0.01). 8. Lives in WMU 3A (p < 0.05).
6. Does not rate concern about the quality of deer habitat in PA as a 9 or 10 1. Does not consider deer-related issues as a 9 or 10 in importance as compared to other issues in his/her life (p < 0.001). 3. Does not indicate having taken a trip more than a mile from home for the primary purpose of viewing or watching deer in the past 12 months (p < 0.001). 3. Does not indicate considering himself/herself to be a hunter (p < 0.001). 3. Does not indicate having a valid 2011 PA general hunting license (p < 0.001). 3. Does not indicate having fed birds/made birdfeed available on his/her property in past 12 months (p < 0.001). 3. Does not indicate having fed deer intentionally or having put out attractants in the past 12 months (p < 0.001). 3. Does not indicate having spent time viewing or watching deer around home in the past 12 months (p < 0.001). 3. Does not Indicate that he/she or any of his/her family members hunt (p < 0.05). 4. Strongly or moderately supports legal, regulated hunting as a method of controlling deer populations in PA (p < 0.05). 5. Does not rate concern about tick-borne diseases in PA as a 9 or a 10 (p < 0.001). 5. Does not rate concern about deer-vehicle accidents in PA as a 9 or 10 (p < 0.001). 5. Does not rate concern about deer droppings in their yard as a 9 or a 10 (p < 0.001). 5. Does not rate concern about deer damage to plants and landscaping in their yard as a 9 or 10 (p < 0.001). 6. Does not rate concern about the health of the deer population in PA as a 9 or 10 (p < 0.001). 6. Does not rate concern about deer impacts on the habitat and other wildlife in PA as a 9 or 10 (p < 0.001). 7. Uses social media, such as Facebook, Twitter, or YouTube (p < 0.01). 7. Uses Facebook (p < 0.05). 8. Is the median age or younger (p < 0.001). 8. Has lived at his/her primary place of residence for the median number of years or less (p < 0.001). 8. Is female (p < 0.001). 8. Considers place of residence to be an urban or suburban area (p < 0.01). 8. Lives in WMU 5C (p < 0.01). 8. Lives in WMU 2F (p < 0.05). 8. Primary place of residence is a single-family home (p < 0.05). See page 9 through 11 for explanation of how to interpret z-score tables.

48 Responsive Management Overall Results
Q41. How about the quality of deer habitat in Pennsylvania? (How much of a concern is this for you personally on a scale of 0 to 10 where 0 is not at all concerned and 10 is extremely concerned?) 10 9 8 7 6 5 4 3 2 1 0 Don't
know1A 13 3 17 6 10 21 4 5 3 1 11 61B 12 6 16 14 7 19 3 5 3 1 9 32A 16 3 14 9 11 22 3 1 5 0 12 32B 12 4 16 11 10 22 3 4 3 1 9 32C 12 3 9 11 7 29 4 5 4 1 11 52D 13 2 12 8 11 24 4 3 2 1 15 52E 13 2 16 12 10 20 3 2 3 1 16 22F 12 2 23 13 8 21 2 3 2 3 9 22G 17 3 18 8 8 24 2 3 2 2 13 13A 14 8 15 8 6 23 2 3 4 1 11 53B 15 5 14 10 8 23 3 3 4 2 11 23C 14 2 14 10 6 26 2 2 2 2 12 73D 21 4 12 10 8 21 4 4 3 2 8 24A 16 3 19 8 5 21 5 5 3 2 12 14B 15 4 15 12 10 18 4 1 2 0 13 34C 16 5 16 8 12 20 4 3 4 1 9 34D 13 5 10 10 15 23 4 3 1 2 14 14E 13 6 14 14 9 25 4 2 2 0 9 25A 13 5 16 11 9 18 7 2 2 1 11 45B 14 4 14 10 13 24 4 5 3 3 4 25C 11 2 12 12 8 27 6 5 4 3 7 15D 16 4 14 11 8 23 4 3 3 3 9 2Statewide 14 4 14 11 10 23 4 4 3 2 9 3
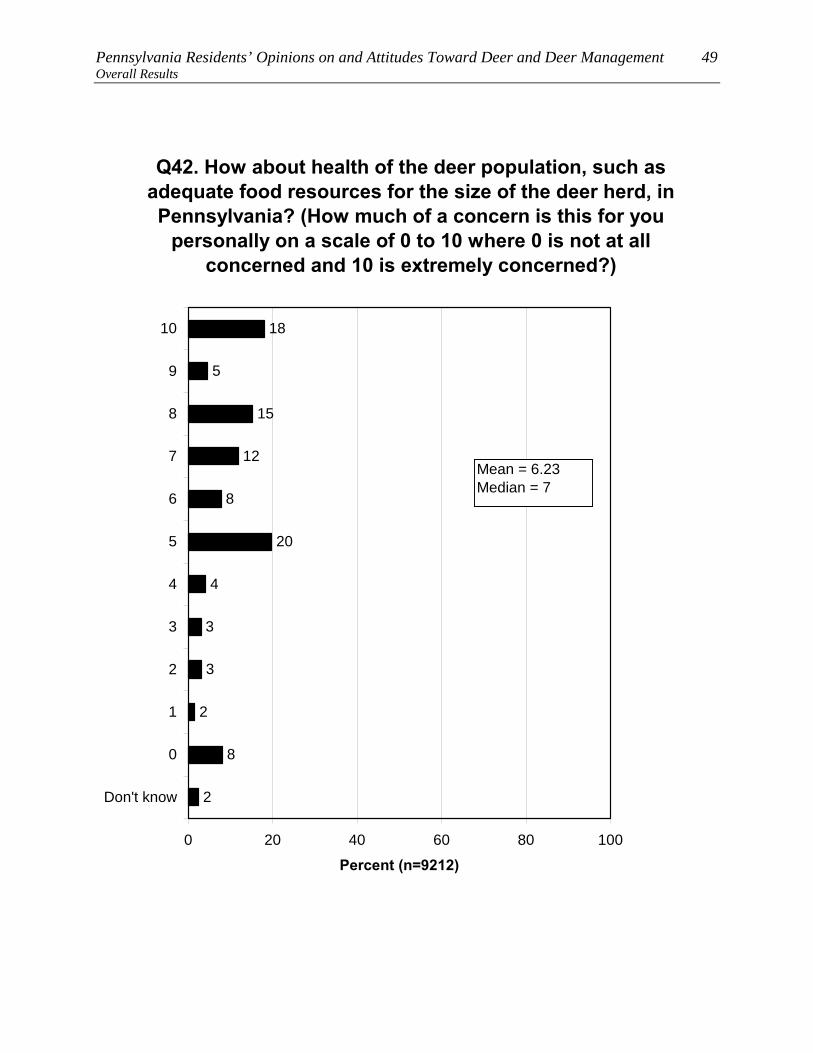
Pennsylvania Residents’ Opinions on and Attitudes Toward Deer and Deer Management 49 Overall Results
3
3
4
18
5
15
12
8
20
2
8
2
0 20 40 60 80 100
10
9
8
7
6
5
4
3
2
1
0
Don't know
Percent (n=9212)
Q42. How about health of the deer population, such as adequate food resources for the size of the deer herd, in Pennsylvania? (How much of a concern is this for you
personally on a scale of 0 to 10 where 0 is not at all concerned and 10 is extremely concerned?)
Mean = 6.23Median = 7
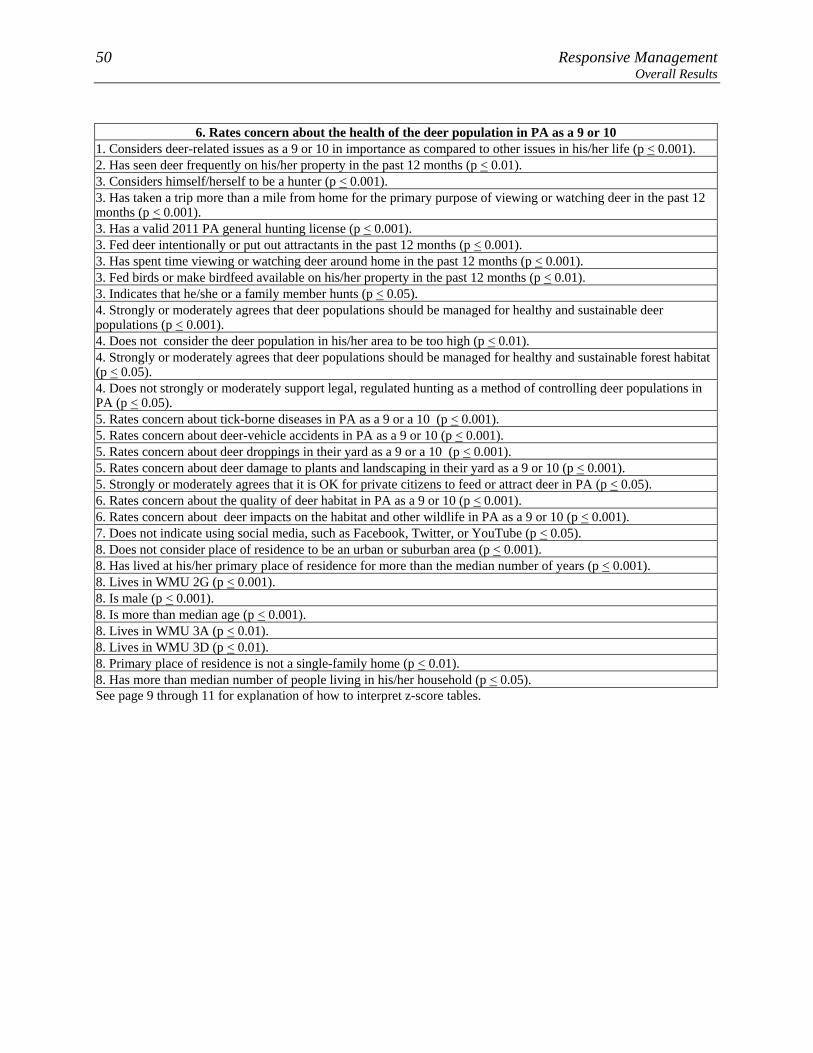
50 Responsive Management Overall Results
6. Rates concern about the health of the deer population in PA as a 9 or 10
1. Considers deer-related issues as a 9 or 10 in importance as compared to other issues in his/her life (p < 0.001). 2. Has seen deer frequently on his/her property in the past 12 months (p < 0.01). 3. Considers himself/herself to be a hunter (p < 0.001). 3. Has taken a trip more than a mile from home for the primary purpose of viewing or watching deer in the past 12 months (p < 0.001). 3. Has a valid 2011 PA general hunting license (p < 0.001). 3. Fed deer intentionally or put out attractants in the past 12 months (p < 0.001). 3. Has spent time viewing or watching deer around home in the past 12 months (p < 0.001). 3. Fed birds or make birdfeed available on his/her property in the past 12 months (p < 0.01). 3. Indicates that he/she or a family member hunts (p < 0.05). 4. Strongly or moderately agrees that deer populations should be managed for healthy and sustainable deer populations (p < 0.001). 4. Does not consider the deer population in his/her area to be too high (p < 0.01). 4. Strongly or moderately agrees that deer populations should be managed for healthy and sustainable forest habitat (p < 0.05). 4. Does not strongly or moderately support legal, regulated hunting as a method of controlling deer populations in PA (p < 0.05). 5. Rates concern about tick-borne diseases in PA as a 9 or a 10 (p < 0.001). 5. Rates concern about deer-vehicle accidents in PA as a 9 or 10 (p < 0.001). 5. Rates concern about deer droppings in their yard as a 9 or a 10 (p < 0.001). 5. Rates concern about deer damage to plants and landscaping in their yard as a 9 or 10 (p < 0.001). 5. Strongly or moderately agrees that it is OK for private citizens to feed or attract deer in PA (p < 0.05). 6. Rates concern about the quality of deer habitat in PA as a 9 or 10 (p < 0.001). 6. Rates concern about deer impacts on the habitat and other wildlife in PA as a 9 or 10 (p < 0.001). 7. Does not indicate using social media, such as Facebook, Twitter, or YouTube (p < 0.05). 8. Does not consider place of residence to be an urban or suburban area (p < 0.001). 8. Has lived at his/her primary place of residence for more than the median number of years (p < 0.001). 8. Lives in WMU 2G (p < 0.001). 8. Is male (p < 0.001). 8. Is more than median age (p < 0.001). 8. Lives in WMU 3A (p < 0.01). 8. Lives in WMU 3D (p < 0.01). 8. Primary place of residence is not a single-family home (p < 0.01). 8. Has more than median number of people living in his/her household (p < 0.05). See page 9 through 11 for explanation of how to interpret z-score tables.
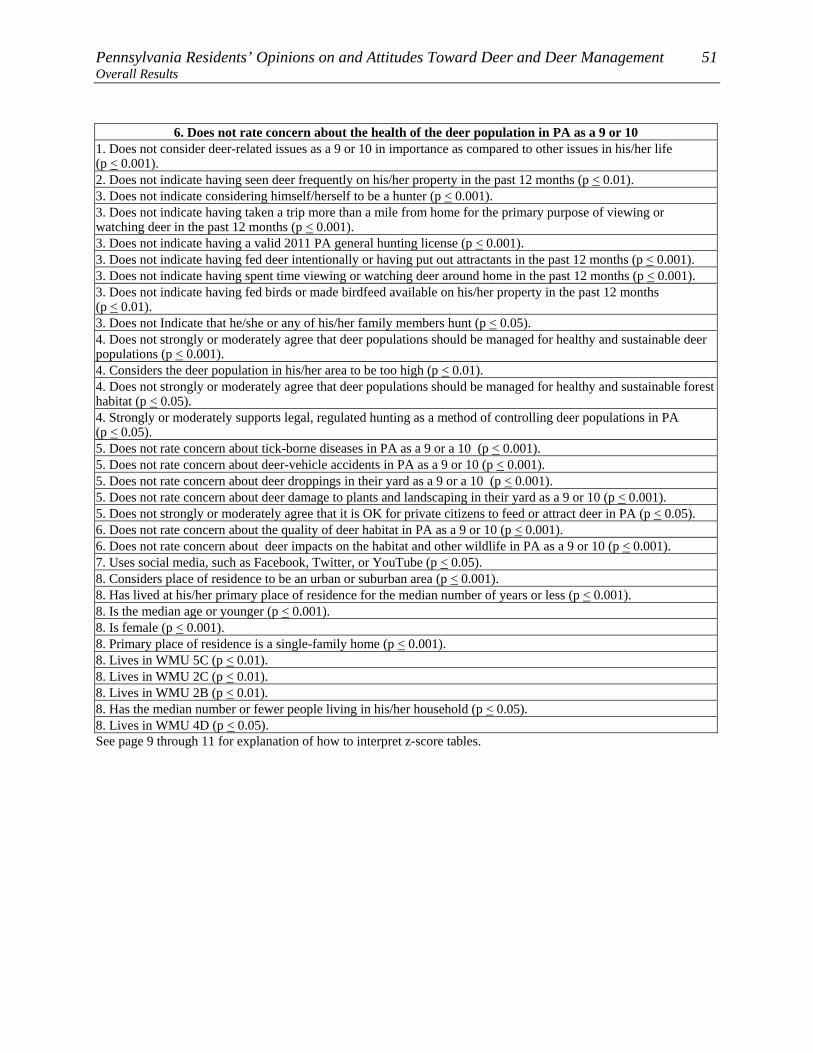
Pennsylvania Residents’ Opinions on and Attitudes Toward Deer and Deer Management 51 Overall Results
6. Does not rate concern about the health of the deer population in PA as a 9 or 10 1. Does not consider deer-related issues as a 9 or 10 in importance as compared to other issues in his/her life (p < 0.001). 2. Does not indicate having seen deer frequently on his/her property in the past 12 months (p < 0.01). 3. Does not indicate considering himself/herself to be a hunter (p < 0.001). 3. Does not indicate having taken a trip more than a mile from home for the primary purpose of viewing or watching deer in the past 12 months (p < 0.001). 3. Does not indicate having a valid 2011 PA general hunting license (p < 0.001). 3. Does not indicate having fed deer intentionally or having put out attractants in the past 12 months (p < 0.001). 3. Does not indicate having spent time viewing or watching deer around home in the past 12 months (p < 0.001). 3. Does not indicate having fed birds or made birdfeed available on his/her property in the past 12 months (p < 0.01). 3. Does not Indicate that he/she or any of his/her family members hunt (p < 0.05). 4. Does not strongly or moderately agree that deer populations should be managed for healthy and sustainable deer populations (p < 0.001). 4. Considers the deer population in his/her area to be too high (p < 0.01). 4. Does not strongly or moderately agree that deer populations should be managed for healthy and sustainable forest habitat (p < 0.05). 4. Strongly or moderately supports legal, regulated hunting as a method of controlling deer populations in PA (p < 0.05). 5. Does not rate concern about tick-borne diseases in PA as a 9 or a 10 (p < 0.001). 5. Does not rate concern about deer-vehicle accidents in PA as a 9 or 10 (p < 0.001). 5. Does not rate concern about deer droppings in their yard as a 9 or a 10 (p < 0.001). 5. Does not rate concern about deer damage to plants and landscaping in their yard as a 9 or 10 (p < 0.001). 5. Does not strongly or moderately agree that it is OK for private citizens to feed or attract deer in PA (p < 0.05). 6. Does not rate concern about the quality of deer habitat in PA as a 9 or 10 (p < 0.001). 6. Does not rate concern about deer impacts on the habitat and other wildlife in PA as a 9 or 10 (p < 0.001). 7. Uses social media, such as Facebook, Twitter, or YouTube (p < 0.05). 8. Considers place of residence to be an urban or suburban area (p < 0.001). 8. Has lived at his/her primary place of residence for the median number of years or less (p < 0.001). 8. Is the median age or younger (p < 0.001). 8. Is female (p < 0.001). 8. Primary place of residence is a single-family home (p < 0.001). 8. Lives in WMU 5C (p < 0.01). 8. Lives in WMU 2C (p < 0.01). 8. Lives in WMU 2B (p < 0.01). 8. Has the median number or fewer people living in his/her household (p < 0.05). 8. Lives in WMU 4D (p < 0.05). See page 9 through 11 for explanation of how to interpret z-score tables.
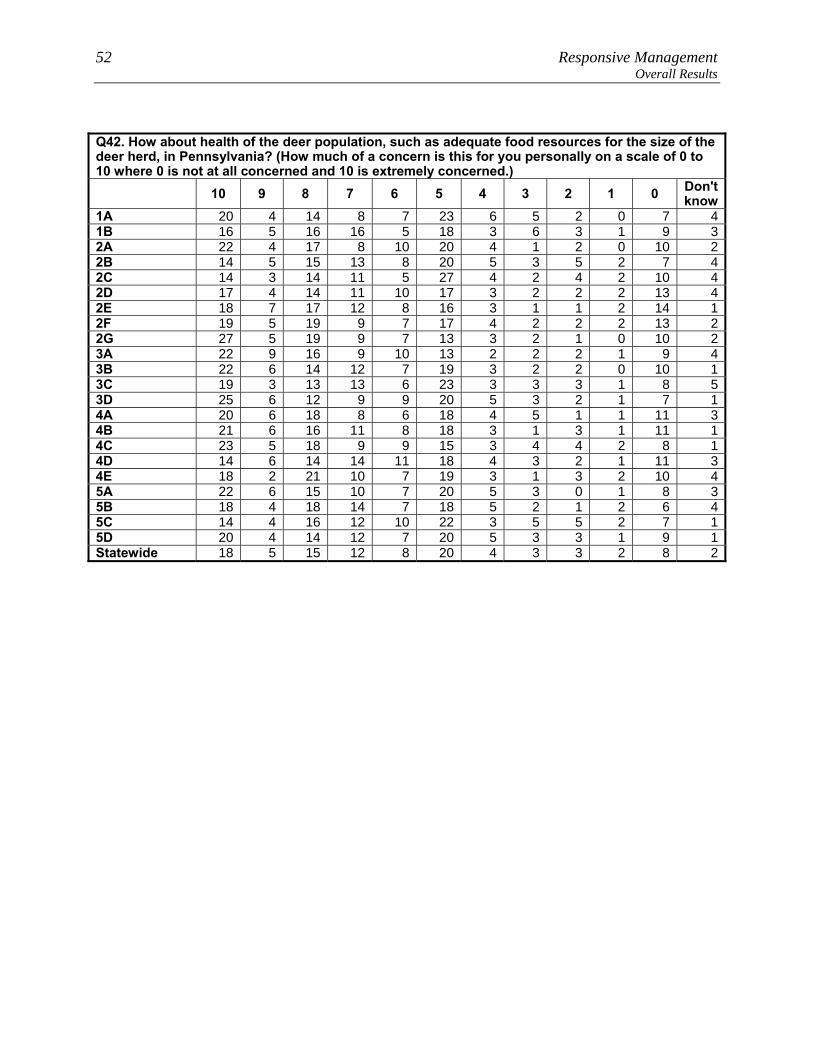
52 Responsive Management Overall Results
Q42. How about health of the deer population, such as adequate food resources for the size of the deer herd, in Pennsylvania? (How much of a concern is this for you personally on a scale of 0 to 10 where 0 is not at all concerned and 10 is extremely concerned.) 10 9 8 7 6 5 4 3 2 1 0 Don't
know1A 20 4 14 8 7 23 6 5 2 0 7 41B 16 5 16 16 5 18 3 6 3 1 9 32A 22 4 17 8 10 20 4 1 2 0 10 22B 14 5 15 13 8 20 5 3 5 2 7 42C 14 3 14 11 5 27 4 2 4 2 10 42D 17 4 14 11 10 17 3 2 2 2 13 42E 18 7 17 12 8 16 3 1 1 2 14 12F 19 5 19 9 7 17 4 2 2 2 13 22G 27 5 19 9 7 13 3 2 1 0 10 23A 22 9 16 9 10 13 2 2 2 1 9 43B 22 6 14 12 7 19 3 2 2 0 10 13C 19 3 13 13 6 23 3 3 3 1 8 53D 25 6 12 9 9 20 5 3 2 1 7 14A 20 6 18 8 6 18 4 5 1 1 11 34B 21 6 16 11 8 18 3 1 3 1 11 14C 23 5 18 9 9 15 3 4 4 2 8 14D 14 6 14 14 11 18 4 3 2 1 11 34E 18 2 21 10 7 19 3 1 3 2 10 45A 22 6 15 10 7 20 5 3 0 1 8 35B 18 4 18 14 7 18 5 2 1 2 6 45C 14 4 16 12 10 22 3 5 5 2 7 15D 20 4 14 12 7 20 5 3 3 1 9 1Statewide 18 5 15 12 8 20 4 3 3 2 8 2

Pennsylvania Residents’ Opinions on and Attitudes Toward Deer and Deer Management 53 Overall Results
Q16. In your opinion, is the deer population in the area where you live too high, just right, or too low?
20
54
18
8
0 20 40 60 80 100
Too high
Just right
Too low
Don't know
Percent (n=9212)
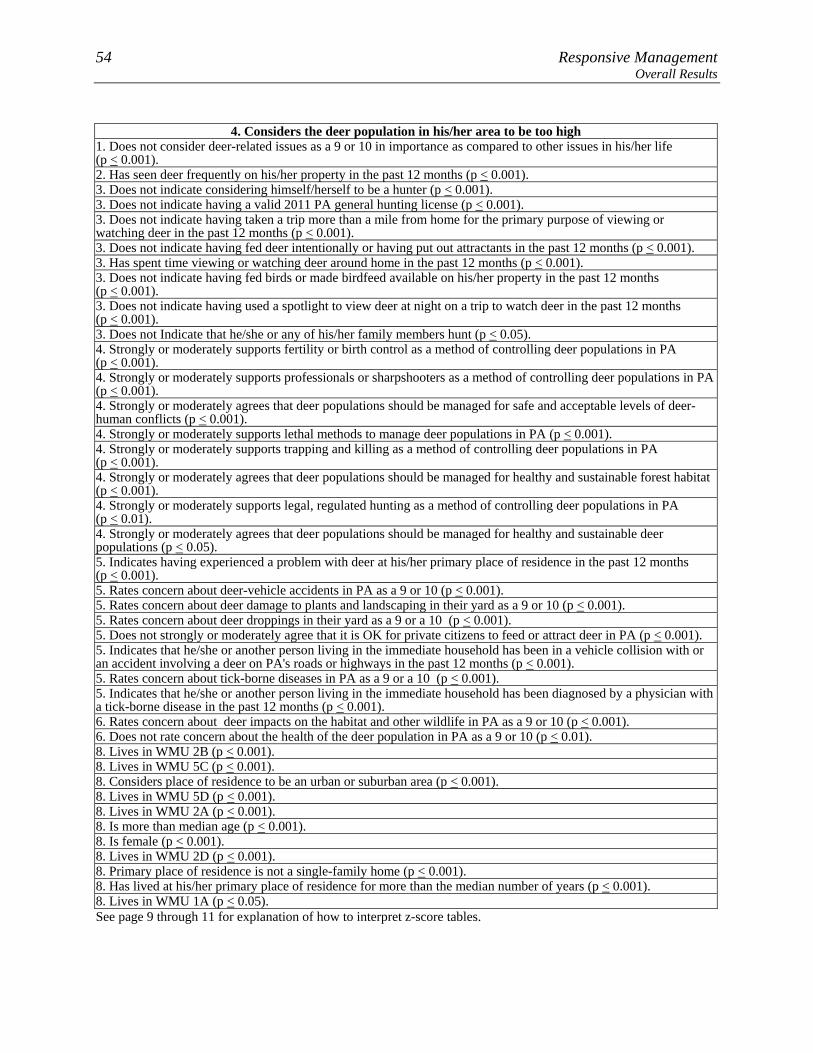
54 Responsive Management Overall Results
4. Considers the deer population in his/her area to be too high
1. Does not consider deer-related issues as a 9 or 10 in importance as compared to other issues in his/her life (p < 0.001). 2. Has seen deer frequently on his/her property in the past 12 months (p < 0.001). 3. Does not indicate considering himself/herself to be a hunter (p < 0.001). 3. Does not indicate having a valid 2011 PA general hunting license (p < 0.001). 3. Does not indicate having taken a trip more than a mile from home for the primary purpose of viewing or watching deer in the past 12 months (p < 0.001). 3. Does not indicate having fed deer intentionally or having put out attractants in the past 12 months (p < 0.001). 3. Has spent time viewing or watching deer around home in the past 12 months (p < 0.001). 3. Does not indicate having fed birds or made birdfeed available on his/her property in the past 12 months (p < 0.001). 3. Does not indicate having used a spotlight to view deer at night on a trip to watch deer in the past 12 months (p < 0.001). 3. Does not Indicate that he/she or any of his/her family members hunt (p < 0.05). 4. Strongly or moderately supports fertility or birth control as a method of controlling deer populations in PA (p < 0.001). 4. Strongly or moderately supports professionals or sharpshooters as a method of controlling deer populations in PA(p < 0.001). 4. Strongly or moderately agrees that deer populations should be managed for safe and acceptable levels of deer-human conflicts (p < 0.001). 4. Strongly or moderately supports lethal methods to manage deer populations in PA (p < 0.001). 4. Strongly or moderately supports trapping and killing as a method of controlling deer populations in PA (p < 0.001). 4. Strongly or moderately agrees that deer populations should be managed for healthy and sustainable forest habitat (p < 0.001). 4. Strongly or moderately supports legal, regulated hunting as a method of controlling deer populations in PA (p < 0.01). 4. Strongly or moderately agrees that deer populations should be managed for healthy and sustainable deer populations (p < 0.05). 5. Indicates having experienced a problem with deer at his/her primary place of residence in the past 12 months (p < 0.001). 5. Rates concern about deer-vehicle accidents in PA as a 9 or 10 (p < 0.001). 5. Rates concern about deer damage to plants and landscaping in their yard as a 9 or 10 (p < 0.001). 5. Rates concern about deer droppings in their yard as a 9 or a 10 (p < 0.001). 5. Does not strongly or moderately agree that it is OK for private citizens to feed or attract deer in PA (p < 0.001). 5. Indicates that he/she or another person living in the immediate household has been in a vehicle collision with or an accident involving a deer on PA's roads or highways in the past 12 months (p < 0.001). 5. Rates concern about tick-borne diseases in PA as a 9 or a 10 (p < 0.001). 5. Indicates that he/she or another person living in the immediate household has been diagnosed by a physician with a tick-borne disease in the past 12 months (p < 0.001). 6. Rates concern about deer impacts on the habitat and other wildlife in PA as a 9 or 10 (p < 0.001). 6. Does not rate concern about the health of the deer population in PA as a 9 or 10 (p < 0.01). 8. Lives in WMU 2B (p < 0.001). 8. Lives in WMU 5C (p < 0.001). 8. Considers place of residence to be an urban or suburban area (p < 0.001). 8. Lives in WMU 5D (p < 0.001). 8. Lives in WMU 2A (p < 0.001). 8. Is more than median age (p < 0.001). 8. Is female (p < 0.001). 8. Lives in WMU 2D (p < 0.001). 8. Primary place of residence is not a single-family home (p < 0.001). 8. Has lived at his/her primary place of residence for more than the median number of years (p < 0.001). 8. Lives in WMU 1A (p < 0.05). See page 9 through 11 for explanation of how to interpret z-score tables.
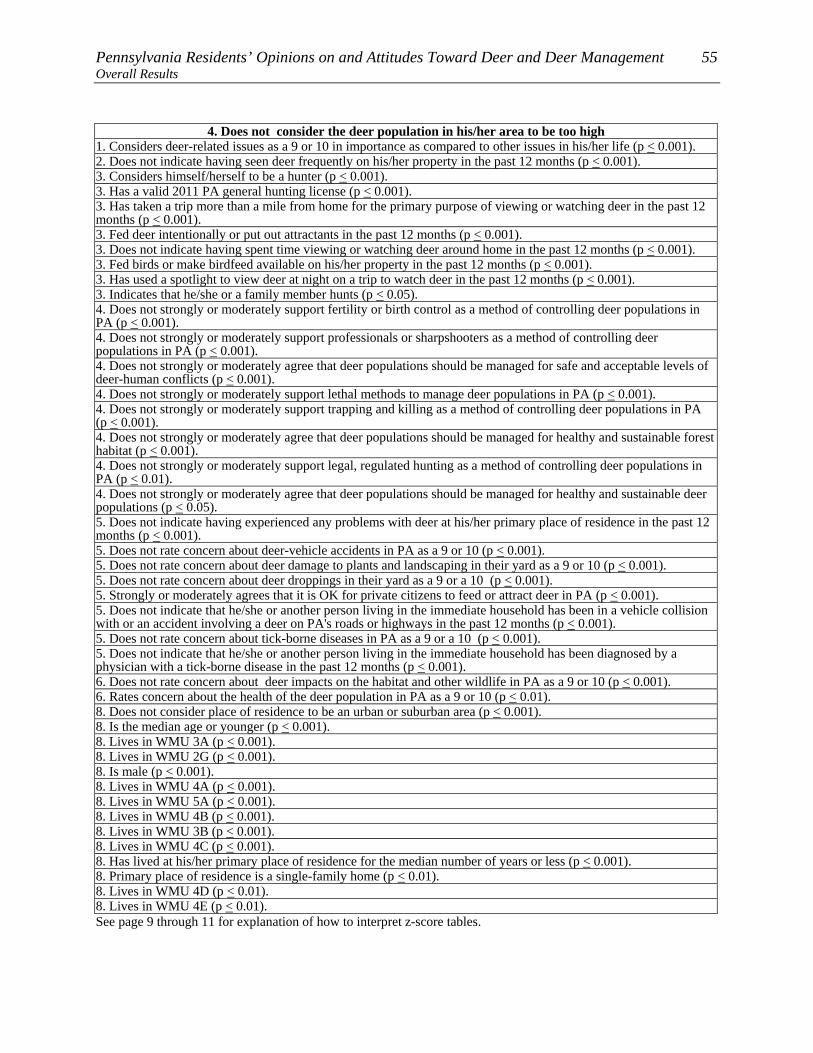
Pennsylvania Residents’ Opinions on and Attitudes Toward Deer and Deer Management 55 Overall Results
4. Does not consider the deer population in his/her area to be too high 1. Considers deer-related issues as a 9 or 10 in importance as compared to other issues in his/her life (p < 0.001). 2. Does not indicate having seen deer frequently on his/her property in the past 12 months (p < 0.001). 3. Considers himself/herself to be a hunter (p < 0.001). 3. Has a valid 2011 PA general hunting license (p < 0.001). 3. Has taken a trip more than a mile from home for the primary purpose of viewing or watching deer in the past 12 months (p < 0.001). 3. Fed deer intentionally or put out attractants in the past 12 months (p < 0.001). 3. Does not indicate having spent time viewing or watching deer around home in the past 12 months (p < 0.001). 3. Fed birds or make birdfeed available on his/her property in the past 12 months (p < 0.001). 3. Has used a spotlight to view deer at night on a trip to watch deer in the past 12 months (p < 0.001). 3. Indicates that he/she or a family member hunts (p < 0.05). 4. Does not strongly or moderately support fertility or birth control as a method of controlling deer populations in PA (p < 0.001). 4. Does not strongly or moderately support professionals or sharpshooters as a method of controlling deer populations in PA (p < 0.001). 4. Does not strongly or moderately agree that deer populations should be managed for safe and acceptable levels of deer-human conflicts (p < 0.001). 4. Does not strongly or moderately support lethal methods to manage deer populations in PA (p < 0.001). 4. Does not strongly or moderately support trapping and killing as a method of controlling deer populations in PA (p < 0.001). 4. Does not strongly or moderately agree that deer populations should be managed for healthy and sustainable forest habitat (p < 0.001). 4. Does not strongly or moderately support legal, regulated hunting as a method of controlling deer populations in PA (p < 0.01). 4. Does not strongly or moderately agree that deer populations should be managed for healthy and sustainable deer populations (p < 0.05). 5. Does not indicate having experienced any problems with deer at his/her primary place of residence in the past 12 months (p < 0.001). 5. Does not rate concern about deer-vehicle accidents in PA as a 9 or 10 (p < 0.001). 5. Does not rate concern about deer damage to plants and landscaping in their yard as a 9 or 10 (p < 0.001). 5. Does not rate concern about deer droppings in their yard as a 9 or a 10 (p < 0.001). 5. Strongly or moderately agrees that it is OK for private citizens to feed or attract deer in PA (p < 0.001). 5. Does not indicate that he/she or another person living in the immediate household has been in a vehicle collision with or an accident involving a deer on PA's roads or highways in the past 12 months (p < 0.001). 5. Does not rate concern about tick-borne diseases in PA as a 9 or a 10 (p < 0.001). 5. Does not indicate that he/she or another person living in the immediate household has been diagnosed by a physician with a tick-borne disease in the past 12 months (p < 0.001). 6. Does not rate concern about deer impacts on the habitat and other wildlife in PA as a 9 or 10 (p < 0.001). 6. Rates concern about the health of the deer population in PA as a 9 or 10 (p < 0.01). 8. Does not consider place of residence to be an urban or suburban area (p < 0.001). 8. Is the median age or younger (p < 0.001). 8. Lives in WMU 3A (p < 0.001). 8. Lives in WMU 2G (p < 0.001). 8. Is male (p < 0.001). 8. Lives in WMU 4A (p < 0.001). 8. Lives in WMU 5A (p < 0.001). 8. Lives in WMU 4B (p < 0.001). 8. Lives in WMU 3B (p < 0.001). 8. Lives in WMU 4C (p < 0.001). 8. Has lived at his/her primary place of residence for the median number of years or less (p < 0.001). 8. Primary place of residence is a single-family home (p < 0.01). 8. Lives in WMU 4D (p < 0.01). 8. Lives in WMU 4E (p < 0.01). See page 9 through 11 for explanation of how to interpret z-score tables.

56 Responsive Management Overall Results
Q16. In your opinion, is the deer population in the area where you live too high, just right, or too low?
22
53
18
7
18
56
16
10
0 20 40 60 80 100
Too high
Just right
Too low
Don't know
Percent
Owns home (n=7617)
Does not own home(n=589)

Pennsylvania Residents’ Opinions on and Attitudes Toward Deer and Deer Management 57 Overall Results
Q16. In your opinion, is the deer population in the area where you live too high, just right, or too low?
13
46
38
3
11
57
22
10
0 20 40 60 80 100
Too high
Just right
Too low
Don't know
Percent
Consider themselves ahunter (n=3285)Do not consider themselvesa hunter (n=5906)

58 Responsive Management Overall Results
Q16. In your opinion, is the deer population in the area where you live too high, just right, or too low?
Too high Just right Too low Don't
know 1A 16 54 23 61B 11 56 26 82A 25 56 13 72B 32 52 9 72C 13 50 26 102D 23 52 19 72E 13 48 31 82F 10 39 42 102G 3 39 55 33A 3 32 59 63B 7 59 24 103C 10 61 20 93D 13 57 24 64A 4 45 42 94B 6 53 33 84C 7 56 26 114D 8 46 38 84E 8 58 28 65A 5 58 25 125B 13 58 21 85C 30 55 9 75D 25 55 10 11Statewide 20 54 18 8

Pennsylvania Residents’ Opinions on and Attitudes Toward Deer and Deer Management 59 Overall Results
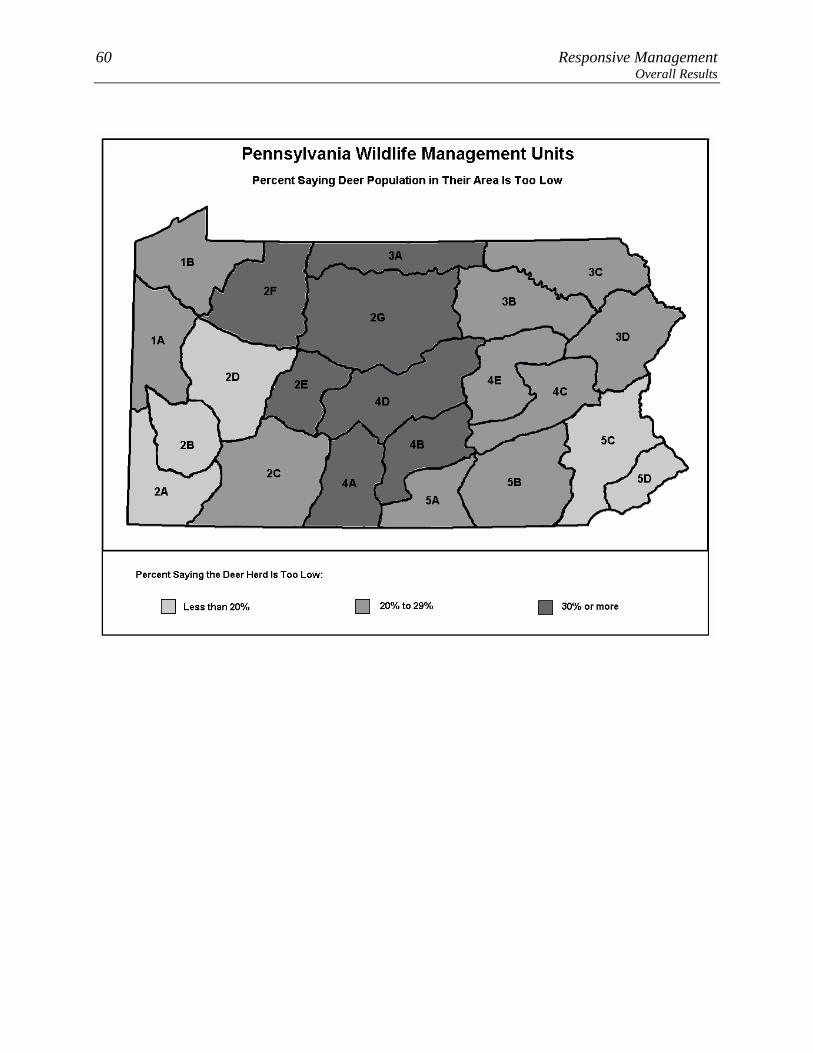
60 Responsive Management Overall Results

Pennsylvania Residents’ Opinions on and Attitudes Toward Deer and Deer Management 61 Overall Results OPINIONS ON MANAGEMENT EFFORTS AND MANAGEMENT GOALS
The survey asked about three deer population management goals. For all three, a large
majority agree with the management goal: 91% agree with managing for healthy and
sustainable deer populations, 89% agree with managing the deer for a healthy and sustainable
forest habitat, and 84% agree with managing for safe, acceptable levels of deer-human
conflicts. The ecological goals are both slightly higher than the human-centered goal.
Pennsylvania residents who said that the deer population in their area is too high or too low
were asked to indicate the reasonable number of years it should take to achieve an acceptable
deer population. A relatively large percentage of respondents to this question did not know
what a reasonable time would be: 34% indicated “don’t know.” Otherwise, the most
common answer is 5 years (21% gave this answer). The mean is 4.77 years, and the median
is 4 years.
• Because management plans typically look at a time frame of about 10 years to effect
change, the survey specifically asked if these respondents would be willing to wait
more than 10 years to achieve an acceptable deer population: just over half of
Pennsylvania residents (53%) indicated that they would be willing to wait that long.
However, 42% indicated an unwillingness to wait that long.
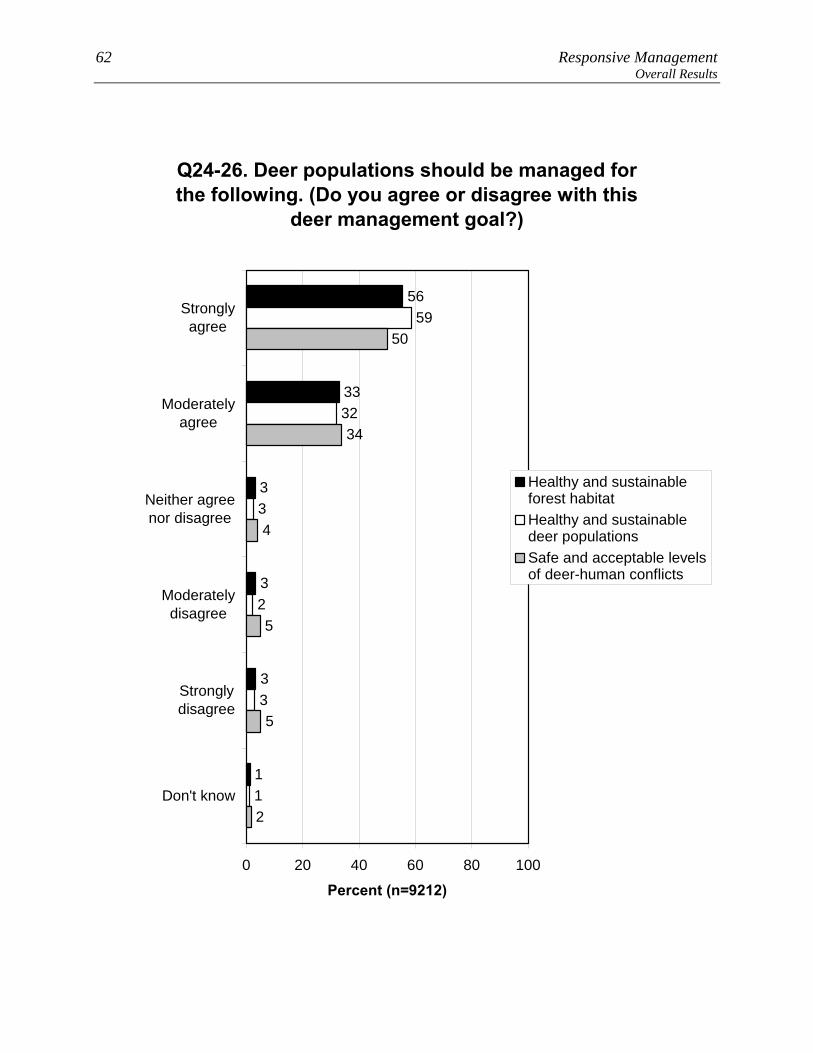
62 Responsive Management Overall Results
Q24-26. Deer populations should be managed for the following. (Do you agree or disagree with this
deer management goal?)
56
33
3
3
3
1
3
32
59
2
3
1
5
50
34
4
5
2
0 20 40 60 80 100
Stronglyagree
Moderatelyagree
Neither agreenor disagree
Moderatelydisagree
Stronglydisagree
Don't know
Percent (n=9212)
Healthy and sustainableforest habitatHealthy and sustainabledeer populationsSafe and acceptable levelsof deer-human conflicts
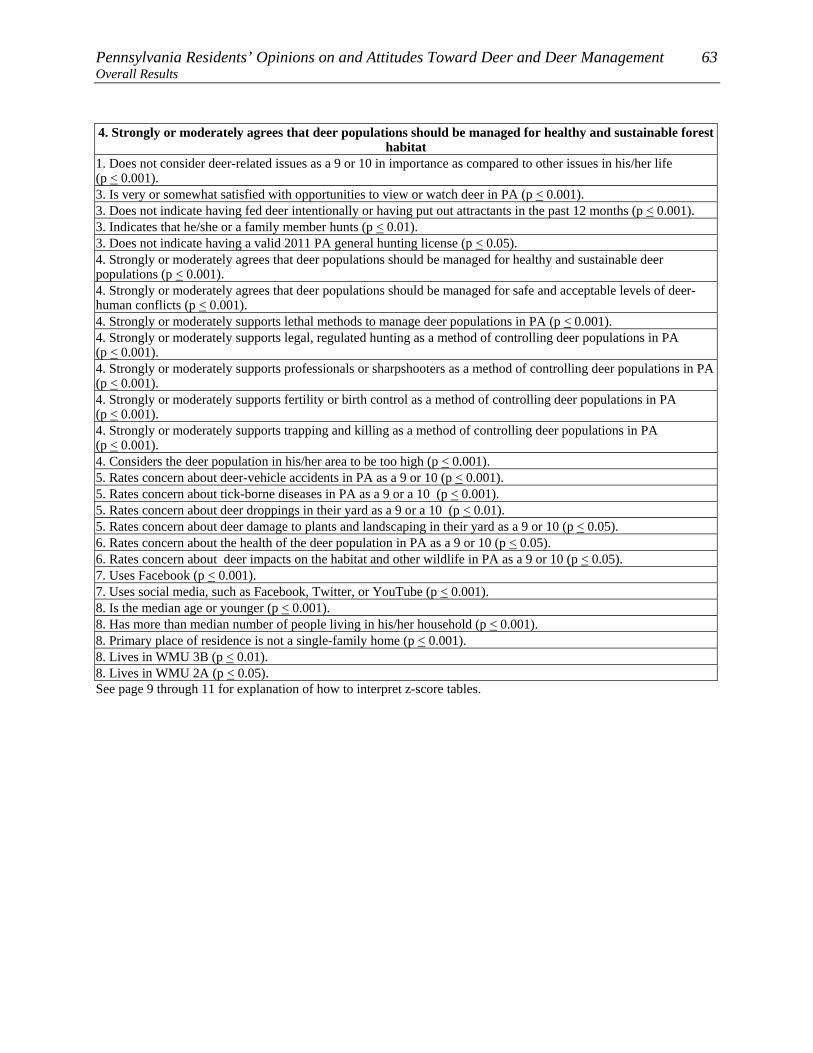
Pennsylvania Residents’ Opinions on and Attitudes Toward Deer and Deer Management 63 Overall Results 4. Strongly or moderately agrees that deer populations should be managed for healthy and sustainable forest
habitat 1. Does not consider deer-related issues as a 9 or 10 in importance as compared to other issues in his/her life (p < 0.001). 3. Is very or somewhat satisfied with opportunities to view or watch deer in PA (p < 0.001). 3. Does not indicate having fed deer intentionally or having put out attractants in the past 12 months (p < 0.001). 3. Indicates that he/she or a family member hunts (p < 0.01). 3. Does not indicate having a valid 2011 PA general hunting license (p < 0.05). 4. Strongly or moderately agrees that deer populations should be managed for healthy and sustainable deer populations (p < 0.001). 4. Strongly or moderately agrees that deer populations should be managed for safe and acceptable levels of deer-human conflicts (p < 0.001). 4. Strongly or moderately supports lethal methods to manage deer populations in PA (p < 0.001). 4. Strongly or moderately supports legal, regulated hunting as a method of controlling deer populations in PA (p < 0.001). 4. Strongly or moderately supports professionals or sharpshooters as a method of controlling deer populations in PA(p < 0.001). 4. Strongly or moderately supports fertility or birth control as a method of controlling deer populations in PA (p < 0.001). 4. Strongly or moderately supports trapping and killing as a method of controlling deer populations in PA (p < 0.001). 4. Considers the deer population in his/her area to be too high (p < 0.001). 5. Rates concern about deer-vehicle accidents in PA as a 9 or 10 (p < 0.001). 5. Rates concern about tick-borne diseases in PA as a 9 or a 10 (p < 0.001). 5. Rates concern about deer droppings in their yard as a 9 or a 10 (p < 0.01). 5. Rates concern about deer damage to plants and landscaping in their yard as a 9 or 10 (p < 0.05). 6. Rates concern about the health of the deer population in PA as a 9 or 10 (p < 0.05). 6. Rates concern about deer impacts on the habitat and other wildlife in PA as a 9 or 10 (p < 0.05). 7. Uses Facebook (p < 0.001). 7. Uses social media, such as Facebook, Twitter, or YouTube (p < 0.001). 8. Is the median age or younger (p < 0.001). 8. Has more than median number of people living in his/her household (p < 0.001). 8. Primary place of residence is not a single-family home (p < 0.001). 8. Lives in WMU 3B (p < 0.01). 8. Lives in WMU 2A (p < 0.05). See page 9 through 11 for explanation of how to interpret z-score tables.

64 Responsive Management Overall Results
4. Does not strongly or moderately agree that deer populations should be managed for healthy and
sustainable forest habitat 1. Considers deer-related issues as a 9 or 10 in importance as compared to other issues in his/her life (p < 0.001). 3. Does not indicate being very or somewhat satisfied with opportunities to view or watch deer in PA (p < 0.001). 3. Fed deer intentionally or put out attractants in the past 12 months (p < 0.001). 3. Does not Indicate that he/she or any of his/her family members hunt (p < 0.01). 3. Has a valid 2011 PA general hunting license (p < 0.05). 4. Does not strongly or moderately agree that deer populations should be managed for healthy and sustainable deer populations (p < 0.001). 4. Does not strongly or moderately agree that deer populations should be managed for safe and acceptable levels of deer-human conflicts (p < 0.001). 4. Does not strongly or moderately support lethal methods to manage deer populations in PA (p < 0.001). 4. Does not strongly or moderately support legal, regulated hunting as a method of controlling deer populations in PA (p < 0.001). 4. Does not strongly or moderately support professionals or sharpshooters as a method of controlling deer populations in PA (p < 0.001). 4. Does not strongly or moderately support fertility or birth control as a method of controlling deer populations in PA (p < 0.001). 4. Does not strongly or moderately support trapping and killing as a method of controlling deer populations in PA (p < 0.001). 4. Does not consider the deer population in his/her area to be too high (p < 0.001). 5. Does not rate concern about deer-vehicle accidents in PA as a 9 or 10 (p < 0.001). 5. Does not rate concern about tick-borne diseases in PA as a 9 or a 10 (p < 0.001). 5. Does not rate concern about deer droppings in their yard as a 9 or a 10 (p < 0.01). 5. Does not rate concern about deer damage to plants and landscaping in their yard as a 9 or 10 (p < 0.05). 6. Does not rate concern about the health of the deer population in PA as a 9 or 10 (p < 0.05). 6. Does not rate concern about deer impacts on the habitat and other wildlife in PA as a 9 or 10 (p < 0.05). 7. Does not indicate using Facebook (including not using any social media) (p < 0.001). 7. Does not indicate using social media, such as Facebook, Twitter, or YouTube (p < 0.001). 8. Is more than median age (p < 0.001). 8. Lives in WMU 2G (p < 0.001). 8. Lives in WMU 4D (p < 0.001). 8. Has the median number or fewer people living in his/her household (p < 0.001). 8. Lives in WMU 3A (p < 0.001). 8. Primary place of residence is a single-family home (p < 0.001). 8. Lives in WMU 1A (p < 0.05). See page 9 through 11 for explanation of how to interpret z-score tables.

Pennsylvania Residents’ Opinions on and Attitudes Toward Deer and Deer Management 65 Overall Results 4. Strongly or moderately agrees that deer populations should be managed for healthy and sustainable deer
populations 1. Does not consider deer-related issues as a 9 or 10 in importance as compared to other issues in his/her life (p < 0.001). 3. Indicates that he/she or a family member hunts (p < 0.001). 3. Considers himself/herself to be a hunter (p < 0.001). 3. Is very or somewhat satisfied with opportunities to view or watch deer in PA (p < 0.001). 3. Has taken a trip more than a mile from home for the primary purpose of viewing or watching deer in the past 12 months (p < 0.001). 3. Has a valid 2011 PA general hunting license (p < 0.001). 3. Has spent time viewing or watching deer around home in the past 12 months (p < 0.05). 4. Strongly or moderately agrees that deer populations should be managed for healthy and sustainable forest habitat (p < 0.001). 4. Strongly or moderately agrees that deer populations should be managed for safe and acceptable levels of deer-human conflicts (p < 0.001). 4. Strongly or moderately supports legal, regulated hunting as a method of controlling deer populations in PA (p < 0.001). 4. Strongly or moderately supports lethal methods to manage deer populations in PA (p < 0.001). 4. Strongly or moderately supports professionals or sharpshooters as a method of controlling deer populations in PA(p < 0.001). 4. Strongly or moderately supports trapping and killing as a method of controlling deer populations in PA (p < 0.001). 4. Strongly or moderately supports fertility or birth control as a method of controlling deer populations in PA (p < 0.001). 4. Considers the deer population in his/her area to be too high (p < 0.05). 5. Rates concern about tick-borne diseases in PA as a 9 or a 10 (p < 0.001). 5. Rates concern about deer-vehicle accidents in PA as a 9 or 10 (p < 0.01). 6. Rates concern about the health of the deer population in PA as a 9 or 10 (p < 0.001). 7. Uses social media, such as Facebook, Twitter, or YouTube (p < 0.001). 7. Uses Facebook (p < 0.001). 8. Is the median age or younger (p < 0.001). 8. Is male (p < 0.001). 8. Has more than median number of people living in his/her household (p < 0.001). 8. Primary place of residence is not a single-family home (p < 0.001). 8. Lives in WMU 4E (p < 0.01). 8. Lives in WMU 2F (p < 0.05). 8. Has lived at his/her primary place of residence for the median number of years or less (p < 0.05). 8. Lives in WMU 4A (p < 0.05). 8. Lives in WMU 2A (p < 0.05). See page 9 through 11 for explanation of how to interpret z-score tables.

66 Responsive Management Overall Results
4. Does not strongly or moderately agree that deer populations should be managed for healthy and
sustainable deer populations 1. Considers deer-related issues as a 9 or 10 in importance as compared to other issues in his/her life (p < 0.001). 3. Does not Indicate that he/she or any of his/her family members hunt (p < 0.001). 3. Does not indicate considering himself/herself to be a hunter (p < 0.001). 3. Does not indicate being very or somewhat satisfied with opportunities to view or watch deer in PA (p < 0.001). 3. Does not indicate having taken a trip more than a mile from home for the primary purpose of viewing or watching deer in the past 12 months (p < 0.001). 3. Does not indicate having a valid 2011 PA general hunting license (p < 0.001). 3. Does not indicate having spent time viewing or watching deer around home in the past 12 months (p < 0.05). 4. Does not strongly or moderately agree that deer populations should be managed for healthy and sustainable forest habitat (p < 0.001). 4. Does not strongly or moderately agree that deer populations should be managed for safe and acceptable levels of deer-human conflicts (p < 0.001). 4. Does not strongly or moderately support legal, regulated hunting as a method of controlling deer populations in PA (p < 0.001). 4. Does not strongly or moderately support lethal methods to manage deer populations in PA (p < 0.001). 4. Does not strongly or moderately support professionals or sharpshooters as a method of controlling deer populations in PA (p < 0.001). 4. Does not strongly or moderately support trapping and killing as a method of controlling deer populations in PA (p < 0.001). 4. Does not strongly or moderately support fertility or birth control as a method of controlling deer populations in PA (p < 0.001). 4. Does not consider the deer population in his/her area to be too high (p < 0.05). 5. Does not rate concern about tick-borne diseases in PA as a 9 or a 10 (p < 0.001). 5. Does not rate concern about deer-vehicle accidents in PA as a 9 or 10 (p < 0.01). 6. Does not rate concern about the health of the deer population in PA as a 9 or 10 (p < 0.001). 7. Does not indicate using social media, such as Facebook, Twitter, or YouTube (p < 0.001). 7. Does not indicate using Facebook (including not using any social media) (p < 0.001). 8. Is more than median age (p < 0.001). 8. Is female (p < 0.001). 8. Has the median number or fewer people living in his/her household (p < 0.001). 8. Lives in WMU 2C (p < 0.001). 8. Lives in WMU 3A (p < 0.01). 8. Lives in WMU 2D (p < 0.05). 8. Primary place of residence is a single-family home (p < 0.05). 8. Lives in WMU 1A (p < 0.05). 8. Lives in WMU 5D (p < 0.05). 8. Has lived at his/her primary place of residence for more than the median number of years (p < 0.05). See page 9 through 11 for explanation of how to interpret z-score tables.

Pennsylvania Residents’ Opinions on and Attitudes Toward Deer and Deer Management 67 Overall Results
4. Strongly or moderately agrees that deer populations should be managed for safe and acceptable levels of deer-human conflicts
1. Does not consider deer-related issues as a 9 or 10 in importance as compared to other issues in his/her life (p < 0.001). 2. Has seen deer frequently on his/her property in the past 12 months (p < 0.01). 3. Is very or somewhat satisfied with opportunities to view or watch deer in PA (p < 0.001). 3. Does not indicate having a valid 2011 PA general hunting license (p < 0.001). 3. Does not indicate considering himself/herself to be a hunter (p < 0.001). 3. Does not indicate having fed deer intentionally or having put out attractants in the past 12 months (p < 0.001). 4. Strongly or moderately agrees that deer populations should be managed for healthy and sustainable forest habitat (p < 0.001). 4. Strongly or moderately agrees that deer populations should be managed for healthy and sustainable deer populations (p < 0.001). 4. Strongly or moderately supports professionals or sharpshooters as a method of controlling deer populations in PA(p < 0.001). 4. Strongly or moderately supports lethal methods to manage deer populations in PA (p < 0.001). 4. Strongly or moderately supports legal, regulated hunting as a method of controlling deer populations in PA (p < 0.001). 4. Considers the deer population in his/her area to be too high (p < 0.001). 4. Strongly or moderately supports fertility or birth control as a method of controlling deer populations in PA (p < 0.001). 4. Strongly or moderately supports trapping and killing as a method of controlling deer populations in PA (p < 0.001). 5. Rates concern about deer-vehicle accidents in PA as a 9 or 10 (p < 0.001). 5. Rates concern about tick-borne diseases in PA as a 9 or a 10 (p < 0.001). 5. Rates concern about deer damage to plants and landscaping in their yard as a 9 or 10 (p < 0.001). 5. Indicates having experienced a problem with deer at his/her primary place of residence in the past 12 months (p < 0.001). 5. Rates concern about deer droppings in their yard as a 9 or a 10 (p < 0.001). 5. Indicates that he/she or another person living in the immediate household has been diagnosed by a physician with a tick-borne disease in the past 12 months (p < 0.05). 6. Rates concern about deer impacts on the habitat and other wildlife in PA as a 9 or 10 (p < 0.001). 7. Uses Facebook (p < 0.001). 7. Uses social media, such as Facebook, Twitter, or YouTube (p < 0.01). 8. Primary place of residence is not a single-family home (p < 0.001). 8. Has more than median number of people living in his/her household (p < 0.001). 8. Lives in WMU 5C (p < 0.001). 8. Lives in WMU 2D (p < 0.001). 8. Lives in WMU 5A (p < 0.01). 8. Does not consider place of residence to be an urban or suburban area (p < 0.01). 8. Lives in WMU 2B (p < 0.01). 8. Lives in WMU 4E (p < 0.05). 8. Lives in WMU 5D (p < 0.05). See page 9 through 11 for explanation of how to interpret z-score tables.

68 Responsive Management Overall Results
4. Does not strongly or moderately agree that deer populations should be managed for safe and acceptable
levels of deer-human conflicts 1. Considers deer-related issues as a 9 or 10 in importance as compared to other issues in his/her life (p < 0.001). 2. Does not indicate having seen deer frequently on his/her property in the past 12 months (p < 0.01). 3. Does not indicate being very or somewhat satisfied with opportunities to view or watch deer in PA (p < 0.001). 3. Has a valid 2011 PA general hunting license (p < 0.001). 3. Considers himself/herself to be a hunter (p < 0.001). 3. Fed deer intentionally or put out attractants in the past 12 months (p < 0.001). 4. Does not strongly or moderately agree that deer populations should be managed for healthy and sustainable forest habitat (p < 0.001). 4. Does not strongly or moderately agree that deer populations should be managed for healthy and sustainable deer populations (p < 0.001). 4. Does not strongly or moderately support professionals or sharpshooters as a method of controlling deer populations in PA (p < 0.001). 4. Does not strongly or moderately support lethal methods to manage deer populations in PA (p < 0.001). 4. Does not strongly or moderately support legal, regulated hunting as a method of controlling deer populations in PA (p < 0.001). 4. Does not consider the deer population in his/her area to be too high (p < 0.001). 4. Does not strongly or moderately support fertility or birth control as a method of controlling deer populations in PA (p < 0.001). 4. Does not strongly or moderately support trapping and killing as a method of controlling deer populations in PA (p < 0.001). 5. Does not rate concern about deer-vehicle accidents in PA as a 9 or 10 (p < 0.001). 5. Does not rate concern about tick-borne diseases in PA as a 9 or a 10 (p < 0.001). 5. Does not rate concern about deer damage to plants and landscaping in their yard as a 9 or 10 (p < 0.001). 5. Does not indicate having experienced any problems with deer at his/her primary place of residence in the past 12 months (p < 0.001). 5. Does not rate concern about deer droppings in their yard as a 9 or a 10 (p < 0.001). 5. Does not indicate that he/she or another person living in the immediate household has been diagnosed by a physician with a tick-borne disease in the past 12 months (p < 0.05). 6. Does not rate concern about deer impacts on the habitat and other wildlife in PA as a 9 or 10 (p < 0.001). 7. Does not indicate using Facebook (including not using any social media) (p < 0.001). 7. Does not indicate using social media, such as Facebook, Twitter, or YouTube (p < 0.01). 8. Primary place of residence is a single-family home (p < 0.001). 8. Has the median number or fewer people living in his/her household (p < 0.001). 8. Lives in WMU 2C (p < 0.001). 8. Lives in WMU 2G (p < 0.001). 8. Lives in WMU 4D (p < 0.001). 8. Lives in WMU 3A (p < 0.01). 8. Considers place of residence to be an urban or suburban area (p < 0.01). 8. Lives in WMU 4B (p < 0.05). See page 9 through 11 for explanation of how to interpret z-score tables.
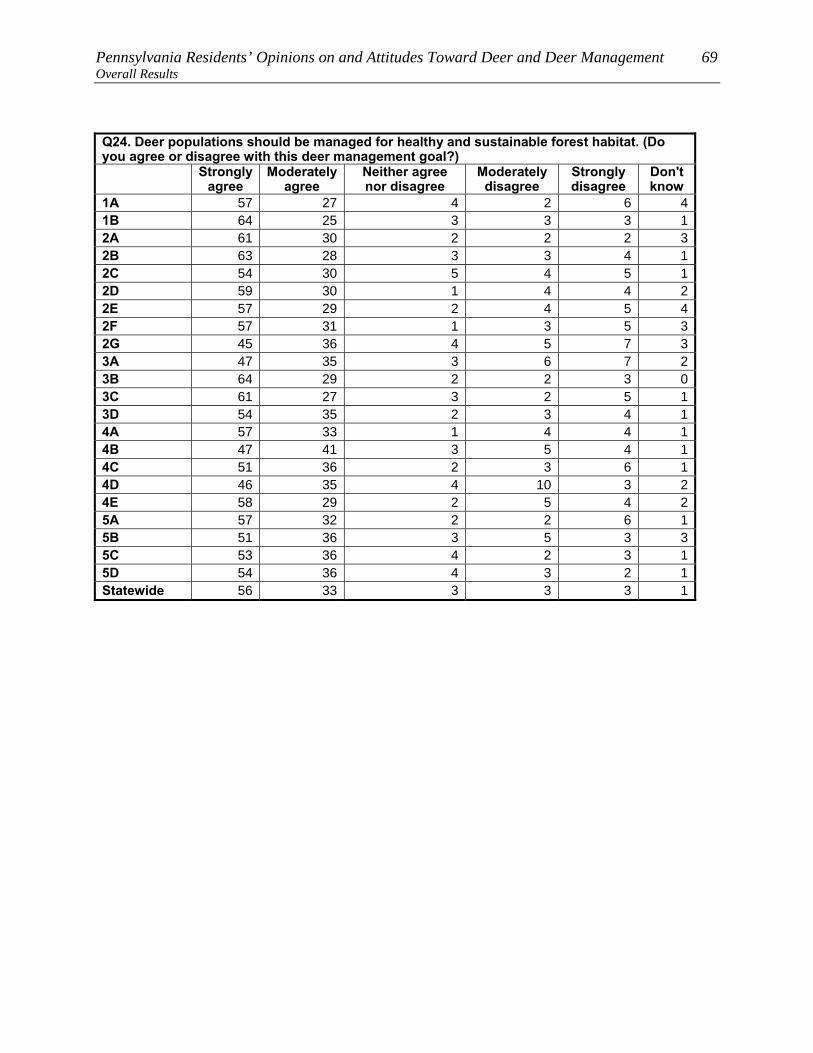
Pennsylvania Residents’ Opinions on and Attitudes Toward Deer and Deer Management 69 Overall Results
Q24. Deer populations should be managed for healthy and sustainable forest habitat. (Do you agree or disagree with this deer management goal?) Strongly
agree Moderately
agree Neither agree nor disagree
Moderately disagree
Strongly disagree
Don't know
1A 57 27 4 2 6 41B 64 25 3 3 3 12A 61 30 2 2 2 32B 63 28 3 3 4 12C 54 30 5 4 5 12D 59 30 1 4 4 22E 57 29 2 4 5 42F 57 31 1 3 5 32G 45 36 4 5 7 33A 47 35 3 6 7 23B 64 29 2 2 3 03C 61 27 3 2 5 13D 54 35 2 3 4 14A 57 33 1 4 4 14B 47 41 3 5 4 14C 51 36 2 3 6 14D 46 35 4 10 3 24E 58 29 2 5 4 25A 57 32 2 2 6 15B 51 36 3 5 3 35C 53 36 4 2 3 15D 54 36 4 3 2 1Statewide 56 33 3 3 3 1
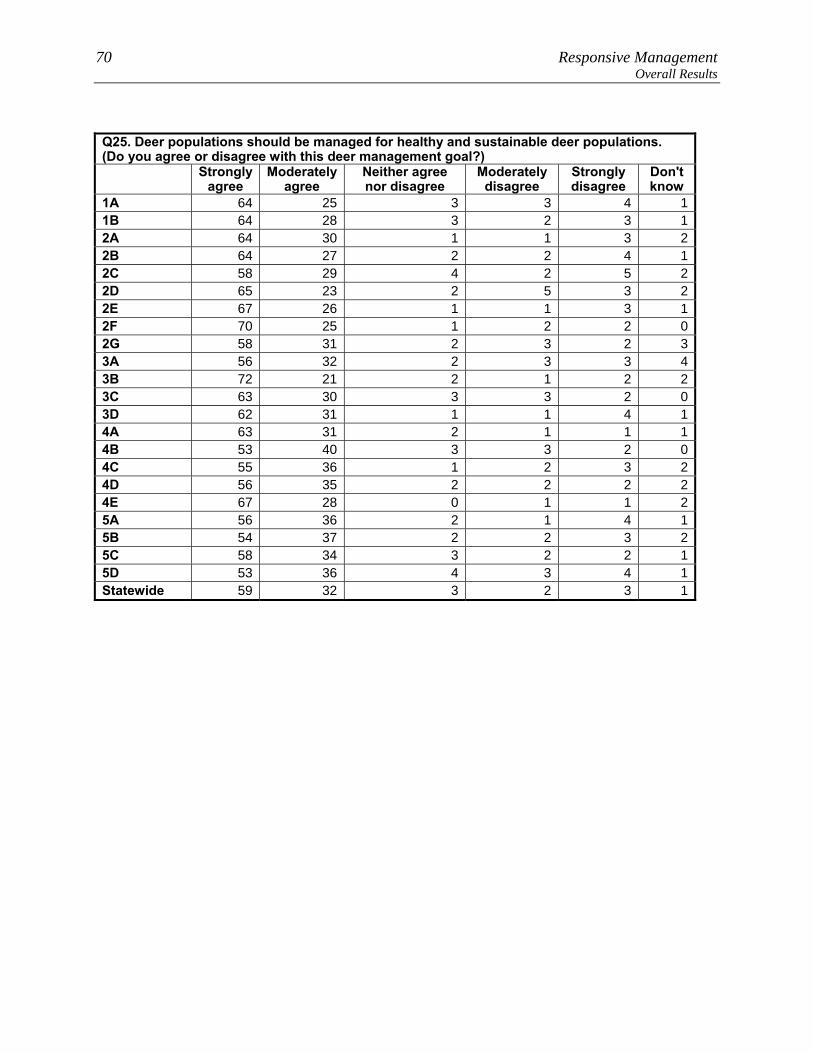
70 Responsive Management Overall Results
Q25. Deer populations should be managed for healthy and sustainable deer populations. (Do you agree or disagree with this deer management goal?) Strongly
agree Moderately
agree Neither agree nor disagree
Moderately disagree
Strongly disagree
Don't know
1A 64 25 3 3 4 11B 64 28 3 2 3 12A 64 30 1 1 3 22B 64 27 2 2 4 12C 58 29 4 2 5 22D 65 23 2 5 3 22E 67 26 1 1 3 12F 70 25 1 2 2 02G 58 31 2 3 2 33A 56 32 2 3 3 43B 72 21 2 1 2 23C 63 30 3 3 2 03D 62 31 1 1 4 14A 63 31 2 1 1 14B 53 40 3 3 2 04C 55 36 1 2 3 24D 56 35 2 2 2 24E 67 28 0 1 1 25A 56 36 2 1 4 15B 54 37 2 2 3 25C 58 34 3 2 2 15D 53 36 4 3 4 1Statewide 59 32 3 2 3 1

Pennsylvania Residents’ Opinions on and Attitudes Toward Deer and Deer Management 71 Overall Results
Q26. Deer populations should be managed for safe and acceptable levels of deer-human conflicts. (Do you agree or disagree with this deer management goal?) Strongly
agree Moderately
agree Neither agree nor disagree
Moderately disagree
Strongly disagree
Don't know
1A 53 30 4 5 4 31B 51 32 6 4 5 22A 53 30 4 5 6 22B 56 30 3 5 4 22C 48 27 6 7 9 32D 60 29 3 5 3 12E 52 28 5 4 10 22F 43 35 3 7 8 42G 39 36 6 8 8 23A 40 37 4 6 9 53B 54 26 7 6 8 03C 53 32 4 3 6 33D 40 39 5 6 7 34A 43 39 5 9 4 14B 36 42 5 7 7 34C 42 41 3 7 6 14D 36 40 5 10 6 34E 51 35 1 7 4 25A 48 39 3 4 5 15B 42 39 5 4 7 45C 52 37 3 4 4 15D 53 33 5 5 4 1Statewide 50 34 4 5 5 2

72 Responsive Management Overall Results
34
2
6
2
9
21
4
12
11
0 20 40 60 80 100
More than 10years
6-10 years
5 years
4 years
3 years
2 years
1 year
Less than a year
Don't know
Percent (n=3811)
Q18. You said the deer population in the area where you live is [too high / too low]. In years, what is a reasonable amount of time to achieve an acceptable deer population in the area where you live? (Asked of those who think the deer population in the area where they live is too high or
too low.)
Mean = 4.77Median = 4

Pennsylvania Residents’ Opinions on and Attitudes Toward Deer and Deer Management 73 Overall Results
Q18. You said the deer population in the area where you live is [too high / too low]. In years, what is a reasonable amount of time to achieve an acceptable deer population in the area where you live? (Asked of those who think the deer population in the area is too high or too low.)
More than 10
years
6-10 years
5 years
4 years
3 years
2 years 1 year
Less than a year
Don't know
1A 0 5 17 6 12 8 6 3 431B 0 6 16 11 14 7 5 1 382A 1 8 22 4 10 9 9 3 342B 5 6 26 3 8 12 6 2 322C 0 7 27 3 12 18 6 0 272D 0 8 18 5 10 13 5 1 402E 0 5 28 6 10 8 1 1 402F 1 9 20 7 11 9 5 2 362G 2 7 24 4 11 14 4 1 333A 1 11 21 5 13 10 3 0 373B 1 6 23 1 17 12 9 4 283C 1 11 22 6 10 8 1 3 383D 2 11 20 5 15 12 3 4 284A 1 6 26 9 17 14 2 0 254B 2 7 22 4 17 11 2 1 354C 2 6 21 8 10 14 3 0 354D 1 15 15 10 19 7 2 0 304E 1 11 20 6 11 9 3 0 405A 1 11 16 7 16 11 3 2 325B 0 15 24 3 6 11 3 0 375C 1 7 19 3 17 12 5 1 355D 2 12 16 3 9 9 9 4 35Statewide 2 9 21 4 12 11 6 2 34

74 Responsive Management Overall Results
Q21. Would you be willing to wait more than 10 years to achieve an acceptable deer population in the area where you live? (Among those who think the deer population in the area where they live is
too high or too low.)
53
42
5
0 20 40 60 80 100
Yes
No
Don't know
Percent (n=3811)
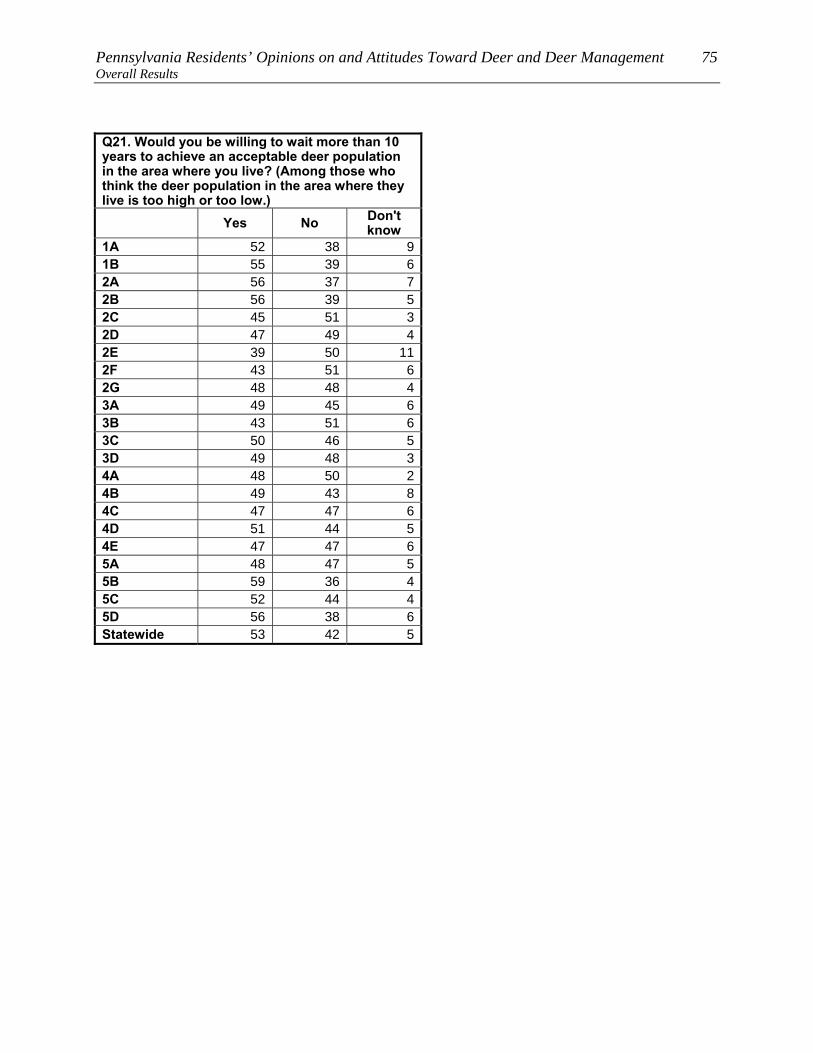
Pennsylvania Residents’ Opinions on and Attitudes Toward Deer and Deer Management 75 Overall Results
Q21. Would you be willing to wait more than 10 years to achieve an acceptable deer population in the area where you live? (Among those who think the deer population in the area where they live is too high or too low.) Yes No Don't
know 1A 52 38 91B 55 39 62A 56 37 72B 56 39 52C 45 51 32D 47 49 42E 39 50 112F 43 51 62G 48 48 43A 49 45 63B 43 51 63C 50 46 53D 49 48 34A 48 50 24B 49 43 84C 47 47 64D 51 44 54E 47 47 65A 48 47 55B 59 36 45C 52 44 45D 56 38 6Statewide 53 42 5
76 Responsive Management Overall Results
OPINIONS ON METHODS FOR MANAGING DEER, INCLUDING HUNTING Just under two-thirds of Pennsylvania residents (63%) support lethal methods to manage deer
populations in Pennsylvania (38% strongly support, and 25% moderately support);
nonetheless, 29% oppose (20% strongly oppose, and 9% moderately oppose). Maps show
results by WMU for total support and total opposition.
• Those who own their home, compared to those who do not, are more likely to strongly
support, but they are less likely to moderately support, meaning that overall support is
about the same.
• The survey asked about four methods of controlling deer populations (three of them
lethal). The most support is for legal, regulated hunting (85% of respondents support
this method, while 12% oppose), distantly followed by fertility/birth control (46%
support, 45% oppose), professionals or sharpshooters (39% support, 54% oppose), and
trapping and killing (24% support, 72% oppose). In each case, the remainder are
neutral or do not know.
Pennsylvania residents who live in a single-family home were asked if they personally hunt
on their property: 10% indicate that they do. Additionally, 15% allow others to hunt on their
property. In total, 17% hunt on their property and/or allow others to do so (it is not simply a
sum because some did both).
• There was interest in seeing how a particular subgroup responded on this question, the
subgroup being those who live in a single-family home; who live on 1 acre or less; and
who live in an urban, suburban area, or a small city/town. Among this subgroup, 4%
either hunt on their own property or allow others to hunt on the property.
• Those who live in a single-family home but who do not allow hunting were asked for
their reasons for prohibiting hunting. Most commonly, they say it is because their
property is too small/too near neighbors (48% of these respondents) and/or that they
live in an urban or suburban neighborhood where hunting is not feasible (also 48%).
These top two reasons are distantly followed by concerns about safety (10%) and a
general opposition to hunting (9%), with small percentages saying that there are not
enough deer on their property, that they have liability concerns, that they want to save
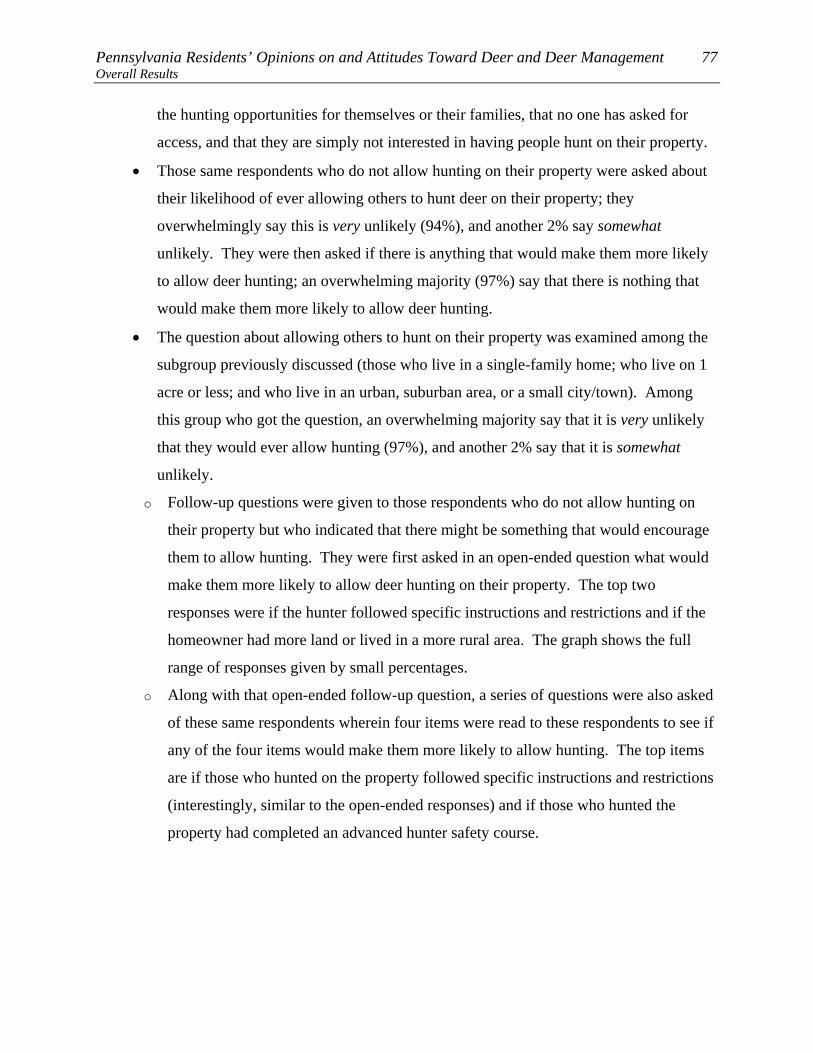
Pennsylvania Residents’ Opinions on and Attitudes Toward Deer and Deer Management 77 Overall Results
the hunting opportunities for themselves or their families, that no one has asked for
access, and that they are simply not interested in having people hunt on their property.
• Those same respondents who do not allow hunting on their property were asked about
their likelihood of ever allowing others to hunt deer on their property; they
overwhelmingly say this is very unlikely (94%), and another 2% say somewhat
unlikely. They were then asked if there is anything that would make them more likely
to allow deer hunting; an overwhelming majority (97%) say that there is nothing that
would make them more likely to allow deer hunting.
• The question about allowing others to hunt on their property was examined among the
subgroup previously discussed (those who live in a single-family home; who live on 1
acre or less; and who live in an urban, suburban area, or a small city/town). Among
this group who got the question, an overwhelming majority say that it is very unlikely
that they would ever allow hunting (97%), and another 2% say that it is somewhat
unlikely.
o Follow-up questions were given to those respondents who do not allow hunting on
their property but who indicated that there might be something that would encourage
them to allow hunting. They were first asked in an open-ended question what would
make them more likely to allow deer hunting on their property. The top two
responses were if the hunter followed specific instructions and restrictions and if the
homeowner had more land or lived in a more rural area. The graph shows the full
range of responses given by small percentages.
o Along with that open-ended follow-up question, a series of questions were also asked
of these same respondents wherein four items were read to these respondents to see if
any of the four items would make them more likely to allow hunting. The top items
are if those who hunted on the property followed specific instructions and restrictions
(interestingly, similar to the open-ended responses) and if those who hunted the
property had completed an advanced hunter safety course.

78 Responsive Management Overall Results
Q27. In general, do you support or oppose lethal methods to manage deer populations in
Pennsylvania?
38
25
7
9
20
2
0 20 40 60 80 100
Strongly support
Moderatelysupport
Neither supportnor oppose
Moderately oppose
Strongly oppose
Don't know
Percent (n=9212)
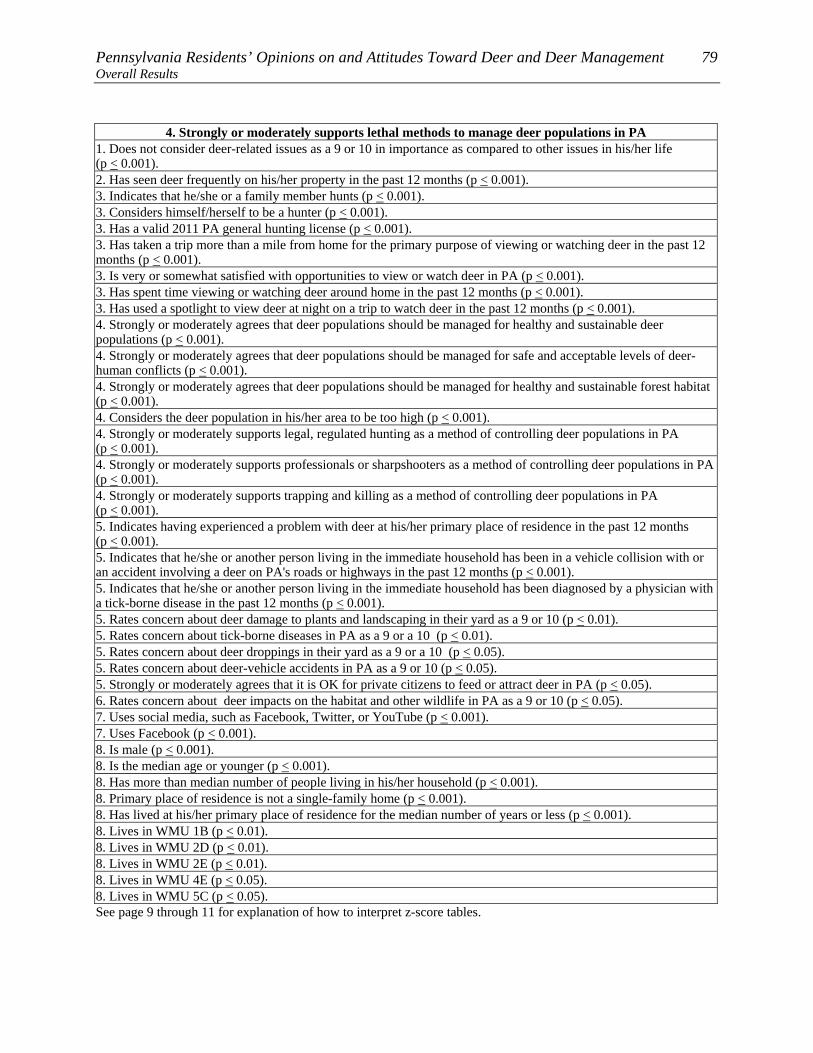
Pennsylvania Residents’ Opinions on and Attitudes Toward Deer and Deer Management 79 Overall Results
4. Strongly or moderately supports lethal methods to manage deer populations in PA 1. Does not consider deer-related issues as a 9 or 10 in importance as compared to other issues in his/her life (p < 0.001). 2. Has seen deer frequently on his/her property in the past 12 months (p < 0.001). 3. Indicates that he/she or a family member hunts (p < 0.001). 3. Considers himself/herself to be a hunter (p < 0.001). 3. Has a valid 2011 PA general hunting license (p < 0.001). 3. Has taken a trip more than a mile from home for the primary purpose of viewing or watching deer in the past 12 months (p < 0.001). 3. Is very or somewhat satisfied with opportunities to view or watch deer in PA (p < 0.001). 3. Has spent time viewing or watching deer around home in the past 12 months (p < 0.001). 3. Has used a spotlight to view deer at night on a trip to watch deer in the past 12 months (p < 0.001). 4. Strongly or moderately agrees that deer populations should be managed for healthy and sustainable deer populations (p < 0.001). 4. Strongly or moderately agrees that deer populations should be managed for safe and acceptable levels of deer-human conflicts (p < 0.001). 4. Strongly or moderately agrees that deer populations should be managed for healthy and sustainable forest habitat (p < 0.001). 4. Considers the deer population in his/her area to be too high (p < 0.001). 4. Strongly or moderately supports legal, regulated hunting as a method of controlling deer populations in PA (p < 0.001). 4. Strongly or moderately supports professionals or sharpshooters as a method of controlling deer populations in PA(p < 0.001). 4. Strongly or moderately supports trapping and killing as a method of controlling deer populations in PA (p < 0.001). 5. Indicates having experienced a problem with deer at his/her primary place of residence in the past 12 months (p < 0.001). 5. Indicates that he/she or another person living in the immediate household has been in a vehicle collision with or an accident involving a deer on PA's roads or highways in the past 12 months (p < 0.001). 5. Indicates that he/she or another person living in the immediate household has been diagnosed by a physician with a tick-borne disease in the past 12 months (p < 0.001). 5. Rates concern about deer damage to plants and landscaping in their yard as a 9 or 10 (p < 0.01). 5. Rates concern about tick-borne diseases in PA as a 9 or a 10 (p < 0.01). 5. Rates concern about deer droppings in their yard as a 9 or a 10 (p < 0.05). 5. Rates concern about deer-vehicle accidents in PA as a 9 or 10 (p < 0.05). 5. Strongly or moderately agrees that it is OK for private citizens to feed or attract deer in PA (p < 0.05). 6. Rates concern about deer impacts on the habitat and other wildlife in PA as a 9 or 10 (p < 0.05). 7. Uses social media, such as Facebook, Twitter, or YouTube (p < 0.001). 7. Uses Facebook (p < 0.001). 8. Is male (p < 0.001). 8. Is the median age or younger (p < 0.001). 8. Has more than median number of people living in his/her household (p < 0.001). 8. Primary place of residence is not a single-family home (p < 0.001). 8. Has lived at his/her primary place of residence for the median number of years or less (p < 0.001). 8. Lives in WMU 1B (p < 0.01). 8. Lives in WMU 2D (p < 0.01). 8. Lives in WMU 2E (p < 0.01). 8. Lives in WMU 4E (p < 0.05). 8. Lives in WMU 5C (p < 0.05). See page 9 through 11 for explanation of how to interpret z-score tables.
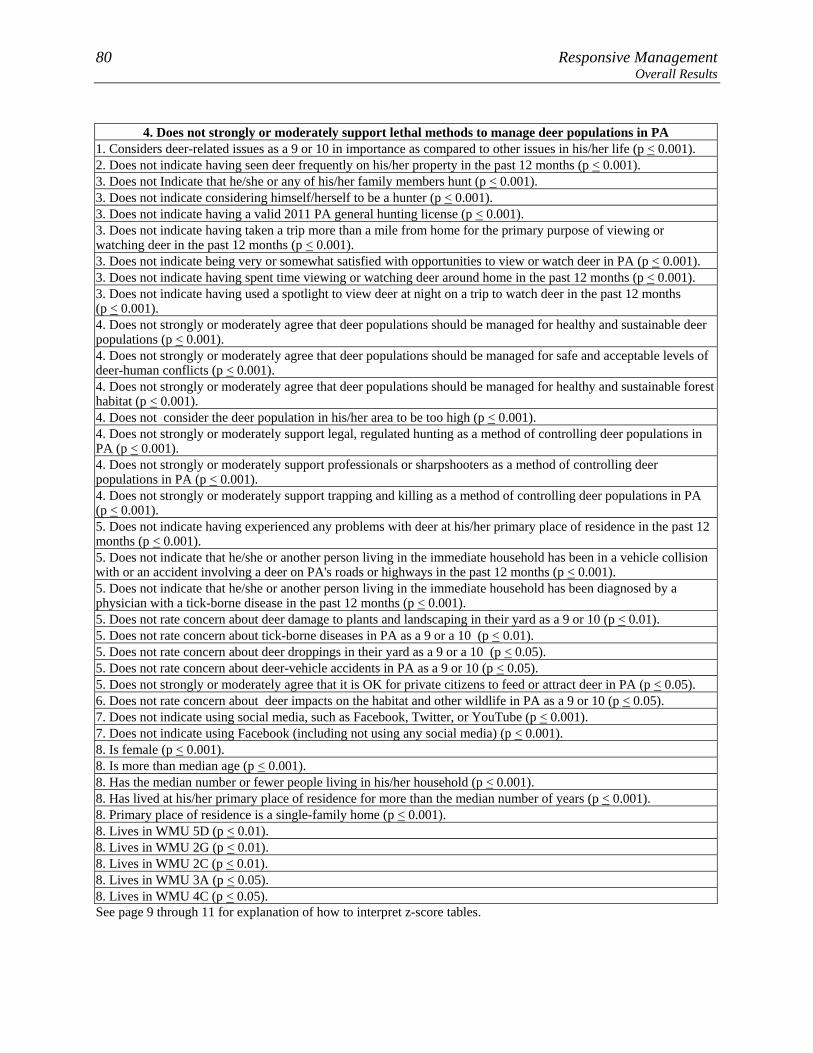
80 Responsive Management Overall Results
4. Does not strongly or moderately support lethal methods to manage deer populations in PA
1. Considers deer-related issues as a 9 or 10 in importance as compared to other issues in his/her life (p < 0.001). 2. Does not indicate having seen deer frequently on his/her property in the past 12 months (p < 0.001). 3. Does not Indicate that he/she or any of his/her family members hunt (p < 0.001). 3. Does not indicate considering himself/herself to be a hunter (p < 0.001). 3. Does not indicate having a valid 2011 PA general hunting license (p < 0.001). 3. Does not indicate having taken a trip more than a mile from home for the primary purpose of viewing or watching deer in the past 12 months (p < 0.001). 3. Does not indicate being very or somewhat satisfied with opportunities to view or watch deer in PA (p < 0.001). 3. Does not indicate having spent time viewing or watching deer around home in the past 12 months (p < 0.001). 3. Does not indicate having used a spotlight to view deer at night on a trip to watch deer in the past 12 months (p < 0.001). 4. Does not strongly or moderately agree that deer populations should be managed for healthy and sustainable deer populations (p < 0.001). 4. Does not strongly or moderately agree that deer populations should be managed for safe and acceptable levels of deer-human conflicts (p < 0.001). 4. Does not strongly or moderately agree that deer populations should be managed for healthy and sustainable forest habitat (p < 0.001). 4. Does not consider the deer population in his/her area to be too high (p < 0.001). 4. Does not strongly or moderately support legal, regulated hunting as a method of controlling deer populations in PA (p < 0.001). 4. Does not strongly or moderately support professionals or sharpshooters as a method of controlling deer populations in PA (p < 0.001). 4. Does not strongly or moderately support trapping and killing as a method of controlling deer populations in PA (p < 0.001). 5. Does not indicate having experienced any problems with deer at his/her primary place of residence in the past 12 months (p < 0.001). 5. Does not indicate that he/she or another person living in the immediate household has been in a vehicle collision with or an accident involving a deer on PA's roads or highways in the past 12 months (p < 0.001). 5. Does not indicate that he/she or another person living in the immediate household has been diagnosed by a physician with a tick-borne disease in the past 12 months (p < 0.001). 5. Does not rate concern about deer damage to plants and landscaping in their yard as a 9 or 10 (p < 0.01). 5. Does not rate concern about tick-borne diseases in PA as a 9 or a 10 (p < 0.01). 5. Does not rate concern about deer droppings in their yard as a 9 or a 10 (p < 0.05). 5. Does not rate concern about deer-vehicle accidents in PA as a 9 or 10 (p < 0.05). 5. Does not strongly or moderately agree that it is OK for private citizens to feed or attract deer in PA (p < 0.05). 6. Does not rate concern about deer impacts on the habitat and other wildlife in PA as a 9 or 10 (p < 0.05). 7. Does not indicate using social media, such as Facebook, Twitter, or YouTube (p < 0.001). 7. Does not indicate using Facebook (including not using any social media) (p < 0.001). 8. Is female (p < 0.001). 8. Is more than median age (p < 0.001). 8. Has the median number or fewer people living in his/her household (p < 0.001). 8. Has lived at his/her primary place of residence for more than the median number of years (p < 0.001). 8. Primary place of residence is a single-family home (p < 0.001). 8. Lives in WMU 5D (p < 0.01). 8. Lives in WMU 2G (p < 0.01). 8. Lives in WMU 2C (p < 0.01). 8. Lives in WMU 3A (p < 0.05). 8. Lives in WMU 4C (p < 0.05). See page 9 through 11 for explanation of how to interpret z-score tables.

Pennsylvania Residents’ Opinions on and Attitudes Toward Deer and Deer Management 81 Overall Results
Q27. In general, do you support or oppose lethal methods to manage deer populations in
Pennsylvania?
40
24
6
9
19
2
10
28
32
9
20
0
0 20 40 60 80 100
Strongly support
Moderatelysupport
Neither supportnor oppose
Moderatelyoppose
Strongly oppose
Don't know
Percent
Owns home (n=7617)
Does not own home(n=589)

82 Responsive Management Overall Results
Q27. In general, do you support or oppose lethal methods to manage deer populations in Pennsylvania?
Strongly support
Moderately support
Neither support nor oppose
Moderately oppose
Strongly oppose
Don't know
1A 40 23 8 6 19 41B 46 24 7 6 15 12A 39 23 4 11 20 32B 42 24 4 9 20 12C 36 22 8 8 25 22D 47 24 5 4 16 42E 54 17 7 6 14 22F 39 24 8 9 17 42G 36 21 7 8 26 23A 36 23 6 12 22 23B 42 25 6 5 23 03C 37 26 6 8 22 13D 38 27 6 7 21 14A 35 32 7 8 17 14B 32 31 7 10 18 24C 37 22 6 9 23 34D 33 32 7 12 15 14E 37 33 4 5 20 25A 30 29 9 6 24 15B 35 27 8 9 18 45C 45 24 6 9 15 05D 31 26 8 11 22 2Statewide 38 25 7 9 20 2
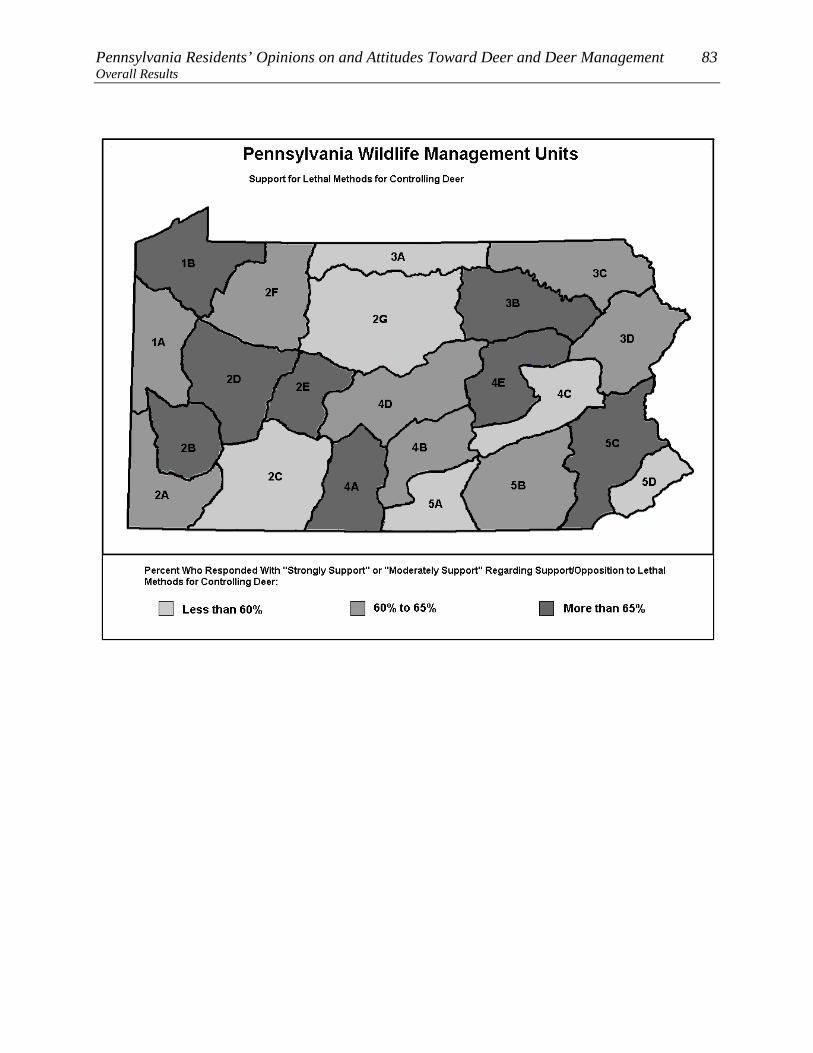
Pennsylvania Residents’ Opinions on and Attitudes Toward Deer and Deer Management 83 Overall Results

84 Responsive Management Overall Results

Pennsylvania Residents’ Opinions on and Attitudes Toward Deer and Deer Management 85 Overall Results
Q30-Q33. Percent who strongly support each of the following methods of controlling deer populations
in Pennsylvania:
11
19
25
66
0 20 40 60 80 100
Q30. Legal,regulated hunting
Q33. Fertility or birthcontrol
Q31. Professionalsor sharpshooters
Q32. Trapping andkilling
Percent
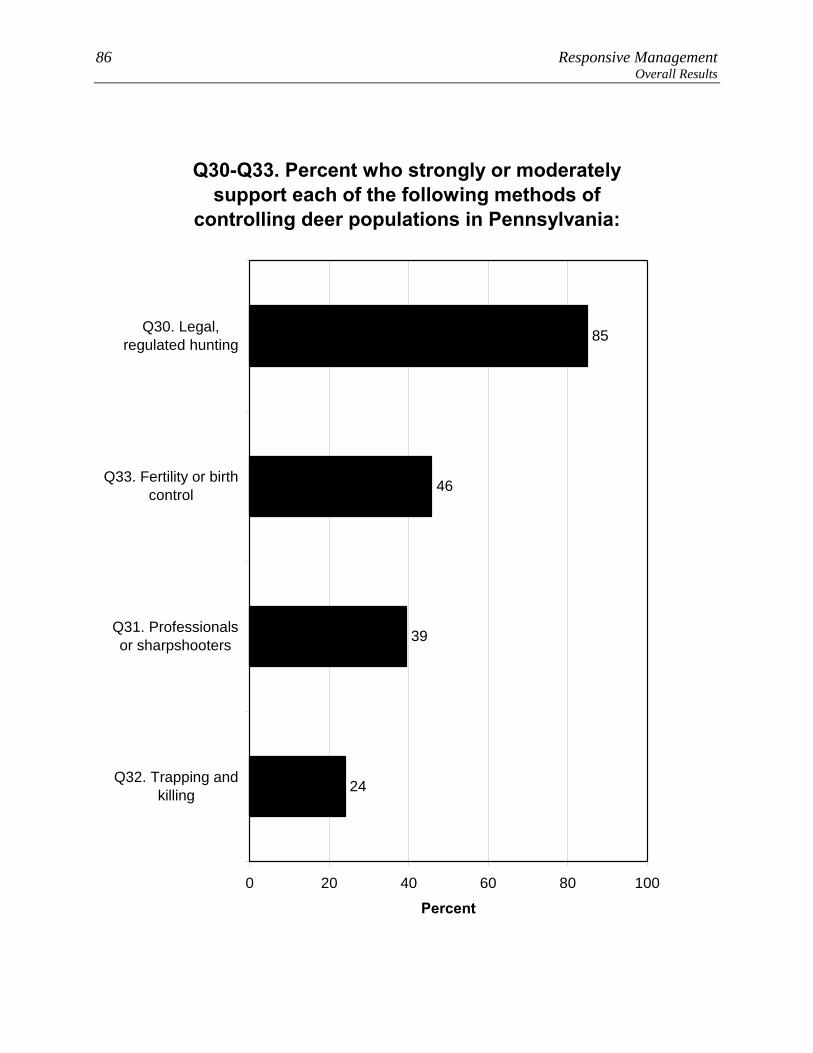
86 Responsive Management Overall Results
Q30-Q33. Percent who strongly or moderately support each of the following methods of
controlling deer populations in Pennsylvania:
85
46
39
24
0 20 40 60 80 100
Q30. Legal,regulated hunting
Q33. Fertility or birthcontrol
Q31. Professionalsor sharpshooters
Q32. Trapping andkilling
Percent

Pennsylvania Residents’ Opinions on and Attitudes Toward Deer and Deer Management 87 Overall Results
Q30-Q33. Percent who strongly or moderately oppose each of the following methods of
controlling deer populations in Pennsylvania:
12
45
54
72
0 20 40 60 80 100
Q32. Trapping andkilling
Q31. Professionalsor sharpshooters
Q33. Fertility or birthcontrol
Q30. Legal,regulated hunting
Percent

88 Responsive Management Overall Results
Q30-Q33. Percent who strongly oppose each of the following methods of controlling deer populations
in Pennsylvania:
8
33
40
57
0 20 40 60 80 100
Q32. Trapping andkilling
Q31. Professionalsor sharpshooters
Q33. Fertility or birthcontrol
Q30. Legal,regulated hunting
Percent
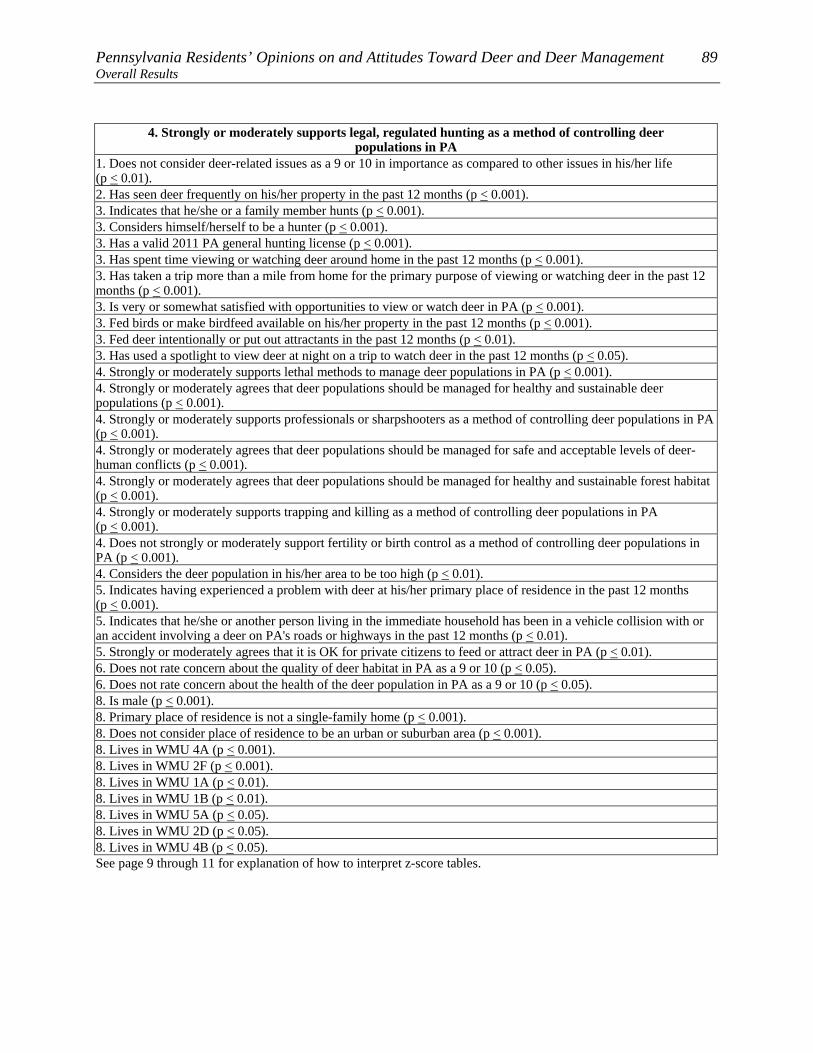
Pennsylvania Residents’ Opinions on and Attitudes Toward Deer and Deer Management 89 Overall Results
4. Strongly or moderately supports legal, regulated hunting as a method of controlling deer populations in PA
1. Does not consider deer-related issues as a 9 or 10 in importance as compared to other issues in his/her life (p < 0.01). 2. Has seen deer frequently on his/her property in the past 12 months (p < 0.001). 3. Indicates that he/she or a family member hunts (p < 0.001). 3. Considers himself/herself to be a hunter (p < 0.001). 3. Has a valid 2011 PA general hunting license (p < 0.001). 3. Has spent time viewing or watching deer around home in the past 12 months (p < 0.001). 3. Has taken a trip more than a mile from home for the primary purpose of viewing or watching deer in the past 12 months (p < 0.001). 3. Is very or somewhat satisfied with opportunities to view or watch deer in PA (p < 0.001). 3. Fed birds or make birdfeed available on his/her property in the past 12 months (p < 0.001). 3. Fed deer intentionally or put out attractants in the past 12 months (p < 0.01). 3. Has used a spotlight to view deer at night on a trip to watch deer in the past 12 months (p < 0.05). 4. Strongly or moderately supports lethal methods to manage deer populations in PA (p < 0.001). 4. Strongly or moderately agrees that deer populations should be managed for healthy and sustainable deer populations (p < 0.001). 4. Strongly or moderately supports professionals or sharpshooters as a method of controlling deer populations in PA(p < 0.001). 4. Strongly or moderately agrees that deer populations should be managed for safe and acceptable levels of deer-human conflicts (p < 0.001). 4. Strongly or moderately agrees that deer populations should be managed for healthy and sustainable forest habitat (p < 0.001). 4. Strongly or moderately supports trapping and killing as a method of controlling deer populations in PA (p < 0.001). 4. Does not strongly or moderately support fertility or birth control as a method of controlling deer populations in PA (p < 0.001). 4. Considers the deer population in his/her area to be too high (p < 0.01). 5. Indicates having experienced a problem with deer at his/her primary place of residence in the past 12 months (p < 0.001). 5. Indicates that he/she or another person living in the immediate household has been in a vehicle collision with or an accident involving a deer on PA's roads or highways in the past 12 months (p < 0.01). 5. Strongly or moderately agrees that it is OK for private citizens to feed or attract deer in PA (p < 0.01). 6. Does not rate concern about the quality of deer habitat in PA as a 9 or 10 (p < 0.05). 6. Does not rate concern about the health of the deer population in PA as a 9 or 10 (p < 0.05). 8. Is male (p < 0.001). 8. Primary place of residence is not a single-family home (p < 0.001). 8. Does not consider place of residence to be an urban or suburban area (p < 0.001). 8. Lives in WMU 4A (p < 0.001). 8. Lives in WMU 2F (p < 0.001). 8. Lives in WMU 1A (p < 0.01). 8. Lives in WMU 1B (p < 0.01). 8. Lives in WMU 5A (p < 0.05). 8. Lives in WMU 2D (p < 0.05). 8. Lives in WMU 4B (p < 0.05). See page 9 through 11 for explanation of how to interpret z-score tables.
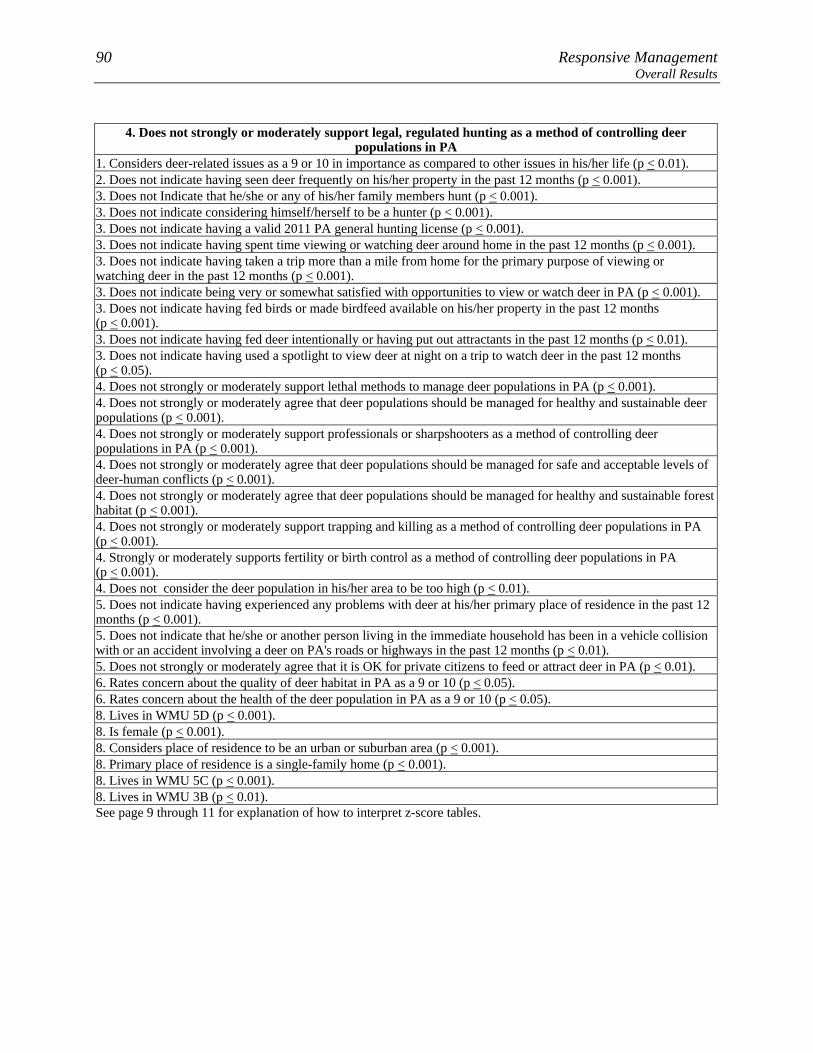
90 Responsive Management Overall Results
4. Does not strongly or moderately support legal, regulated hunting as a method of controlling deer
populations in PA 1. Considers deer-related issues as a 9 or 10 in importance as compared to other issues in his/her life (p < 0.01). 2. Does not indicate having seen deer frequently on his/her property in the past 12 months (p < 0.001). 3. Does not Indicate that he/she or any of his/her family members hunt (p < 0.001). 3. Does not indicate considering himself/herself to be a hunter (p < 0.001). 3. Does not indicate having a valid 2011 PA general hunting license (p < 0.001). 3. Does not indicate having spent time viewing or watching deer around home in the past 12 months (p < 0.001). 3. Does not indicate having taken a trip more than a mile from home for the primary purpose of viewing or watching deer in the past 12 months (p < 0.001). 3. Does not indicate being very or somewhat satisfied with opportunities to view or watch deer in PA (p < 0.001). 3. Does not indicate having fed birds or made birdfeed available on his/her property in the past 12 months (p < 0.001). 3. Does not indicate having fed deer intentionally or having put out attractants in the past 12 months (p < 0.01). 3. Does not indicate having used a spotlight to view deer at night on a trip to watch deer in the past 12 months (p < 0.05). 4. Does not strongly or moderately support lethal methods to manage deer populations in PA (p < 0.001). 4. Does not strongly or moderately agree that deer populations should be managed for healthy and sustainable deer populations (p < 0.001). 4. Does not strongly or moderately support professionals or sharpshooters as a method of controlling deer populations in PA (p < 0.001). 4. Does not strongly or moderately agree that deer populations should be managed for safe and acceptable levels of deer-human conflicts (p < 0.001). 4. Does not strongly or moderately agree that deer populations should be managed for healthy and sustainable forest habitat (p < 0.001). 4. Does not strongly or moderately support trapping and killing as a method of controlling deer populations in PA (p < 0.001). 4. Strongly or moderately supports fertility or birth control as a method of controlling deer populations in PA (p < 0.001). 4. Does not consider the deer population in his/her area to be too high (p < 0.01). 5. Does not indicate having experienced any problems with deer at his/her primary place of residence in the past 12 months (p < 0.001). 5. Does not indicate that he/she or another person living in the immediate household has been in a vehicle collision with or an accident involving a deer on PA's roads or highways in the past 12 months (p < 0.01). 5. Does not strongly or moderately agree that it is OK for private citizens to feed or attract deer in PA (p < 0.01). 6. Rates concern about the quality of deer habitat in PA as a 9 or 10 (p < 0.05). 6. Rates concern about the health of the deer population in PA as a 9 or 10 (p < 0.05). 8. Lives in WMU 5D (p < 0.001). 8. Is female (p < 0.001). 8. Considers place of residence to be an urban or suburban area (p < 0.001). 8. Primary place of residence is a single-family home (p < 0.001). 8. Lives in WMU 5C (p < 0.001). 8. Lives in WMU 3B (p < 0.01). See page 9 through 11 for explanation of how to interpret z-score tables.

Pennsylvania Residents’ Opinions on and Attitudes Toward Deer and Deer Management 91 Overall Results
4. Strongly or moderately supports professionals or sharpshooters as a method of controlling deer populations in PA
1. Does not consider deer-related issues as a 9 or 10 in importance as compared to other issues in his/her life (p < 0.001). 3. Is very or somewhat satisfied with opportunities to view or watch deer in PA (p < 0.001). 3. Does not indicate having fed deer intentionally or having put out attractants in the past 12 months (p < 0.001). 3. Does not indicate having taken a trip more than a mile from home for the primary purpose of viewing or watching deer in the past 12 months (p < 0.001). 3. Does not indicate having a valid 2011 PA general hunting license (p < 0.001). 3. Does not indicate considering himself/herself to be a hunter (p < 0.01). 3. Does not indicate having spent time viewing or watching deer around home in the past 12 months (p < 0.01). 4. Strongly or moderately supports fertility or birth control as a method of controlling deer populations in PA (p < 0.001). 4. Strongly or moderately agrees that deer populations should be managed for safe and acceptable levels of deer-human conflicts (p < 0.001). 4. Strongly or moderately supports legal, regulated hunting as a method of controlling deer populations in PA (p < 0.001). 4. Strongly or moderately agrees that deer populations should be managed for healthy and sustainable forest habitat (p < 0.001). 4. Strongly or moderately agrees that deer populations should be managed for healthy and sustainable deer populations (p < 0.001). 4. Strongly or moderately supports trapping and killing as a method of controlling deer populations in PA (p < 0.001). 4. Considers the deer population in his/her area to be too high (p < 0.001). 4. Strongly or moderately supports lethal methods to manage deer populations in PA (p < 0.001). 5. Indicates having experienced a problem with deer at his/her primary place of residence in the past 12 months (p < 0.001). 5. Rates concern about deer-vehicle accidents in PA as a 9 or 10 (p < 0.001). 5. Rates concern about deer damage to plants and landscaping in their yard as a 9 or 10 (p < 0.001). 5. Rates concern about deer droppings in their yard as a 9 or a 10 (p < 0.001). 5. Rates concern about tick-borne diseases in PA as a 9 or a 10 (p < 0.001). 5. Indicates that he/she or another person living in the immediate household has been in a vehicle collision with or an accident involving a deer on PA's roads or highways in the past 12 months (p < 0.01). 6. Rates concern about deer impacts on the habitat and other wildlife in PA as a 9 or 10 (p < 0.001). 7. Uses social media, such as Facebook, Twitter, or YouTube (p < 0.001). 7. Uses Facebook (p < 0.001). 8. Is the median age or younger (p < 0.001). 8. Lives in WMU 5D (p < 0.001). 8. Lives in WMU 5C (p < 0.001). 8. Considers place of residence to be an urban or suburban area (p < 0.001). 8. Is male (p < 0.001). 8. Has more than median number of people living in his/her household (p < 0.001). 8. Lives in WMU 2B (p < 0.001). 8. Has lived at his/her primary place of residence for the median number of years or less (p < 0.001). 8. Lives in WMU 2D (p < 0.01). 8. Lives in WMU 4D (p < 0.01). 8. Primary place of residence is not a single-family home (p < 0.05). See page 9 through 11 for explanation of how to interpret z-score tables.
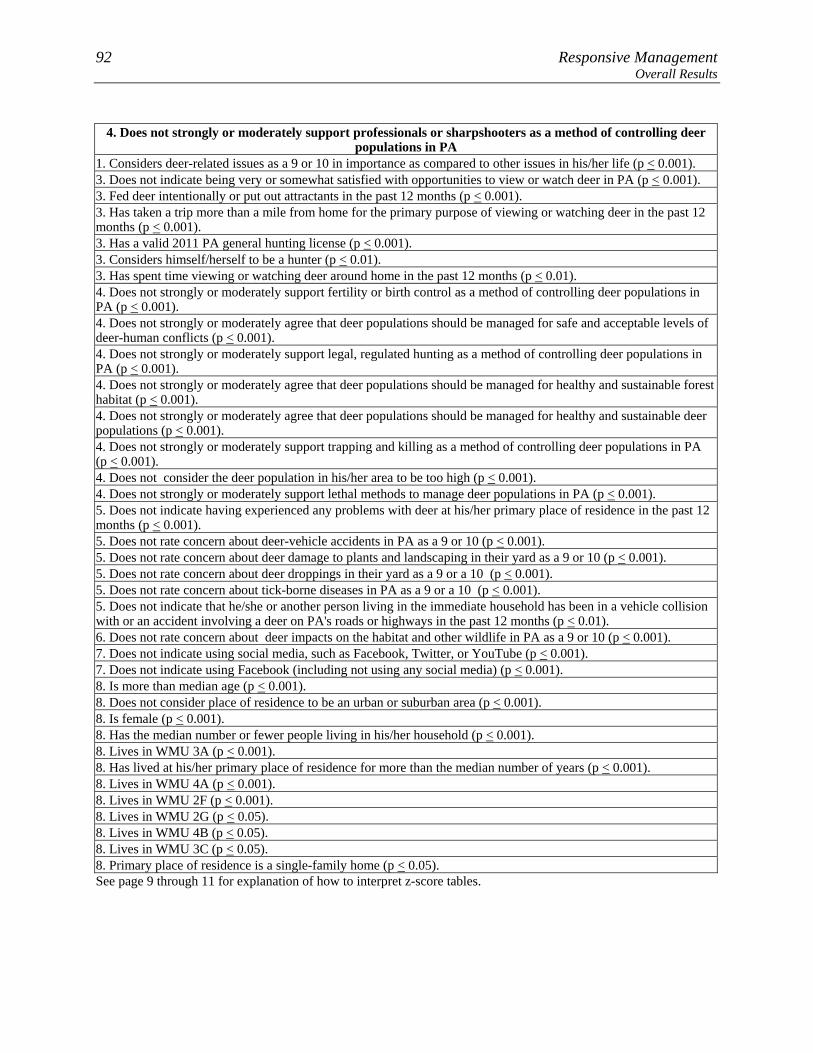
92 Responsive Management Overall Results
4. Does not strongly or moderately support professionals or sharpshooters as a method of controlling deer
populations in PA 1. Considers deer-related issues as a 9 or 10 in importance as compared to other issues in his/her life (p < 0.001). 3. Does not indicate being very or somewhat satisfied with opportunities to view or watch deer in PA (p < 0.001). 3. Fed deer intentionally or put out attractants in the past 12 months (p < 0.001). 3. Has taken a trip more than a mile from home for the primary purpose of viewing or watching deer in the past 12 months (p < 0.001). 3. Has a valid 2011 PA general hunting license (p < 0.001). 3. Considers himself/herself to be a hunter (p < 0.01). 3. Has spent time viewing or watching deer around home in the past 12 months (p < 0.01). 4. Does not strongly or moderately support fertility or birth control as a method of controlling deer populations in PA (p < 0.001). 4. Does not strongly or moderately agree that deer populations should be managed for safe and acceptable levels of deer-human conflicts (p < 0.001). 4. Does not strongly or moderately support legal, regulated hunting as a method of controlling deer populations in PA (p < 0.001). 4. Does not strongly or moderately agree that deer populations should be managed for healthy and sustainable forest habitat (p < 0.001). 4. Does not strongly or moderately agree that deer populations should be managed for healthy and sustainable deer populations (p < 0.001). 4. Does not strongly or moderately support trapping and killing as a method of controlling deer populations in PA (p < 0.001). 4. Does not consider the deer population in his/her area to be too high (p < 0.001). 4. Does not strongly or moderately support lethal methods to manage deer populations in PA (p < 0.001). 5. Does not indicate having experienced any problems with deer at his/her primary place of residence in the past 12 months (p < 0.001). 5. Does not rate concern about deer-vehicle accidents in PA as a 9 or 10 (p < 0.001). 5. Does not rate concern about deer damage to plants and landscaping in their yard as a 9 or 10 (p < 0.001). 5. Does not rate concern about deer droppings in their yard as a 9 or a 10 (p < 0.001). 5. Does not rate concern about tick-borne diseases in PA as a 9 or a 10 (p < 0.001). 5. Does not indicate that he/she or another person living in the immediate household has been in a vehicle collision with or an accident involving a deer on PA's roads or highways in the past 12 months (p < 0.01). 6. Does not rate concern about deer impacts on the habitat and other wildlife in PA as a 9 or 10 (p < 0.001). 7. Does not indicate using social media, such as Facebook, Twitter, or YouTube (p < 0.001). 7. Does not indicate using Facebook (including not using any social media) (p < 0.001). 8. Is more than median age (p < 0.001). 8. Does not consider place of residence to be an urban or suburban area (p < 0.001). 8. Is female (p < 0.001). 8. Has the median number or fewer people living in his/her household (p < 0.001). 8. Lives in WMU 3A (p < 0.001). 8. Has lived at his/her primary place of residence for more than the median number of years (p < 0.001). 8. Lives in WMU 4A (p < 0.001). 8. Lives in WMU 2F (p < 0.001). 8. Lives in WMU 2G (p < 0.05). 8. Lives in WMU 4B (p < 0.05). 8. Lives in WMU 3C (p < 0.05). 8. Primary place of residence is a single-family home (p < 0.05). See page 9 through 11 for explanation of how to interpret z-score tables.
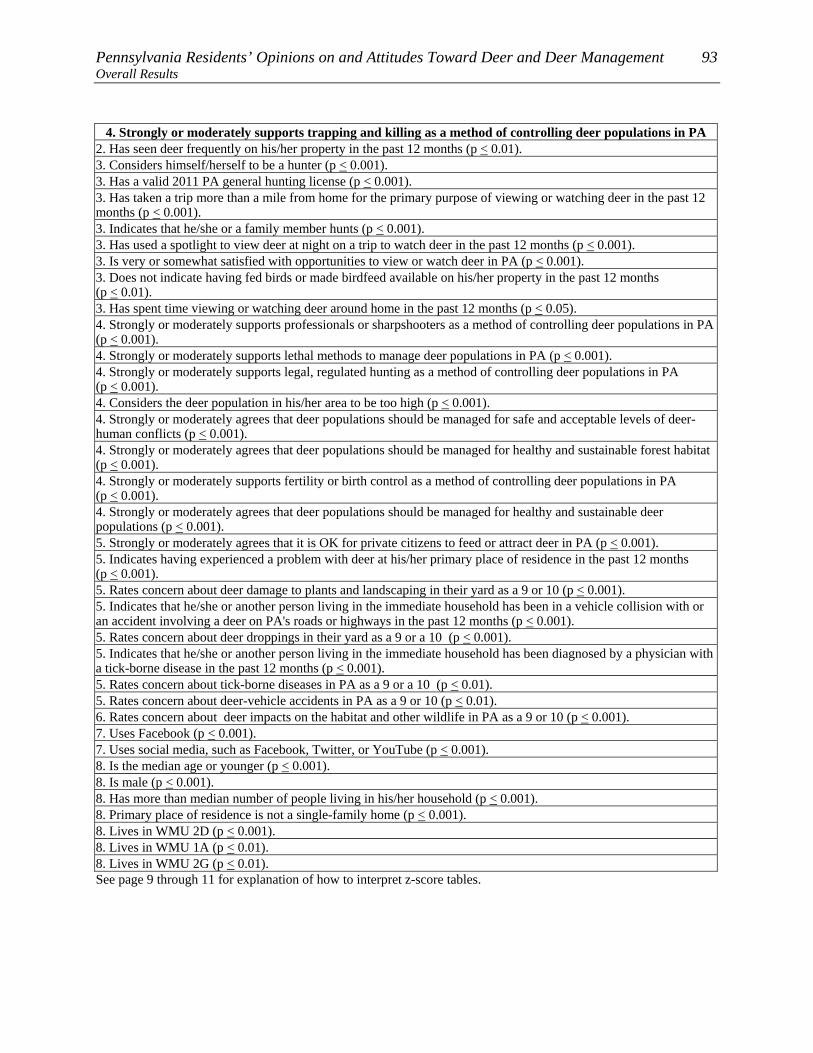
Pennsylvania Residents’ Opinions on and Attitudes Toward Deer and Deer Management 93 Overall Results
4. Strongly or moderately supports trapping and killing as a method of controlling deer populations in PA 2. Has seen deer frequently on his/her property in the past 12 months (p < 0.01). 3. Considers himself/herself to be a hunter (p < 0.001). 3. Has a valid 2011 PA general hunting license (p < 0.001). 3. Has taken a trip more than a mile from home for the primary purpose of viewing or watching deer in the past 12 months (p < 0.001). 3. Indicates that he/she or a family member hunts (p < 0.001). 3. Has used a spotlight to view deer at night on a trip to watch deer in the past 12 months (p < 0.001). 3. Is very or somewhat satisfied with opportunities to view or watch deer in PA (p < 0.001). 3. Does not indicate having fed birds or made birdfeed available on his/her property in the past 12 months (p < 0.01). 3. Has spent time viewing or watching deer around home in the past 12 months (p < 0.05). 4. Strongly or moderately supports professionals or sharpshooters as a method of controlling deer populations in PA(p < 0.001). 4. Strongly or moderately supports lethal methods to manage deer populations in PA (p < 0.001). 4. Strongly or moderately supports legal, regulated hunting as a method of controlling deer populations in PA (p < 0.001). 4. Considers the deer population in his/her area to be too high (p < 0.001). 4. Strongly or moderately agrees that deer populations should be managed for safe and acceptable levels of deer-human conflicts (p < 0.001). 4. Strongly or moderately agrees that deer populations should be managed for healthy and sustainable forest habitat (p < 0.001). 4. Strongly or moderately supports fertility or birth control as a method of controlling deer populations in PA (p < 0.001). 4. Strongly or moderately agrees that deer populations should be managed for healthy and sustainable deer populations (p < 0.001). 5. Strongly or moderately agrees that it is OK for private citizens to feed or attract deer in PA (p < 0.001). 5. Indicates having experienced a problem with deer at his/her primary place of residence in the past 12 months (p < 0.001). 5. Rates concern about deer damage to plants and landscaping in their yard as a 9 or 10 (p < 0.001). 5. Indicates that he/she or another person living in the immediate household has been in a vehicle collision with or an accident involving a deer on PA's roads or highways in the past 12 months (p < 0.001). 5. Rates concern about deer droppings in their yard as a 9 or a 10 (p < 0.001). 5. Indicates that he/she or another person living in the immediate household has been diagnosed by a physician with a tick-borne disease in the past 12 months (p < 0.001). 5. Rates concern about tick-borne diseases in PA as a 9 or a 10 (p < 0.01). 5. Rates concern about deer-vehicle accidents in PA as a 9 or 10 (p < 0.01). 6. Rates concern about deer impacts on the habitat and other wildlife in PA as a 9 or 10 (p < 0.001). 7. Uses Facebook (p < 0.001). 7. Uses social media, such as Facebook, Twitter, or YouTube (p < 0.001). 8. Is the median age or younger (p < 0.001). 8. Is male (p < 0.001). 8. Has more than median number of people living in his/her household (p < 0.001). 8. Primary place of residence is not a single-family home (p < 0.001). 8. Lives in WMU 2D (p < 0.001). 8. Lives in WMU 1A (p < 0.01). 8. Lives in WMU 2G (p < 0.01). See page 9 through 11 for explanation of how to interpret z-score tables.
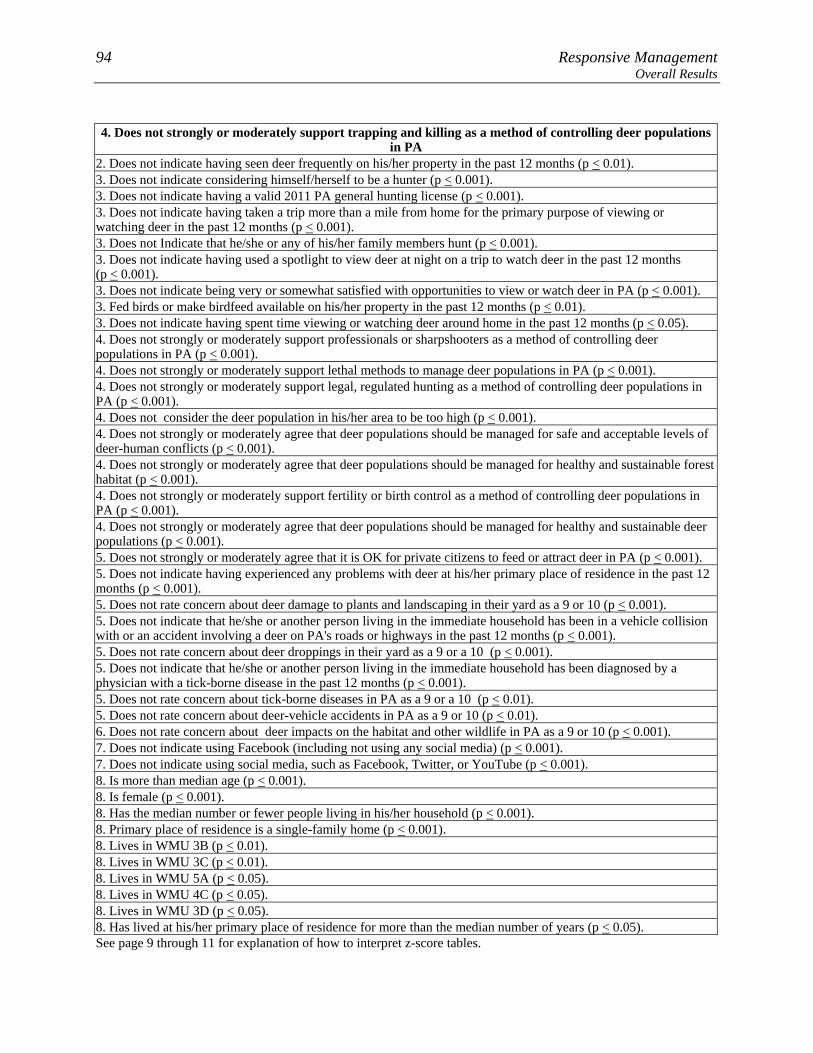
94 Responsive Management Overall Results
4. Does not strongly or moderately support trapping and killing as a method of controlling deer populations
in PA 2. Does not indicate having seen deer frequently on his/her property in the past 12 months (p < 0.01). 3. Does not indicate considering himself/herself to be a hunter (p < 0.001). 3. Does not indicate having a valid 2011 PA general hunting license (p < 0.001). 3. Does not indicate having taken a trip more than a mile from home for the primary purpose of viewing or watching deer in the past 12 months (p < 0.001). 3. Does not Indicate that he/she or any of his/her family members hunt (p < 0.001). 3. Does not indicate having used a spotlight to view deer at night on a trip to watch deer in the past 12 months (p < 0.001). 3. Does not indicate being very or somewhat satisfied with opportunities to view or watch deer in PA (p < 0.001). 3. Fed birds or make birdfeed available on his/her property in the past 12 months (p < 0.01). 3. Does not indicate having spent time viewing or watching deer around home in the past 12 months (p < 0.05). 4. Does not strongly or moderately support professionals or sharpshooters as a method of controlling deer populations in PA (p < 0.001). 4. Does not strongly or moderately support lethal methods to manage deer populations in PA (p < 0.001). 4. Does not strongly or moderately support legal, regulated hunting as a method of controlling deer populations in PA (p < 0.001). 4. Does not consider the deer population in his/her area to be too high (p < 0.001). 4. Does not strongly or moderately agree that deer populations should be managed for safe and acceptable levels of deer-human conflicts (p < 0.001). 4. Does not strongly or moderately agree that deer populations should be managed for healthy and sustainable forest habitat (p < 0.001). 4. Does not strongly or moderately support fertility or birth control as a method of controlling deer populations in PA (p < 0.001). 4. Does not strongly or moderately agree that deer populations should be managed for healthy and sustainable deer populations (p < 0.001). 5. Does not strongly or moderately agree that it is OK for private citizens to feed or attract deer in PA (p < 0.001). 5. Does not indicate having experienced any problems with deer at his/her primary place of residence in the past 12 months (p < 0.001). 5. Does not rate concern about deer damage to plants and landscaping in their yard as a 9 or 10 (p < 0.001). 5. Does not indicate that he/she or another person living in the immediate household has been in a vehicle collision with or an accident involving a deer on PA's roads or highways in the past 12 months (p < 0.001). 5. Does not rate concern about deer droppings in their yard as a 9 or a 10 (p < 0.001). 5. Does not indicate that he/she or another person living in the immediate household has been diagnosed by a physician with a tick-borne disease in the past 12 months (p < 0.001). 5. Does not rate concern about tick-borne diseases in PA as a 9 or a 10 (p < 0.01). 5. Does not rate concern about deer-vehicle accidents in PA as a 9 or 10 (p < 0.01). 6. Does not rate concern about deer impacts on the habitat and other wildlife in PA as a 9 or 10 (p < 0.001). 7. Does not indicate using Facebook (including not using any social media) (p < 0.001). 7. Does not indicate using social media, such as Facebook, Twitter, or YouTube (p < 0.001). 8. Is more than median age (p < 0.001). 8. Is female (p < 0.001). 8. Has the median number or fewer people living in his/her household (p < 0.001). 8. Primary place of residence is a single-family home (p < 0.001). 8. Lives in WMU 3B (p < 0.01). 8. Lives in WMU 3C (p < 0.01). 8. Lives in WMU 5A (p < 0.05). 8. Lives in WMU 4C (p < 0.05). 8. Lives in WMU 3D (p < 0.05). 8. Has lived at his/her primary place of residence for more than the median number of years (p < 0.05). See page 9 through 11 for explanation of how to interpret z-score tables.

Pennsylvania Residents’ Opinions on and Attitudes Toward Deer and Deer Management 95 Overall Results
4. Strongly or moderately supports fertility or birth control as a method of controlling deer populations in PA
1. Does not consider deer-related issues as a 9 or 10 in importance as compared to other issues in his/her life (p < 0.001). 3. Does not indicate having a valid 2011 PA general hunting license (p < 0.001). 3. Does not indicate having taken a trip more than a mile from home for the primary purpose of viewing or watching deer in the past 12 months (p < 0.001). 3. Is very or somewhat satisfied with opportunities to view or watch deer in PA (p < 0.001). 3. Does not indicate having used a spotlight to view deer at night on a trip to watch deer in the past 12 months (p < 0.001). 3. Does not indicate having spent time viewing or watching deer around home in the past 12 months (p < 0.001). 3. Does not indicate having fed deer intentionally or having put out attractants in the past 12 months (p < 0.001). 3. Does not indicate considering himself/herself to be a hunter (p < 0.001). 3. Does not Indicate that he/she or any of his/her family members hunt (p < 0.001). 4. Strongly or moderately supports professionals or sharpshooters as a method of controlling deer populations in PA(p < 0.001). 4. Considers the deer population in his/her area to be too high (p < 0.001). 4. Strongly or moderately agrees that deer populations should be managed for safe and acceptable levels of deer-human conflicts (p < 0.001). 4. Strongly or moderately agrees that deer populations should be managed for healthy and sustainable forest habitat (p < 0.001). 4. Strongly or moderately supports trapping and killing as a method of controlling deer populations in PA (p < 0.001). 4. Does not strongly or moderately support legal, regulated hunting as a method of controlling deer populations in PA (p < 0.001). 4. Strongly or moderately agrees that deer populations should be managed for healthy and sustainable deer populations (p < 0.001). 5. Rates concern about deer-vehicle accidents in PA as a 9 or 10 (p < 0.001). 5. Rates concern about deer droppings in their yard as a 9 or a 10 (p < 0.001). 5. Rates concern about deer damage to plants and landscaping in their yard as a 9 or 10 (p < 0.001). 5. Rates concern about tick-borne diseases in PA as a 9 or a 10 (p < 0.001). 5. Does not strongly or moderately agree that it is OK for private citizens to feed or attract deer in PA (p < 0.001). 5. Indicates having experienced a problem with deer at his/her primary place of residence in the past 12 months (p < 0.001). 6. Rates concern about deer impacts on the habitat and other wildlife in PA as a 9 or 10 (p < 0.001). 7. Uses Facebook (p < 0.001). 7. Uses social media, such as Facebook, Twitter, or YouTube (p < 0.001). 8. Is female (p < 0.001). 8. Lives in WMU 5D (p < 0.001). 8. Considers place of residence to be an urban or suburban area (p < 0.001). 8. Lives in WMU 2B (p < 0.001). 8. Lives in WMU 5C (p < 0.001). 8. Is more than median age (p < 0.001). 8. Has the median number or fewer people living in his/her household (p < 0.001). 8. Lives in WMU 5B (p < 0.01). 8. Primary place of residence is a single-family home (p < 0.01). 8. Has lived at his/her primary place of residence for more than the median number of years (p < 0.05). See page 9 through 11 for explanation of how to interpret z-score tables.

96 Responsive Management Overall Results
4. Does not strongly or moderately support fertility or birth control as a method of controlling deer
populations in PA 1. Considers deer-related issues as a 9 or 10 in importance as compared to other issues in his/her life (p < 0.001). 3. Considers himself/herself to be a hunter (p < 0.001). 3. Has a valid 2011 PA general hunting license (p < 0.001). 3. Has taken a trip more than a mile from home for the primary purpose of viewing or watching deer in the past 12 months (p < 0.001). 3. Indicates that he/she or a family member hunts (p < 0.001). 3. Has spent time viewing or watching deer around home in the past 12 months (p < 0.001). 3. Fed deer intentionally or put out attractants in the past 12 months (p < 0.001). 3. Does not indicate being very or somewhat satisfied with opportunities to view or watch deer in PA (p < 0.001). 3. Has used a spotlight to view deer at night on a trip to watch deer in the past 12 months (p < 0.001). 4. Does not strongly or moderately support professionals or sharpshooters as a method of controlling deer populations in PA (p < 0.001). 4. Does not consider the deer population in his/her area to be too high (p < 0.001). 4. Does not strongly or moderately agree that deer populations should be managed for safe and acceptable levels of deer-human conflicts (p < 0.001). 4. Does not strongly or moderately agree that deer populations should be managed for healthy and sustainable forest habitat (p < 0.001). 4. Does not strongly or moderately support trapping and killing as a method of controlling deer populations in PA (p < 0.001). 4. Strongly or moderately supports legal, regulated hunting as a method of controlling deer populations in PA (p < 0.001). 4. Does not strongly or moderately agree that deer populations should be managed for healthy and sustainable deer populations (p < 0.001). 5. Does not rate concern about deer-vehicle accidents in PA as a 9 or 10 (p < 0.001). 5. Does not rate concern about deer droppings in their yard as a 9 or a 10 (p < 0.001). 5. Does not rate concern about deer damage to plants and landscaping in their yard as a 9 or 10 (p < 0.001). 5. Does not rate concern about tick-borne diseases in PA as a 9 or a 10 (p < 0.001). 5. Strongly or moderately agrees that it is OK for private citizens to feed or attract deer in PA (p < 0.001). 5. Does not indicate having experienced any problems with deer at his/her primary place of residence in the past 12 months (p < 0.001). 6. Does not rate concern about deer impacts on the habitat and other wildlife in PA as a 9 or 10 (p < 0.001). 7. Does not indicate using Facebook (including not using any social media) (p < 0.001). 7. Does not indicate using social media, such as Facebook, Twitter, or YouTube (p < 0.001). 8. Is male (p < 0.001). 8. Does not consider place of residence to be an urban or suburban area (p < 0.001). 8. Lives in WMU 2G (p < 0.001). 8. Is the median age or younger (p < 0.001). 8. Lives in WMU 4A (p < 0.001). 8. Lives in WMU 3A (p < 0.001). 8. Lives in WMU 2F (p < 0.001). 8. Has more than median number of people living in his/her household (p < 0.001). 8. Lives in WMU 1B (p < 0.01). 8. Lives in WMU 3C (p < 0.05). 8. Lives in WMU 2E (p < 0.05). 8. Primary place of residence is not a single-family home (p < 0.05). 8. Lives in WMU 4E (p < 0.05). 8. Has lived at his/her primary place of residence for the median number of years or less (p < 0.05). 8. Lives in WMU 4B (p < 0.05). See page 9 through 11 for explanation of how to interpret z-score tables.
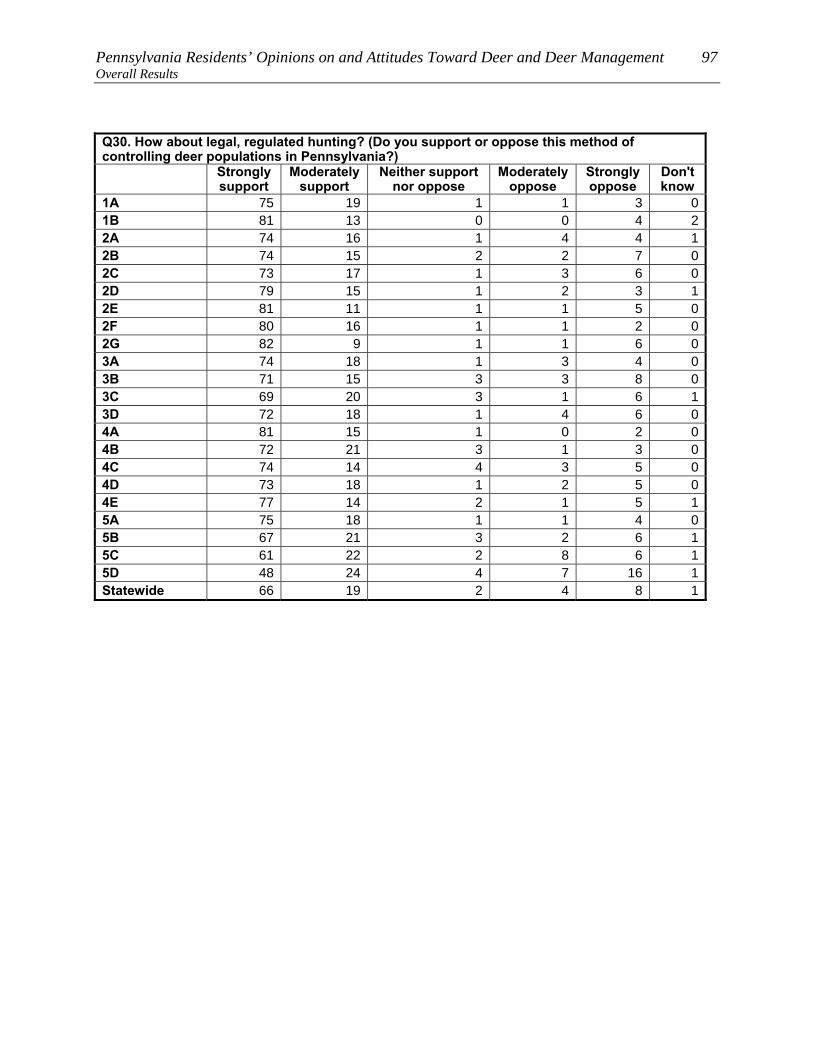
Pennsylvania Residents’ Opinions on and Attitudes Toward Deer and Deer Management 97 Overall Results
Q30. How about legal, regulated hunting? (Do you support or oppose this method of controlling deer populations in Pennsylvania?) Strongly
support Moderately
support Neither support
nor oppose Moderately
oppose Strongly oppose
Don't know
1A 75 19 1 1 3 01B 81 13 0 0 4 22A 74 16 1 4 4 12B 74 15 2 2 7 02C 73 17 1 3 6 02D 79 15 1 2 3 12E 81 11 1 1 5 02F 80 16 1 1 2 02G 82 9 1 1 6 03A 74 18 1 3 4 03B 71 15 3 3 8 03C 69 20 3 1 6 13D 72 18 1 4 6 04A 81 15 1 0 2 04B 72 21 3 1 3 04C 74 14 4 3 5 04D 73 18 1 2 5 04E 77 14 2 1 5 15A 75 18 1 1 4 05B 67 21 3 2 6 15C 61 22 2 8 6 15D 48 24 4 7 16 1Statewide 66 19 2 4 8 1
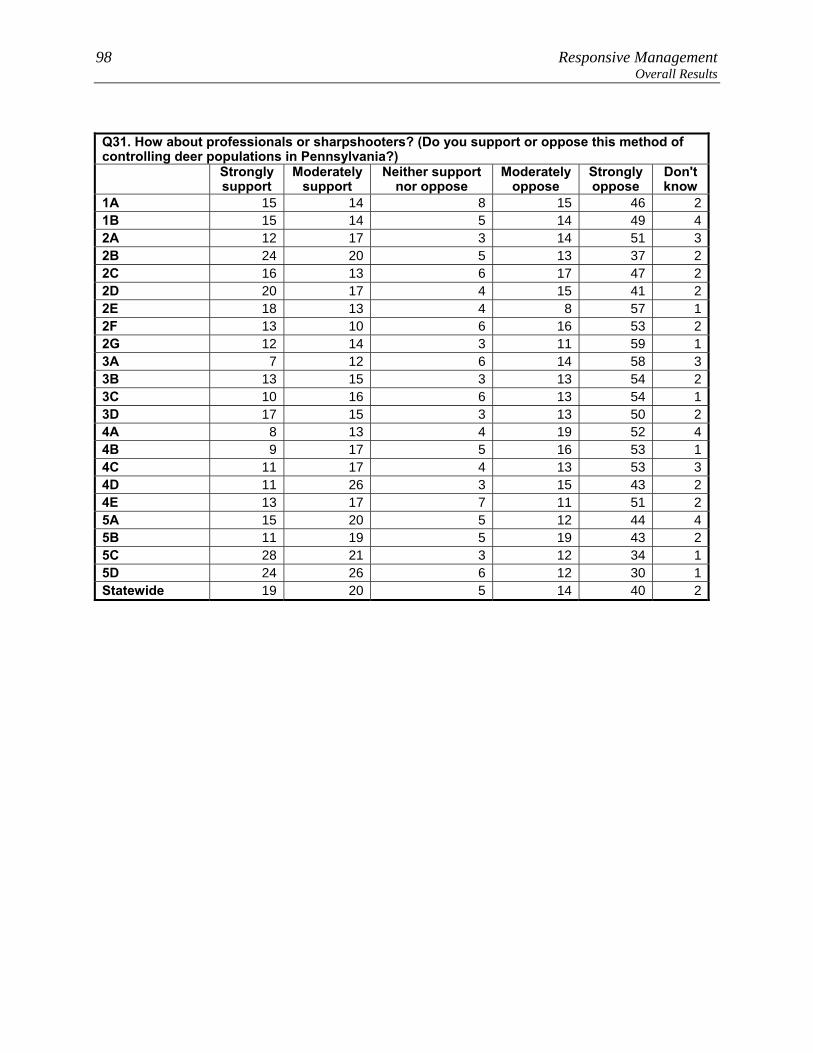
98 Responsive Management Overall Results
Q31. How about professionals or sharpshooters? (Do you support or oppose this method of controlling deer populations in Pennsylvania?) Strongly
support Moderately
support Neither support
nor oppose Moderately
oppose Strongly oppose
Don't know
1A 15 14 8 15 46 21B 15 14 5 14 49 42A 12 17 3 14 51 32B 24 20 5 13 37 22C 16 13 6 17 47 22D 20 17 4 15 41 22E 18 13 4 8 57 12F 13 10 6 16 53 22G 12 14 3 11 59 13A 7 12 6 14 58 33B 13 15 3 13 54 23C 10 16 6 13 54 13D 17 15 3 13 50 24A 8 13 4 19 52 44B 9 17 5 16 53 14C 11 17 4 13 53 34D 11 26 3 15 43 24E 13 17 7 11 51 25A 15 20 5 12 44 45B 11 19 5 19 43 25C 28 21 3 12 34 15D 24 26 6 12 30 1Statewide 19 20 5 14 40 2

Pennsylvania Residents’ Opinions on and Attitudes Toward Deer and Deer Management 99 Overall Results
Q32. How about trapping and killing? (Do you support or oppose this method of controlling deer populations in Pennsylvania?) Strongly
support Moderately
support Neither support
nor oppose Moderately
oppose Strongly oppose
Don't know
1A 16 14 3 11 55 21B 13 12 4 14 54 22A 12 13 4 16 53 22B 15 12 3 14 57 02C 13 11 5 11 58 32D 14 17 6 12 49 22E 16 10 2 7 64 12F 11 15 2 13 55 42G 17 13 4 10 55 13A 12 10 3 11 63 13B 6 12 1 13 67 03C 7 12 3 11 66 13D 8 12 2 13 63 14A 10 13 3 13 60 24B 10 16 2 13 56 24C 8 11 3 16 61 14D 7 18 2 15 57 04E 11 14 4 11 58 25A 11 8 3 13 63 15B 11 13 3 21 51 15C 12 16 3 12 56 25D 7 14 4 17 57 1Statewide 11 13 3 15 57 1
100 Responsive Management Overall Results
Q33. How about fertility or birth control? (Do you support or oppose this method of controlling deer populations in Pennsylvania?) Strongly
support Moderately
support Neither support
nor oppose Moderately
oppose Strongly oppose
Don't know
1A 19 15 9 12 40 51B 15 13 7 14 45 52A 20 16 6 13 40 52B 33 21 4 8 30 62C 18 17 6 11 44 52D 19 15 9 9 43 52E 19 11 6 11 47 62F 11 16 4 14 49 62G 4 13 9 9 61 33A 10 15 7 12 49 73B 17 20 7 10 44 33C 16 14 9 11 46 43D 19 19 8 13 39 34A 12 11 4 20 48 54B 13 17 6 12 45 64C 20 16 7 11 40 54D 17 20 8 12 41 14E 11 19 6 17 45 25A 18 20 7 11 39 45B 22 20 3 13 37 65C 29 22 4 12 31 25D 34 27 6 12 19 2Statewide 25 21 6 12 33 4
Pennsylvania Residents’ Opinions on and Attitudes Toward Deer and Deer Management 101 Overall Results
Q59/60. Deer hunts and/or allows others to deer hunt on property. (Among respondents living in a
single-family home.)
17
82
Less than 1%
0 20 40 60 80 100
Yes
No
Don't know
Percent (n=8206)

102 Responsive Management Overall Results
Q59/60. Deer hunts and/or allows others to deer hunt on property. (Among respondents living in a
single-family home.)
4
96
0 20 40 60 80 100
Yes
No
Percent
Lives in a single family home on 1 acre orless in an urban area, a suburban area,or a small city/town (n=3435)
Pennsylvania Residents’ Opinions on and Attitudes Toward Deer and Deer Management 103 Overall Results
Q59. Do you personally hunt deer on your property? (Asked of those whose primary place of residence is a single-family home.) Yes No Don't
know 1A 18 82 01B 21 79 02A 24 76 02B 5 95 02C 14 86 02D 16 84 02E 18 82 02F 15 85 0
2G 20 79 Less than 1%
3A 22 78 03B 6 94 03C 10 90 03D 8 92 04A 16 84 04B 20 80 04C 9 91 0
4D 13 86 Less than 1%
4E 18 82 05A 5 95 05B 10 90 05C 13 87 05D 3 97 0
Statewide 10 90 Less than 1%
104 Responsive Management Overall Results
Q60. Do you allow others to hunt deer with permission on your property? (Asked of those whose primary place of residence is a single-family home.) Yes No Don't
know 1A 26 74 11B 39 61 02A 33 67 02B 10 90 02C 19 80 12D 24 76 02E 33 67 02F 24 76 0
2G 31 68 Less than 1%
3A 41 59 03B 9 91 03C 18 82 03D 11 89 04A 22 77 14B 24 76 04C 14 86 04D 20 80 04E 24 76 0
5A 9 90 Less than 1%
5B 14 86 05C 14 86 0
5D 4 95 Less than 1%
Statewide 15 85 Less than 1%

Pennsylvania Residents’ Opinions on and Attitudes Toward Deer and Deer Management 105 Overall Results
Q59/60. Deer hunts and/or allows others to deer hunt on property. (Among respondents living in a single-family home.) Yes No Don't
know 1A 30 69 11B 41 59 02A 38 62 02B 12 88 02C 23 77 12D 29 71 02E 34 66 02F 27 73 02G 37 63 03A 42 58 03B 10 90 03C 21 79 03D 13 87 04A 23 76 14B 30 70 04C 15 85 04D 23 77 04E 29 71 0
5A 9 90 Less than 1%
5B 17 83 05C 18 82 0
5D 5 94 Less than 1%
Statewide 17 82 Less than 1%
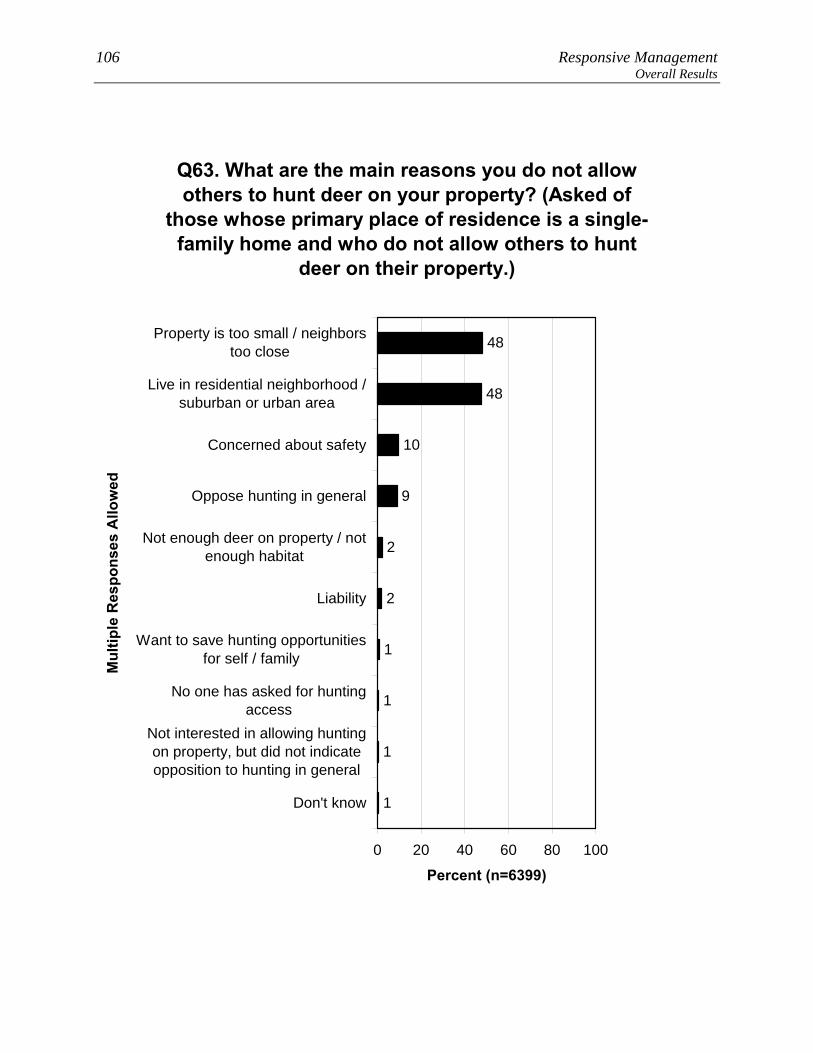
106 Responsive Management Overall Results
Q63. What are the main reasons you do not allow others to hunt deer on your property? (Asked of
those whose primary place of residence is a single-family home and who do not allow others to hunt
deer on their property.)
1
1
1
48
48
10
9
2
2
1
0 20 40 60 80 100
Property is too small / neighborstoo close
Live in residential neighborhood /suburban or urban area
Concerned about safety
Oppose hunting in general
Not enough deer on property / notenough habitat
Liability
Want to save hunting opportunitiesfor self / family
No one has asked for huntingaccess
Not interested in allowing huntingon property, but did not indicateopposition to hunting in general
Don't know
Mul
tiple
Res
pons
es A
llow
ed
Percent (n=6399)
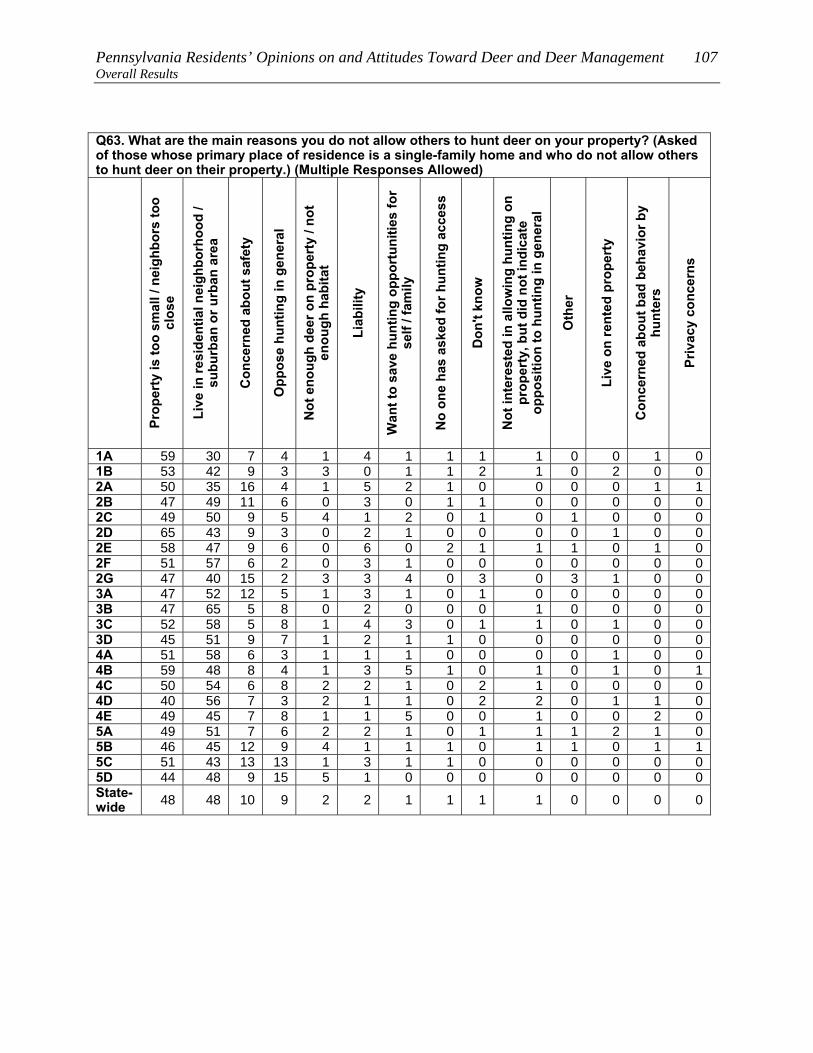
Pennsylvania Residents’ Opinions on and Attitudes Toward Deer and Deer Management 107 Overall Results Q63. What are the main reasons you do not allow others to hunt deer on your property? (Asked of those whose primary place of residence is a single-family home and who do not allow others to hunt deer on their property.) (Multiple Responses Allowed)
Prop
erty
is to
o sm
all /
nei
ghbo
rs to
o cl
ose
Live
in re
side
ntia
l nei
ghbo
rhoo
d /
subu
rban
or u
rban
are
a
Con
cern
ed a
bout
saf
ety
Opp
ose
hunt
ing
in g
ener
al
Not
eno
ugh
deer
on
prop
erty
/ no
t en
ough
hab
itat
Liab
ility
Wan
t to
save
hun
ting
oppo
rtun
ities
for
self
/ fam
ily
No
one
has
aske
d fo
r hun
ting
acce
ss
Don
't kn
ow
Not
inte
rest
ed in
allo
win
g hu
ntin
g on
pr
oper
ty, b
ut d
id n
ot in
dica
te
oppo
sitio
n to
hun
ting
in g
ener
al
Oth
er
Live
on
rent
ed p
rope
rty
Con
cern
ed a
bout
bad
beh
avio
r by
hunt
ers
Priv
acy
conc
erns
1A 59 30 7 4 1 4 1 1 1 1 0 0 1 01B 53 42 9 3 3 0 1 1 2 1 0 2 0 02A 50 35 16 4 1 5 2 1 0 0 0 0 1 12B 47 49 11 6 0 3 0 1 1 0 0 0 0 02C 49 50 9 5 4 1 2 0 1 0 1 0 0 02D 65 43 9 3 0 2 1 0 0 0 0 1 0 02E 58 47 9 6 0 6 0 2 1 1 1 0 1 02F 51 57 6 2 0 3 1 0 0 0 0 0 0 02G 47 40 15 2 3 3 4 0 3 0 3 1 0 03A 47 52 12 5 1 3 1 0 1 0 0 0 0 03B 47 65 5 8 0 2 0 0 0 1 0 0 0 03C 52 58 5 8 1 4 3 0 1 1 0 1 0 03D 45 51 9 7 1 2 1 1 0 0 0 0 0 04A 51 58 6 3 1 1 1 0 0 0 0 1 0 04B 59 48 8 4 1 3 5 1 0 1 0 1 0 14C 50 54 6 8 2 2 1 0 2 1 0 0 0 04D 40 56 7 3 2 1 1 0 2 2 0 1 1 04E 49 45 7 8 1 1 5 0 0 1 0 0 2 05A 49 51 7 6 2 2 1 0 1 1 1 2 1 05B 46 45 12 9 4 1 1 1 0 1 1 0 1 15C 51 43 13 13 1 3 1 1 0 0 0 0 0 05D 44 48 9 15 5 1 0 0 0 0 0 0 0 0State-wide 48 48 10 9 2 2 1 1 1 1 0 0 0 0
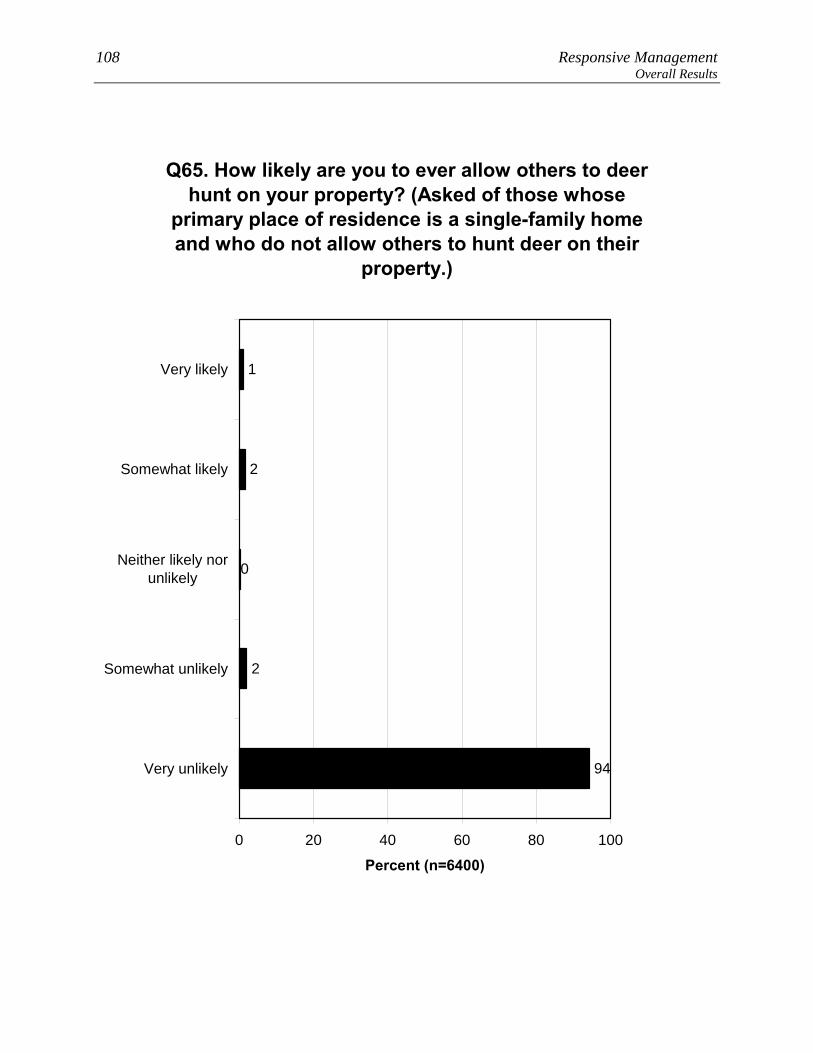
108 Responsive Management Overall Results
Q65. How likely are you to ever allow others to deer hunt on your property? (Asked of those whose
primary place of residence is a single-family home and who do not allow others to hunt deer on their
property.)
1
2
0
2
94
0 20 40 60 80 100
Very likely
Somewhat likely
Neither likely norunlikely
Somewhat unlikely
Very unlikely
Percent (n=6400)

Pennsylvania Residents’ Opinions on and Attitudes Toward Deer and Deer Management 109 Overall Results
Q65. How likely are you to ever allow others to deer hunt on your property? (Asked of those whose
primary place of residence is a single-family home and who do not allow others to hunt deer on their
property.)
1
1
0
2
97
0 20 40 60 80 100
Very likely
Somewhat likely
Neither likely norunlikely
Somewhatunlikely
Very unlikely
Percent
Lives in a single family home on 1acre or less in an urban area, asuburban area, or a smallcity/town (n=3302)
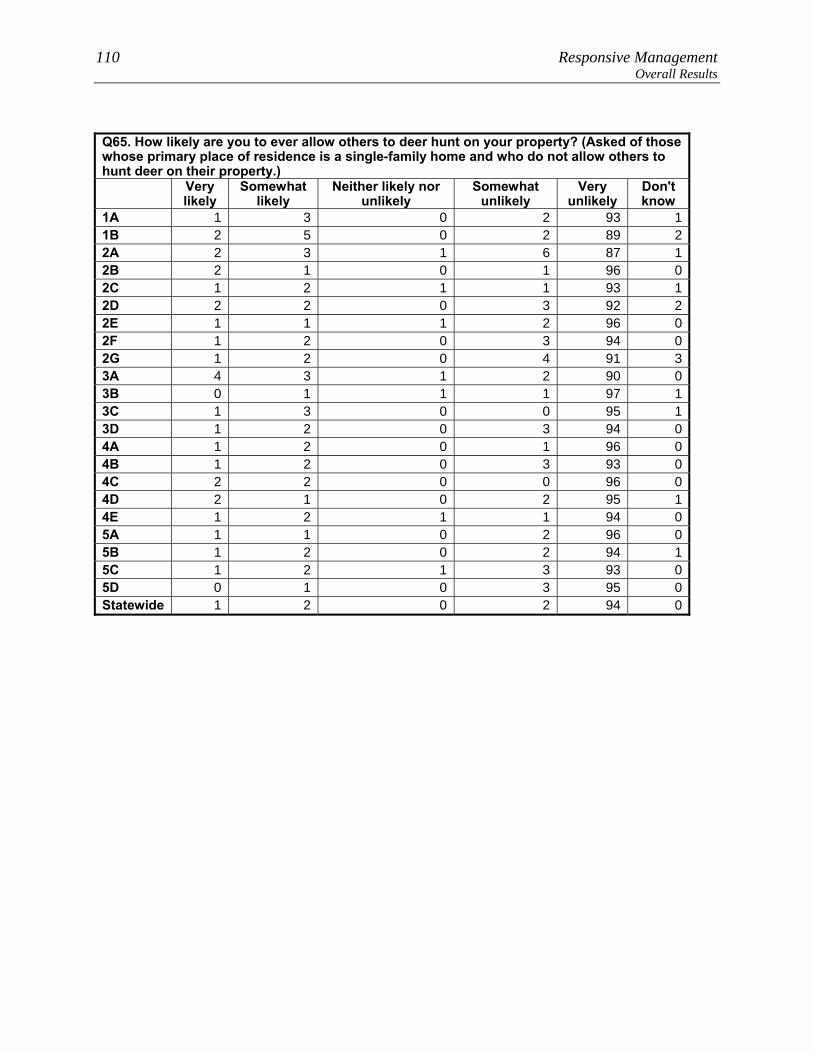
110 Responsive Management Overall Results
Q65. How likely are you to ever allow others to deer hunt on your property? (Asked of those whose primary place of residence is a single-family home and who do not allow others to hunt deer on their property.) Very
likely Somewhat
likely Neither likely nor
unlikely Somewhat
unlikely Very
unlikely Don't know
1A 1 3 0 2 93 11B 2 5 0 2 89 22A 2 3 1 6 87 12B 2 1 0 1 96 02C 1 2 1 1 93 12D 2 2 0 3 92 22E 1 1 1 2 96 02F 1 2 0 3 94 02G 1 2 0 4 91 33A 4 3 1 2 90 03B 0 1 1 1 97 13C 1 3 0 0 95 13D 1 2 0 3 94 04A 1 2 0 1 96 04B 1 2 0 3 93 04C 2 2 0 0 96 04D 2 1 0 2 95 14E 1 2 1 1 94 05A 1 1 0 2 96 05B 1 2 0 2 94 15C 1 2 1 3 93 05D 0 1 0 3 95 0Statewide 1 2 0 2 94 0
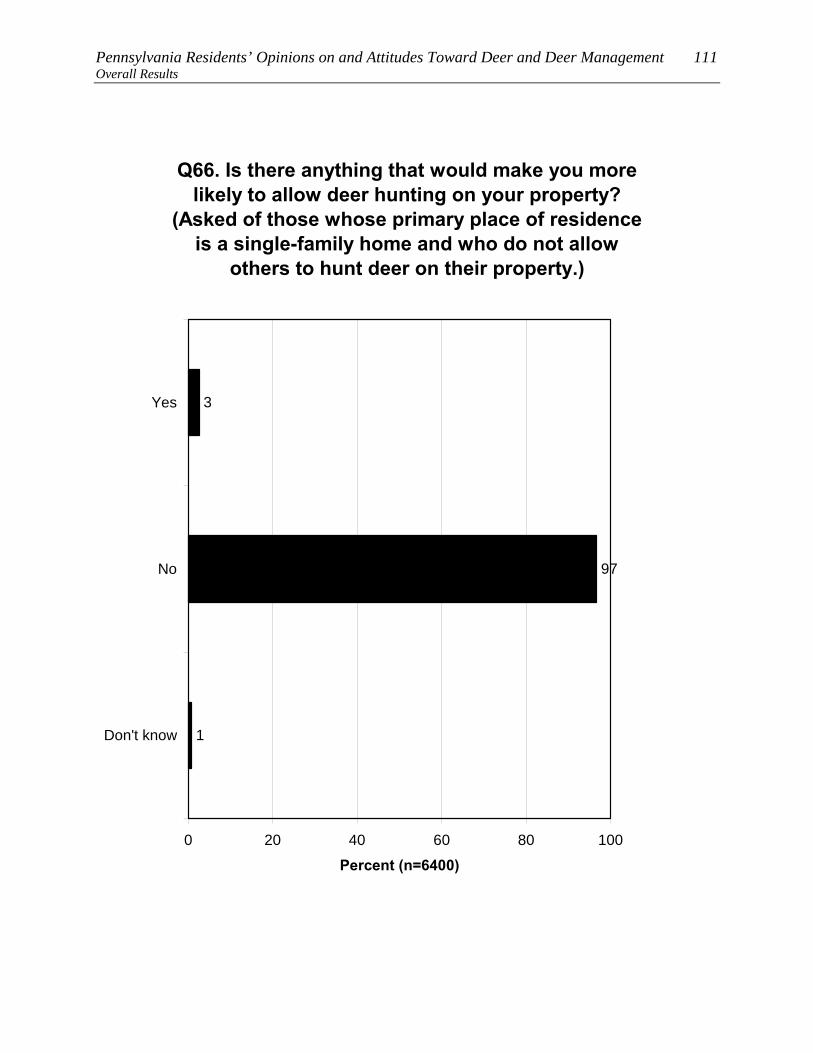
Pennsylvania Residents’ Opinions on and Attitudes Toward Deer and Deer Management 111 Overall Results
Q66. Is there anything that would make you more likely to allow deer hunting on your property?
(Asked of those whose primary place of residence is a single-family home and who do not allow
others to hunt deer on their property.)
3
97
1
0 20 40 60 80 100
Yes
No
Don't know
Percent (n=6400)
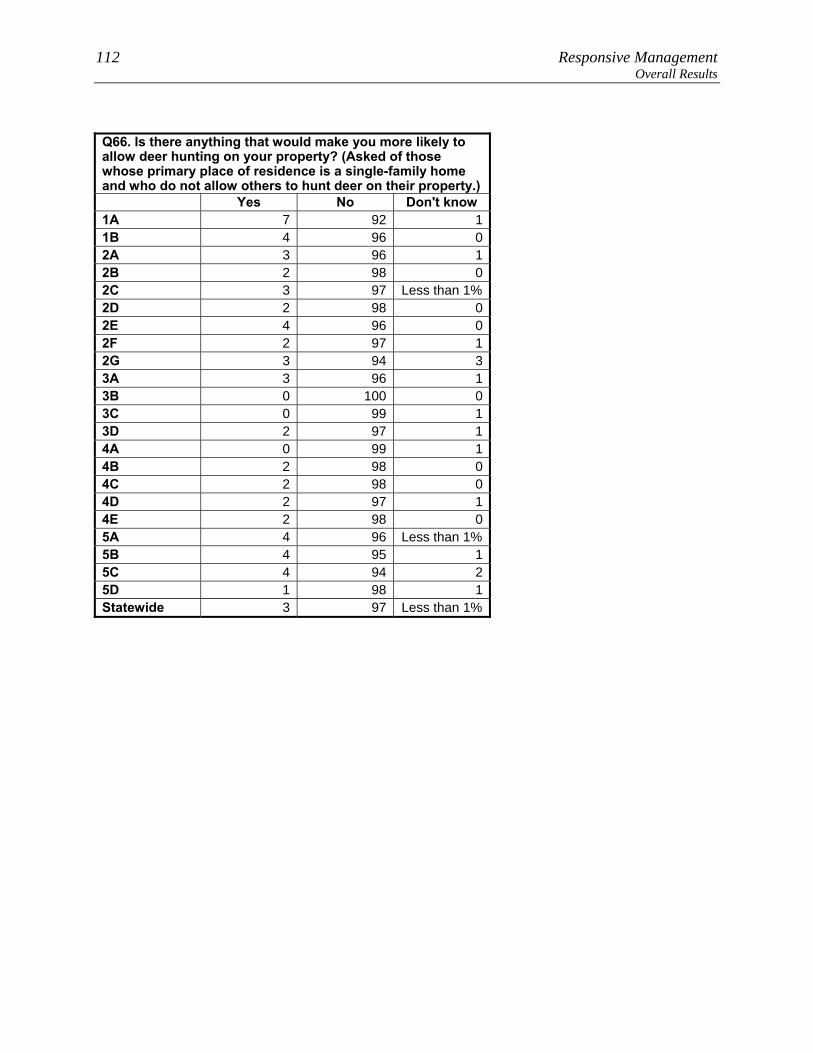
112 Responsive Management Overall Results
Q66. Is there anything that would make you more likely to allow deer hunting on your property? (Asked of those whose primary place of residence is a single-family home and who do not allow others to hunt deer on their property.) Yes No Don't know 1A 7 92 11B 4 96 02A 3 96 12B 2 98 02C 3 97 Less than 1%2D 2 98 02E 4 96 02F 2 97 12G 3 94 33A 3 96 13B 0 100 03C 0 99 13D 2 97 14A 0 99 14B 2 98 04C 2 98 04D 2 97 14E 2 98 05A 4 96 Less than 1%5B 4 95 15C 4 94 25D 1 98 1Statewide 3 97 Less than 1%

Pennsylvania Residents’ Opinions on and Attitudes Toward Deer and Deer Management 113 Overall Results
2
2
2
45
32
8
5
3
3
1
0 20 40 60 80 100
If hunter followed specific instructions andrestrictions
If had more land / lived in a more ruralarea
If regulations were lessened
If neighbors would agree / cooperate withus to allow hunting in area / neighborhood
If received compensation for allowingothers to hunt on land
If hunter demonstrated hunting proficiency
If hunter completed an advanced huntersafety course
If hunter had minimum level of huntingexperience
Other
Don't know
Mul
tiple
Res
pons
es A
llow
ed
Percent (n=158)
Q69. What would make you more likely to allow deer hunting on your property? (Asked of those whose primary place of residence is a single-family home and who do not
allow others to hunt deer on their property but who say that there is something that would make them more likely
to allow deer hunting on their property.)
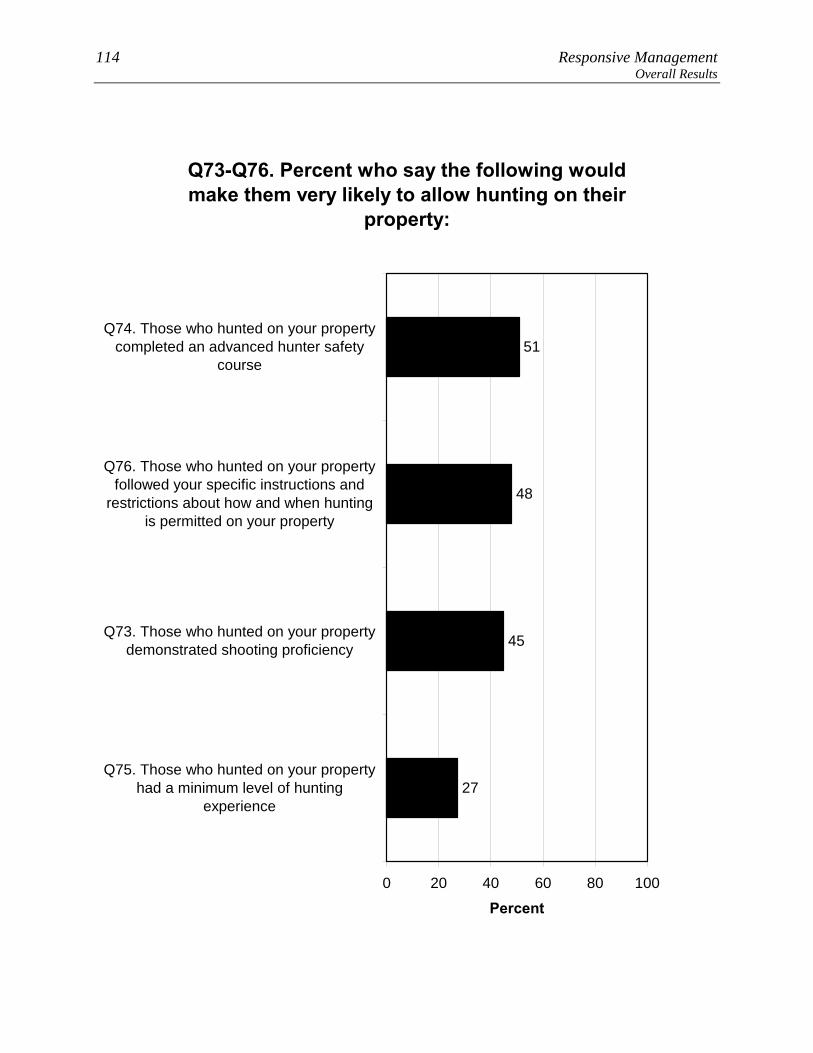
114 Responsive Management Overall Results
Q73-Q76. Percent who say the following would make them very likely to allow hunting on their
property:
27
45
48
51
0 20 40 60 80 100
Q74. Those who hunted on your propertycompleted an advanced hunter safety
course
Q76. Those who hunted on your propertyfollowed your specific instructions and
restrictions about how and when huntingis permitted on your property
Q73. Those who hunted on your propertydemonstrated shooting proficiency
Q75. Those who hunted on your propertyhad a minimum level of hunting
experience
Percent
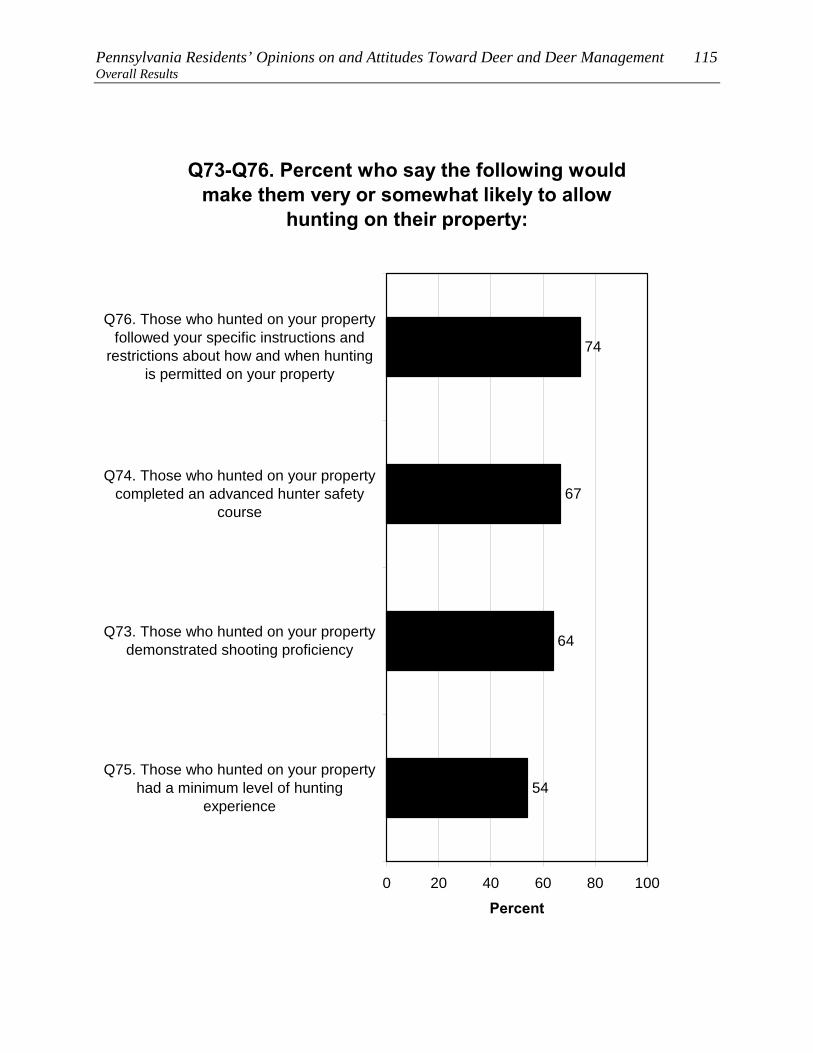
Pennsylvania Residents’ Opinions on and Attitudes Toward Deer and Deer Management 115 Overall Results
Q73-Q76. Percent who say the following would make them very or somewhat likely to allow
hunting on their property:
54
64
67
74
0 20 40 60 80 100
Q76. Those who hunted on your propertyfollowed your specific instructions and
restrictions about how and when huntingis permitted on your property
Q74. Those who hunted on your propertycompleted an advanced hunter safety
course
Q73. Those who hunted on your propertydemonstrated shooting proficiency
Q75. Those who hunted on your propertyhad a minimum level of hunting
experience
Percent

116 Responsive Management Overall Results
Q73-Q76. Percent who say the following would make them somewhat or very unlikely to allow
hunting on their property:
41
31
30
25
0 20 40 60 80 100
Q75. Those who hunted on your propertyhad a minimum level of hunting
experience
Q73. Those who hunted on your propertydemonstrated shooting proficiency
Q74. Those who hunted on your propertycompleted an advanced hunter safety
course
Q76. Those who hunted on your propertyfollowed your specific instructions and
restrictions about how and when huntingis permitted on your property
Percent
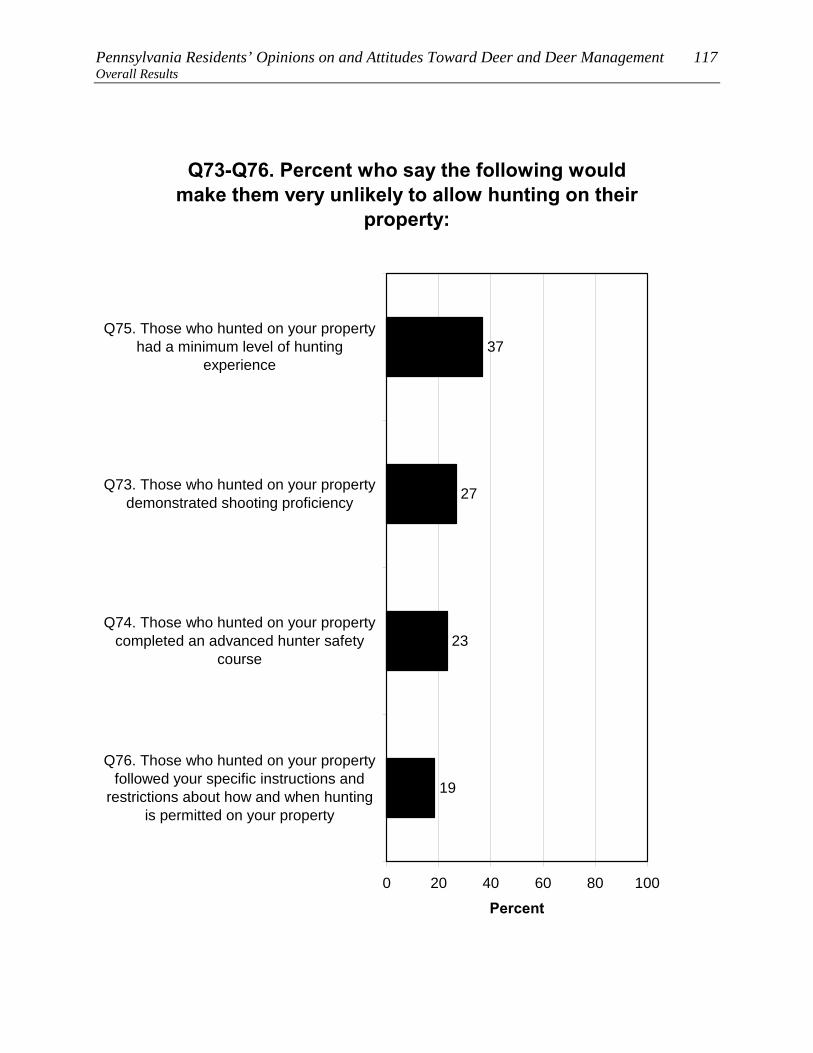
Pennsylvania Residents’ Opinions on and Attitudes Toward Deer and Deer Management 117 Overall Results
Q73-Q76. Percent who say the following would make them very unlikely to allow hunting on their
property:
19
23
27
37
0 20 40 60 80 100
Q75. Those who hunted on your propertyhad a minimum level of hunting
experience
Q73. Those who hunted on your propertydemonstrated shooting proficiency
Q74. Those who hunted on your propertycompleted an advanced hunter safety
course
Q76. Those who hunted on your propertyfollowed your specific instructions and
restrictions about how and when huntingis permitted on your property
Percent

118 Responsive Management Overall Results
Q73. How about if those who hunted on your property demonstrated shooting proficiency, such as the ability to consistently hit a target from 20 yards? (How likely would you be to allow deer hunting on your property if this requirement was met?) (Asked of those whose primary place of residence is a single-family home and who do not allow others to hunt deer on their property.) Very
likely Somewhat
likely Neither likely nor
unlikely Somewhat
unlikely Very
unlikely Don't know
1A 29 42 0 0 21 71B 66 10 0 0 6 182A 50 21 13 0 16 02B 70 19 0 0 11 02C 43 12 0 0 37 92D 59 41 0 0 0 02E 4 4 0 0 92 02F 45 55 0 0 0 02G 71 0 9 0 9 113A 58 14 0 0 27 03B 100 0 0 0 0 03C 0 0 100 0 0 03D 57 16 0 0 27 04A 33 0 33 0 33 04B 48 14 0 0 0 384C 93 7 0 0 0 04D 78 0 13 0 8 04E 56 8 10 0 25 05A 15 5 0 0 80 05B 18 13 10 14 45 05C 67 14 0 9 10 05D 0 50 0 0 50 0Statewide 45 19 3 5 27 2

Pennsylvania Residents’ Opinions on and Attitudes Toward Deer and Deer Management 119 Overall Results
Q74. How about if those who hunted on your property completed an advanced hunter safety course? (How likely would you be to allow deer hunting on your property if this requirement was met?) (Asked of those whose primary place of residence is a single-family home and who do not allow others to hunt deer on their property.) Very
likely Somewhat
likely Neither likely nor
unlikely Somewhat
unlikely Very
unlikely Don't know
1A 31 33 0 7 29 01B 89 6 0 0 6 02A 86 6 0 0 7 02B 89 0 0 0 11 02C 49 6 0 37 8 02D 59 41 0 0 0 02E 4 4 0 4 88 02F 45 18 37 0 0 02G 60 0 20 11 9 03A 58 14 0 0 27 03B 100 0 0 0 0 03C 0 0 100 0 0 03D 54 19 0 0 27 04A 0 33 33 0 33 04B 48 0 0 20 14 184C 83 8 0 0 8 04D 78 0 0 0 8 134E 33 15 10 0 41 05A 15 5 0 0 80 05B 35 23 0 14 28 05C 64 9 8 9 10 05D 0 50 0 0 50 0Statewide 51 16 3 7 23 0
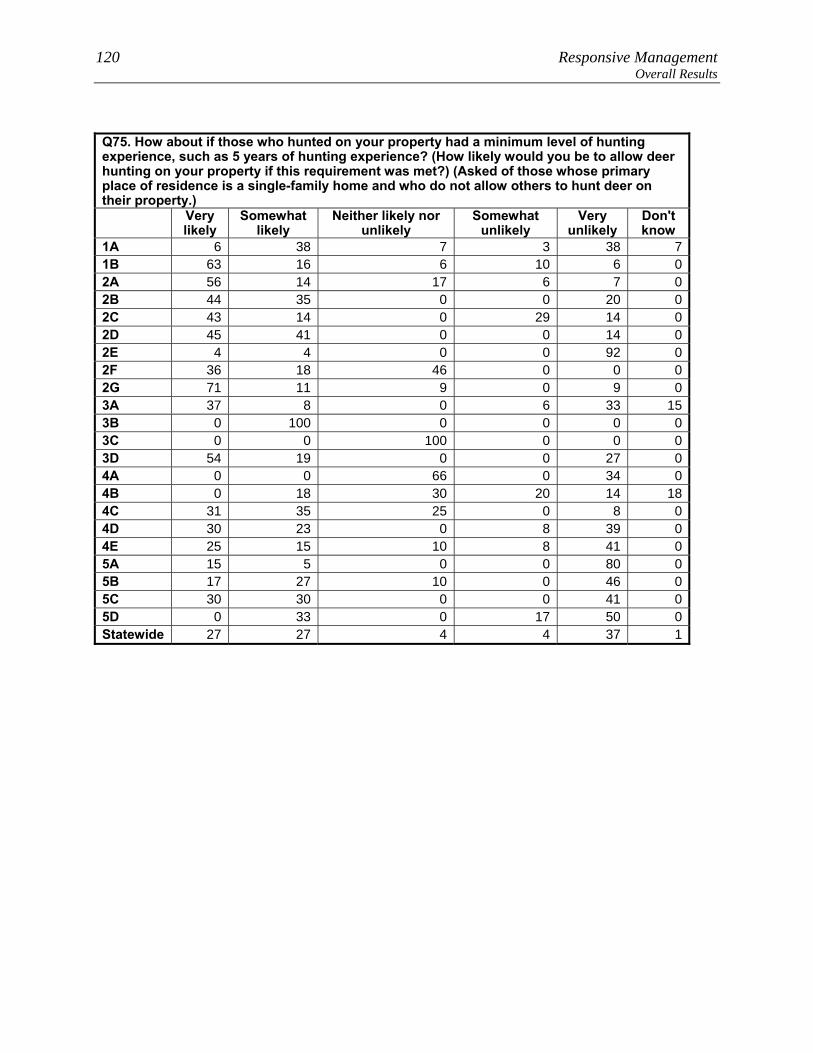
120 Responsive Management Overall Results
Q75. How about if those who hunted on your property had a minimum level of hunting experience, such as 5 years of hunting experience? (How likely would you be to allow deer hunting on your property if this requirement was met?) (Asked of those whose primary place of residence is a single-family home and who do not allow others to hunt deer on their property.) Very
likely Somewhat
likely Neither likely nor
unlikely Somewhat
unlikely Very
unlikely Don't know
1A 6 38 7 3 38 71B 63 16 6 10 6 02A 56 14 17 6 7 02B 44 35 0 0 20 02C 43 14 0 29 14 02D 45 41 0 0 14 02E 4 4 0 0 92 02F 36 18 46 0 0 02G 71 11 9 0 9 03A 37 8 0 6 33 153B 0 100 0 0 0 03C 0 0 100 0 0 03D 54 19 0 0 27 04A 0 0 66 0 34 04B 0 18 30 20 14 184C 31 35 25 0 8 04D 30 23 0 8 39 04E 25 15 10 8 41 05A 15 5 0 0 80 05B 17 27 10 0 46 05C 30 30 0 0 41 05D 0 33 0 17 50 0Statewide 27 27 4 4 37 1
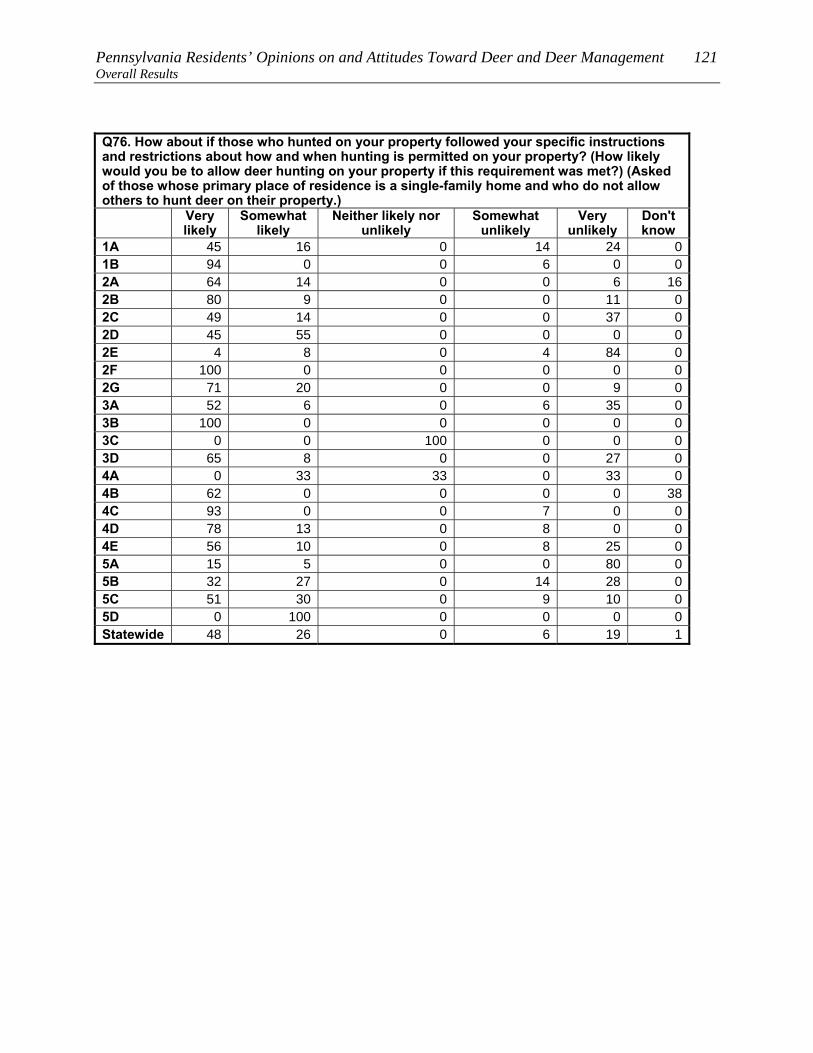
Pennsylvania Residents’ Opinions on and Attitudes Toward Deer and Deer Management 121 Overall Results
Q76. How about if those who hunted on your property followed your specific instructions and restrictions about how and when hunting is permitted on your property? (How likely would you be to allow deer hunting on your property if this requirement was met?) (Asked of those whose primary place of residence is a single-family home and who do not allow others to hunt deer on their property.) Very
likely Somewhat
likely Neither likely nor
unlikely Somewhat
unlikely Very
unlikely Don't know
1A 45 16 0 14 24 01B 94 0 0 6 0 02A 64 14 0 0 6 162B 80 9 0 0 11 02C 49 14 0 0 37 02D 45 55 0 0 0 02E 4 8 0 4 84 02F 100 0 0 0 0 02G 71 20 0 0 9 03A 52 6 0 6 35 03B 100 0 0 0 0 03C 0 0 100 0 0 03D 65 8 0 0 27 04A 0 33 33 0 33 04B 62 0 0 0 0 384C 93 0 0 7 0 04D 78 13 0 8 0 04E 56 10 0 8 25 05A 15 5 0 0 80 05B 32 27 0 14 28 05C 51 30 0 9 10 05D 0 100 0 0 0 0Statewide 48 26 0 6 19 1
122 Responsive Management Overall Results
CONCERNS ABOUT DEER AND DEER NUISANCE PROBLEMS Seven questions asked about respondents’ level of concern about issues associated with deer.
For each issue, respondents rated their level of concern about it using a 10-point scale, with
10 being the most concerned.
• The most concern was for tick-borne diseases (mean rating of 7.4) and deer-vehicle
accidents (7.0), followed by two more whose means are just under those top two: the
health of the deer population (6.2) and the quality of deer habitat (5.9).
• At the bottom are concern about deer impacts on habitat and other wildlife (even
though this can be considerable) (3.9) and the two impacts to residents’ landscaping:
deer damage to plants and landscaping (2.5) and deer droppings in the yard (1.7).
o Another graph shows the percentages giving ratings of “9” or “10.” This gives an
idea of the percentage who feel strongly about the issues. The ranking is the same,
with tick-borne diseases (46% gave a high rating) and deer-vehicle accidents (45%
gave a high rating) at the top.
Just under two-thirds of Pennsylvania residents (61%) have seen deer on their property in the
past 12 months, with a quarter of residents (26%) saying that they saw them frequently. A
map shows the results by WMU for seeing deer “frequently.”
• Those who fed birds, compared to those who did not, were more likely to see deer
(67% of those who fed birds, and 56% of those who did not). Also, those who fed deer
or put out attractants, compared to those who did not, were much more likely to see
deer (89% compared to 59%). Finally, those who said that they were aware of
neighbors feeding deer or putting out attractants, compared to those who were not,
were also much more likely to see deer (90% compared to 58%).
Pennsylvania Residents’ Opinions on and Attitudes Toward Deer and Deer Management 123 Overall Results
The survey asked about specific nuisance problems with deer that Pennsylvania residents
may have experienced, and 12% indicated that they experienced problems with deer at their
primary place of residence in the past 12 months (a map shows results by WMU for this
question). Another question asked about deer-vehicle collisions, and 13% indicated that they
or another household member had been in a vehicle collision with a deer (only about 1 in 20
respondents to this question indicated that either the driver or passengers were injured).
Finally, 4% indicated that they or a household member had been diagnosed with a tick-borne
disease.
• Those who fed birds were about the same as those who did not regarding experiencing
deer problems at their residence. However, those who indicated that their neighbors
fed deer or put out attractants, compared to those who did not, were about twice as
likely to say that they experienced deer problems in the past 12 months.
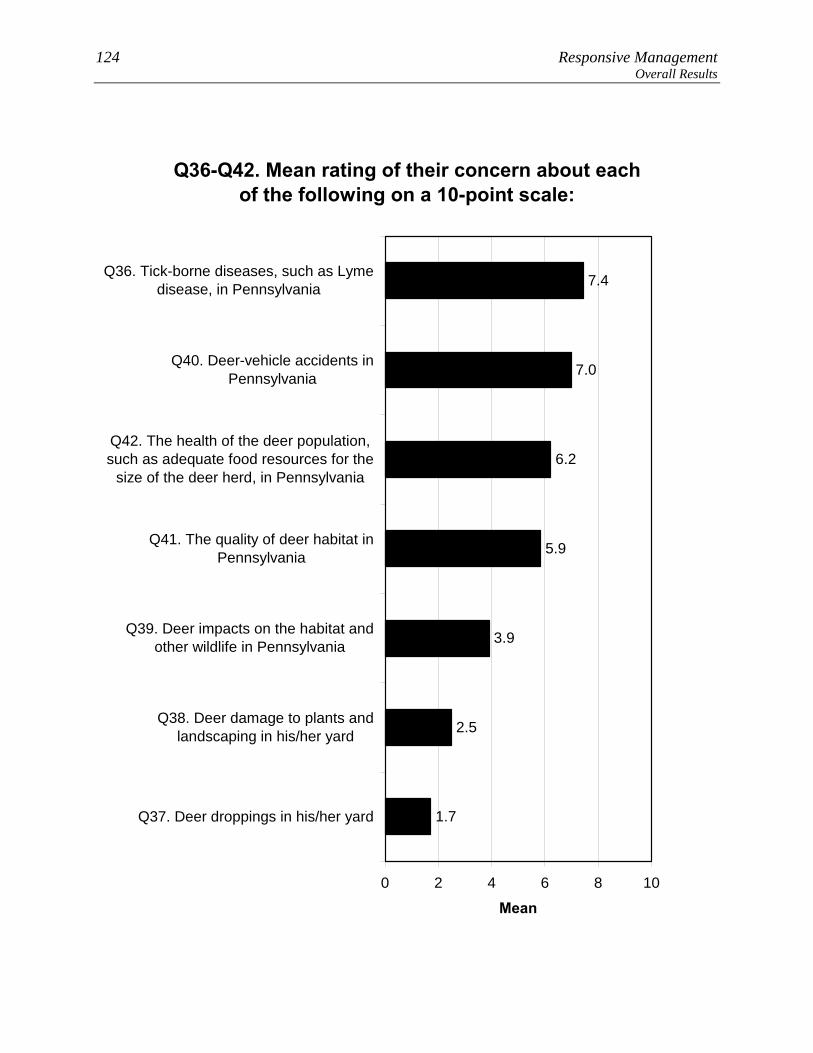
124 Responsive Management Overall Results
Q36-Q42. Mean rating of their concern about each of the following on a 10-point scale:
2.5
3.9
5.9
6.2
7.0
7.4
1.7
0 2 4 6 8 10
Q36. Tick-borne diseases, such as Lymedisease, in Pennsylvania
Q40. Deer-vehicle accidents inPennsylvania
Q42. The health of the deer population,such as adequate food resources for the
size of the deer herd, in Pennsylvania
Q41. The quality of deer habitat inPennsylvania
Q39. Deer impacts on the habitat andother wildlife in Pennsylvania
Q38. Deer damage to plants andlandscaping in his/her yard
Q37. Deer droppings in his/her yard
Mean

Pennsylvania Residents’ Opinions on and Attitudes Toward Deer and Deer Management 125 Overall Results
Q36-Q42. Percent who rated their concern about each of the following as a 9 or 10 on a 10-point
scale:
10
16
17
19
45
46
7
0 20 40 60 80 100
Q36. Tick-borne diseases, such as Lymedisease, in Pennsylvania
Q40. Deer-vehicle accidents inPennsylvania
Q42. The health of the deer population,such as adequate food resources for the
size of the deer herd, in Pennsylvania
Q41. The quality of deer habitat inPennsylvania
Q38. Deer damage to plants andlandscaping in his/her yard
Q39. Deer impacts on the habitat andother wildlife in Pennsylvania
Q37. Deer droppings in his/her yard
Percent
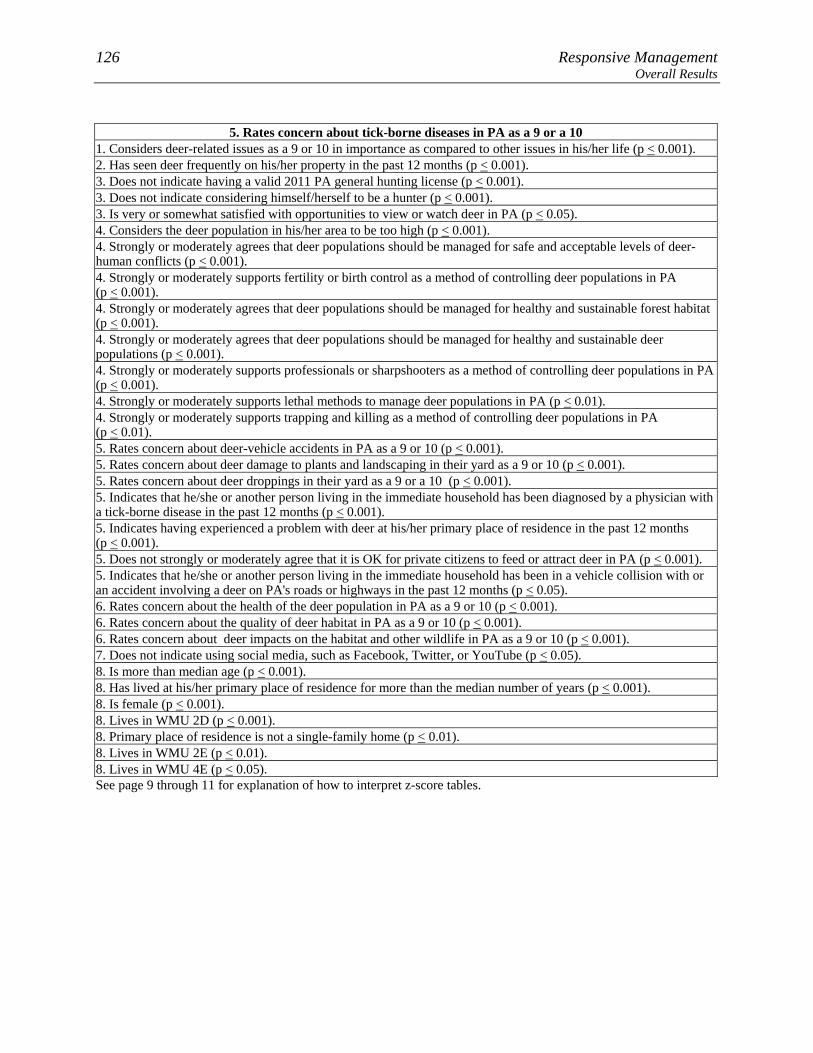
126 Responsive Management Overall Results
5. Rates concern about tick-borne diseases in PA as a 9 or a 10
1. Considers deer-related issues as a 9 or 10 in importance as compared to other issues in his/her life (p < 0.001). 2. Has seen deer frequently on his/her property in the past 12 months (p < 0.001). 3. Does not indicate having a valid 2011 PA general hunting license (p < 0.001). 3. Does not indicate considering himself/herself to be a hunter (p < 0.001). 3. Is very or somewhat satisfied with opportunities to view or watch deer in PA (p < 0.05). 4. Considers the deer population in his/her area to be too high (p < 0.001). 4. Strongly or moderately agrees that deer populations should be managed for safe and acceptable levels of deer-human conflicts (p < 0.001). 4. Strongly or moderately supports fertility or birth control as a method of controlling deer populations in PA (p < 0.001). 4. Strongly or moderately agrees that deer populations should be managed for healthy and sustainable forest habitat (p < 0.001). 4. Strongly or moderately agrees that deer populations should be managed for healthy and sustainable deer populations (p < 0.001). 4. Strongly or moderately supports professionals or sharpshooters as a method of controlling deer populations in PA(p < 0.001). 4. Strongly or moderately supports lethal methods to manage deer populations in PA (p < 0.01). 4. Strongly or moderately supports trapping and killing as a method of controlling deer populations in PA (p < 0.01). 5. Rates concern about deer-vehicle accidents in PA as a 9 or 10 (p < 0.001). 5. Rates concern about deer damage to plants and landscaping in their yard as a 9 or 10 (p < 0.001). 5. Rates concern about deer droppings in their yard as a 9 or a 10 (p < 0.001). 5. Indicates that he/she or another person living in the immediate household has been diagnosed by a physician with a tick-borne disease in the past 12 months (p < 0.001). 5. Indicates having experienced a problem with deer at his/her primary place of residence in the past 12 months (p < 0.001). 5. Does not strongly or moderately agree that it is OK for private citizens to feed or attract deer in PA (p < 0.001). 5. Indicates that he/she or another person living in the immediate household has been in a vehicle collision with or an accident involving a deer on PA's roads or highways in the past 12 months (p < 0.05). 6. Rates concern about the health of the deer population in PA as a 9 or 10 (p < 0.001). 6. Rates concern about the quality of deer habitat in PA as a 9 or 10 (p < 0.001). 6. Rates concern about deer impacts on the habitat and other wildlife in PA as a 9 or 10 (p < 0.001). 7. Does not indicate using social media, such as Facebook, Twitter, or YouTube (p < 0.05). 8. Is more than median age (p < 0.001). 8. Has lived at his/her primary place of residence for more than the median number of years (p < 0.001). 8. Is female (p < 0.001). 8. Lives in WMU 2D (p < 0.001). 8. Primary place of residence is not a single-family home (p < 0.01). 8. Lives in WMU 2E (p < 0.01). 8. Lives in WMU 4E (p < 0.05). See page 9 through 11 for explanation of how to interpret z-score tables.

Pennsylvania Residents’ Opinions on and Attitudes Toward Deer and Deer Management 127 Overall Results
5. Does not rate concern about tick-borne diseases in PA as a 9 or a 10 1. Does not consider deer-related issues as a 9 or 10 in importance as compared to other issues in his/her life (p < 0.001). 2. Does not indicate having seen deer frequently on his/her property in the past 12 months (p < 0.001). 3. Has a valid 2011 PA general hunting license (p < 0.001). 3. Considers himself/herself to be a hunter (p < 0.001). 3. Does not indicate being very or somewhat satisfied with opportunities to view or watch deer in PA (p < 0.05). 4. Does not consider the deer population in his/her area to be too high (p < 0.001). 4. Does not strongly or moderately agree that deer populations should be managed for safe and acceptable levels of deer-human conflicts (p < 0.001). 4. Does not strongly or moderately support fertility or birth control as a method of controlling deer populations in PA (p < 0.001). 4. Does not strongly or moderately agree that deer populations should be managed for healthy and sustainable forest habitat (p < 0.001). 4. Does not strongly or moderately agree that deer populations should be managed for healthy and sustainable deer populations (p < 0.001). 4. Does not strongly or moderately support professionals or sharpshooters as a method of controlling deer populations in PA (p < 0.001). 4. Does not strongly or moderately support lethal methods to manage deer populations in PA (p < 0.01). 4. Does not strongly or moderately support trapping and killing as a method of controlling deer populations in PA (p < 0.01). 5. Does not rate concern about deer-vehicle accidents in PA as a 9 or 10 (p < 0.001). 5. Does not rate concern about deer damage to plants and landscaping in their yard as a 9 or 10 (p < 0.001). 5. Does not rate concern about deer droppings in their yard as a 9 or a 10 (p < 0.001). 5. Does not indicate that he/she or another person living in the immediate household has been diagnosed by a physician with a tick-borne disease in the past 12 months (p < 0.001). 5. Does not indicate having experienced any problems with deer at his/her primary place of residence in the past 12 months (p < 0.001). 5. Strongly or moderately agrees that it is OK for private citizens to feed or attract deer in PA (p < 0.001). 5. Does not indicate that he/she or another person living in the immediate household has been in a vehicle collision with or an accident involving a deer on PA's roads or highways in the past 12 months (p < 0.05). 6. Does not rate concern about the health of the deer population in PA as a 9 or 10 (p < 0.001). 6. Does not rate concern about the quality of deer habitat in PA as a 9 or 10 (p < 0.001). 6. Does not rate concern about deer impacts on the habitat and other wildlife in PA as a 9 or 10 (p < 0.001). 7. Uses social media, such as Facebook, Twitter, or YouTube (p < 0.05). 8. Is the median age or younger (p < 0.001). 8. Has lived at his/her primary place of residence for the median number of years or less (p < 0.001). 8. Is male (p < 0.001). 8. Lives in WMU 3A (p < 0.001). 8. Lives in WMU 4D (p < 0.01). 8. Primary place of residence is a single-family home (p < 0.01). 8. Lives in WMU 1B (p < 0.05). 8. Lives in WMU 5B (p < 0.05). See page 9 through 11 for explanation of how to interpret z-score tables.

128 Responsive Management Overall Results
5. Rates concern about deer droppings in their yard as a 9 or a 10
1. Considers deer-related issues as a 9 or 10 in importance as compared to other issues in his/her life (p < 0.05). 2. Has seen deer frequently on his/her property in the past 12 months (p < 0.001). 3. Does not Indicate that he/she or any of his/her family members hunt (p < 0.001). 3. Does not indicate considering himself/herself to be a hunter (p < 0.001). 3. Does not indicate having a valid 2011 PA general hunting license (p < 0.001). 3. Does not indicate having taken a trip more than a mile from home for the primary purpose of viewing or watching deer in the past 12 months (p < 0.001). 3. Does not indicate having fed birds or made birdfeed available on his/her property in the past 12 months (p < 0.001). 3. Does not indicate having fed deer intentionally or having put out attractants in the past 12 months (p < 0.001). 3. Does not indicate having spent time viewing or watching deer around home in the past 12 months (p < 0.05). 4. Considers the deer population in his/her area to be too high (p < 0.001). 4. Strongly or moderately supports fertility or birth control as a method of controlling deer populations in PA (p < 0.001). 4. Strongly or moderately supports professionals or sharpshooters as a method of controlling deer populations in PA(p < 0.001). 4. Strongly or moderately agrees that deer populations should be managed for safe and acceptable levels of deer-human conflicts (p < 0.001). 4. Strongly or moderately supports trapping and killing as a method of controlling deer populations in PA (p < 0.001). 4. Strongly or moderately agrees that deer populations should be managed for healthy and sustainable forest habitat (p < 0.01). 4. Strongly or moderately supports lethal methods to manage deer populations in PA (p < 0.05). 5. Rates concern about deer damage to plants and landscaping in their yard as a 9 or 10 (p < 0.001). 5. Rates concern about deer-vehicle accidents in PA as a 9 or 10 (p < 0.001). 5. Rates concern about tick-borne diseases in PA as a 9 or a 10 (p < 0.001). 5. Indicates having experienced a problem with deer at his/her primary place of residence in the past 12 months (p < 0.001). 5. Does not strongly or moderately agree that it is OK for private citizens to feed or attract deer in PA (p < 0.001). 5. Indicates that he/she or another person living in the immediate household has been in a vehicle collision with or an accident involving a deer on PA's roads or highways in the past 12 months (p < 0.01). 6. Rates concern about deer impacts on the habitat and other wildlife in PA as a 9 or 10 (p < 0.001). 6. Rates concern about the health of the deer population in PA as a 9 or 10 (p < 0.001). 6. Rates concern about the quality of deer habitat in PA as a 9 or 10 (p < 0.001). 8. Is female (p < 0.001). 8. Is more than median age (p < 0.001). 8. Lives in WMU 5D (p < 0.001). 8. Lives in WMU 2B (p < 0.001). 8. Considers place of residence to be an urban or suburban area (p < 0.001). 8. Has lived at his/her primary place of residence for more than the median number of years (p < 0.001). 8. Has the median number or fewer people living in his/her household (p < 0.05). See page 9 through 11 for explanation of how to interpret z-score tables.

Pennsylvania Residents’ Opinions on and Attitudes Toward Deer and Deer Management 129 Overall Results
5. Does not rate concern about deer droppings in their yard as a 9 or a 10 1. Does not consider deer-related issues as a 9 or 10 in importance as compared to other issues in his/her life (p < 0.05). 2. Does not indicate having seen deer frequently on his/her property in the past 12 months (p < 0.001). 3. Indicates that he/she or a family member hunts (p < 0.001). 3. Considers himself/herself to be a hunter (p < 0.001). 3. Has a valid 2011 PA general hunting license (p < 0.001). 3. Has taken a trip more than a mile from home for the primary purpose of viewing or watching deer in the past 12 months (p < 0.001). 3. Fed birds or make birdfeed available on his/her property in the past 12 months (p < 0.001). 3. Fed deer intentionally or put out attractants in the past 12 months (p < 0.001). 3. Has spent time viewing or watching deer around home in the past 12 months (p < 0.05). 4. Does not consider the deer population in his/her area to be too high (p < 0.001). 4. Does not strongly or moderately support fertility or birth control as a method of controlling deer populations in PA (p < 0.001). 4. Does not strongly or moderately support professionals or sharpshooters as a method of controlling deer populations in PA (p < 0.001). 4. Does not strongly or moderately agree that deer populations should be managed for safe and acceptable levels of deer-human conflicts (p < 0.001). 4. Does not strongly or moderately support trapping and killing as a method of controlling deer populations in PA (p < 0.001). 4. Does not strongly or moderately agree that deer populations should be managed for healthy and sustainable forest habitat (p < 0.01). 4. Does not strongly or moderately support lethal methods to manage deer populations in PA (p < 0.05). 5. Does not rate concern about deer damage to plants and landscaping in their yard as a 9 or 10 (p < 0.001). 5. Does not rate concern about deer-vehicle accidents in PA as a 9 or 10 (p < 0.001). 5. Does not rate concern about tick-borne diseases in PA as a 9 or a 10 (p < 0.001). 5. Does not indicate having experienced any problems with deer at his/her primary place of residence in the past 12 months (p < 0.001). 5. Strongly or moderately agrees that it is OK for private citizens to feed or attract deer in PA (p < 0.001). 5. Does not indicate that he/she or another person living in the immediate household has been in a vehicle collision with or an accident involving a deer on PA's roads or highways in the past 12 months (p < 0.01). 6. Does not rate concern about deer impacts on the habitat and other wildlife in PA as a 9 or 10 (p < 0.001). 6. Does not rate concern about the health of the deer population in PA as a 9 or 10 (p < 0.001). 6. Does not rate concern about the quality of deer habitat in PA as a 9 or 10 (p < 0.001). 8. Is male (p < 0.001). 8. Is the median age or younger (p < 0.001). 8. Does not consider place of residence to be an urban or suburban area (p < 0.001). 8. Has lived at his/her primary place of residence for the median number of years or less (p < 0.001). 8. Lives in WMU 4D (p < 0.001). 8. Lives in WMU 2G (p < 0.01). 8. Has more than median number of people living in his/her household (p < 0.05). See page 9 through 11 for explanation of how to interpret z-score tables.
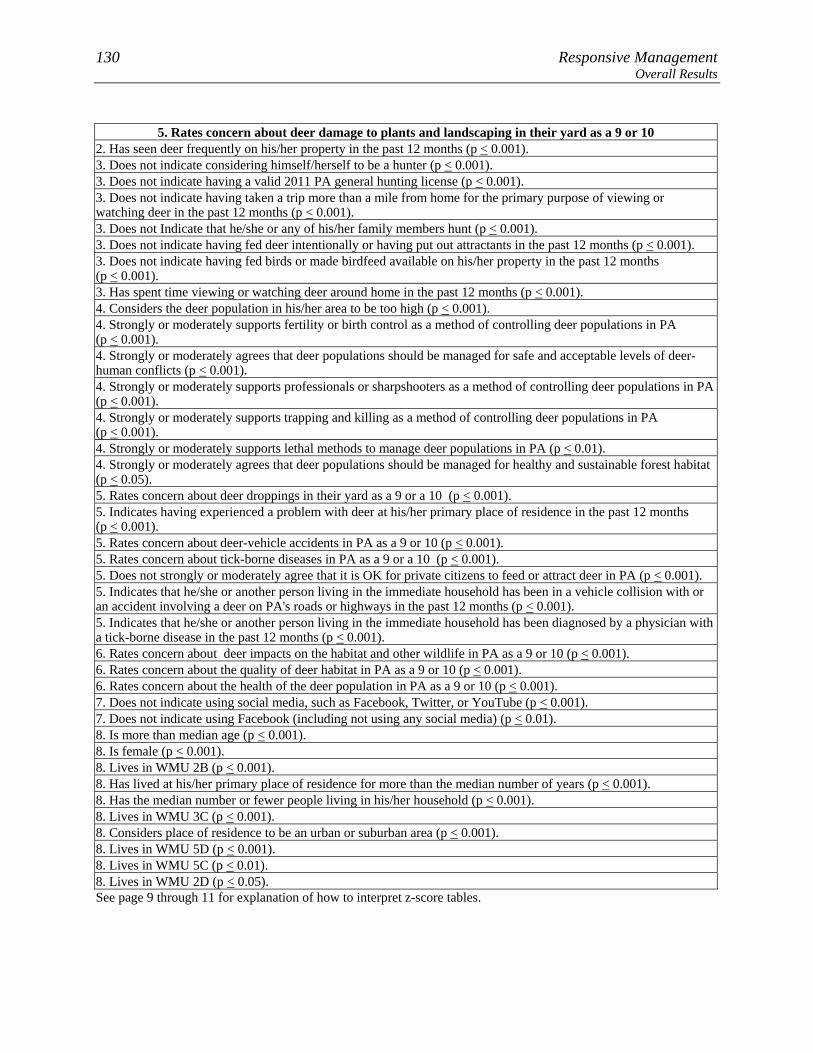
130 Responsive Management Overall Results
5. Rates concern about deer damage to plants and landscaping in their yard as a 9 or 10
2. Has seen deer frequently on his/her property in the past 12 months (p < 0.001). 3. Does not indicate considering himself/herself to be a hunter (p < 0.001). 3. Does not indicate having a valid 2011 PA general hunting license (p < 0.001). 3. Does not indicate having taken a trip more than a mile from home for the primary purpose of viewing or watching deer in the past 12 months (p < 0.001). 3. Does not Indicate that he/she or any of his/her family members hunt (p < 0.001). 3. Does not indicate having fed deer intentionally or having put out attractants in the past 12 months (p < 0.001). 3. Does not indicate having fed birds or made birdfeed available on his/her property in the past 12 months (p < 0.001). 3. Has spent time viewing or watching deer around home in the past 12 months (p < 0.001). 4. Considers the deer population in his/her area to be too high (p < 0.001). 4. Strongly or moderately supports fertility or birth control as a method of controlling deer populations in PA (p < 0.001). 4. Strongly or moderately agrees that deer populations should be managed for safe and acceptable levels of deer-human conflicts (p < 0.001). 4. Strongly or moderately supports professionals or sharpshooters as a method of controlling deer populations in PA(p < 0.001). 4. Strongly or moderately supports trapping and killing as a method of controlling deer populations in PA (p < 0.001). 4. Strongly or moderately supports lethal methods to manage deer populations in PA (p < 0.01). 4. Strongly or moderately agrees that deer populations should be managed for healthy and sustainable forest habitat (p < 0.05). 5. Rates concern about deer droppings in their yard as a 9 or a 10 (p < 0.001). 5. Indicates having experienced a problem with deer at his/her primary place of residence in the past 12 months (p < 0.001). 5. Rates concern about deer-vehicle accidents in PA as a 9 or 10 (p < 0.001). 5. Rates concern about tick-borne diseases in PA as a 9 or a 10 (p < 0.001). 5. Does not strongly or moderately agree that it is OK for private citizens to feed or attract deer in PA (p < 0.001). 5. Indicates that he/she or another person living in the immediate household has been in a vehicle collision with or an accident involving a deer on PA's roads or highways in the past 12 months (p < 0.001). 5. Indicates that he/she or another person living in the immediate household has been diagnosed by a physician with a tick-borne disease in the past 12 months (p < 0.001). 6. Rates concern about deer impacts on the habitat and other wildlife in PA as a 9 or 10 (p < 0.001). 6. Rates concern about the quality of deer habitat in PA as a 9 or 10 (p < 0.001). 6. Rates concern about the health of the deer population in PA as a 9 or 10 (p < 0.001). 7. Does not indicate using social media, such as Facebook, Twitter, or YouTube (p < 0.001). 7. Does not indicate using Facebook (including not using any social media) (p < 0.01). 8. Is more than median age (p < 0.001). 8. Is female (p < 0.001). 8. Lives in WMU 2B (p < 0.001). 8. Has lived at his/her primary place of residence for more than the median number of years (p < 0.001). 8. Has the median number or fewer people living in his/her household (p < 0.001). 8. Lives in WMU 3C (p < 0.001). 8. Considers place of residence to be an urban or suburban area (p < 0.001). 8. Lives in WMU 5D (p < 0.001). 8. Lives in WMU 5C (p < 0.01). 8. Lives in WMU 2D (p < 0.05). See page 9 through 11 for explanation of how to interpret z-score tables.

Pennsylvania Residents’ Opinions on and Attitudes Toward Deer and Deer Management 131 Overall Results
5. Does not rate concern about deer damage to plants and landscaping in their yard as a 9 or 10 2. Does not indicate having seen deer frequently on his/her property in the past 12 months (p < 0.001). 3. Considers himself/herself to be a hunter (p < 0.001). 3. Has a valid 2011 PA general hunting license (p < 0.001). 3. Has taken a trip more than a mile from home for the primary purpose of viewing or watching deer in the past 12 months (p < 0.001). 3. Indicates that he/she or a family member hunts (p < 0.001). 3. Fed deer intentionally or put out attractants in the past 12 months (p < 0.001). 3. Fed birds or make birdfeed available on his/her property in the past 12 months (p < 0.001). 3. Does not indicate having spent time viewing or watching deer around home in the past 12 months (p < 0.001). 4. Does not consider the deer population in his/her area to be too high (p < 0.001). 4. Does not strongly or moderately support fertility or birth control as a method of controlling deer populations in PA (p < 0.001). 4. Does not strongly or moderately agree that deer populations should be managed for safe and acceptable levels of deer-human conflicts (p < 0.001). 4. Does not strongly or moderately support professionals or sharpshooters as a method of controlling deer populations in PA (p < 0.001). 4. Does not strongly or moderately support trapping and killing as a method of controlling deer populations in PA (p < 0.001). 4. Does not strongly or moderately support lethal methods to manage deer populations in PA (p < 0.01). 4. Does not strongly or moderately agree that deer populations should be managed for healthy and sustainable forest habitat (p < 0.05). 5. Does not rate concern about deer droppings in their yard as a 9 or a 10 (p < 0.001). 5. Does not indicate having experienced any problems with deer at his/her primary place of residence in the past 12 months (p < 0.001). 5. Does not rate concern about deer-vehicle accidents in PA as a 9 or 10 (p < 0.001). 5. Does not rate concern about tick-borne diseases in PA as a 9 or a 10 (p < 0.001). 5. Strongly or moderately agrees that it is OK for private citizens to feed or attract deer in PA (p < 0.001). 5. Does not indicate that he/she or another person living in the immediate household has been in a vehicle collision with or an accident involving a deer on PA's roads or highways in the past 12 months (p < 0.001). 5. Does not indicate that he/she or another person living in the immediate household has been diagnosed by a physician with a tick-borne disease in the past 12 months (p < 0.001). 6. Does not rate concern about deer impacts on the habitat and other wildlife in PA as a 9 or 10 (p < 0.001). 6. Does not rate concern about the quality of deer habitat in PA as a 9 or 10 (p < 0.001). 6. Does not rate concern about the health of the deer population in PA as a 9 or 10 (p < 0.001). 7. Uses social media, such as Facebook, Twitter, or YouTube (p < 0.001). 7. Uses Facebook (p < 0.01). 8. Is the median age or younger (p < 0.001). 8. Is male (p < 0.001). 8. Has lived at his/her primary place of residence for the median number of years or less (p < 0.001). 8. Has more than median number of people living in his/her household (p < 0.001). 8. Lives in WMU 4D (p < 0.001). 8. Does not consider place of residence to be an urban or suburban area (p < 0.001). 8. Lives in WMU 3A (p < 0.01). 8. Lives in WMU 5A (p < 0.01). 8. Lives in WMU 4B (p < 0.05). See page 9 through 11 for explanation of how to interpret z-score tables.

132 Responsive Management Overall Results
6. Rates concern about deer impacts on the habitat and other wildlife in PA as a 9 or 10
1. Considers deer-related issues as a 9 or 10 in importance as compared to other issues in his/her life (p < 0.001). 2. Has seen deer frequently on his/her property in the past 12 months (p < 0.001). 3. Does not Indicate that he/she or any of his/her family members hunt (p < 0.001). 3. Does not indicate having a valid 2011 PA general hunting license (p < 0.001). 3. Does not indicate considering himself/herself to be a hunter (p < 0.001). 3. Does not indicate having fed deer intentionally or having put out attractants in the past 12 months (p < 0.001). 3. Does not indicate having taken a trip more than a mile from home for the primary purpose of viewing or watching deer in the past 12 months (p < 0.01). 3. Does not indicate being very or somewhat satisfied with opportunities to view or watch deer in PA (p < 0.05). 3. Does not indicate having fed birds or made birdfeed available on his/her property in the past 12 months (p < 0.05). 4. Considers the deer population in his/her area to be too high (p < 0.001). 4. Strongly or moderately supports professionals or sharpshooters as a method of controlling deer populations in PA(p < 0.001). 4. Strongly or moderately supports fertility or birth control as a method of controlling deer populations in PA (p < 0.001). 4. Strongly or moderately agrees that deer populations should be managed for safe and acceptable levels of deer-human conflicts (p < 0.001). 4. Strongly or moderately supports trapping and killing as a method of controlling deer populations in PA (p < 0.001). 4. Strongly or moderately supports lethal methods to manage deer populations in PA (p < 0.05). 4. Strongly or moderately agrees that deer populations should be managed for healthy and sustainable forest habitat (p < 0.05). 5. Rates concern about tick-borne diseases in PA as a 9 or a 10 (p < 0.001). 5. Indicates having experienced a problem with deer at his/her primary place of residence in the past 12 months (p < 0.001). 5. Does not strongly or moderately agree that it is OK for private citizens to feed or attract deer in PA (p < 0.001). 5. Rates concern about deer-vehicle accidents in PA as a 9 or 10 (p < 0.001). 5. Rates concern about deer damage to plants and landscaping in their yard as a 9 or 10 (p < 0.001). 5. Rates concern about deer droppings in their yard as a 9 or a 10 (p < 0.001). 6. Rates concern about the quality of deer habitat in PA as a 9 or 10 (p < 0.001). 6. Rates concern about the health of the deer population in PA as a 9 or 10 (p < 0.001). 7. Does not indicate using social media, such as Facebook, Twitter, or YouTube (p < 0.001). 7. Does not indicate using Facebook (including not using any social media) (p < 0.001). 8. Is more than median age (p < 0.001). 8. Lives in WMU 5D (p < 0.001). 8. Has lived at his/her primary place of residence for more than the median number of years (p < 0.001). 8. Considers place of residence to be an urban or suburban area (p < 0.01). 8. Has the median number or fewer people living in his/her household (p < 0.01). 8. Is female (p < 0.05). 8. Lives in WMU 3D (p < 0.05). See page 9 through 11 for explanation of how to interpret z-score tables.

Pennsylvania Residents’ Opinions on and Attitudes Toward Deer and Deer Management 133 Overall Results
6. Does not rate concern about deer impacts on the habitat and other wildlife in PA as a 9 or 10 1. Does not consider deer-related issues as a 9 or 10 in importance as compared to other issues in his/her life (p < 0.001). 2. Does not indicate having seen deer frequently on his/her property in the past 12 months (p < 0.001). 3. Indicates that he/she or a family member hunts (p < 0.001). 3. Has a valid 2011 PA general hunting license (p < 0.001). 3. Considers himself/herself to be a hunter (p < 0.001). 3. Fed deer intentionally or put out attractants in the past 12 months (p < 0.001). 3. Has taken a trip more than a mile from home for the primary purpose of viewing or watching deer in the past 12 months (p < 0.01). 3. Is very or somewhat satisfied with opportunities to view or watch deer in PA (p < 0.05). 3. Fed birds or make birdfeed available on his/her property in the past 12 months (p < 0.05). 4. Does not consider the deer population in his/her area to be too high (p < 0.001). 4. Does not strongly or moderately support professionals or sharpshooters as a method of controlling deer populations in PA (p < 0.001). 4. Does not strongly or moderately support fertility or birth control as a method of controlling deer populations in PA (p < 0.001). 4. Does not strongly or moderately agree that deer populations should be managed for safe and acceptable levels of deer-human conflicts (p < 0.001). 4. Does not strongly or moderately support trapping and killing as a method of controlling deer populations in PA (p < 0.001). 4. Does not strongly or moderately support lethal methods to manage deer populations in PA (p < 0.05). 4. Does not strongly or moderately agree that deer populations should be managed for healthy and sustainable forest habitat (p < 0.05). 5. Does not rate concern about deer damage to plants and landscaping in their yard as a 9 or 10 (p < 0.001). 5. Does not rate concern about deer droppings in their yard as a 9 or a 10 (p < 0.001). 5. Does not rate concern about deer-vehicle accidents in PA as a 9 or 10 (p < 0.001). 5. Does not rate concern about tick-borne diseases in PA as a 9 or a 10 (p < 0.001). 5. Does not indicate having experienced any problems with deer at his/her primary place of residence in the past 12 months (p < 0.001). 5. Strongly or moderately agrees that it is OK for private citizens to feed or attract deer in PA (p < 0.001). 6. Does not rate concern about the quality of deer habitat in PA as a 9 or 10 (p < 0.001). 6. Does not rate concern about the health of the deer population in PA as a 9 or 10 (p < 0.001). 7. Uses social media, such as Facebook, Twitter, or YouTube (p < 0.001). 7. Uses Facebook (p < 0.001). 8. Is the median age or younger (p < 0.001). 8. Has lived at his/her primary place of residence for the median number of years or less (p < 0.001). 8. Lives in WMU 4D (p < 0.01). 8. Does not consider place of residence to be an urban or suburban area (p < 0.01). 8. Has more than median number of people living in his/her household (p < 0.01). 8. Is male (p < 0.05). See page 9 through 11 for explanation of how to interpret z-score tables.

134 Responsive Management Overall Results
5. Rates concern about deer-vehicle accidents in PA as a 9 or 10
1. Considers deer-related issues as a 9 or 10 in importance as compared to other issues in his/her life (p < 0.05). 2. Has seen deer frequently on his/her property in the past 12 months (p < 0.01). 3. Does not indicate considering himself/herself to be a hunter (p < 0.001). 3. Does not indicate having a valid 2011 PA general hunting license (p < 0.001). 3. Does not indicate having taken a trip more than a mile from home for the primary purpose of viewing or watching deer in the past 12 months (p < 0.001). 3. Does not indicate having fed deer intentionally or having put out attractants in the past 12 months (p < 0.001). 3. Does not Indicate that he/she or any of his/her family members hunt (p < 0.001). 3. Does not indicate having used a spotlight to view deer at night on a trip to watch deer in the past 12 months (p < 0.001). 3. Does not indicate having fed birds or made birdfeed available on his/her property in the past 12 months (p < 0.001). 3. Does not indicate having spent time viewing or watching deer around home in the past 12 months (p < 0.01). 4. Considers the deer population in his/her area to be too high (p < 0.001). 4. Strongly or moderately supports fertility or birth control as a method of controlling deer populations in PA (p < 0.001). 4. Strongly or moderately agrees that deer populations should be managed for safe and acceptable levels of deer-human conflicts (p < 0.001). 4. Strongly or moderately supports professionals or sharpshooters as a method of controlling deer populations in PA(p < 0.001). 4. Strongly or moderately agrees that deer populations should be managed for healthy and sustainable forest habitat (p < 0.001). 4. Strongly or moderately agrees that deer populations should be managed for healthy and sustainable deer populations (p < 0.01). 4. Strongly or moderately supports trapping and killing as a method of controlling deer populations in PA (p < 0.01). 4. Strongly or moderately supports lethal methods to manage deer populations in PA (p < 0.05). 5. Rates concern about tick-borne diseases in PA as a 9 or a 10 (p < 0.001). 5. Rates concern about deer damage to plants and landscaping in their yard as a 9 or 10 (p < 0.001). 5. Rates concern about deer droppings in their yard as a 9 or a 10 (p < 0.001). 5. Indicates having experienced a problem with deer at his/her primary place of residence in the past 12 months (p < 0.001). 5. Does not strongly or moderately agree that it is OK for private citizens to feed or attract deer in PA (p < 0.001). 5. Indicates that he/she or another person living in the immediate household has been in a vehicle collision with or an accident involving a deer on PA's roads or highways in the past 12 months (p < 0.001). 5. Indicates that he/she or another person living in the immediate household has been diagnosed by a physician with a tick-borne disease in the past 12 months (p < 0.05). 6. Rates concern about deer impacts on the habitat and other wildlife in PA as a 9 or 10 (p < 0.001). 6. Rates concern about the health of the deer population in PA as a 9 or 10 (p < 0.001). 6. Rates concern about the quality of deer habitat in PA as a 9 or 10 (p < 0.001). 7. Uses social media, such as Facebook, Twitter, or YouTube (p < 0.05). 7. Uses Facebook (p < 0.05). 8. Is female (p < 0.001). 8. Is more than median age (p < 0.001). 8. Considers place of residence to be an urban or suburban area (p < 0.001). 8. Lives in WMU 2B (p < 0.001). 8. Lives in WMU 2A (p < 0.001). 8. Lives in WMU 5D (p < 0.001). 8. Has lived at his/her primary place of residence for more than the median number of years (p < 0.001). 8. Lives in WMU 5C (p < 0.001). 8. Has the median number or fewer people living in his/her household (p < 0.001). 8. Lives in WMU 2D (p < 0.001). 8. Primary place of residence is a single-family home (p < 0.001). See page 9 through 11 for explanation of how to interpret z-score tables.
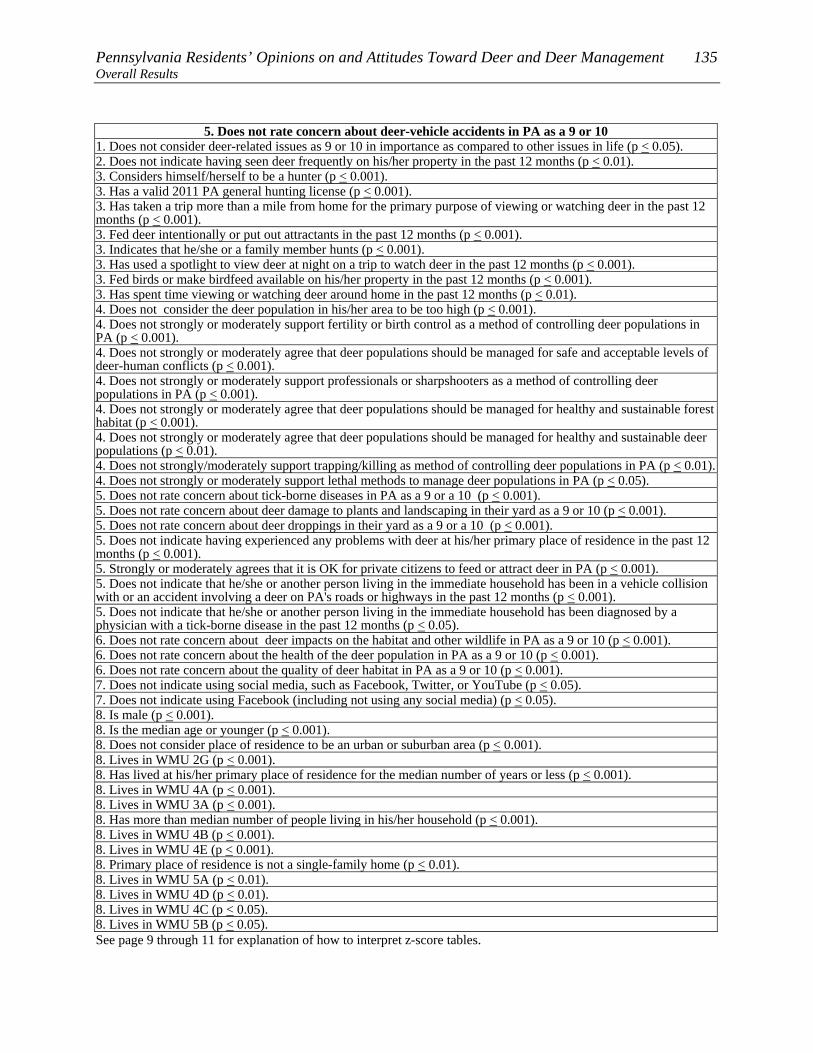
Pennsylvania Residents’ Opinions on and Attitudes Toward Deer and Deer Management 135 Overall Results
5. Does not rate concern about deer-vehicle accidents in PA as a 9 or 10 1. Does not consider deer-related issues as 9 or 10 in importance as compared to other issues in life (p < 0.05). 2. Does not indicate having seen deer frequently on his/her property in the past 12 months (p < 0.01). 3. Considers himself/herself to be a hunter (p < 0.001). 3. Has a valid 2011 PA general hunting license (p < 0.001). 3. Has taken a trip more than a mile from home for the primary purpose of viewing or watching deer in the past 12 months (p < 0.001). 3. Fed deer intentionally or put out attractants in the past 12 months (p < 0.001). 3. Indicates that he/she or a family member hunts (p < 0.001). 3. Has used a spotlight to view deer at night on a trip to watch deer in the past 12 months (p < 0.001). 3. Fed birds or make birdfeed available on his/her property in the past 12 months (p < 0.001). 3. Has spent time viewing or watching deer around home in the past 12 months (p < 0.01). 4. Does not consider the deer population in his/her area to be too high (p < 0.001). 4. Does not strongly or moderately support fertility or birth control as a method of controlling deer populations in PA (p < 0.001). 4. Does not strongly or moderately agree that deer populations should be managed for safe and acceptable levels of deer-human conflicts (p < 0.001). 4. Does not strongly or moderately support professionals or sharpshooters as a method of controlling deer populations in PA (p < 0.001). 4. Does not strongly or moderately agree that deer populations should be managed for healthy and sustainable forest habitat (p < 0.001). 4. Does not strongly or moderately agree that deer populations should be managed for healthy and sustainable deer populations (p < 0.01). 4. Does not strongly/moderately support trapping/killing as method of controlling deer populations in PA (p < 0.01).4. Does not strongly or moderately support lethal methods to manage deer populations in PA (p < 0.05). 5. Does not rate concern about tick-borne diseases in PA as a 9 or a 10 (p < 0.001). 5. Does not rate concern about deer damage to plants and landscaping in their yard as a 9 or 10 (p < 0.001). 5. Does not rate concern about deer droppings in their yard as a 9 or a 10 (p < 0.001). 5. Does not indicate having experienced any problems with deer at his/her primary place of residence in the past 12 months (p < 0.001). 5. Strongly or moderately agrees that it is OK for private citizens to feed or attract deer in PA (p < 0.001). 5. Does not indicate that he/she or another person living in the immediate household has been in a vehicle collision with or an accident involving a deer on PA's roads or highways in the past 12 months (p < 0.001). 5. Does not indicate that he/she or another person living in the immediate household has been diagnosed by a physician with a tick-borne disease in the past 12 months (p < 0.05). 6. Does not rate concern about deer impacts on the habitat and other wildlife in PA as a 9 or 10 (p < 0.001). 6. Does not rate concern about the health of the deer population in PA as a 9 or 10 (p < 0.001). 6. Does not rate concern about the quality of deer habitat in PA as a 9 or 10 (p < 0.001). 7. Does not indicate using social media, such as Facebook, Twitter, or YouTube (p < 0.05). 7. Does not indicate using Facebook (including not using any social media) (p < 0.05). 8. Is male (p < 0.001). 8. Is the median age or younger (p < 0.001). 8. Does not consider place of residence to be an urban or suburban area (p < 0.001). 8. Lives in WMU 2G (p < 0.001). 8. Has lived at his/her primary place of residence for the median number of years or less (p < 0.001). 8. Lives in WMU 4A (p < 0.001). 8. Lives in WMU 3A (p < 0.001). 8. Has more than median number of people living in his/her household (p < 0.001). 8. Lives in WMU 4B (p < 0.001). 8. Lives in WMU 4E (p < 0.001). 8. Primary place of residence is not a single-family home (p < 0.01). 8. Lives in WMU 5A (p < 0.01). 8. Lives in WMU 4D (p < 0.01). 8. Lives in WMU 4C (p < 0.05). 8. Lives in WMU 5B (p < 0.05). See page 9 through 11 for explanation of how to interpret z-score tables.
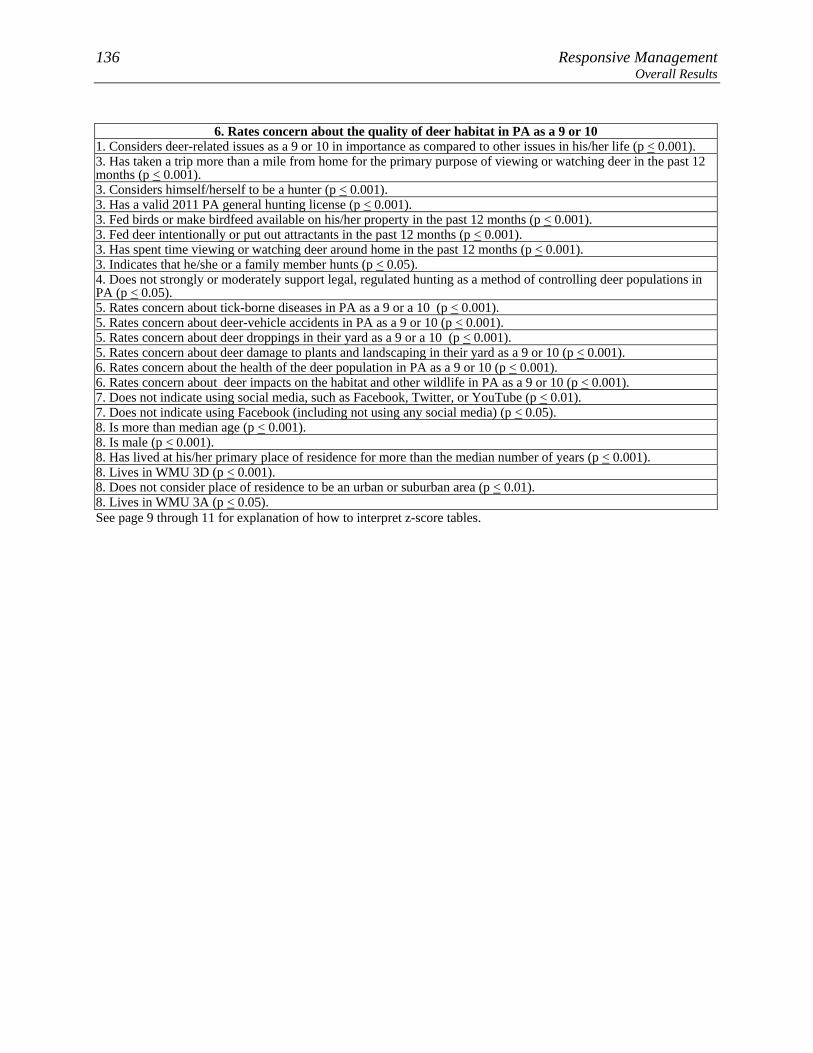
136 Responsive Management Overall Results
6. Rates concern about the quality of deer habitat in PA as a 9 or 10
1. Considers deer-related issues as a 9 or 10 in importance as compared to other issues in his/her life (p < 0.001). 3. Has taken a trip more than a mile from home for the primary purpose of viewing or watching deer in the past 12 months (p < 0.001). 3. Considers himself/herself to be a hunter (p < 0.001). 3. Has a valid 2011 PA general hunting license (p < 0.001). 3. Fed birds or make birdfeed available on his/her property in the past 12 months (p < 0.001). 3. Fed deer intentionally or put out attractants in the past 12 months (p < 0.001). 3. Has spent time viewing or watching deer around home in the past 12 months (p < 0.001). 3. Indicates that he/she or a family member hunts (p < 0.05). 4. Does not strongly or moderately support legal, regulated hunting as a method of controlling deer populations in PA (p < 0.05). 5. Rates concern about tick-borne diseases in PA as a 9 or a 10 (p < 0.001). 5. Rates concern about deer-vehicle accidents in PA as a 9 or 10 (p < 0.001). 5. Rates concern about deer droppings in their yard as a 9 or a 10 (p < 0.001). 5. Rates concern about deer damage to plants and landscaping in their yard as a 9 or 10 (p < 0.001). 6. Rates concern about the health of the deer population in PA as a 9 or 10 (p < 0.001). 6. Rates concern about deer impacts on the habitat and other wildlife in PA as a 9 or 10 (p < 0.001). 7. Does not indicate using social media, such as Facebook, Twitter, or YouTube (p < 0.01). 7. Does not indicate using Facebook (including not using any social media) (p < 0.05). 8. Is more than median age (p < 0.001). 8. Is male (p < 0.001). 8. Has lived at his/her primary place of residence for more than the median number of years (p < 0.001). 8. Lives in WMU 3D (p < 0.001). 8. Does not consider place of residence to be an urban or suburban area (p < 0.01). 8. Lives in WMU 3A (p < 0.05). See page 9 through 11 for explanation of how to interpret z-score tables.

Pennsylvania Residents’ Opinions on and Attitudes Toward Deer and Deer Management 137 Overall Results
6. Does not rate concern about the quality of deer habitat in PA as a 9 or 10 1. Does not consider deer-related issues as a 9 or 10 in importance as compared to other issues in his/her life (p < 0.001). 3. Does not indicate having taken a trip more than a mile from home for the primary purpose of viewing or watching deer in the past 12 months (p < 0.001). 3. Does not indicate considering himself/herself to be a hunter (p < 0.001). 3. Does not indicate having a valid 2011 PA general hunting license (p < 0.001). 3. Does not indicate having fed birds or made birdfeed available on his/her property in the past 12 months (p < 0.001). 3. Does not indicate having fed deer intentionally or having put out attractants in the past 12 months (p < 0.001). 3. Does not indicate having spent time viewing or watching deer around home in the past 12 months (p < 0.001). 3. Does not Indicate that he/she or any of his/her family members hunt (p < 0.05). 4. Strongly or moderately supports legal, regulated hunting as a method of controlling deer populations in PA (p < 0.05). 5. Does not rate concern about tick-borne diseases in PA as a 9 or a 10 (p < 0.001). 5. Does not rate concern about deer-vehicle accidents in PA as a 9 or 10 (p < 0.001). 5. Does not rate concern about deer droppings in their yard as a 9 or a 10 (p < 0.001). 5. Does not rate concern about deer damage to plants and landscaping in their yard as a 9 or 10 (p < 0.001). 6. Does not rate concern about the health of the deer population in PA as a 9 or 10 (p < 0.001). 6. Does not rate concern about deer impacts on the habitat and other wildlife in PA as a 9 or 10 (p < 0.001). 7. Uses social media, such as Facebook, Twitter, or YouTube (p < 0.01). 7. Uses Facebook (p < 0.05). 8. Is the median age or younger (p < 0.001). 8. Has lived at his/her primary place of residence for the median number of years or less (p < 0.001). 8. Is female (p < 0.001). 8. Considers place of residence to be an urban or suburban area (p < 0.01). 8. Lives in WMU 5C (p < 0.01). 8. Lives in WMU 2F (p < 0.05). 8. Primary place of residence is a single-family home (p < 0.05). See page 9 through 11 for explanation of how to interpret z-score tables.

138 Responsive Management Overall Results
6. Rates concern about the health of the deer population in PA as a 9 or 10
1. Considers deer-related issues as a 9 or 10 in importance as compared to other issues in his/her life (p < 0.001). 2. Has seen deer frequently on his/her property in the past 12 months (p < 0.01). 3. Considers himself/herself to be a hunter (p < 0.001). 3. Has taken a trip more than a mile from home for the primary purpose of viewing or watching deer in the past 12 months (p < 0.001). 3. Has a valid 2011 PA general hunting license (p < 0.001). 3. Fed deer intentionally or put out attractants in the past 12 months (p < 0.001). 3. Has spent time viewing or watching deer around home in the past 12 months (p < 0.001). 3. Fed birds or make birdfeed available on his/her property in the past 12 months (p < 0.01). 3. Indicates that he/she or a family member hunts (p < 0.05). 4. Strongly or moderately agrees that deer populations should be managed for healthy and sustainable deer populations (p < 0.001). 4. Does not consider the deer population in his/her area to be too high (p < 0.01). 4. Strongly or moderately agrees that deer populations should be managed for healthy and sustainable forest habitat (p < 0.05). 4. Does not strongly or moderately support legal, regulated hunting as a method of controlling deer populations in PA (p < 0.05). 5. Rates concern about tick-borne diseases in PA as a 9 or a 10 (p < 0.001). 5. Rates concern about deer-vehicle accidents in PA as a 9 or 10 (p < 0.001). 5. Rates concern about deer droppings in their yard as a 9 or a 10 (p < 0.001). 5. Rates concern about deer damage to plants and landscaping in their yard as a 9 or 10 (p < 0.001). 5. Strongly or moderately agrees that it is OK for private citizens to feed or attract deer in PA (p < 0.05). 6. Rates concern about the quality of deer habitat in PA as a 9 or 10 (p < 0.001). 6. Rates concern about deer impacts on the habitat and other wildlife in PA as a 9 or 10 (p < 0.001). 7. Does not indicate using social media, such as Facebook, Twitter, or YouTube (p < 0.05). 8. Does not consider place of residence to be an urban or suburban area (p < 0.001). 8. Has lived at his/her primary place of residence for more than the median number of years (p < 0.001). 8. Lives in WMU 2G (p < 0.001). 8. Is male (p < 0.001). 8. Is more than median age (p < 0.001). 8. Lives in WMU 3A (p < 0.01). 8. Lives in WMU 3D (p < 0.01). 8. Primary place of residence is not a single-family home (p < 0.01). 8. Has more than median number of people living in his/her household (p < 0.05). See page 9 through 11 for explanation of how to interpret z-score tables.

Pennsylvania Residents’ Opinions on and Attitudes Toward Deer and Deer Management 139 Overall Results
6. Does not rate concern about the health of the deer population in PA as a 9 or 10 1. Does not consider deer-related issues as a 9 or 10 in importance as compared to other issues in his/her life (p < 0.001). 2. Does not indicate having seen deer frequently on his/her property in the past 12 months (p < 0.01). 3. Does not indicate considering himself/herself to be a hunter (p < 0.001). 3. Does not indicate having taken a trip more than a mile from home for the primary purpose of viewing or watching deer in the past 12 months (p < 0.001). 3. Does not indicate having a valid 2011 PA general hunting license (p < 0.001). 3. Does not indicate having fed deer intentionally or having put out attractants in the past 12 months (p < 0.001). 3. Does not indicate having spent time viewing or watching deer around home in the past 12 months (p < 0.001). 3. Does not indicate having fed birds or made birdfeed available on his/her property in the past 12 months (p < 0.01). 3. Does not Indicate that he/she or any of his/her family members hunt (p < 0.05). 4. Does not strongly or moderately agree that deer populations should be managed for healthy and sustainable deer populations (p < 0.001). 4. Considers the deer population in his/her area to be too high (p < 0.01). 4. Does not strongly or moderately agree that deer populations should be managed for healthy and sustainable forest habitat (p < 0.05). 4. Strongly or moderately supports legal, regulated hunting as a method of controlling deer populations in PA (p < 0.05). 5. Does not rate concern about tick-borne diseases in PA as a 9 or a 10 (p < 0.001). 5. Does not rate concern about deer-vehicle accidents in PA as a 9 or 10 (p < 0.001). 5. Does not rate concern about deer droppings in their yard as a 9 or a 10 (p < 0.001). 5. Does not rate concern about deer damage to plants and landscaping in their yard as a 9 or 10 (p < 0.001). 5. Does not strongly or moderately agree that it is OK for private citizens to feed or attract deer in PA (p < 0.05). 6. Does not rate concern about the quality of deer habitat in PA as a 9 or 10 (p < 0.001). 6. Does not rate concern about deer impacts on the habitat and other wildlife in PA as a 9 or 10 (p < 0.001). 7. Uses social media, such as Facebook, Twitter, or YouTube (p < 0.05). 8. Considers place of residence to be an urban or suburban area (p < 0.001). 8. Has lived at his/her primary place of residence for the median number of years or less (p < 0.001). 8. Is the median age or younger (p < 0.001). 8. Is female (p < 0.001). 8. Primary place of residence is a single-family home (p < 0.001). 8. Lives in WMU 5C (p < 0.01). 8. Lives in WMU 2C (p < 0.01). 8. Lives in WMU 2B (p < 0.01). 8. Has the median number or fewer people living in his/her household (p < 0.05). 8. Lives in WMU 4D (p < 0.05). See page 9 through 11 for explanation of how to interpret z-score tables.

140 Responsive Management Overall Results
Q36. How about tick-borne diseases, such as Lyme disease, in Pennsylvania? (How much of a concern is this for you personally on a scale of 0 to 10 where 0 is not at all concerned and 10 is extremely concerned?) 10 9 8 7 6 5 4 3 2 1 0 Don't
know1A 32 7 17 10 5 13 3 2 3 1 5 31B 30 8 14 9 6 14 2 3 3 1 8 22A 37 5 15 6 5 11 3 4 2 1 7 32B 36 9 16 9 6 13 2 2 1 1 5 12C 32 8 13 8 6 15 2 3 0 2 6 32D 44 10 13 6 5 11 3 1 1 1 3 12E 43 8 13 9 5 6 2 1 0 1 9 02F 33 6 17 10 3 11 4 4 1 1 8 22G 41 6 11 9 4 12 1 3 3 1 8 13A 26 6 17 5 7 18 2 3 2 1 10 33B 38 8 13 8 8 12 2 2 2 0 7 13C 39 8 16 8 6 10 2 1 1 2 6 13D 37 8 15 7 2 10 5 5 3 1 4 14A 40 6 16 8 4 13 2 2 2 1 4 24B 36 6 16 10 4 12 4 2 2 0 5 14C 39 6 14 9 5 9 4 4 2 1 6 14D 27 9 21 9 8 10 4 2 2 2 5 14E 41 7 13 9 4 13 3 3 2 0 3 25A 36 7 13 10 4 15 2 2 2 1 7 15B 31 8 22 11 5 8 3 4 1 2 2 15C 37 11 17 9 4 8 5 3 2 1 3 15D 39 9 11 8 5 13 5 3 2 0 4 1Statewide 36 9 15 9 5 12 4 3 2 1 5 1

Pennsylvania Residents’ Opinions on and Attitudes Toward Deer and Deer Management 141 Overall Results
Q37. How about deer droppings in your yard? (How much of a concern is this for you personally on a scale of 0 to 10 where 0 is not at all concerned and 10 is extremely concerned?) 10 9 8 7 6 5 4 3 2 1 0 Don't
know1A 3 0 3 1 2 10 1 5 8 6 60 11B 3 0 1 2 0 6 1 4 6 3 74 12A 6 1 3 2 2 8 1 4 7 6 61 02B 9 1 6 2 2 7 2 5 9 4 52 12C 2 1 2 1 0 7 2 3 4 7 70 02D 5 0 2 2 1 6 2 1 7 8 65 02E 3 1 2 0 1 7 3 4 4 5 70 02F 6 0 1 0 0 7 2 4 5 7 68 02G 1 1 1 0 2 4 2 2 5 6 77 03A 2 0 1 0 1 5 4 3 3 7 73 03B 3 0 0 2 0 5 1 3 5 5 75 03C 6 1 1 2 2 6 1 3 7 5 66 03D 5 1 2 1 2 4 1 4 5 7 68 04A 3 0 2 0 0 4 1 4 5 10 70 04B 2 1 1 2 1 4 2 2 6 7 72 04C 3 1 2 1 0 5 2 4 8 7 67 04D 1 0 1 0 0 4 1 6 6 10 70 04E 2 1 2 1 2 5 4 3 6 9 67 05A 3 1 2 2 0 4 1 2 5 5 75 05B 4 0 2 1 1 6 3 4 6 9 65 05C 5 2 4 3 0 6 2 3 11 6 59 05D 9 2 2 1 2 4 2 2 6 9 59 0Statewide 6 1 3 2 1 6 2 3 7 7 63 0
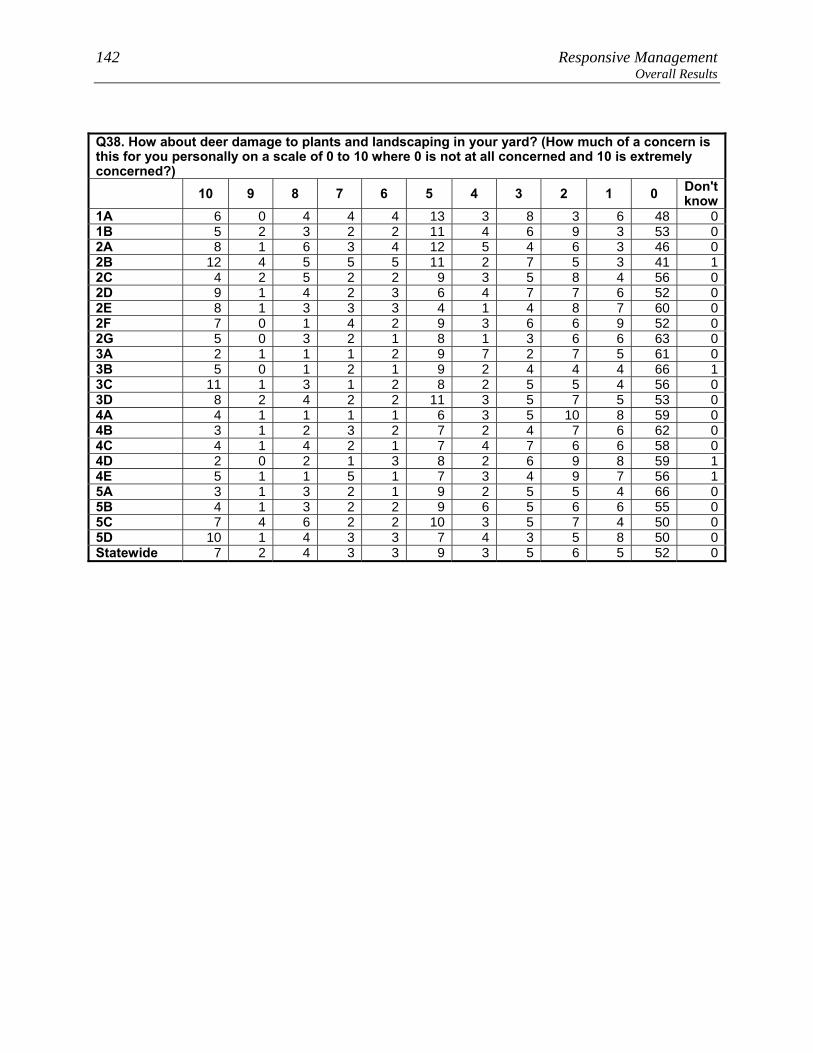
142 Responsive Management Overall Results
Q38. How about deer damage to plants and landscaping in your yard? (How much of a concern is this for you personally on a scale of 0 to 10 where 0 is not at all concerned and 10 is extremely concerned?) 10 9 8 7 6 5 4 3 2 1 0 Don't
know1A 6 0 4 4 4 13 3 8 3 6 48 01B 5 2 3 2 2 11 4 6 9 3 53 02A 8 1 6 3 4 12 5 4 6 3 46 02B 12 4 5 5 5 11 2 7 5 3 41 12C 4 2 5 2 2 9 3 5 8 4 56 02D 9 1 4 2 3 6 4 7 7 6 52 02E 8 1 3 3 3 4 1 4 8 7 60 02F 7 0 1 4 2 9 3 6 6 9 52 02G 5 0 3 2 1 8 1 3 6 6 63 03A 2 1 1 1 2 9 7 2 7 5 61 03B 5 0 1 2 1 9 2 4 4 4 66 13C 11 1 3 1 2 8 2 5 5 4 56 03D 8 2 4 2 2 11 3 5 7 5 53 04A 4 1 1 1 1 6 3 5 10 8 59 04B 3 1 2 3 2 7 2 4 7 6 62 04C 4 1 4 2 1 7 4 7 6 6 58 04D 2 0 2 1 3 8 2 6 9 8 59 14E 5 1 1 5 1 7 3 4 9 7 56 15A 3 1 3 2 1 9 2 5 5 4 66 05B 4 1 3 2 2 9 6 5 6 6 55 05C 7 4 6 2 2 10 3 5 7 4 50 05D 10 1 4 3 3 7 4 3 5 8 50 0Statewide 7 2 4 3 3 9 3 5 6 5 52 0

Pennsylvania Residents’ Opinions on and Attitudes Toward Deer and Deer Management 143 Overall Results
Q39. How about deer impacts on the habitat and other wildlife in Pennsylvania, such as overeating specific plants that are also a food source for other wildlife? (How much of a concern is this for you personally on a scale of 0 to 10 where 0 is not at all concerned and 10 is extremely concerned.) 10 9 8 7 6 5 4 3 2 1 0 Don't
know1A 4 0 4 6 7 25 4 7 6 4 29 51B 5 1 4 5 6 23 7 6 9 3 29 32A 5 2 3 5 7 22 8 6 9 3 27 42B 6 1 7 5 6 28 6 7 7 2 21 32C 3 1 6 3 3 23 5 7 10 4 30 42D 6 2 2 6 6 21 8 6 6 3 30 32E 5 1 6 3 4 19 8 5 9 3 36 12F 3 2 4 5 4 25 5 7 6 5 32 22G 4 0 3 1 2 18 3 9 6 5 44 43A 3 1 4 4 6 24 9 5 7 3 32 43B 4 2 3 5 6 28 6 5 6 5 27 33C 6 1 6 4 6 22 5 8 6 4 27 63D 7 2 3 6 8 21 7 5 9 5 25 34A 3 1 6 8 4 18 6 8 9 5 31 14B 4 0 6 3 6 23 7 11 5 5 29 34C 5 1 3 5 8 26 9 8 4 3 27 24D 2 1 3 4 10 21 7 11 6 4 27 44E 3 1 4 4 7 24 7 9 8 3 29 25A 5 1 7 6 4 26 6 6 7 3 25 35B 4 0 5 6 7 25 10 9 7 3 20 35C 5 2 6 6 8 21 9 8 7 5 23 15D 12 2 6 6 8 19 9 5 4 6 21 2Statewide 7 1 5 6 7 23 8 7 6 4 24 3
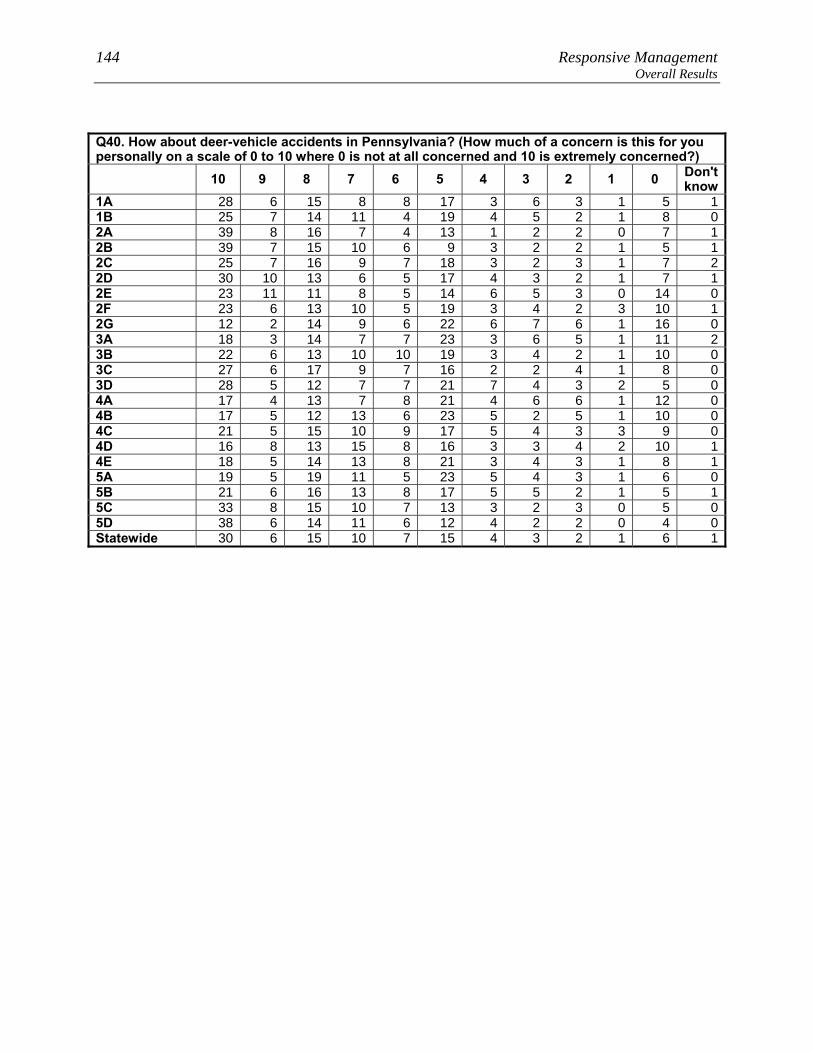
144 Responsive Management Overall Results
Q40. How about deer-vehicle accidents in Pennsylvania? (How much of a concern is this for you personally on a scale of 0 to 10 where 0 is not at all concerned and 10 is extremely concerned?) 10 9 8 7 6 5 4 3 2 1 0 Don't
know1A 28 6 15 8 8 17 3 6 3 1 5 11B 25 7 14 11 4 19 4 5 2 1 8 02A 39 8 16 7 4 13 1 2 2 0 7 12B 39 7 15 10 6 9 3 2 2 1 5 12C 25 7 16 9 7 18 3 2 3 1 7 22D 30 10 13 6 5 17 4 3 2 1 7 12E 23 11 11 8 5 14 6 5 3 0 14 02F 23 6 13 10 5 19 3 4 2 3 10 12G 12 2 14 9 6 22 6 7 6 1 16 03A 18 3 14 7 7 23 3 6 5 1 11 23B 22 6 13 10 10 19 3 4 2 1 10 03C 27 6 17 9 7 16 2 2 4 1 8 03D 28 5 12 7 7 21 7 4 3 2 5 04A 17 4 13 7 8 21 4 6 6 1 12 04B 17 5 12 13 6 23 5 2 5 1 10 04C 21 5 15 10 9 17 5 4 3 3 9 04D 16 8 13 15 8 16 3 3 4 2 10 14E 18 5 14 13 8 21 3 4 3 1 8 15A 19 5 19 11 5 23 5 4 3 1 6 05B 21 6 16 13 8 17 5 5 2 1 5 15C 33 8 15 10 7 13 3 2 3 0 5 05D 38 6 14 11 6 12 4 2 2 0 4 0Statewide 30 6 15 10 7 15 4 3 2 1 6 1

Pennsylvania Residents’ Opinions on and Attitudes Toward Deer and Deer Management 145 Overall Results
Q41. How about the quality of deer habitat in Pennsylvania? (How much of a concern is this for you personally on a scale of 0 to 10 where 0 is not at all concerned and 10 is extremely concerned?) 10 9 8 7 6 5 4 3 2 1 0 Don't
know1A 13 3 17 6 10 21 4 5 3 1 11 61B 12 6 16 14 7 19 3 5 3 1 9 32A 16 3 14 9 11 22 3 1 5 0 12 32B 12 4 16 11 10 22 3 4 3 1 9 32C 12 3 9 11 7 29 4 5 4 1 11 52D 13 2 12 8 11 24 4 3 2 1 15 52E 13 2 16 12 10 20 3 2 3 1 16 22F 12 2 23 13 8 21 2 3 2 3 9 22G 17 3 18 8 8 24 2 3 2 2 13 13A 14 8 15 8 6 23 2 3 4 1 11 53B 15 5 14 10 8 23 3 3 4 2 11 23C 14 2 14 10 6 26 2 2 2 2 12 73D 21 4 12 10 8 21 4 4 3 2 8 24A 16 3 19 8 5 21 5 5 3 2 12 14B 15 4 15 12 10 18 4 1 2 0 13 34C 16 5 16 8 12 20 4 3 4 1 9 34D 13 5 10 10 15 23 4 3 1 2 14 14E 13 6 14 14 9 25 4 2 2 0 9 25A 13 5 16 11 9 18 7 2 2 1 11 45B 14 4 14 10 13 24 4 5 3 3 4 25C 11 2 12 12 8 27 6 5 4 3 7 15D 16 4 14 11 8 23 4 3 3 3 9 2Statewide 14 4 14 11 10 23 4 4 3 2 9 3

146 Responsive Management Overall Results
Q42. How about health of the deer population, such as adequate food resources for the size of the deer herd, in Pennsylvania? (How much of a concern is this for you personally on a scale of 0 to 10 where 0 is not at all concerned and 10 is extremely concerned.) 10 9 8 7 6 5 4 3 2 1 0 Don't
know1A 20 4 14 8 7 23 6 5 2 0 7 41B 16 5 16 16 5 18 3 6 3 1 9 32A 22 4 17 8 10 20 4 1 2 0 10 22B 14 5 15 13 8 20 5 3 5 2 7 42C 14 3 14 11 5 27 4 2 4 2 10 42D 17 4 14 11 10 17 3 2 2 2 13 42E 18 7 17 12 8 16 3 1 1 2 14 12F 19 5 19 9 7 17 4 2 2 2 13 22G 27 5 19 9 7 13 3 2 1 0 10 23A 22 9 16 9 10 13 2 2 2 1 9 43B 22 6 14 12 7 19 3 2 2 0 10 13C 19 3 13 13 6 23 3 3 3 1 8 53D 25 6 12 9 9 20 5 3 2 1 7 14A 20 6 18 8 6 18 4 5 1 1 11 34B 21 6 16 11 8 18 3 1 3 1 11 14C 23 5 18 9 9 15 3 4 4 2 8 14D 14 6 14 14 11 18 4 3 2 1 11 34E 18 2 21 10 7 19 3 1 3 2 10 45A 22 6 15 10 7 20 5 3 0 1 8 35B 18 4 18 14 7 18 5 2 1 2 6 45C 14 4 16 12 10 22 3 5 5 2 7 15D 20 4 14 12 7 20 5 3 3 1 9 1Statewide 18 5 15 12 8 20 4 3 3 2 8 2

Pennsylvania Residents’ Opinions on and Attitudes Toward Deer and Deer Management 147 Overall Results
Q49. How often have you seen deer on your property in the past 12 months?
26
16
19
39
0 20 40 60 80 100
Frequently
Sometimes
Rarely
Never
Percent (n=9212)
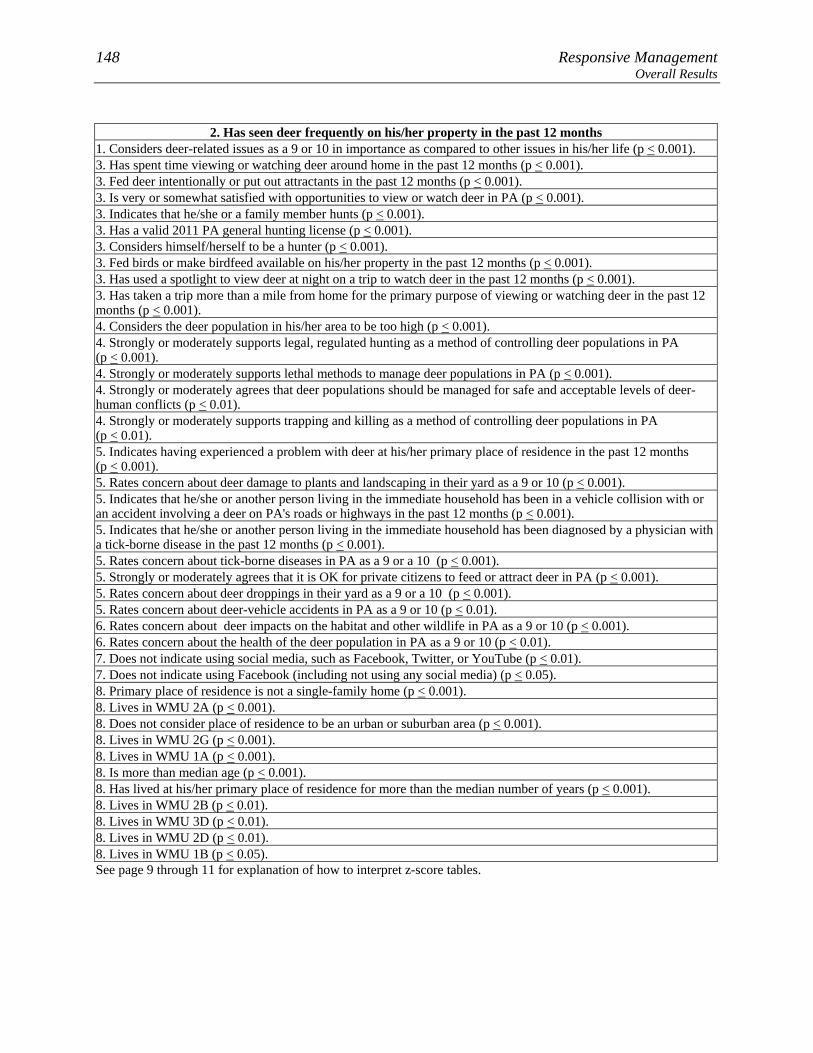
148 Responsive Management Overall Results
2. Has seen deer frequently on his/her property in the past 12 months
1. Considers deer-related issues as a 9 or 10 in importance as compared to other issues in his/her life (p < 0.001). 3. Has spent time viewing or watching deer around home in the past 12 months (p < 0.001). 3. Fed deer intentionally or put out attractants in the past 12 months (p < 0.001). 3. Is very or somewhat satisfied with opportunities to view or watch deer in PA (p < 0.001). 3. Indicates that he/she or a family member hunts (p < 0.001). 3. Has a valid 2011 PA general hunting license (p < 0.001). 3. Considers himself/herself to be a hunter (p < 0.001). 3. Fed birds or make birdfeed available on his/her property in the past 12 months (p < 0.001). 3. Has used a spotlight to view deer at night on a trip to watch deer in the past 12 months (p < 0.001). 3. Has taken a trip more than a mile from home for the primary purpose of viewing or watching deer in the past 12 months (p < 0.001). 4. Considers the deer population in his/her area to be too high (p < 0.001). 4. Strongly or moderately supports legal, regulated hunting as a method of controlling deer populations in PA (p < 0.001). 4. Strongly or moderately supports lethal methods to manage deer populations in PA (p < 0.001). 4. Strongly or moderately agrees that deer populations should be managed for safe and acceptable levels of deer-human conflicts (p < 0.01). 4. Strongly or moderately supports trapping and killing as a method of controlling deer populations in PA (p < 0.01). 5. Indicates having experienced a problem with deer at his/her primary place of residence in the past 12 months (p < 0.001). 5. Rates concern about deer damage to plants and landscaping in their yard as a 9 or 10 (p < 0.001). 5. Indicates that he/she or another person living in the immediate household has been in a vehicle collision with or an accident involving a deer on PA's roads or highways in the past 12 months (p < 0.001). 5. Indicates that he/she or another person living in the immediate household has been diagnosed by a physician with a tick-borne disease in the past 12 months (p < 0.001). 5. Rates concern about tick-borne diseases in PA as a 9 or a 10 (p < 0.001). 5. Strongly or moderately agrees that it is OK for private citizens to feed or attract deer in PA (p < 0.001). 5. Rates concern about deer droppings in their yard as a 9 or a 10 (p < 0.001). 5. Rates concern about deer-vehicle accidents in PA as a 9 or 10 (p < 0.01). 6. Rates concern about deer impacts on the habitat and other wildlife in PA as a 9 or 10 (p < 0.001). 6. Rates concern about the health of the deer population in PA as a 9 or 10 (p < 0.01). 7. Does not indicate using social media, such as Facebook, Twitter, or YouTube (p < 0.01). 7. Does not indicate using Facebook (including not using any social media) (p < 0.05). 8. Primary place of residence is not a single-family home (p < 0.001). 8. Lives in WMU 2A (p < 0.001). 8. Does not consider place of residence to be an urban or suburban area (p < 0.001). 8. Lives in WMU 2G (p < 0.001). 8. Lives in WMU 1A (p < 0.001). 8. Is more than median age (p < 0.001). 8. Has lived at his/her primary place of residence for more than the median number of years (p < 0.001). 8. Lives in WMU 2B (p < 0.01). 8. Lives in WMU 3D (p < 0.01). 8. Lives in WMU 2D (p < 0.01). 8. Lives in WMU 1B (p < 0.05). See page 9 through 11 for explanation of how to interpret z-score tables.

Pennsylvania Residents’ Opinions on and Attitudes Toward Deer and Deer Management 149 Overall Results
2. Does not indicate having seen deer frequently on his/her property in the past 12 months 1. Does not consider deer-related issues as a 9 or 10 in importance as compared to other issues in his/her life (p < 0.001). 3. Does not indicate having spent time viewing or watching deer around home in the past 12 months (p < 0.001). 3. Does not indicate having fed deer intentionally or having put out attractants in the past 12 months (p < 0.001). 3. Does not indicate being very or somewhat satisfied with opportunities to view or watch deer in PA (p < 0.001). 3. Does not Indicate that he/she or any of his/her family members hunt (p < 0.001). 3. Does not indicate having a valid 2011 PA general hunting license (p < 0.001). 3. Does not indicate considering himself/herself to be a hunter (p < 0.001). 3. Does not indicate having fed birds or made birdfeed available on his/her property in the past 12 months (p < 0.001). 3. Does not indicate having used a spotlight to view deer at night on a trip to watch deer in the past 12 months (p < 0.001). 3. Does not indicate having taken a trip more than a mile from home for the primary purpose of viewing or watching deer in the past 12 months (p < 0.001). 4. Does not consider the deer population in his/her area to be too high (p < 0.001). 4. Does not strongly or moderately support legal, regulated hunting as a method of controlling deer populations in PA (p < 0.001). 4. Does not strongly or moderately support lethal methods to manage deer populations in PA (p < 0.001). 4. Does not strongly or moderately agree that deer populations should be managed for safe and acceptable levels of deer-human conflicts (p < 0.01). 4. Does not strongly or moderately support trapping and killing as a method of controlling deer populations in PA (p < 0.01). 5. Does not indicate having experienced any problems with deer at his/her primary place of residence in the past 12 months (p < 0.001). 5. Does not rate concern about deer damage to plants and landscaping in their yard as a 9 or 10 (p < 0.001). 5. Does not indicate that he/she or another person living in the immediate household has been in a vehicle collision with or an accident involving a deer on PA's roads or highways in the past 12 months (p < 0.001). 5. Does not indicate that he/she or another person living in the immediate household has been diagnosed by a physician with a tick-borne disease in the past 12 months (p < 0.001). 5. Does not rate concern about tick-borne diseases in PA as a 9 or a 10 (p < 0.001). 5. Does not strongly or moderately agree that it is OK for private citizens to feed or attract deer in PA (p < 0.001). 5. Does not rate concern about deer droppings in their yard as a 9 or a 10 (p < 0.001). 5. Does not rate concern about deer-vehicle accidents in PA as a 9 or 10 (p < 0.01). 6. Does not rate concern about deer impacts on the habitat and other wildlife in PA as a 9 or 10 (p < 0.001). 6. Does not rate concern about the health of the deer population in PA as a 9 or 10 (p < 0.01). 7. Uses social media, such as Facebook, Twitter, or YouTube (p < 0.01). 7. Uses Facebook (p < 0.05). 8. Primary place of residence is a single-family home (p < 0.001). 8. Considers place of residence to be an urban or suburban area (p < 0.001). 8. Lives in WMU 5D (p < 0.001). 8. Lives in WMU 3B (p < 0.001). 8. Lives in WMU 5B (p < 0.001). 8. Lives in WMU 5A (p < 0.001). 8. Lives in WMU 4D (p < 0.001). 8. Has lived at his/her primary place of residence for the median number of years or less (p < 0.001). 8. Is the median age or younger (p < 0.001). 8. Lives in WMU 5C (p < 0.05). 8. Lives in WMU 3C (p < 0.05). See page 9 through 11 for explanation of how to interpret z-score tables.

150 Responsive Management Overall Results
Q49. How often have you seen deer on your property in the past 12 months?
30
17
20
33
18
14
24
44
0 20 40 60 80 100
Frequently
Sometimes
Rarely
Never
Percent
Fed birds on his / herproperty in the past 12months (n=4496)Did not feed birds on his /her property in the past 12months (n=4708)
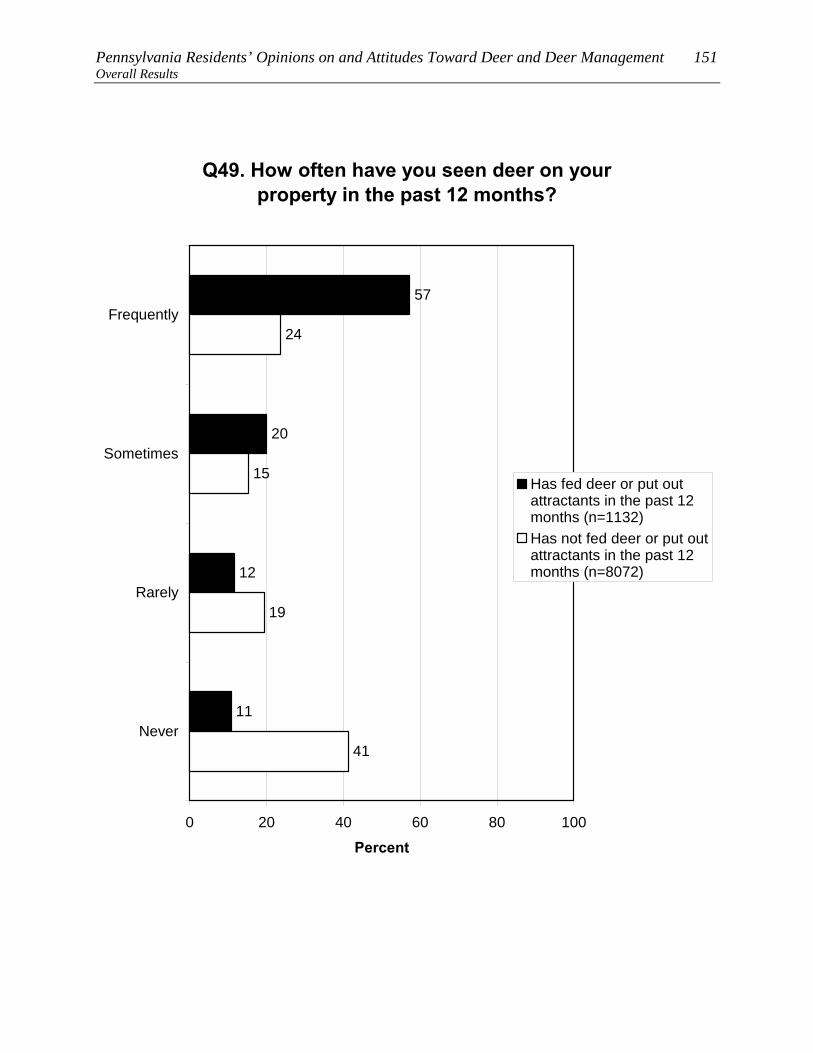
Pennsylvania Residents’ Opinions on and Attitudes Toward Deer and Deer Management 151 Overall Results
Q49. How often have you seen deer on your property in the past 12 months?
57
20
12
11
19
15
24
41
0 20 40 60 80 100
Frequently
Sometimes
Rarely
Never
Percent
Has fed deer or put outattractants in the past 12months (n=1132)Has not fed deer or put outattractants in the past 12months (n=8072)
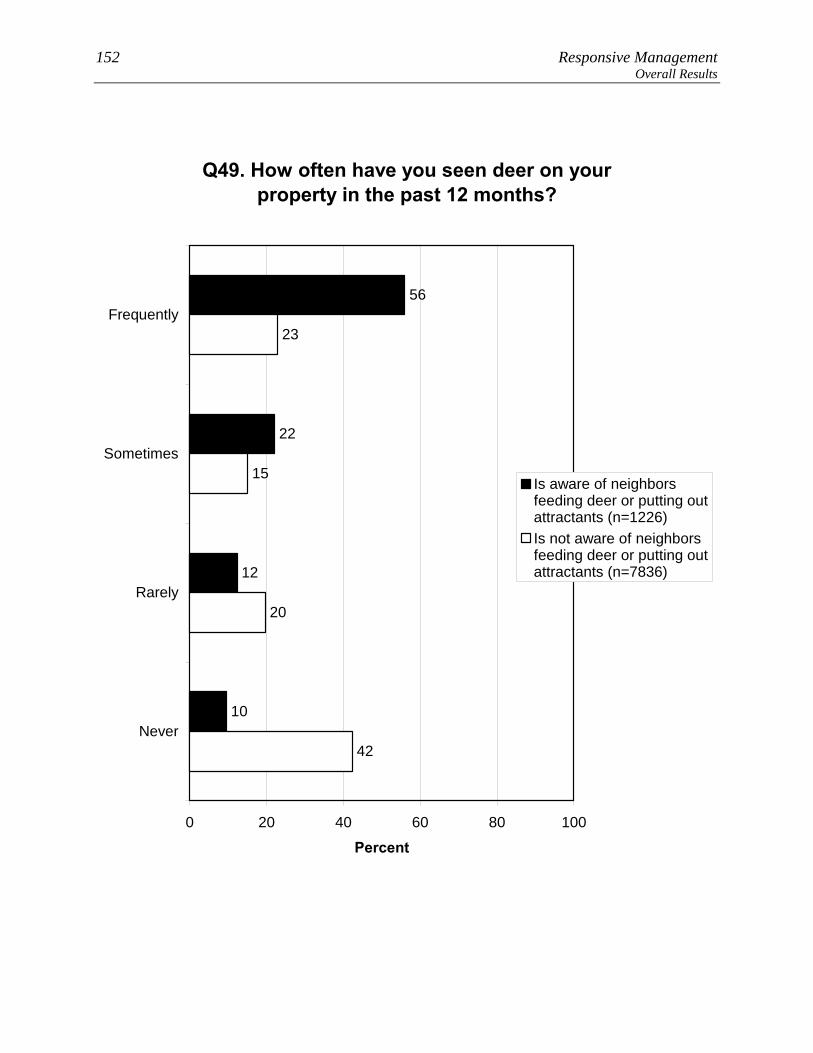
152 Responsive Management Overall Results
Q49. How often have you seen deer on your property in the past 12 months?
56
22
12
10
20
15
23
42
0 20 40 60 80 100
Frequently
Sometimes
Rarely
Never
Percent
Is aware of neighborsfeeding deer or putting outattractants (n=1226)Is not aware of neighborsfeeding deer or putting outattractants (n=7836)

Pennsylvania Residents’ Opinions on and Attitudes Toward Deer and Deer Management 153 Overall Results
Q49. How often have you seen deer on your property in the past 12 months?
Frequently Sometimes Rarely Never Don't know
1A 41 21 17 20 0 1B 37 19 17 27 0 2A 60 15 11 12 1 2B 38 18 24 20 0 2C 35 21 19 26 0 2D 37 22 22 19 0 2E 34 19 22 25 0 2F 36 21 16 27 0 2G 46 18 20 16 0 3A 30 16 25 30 0 3B 15 11 17 57 0 3C 26 18 20 36 0 3D 37 18 17 27 0 4A 30 16 16 38 0 4B 28 22 20 30 0 4C 28 20 19 33 0 4D 21 14 16 48 0 4E 30 22 21 27 0 5A 19 15 16 50 0 5B 17 17 22 45 0 5C 26 16 21 37 1 5D 15 10 15 59 0 Statewide 26 16 19 39 0

154 Responsive Management Overall Results

Pennsylvania Residents’ Opinions on and Attitudes Toward Deer and Deer Management 155 Overall Results
Q43. In the past 12 months, have you experienced any problems with deer at your primary place of
residence?
12
88
0 20 40 60 80 100
Yes
No
Percent (n=9212)

156 Responsive Management Overall Results
5. Indicates having experienced a problem with deer at his/her primary place of residence in the past 12
months 1. Does not consider deer-related issues as a 9 or 10 in importance as compared to other issues in his/her life (p < 0.01). 2. Has seen deer frequently on his/her property in the past 12 months (p < 0.001). 3. Has spent time viewing or watching deer around home in the past 12 months (p < 0.001). 3. Does not indicate having taken a trip more than a mile from home for the primary purpose of viewing or watching deer in the past 12 months (p < 0.001). 3. Does not indicate having a valid 2011 PA general hunting license (p < 0.001). 3. Does not indicate considering himself/herself to be a hunter (p < 0.001). 3. Does not indicate having fed deer intentionally or having put out attractants in the past 12 months (p < 0.01). 4. Considers the deer population in his/her area to be too high (p < 0.001). 4. Strongly or moderately supports professionals or sharpshooters as a method of controlling deer populations in PA(p < 0.001). 4. Strongly or moderately supports trapping and killing as a method of controlling deer populations in PA (p < 0.001). 4. Strongly or moderately supports fertility or birth control as a method of controlling deer populations in PA (p < 0.001). 4. Strongly or moderately agrees that deer populations should be managed for safe and acceptable levels of deer-human conflicts (p < 0.001). 4. Strongly or moderately supports lethal methods to manage deer populations in PA (p < 0.001). 4. Strongly or moderately supports legal, regulated hunting as a method of controlling deer populations in PA (p < 0.001). 5. Rates concern about deer damage to plants and landscaping in their yard as a 9 or 10 (p < 0.001). 5. Rates concern about deer droppings in their yard as a 9 or a 10 (p < 0.001). 5. Rates concern about deer-vehicle accidents in PA as a 9 or 10 (p < 0.001). 5. Indicates that he/she or another person living in the immediate household has been diagnosed by a physician with a tick-borne disease in the past 12 months (p < 0.001). 5. Rates concern about tick-borne diseases in PA as a 9 or a 10 (p < 0.001). 5. Indicates that he/she or another person living in the immediate household has been in a vehicle collision with or an accident involving a deer on PA's roads or highways in the past 12 months (p < 0.001). 5. Does not strongly or moderately agree that it is OK for private citizens to feed or attract deer in PA (p < 0.001). 6. Rates concern about deer impacts on the habitat and other wildlife in PA as a 9 or 10 (p < 0.001). 8. Is more than median age (p < 0.001). 8. Primary place of residence is not a single-family home (p < 0.001). 8. Has lived at his/her primary place of residence for more than the median number of years (p < 0.001). 8. Lives in WMU 2B (p < 0.001). 8. Lives in WMU 5C (p < 0.001). 8. Lives in WMU 3D (p < 0.001). 8. Lives in WMU 2D (p < 0.001). 8. Is female (p < 0.001). 8. Lives in WMU 2A (p < 0.01). See page 9 through 11 for explanation of how to interpret z-score tables.
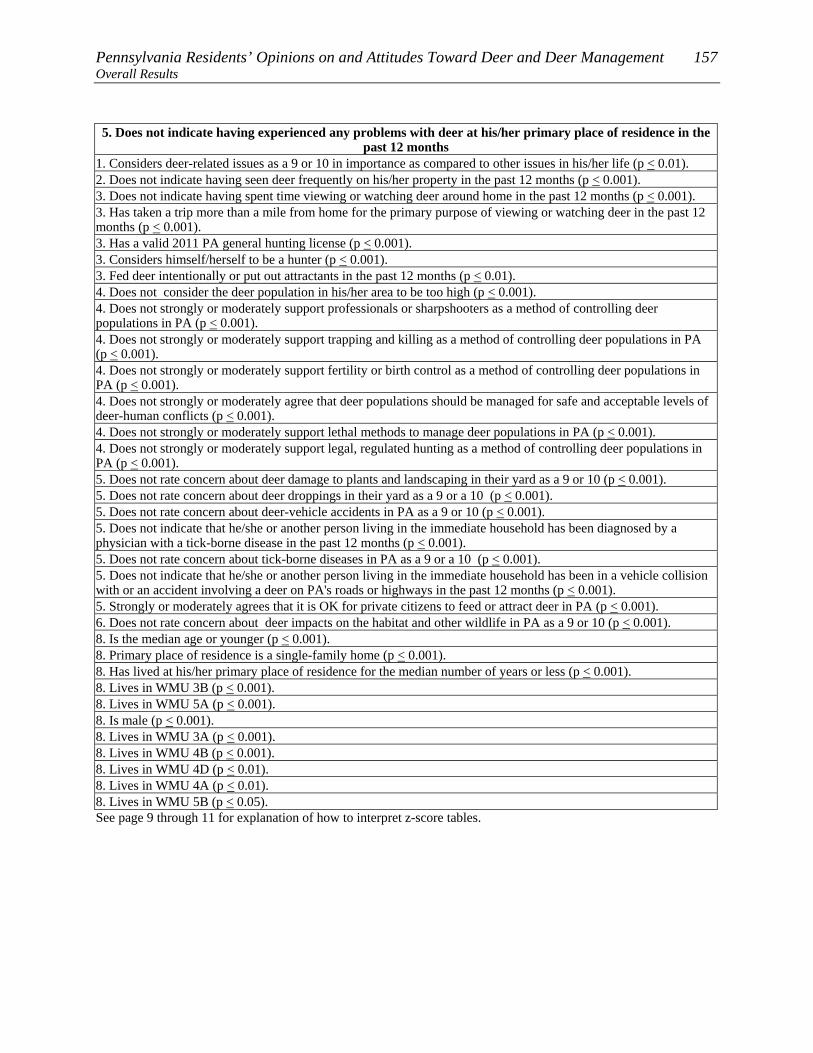
Pennsylvania Residents’ Opinions on and Attitudes Toward Deer and Deer Management 157 Overall Results 5. Does not indicate having experienced any problems with deer at his/her primary place of residence in the
past 12 months 1. Considers deer-related issues as a 9 or 10 in importance as compared to other issues in his/her life (p < 0.01). 2. Does not indicate having seen deer frequently on his/her property in the past 12 months (p < 0.001). 3. Does not indicate having spent time viewing or watching deer around home in the past 12 months (p < 0.001). 3. Has taken a trip more than a mile from home for the primary purpose of viewing or watching deer in the past 12 months (p < 0.001). 3. Has a valid 2011 PA general hunting license (p < 0.001). 3. Considers himself/herself to be a hunter (p < 0.001). 3. Fed deer intentionally or put out attractants in the past 12 months (p < 0.01). 4. Does not consider the deer population in his/her area to be too high (p < 0.001). 4. Does not strongly or moderately support professionals or sharpshooters as a method of controlling deer populations in PA (p < 0.001). 4. Does not strongly or moderately support trapping and killing as a method of controlling deer populations in PA (p < 0.001). 4. Does not strongly or moderately support fertility or birth control as a method of controlling deer populations in PA (p < 0.001). 4. Does not strongly or moderately agree that deer populations should be managed for safe and acceptable levels of deer-human conflicts (p < 0.001). 4. Does not strongly or moderately support lethal methods to manage deer populations in PA (p < 0.001). 4. Does not strongly or moderately support legal, regulated hunting as a method of controlling deer populations in PA (p < 0.001). 5. Does not rate concern about deer damage to plants and landscaping in their yard as a 9 or 10 (p < 0.001). 5. Does not rate concern about deer droppings in their yard as a 9 or a 10 (p < 0.001). 5. Does not rate concern about deer-vehicle accidents in PA as a 9 or 10 (p < 0.001). 5. Does not indicate that he/she or another person living in the immediate household has been diagnosed by a physician with a tick-borne disease in the past 12 months (p < 0.001). 5. Does not rate concern about tick-borne diseases in PA as a 9 or a 10 (p < 0.001). 5. Does not indicate that he/she or another person living in the immediate household has been in a vehicle collision with or an accident involving a deer on PA's roads or highways in the past 12 months (p < 0.001). 5. Strongly or moderately agrees that it is OK for private citizens to feed or attract deer in PA (p < 0.001). 6. Does not rate concern about deer impacts on the habitat and other wildlife in PA as a 9 or 10 (p < 0.001). 8. Is the median age or younger (p < 0.001). 8. Primary place of residence is a single-family home (p < 0.001). 8. Has lived at his/her primary place of residence for the median number of years or less (p < 0.001). 8. Lives in WMU 3B (p < 0.001). 8. Lives in WMU 5A (p < 0.001). 8. Is male (p < 0.001). 8. Lives in WMU 3A (p < 0.001). 8. Lives in WMU 4B (p < 0.001). 8. Lives in WMU 4D (p < 0.01). 8. Lives in WMU 4A (p < 0.01). 8. Lives in WMU 5B (p < 0.05). See page 9 through 11 for explanation of how to interpret z-score tables.

158 Responsive Management Overall Results
Q43. In the past 12 months, have you experienced any problems with deer at your primary place of
residence?
12
88
88
12
0 20 40 60 80 100
Yes
No
Percent
Fed birds on his / herproperty in the past 12months (n=4496)Did not feed birds on his /her property in the past 12months (n=4708)

Pennsylvania Residents’ Opinions on and Attitudes Toward Deer and Deer Management 159 Overall Results
Q43. In the past 12 months, have you experienced any problems with deer at your primary place of
residence?
21
79
89
11
0 20 40 60 80 100
Yes
No
Percent
Is aware of neighborsfeeding deer or putting outattractants (n=1226)Is not aware of neighborsfeeding deer or putting outattractants (n=7836)

160 Responsive Management Overall Results
Q43. In the past 12 months, have you experienced any problems with deer at your primary place of residence? Yes No 1A 12 881B 9 912A 15 852B 19 812C 9 912D 16 842E 11 892F 11 892G 8 923A 5 953B 4 963C 10 903D 16 844A 6 944B 5 954C 10 904D 6 944E 12 885A 4 965B 7 935C 17 835D 12 88Statewide 12 88

Pennsylvania Residents’ Opinions on and Attitudes Toward Deer and Deer Management 161 Overall Results

162 Responsive Management Overall Results
Q44. In the past 12 months, have you or any other person living in your immediate household been in a vehicle collision with or an accident involving a
deer on Pennsylvania's roads or highways?
13
87
0 20 40 60 80 100
Yes
No
Percent (n=9212)
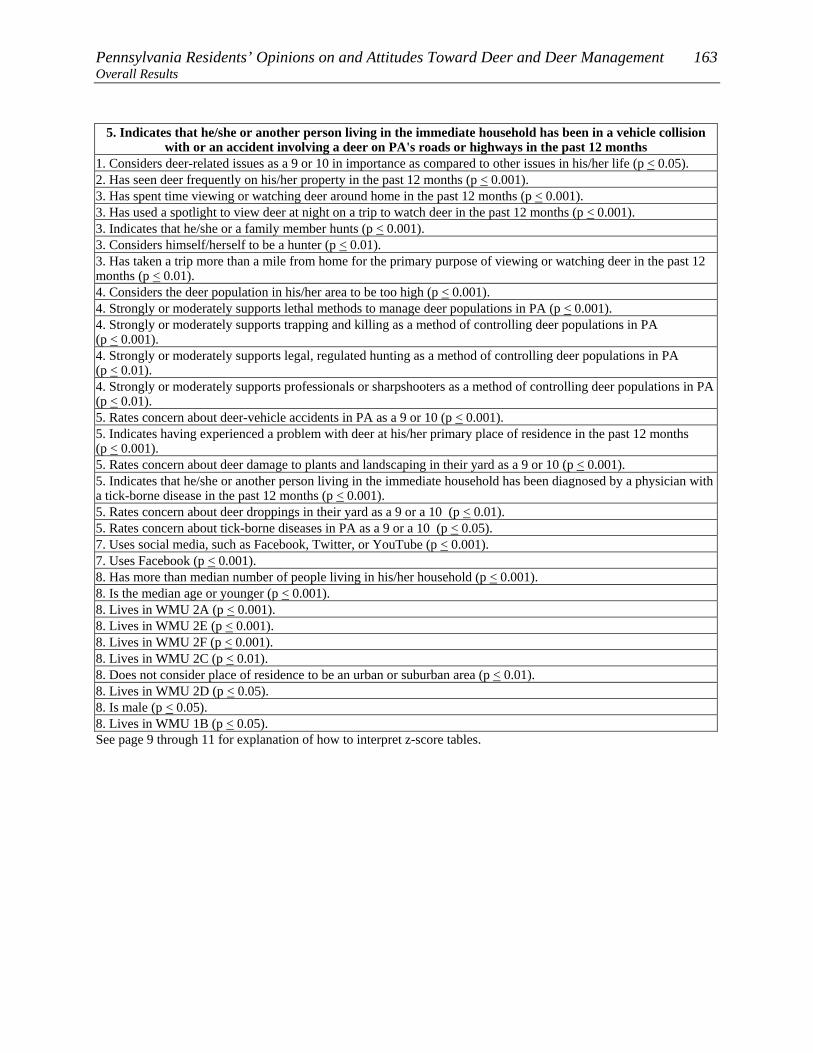
Pennsylvania Residents’ Opinions on and Attitudes Toward Deer and Deer Management 163 Overall Results
5. Indicates that he/she or another person living in the immediate household has been in a vehicle collision with or an accident involving a deer on PA's roads or highways in the past 12 months
1. Considers deer-related issues as a 9 or 10 in importance as compared to other issues in his/her life (p < 0.05). 2. Has seen deer frequently on his/her property in the past 12 months (p < 0.001). 3. Has spent time viewing or watching deer around home in the past 12 months (p < 0.001). 3. Has used a spotlight to view deer at night on a trip to watch deer in the past 12 months (p < 0.001). 3. Indicates that he/she or a family member hunts (p < 0.001). 3. Considers himself/herself to be a hunter (p < 0.01). 3. Has taken a trip more than a mile from home for the primary purpose of viewing or watching deer in the past 12 months (p < 0.01). 4. Considers the deer population in his/her area to be too high (p < 0.001). 4. Strongly or moderately supports lethal methods to manage deer populations in PA (p < 0.001). 4. Strongly or moderately supports trapping and killing as a method of controlling deer populations in PA (p < 0.001). 4. Strongly or moderately supports legal, regulated hunting as a method of controlling deer populations in PA (p < 0.01). 4. Strongly or moderately supports professionals or sharpshooters as a method of controlling deer populations in PA(p < 0.01). 5. Rates concern about deer-vehicle accidents in PA as a 9 or 10 (p < 0.001). 5. Indicates having experienced a problem with deer at his/her primary place of residence in the past 12 months (p < 0.001). 5. Rates concern about deer damage to plants and landscaping in their yard as a 9 or 10 (p < 0.001). 5. Indicates that he/she or another person living in the immediate household has been diagnosed by a physician with a tick-borne disease in the past 12 months (p < 0.001). 5. Rates concern about deer droppings in their yard as a 9 or a 10 (p < 0.01). 5. Rates concern about tick-borne diseases in PA as a 9 or a 10 (p < 0.05). 7. Uses social media, such as Facebook, Twitter, or YouTube (p < 0.001). 7. Uses Facebook (p < 0.001). 8. Has more than median number of people living in his/her household (p < 0.001). 8. Is the median age or younger (p < 0.001). 8. Lives in WMU 2A (p < 0.001). 8. Lives in WMU 2E (p < 0.001). 8. Lives in WMU 2F (p < 0.001). 8. Lives in WMU 2C (p < 0.01). 8. Does not consider place of residence to be an urban or suburban area (p < 0.01). 8. Lives in WMU 2D (p < 0.05). 8. Is male (p < 0.05). 8. Lives in WMU 1B (p < 0.05). See page 9 through 11 for explanation of how to interpret z-score tables.

164 Responsive Management Overall Results
5. Does not indicate that he/she or another person living in the immediate household has been in a vehicle
collision with or an accident involving a deer on PA's roads or highways in the past 12 months 1. Does not consider deer-related issues as a 9 or 10 in importance as compared to other issues in his/her life (p < 0.05). 2. Does not indicate having seen deer frequently on his/her property in the past 12 months (p < 0.001). 3. Does not indicate having spent time viewing or watching deer around home in the past 12 months (p < 0.001). 3. Does not indicate having used a spotlight to view deer at night on a trip to watch deer in the past 12 months (p < 0.001). 3. Does not Indicate that he/she or any of his/her family members hunt (p < 0.001). 3. Does not indicate considering himself/herself to be a hunter (p < 0.01). 3. Does not indicate having taken a trip more than a mile from home for the primary purpose of viewing or watching deer in the past 12 months (p < 0.01). 4. Does not consider the deer population in his/her area to be too high (p < 0.001). 4. Does not strongly or moderately support lethal methods to manage deer populations in PA (p < 0.001). 4. Does not strongly or moderately support trapping and killing as a method of controlling deer populations in PA (p < 0.001). 4. Does not strongly or moderately support legal, regulated hunting as a method of controlling deer populations in PA (p < 0.01). 4. Does not strongly or moderately support professionals or sharpshooters as a method of controlling deer populations in PA (p < 0.01). 5. Does not rate concern about deer-vehicle accidents in PA as a 9 or 10 (p < 0.001). 5. Does not indicate having experienced any problems with deer at his/her primary place of residence in the past 12 months (p < 0.001). 5. Does not rate concern about deer damage to plants and landscaping in their yard as a 9 or 10 (p < 0.001). 5. Does not indicate that he/she or another person living in the immediate household has been diagnosed by a physician with a tick-borne disease in the past 12 months (p < 0.001). 5. Does not rate concern about deer droppings in their yard as a 9 or a 10 (p < 0.01). 5. Does not rate concern about tick-borne diseases in PA as a 9 or a 10 (p < 0.05). 7. Does not indicate using social media, such as Facebook, Twitter, or YouTube (p < 0.001). 7. Does not indicate using Facebook (including not using any social media) (p < 0.001). 8. Has the median number or fewer people living in his/her household (p < 0.001). 8. Is more than median age (p < 0.001). 8. Lives in WMU 4C (p < 0.001). 8. Lives in WMU 5D (p < 0.001). 8. Lives in WMU 5A (p < 0.001). 8. Lives in WMU 3B (p < 0.001). 8. Lives in WMU 4B (p < 0.001). 8. Lives in WMU 5B (p < 0.01). 8. Considers place of residence to be an urban or suburban area (p < 0.01). 8. Lives in WMU 3D (p < 0.01). 8. Is female (p < 0.05). See page 9 through 11 for explanation of how to interpret z-score tables.

Pennsylvania Residents’ Opinions on and Attitudes Toward Deer and Deer Management 165 Overall Results
Q44. In the past 12 months, have you or any other person living in your immediate household been in a vehicle collision with or an accident involving a deer on Pennsylvania's roads or highways?
Yes No Don't know
1A 19 81 01B 19 81 02A 23 77 02B 16 84 02C 21 79 02D 20 80 02E 23 77 02F 23 77 02G 15 85 03A 17 83 03B 9 91 03C 16 84 03D 11 89 04A 16 84 04B 9 89 24C 8 92 0
4D 17 82 Less than 1%
4E 17 83 05A 9 91 05B 10 90 05C 13 87 05D 8 92 0
Statewide 13 87 Less than 1%

166 Responsive Management Overall Results
Q45. Were you or anyone else injured? (Asked of those who had a household member who was in or
who have personally been in a vehicle collision with or an accident involving a deer on
Pennsylvania's roads or highways in the past 12 months.)
6
94
0 20 40 60 80 100
Yes
No
Percent (n=1426)
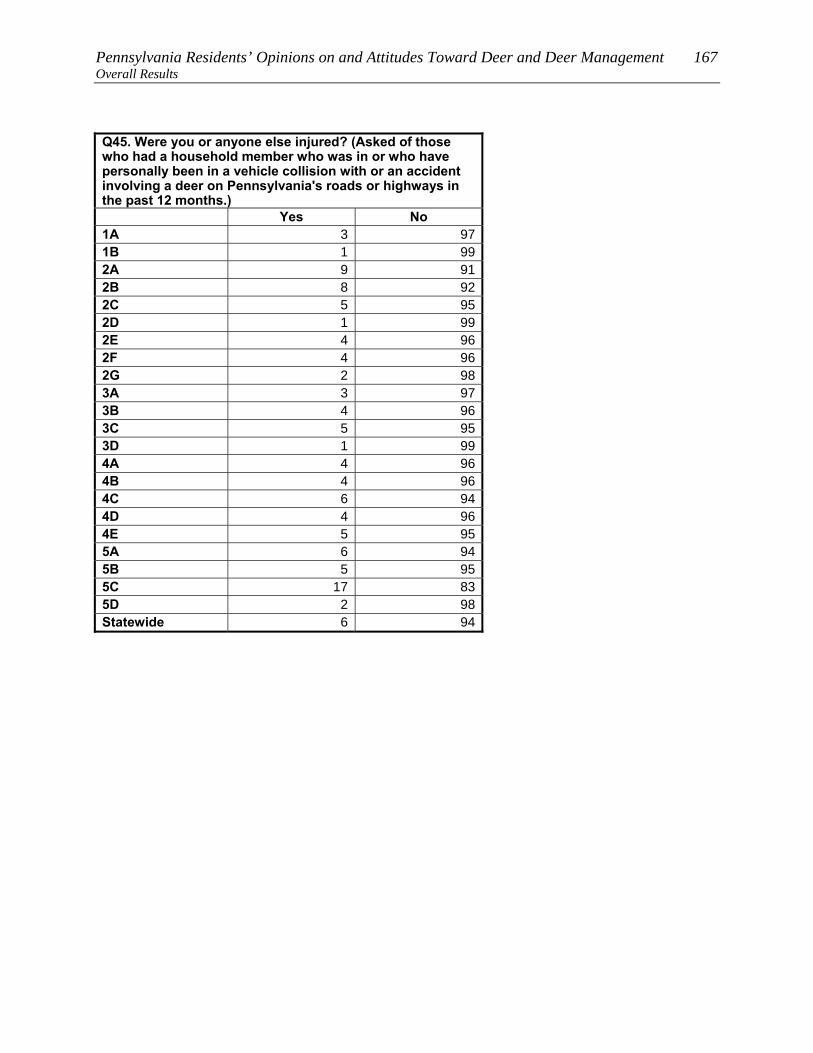
Pennsylvania Residents’ Opinions on and Attitudes Toward Deer and Deer Management 167 Overall Results
Q45. Were you or anyone else injured? (Asked of those who had a household member who was in or who have personally been in a vehicle collision with or an accident involving a deer on Pennsylvania's roads or highways in the past 12 months.) Yes No 1A 3 971B 1 992A 9 912B 8 922C 5 952D 1 992E 4 962F 4 962G 2 983A 3 973B 4 963C 5 953D 1 994A 4 964B 4 964C 6 944D 4 964E 5 955A 6 945B 5 955C 17 835D 2 98Statewide 6 94

168 Responsive Management Overall Results
Q46. In the past 12 months, have you or any other person living in your immediate household been
diagnosed by a physician with a tick-borne disease, such as Lyme disease?
4
95
Less than 1%
0 20 40 60 80 100
Yes
No
Don't know
Percent (n=9212)

Pennsylvania Residents’ Opinions on and Attitudes Toward Deer and Deer Management 169 Overall Results
5. Indicates that he/she or another person living in the immediate household has been diagnosed by a physician with a tick-borne disease in the past 12 months
2. Has seen deer frequently on his/her property in the past 12 months (p < 0.001). 3. Has spent time viewing or watching deer around home in the past 12 months (p < 0.001). 3. Indicates that he/she or a family member hunts (p < 0.001). 3. Has a valid 2011 PA general hunting license (p < 0.05). 4. Strongly or moderately supports lethal methods to manage deer populations in PA (p < 0.001). 4. Considers the deer population in his/her area to be too high (p < 0.001). 4. Strongly or moderately supports trapping and killing as a method of controlling deer populations in PA (p < 0.001). 4. Strongly or moderately agrees that deer populations should be managed for safe and acceptable levels of deer-human conflicts (p < 0.05). 5. Rates concern about tick-borne diseases in PA as a 9 or a 10 (p < 0.001). 5. Indicates having experienced a problem with deer at his/her primary place of residence in the past 12 months (p < 0.001). 5. Indicates that he/she or another person living in the immediate household has been in a vehicle collision with or an accident involving a deer on PA's roads or highways in the past 12 months (p < 0.001). 5. Rates concern about deer damage to plants and landscaping in their yard as a 9 or 10 (p < 0.001). 5. Rates concern about deer-vehicle accidents in PA as a 9 or 10 (p < 0.05). 7. Uses Facebook (p < 0.01). 7. Uses social media, such as Facebook, Twitter, or YouTube (p < 0.05). 8. Lives in WMU 5C (p < 0.001). 8. Lives in WMU 2E (p < 0.001). 8. Does not consider place of residence to be an urban or suburban area (p < 0.001). 8. Lives in WMU 2D (p < 0.01). 8. Lives in WMU 5A (p < 0.01). 8. Primary place of residence is not a single-family home (p < 0.01). 8. Has lived at his/her primary place of residence for more than the median number of years (p < 0.01). 8. Is female (p < 0.05). 8. Has more than median number of people living in his/her household (p < 0.05). See page 9 through 11 for explanation of how to interpret z-score tables.
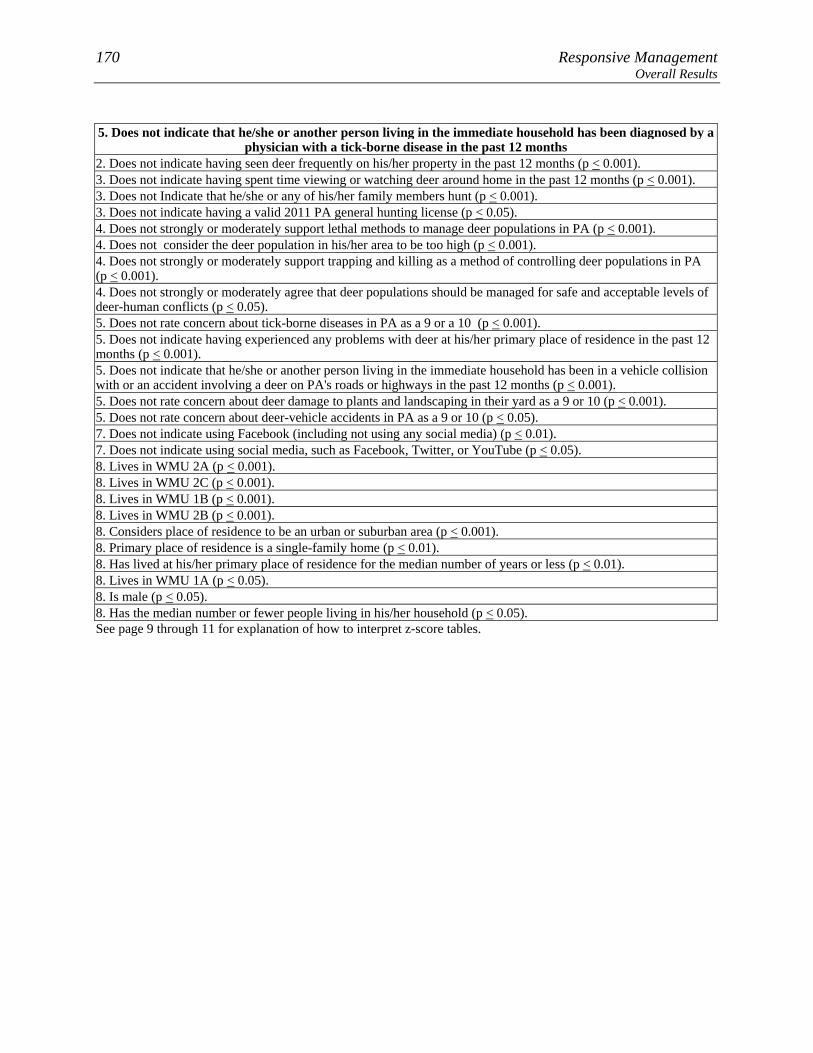
170 Responsive Management Overall Results
5. Does not indicate that he/she or another person living in the immediate household has been diagnosed by a
physician with a tick-borne disease in the past 12 months 2. Does not indicate having seen deer frequently on his/her property in the past 12 months (p < 0.001). 3. Does not indicate having spent time viewing or watching deer around home in the past 12 months (p < 0.001). 3. Does not Indicate that he/she or any of his/her family members hunt (p < 0.001). 3. Does not indicate having a valid 2011 PA general hunting license (p < 0.05). 4. Does not strongly or moderately support lethal methods to manage deer populations in PA (p < 0.001). 4. Does not consider the deer population in his/her area to be too high (p < 0.001). 4. Does not strongly or moderately support trapping and killing as a method of controlling deer populations in PA (p < 0.001). 4. Does not strongly or moderately agree that deer populations should be managed for safe and acceptable levels of deer-human conflicts (p < 0.05). 5. Does not rate concern about tick-borne diseases in PA as a 9 or a 10 (p < 0.001). 5. Does not indicate having experienced any problems with deer at his/her primary place of residence in the past 12 months (p < 0.001). 5. Does not indicate that he/she or another person living in the immediate household has been in a vehicle collision with or an accident involving a deer on PA's roads or highways in the past 12 months (p < 0.001). 5. Does not rate concern about deer damage to plants and landscaping in their yard as a 9 or 10 (p < 0.001). 5. Does not rate concern about deer-vehicle accidents in PA as a 9 or 10 (p < 0.05). 7. Does not indicate using Facebook (including not using any social media) (p < 0.01). 7. Does not indicate using social media, such as Facebook, Twitter, or YouTube (p < 0.05). 8. Lives in WMU 2A (p < 0.001). 8. Lives in WMU 2C (p < 0.001). 8. Lives in WMU 1B (p < 0.001). 8. Lives in WMU 2B (p < 0.001). 8. Considers place of residence to be an urban or suburban area (p < 0.001). 8. Primary place of residence is a single-family home (p < 0.01). 8. Has lived at his/her primary place of residence for the median number of years or less (p < 0.01). 8. Lives in WMU 1A (p < 0.05). 8. Is male (p < 0.05). 8. Has the median number or fewer people living in his/her household (p < 0.05). See page 9 through 11 for explanation of how to interpret z-score tables.
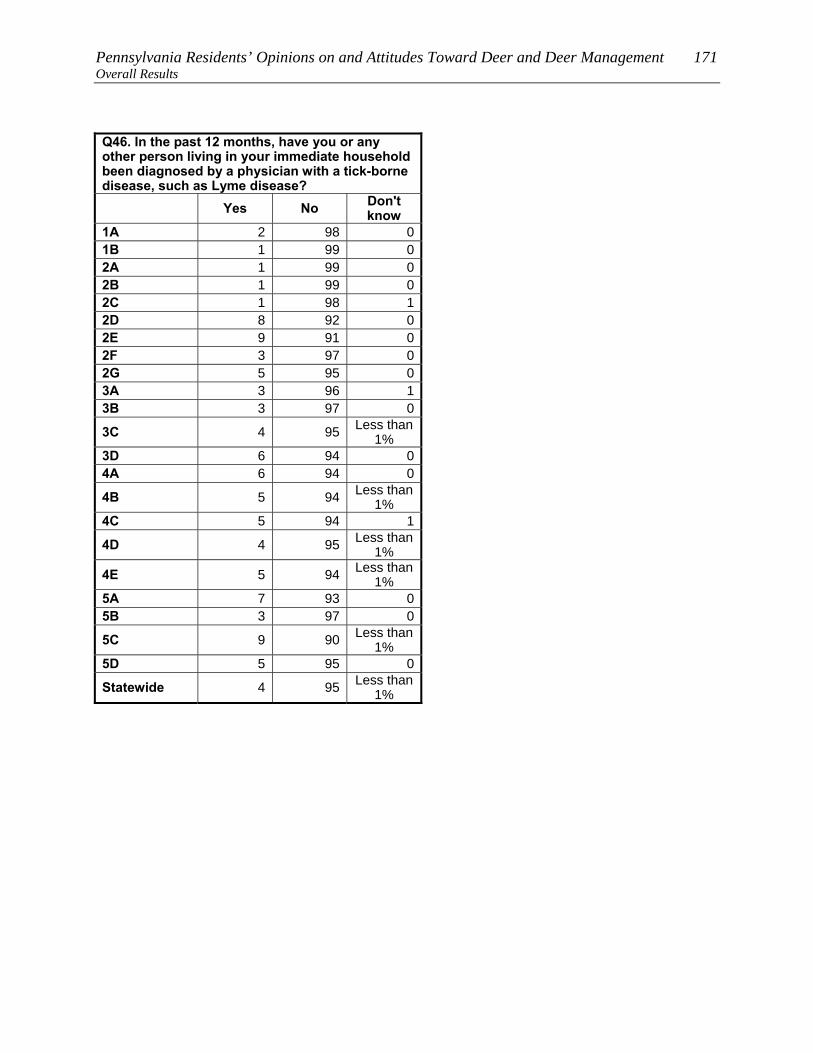
Pennsylvania Residents’ Opinions on and Attitudes Toward Deer and Deer Management 171 Overall Results
Q46. In the past 12 months, have you or any other person living in your immediate household been diagnosed by a physician with a tick-borne disease, such as Lyme disease?
Yes No Don't know
1A 2 98 01B 1 99 02A 1 99 02B 1 99 02C 1 98 12D 8 92 02E 9 91 02F 3 97 02G 5 95 03A 3 96 13B 3 97 0
3C 4 95 Less than 1%
3D 6 94 04A 6 94 0
4B 5 94 Less than 1%
4C 5 94 1
4D 4 95 Less than 1%
4E 5 94 Less than 1%
5A 7 93 05B 3 97 0
5C 9 90 Less than 1%
5D 5 95 0
Statewide 4 95 Less than 1%

172 Responsive Management Overall Results
FEEDING WILDLIFE AND HUNTING DEER Several questions asked about feeding wildlife.
• Among Pennsylvania residents overall, 8% fed deer or put out attractants, 10%
indicated that neighbors had done so, and just under half (44%) fed birds.
o The most typical feeds or attractants put out by respondents are salt/mineral blocks
and corn (just under half of those who put out feed/attractants put out these), with
apples put out by 18% of these respondents.
There is no consensus on whether it is okay for private citizens to feed or attract deer in
Pennsylvania: 44% agree that this is okay, but a similar percentage (47%) disagree. The rest
are neutral. While the agree responses are about evenly divided between strong and
moderate agreement, most of the disagreement is strong disagreement. A map shows the
results regarding disagreement for each WMU.
• Those who own their home, compared to those who do not, are not markedly different
regarding whether they think it is okay or not for private citizens to feed or attract deer.
A quarter of Pennsylvania residents (25%) consider themselves to be a hunter (even though
not all of them hunt every year), about three-fourths of whom have a 2011 Pennsylvania
hunting license.
• Among Pennsylvania residents whose primary place of residence is a single-family
home, 10% indicated that they personally hunt on their property.
• Just under three-fourths of Pennsylvania residents (72%) have family members or
friends who hunt.
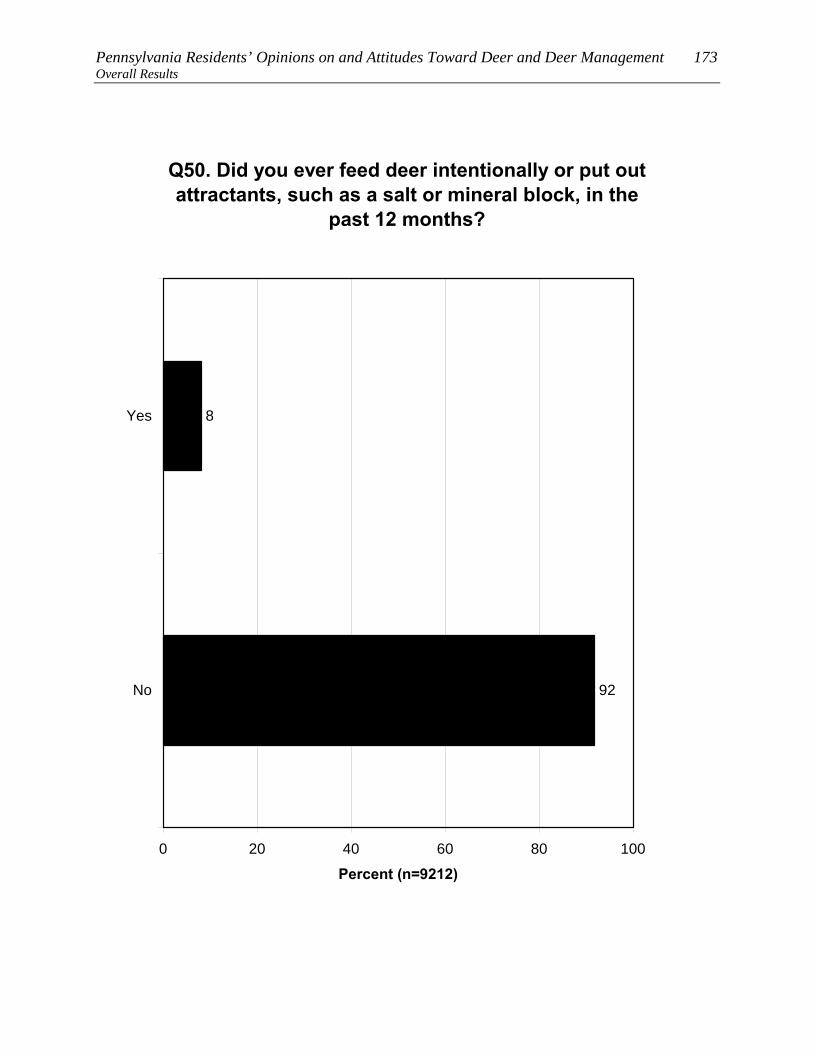
Pennsylvania Residents’ Opinions on and Attitudes Toward Deer and Deer Management 173 Overall Results
Q50. Did you ever feed deer intentionally or put out attractants, such as a salt or mineral block, in the
past 12 months?
8
92
0 20 40 60 80 100
Yes
No
Percent (n=9212)

174 Responsive Management Overall Results
3. Fed deer intentionally or put out attractants in the past 12 months
1. Considers deer-related issues as a 9 or 10 in importance as compared to other issues in his/her life (p < 0.001). 2. Has seen deer frequently on his/her property in the past 12 months (p < 0.001). 3. Has a valid 2011 PA general hunting license (p < 0.001). 3. Considers himself/herself to be a hunter (p < 0.001). 3. Has spent time viewing or watching deer around home in the past 12 months (p < 0.001). 3. Has taken a trip more than a mile from home for the primary purpose of viewing or watching deer in the past 12 months (p < 0.001). 3. Fed birds or make birdfeed available on his/her property in the past 12 months (p < 0.001). 3. Indicates that he/she or a family member hunts (p < 0.001). 3. Has used a spotlight to view deer at night on a trip to watch deer in the past 12 months (p < 0.001). 3. Is very or somewhat satisfied with opportunities to view or watch deer in PA (p < 0.001). 4. Does not consider the deer population in his/her area to be too high (p < 0.001). 4. Does not strongly or moderately support professionals or sharpshooters as a method of controlling deer populations in PA (p < 0.001). 4. Does not strongly or moderately support fertility or birth control as a method of controlling deer populations in PA (p < 0.001). 4. Does not strongly or moderately agree that deer populations should be managed for healthy and sustainable forest habitat (p < 0.001). 4. Does not strongly or moderately agree that deer populations should be managed for safe and acceptable levels of deer-human conflicts (p < 0.001). 4. Strongly or moderately supports legal, regulated hunting as a method of controlling deer populations in PA (p < 0.01). 5. Strongly or moderately agrees that it is OK for private citizens to feed or attract deer in PA (p < 0.001). 5. Does not rate concern about deer-vehicle accidents in PA as a 9 or 10 (p < 0.001). 5. Does not rate concern about deer damage to plants and landscaping in their yard as a 9 or 10 (p < 0.001). 5. Does not rate concern about deer droppings in their yard as a 9 or a 10 (p < 0.001). 5. Does not indicate having experienced any problems with deer at his/her primary place of residence in the past 12 months (p < 0.01). 6. Rates concern about the health of the deer population in PA as a 9 or 10 (p < 0.001). 6. Rates concern about the quality of deer habitat in PA as a 9 or 10 (p < 0.001). 6. Does not rate concern about deer impacts on the habitat and other wildlife in PA as a 9 or 10 (p < 0.001). 7. Does not indicate using social media, such as Facebook, Twitter, or YouTube (p < 0.01). 7. Does not indicate using Facebook (including not using any social media) (p < 0.05). 8. Does not consider place of residence to be an urban or suburban area (p < 0.001). 8. Primary place of residence is not a single-family home (p < 0.001). 8. Is male (p < 0.001). 8. Lives in WMU 2G (p < 0.001). 8. Is the median age or younger (p < 0.001). 8. Has more than median number of people living in his/her household (p < 0.001). 8. Lives in WMU 4B (p < 0.001). 8. Lives in WMU 2A (p < 0.001). 8. Lives in WMU 4A (p < 0.01). 8. Has lived at his/her primary place of residence for the median number of years or less (p < 0.01). 8. Lives in WMU 1A (p < 0.05). See page 9 through 11 for explanation of how to interpret z-score tables.

Pennsylvania Residents’ Opinions on and Attitudes Toward Deer and Deer Management 175 Overall Results
3. Does not indicate having fed deer intentionally or having put out attractants in the past 12 months 1. Does not consider deer-related issues as a 9 or 10 in importance as compared to other issues in his/her life (p < 0.001). 2. Does not indicate having seen deer frequently on his/her property in the past 12 months (p < 0.001). 3. Does not indicate having a valid 2011 PA general hunting license (p < 0.001). 3. Does not indicate considering himself/herself to be a hunter (p < 0.001). 3. Does not indicate having spent time viewing or watching deer around home in the past 12 months (p < 0.001). 3. Does not indicate having taken a trip more than a mile from home for the primary purpose of viewing or watching deer in the past 12 months (p < 0.001). 3. Does not Indicate that he/she or any of his/her family members hunt (p < 0.001). 3. Does not indicate having used a spotlight to view deer at night on a trip to watch deer in the past 12 months (p < 0.001). 3. Does not indicate being very or somewhat satisfied with opportunities to view or watch deer in PA (p < 0.001). 3. Does not indicate having fed birds or made birdfeed available on his/her property in the past 12 months (p < 0.001). 4. Considers the deer population in his/her area to be too high (p < 0.001). 4. Strongly or moderately supports professionals or sharpshooters as a method of controlling deer populations in PA(p < 0.001). 4. Strongly or moderately supports fertility or birth control as a method of controlling deer populations in PA (p < 0.001). 4. Strongly or moderately agrees that deer populations should be managed for healthy and sustainable forest habitat (p < 0.001). 4. Strongly or moderately agrees that deer populations should be managed for safe and acceptable levels of deer-human conflicts (p < 0.001). 4. Does not strongly or moderately support legal, regulated hunting as a method of controlling deer populations in PA (p < 0.01). 5. Does not strongly or moderately agree that it is OK for private citizens to feed or attract deer in PA (p < 0.001). 5. Rates concern about deer-vehicle accidents in PA as a 9 or 10 (p < 0.001). 5. Rates concern about deer damage to plants and landscaping in their yard as a 9 or 10 (p < 0.001). 5. Rates concern about deer droppings in their yard as a 9 or a 10 (p < 0.001). 5. Indicates having experienced a problem with deer at his/her primary place of residence in the past 12 months (p < 0.01). 6. Does not rate concern about the health of the deer population in PA as a 9 or 10 (p < 0.001). 6. Does not rate concern about the quality of deer habitat in PA as a 9 or 10 (p < 0.001). 6. Rates concern about deer impacts on the habitat and other wildlife in PA as a 9 or 10 (p < 0.001). 7. Uses social media, such as Facebook, Twitter, or YouTube (p < 0.01). 7. Uses Facebook (p < 0.05). 8. Considers place of residence to be an urban or suburban area (p < 0.001). 8. Primary place of residence is a single-family home (p < 0.001). 8. Is female (p < 0.001). 8. Lives in WMU 5D (p < 0.001). 8. Is more than median age (p < 0.001). 8. Has the median number or fewer people living in his/her household (p < 0.001). 8. Lives in WMU 5B (p < 0.001). 8. Lives in WMU 3C (p < 0.001). 8. Lives in WMU 5C (p < 0.001). 8. Lives in WMU 2B (p < 0.01). 8. Has lived at his/her primary place of residence for more than the median number of years (p < 0.05). 8. Lives in WMU 3B (p < 0.05). See page 9 through 11 for explanation of how to interpret z-score tables.

176 Responsive Management Overall Results
Q50. Did you ever feed deer intentionally or put out attractants, such as a salt or mineral block, in the past 12 months?
Yes No Don't know
1A 16 84 01B 11 89 02A 18 82 02B 8 92 02C 12 88 02D 12 88 02E 15 85 02F 13 87 02G 22 78 03A 14 86 03B 9 91 03C 6 94 03D 11 89 04A 16 84 04B 18 82 04C 12 88 04D 12 88 04E 14 86 05A 12 88 05B 5 95 05C 7 93 15D 3 97 0
Statewide 8 92 Less than 1%
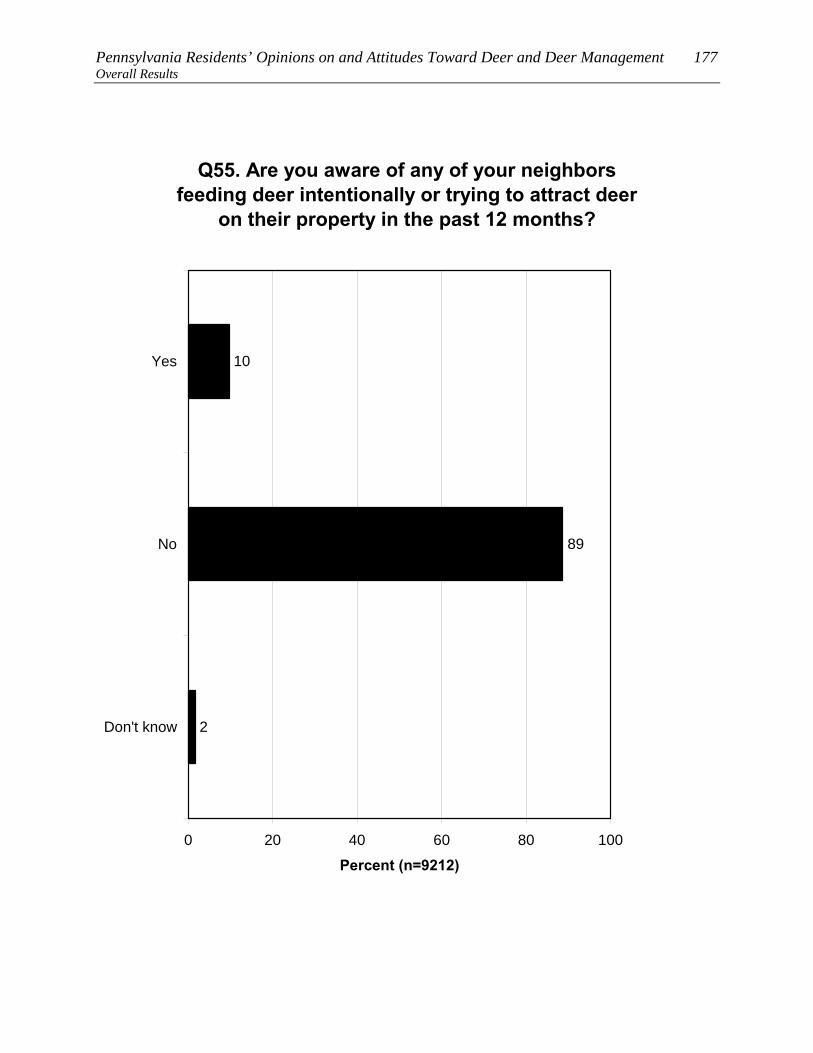
Pennsylvania Residents’ Opinions on and Attitudes Toward Deer and Deer Management 177 Overall Results
Q55. Are you aware of any of your neighbors feeding deer intentionally or trying to attract deer
on their property in the past 12 months?
10
89
2
0 20 40 60 80 100
Yes
No
Don't know
Percent (n=9212)

178 Responsive Management Overall Results
Q55. Are you aware of any of your neighbors feeding deer intentionally or trying to attract deer on their property in the past 12 months?
Yes No Don't know
1A 15 84 11B 15 83 22A 23 73 32B 12 86 22C 16 82 22D 19 79 22E 15 83 22F 15 85 12G 23 75 23A 17 81 13B 5 94 03C 8 92 03D 10 86 44A 13 84 34B 16 83 24C 13 86 14D 10 88 24E 11 88 25A 10 89 15B 8 91 15C 9 88 35D 4 96 1Statewide 10 89 2
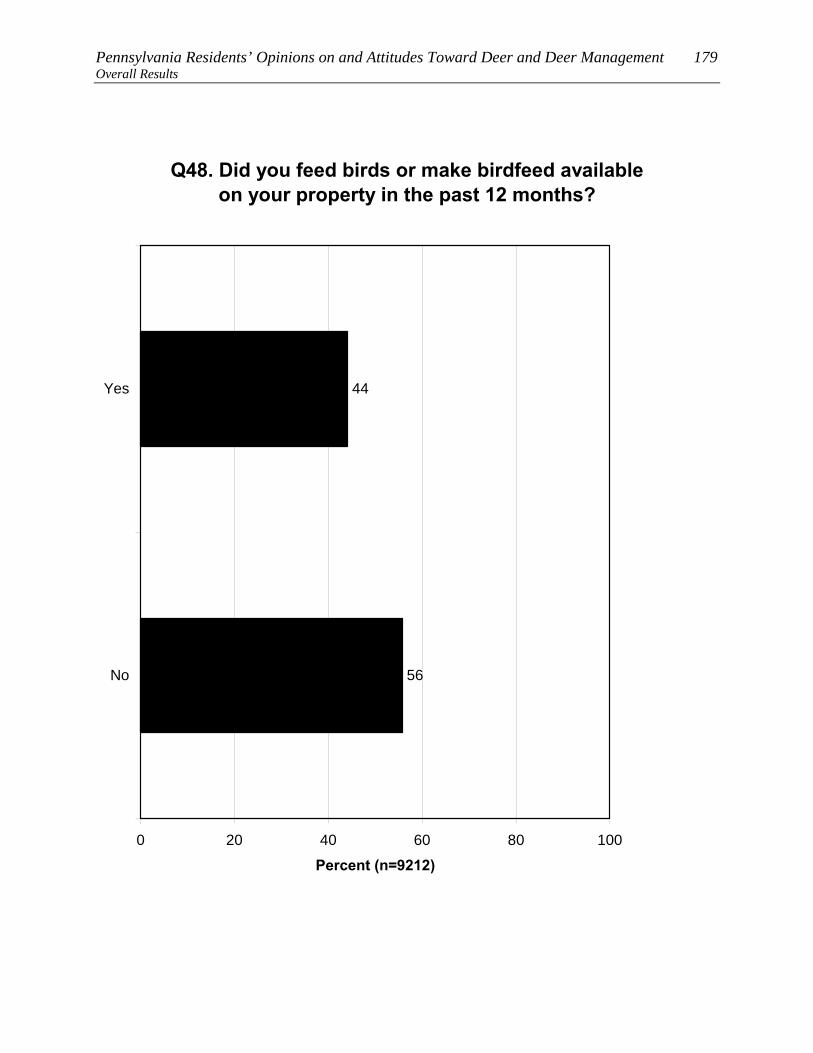
Pennsylvania Residents’ Opinions on and Attitudes Toward Deer and Deer Management 179 Overall Results
Q48. Did you feed birds or make birdfeed available on your property in the past 12 months?
44
56
0 20 40 60 80 100
Yes
No
Percent (n=9212)
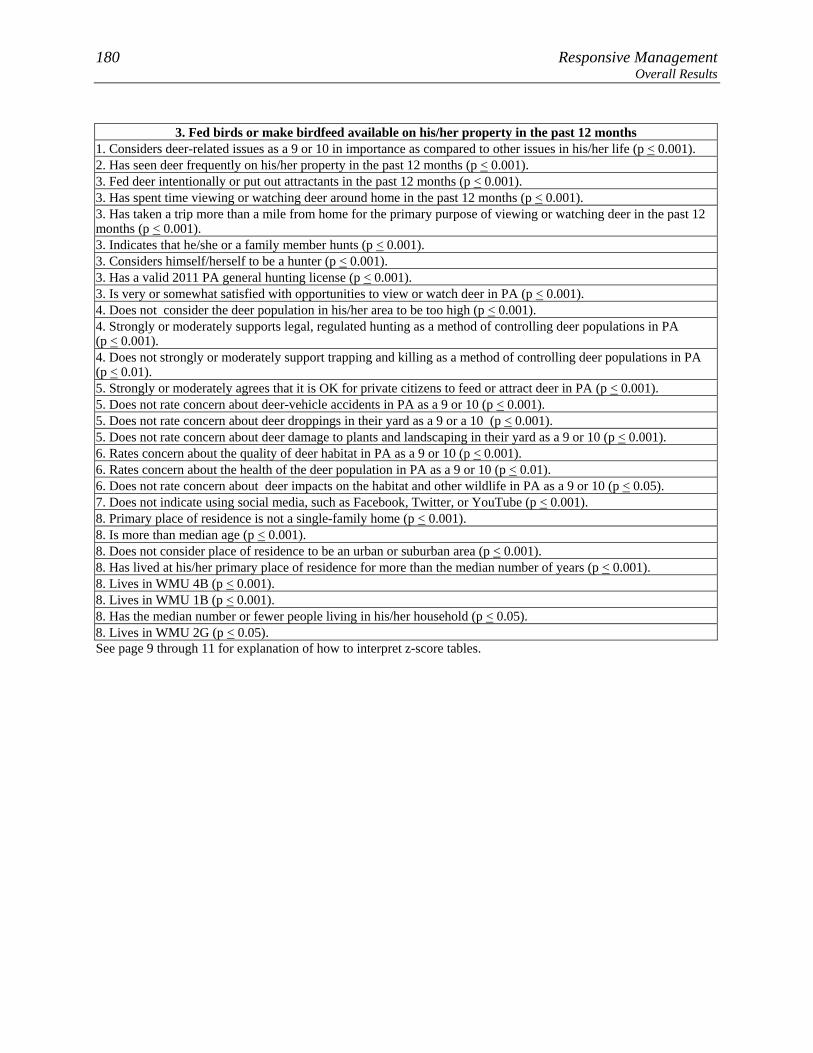
180 Responsive Management Overall Results
3. Fed birds or make birdfeed available on his/her property in the past 12 months
1. Considers deer-related issues as a 9 or 10 in importance as compared to other issues in his/her life (p < 0.001). 2. Has seen deer frequently on his/her property in the past 12 months (p < 0.001). 3. Fed deer intentionally or put out attractants in the past 12 months (p < 0.001). 3. Has spent time viewing or watching deer around home in the past 12 months (p < 0.001). 3. Has taken a trip more than a mile from home for the primary purpose of viewing or watching deer in the past 12 months (p < 0.001). 3. Indicates that he/she or a family member hunts (p < 0.001). 3. Considers himself/herself to be a hunter (p < 0.001). 3. Has a valid 2011 PA general hunting license (p < 0.001). 3. Is very or somewhat satisfied with opportunities to view or watch deer in PA (p < 0.001). 4. Does not consider the deer population in his/her area to be too high (p < 0.001). 4. Strongly or moderately supports legal, regulated hunting as a method of controlling deer populations in PA (p < 0.001). 4. Does not strongly or moderately support trapping and killing as a method of controlling deer populations in PA (p < 0.01). 5. Strongly or moderately agrees that it is OK for private citizens to feed or attract deer in PA (p < 0.001). 5. Does not rate concern about deer-vehicle accidents in PA as a 9 or 10 (p < 0.001). 5. Does not rate concern about deer droppings in their yard as a 9 or a 10 (p < 0.001). 5. Does not rate concern about deer damage to plants and landscaping in their yard as a 9 or 10 (p < 0.001). 6. Rates concern about the quality of deer habitat in PA as a 9 or 10 (p < 0.001). 6. Rates concern about the health of the deer population in PA as a 9 or 10 (p < 0.01). 6. Does not rate concern about deer impacts on the habitat and other wildlife in PA as a 9 or 10 (p < 0.05). 7. Does not indicate using social media, such as Facebook, Twitter, or YouTube (p < 0.001). 8. Primary place of residence is not a single-family home (p < 0.001). 8. Is more than median age (p < 0.001). 8. Does not consider place of residence to be an urban or suburban area (p < 0.001). 8. Has lived at his/her primary place of residence for more than the median number of years (p < 0.001). 8. Lives in WMU 4B (p < 0.001). 8. Lives in WMU 1B (p < 0.001). 8. Has the median number or fewer people living in his/her household (p < 0.05). 8. Lives in WMU 2G (p < 0.05). See page 9 through 11 for explanation of how to interpret z-score tables.

Pennsylvania Residents’ Opinions on and Attitudes Toward Deer and Deer Management 181 Overall Results
3. Does not indicate having fed birds or made birdfeed available on his/her property in the past 12 months 1. Does not consider deer-related issues as a 9 or 10 in importance as compared to other issues in his/her life (p < 0.001). 2. Does not indicate having seen deer frequently on his/her property in the past 12 months (p < 0.001). 3. Does not indicate having fed deer intentionally or having put out attractants in the past 12 months (p < 0.001). 3. Does not indicate having spent time viewing or watching deer around home in the past 12 months (p < 0.001). 3. Does not indicate having taken a trip more than a mile from home for the primary purpose of viewing or watching deer in the past 12 months (p < 0.001). 3. Does not Indicate that he/she or any of his/her family members hunt (p < 0.001). 3. Does not indicate considering himself/herself to be a hunter (p < 0.001). 3. Does not indicate having a valid 2011 PA general hunting license (p < 0.001). 3. Does not indicate being very or somewhat satisfied with opportunities to view or watch deer in PA (p < 0.001). 4. Considers the deer population in his/her area to be too high (p < 0.001). 4. Does not strongly or moderately support legal, regulated hunting as a method of controlling deer populations in PA (p < 0.001). 4. Strongly or moderately supports trapping and killing as a method of controlling deer populations in PA (p < 0.01). 5. Does not strongly or moderately agree that it is OK for private citizens to feed or attract deer in PA (p < 0.001). 5. Rates concern about deer-vehicle accidents in PA as a 9 or 10 (p < 0.001). 5. Rates concern about deer droppings in their yard as a 9 or a 10 (p < 0.001). 5. Rates concern about deer damage to plants and landscaping in their yard as a 9 or 10 (p < 0.001). 6. Does not rate concern about the quality of deer habitat in PA as a 9 or 10 (p < 0.001). 6. Does not rate concern about the health of the deer population in PA as a 9 or 10 (p < 0.01). 6. Rates concern about deer impacts on the habitat and other wildlife in PA as a 9 or 10 (p < 0.05). 7. Uses social media, such as Facebook, Twitter, or YouTube (p < 0.001). 8. Primary place of residence is a single-family home (p < 0.001). 8. Is the median age or younger (p < 0.001). 8. Considers place of residence to be an urban or suburban area (p < 0.001). 8. Lives in WMU 5D (p < 0.001). 8. Has lived at his/her primary place of residence for the median number of years or less (p < 0.001). 8. Lives in WMU 2B (p < 0.001). 8. Has more than median number of people living in his/her household (p < 0.05). See page 9 through 11 for explanation of how to interpret z-score tables.

182 Responsive Management Overall Results
Q48. Did you feed birds or make birdfeed available on your property in the past 12 months?
Yes No Don't know
1A 53 47 01B 59 41 02A 49 50 12B 38 62 02C 48 52 02D 49 51 0
2E 51 48 Less than 1%
2F 53 47 02G 54 46 0
3A 52 47 Less than 1%
3B 45 55 03C 47 53 03D 49 51 04A 50 50 04B 60 40 04C 49 51 04D 52 48 04E 51 48 15A 50 50 05B 51 49 05C 49 51 0
5D 31 68 Less than 1%
Statewide 44 56 Less than 1%

Pennsylvania Residents’ Opinions on and Attitudes Toward Deer and Deer Management 183 Overall Results
Q53. What type of feed or attractant did you use? (Asked of those who fed deer intentionally or put
out attractants in the past 12 months.)
1
2
2
48
44
18
4
4
3
2
0 20 40 60 80 100
Salt / mineral block
Corn
Apples
Pellets / commercial feed
Other food products
Birdseed
Bread
Hay
Horse feed
Don't know
Mul
tiple
Res
pons
es A
llow
ed
Percent (n=1132)

184 Responsive Management Overall Results
Q53. What type of feed or attractant did you use? (Asked of those who fed deer intentionally or put out attractants in the past 12 months.) (Multiple Responses Allowed)
Salt
/ min
eral
bl
ock
Cor
n
App
les
Pelle
ts /
com
mer
cial
feed
Oth
er fo
od
prod
ucts
Bird
seed
Bre
ad
Hay
Don
't kn
ow
Hor
se fe
ed
Food
plo
t
Oth
er
Non
-con
sum
able
at
trac
tant
s
1A 42 39 21 1 0 5 0 2 4 0 0 0 01B 41 45 22 7 8 0 0 0 0 3 0 1 02A 49 51 22 2 3 12 3 1 0 1 0 0 02B 38 31 27 3 2 7 7 5 0 0 0 0 22C 38 53 25 4 3 8 0 2 0 1 0 0 02D 55 60 10 0 0 1 0 0 1 0 0 0 02E 50 65 16 3 4 2 2 0 0 4 3 0 12F 38 40 28 7 0 4 0 5 0 0 0 0 02G 61 51 8 8 3 8 0 0 1 1 1 0 03A 40 46 21 5 2 0 1 0 0 3 6 2 03B 50 41 18 1 1 1 4 2 0 2 0 0 03C 20 50 23 7 7 8 4 2 0 4 0 0 03D 48 44 16 4 3 0 11 4 0 10 0 0 04A 41 54 21 6 5 0 0 0 1 0 1 2 04B 53 50 13 2 1 2 0 1 2 0 3 3 04C 48 38 14 4 7 0 3 0 6 1 2 3 04D 37 66 16 7 0 0 0 0 0 0 0 0 04E 45 39 10 7 6 1 0 4 1 1 0 0 05A 37 53 28 12 1 3 1 0 0 0 1 0 05B 56 20 13 0 16 0 0 0 16 0 0 0 05C 60 50 14 3 0 0 0 4 0 0 0 0 05D 67 35 13 8 8 0 0 0 0 0 0 0 0State-wide 48 44 18 4 4 3 2 2 2 1 0 0 0

Pennsylvania Residents’ Opinions on and Attitudes Toward Deer and Deer Management 185 Overall Results
Q56. Do you agree or disagree that it is OK for private citizens to feed or attract deer in
Pennsylvania?
20
24
8
15
32
2
0 20 40 60 80 100
Strongly agree
Moderately agree
Neither agree nordisagree
Moderatelydisagree
Strongly disagree
Don't know
Percent (n=9212)
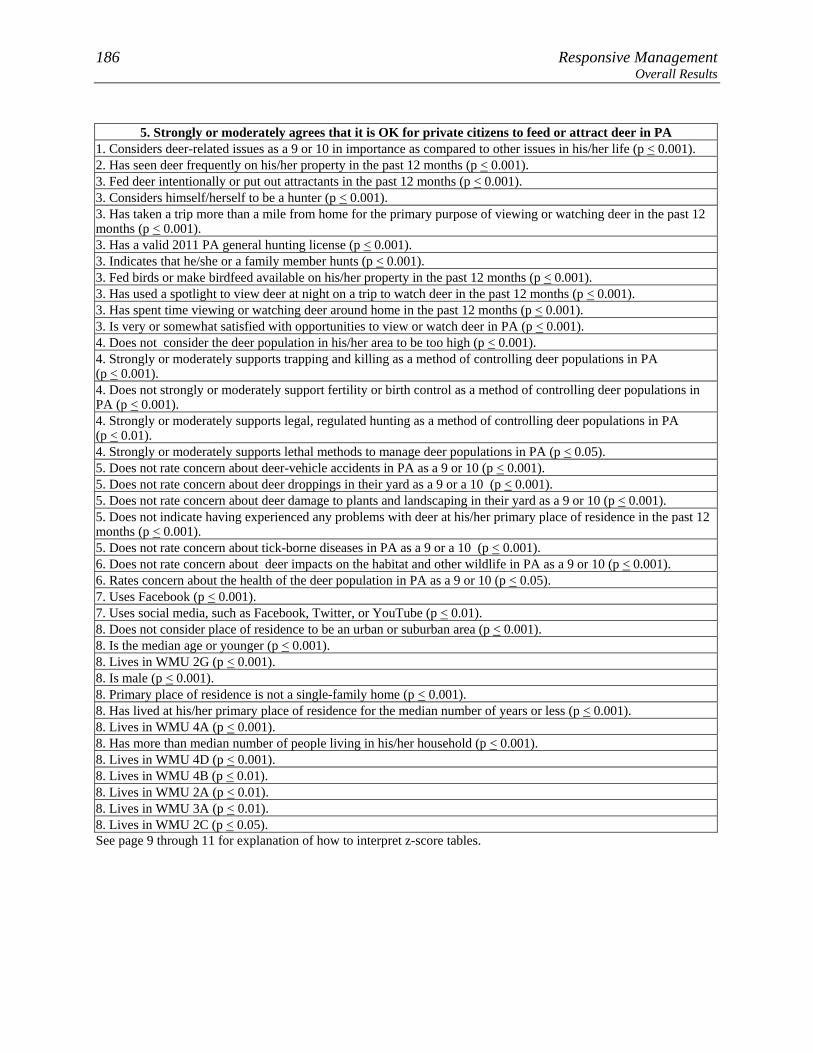
186 Responsive Management Overall Results
5. Strongly or moderately agrees that it is OK for private citizens to feed or attract deer in PA
1. Considers deer-related issues as a 9 or 10 in importance as compared to other issues in his/her life (p < 0.001). 2. Has seen deer frequently on his/her property in the past 12 months (p < 0.001). 3. Fed deer intentionally or put out attractants in the past 12 months (p < 0.001). 3. Considers himself/herself to be a hunter (p < 0.001). 3. Has taken a trip more than a mile from home for the primary purpose of viewing or watching deer in the past 12 months (p < 0.001). 3. Has a valid 2011 PA general hunting license (p < 0.001). 3. Indicates that he/she or a family member hunts (p < 0.001). 3. Fed birds or make birdfeed available on his/her property in the past 12 months (p < 0.001). 3. Has used a spotlight to view deer at night on a trip to watch deer in the past 12 months (p < 0.001). 3. Has spent time viewing or watching deer around home in the past 12 months (p < 0.001). 3. Is very or somewhat satisfied with opportunities to view or watch deer in PA (p < 0.001). 4. Does not consider the deer population in his/her area to be too high (p < 0.001). 4. Strongly or moderately supports trapping and killing as a method of controlling deer populations in PA (p < 0.001). 4. Does not strongly or moderately support fertility or birth control as a method of controlling deer populations in PA (p < 0.001). 4. Strongly or moderately supports legal, regulated hunting as a method of controlling deer populations in PA (p < 0.01). 4. Strongly or moderately supports lethal methods to manage deer populations in PA (p < 0.05). 5. Does not rate concern about deer-vehicle accidents in PA as a 9 or 10 (p < 0.001). 5. Does not rate concern about deer droppings in their yard as a 9 or a 10 (p < 0.001). 5. Does not rate concern about deer damage to plants and landscaping in their yard as a 9 or 10 (p < 0.001). 5. Does not indicate having experienced any problems with deer at his/her primary place of residence in the past 12 months (p < 0.001). 5. Does not rate concern about tick-borne diseases in PA as a 9 or a 10 (p < 0.001). 6. Does not rate concern about deer impacts on the habitat and other wildlife in PA as a 9 or 10 (p < 0.001). 6. Rates concern about the health of the deer population in PA as a 9 or 10 (p < 0.05). 7. Uses Facebook (p < 0.001). 7. Uses social media, such as Facebook, Twitter, or YouTube (p < 0.01). 8. Does not consider place of residence to be an urban or suburban area (p < 0.001). 8. Is the median age or younger (p < 0.001). 8. Lives in WMU 2G (p < 0.001). 8. Is male (p < 0.001). 8. Primary place of residence is not a single-family home (p < 0.001). 8. Has lived at his/her primary place of residence for the median number of years or less (p < 0.001). 8. Lives in WMU 4A (p < 0.001). 8. Has more than median number of people living in his/her household (p < 0.001). 8. Lives in WMU 4D (p < 0.001). 8. Lives in WMU 4B (p < 0.01). 8. Lives in WMU 2A (p < 0.01). 8. Lives in WMU 3A (p < 0.01). 8. Lives in WMU 2C (p < 0.05). See page 9 through 11 for explanation of how to interpret z-score tables.
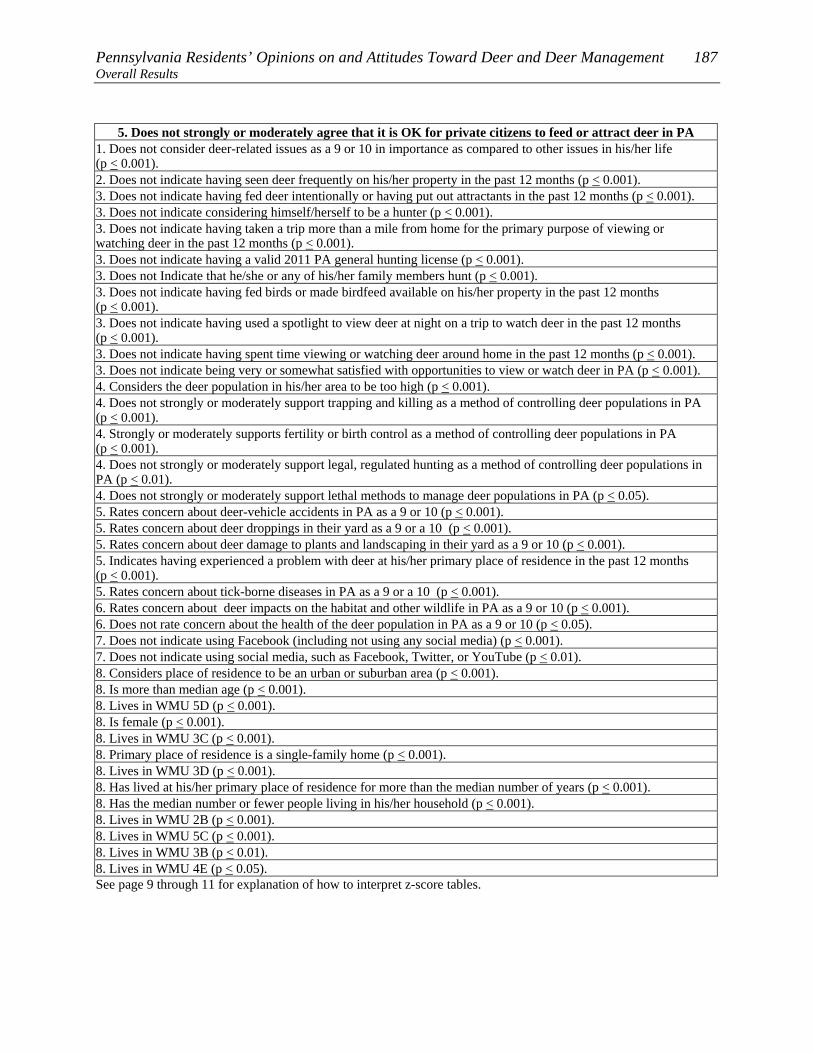
Pennsylvania Residents’ Opinions on and Attitudes Toward Deer and Deer Management 187 Overall Results
5. Does not strongly or moderately agree that it is OK for private citizens to feed or attract deer in PA 1. Does not consider deer-related issues as a 9 or 10 in importance as compared to other issues in his/her life (p < 0.001). 2. Does not indicate having seen deer frequently on his/her property in the past 12 months (p < 0.001). 3. Does not indicate having fed deer intentionally or having put out attractants in the past 12 months (p < 0.001). 3. Does not indicate considering himself/herself to be a hunter (p < 0.001). 3. Does not indicate having taken a trip more than a mile from home for the primary purpose of viewing or watching deer in the past 12 months (p < 0.001). 3. Does not indicate having a valid 2011 PA general hunting license (p < 0.001). 3. Does not Indicate that he/she or any of his/her family members hunt (p < 0.001). 3. Does not indicate having fed birds or made birdfeed available on his/her property in the past 12 months (p < 0.001). 3. Does not indicate having used a spotlight to view deer at night on a trip to watch deer in the past 12 months (p < 0.001). 3. Does not indicate having spent time viewing or watching deer around home in the past 12 months (p < 0.001). 3. Does not indicate being very or somewhat satisfied with opportunities to view or watch deer in PA (p < 0.001). 4. Considers the deer population in his/her area to be too high (p < 0.001). 4. Does not strongly or moderately support trapping and killing as a method of controlling deer populations in PA (p < 0.001). 4. Strongly or moderately supports fertility or birth control as a method of controlling deer populations in PA (p < 0.001). 4. Does not strongly or moderately support legal, regulated hunting as a method of controlling deer populations in PA (p < 0.01). 4. Does not strongly or moderately support lethal methods to manage deer populations in PA (p < 0.05). 5. Rates concern about deer-vehicle accidents in PA as a 9 or 10 (p < 0.001). 5. Rates concern about deer droppings in their yard as a 9 or a 10 (p < 0.001). 5. Rates concern about deer damage to plants and landscaping in their yard as a 9 or 10 (p < 0.001). 5. Indicates having experienced a problem with deer at his/her primary place of residence in the past 12 months (p < 0.001). 5. Rates concern about tick-borne diseases in PA as a 9 or a 10 (p < 0.001). 6. Rates concern about deer impacts on the habitat and other wildlife in PA as a 9 or 10 (p < 0.001). 6. Does not rate concern about the health of the deer population in PA as a 9 or 10 (p < 0.05). 7. Does not indicate using Facebook (including not using any social media) (p < 0.001). 7. Does not indicate using social media, such as Facebook, Twitter, or YouTube (p < 0.01). 8. Considers place of residence to be an urban or suburban area (p < 0.001). 8. Is more than median age (p < 0.001). 8. Lives in WMU 5D (p < 0.001). 8. Is female (p < 0.001). 8. Lives in WMU 3C (p < 0.001). 8. Primary place of residence is a single-family home (p < 0.001). 8. Lives in WMU 3D (p < 0.001). 8. Has lived at his/her primary place of residence for more than the median number of years (p < 0.001). 8. Has the median number or fewer people living in his/her household (p < 0.001). 8. Lives in WMU 2B (p < 0.001). 8. Lives in WMU 5C (p < 0.001). 8. Lives in WMU 3B (p < 0.01). 8. Lives in WMU 4E (p < 0.05). See page 9 through 11 for explanation of how to interpret z-score tables.

188 Responsive Management Overall Results
Q56. Do you agree or disagree that it is OK for private citizens to feed or attract deer in
Pennsylvania?
21
24
7
15
31
2
6
22
18
20
33
1
0 20 40 60 80 100
Strongly agree
Moderately agree
Neither agree nordisagree
Moderatelydisagree
Strongly disagree
Don't know
Percent
Owns home (n=7617)
Does not own home(n=589)
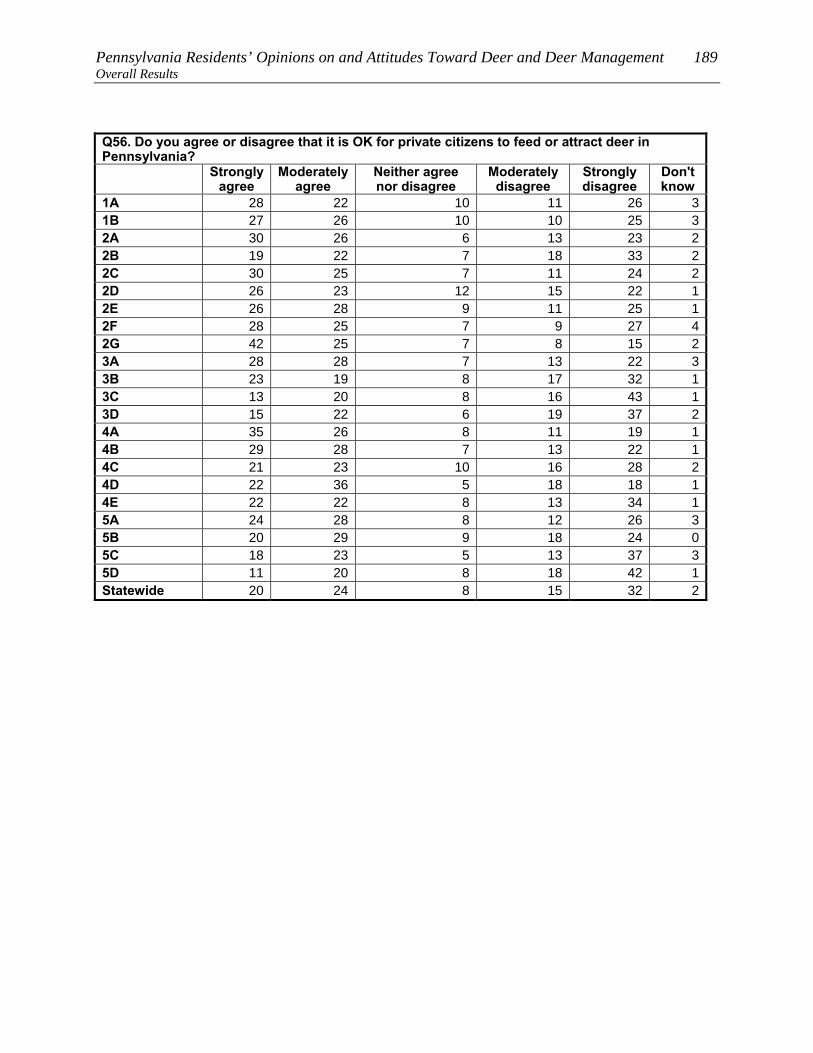
Pennsylvania Residents’ Opinions on and Attitudes Toward Deer and Deer Management 189 Overall Results
Q56. Do you agree or disagree that it is OK for private citizens to feed or attract deer in Pennsylvania?
Strongly agree
Moderately agree
Neither agree nor disagree
Moderately disagree
Strongly disagree
Don't know
1A 28 22 10 11 26 31B 27 26 10 10 25 32A 30 26 6 13 23 22B 19 22 7 18 33 22C 30 25 7 11 24 22D 26 23 12 15 22 12E 26 28 9 11 25 12F 28 25 7 9 27 42G 42 25 7 8 15 23A 28 28 7 13 22 33B 23 19 8 17 32 13C 13 20 8 16 43 13D 15 22 6 19 37 24A 35 26 8 11 19 14B 29 28 7 13 22 14C 21 23 10 16 28 24D 22 36 5 18 18 14E 22 22 8 13 34 15A 24 28 8 12 26 35B 20 29 9 18 24 05C 18 23 5 13 37 35D 11 20 8 18 42 1Statewide 20 24 8 15 32 2
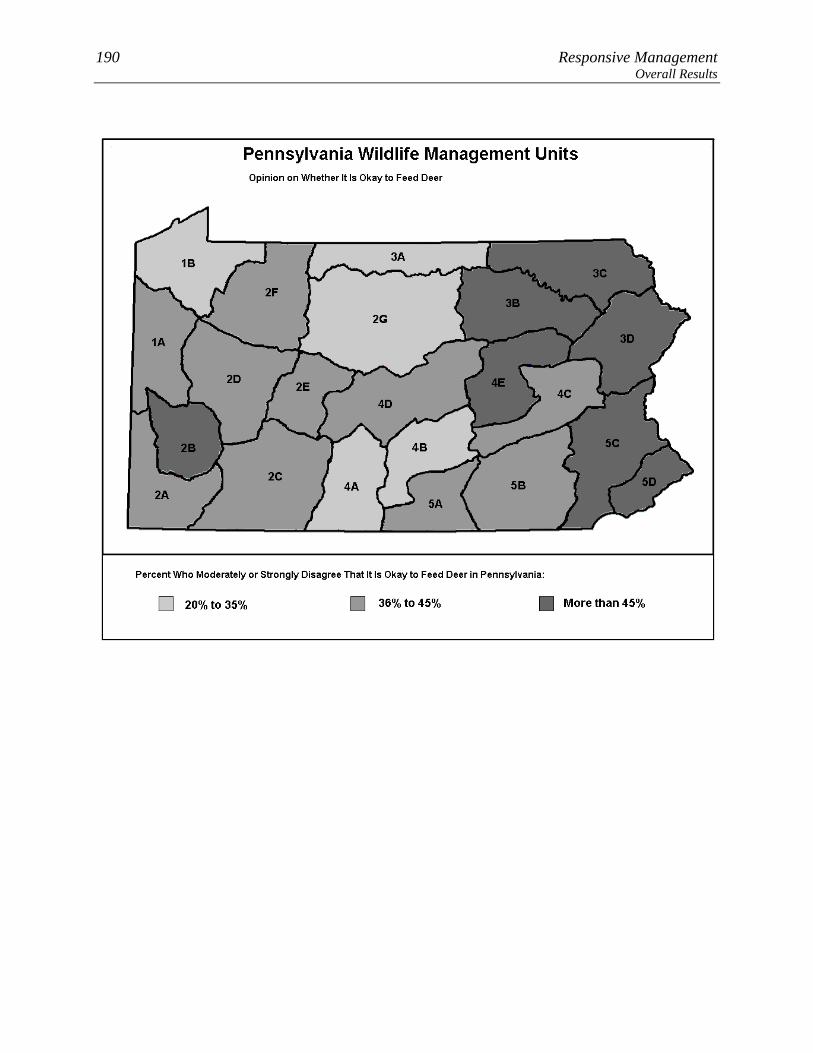
190 Responsive Management Overall Results

Pennsylvania Residents’ Opinions on and Attitudes Toward Deer and Deer Management 191 Overall Results
Q59. Do you personally hunt deer on your property? (Asked of those whose primary place of
residence is a single-family home.)
10
90
0 20 40 60 80 100
Yes
No
Percent (n=8206)
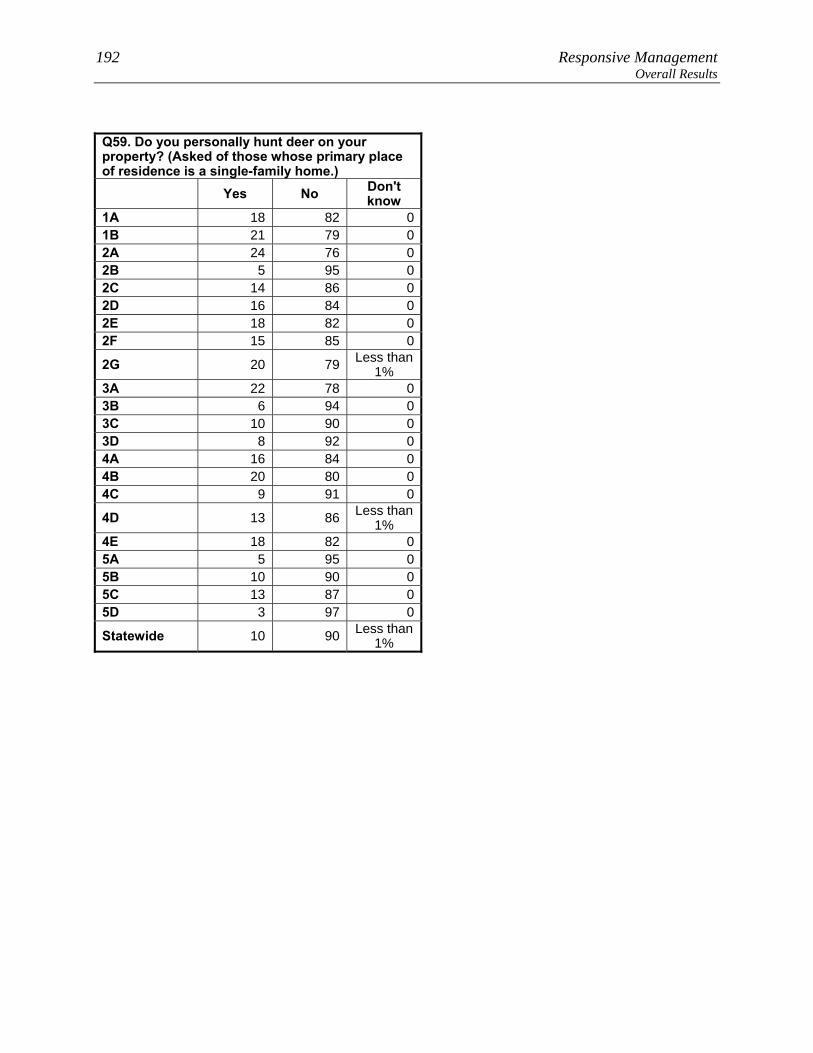
192 Responsive Management Overall Results
Q59. Do you personally hunt deer on your property? (Asked of those whose primary place of residence is a single-family home.) Yes No Don't
know 1A 18 82 01B 21 79 02A 24 76 02B 5 95 02C 14 86 02D 16 84 02E 18 82 02F 15 85 0
2G 20 79 Less than 1%
3A 22 78 03B 6 94 03C 10 90 03D 8 92 04A 16 84 04B 20 80 04C 9 91 0
4D 13 86 Less than 1%
4E 18 82 05A 5 95 05B 10 90 05C 13 87 05D 3 97 0
Statewide 10 90 Less than 1%

Pennsylvania Residents’ Opinions on and Attitudes Toward Deer and Deer Management 193 Overall Results
Q79. Do you, any of your family members, or any friends hunt any wildlife species?
72
27
1
0 20 40 60 80 100
Yes
No
Don't know
Percent (n=9212)

194 Responsive Management Overall Results
3. Indicates that he/she or a family member hunts
1. Considers deer-related issues as a 9 or 10 in importance as compared to other issues in his/her life (p < 0.001). 2. Has seen deer frequently on his/her property in the past 12 months (p < 0.001). 3. Considers himself/herself to be a hunter (p < 0.001). 3. Has a valid 2011 PA general hunting license (p < 0.001). 3. Has taken a trip more than a mile from home for the primary purpose of viewing or watching deer in the past 12 months (p < 0.001). 3. Has spent time viewing or watching deer around home in the past 12 months (p < 0.001). 3. Fed deer intentionally or put out attractants in the past 12 months (p < 0.001). 3. Fed birds or make birdfeed available on his/her property in the past 12 months (p < 0.001). 3. Has used a spotlight to view deer at night on a trip to watch deer in the past 12 months (p < 0.001). 3. Is very or somewhat satisfied with opportunities to view or watch deer in PA (p < 0.01). 4. Strongly or moderately supports legal, regulated hunting as a method of controlling deer populations in PA (p < 0.001). 4. Strongly or moderately supports lethal methods to manage deer populations in PA (p < 0.001). 4. Does not strongly or moderately support fertility or birth control as a method of controlling deer populations in PA (p < 0.001). 4. Strongly or moderately agrees that deer populations should be managed for healthy and sustainable deer populations (p < 0.001). 4. Strongly or moderately supports trapping and killing as a method of controlling deer populations in PA (p < 0.001). 4. Strongly or moderately agrees that deer populations should be managed for healthy and sustainable forest habitat (p < 0.01). 4. Does not consider the deer population in his/her area to be too high (p < 0.05). 5. Strongly or moderately agrees that it is OK for private citizens to feed or attract deer in PA (p < 0.001). 5. Does not rate concern about deer droppings in their yard as a 9 or a 10 (p < 0.001). 5. Does not rate concern about deer-vehicle accidents in PA as a 9 or 10 (p < 0.001). 5. Does not rate concern about deer damage to plants and landscaping in their yard as a 9 or 10 (p < 0.001). 5. Indicates that he/she or another person living in the immediate household has been diagnosed by a physician with a tick-borne disease in the past 12 months (p < 0.001). 5. Indicates that he/she or another person living in the immediate household has been in a vehicle collision with or an accident involving a deer on PA's roads or highways in the past 12 months (p < 0.001). 6. Does not rate concern about deer impacts on the habitat and other wildlife in PA as a 9 or 10 (p < 0.001). 6. Rates concern about the quality of deer habitat in PA as a 9 or 10 (p < 0.05). 6. Rates concern about the health of the deer population in PA as a 9 or 10 (p < 0.05). 7. Uses Facebook (p < 0.001). 7. Uses social media, such as Facebook, Twitter, or YouTube (p < 0.001). 8. Is male (p < 0.001). 8. Does not consider place of residence to be an urban or suburban area (p < 0.001). 8. Primary place of residence is not a single-family home (p < 0.001). 8. Is the median age or younger (p < 0.001). 8. Has more than median number of people living in his/her household (p < 0.001). 8. Lives in WMU 2E (p < 0.001). 8. Lives in WMU 2G (p < 0.001). 8. Lives in WMU 2F (p < 0.001). 8. Lives in WMU 4A (p < 0.001). 8. Lives in WMU 3A (p < 0.001). 8. Lives in WMU 4B (p < 0.01). 8. Lives in WMU 4E (p < 0.05). 8. Lives in WMU 1B (p < 0.05). 8. Lives in WMU 2A (p < 0.05). 8. Lives in WMU 2C (p < 0.05). See page 9 through 11 for explanation of how to interpret z-score tables.

Pennsylvania Residents’ Opinions on and Attitudes Toward Deer and Deer Management 195 Overall Results
3. Does not Indicate that he/she or any of his/her family members hunt 1. Does not consider deer-related issues as a 9 or 10 in importance as compared to other issues in his/her life (p < 0.001). 2. Does not indicate having seen deer frequently on his/her property in the past 12 months (p < 0.001). 3. Does not indicate considering himself/herself to be a hunter (p < 0.001). 3. Does not indicate having a valid 2011 PA general hunting license (p < 0.001). 3. Does not indicate having taken a trip more than a mile from home for the primary purpose of viewing or watching deer in the past 12 months (p < 0.001). 3. Does not indicate having spent time viewing or watching deer around home in the past 12 months (p < 0.001). 3. Does not indicate having fed deer intentionally or having put out attractants in the past 12 months (p < 0.001). 3. Does not indicate having fed birds or made birdfeed available on his/her property in the past 12 months (p < 0.001). 3. Does not indicate having used a spotlight to view deer at night on a trip to watch deer in the past 12 months (p < 0.001). 3. Does not indicate being very or somewhat satisfied with opportunities to view or watch deer in PA (p < 0.01). 4. Does not strongly or moderately support legal, regulated hunting as a method of controlling deer populations in PA (p < 0.001). 4. Does not strongly or moderately support lethal methods to manage deer populations in PA (p < 0.001). 4. Strongly or moderately supports fertility or birth control as a method of controlling deer populations in PA (p < 0.001). 4. Does not strongly or moderately agree that deer populations should be managed for healthy and sustainable deer populations (p < 0.001). 4. Does not strongly or moderately support trapping and killing as a method of controlling deer populations in PA (p < 0.001). 4. Does not strongly or moderately agree that deer populations should be managed for healthy and sustainable forest habitat (p < 0.01). 4. Considers the deer population in his/her area to be too high (p < 0.05). 5. Does not strongly or moderately agree that it is OK for private citizens to feed or attract deer in PA (p < 0.001). 5. Rates concern about deer droppings in their yard as a 9 or a 10 (p < 0.001). 5. Rates concern about deer-vehicle accidents in PA as a 9 or 10 (p < 0.001). 5. Rates concern about deer damage to plants and landscaping in their yard as a 9 or 10 (p < 0.001). 5. Does not indicate that he/she or another person living in the immediate household has been diagnosed by a physician with a tick-borne disease in the past 12 months (p < 0.001). 5. Does not indicate that he/she or another person living in the immediate household has been in a vehicle collision with or an accident involving a deer on PA's roads or highways in the past 12 months (p < 0.001). 6. Rates concern about deer impacts on the habitat and other wildlife in PA as a 9 or 10 (p < 0.001). 6. Does not rate concern about the quality of deer habitat in PA as a 9 or 10 (p < 0.05). 6. Does not rate concern about the health of the deer population in PA as a 9 or 10 (p < 0.05). 7. Does not indicate using Facebook (including not using any social media) (p < 0.001). 7. Does not indicate using social media, such as Facebook, Twitter, or YouTube (p < 0.001). 8. Lives in WMU 5D (p < 0.001). 8. Is female (p < 0.001). 8. Considers place of residence to be an urban or suburban area (p < 0.001). 8. Primary place of residence is a single-family home (p < 0.001). 8. Is more than median age (p < 0.001). 8. Has the median number or fewer people living in his/her household (p < 0.001). 8. Lives in WMU 5C (p < 0.001). 8. Lives in WMU 2B (p < 0.001). 8. Lives in WMU 3B (p < 0.01). 8. Lives in WMU 1A (p < 0.01). See page 9 through 11 for explanation of how to interpret z-score tables.

196 Responsive Management Overall Results
Q79. Do you, any of your family members, or any friends hunt any wildlife species? Yes No Don't know 1A 76 24 01B 85 14 12A 85 15 Less than 1%2B 72 27 Less than 1%2C 85 15 02D 83 15 22E 91 9 Less than 1%2F 89 11 02G 89 9 23A 87 12 13B 75 25 03C 78 20 13D 78 21 Less than 1%4A 88 12 04B 87 13 04C 79 21 04D 84 15 14E 86 14 15A 82 17 15B 78 22 05C 72 27 25D 53 46 1Statewide 72 27 1
Pennsylvania Residents’ Opinions on and Attitudes Toward Deer and Deer Management 197 Overall Results SOURCES OF INFORMATION
Most commonly, Pennsylvania residents say that the best way to provide them with
information about deer in Pennsylvania is through direct mail (39% gave this response). This
is distantly followed by four other sources: email (17%), newspaper (16%), the Internet
(14% saying an Internet site other than the PGC and 4% saying the agency website; note that
some said both), and TV (11%).
Just under half of Pennsylvania residents (45%) use social media such as Facebook (the most
common of the social media), YouTube, or Twitter.
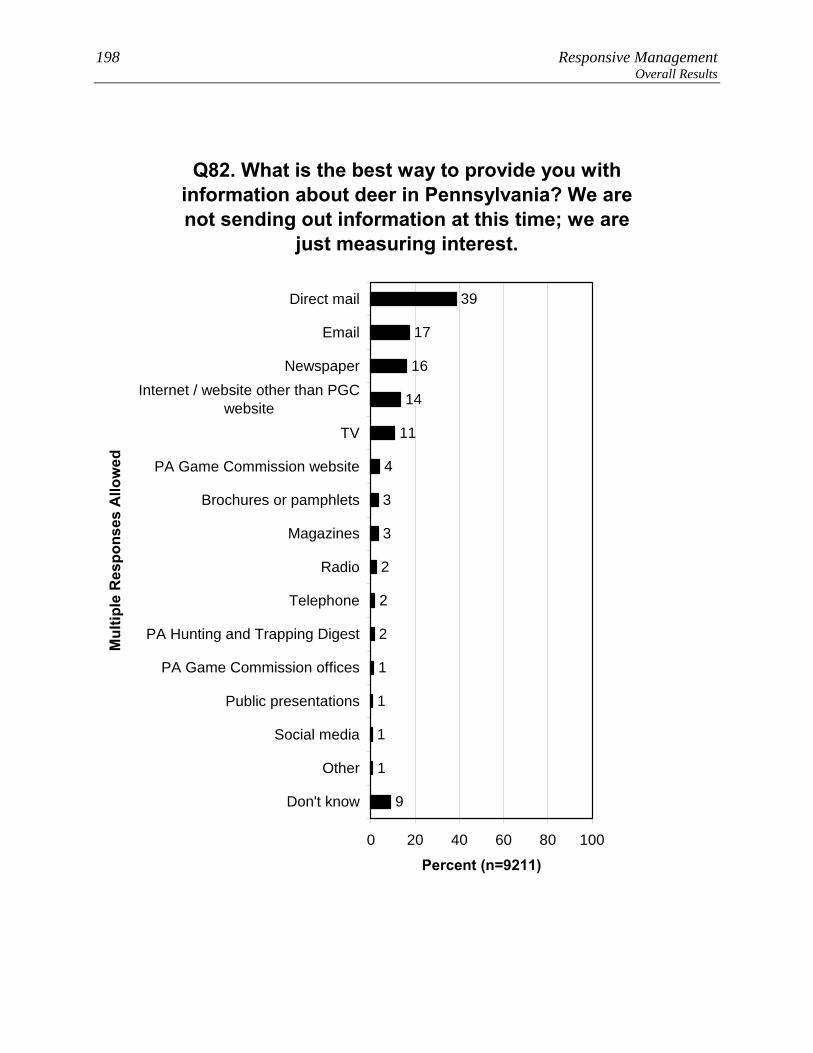
198 Responsive Management Overall Results
Q82. What is the best way to provide you with information about deer in Pennsylvania? We are not sending out information at this time; we are
just measuring interest.
9
2
3
3
39
17
16
14
11
4
2
2
1
1
1
1
0 20 40 60 80 100
Direct mail
NewspaperInternet / website other than PGC
websiteTV
PA Game Commission website
Brochures or pamphlets
Magazines
Radio
Telephone
PA Hunting and Trapping Digest
PA Game Commission offices
Public presentations
Social media
Other
Don't know
Mul
tiple
Res
pons
es A
llow
ed
Percent (n=9211)

Pennsylvania Residents’ Opinions on and Attitudes Toward Deer and Deer Management 199 Overall Results Q82. What is the best way to provide you with information about deer in Pennsylvania? We are not sending out information at this time; we are just measuring interest. (Multiple Responses Allowed)
Dire
ct m
ail
Emai
l
New
spap
er
Inte
rnet
/ w
ebsi
te o
ther
th
an P
GC
web
site
TV
Don
't kn
ow
PA G
ame
Com
mis
sion
w
ebsi
te
Bro
chur
es o
r pa
mph
lets
Mag
azin
es
Rad
io
Tele
phon
e
PA H
untin
g an
d Tr
appi
ng D
iges
t PA
Gam
e C
omm
issi
on
offic
es
Oth
er
Publ
ic p
rese
ntat
ions
Soci
al m
edia
1A 45 12 21 15 9 7 3 2 8 4 1 2 2 2 1 11B 46 15 23 11 11 5 3 4 6 2 1 2 1 1 1 12A 47 12 19 12 9 10 2 4 1 2 5 1 1 2 1 32B 36 14 20 16 15 9 4 2 5 3 5 1 1 0 1 12C 45 11 19 10 11 9 3 4 8 2 4 2 1 0 1 22D 38 17 20 13 10 12 3 4 3 1 1 3 1 0 1 12E 39 17 13 14 12 5 6 3 6 2 0 3 4 5 2 12F 41 13 19 11 8 7 5 5 3 3 2 4 5 1 1 12G 41 12 19 15 9 7 9 7 5 2 1 3 1 1 1 13A 36 10 23 10 4 7 4 6 6 2 3 4 1 2 1 13B 39 15 18 15 11 9 5 3 3 2 5 1 1 1 1 03C 37 20 14 12 12 7 2 6 5 1 3 1 0 2 1 13D 44 15 18 11 10 5 6 5 3 1 2 1 1 0 0 14A 42 12 21 10 11 8 6 6 5 4 1 3 1 1 1 04B 37 17 18 10 9 8 4 4 5 2 0 3 1 0 1 14C 36 12 17 13 11 10 4 4 3 2 1 2 0 0 2 04D 36 17 17 15 11 9 4 6 2 2 0 2 1 3 0 04E 36 15 20 12 14 7 4 5 4 2 2 2 1 1 1 05A 41 12 15 10 12 11 5 2 2 3 2 2 3 0 0 05B 42 17 16 10 6 9 5 2 3 2 0 2 1 1 1 05C 34 22 12 16 10 13 6 3 3 5 1 2 3 1 0 15D 38 22 14 14 12 8 2 4 2 1 1 1 1 0 1 0State-wide 39 17 16 14 11 9 4 3 3 2 2 2 1 1 1 1
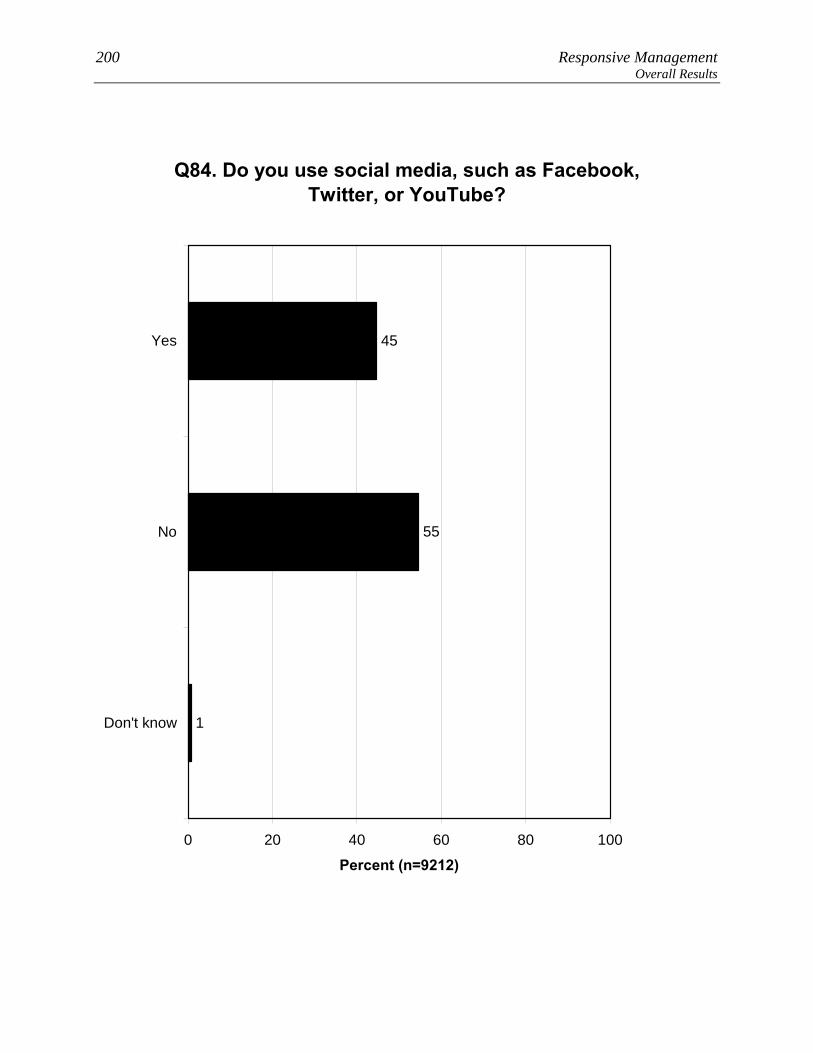
200 Responsive Management Overall Results
Q84. Do you use social media, such as Facebook, Twitter, or YouTube?
45
55
1
0 20 40 60 80 100
Yes
No
Don't know
Percent (n=9212)

Pennsylvania Residents’ Opinions on and Attitudes Toward Deer and Deer Management 201 Overall Results
7. Uses social media, such as Facebook, Twitter, or YouTube 1. Does not consider deer-related issues as a 9 or 10 in importance as compared to other issues in his/her life (p < 0.001). 2. Does not indicate having seen deer frequently on his/her property in the past 12 months (p < 0.01). 3. Does not indicate having a valid 2011 PA general hunting license (p < 0.001). 3. Does not indicate considering himself/herself to be a hunter (p < 0.001). 3. Does not indicate having spent time viewing or watching deer around home in the past 12 months (p < 0.001). 3. Has used a spotlight to view deer at night on a trip to watch deer in the past 12 months (p < 0.001). 3. Indicates that he/she or a family member hunts (p < 0.001). 3. Does not indicate having fed birds or made birdfeed available on his/her property in the past 12 months (p < 0.001). 3. Is very or somewhat satisfied with opportunities to view or watch deer in PA (p < 0.001). 3. Does not indicate having fed deer intentionally or having put out attractants in the past 12 months (p < 0.01). 4. Strongly or moderately supports professionals or sharpshooters as a method of controlling deer populations in PA (p < 0.001). 4. Strongly or moderately agrees that deer populations should be managed for healthy and sustainable deer populations (p < 0.001). 4. Strongly or moderately agrees that deer populations should be managed for healthy and sustainable forest habitat (p < 0.001). 4. Strongly or moderately supports lethal methods to manage deer populations in PA (p < 0.001). 4. Strongly or moderately supports fertility or birth control as a method of controlling deer populations in PA (p < 0.001). 4. Strongly or moderately supports trapping and killing as a method of controlling deer populations in PA (p < 0.001). 4. Strongly or moderately agrees that deer populations should be managed for safe and acceptable levels of deer-human conflicts (p < 0.01). 5. Indicates that he/she or another person living in the immediate household has been in a vehicle collision with or an accident involving a deer on PA's roads or highways in the past 12 months (p < 0.001). 5. Does not rate concern about deer damage to plants and landscaping in their yard as a 9 or 10 (p < 0.001). 5. Strongly or moderately agrees that it is OK for private citizens to feed or attract deer in PA (p < 0.01). 5. Rates concern about deer-vehicle accidents in PA as a 9 or 10 (p < 0.05). 5. Does not rate concern about tick-borne diseases in PA as a 9 or a 10 (p < 0.05). 5. Indicates that he/she or another person living in the immediate household has been diagnosed by a physician with a tick-borne disease in the past 12 months (p < 0.05). 6. Does not rate concern about deer impacts on the habitat and other wildlife in PA as a 9 or 10 (p < 0.001). 6. Does not rate concern about the quality of deer habitat in PA as a 9 or 10 (p < 0.01). 6. Does not rate concern about the health of the deer population in PA as a 9 or 10 (p < 0.05). 7. Uses Facebook (p < 0.001). 8. Is the median age or younger (p < 0.001). 8. Has lived at his/her primary place of residence for the median number of years or less (p < 0.001). 8. Has more than median number of people living in his/her household (p < 0.001). 8. Is female (p < 0.001). 8. Considers place of residence to be an urban or suburban area (p < 0.001). 8. Primary place of residence is a single-family home (p < 0.001). 8. Lives in WMU 2E (p < 0.001). 8. Lives in WMU 5D (p < 0.001). 8. Lives in WMU 3B (p < 0.05). See page 9 through 11 for explanation of how to interpret z-score tables.

202 Responsive Management Overall Results
7. Does not indicate using social media, such as Facebook, Twitter, or YouTube
1. Considers deer-related issues as a 9 or 10 in importance as compared to other issues in his/her life (p < 0.001). 2. Has seen deer frequently on his/her property in the past 12 months (p < 0.01). 3. Has a valid 2011 PA general hunting license (p < 0.001). 3. Considers himself/herself to be a hunter (p < 0.001). 3. Has spent time viewing or watching deer around home in the past 12 months (p < 0.001). 3. Does not indicate having used a spotlight to view deer at night on a trip to watch deer in the past 12 months (p < 0.001). 3. Does not Indicate that he/she or any of his/her family members hunt (p < 0.001). 3. Fed birds or make birdfeed available on his/her property in the past 12 months (p < 0.001). 3. Does not indicate being very or somewhat satisfied with opportunities to view or watch deer in PA (p < 0.001). 3. Fed deer intentionally or put out attractants in the past 12 months (p < 0.01). 4. Does not strongly or moderately support professionals or sharpshooters as a method of controlling deer populations in PA (p < 0.001). 4. Does not strongly or moderately agree that deer populations should be managed for healthy and sustainable deer populations (p < 0.001). 4. Does not strongly or moderately agree that deer populations should be managed for healthy and sustainable forest habitat (p < 0.001). 4. Does not strongly or moderately support lethal methods to manage deer populations in PA (p < 0.001). 4. Does not strongly or moderately support fertility or birth control as a method of controlling deer populations in PA (p < 0.001). 4. Does not strongly or moderately support trapping and killing as a method of controlling deer populations in PA (p < 0.001). 4. Does not strongly or moderately agree that deer populations should be managed for safe and acceptable levels of deer-human conflicts (p < 0.01). 5. Does not indicate that he/she or another person living in the immediate household has been in a vehicle collision with or an accident involving a deer on PA's roads or highways in the past 12 months (p < 0.001). 5. Rates concern about deer damage to plants and landscaping in their yard as a 9 or 10 (p < 0.001). 5. Does not strongly or moderately agree that it is OK for private citizens to feed or attract deer in PA (p < 0.01). 5. Does not rate concern about deer-vehicle accidents in PA as a 9 or 10 (p < 0.05). 5. Rates concern about tick-borne diseases in PA as a 9 or a 10 (p < 0.05). 5. Does not indicate that he/she or another person living in the immediate household has been diagnosed by a physician with a tick-borne disease in the past 12 months (p < 0.05). 6. Rates concern about deer impacts on the habitat and other wildlife in PA as a 9 or 10 (p < 0.001). 6. Rates concern about the quality of deer habitat in PA as a 9 or 10 (p < 0.01). 6. Rates concern about the health of the deer population in PA as a 9 or 10 (p < 0.05). 7. Does not indicate using Facebook (including not using any social media) (p < 0.001). 8. Is more than median age (p < 0.001). 8. Has lived at his/her primary place of residence for more than the median number of years (p < 0.001). 8. Has the median number or fewer people living in his/her household (p < 0.001). 8. Is male (p < 0.001). 8. Does not consider place of residence to be an urban or suburban area (p < 0.001). 8. Primary place of residence is not a single-family home (p < 0.001). 8. Lives in WMU 3A (p < 0.001). 8. Lives in WMU 4A (p < 0.05). 8. Lives in WMU 1A (p < 0.05). 8. Lives in WMU 2C (p < 0.05). 8. Lives in WMU 4C (p < 0.05). See page 9 through 11 for explanation of how to interpret z-score tables.
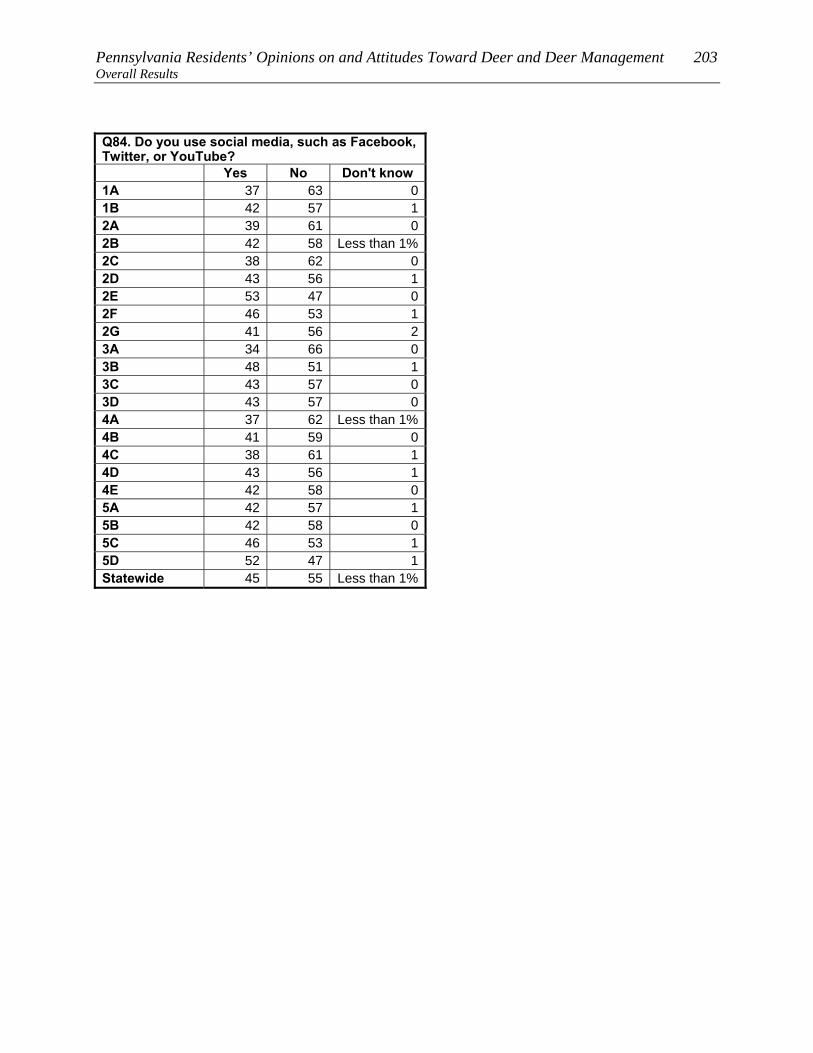
Pennsylvania Residents’ Opinions on and Attitudes Toward Deer and Deer Management 203 Overall Results
Q84. Do you use social media, such as Facebook, Twitter, or YouTube? Yes No Don't know 1A 37 63 01B 42 57 12A 39 61 02B 42 58 Less than 1%2C 38 62 02D 43 56 12E 53 47 02F 46 53 12G 41 56 23A 34 66 03B 48 51 13C 43 57 03D 43 57 04A 37 62 Less than 1%4B 41 59 04C 38 61 14D 43 56 14E 42 58 05A 42 57 15B 42 58 05C 46 53 15D 52 47 1Statewide 45 55 Less than 1%

204 Responsive Management Overall Results
Q85. Which social media site do you use most often? (Asked of those who use social media.)
86
7
5
1
1
0 20 40 60 80 100
YouTube
Other
Don't know
Percent (n=3962)
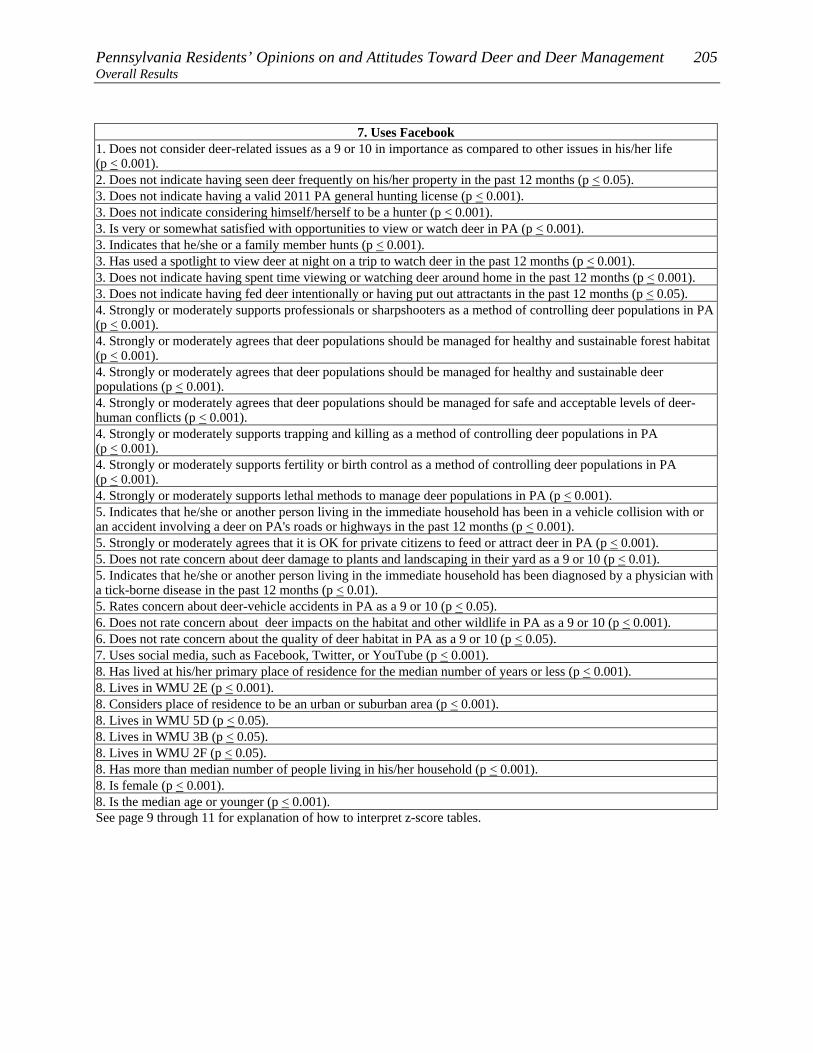
Pennsylvania Residents’ Opinions on and Attitudes Toward Deer and Deer Management 205 Overall Results
7. Uses Facebook 1. Does not consider deer-related issues as a 9 or 10 in importance as compared to other issues in his/her life (p < 0.001). 2. Does not indicate having seen deer frequently on his/her property in the past 12 months (p < 0.05). 3. Does not indicate having a valid 2011 PA general hunting license (p < 0.001). 3. Does not indicate considering himself/herself to be a hunter (p < 0.001). 3. Is very or somewhat satisfied with opportunities to view or watch deer in PA (p < 0.001). 3. Indicates that he/she or a family member hunts (p < 0.001). 3. Has used a spotlight to view deer at night on a trip to watch deer in the past 12 months (p < 0.001). 3. Does not indicate having spent time viewing or watching deer around home in the past 12 months (p < 0.001). 3. Does not indicate having fed deer intentionally or having put out attractants in the past 12 months (p < 0.05). 4. Strongly or moderately supports professionals or sharpshooters as a method of controlling deer populations in PA(p < 0.001). 4. Strongly or moderately agrees that deer populations should be managed for healthy and sustainable forest habitat (p < 0.001). 4. Strongly or moderately agrees that deer populations should be managed for healthy and sustainable deer populations (p < 0.001). 4. Strongly or moderately agrees that deer populations should be managed for safe and acceptable levels of deer-human conflicts (p < 0.001). 4. Strongly or moderately supports trapping and killing as a method of controlling deer populations in PA (p < 0.001). 4. Strongly or moderately supports fertility or birth control as a method of controlling deer populations in PA (p < 0.001). 4. Strongly or moderately supports lethal methods to manage deer populations in PA (p < 0.001). 5. Indicates that he/she or another person living in the immediate household has been in a vehicle collision with or an accident involving a deer on PA's roads or highways in the past 12 months (p < 0.001). 5. Strongly or moderately agrees that it is OK for private citizens to feed or attract deer in PA (p < 0.001). 5. Does not rate concern about deer damage to plants and landscaping in their yard as a 9 or 10 (p < 0.01). 5. Indicates that he/she or another person living in the immediate household has been diagnosed by a physician with a tick-borne disease in the past 12 months (p < 0.01). 5. Rates concern about deer-vehicle accidents in PA as a 9 or 10 (p < 0.05). 6. Does not rate concern about deer impacts on the habitat and other wildlife in PA as a 9 or 10 (p < 0.001). 6. Does not rate concern about the quality of deer habitat in PA as a 9 or 10 (p < 0.05). 7. Uses social media, such as Facebook, Twitter, or YouTube (p < 0.001). 8. Has lived at his/her primary place of residence for the median number of years or less (p < 0.001). 8. Lives in WMU 2E (p < 0.001). 8. Considers place of residence to be an urban or suburban area (p < 0.001). 8. Lives in WMU 5D (p < 0.05). 8. Lives in WMU 3B (p < 0.05). 8. Lives in WMU 2F (p < 0.05). 8. Has more than median number of people living in his/her household (p < 0.001). 8. Is female (p < 0.001). 8. Is the median age or younger (p < 0.001). See page 9 through 11 for explanation of how to interpret z-score tables.
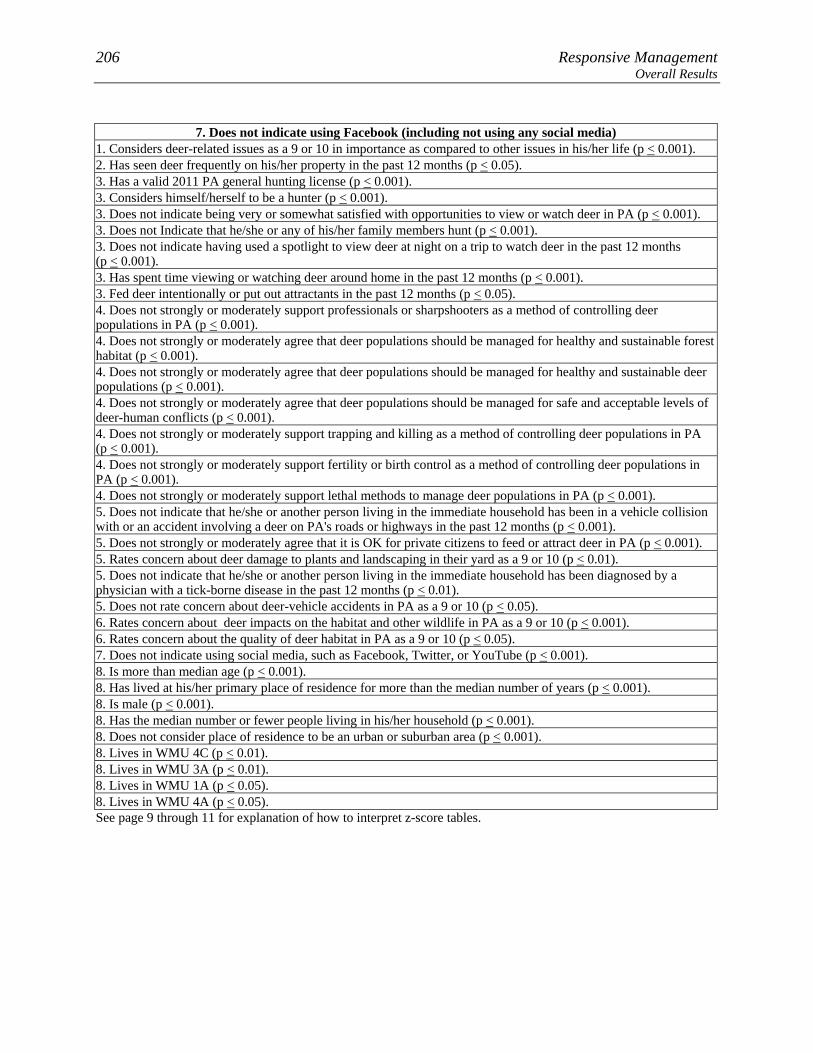
206 Responsive Management Overall Results
7. Does not indicate using Facebook (including not using any social media)
1. Considers deer-related issues as a 9 or 10 in importance as compared to other issues in his/her life (p < 0.001). 2. Has seen deer frequently on his/her property in the past 12 months (p < 0.05). 3. Has a valid 2011 PA general hunting license (p < 0.001). 3. Considers himself/herself to be a hunter (p < 0.001). 3. Does not indicate being very or somewhat satisfied with opportunities to view or watch deer in PA (p < 0.001). 3. Does not Indicate that he/she or any of his/her family members hunt (p < 0.001). 3. Does not indicate having used a spotlight to view deer at night on a trip to watch deer in the past 12 months (p < 0.001). 3. Has spent time viewing or watching deer around home in the past 12 months (p < 0.001). 3. Fed deer intentionally or put out attractants in the past 12 months (p < 0.05). 4. Does not strongly or moderately support professionals or sharpshooters as a method of controlling deer populations in PA (p < 0.001). 4. Does not strongly or moderately agree that deer populations should be managed for healthy and sustainable forest habitat (p < 0.001). 4. Does not strongly or moderately agree that deer populations should be managed for healthy and sustainable deer populations (p < 0.001). 4. Does not strongly or moderately agree that deer populations should be managed for safe and acceptable levels of deer-human conflicts (p < 0.001). 4. Does not strongly or moderately support trapping and killing as a method of controlling deer populations in PA (p < 0.001). 4. Does not strongly or moderately support fertility or birth control as a method of controlling deer populations in PA (p < 0.001). 4. Does not strongly or moderately support lethal methods to manage deer populations in PA (p < 0.001). 5. Does not indicate that he/she or another person living in the immediate household has been in a vehicle collision with or an accident involving a deer on PA's roads or highways in the past 12 months (p < 0.001). 5. Does not strongly or moderately agree that it is OK for private citizens to feed or attract deer in PA (p < 0.001). 5. Rates concern about deer damage to plants and landscaping in their yard as a 9 or 10 (p < 0.01). 5. Does not indicate that he/she or another person living in the immediate household has been diagnosed by a physician with a tick-borne disease in the past 12 months (p < 0.01). 5. Does not rate concern about deer-vehicle accidents in PA as a 9 or 10 (p < 0.05). 6. Rates concern about deer impacts on the habitat and other wildlife in PA as a 9 or 10 (p < 0.001). 6. Rates concern about the quality of deer habitat in PA as a 9 or 10 (p < 0.05). 7. Does not indicate using social media, such as Facebook, Twitter, or YouTube (p < 0.001). 8. Is more than median age (p < 0.001). 8. Has lived at his/her primary place of residence for more than the median number of years (p < 0.001). 8. Is male (p < 0.001). 8. Has the median number or fewer people living in his/her household (p < 0.001). 8. Does not consider place of residence to be an urban or suburban area (p < 0.001). 8. Lives in WMU 4C (p < 0.01). 8. Lives in WMU 3A (p < 0.01). 8. Lives in WMU 1A (p < 0.05). 8. Lives in WMU 4A (p < 0.05). See page 9 through 11 for explanation of how to interpret z-score tables.
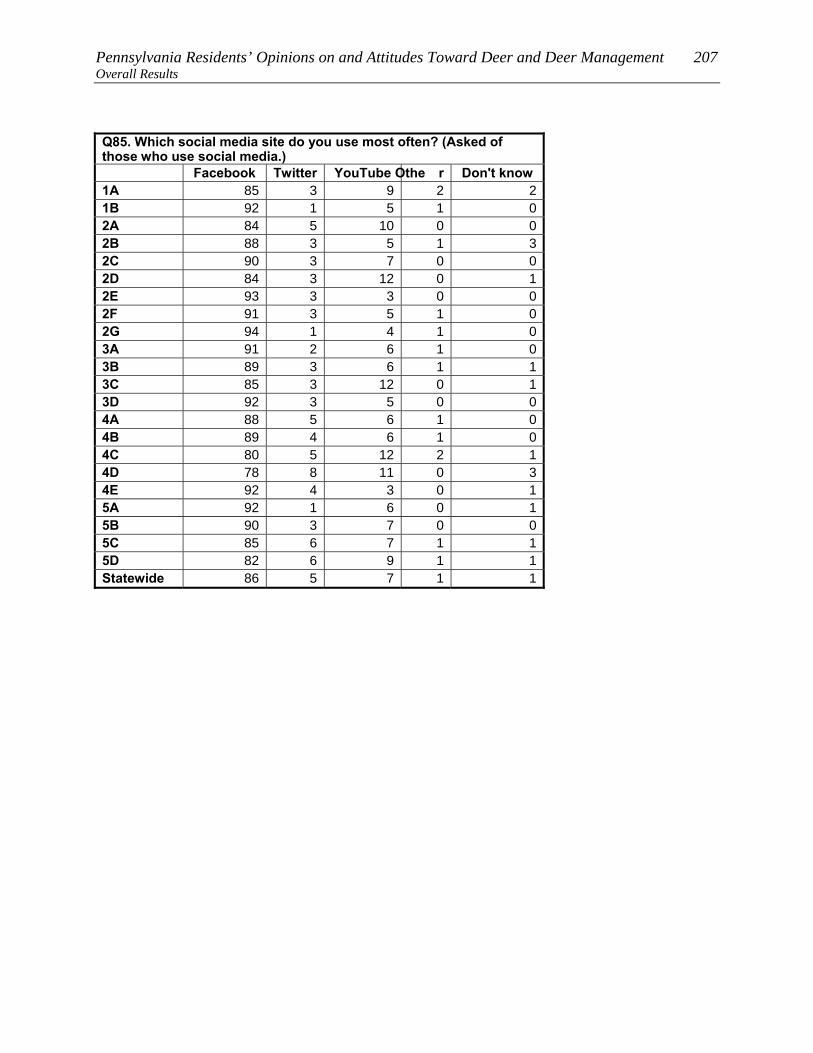
Pennsylvania Residents’ Opinions on and Attitudes Toward Deer and Deer Management 207 Overall Results
Q85. Which social media site do you use most often? (Asked of those who use social media.) Facebook Twitter YouTube Othe r Don't know 1A 85 3 9 2 21B 92 1 5 1 02A 84 5 10 0 02B 88 3 5 1 32C 90 3 7 0 02D 84 3 12 0 12E 93 3 3 0 02F 91 3 5 1 02G 94 1 4 1 03A 91 2 6 1 03B 89 3 6 1 13C 85 3 12 0 13D 92 3 5 0 04A 88 5 6 1 04B 89 4 6 1 04C 80 5 12 2 14D 78 8 11 0 34E 92 4 3 0 15A 92 1 6 0 15B 90 3 7 0 05C 85 6 7 1 15D 82 6 9 1 1Statewide 86 5 7 1 1
208 Responsive Management Overall Results
DEMOGRAPHIC DATA The demographic data from the survey are shown below; note that the primary reason for
asking these questions was for crosstabulations and the z-score analysis. The survey asked
about the following:
• Gender
• Age
• Years lived at primary residency
• Number of people in household
• Type of residential area (i.e., urban, suburban, or rural)
• Type of housing
• Acres of land (among those living in a single-family home)
• Owning versus renting primary residence
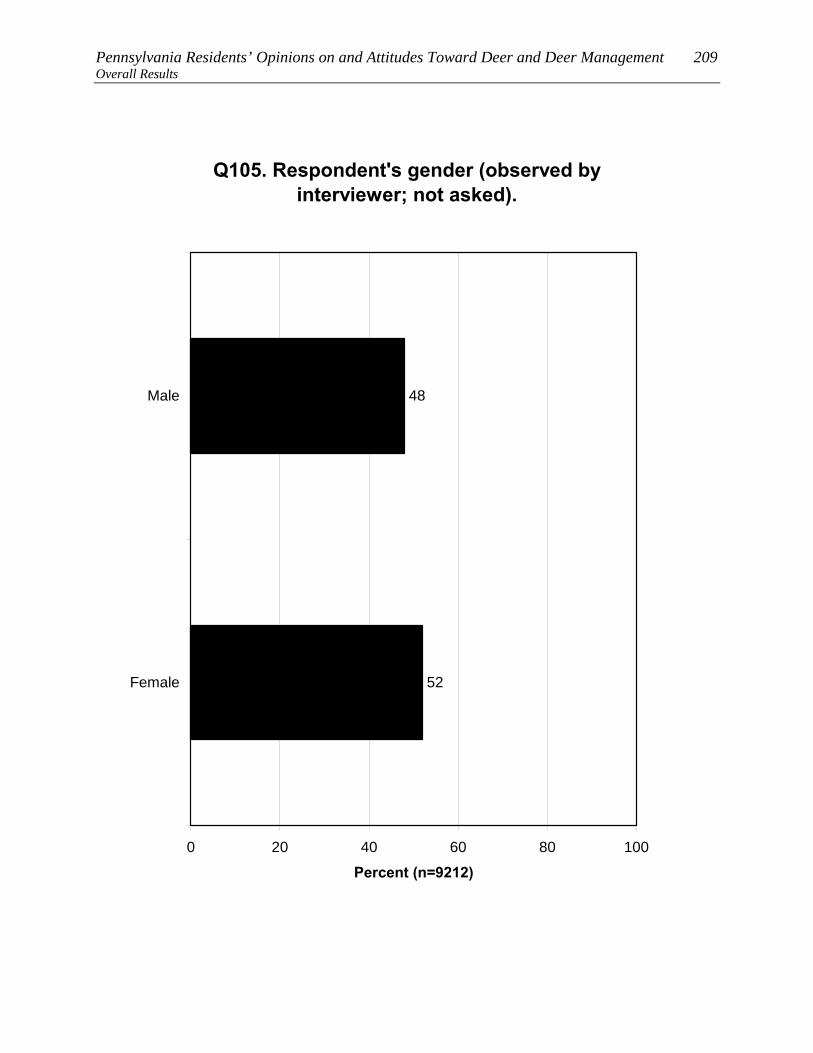
Pennsylvania Residents’ Opinions on and Attitudes Toward Deer and Deer Management 209 Overall Results
Q105. Respondent's gender (observed by interviewer; not asked).
48
52
0 20 40 60 80 100
Male
Female
Percent (n=9212)

210 Responsive Management Overall Results
8. Is male
1. Considers deer-related issues as a 9 or 10 in importance as compared to other issues in his/her life (p < 0.001). 3. Considers himself/herself to be a hunter (p < 0.001). 3. Has a valid 2011 PA general hunting license (p < 0.001). 3. Has taken a trip more than a mile from home for the primary purpose of viewing or watching deer in the past 12 months (p < 0.001). 3. Indicates that he/she or a family member hunts (p < 0.001). 3. Fed deer intentionally or put out attractants in the past 12 months (p < 0.001). 3. Has spent time viewing or watching deer around home in the past 12 months (p < 0.001). 3. Does not indicate being very or somewhat satisfied with opportunities to view or watch deer in PA (p < 0.001). 4. Strongly or moderately supports lethal methods to manage deer populations in PA (p < 0.001). 4. Does not strongly or moderately support fertility or birth control as a method of controlling deer populations in PA (p < 0.001). 4. Strongly or moderately supports legal, regulated hunting as a method of controlling deer populations in PA (p < 0.001). 4. Does not consider the deer population in his/her area to be too high (p < 0.001). 4. Strongly or moderately supports professionals or sharpshooters as a method of controlling deer populations in PA(p < 0.001). 4. Strongly or moderately supports trapping and killing as a method of controlling deer populations in PA (p < 0.001). 4. Strongly or moderately agrees that deer populations should be managed for healthy and sustainable deer populations (p < 0.001). 5. Does not rate concern about deer-vehicle accidents in PA as a 9 or 10 (p < 0.001). 5. Does not rate concern about deer damage to plants and landscaping in their yard as a 9 or 10 (p < 0.001). 5. Does not rate concern about deer droppings in their yard as a 9 or a 10 (p < 0.001). 5. Strongly or moderately agrees that it is OK for private citizens to feed or attract deer in PA (p < 0.001). 5. Does not rate concern about tick-borne diseases in PA as a 9 or a 10 (p < 0.001). 5. Does not indicate having experienced any problems with deer at his/her primary place of residence in the past 12 months (p < 0.001). 5. Does not indicate that he/she or another person living in the immediate household has been diagnosed by a physician with a tick-borne disease in the past 12 months (p < 0.05). 5. Indicates that he/she or another person living in the immediate household has been in a vehicle collision with or an accident involving a deer on PA's roads or highways in the past 12 months (p < 0.05). 6. Rates concern about the quality of deer habitat in PA as a 9 or 10 (p < 0.001). 6. Rates concern about the health of the deer population in PA as a 9 or 10 (p < 0.001). 6. Does not rate concern about deer impacts on the habitat and other wildlife in PA as a 9 or 10 (p < 0.05). 7. Does not indicate using Facebook (including not using any social media) (p < 0.001). 7. Does not indicate using social media, such as Facebook, Twitter, or YouTube (p < 0.001). 8. Has lived at his/her primary place of residence for the median number of years or less (p < 0.05). See page 9 through 11 for explanation of how to interpret z-score tables.
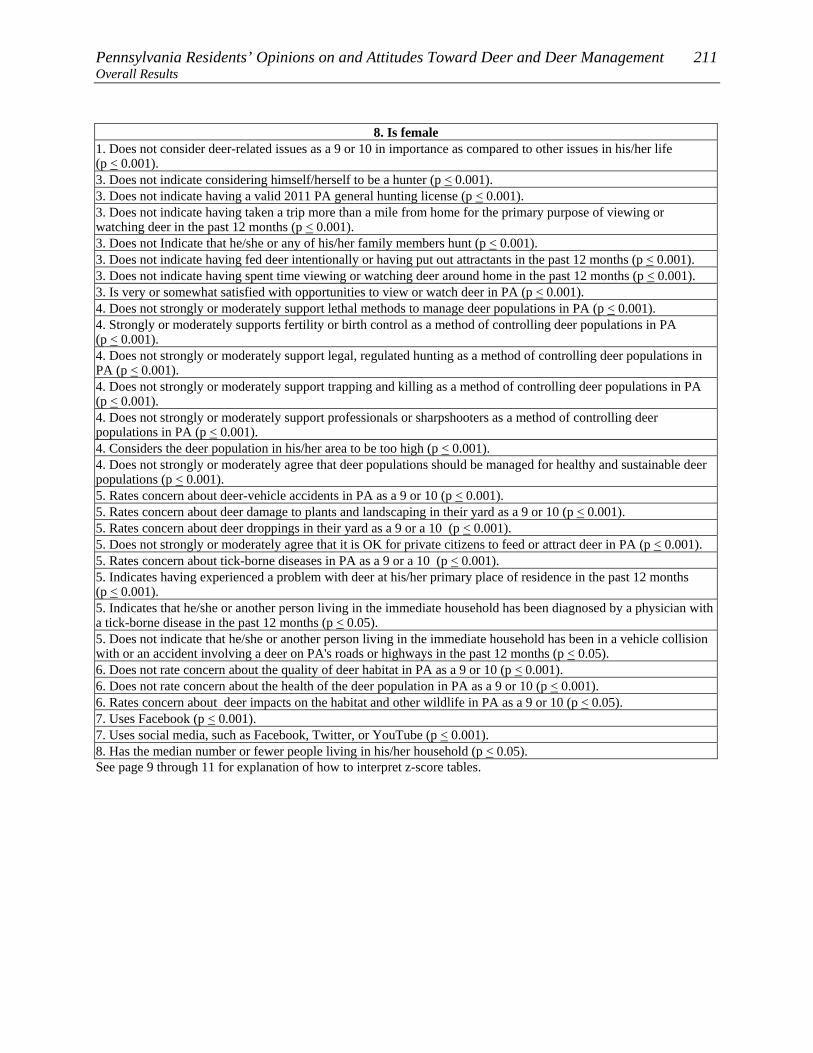
Pennsylvania Residents’ Opinions on and Attitudes Toward Deer and Deer Management 211 Overall Results
8. Is female 1. Does not consider deer-related issues as a 9 or 10 in importance as compared to other issues in his/her life (p < 0.001). 3. Does not indicate considering himself/herself to be a hunter (p < 0.001). 3. Does not indicate having a valid 2011 PA general hunting license (p < 0.001). 3. Does not indicate having taken a trip more than a mile from home for the primary purpose of viewing or watching deer in the past 12 months (p < 0.001). 3. Does not Indicate that he/she or any of his/her family members hunt (p < 0.001). 3. Does not indicate having fed deer intentionally or having put out attractants in the past 12 months (p < 0.001). 3. Does not indicate having spent time viewing or watching deer around home in the past 12 months (p < 0.001). 3. Is very or somewhat satisfied with opportunities to view or watch deer in PA (p < 0.001). 4. Does not strongly or moderately support lethal methods to manage deer populations in PA (p < 0.001). 4. Strongly or moderately supports fertility or birth control as a method of controlling deer populations in PA (p < 0.001). 4. Does not strongly or moderately support legal, regulated hunting as a method of controlling deer populations in PA (p < 0.001). 4. Does not strongly or moderately support trapping and killing as a method of controlling deer populations in PA (p < 0.001). 4. Does not strongly or moderately support professionals or sharpshooters as a method of controlling deer populations in PA (p < 0.001). 4. Considers the deer population in his/her area to be too high (p < 0.001). 4. Does not strongly or moderately agree that deer populations should be managed for healthy and sustainable deer populations (p < 0.001). 5. Rates concern about deer-vehicle accidents in PA as a 9 or 10 (p < 0.001). 5. Rates concern about deer damage to plants and landscaping in their yard as a 9 or 10 (p < 0.001). 5. Rates concern about deer droppings in their yard as a 9 or a 10 (p < 0.001). 5. Does not strongly or moderately agree that it is OK for private citizens to feed or attract deer in PA (p < 0.001). 5. Rates concern about tick-borne diseases in PA as a 9 or a 10 (p < 0.001). 5. Indicates having experienced a problem with deer at his/her primary place of residence in the past 12 months (p < 0.001). 5. Indicates that he/she or another person living in the immediate household has been diagnosed by a physician with a tick-borne disease in the past 12 months (p < 0.05). 5. Does not indicate that he/she or another person living in the immediate household has been in a vehicle collision with or an accident involving a deer on PA's roads or highways in the past 12 months (p < 0.05). 6. Does not rate concern about the quality of deer habitat in PA as a 9 or 10 (p < 0.001). 6. Does not rate concern about the health of the deer population in PA as a 9 or 10 (p < 0.001). 6. Rates concern about deer impacts on the habitat and other wildlife in PA as a 9 or 10 (p < 0.05). 7. Uses Facebook (p < 0.001). 7. Uses social media, such as Facebook, Twitter, or YouTube (p < 0.001). 8. Has the median number or fewer people living in his/her household (p < 0.05). See page 9 through 11 for explanation of how to interpret z-score tables.
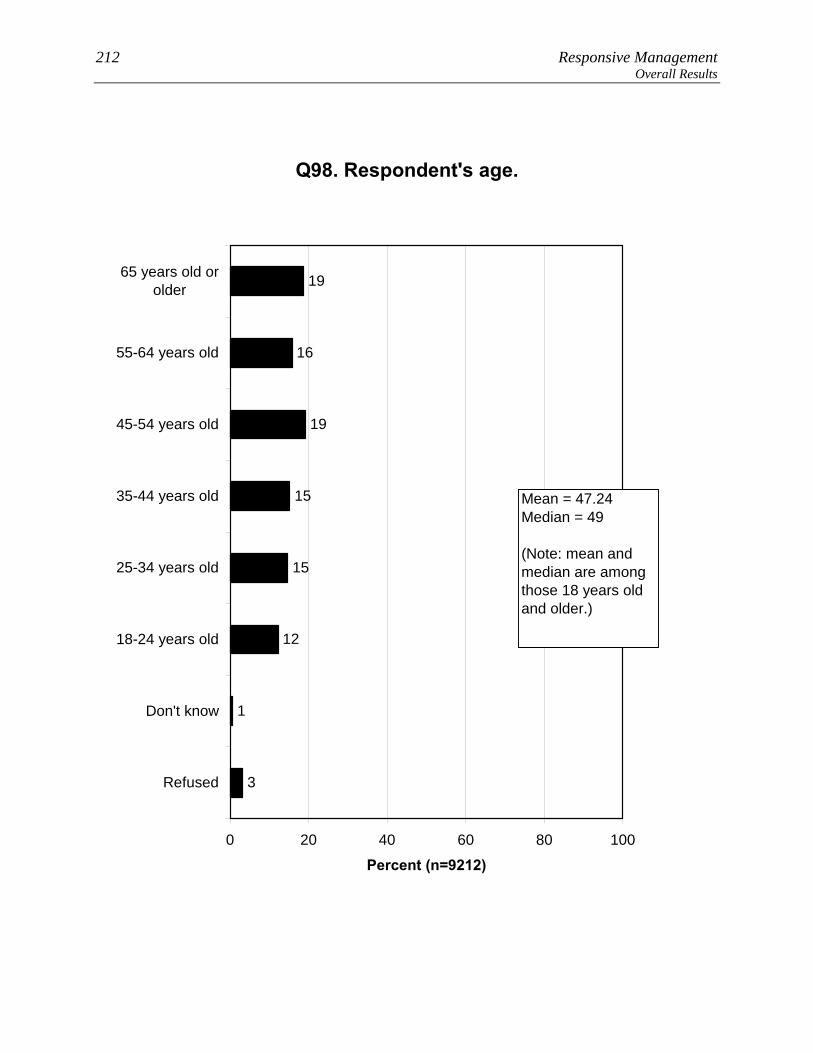
212 Responsive Management Overall Results
Q98. Respondent's age.
3
1
19
16
19
15
15
12
0 20 40 60 80 100
65 years old orolder
55-64 years old
45-54 years old
35-44 years old
25-34 years old
18-24 years old
Don't know
Refused
Percent (n=9212)
Mean = 47.24Median = 49
(Note: mean and median are among those 18 years old and older.)
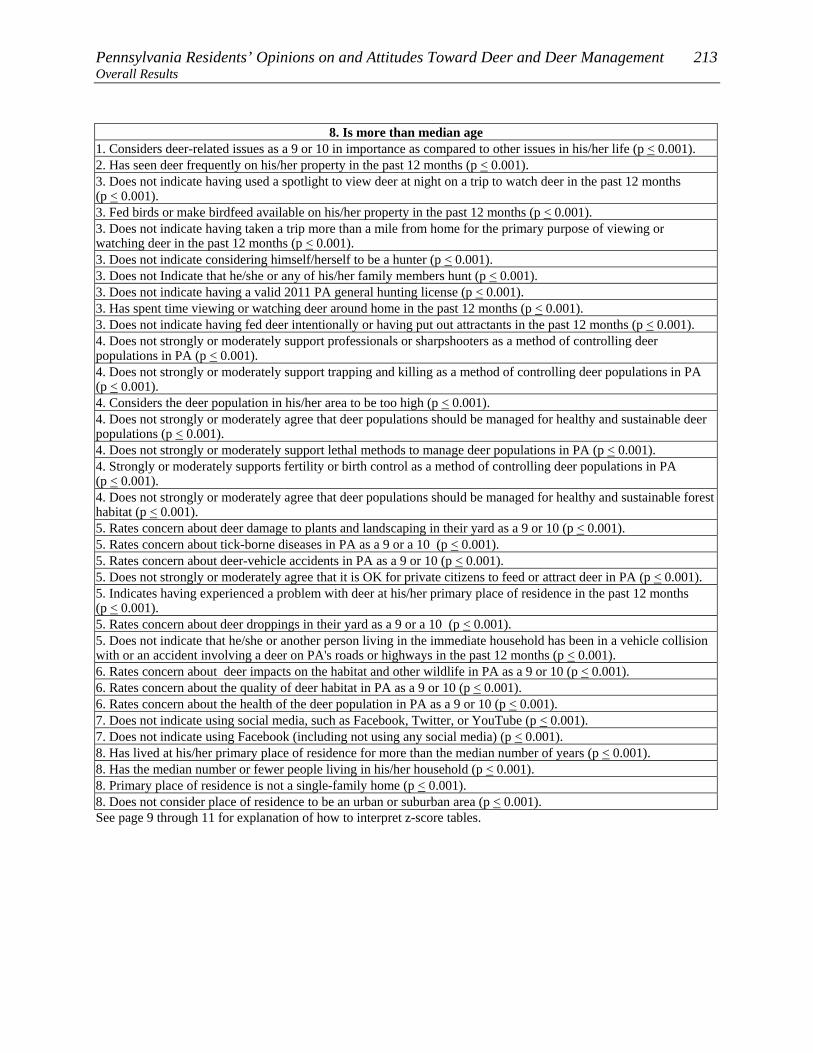
Pennsylvania Residents’ Opinions on and Attitudes Toward Deer and Deer Management 213 Overall Results
8. Is more than median age 1. Considers deer-related issues as a 9 or 10 in importance as compared to other issues in his/her life (p < 0.001). 2. Has seen deer frequently on his/her property in the past 12 months (p < 0.001). 3. Does not indicate having used a spotlight to view deer at night on a trip to watch deer in the past 12 months (p < 0.001). 3. Fed birds or make birdfeed available on his/her property in the past 12 months (p < 0.001). 3. Does not indicate having taken a trip more than a mile from home for the primary purpose of viewing or watching deer in the past 12 months (p < 0.001). 3. Does not indicate considering himself/herself to be a hunter (p < 0.001). 3. Does not Indicate that he/she or any of his/her family members hunt (p < 0.001). 3. Does not indicate having a valid 2011 PA general hunting license (p < 0.001). 3. Has spent time viewing or watching deer around home in the past 12 months (p < 0.001). 3. Does not indicate having fed deer intentionally or having put out attractants in the past 12 months (p < 0.001). 4. Does not strongly or moderately support professionals or sharpshooters as a method of controlling deer populations in PA (p < 0.001). 4. Does not strongly or moderately support trapping and killing as a method of controlling deer populations in PA (p < 0.001). 4. Considers the deer population in his/her area to be too high (p < 0.001). 4. Does not strongly or moderately agree that deer populations should be managed for healthy and sustainable deer populations (p < 0.001). 4. Does not strongly or moderately support lethal methods to manage deer populations in PA (p < 0.001). 4. Strongly or moderately supports fertility or birth control as a method of controlling deer populations in PA (p < 0.001). 4. Does not strongly or moderately agree that deer populations should be managed for healthy and sustainable forest habitat (p < 0.001). 5. Rates concern about deer damage to plants and landscaping in their yard as a 9 or 10 (p < 0.001). 5. Rates concern about tick-borne diseases in PA as a 9 or a 10 (p < 0.001). 5. Rates concern about deer-vehicle accidents in PA as a 9 or 10 (p < 0.001). 5. Does not strongly or moderately agree that it is OK for private citizens to feed or attract deer in PA (p < 0.001). 5. Indicates having experienced a problem with deer at his/her primary place of residence in the past 12 months (p < 0.001). 5. Rates concern about deer droppings in their yard as a 9 or a 10 (p < 0.001). 5. Does not indicate that he/she or another person living in the immediate household has been in a vehicle collision with or an accident involving a deer on PA's roads or highways in the past 12 months (p < 0.001). 6. Rates concern about deer impacts on the habitat and other wildlife in PA as a 9 or 10 (p < 0.001). 6. Rates concern about the quality of deer habitat in PA as a 9 or 10 (p < 0.001). 6. Rates concern about the health of the deer population in PA as a 9 or 10 (p < 0.001). 7. Does not indicate using social media, such as Facebook, Twitter, or YouTube (p < 0.001). 7. Does not indicate using Facebook (including not using any social media) (p < 0.001). 8. Has lived at his/her primary place of residence for more than the median number of years (p < 0.001). 8. Has the median number or fewer people living in his/her household (p < 0.001). 8. Primary place of residence is not a single-family home (p < 0.001). 8. Does not consider place of residence to be an urban or suburban area (p < 0.001). See page 9 through 11 for explanation of how to interpret z-score tables.
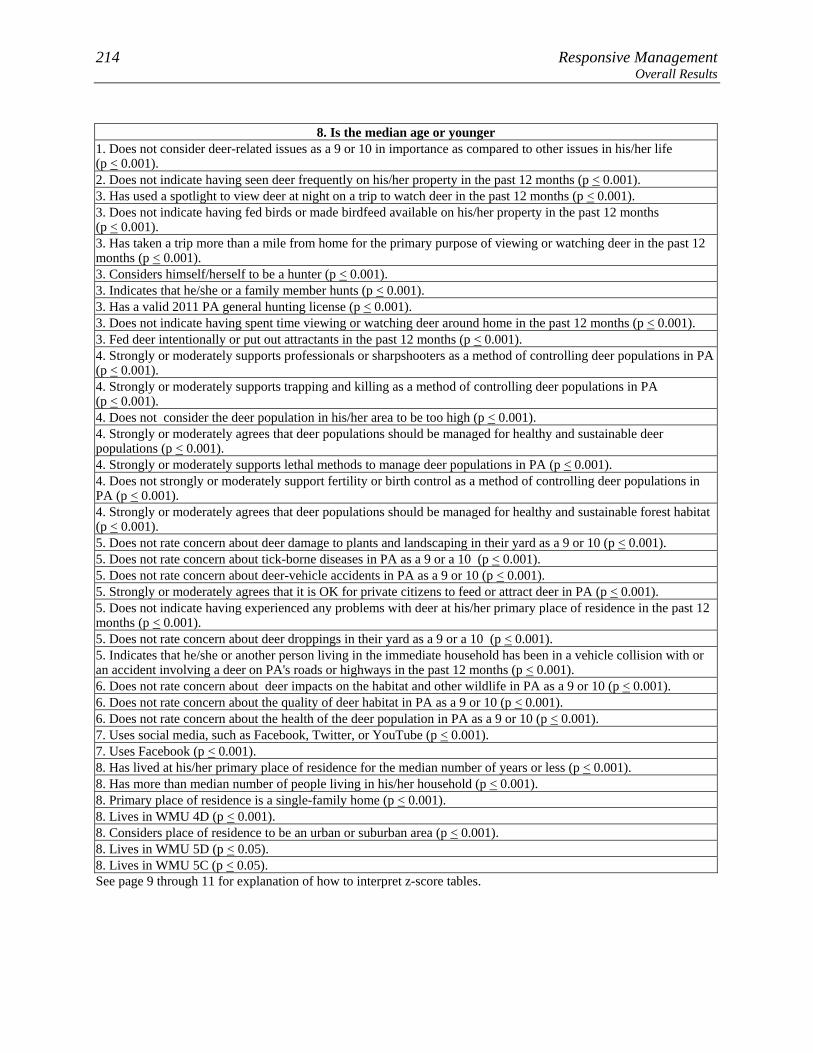
214 Responsive Management Overall Results
8. Is the median age or younger
1. Does not consider deer-related issues as a 9 or 10 in importance as compared to other issues in his/her life (p < 0.001). 2. Does not indicate having seen deer frequently on his/her property in the past 12 months (p < 0.001). 3. Has used a spotlight to view deer at night on a trip to watch deer in the past 12 months (p < 0.001). 3. Does not indicate having fed birds or made birdfeed available on his/her property in the past 12 months (p < 0.001). 3. Has taken a trip more than a mile from home for the primary purpose of viewing or watching deer in the past 12 months (p < 0.001). 3. Considers himself/herself to be a hunter (p < 0.001). 3. Indicates that he/she or a family member hunts (p < 0.001). 3. Has a valid 2011 PA general hunting license (p < 0.001). 3. Does not indicate having spent time viewing or watching deer around home in the past 12 months (p < 0.001). 3. Fed deer intentionally or put out attractants in the past 12 months (p < 0.001). 4. Strongly or moderately supports professionals or sharpshooters as a method of controlling deer populations in PA(p < 0.001). 4. Strongly or moderately supports trapping and killing as a method of controlling deer populations in PA (p < 0.001). 4. Does not consider the deer population in his/her area to be too high (p < 0.001). 4. Strongly or moderately agrees that deer populations should be managed for healthy and sustainable deer populations (p < 0.001). 4. Strongly or moderately supports lethal methods to manage deer populations in PA (p < 0.001). 4. Does not strongly or moderately support fertility or birth control as a method of controlling deer populations in PA (p < 0.001). 4. Strongly or moderately agrees that deer populations should be managed for healthy and sustainable forest habitat (p < 0.001). 5. Does not rate concern about deer damage to plants and landscaping in their yard as a 9 or 10 (p < 0.001). 5. Does not rate concern about tick-borne diseases in PA as a 9 or a 10 (p < 0.001). 5. Does not rate concern about deer-vehicle accidents in PA as a 9 or 10 (p < 0.001). 5. Strongly or moderately agrees that it is OK for private citizens to feed or attract deer in PA (p < 0.001). 5. Does not indicate having experienced any problems with deer at his/her primary place of residence in the past 12 months (p < 0.001). 5. Does not rate concern about deer droppings in their yard as a 9 or a 10 (p < 0.001). 5. Indicates that he/she or another person living in the immediate household has been in a vehicle collision with or an accident involving a deer on PA's roads or highways in the past 12 months (p < 0.001). 6. Does not rate concern about deer impacts on the habitat and other wildlife in PA as a 9 or 10 (p < 0.001). 6. Does not rate concern about the quality of deer habitat in PA as a 9 or 10 (p < 0.001). 6. Does not rate concern about the health of the deer population in PA as a 9 or 10 (p < 0.001). 7. Uses social media, such as Facebook, Twitter, or YouTube (p < 0.001). 7. Uses Facebook (p < 0.001). 8. Has lived at his/her primary place of residence for the median number of years or less (p < 0.001). 8. Has more than median number of people living in his/her household (p < 0.001). 8. Primary place of residence is a single-family home (p < 0.001). 8. Lives in WMU 4D (p < 0.001). 8. Considers place of residence to be an urban or suburban area (p < 0.001). 8. Lives in WMU 5D (p < 0.05). 8. Lives in WMU 5C (p < 0.05). See page 9 through 11 for explanation of how to interpret z-score tables.
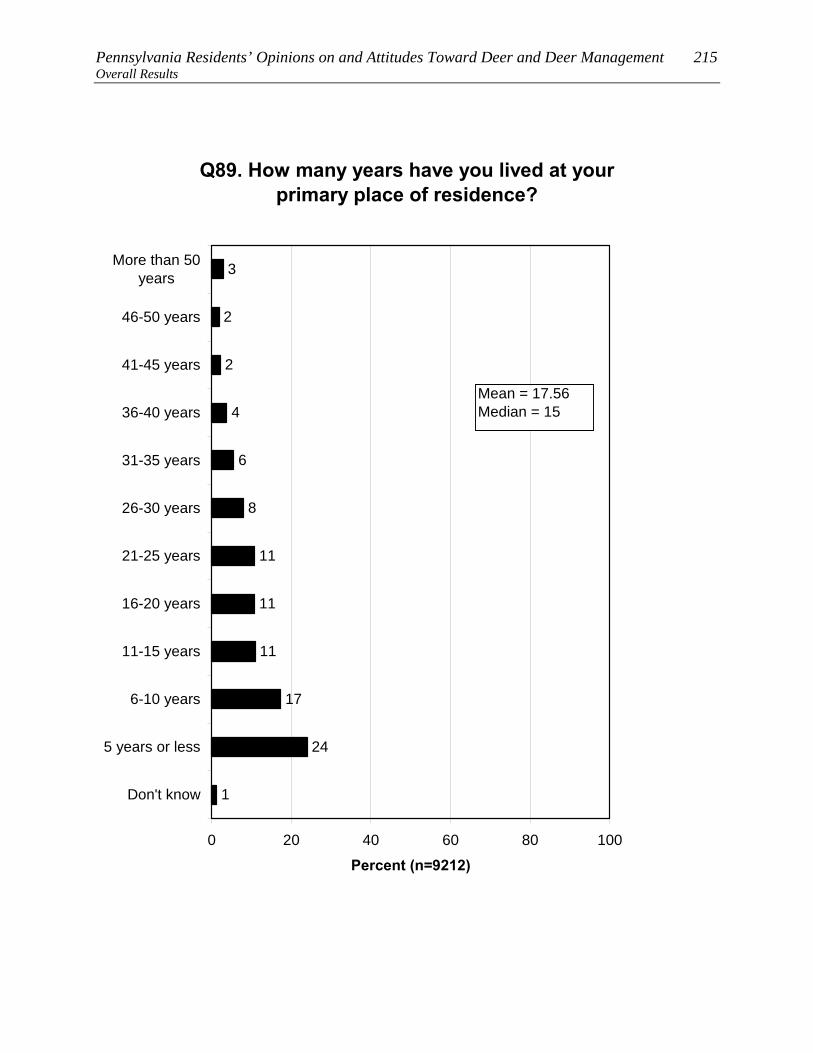
Pennsylvania Residents’ Opinions on and Attitudes Toward Deer and Deer Management 215 Overall Results
Q89. How many years have you lived at your primary place of residence?
11
11
11
3
2
2
4
6
8
17
24
1
0 20 40 60 80 100
More than 50years
46-50 years
41-45 years
36-40 years
31-35 years
26-30 years
21-25 years
16-20 years
11-15 years
6-10 years
5 years or less
Don't know
Percent (n=9212)
Mean = 17.56Median = 15
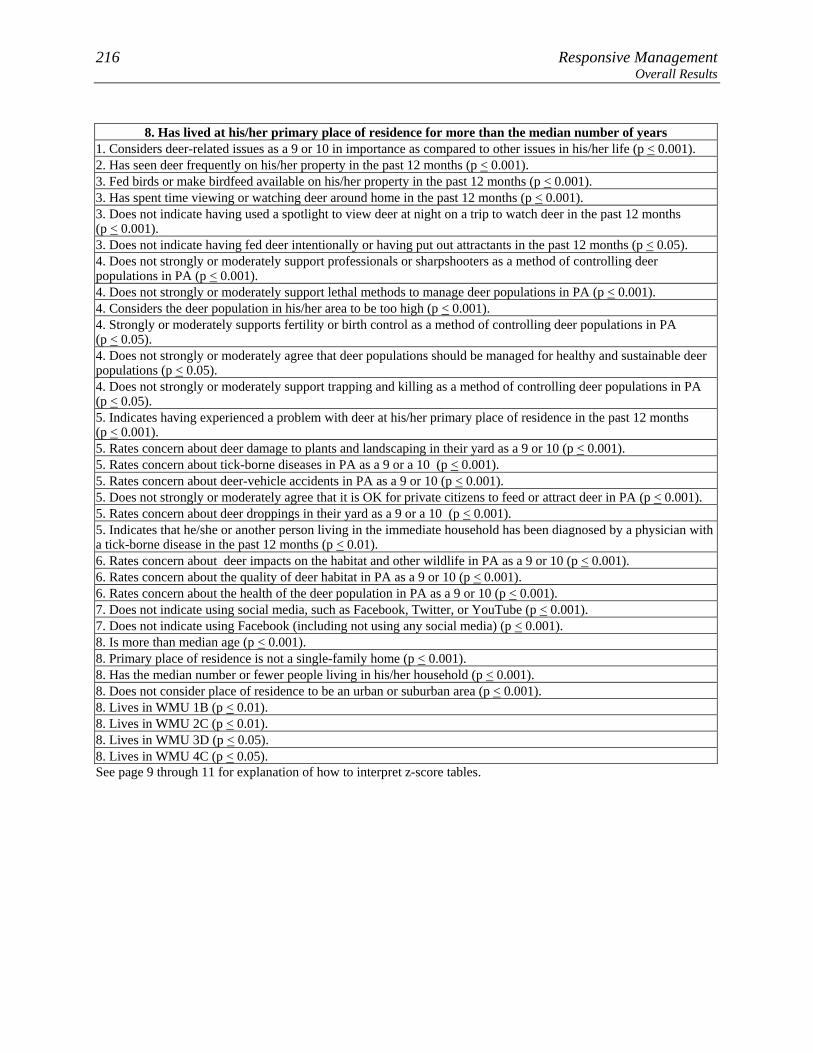
216 Responsive Management Overall Results
8. Has lived at his/her primary place of residence for more than the median number of years
1. Considers deer-related issues as a 9 or 10 in importance as compared to other issues in his/her life (p < 0.001). 2. Has seen deer frequently on his/her property in the past 12 months (p < 0.001). 3. Fed birds or make birdfeed available on his/her property in the past 12 months (p < 0.001). 3. Has spent time viewing or watching deer around home in the past 12 months (p < 0.001). 3. Does not indicate having used a spotlight to view deer at night on a trip to watch deer in the past 12 months (p < 0.001). 3. Does not indicate having fed deer intentionally or having put out attractants in the past 12 months (p < 0.05). 4. Does not strongly or moderately support professionals or sharpshooters as a method of controlling deer populations in PA (p < 0.001). 4. Does not strongly or moderately support lethal methods to manage deer populations in PA (p < 0.001). 4. Considers the deer population in his/her area to be too high (p < 0.001). 4. Strongly or moderately supports fertility or birth control as a method of controlling deer populations in PA (p < 0.05). 4. Does not strongly or moderately agree that deer populations should be managed for healthy and sustainable deer populations (p < 0.05). 4. Does not strongly or moderately support trapping and killing as a method of controlling deer populations in PA (p < 0.05). 5. Indicates having experienced a problem with deer at his/her primary place of residence in the past 12 months (p < 0.001). 5. Rates concern about deer damage to plants and landscaping in their yard as a 9 or 10 (p < 0.001). 5. Rates concern about tick-borne diseases in PA as a 9 or a 10 (p < 0.001). 5. Rates concern about deer-vehicle accidents in PA as a 9 or 10 (p < 0.001). 5. Does not strongly or moderately agree that it is OK for private citizens to feed or attract deer in PA (p < 0.001). 5. Rates concern about deer droppings in their yard as a 9 or a 10 (p < 0.001). 5. Indicates that he/she or another person living in the immediate household has been diagnosed by a physician with a tick-borne disease in the past 12 months (p < 0.01). 6. Rates concern about deer impacts on the habitat and other wildlife in PA as a 9 or 10 (p < 0.001). 6. Rates concern about the quality of deer habitat in PA as a 9 or 10 (p < 0.001). 6. Rates concern about the health of the deer population in PA as a 9 or 10 (p < 0.001). 7. Does not indicate using social media, such as Facebook, Twitter, or YouTube (p < 0.001). 7. Does not indicate using Facebook (including not using any social media) (p < 0.001). 8. Is more than median age (p < 0.001). 8. Primary place of residence is not a single-family home (p < 0.001). 8. Has the median number or fewer people living in his/her household (p < 0.001). 8. Does not consider place of residence to be an urban or suburban area (p < 0.001). 8. Lives in WMU 1B (p < 0.01). 8. Lives in WMU 2C (p < 0.01). 8. Lives in WMU 3D (p < 0.05). 8. Lives in WMU 4C (p < 0.05). See page 9 through 11 for explanation of how to interpret z-score tables.

Pennsylvania Residents’ Opinions on and Attitudes Toward Deer and Deer Management 217 Overall Results
8. Has lived at his/her primary place of residence for the median number of years or less 1. Does not consider deer-related issues as a 9 or 10 in importance as compared to other issues in his/her life (p < 0.001). 2. Does not indicate having seen deer frequently on his/her property in the past 12 months (p < 0.001). 3. Does not indicate having fed birds or made birdfeed available on his/her property in the past 12 months (p < 0.001). 3. Does not indicate having spent time viewing or watching deer around home in the past 12 months (p < 0.001). 3. Has used a spotlight to view deer at night on a trip to watch deer in the past 12 months (p < 0.001). 3. Fed deer intentionally or put out attractants in the past 12 months (p < 0.01). 4. Strongly or moderately supports professionals or sharpshooters as a method of controlling deer populations in PA(p < 0.001). 4. Strongly or moderately supports lethal methods to manage deer populations in PA (p < 0.001). 4. Does not consider the deer population in his/her area to be too high (p < 0.001). 4. Does not strongly or moderately support fertility or birth control as a method of controlling deer populations in PA (p < 0.05). 4. Strongly or moderately agrees that deer populations should be managed for healthy and sustainable deer populations (p < 0.05). 5. Does not indicate having experienced any problems with deer at his/her primary place of residence in the past 12 months (p < 0.001). 5. Does not rate concern about deer damage to plants and landscaping in their yard as a 9 or 10 (p < 0.001). 5. Does not rate concern about tick-borne diseases in PA as a 9 or a 10 (p < 0.001). 5. Does not rate concern about deer-vehicle accidents in PA as a 9 or 10 (p < 0.001). 5. Strongly or moderately agrees that it is OK for private citizens to feed or attract deer in PA (p < 0.001). 5. Does not rate concern about deer droppings in their yard as a 9 or a 10 (p < 0.001). 5. Does not indicate that he/she or another person living in the immediate household has been diagnosed by a physician with a tick-borne disease in the past 12 months (p < 0.01). 6. Does not rate concern about deer impacts on the habitat and other wildlife in PA as a 9 or 10 (p < 0.001). 6. Does not rate concern about the quality of deer habitat in PA as a 9 or 10 (p < 0.001). 6. Does not rate concern about the health of the deer population in PA as a 9 or 10 (p < 0.001). 7. Uses social media, such as Facebook, Twitter, or YouTube (p < 0.001). 7. Uses Facebook (p < 0.001). 8. Is the median age or younger (p < 0.001). 8. Primary place of residence is a single-family home (p < 0.001). 8. Has more than median number of people living in his/her household (p < 0.001). 8. Considers place of residence to be an urban or suburban area (p < 0.001). 8. Lives in WMU 5A (p < 0.001). 8. Lives in WMU 5C (p < 0.001). 8. Lives in WMU 5B (p < 0.01). 8. Lives in WMU 5D (p < 0.01). 8. Is male (p < 0.05). See page 9 through 11 for explanation of how to interpret z-score tables.
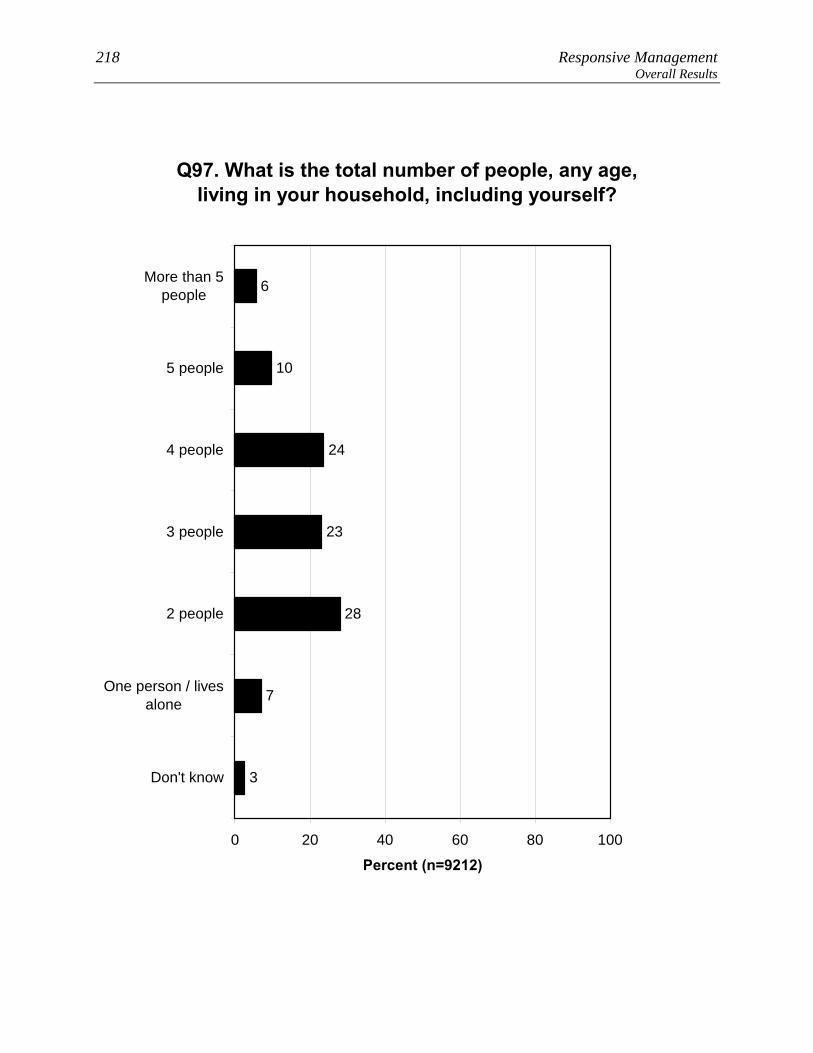
218 Responsive Management Overall Results
Q97. What is the total number of people, any age, living in your household, including yourself?
3
6
10
24
23
28
7
0 20 40 60 80 100
More than 5people
5 people
4 people
3 people
2 people
One person / livesalone
Don't know
Percent (n=9212)

Pennsylvania Residents’ Opinions on and Attitudes Toward Deer and Deer Management 219 Overall Results
8. Has more than median number of people living in his/her household 1. Does not consider deer-related issues as a 9 or 10 in importance as compared to other issues in his/her life (p < 0.01). 3. Has used a spotlight to view deer at night on a trip to watch deer in the past 12 months (p < 0.001). 3. Indicates that he/she or a family member hunts (p < 0.001). 3. Has taken a trip more than a mile from home for the primary purpose of viewing or watching deer in the past 12 months (p < 0.001). 3. Has a valid 2011 PA general hunting license (p < 0.001). 3. Considers himself/herself to be a hunter (p < 0.001). 3. Fed deer intentionally or put out attractants in the past 12 months (p < 0.001). 3. Does not indicate having fed birds or made birdfeed available on his/her property in the past 12 months (p < 0.05). 3. Has spent time viewing or watching deer around home in the past 12 months (p < 0.05). 4. Strongly or moderately supports professionals or sharpshooters as a method of controlling deer populations in PA(p < 0.001). 4. Strongly or moderately supports trapping and killing as a method of controlling deer populations in PA (p < 0.001). 4. Strongly or moderately agrees that deer populations should be managed for healthy and sustainable deer populations (p < 0.001). 4. Strongly or moderately supports lethal methods to manage deer populations in PA (p < 0.001). 4. Strongly or moderately agrees that deer populations should be managed for safe and acceptable levels of deer-human conflicts (p < 0.001). 4. Strongly or moderately agrees that deer populations should be managed for healthy and sustainable forest habitat (p < 0.001). 4. Does not strongly or moderately support fertility or birth control as a method of controlling deer populations in PA (p < 0.001). 5. Indicates that he/she or another person living in the immediate household has been in a vehicle collision with or an accident involving a deer on PA's roads or highways in the past 12 months (p < 0.001). 5. Strongly or moderately agrees that it is OK for private citizens to feed or attract deer in PA (p < 0.001). 5. Does not rate concern about deer damage to plants and landscaping in their yard as a 9 or 10 (p < 0.001). 5. Does not rate concern about deer-vehicle accidents in PA as a 9 or 10 (p < 0.001). 5. Does not rate concern about deer droppings in their yard as a 9 or a 10 (p < 0.05). 5. Indicates that he/she or another person living in the immediate household has been diagnosed by a physician with a tick-borne disease in the past 12 months (p < 0.05). 6. Does not rate concern about deer impacts on the habitat and other wildlife in PA as a 9 or 10 (p < 0.01). 6. Rates concern about the health of the deer population in PA as a 9 or 10 (p < 0.05). 7. Uses Facebook (p < 0.001). 7. Uses social media, such as Facebook, Twitter, or YouTube (p < 0.001). 8. Is the median age or younger (p < 0.001). 8. Has lived at his/her primary place of residence for the median number of years or less (p < 0.001). 8. Primary place of residence is not a single-family home (p < 0.001). 8. Lives in WMU 5C (p < 0.001). 8. Lives in WMU 5D (p < 0.001). 8. Lives in WMU 5B (p < 0.01). 8. Lives in WMU 2E (p < 0.05). See page 9 through 11 for explanation of how to interpret z-score tables.
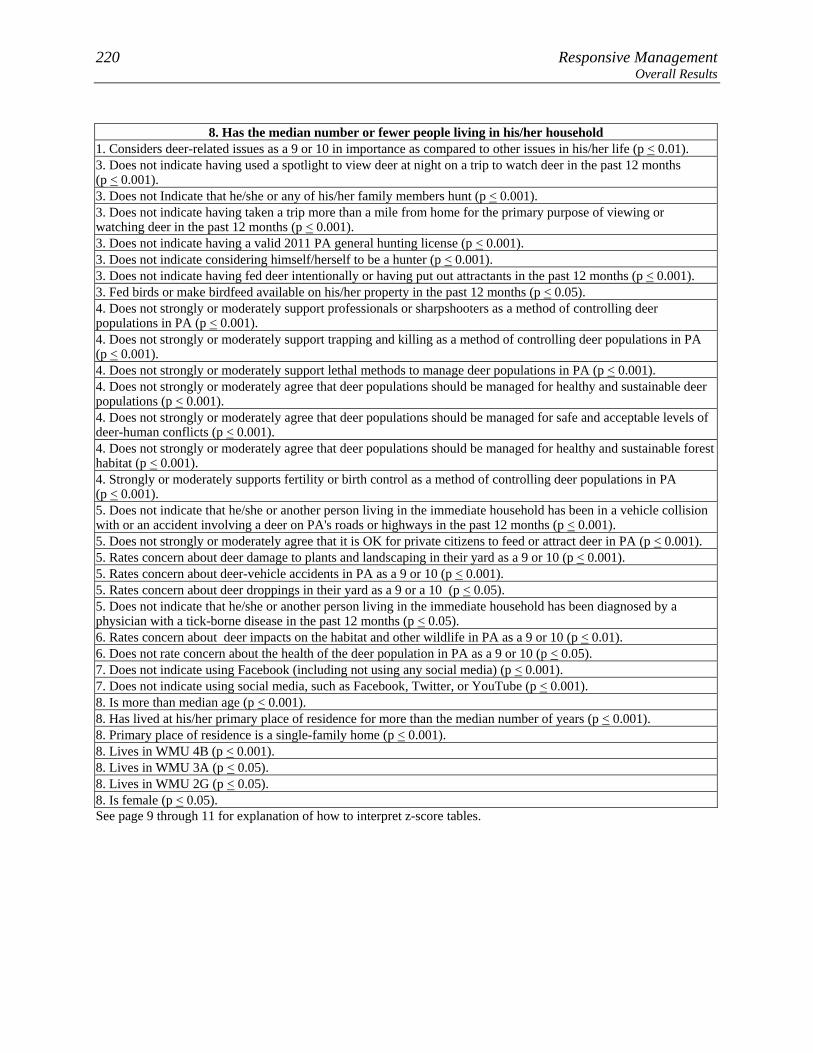
220 Responsive Management Overall Results
8. Has the median number or fewer people living in his/her household
1. Considers deer-related issues as a 9 or 10 in importance as compared to other issues in his/her life (p < 0.01). 3. Does not indicate having used a spotlight to view deer at night on a trip to watch deer in the past 12 months (p < 0.001). 3. Does not Indicate that he/she or any of his/her family members hunt (p < 0.001). 3. Does not indicate having taken a trip more than a mile from home for the primary purpose of viewing or watching deer in the past 12 months (p < 0.001). 3. Does not indicate having a valid 2011 PA general hunting license (p < 0.001). 3. Does not indicate considering himself/herself to be a hunter (p < 0.001). 3. Does not indicate having fed deer intentionally or having put out attractants in the past 12 months (p < 0.001). 3. Fed birds or make birdfeed available on his/her property in the past 12 months (p < 0.05). 4. Does not strongly or moderately support professionals or sharpshooters as a method of controlling deer populations in PA (p < 0.001). 4. Does not strongly or moderately support trapping and killing as a method of controlling deer populations in PA (p < 0.001). 4. Does not strongly or moderately support lethal methods to manage deer populations in PA (p < 0.001). 4. Does not strongly or moderately agree that deer populations should be managed for healthy and sustainable deer populations (p < 0.001). 4. Does not strongly or moderately agree that deer populations should be managed for safe and acceptable levels of deer-human conflicts (p < 0.001). 4. Does not strongly or moderately agree that deer populations should be managed for healthy and sustainable forest habitat (p < 0.001). 4. Strongly or moderately supports fertility or birth control as a method of controlling deer populations in PA (p < 0.001). 5. Does not indicate that he/she or another person living in the immediate household has been in a vehicle collision with or an accident involving a deer on PA's roads or highways in the past 12 months (p < 0.001). 5. Does not strongly or moderately agree that it is OK for private citizens to feed or attract deer in PA (p < 0.001). 5. Rates concern about deer damage to plants and landscaping in their yard as a 9 or 10 (p < 0.001). 5. Rates concern about deer-vehicle accidents in PA as a 9 or 10 (p < 0.001). 5. Rates concern about deer droppings in their yard as a 9 or a 10 (p < 0.05). 5. Does not indicate that he/she or another person living in the immediate household has been diagnosed by a physician with a tick-borne disease in the past 12 months (p < 0.05). 6. Rates concern about deer impacts on the habitat and other wildlife in PA as a 9 or 10 (p < 0.01). 6. Does not rate concern about the health of the deer population in PA as a 9 or 10 (p < 0.05). 7. Does not indicate using Facebook (including not using any social media) (p < 0.001). 7. Does not indicate using social media, such as Facebook, Twitter, or YouTube (p < 0.001). 8. Is more than median age (p < 0.001). 8. Has lived at his/her primary place of residence for more than the median number of years (p < 0.001). 8. Primary place of residence is a single-family home (p < 0.001). 8. Lives in WMU 4B (p < 0.001). 8. Lives in WMU 3A (p < 0.05). 8. Lives in WMU 2G (p < 0.05). 8. Is female (p < 0.05). See page 9 through 11 for explanation of how to interpret z-score tables.
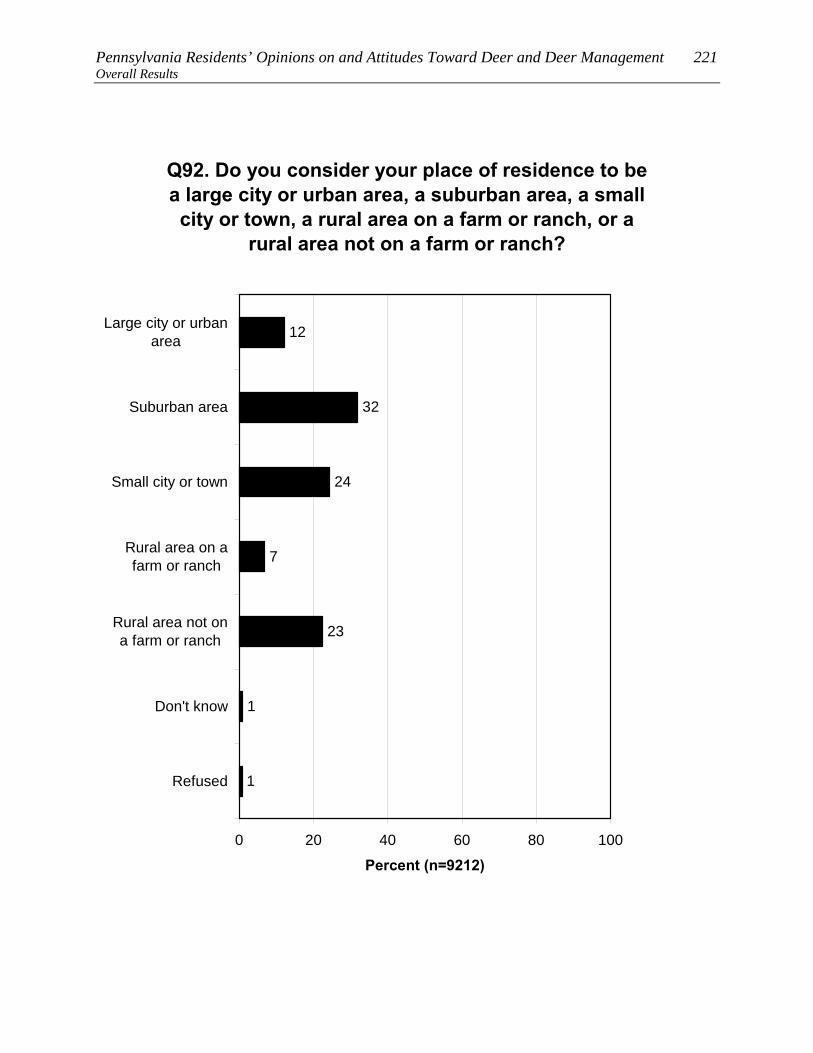
Pennsylvania Residents’ Opinions on and Attitudes Toward Deer and Deer Management 221 Overall Results
Q92. Do you consider your place of residence to be a large city or urban area, a suburban area, a small city or town, a rural area on a farm or ranch, or a
rural area not on a farm or ranch?
1
12
32
24
7
23
1
0 20 40 60 80 100
Large city or urbanarea
Suburban area
Small city or town
Rural area on afarm or ranch
Rural area not ona farm or ranch
Don't know
Refused
Percent (n=9212)

222 Responsive Management Overall Results
8. Considers place of residence to be an urban or suburban area
1. Does not consider deer-related issues as a 9 or 10 in importance as compared to other issues in his/her life (p < 0.001). 2. Does not indicate having seen deer frequently on his/her property in the past 12 months (p < 0.001). 3. Does not Indicate that he/she or any of his/her family members hunt (p < 0.001). 3. Does not indicate having spent time viewing or watching deer around home in the past 12 months (p < 0.001). 3. Does not indicate considering himself/herself to be a hunter (p < 0.001). 3. Does not indicate having a valid 2011 PA general hunting license (p < 0.001). 3. Does not indicate having fed birds or made birdfeed available on his/her property in the past 12 months (p < 0.001). 3. Does not indicate having fed deer intentionally or having put out attractants in the past 12 months (p < 0.001). 3. Does not indicate having taken a trip more than a mile from home for the primary purpose of viewing or watching deer in the past 12 months (p < 0.001). 3. Does not indicate having used a spotlight to view deer at night on a trip to watch deer in the past 12 months (p < 0.001). 3. Does not indicate being very or somewhat satisfied with opportunities to view or watch deer in PA (p < 0.001). 4. Strongly or moderately supports fertility or birth control as a method of controlling deer populations in PA (p < 0.001). 4. Considers the deer population in his/her area to be too high (p < 0.001). 4. Does not strongly or moderately support legal, regulated hunting as a method of controlling deer populations in PA (p < 0.001). 4. Strongly or moderately supports professionals or sharpshooters as a method of controlling deer populations in PA(p < 0.001). 4. Does not strongly or moderately agree that deer populations should be managed for safe and acceptable levels of deer-human conflicts (p < 0.01). 5. Does not strongly or moderately agree that it is OK for private citizens to feed or attract deer in PA (p < 0.001). 5. Rates concern about deer-vehicle accidents in PA as a 9 or 10 (p < 0.001). 5. Rates concern about deer droppings in their yard as a 9 or a 10 (p < 0.001). 5. Rates concern about deer damage to plants and landscaping in their yard as a 9 or 10 (p < 0.001). 5. Does not indicate that he/she or another person living in the immediate household has been diagnosed by a physician with a tick-borne disease in the past 12 months (p < 0.001). 5. Does not indicate that he/she or another person living in the immediate household has been in a vehicle collision with or an accident involving a deer on PA's roads or highways in the past 12 months (p < 0.01). 6. Does not rate concern about the health of the deer population in PA as a 9 or 10 (p < 0.001). 6. Does not rate concern about the quality of deer habitat in PA as a 9 or 10 (p < 0.01). 6. Rates concern about deer impacts on the habitat and other wildlife in PA as a 9 or 10 (p < 0.01). 7. Uses social media, such as Facebook, Twitter, or YouTube (p < 0.001). 7. Uses Facebook (p < 0.001). 8. Lives in WMU 5D (p < 0.001). 8. Primary place of residence is a single-family home (p < 0.001). 8. Lives in WMU 2B (p < 0.001). 8. Lives in WMU 5C (p < 0.001). 8. Has lived at his/her primary place of residence for the median number of years or less (p < 0.001). 8. Lives in WMU 5B (p < 0.001). 8. Is the median age or younger (p < 0.001). 8. Lives in WMU 3B (p < 0.05). See page 9 through 11 for explanation of how to interpret z-score tables.
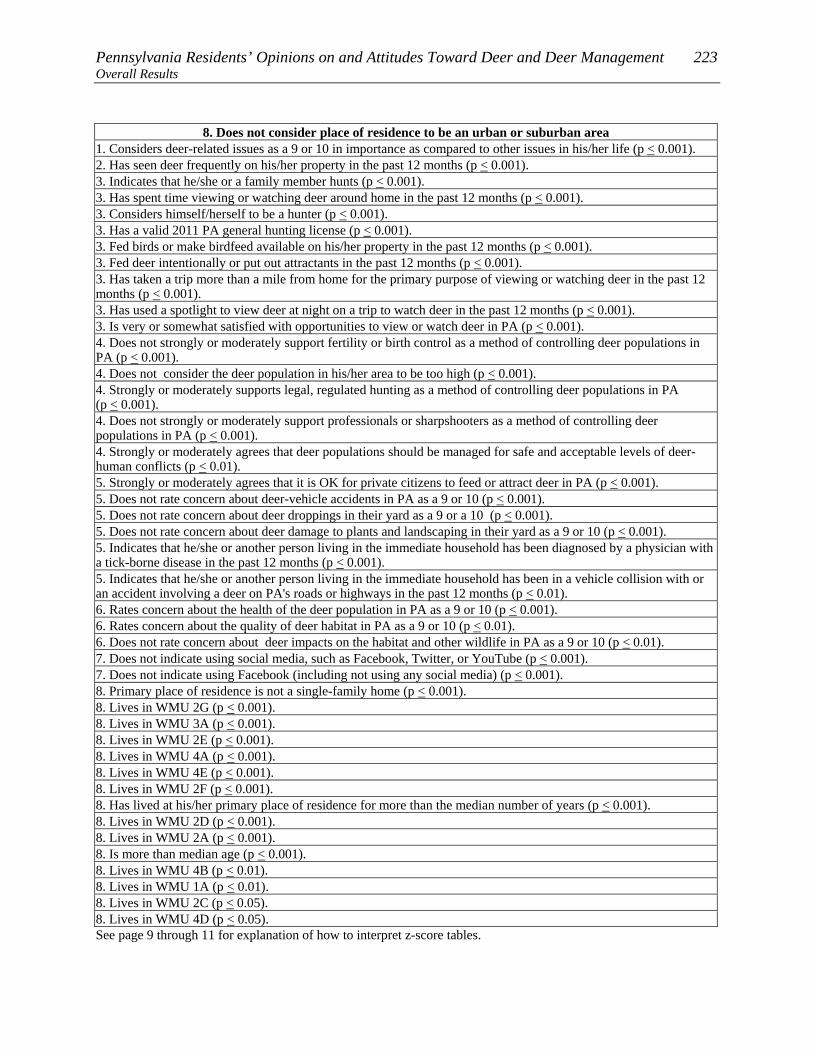
Pennsylvania Residents’ Opinions on and Attitudes Toward Deer and Deer Management 223 Overall Results
8. Does not consider place of residence to be an urban or suburban area 1. Considers deer-related issues as a 9 or 10 in importance as compared to other issues in his/her life (p < 0.001). 2. Has seen deer frequently on his/her property in the past 12 months (p < 0.001). 3. Indicates that he/she or a family member hunts (p < 0.001). 3. Has spent time viewing or watching deer around home in the past 12 months (p < 0.001). 3. Considers himself/herself to be a hunter (p < 0.001). 3. Has a valid 2011 PA general hunting license (p < 0.001). 3. Fed birds or make birdfeed available on his/her property in the past 12 months (p < 0.001). 3. Fed deer intentionally or put out attractants in the past 12 months (p < 0.001). 3. Has taken a trip more than a mile from home for the primary purpose of viewing or watching deer in the past 12 months (p < 0.001). 3. Has used a spotlight to view deer at night on a trip to watch deer in the past 12 months (p < 0.001). 3. Is very or somewhat satisfied with opportunities to view or watch deer in PA (p < 0.001). 4. Does not strongly or moderately support fertility or birth control as a method of controlling deer populations in PA (p < 0.001). 4. Does not consider the deer population in his/her area to be too high (p < 0.001). 4. Strongly or moderately supports legal, regulated hunting as a method of controlling deer populations in PA (p < 0.001). 4. Does not strongly or moderately support professionals or sharpshooters as a method of controlling deer populations in PA (p < 0.001). 4. Strongly or moderately agrees that deer populations should be managed for safe and acceptable levels of deer-human conflicts (p < 0.01). 5. Strongly or moderately agrees that it is OK for private citizens to feed or attract deer in PA (p < 0.001). 5. Does not rate concern about deer-vehicle accidents in PA as a 9 or 10 (p < 0.001). 5. Does not rate concern about deer droppings in their yard as a 9 or a 10 (p < 0.001). 5. Does not rate concern about deer damage to plants and landscaping in their yard as a 9 or 10 (p < 0.001). 5. Indicates that he/she or another person living in the immediate household has been diagnosed by a physician with a tick-borne disease in the past 12 months (p < 0.001). 5. Indicates that he/she or another person living in the immediate household has been in a vehicle collision with or an accident involving a deer on PA's roads or highways in the past 12 months (p < 0.01). 6. Rates concern about the health of the deer population in PA as a 9 or 10 (p < 0.001). 6. Rates concern about the quality of deer habitat in PA as a 9 or 10 (p < 0.01). 6. Does not rate concern about deer impacts on the habitat and other wildlife in PA as a 9 or 10 (p < 0.01). 7. Does not indicate using social media, such as Facebook, Twitter, or YouTube (p < 0.001). 7. Does not indicate using Facebook (including not using any social media) (p < 0.001). 8. Primary place of residence is not a single-family home (p < 0.001). 8. Lives in WMU 2G (p < 0.001). 8. Lives in WMU 3A (p < 0.001). 8. Lives in WMU 2E (p < 0.001). 8. Lives in WMU 4A (p < 0.001). 8. Lives in WMU 4E (p < 0.001). 8. Lives in WMU 2F (p < 0.001). 8. Has lived at his/her primary place of residence for more than the median number of years (p < 0.001). 8. Lives in WMU 2D (p < 0.001). 8. Lives in WMU 2A (p < 0.001). 8. Is more than median age (p < 0.001). 8. Lives in WMU 4B (p < 0.01). 8. Lives in WMU 1A (p < 0.01). 8. Lives in WMU 2C (p < 0.05). 8. Lives in WMU 4D (p < 0.05). See page 9 through 11 for explanation of how to interpret z-score tables.

224 Responsive Management Overall Results
Q57. What type of housing do you live in at your primary place of residence?
82
9
4
4
1
0 20 40 60 80 100
Single family home
Townhome /condo
Duplex
Apartment
Don't know
Percent (n=9212)
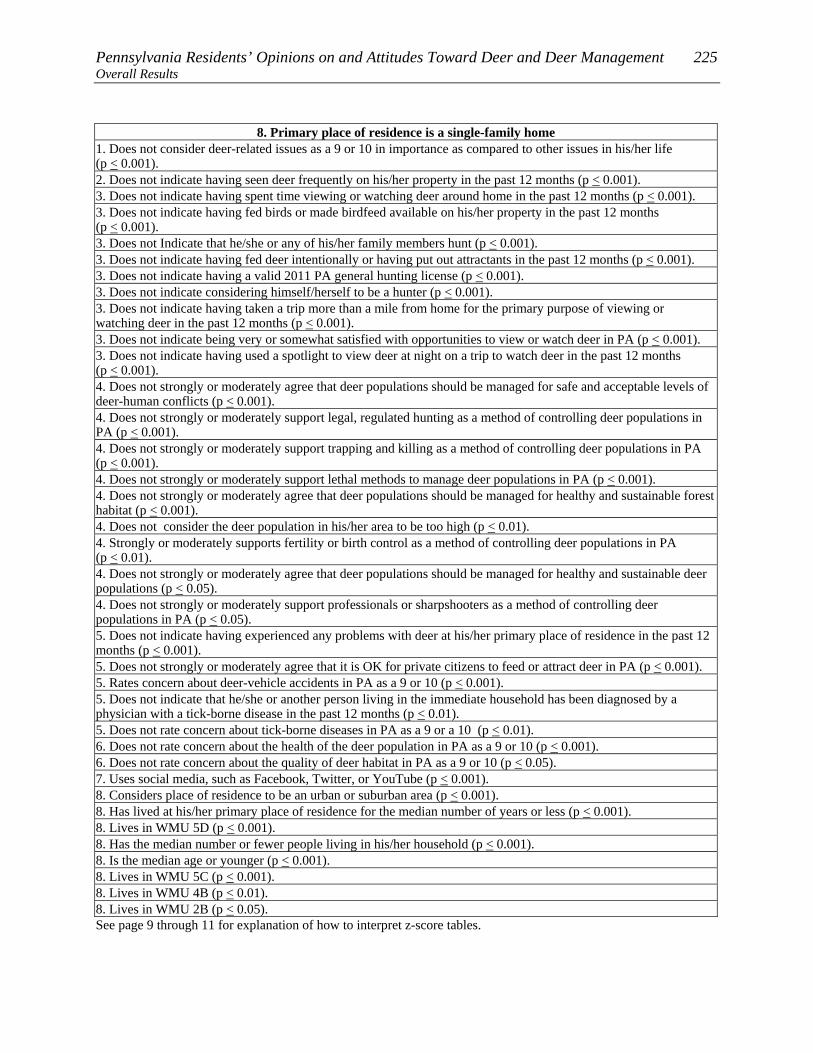
Pennsylvania Residents’ Opinions on and Attitudes Toward Deer and Deer Management 225 Overall Results
8. Primary place of residence is a single-family home 1. Does not consider deer-related issues as a 9 or 10 in importance as compared to other issues in his/her life (p < 0.001). 2. Does not indicate having seen deer frequently on his/her property in the past 12 months (p < 0.001). 3. Does not indicate having spent time viewing or watching deer around home in the past 12 months (p < 0.001). 3. Does not indicate having fed birds or made birdfeed available on his/her property in the past 12 months (p < 0.001). 3. Does not Indicate that he/she or any of his/her family members hunt (p < 0.001). 3. Does not indicate having fed deer intentionally or having put out attractants in the past 12 months (p < 0.001). 3. Does not indicate having a valid 2011 PA general hunting license (p < 0.001). 3. Does not indicate considering himself/herself to be a hunter (p < 0.001). 3. Does not indicate having taken a trip more than a mile from home for the primary purpose of viewing or watching deer in the past 12 months (p < 0.001). 3. Does not indicate being very or somewhat satisfied with opportunities to view or watch deer in PA (p < 0.001). 3. Does not indicate having used a spotlight to view deer at night on a trip to watch deer in the past 12 months (p < 0.001). 4. Does not strongly or moderately agree that deer populations should be managed for safe and acceptable levels of deer-human conflicts (p < 0.001). 4. Does not strongly or moderately support legal, regulated hunting as a method of controlling deer populations in PA (p < 0.001). 4. Does not strongly or moderately support trapping and killing as a method of controlling deer populations in PA (p < 0.001). 4. Does not strongly or moderately support lethal methods to manage deer populations in PA (p < 0.001). 4. Does not strongly or moderately agree that deer populations should be managed for healthy and sustainable forest habitat (p < 0.001). 4. Does not consider the deer population in his/her area to be too high (p < 0.01). 4. Strongly or moderately supports fertility or birth control as a method of controlling deer populations in PA (p < 0.01). 4. Does not strongly or moderately agree that deer populations should be managed for healthy and sustainable deer populations (p < 0.05). 4. Does not strongly or moderately support professionals or sharpshooters as a method of controlling deer populations in PA (p < 0.05). 5. Does not indicate having experienced any problems with deer at his/her primary place of residence in the past 12 months (p < 0.001). 5. Does not strongly or moderately agree that it is OK for private citizens to feed or attract deer in PA (p < 0.001). 5. Rates concern about deer-vehicle accidents in PA as a 9 or 10 (p < 0.001). 5. Does not indicate that he/she or another person living in the immediate household has been diagnosed by a physician with a tick-borne disease in the past 12 months (p < 0.01). 5. Does not rate concern about tick-borne diseases in PA as a 9 or a 10 (p < 0.01). 6. Does not rate concern about the health of the deer population in PA as a 9 or 10 (p < 0.001). 6. Does not rate concern about the quality of deer habitat in PA as a 9 or 10 (p < 0.05). 7. Uses social media, such as Facebook, Twitter, or YouTube (p < 0.001). 8. Considers place of residence to be an urban or suburban area (p < 0.001). 8. Has lived at his/her primary place of residence for the median number of years or less (p < 0.001). 8. Lives in WMU 5D (p < 0.001). 8. Has the median number or fewer people living in his/her household (p < 0.001). 8. Is the median age or younger (p < 0.001). 8. Lives in WMU 5C (p < 0.001). 8. Lives in WMU 4B (p < 0.01). 8. Lives in WMU 2B (p < 0.05). See page 9 through 11 for explanation of how to interpret z-score tables.

226 Responsive Management Overall Results
8. Primary place of residence is not a single-family home
1. Considers deer-related issues as a 9 or 10 in importance as compared to other issues in his/her life (p < 0.01). 2. Has seen deer frequently on his/her property in the past 12 months (p < 0.001). 3. Has spent time viewing or watching deer around home in the past 12 months (p < 0.001). 3. Fed birds or make birdfeed available on his/her property in the past 12 months (p < 0.001). 3. Indicates that he/she or a family member hunts (p < 0.001). 3. Fed deer intentionally or put out attractants in the past 12 months (p < 0.001). 3. Has a valid 2011 PA general hunting license (p < 0.001). 3. Considers himself/herself to be a hunter (p < 0.001). 3. Has taken a trip more than a mile from home for the primary purpose of viewing or watching deer in the past 12 months (p < 0.001). 3. Is very or somewhat satisfied with opportunities to view or watch deer in PA (p < 0.001). 3. Has used a spotlight to view deer at night on a trip to watch deer in the past 12 months (p < 0.001). 4. Strongly or moderately agrees that deer populations should be managed for safe and acceptable levels of deer-human conflicts (p < 0.001). 4. Strongly or moderately supports legal, regulated hunting as a method of controlling deer populations in PA (p < 0.001). 4. Strongly or moderately supports trapping and killing as a method of controlling deer populations in PA (p < 0.001). 4. Strongly or moderately supports lethal methods to manage deer populations in PA (p < 0.001). 4. Considers the deer population in his/her area to be too high (p < 0.001). 4. Strongly or moderately agrees that deer populations should be managed for healthy and sustainable forest habitat (p < 0.001). 4. Strongly or moderately agrees that deer populations should be managed for healthy and sustainable deer populations (p < 0.001). 4. Strongly or moderately supports professionals or sharpshooters as a method of controlling deer populations in PA(p < 0.05). 4. Does not strongly or moderately support fertility or birth control as a method of controlling deer populations in PA (p < 0.05). 5. Indicates having experienced a problem with deer at his/her primary place of residence in the past 12 months (p < 0.001). 5. Strongly or moderately agrees that it is OK for private citizens to feed or attract deer in PA (p < 0.001). 5. Does not rate concern about deer-vehicle accidents in PA as a 9 or 10 (p < 0.01). 5. Rates concern about tick-borne diseases in PA as a 9 or a 10 (p < 0.01). 5. Indicates that he/she or another person living in the immediate household has been diagnosed by a physician with a tick-borne disease in the past 12 months (p < 0.01). 6. Rates concern about the health of the deer population in PA as a 9 or 10 (p < 0.01). 7. Does not indicate using social media, such as Facebook, Twitter, or YouTube (p < 0.001). 8. Has lived at his/her primary place of residence for more than the median number of years (p < 0.001). 8. Has more than median number of people living in his/her household (p < 0.001). 8. Lives in WMU 1B (p < 0.001). 8. Lives in WMU 2F (p < 0.01). 8. Lives in WMU 2E (p < 0.05). 8. Lives in WMU 2C (p < 0.05). 8. Lives in WMU 3A (p < 0.05). 8. Lives in WMU 1A (p < 0.05). 8. Is more than median age (p < 0.001). 8. Lives in WMU 2G (p < 0.001). 8. Does not consider place of residence to be an urban or suburban area (p < 0.001). See page 9 through 11 for explanation of how to interpret z-score tables.

Pennsylvania Residents’ Opinions on and Attitudes Toward Deer and Deer Management 227 Overall Results
Q93. How many acres is your property at your primary place of residence? (Asked of those whose primary place of residence is a single family home.)
2
2
4
2
2
0
1
1
2
4
9
32
34
5
0 20 40 60 80 100
More than 100 acres
51-100 acres
41-50 acres
31-40 acres
21-30 acres
11-20 acres
6-10 acres
5 acres
4 acres
3 acres
2 acres
1 acre
Less than an acre
Don't know
Percent (n=8206)
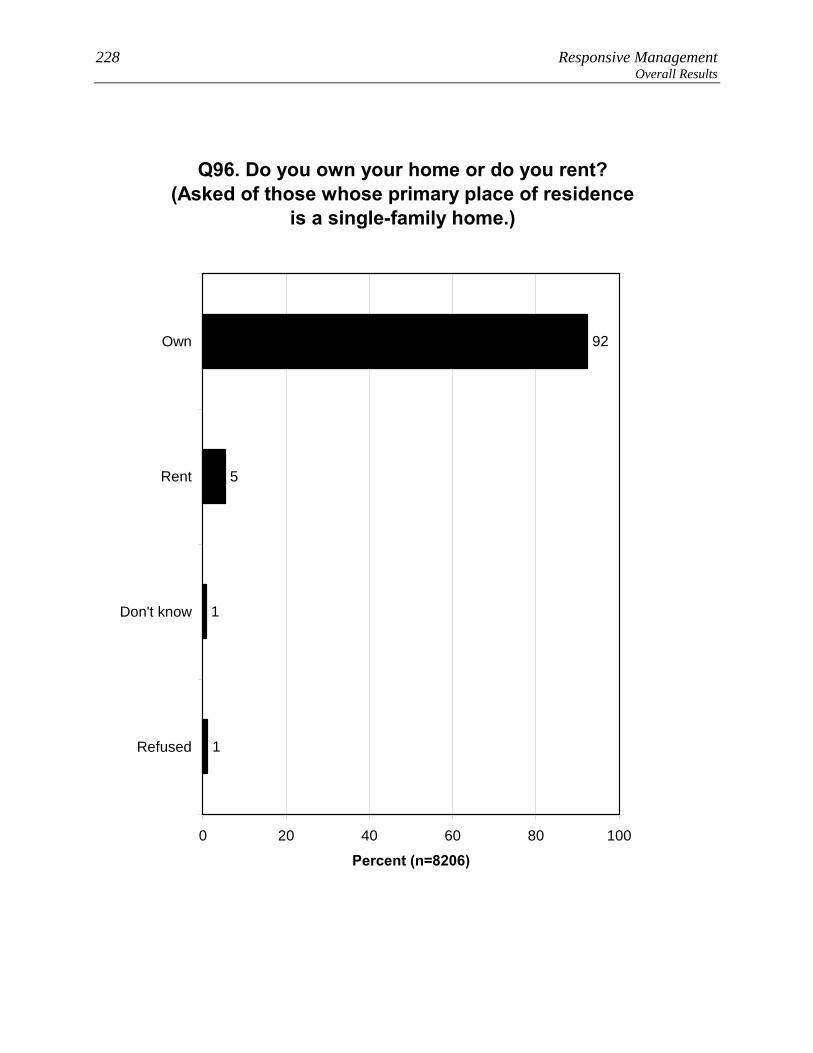
228 Responsive Management Overall Results
Q96. Do you own your home or do you rent? (Asked of those whose primary place of residence
is a single-family home.)
92
5
1
1
0 20 40 60 80 100
Own
Rent
Don't know
Refused
Percent (n=8206)
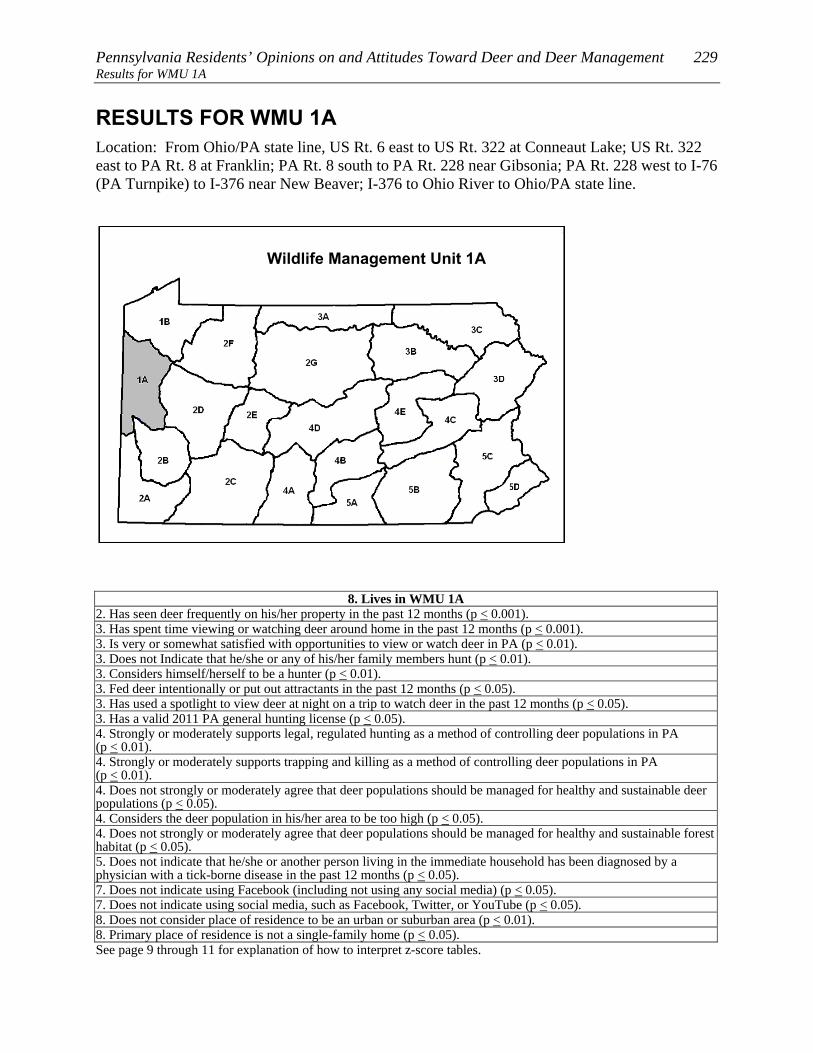
Pennsylvania Residents’ Opinions on and Attitudes Toward Deer and Deer Management 229 Results for WMU 1A
RESULTS FOR WMU 1A Location: From Ohio/PA state line, US Rt. 6 east to US Rt. 322 at Conneaut Lake; US Rt. 322 east to PA Rt. 8 at Franklin; PA Rt. 8 south to PA Rt. 228 near Gibsonia; PA Rt. 228 west to I-76 (PA Turnpike) to I-376 near New Beaver; I-376 to Ohio River to Ohio/PA state line.
8. Lives in WMU 1A 2. Has seen deer frequently on his/her property in the past 12 months (p < 0.001). 3. Has spent time viewing or watching deer around home in the past 12 months (p < 0.001). 3. Is very or somewhat satisfied with opportunities to view or watch deer in PA (p < 0.01). 3. Does not Indicate that he/she or any of his/her family members hunt (p < 0.01). 3. Considers himself/herself to be a hunter (p < 0.01). 3. Fed deer intentionally or put out attractants in the past 12 months (p < 0.05). 3. Has used a spotlight to view deer at night on a trip to watch deer in the past 12 months (p < 0.05). 3. Has a valid 2011 PA general hunting license (p < 0.05). 4. Strongly or moderately supports legal, regulated hunting as a method of controlling deer populations in PA (p < 0.01). 4. Strongly or moderately supports trapping and killing as a method of controlling deer populations in PA (p < 0.01). 4. Does not strongly or moderately agree that deer populations should be managed for healthy and sustainable deer populations (p < 0.05). 4. Considers the deer population in his/her area to be too high (p < 0.05). 4. Does not strongly or moderately agree that deer populations should be managed for healthy and sustainable forest habitat (p < 0.05). 5. Does not indicate that he/she or another person living in the immediate household has been diagnosed by a physician with a tick-borne disease in the past 12 months (p < 0.05). 7. Does not indicate using Facebook (including not using any social media) (p < 0.05). 7. Does not indicate using social media, such as Facebook, Twitter, or YouTube (p < 0.05). 8. Does not consider place of residence to be an urban or suburban area (p < 0.01). 8. Primary place of residence is not a single-family home (p < 0.05). See page 9 through 11 for explanation of how to interpret z-score tables.
Wildlife Management Unit 1A
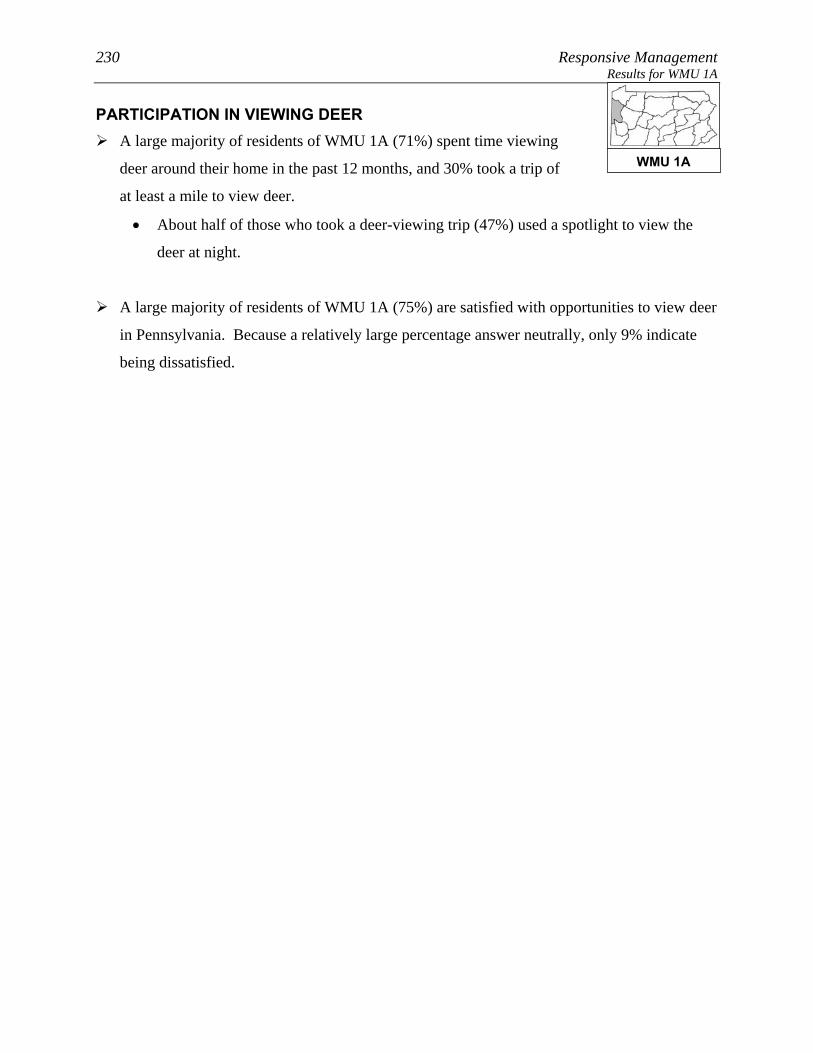
230 Responsive Management Results for WMU 1A
PARTICIPATION IN VIEWING DEER A large majority of residents of WMU 1A (71%) spent time viewing
deer around their home in the past 12 months, and 30% took a trip of
at least a mile to view deer.
• About half of those who took a deer-viewing trip (47%) used a spotlight to view the
deer at night.
A large majority of residents of WMU 1A (75%) are satisfied with opportunities to view deer
in Pennsylvania. Because a relatively large percentage answer neutrally, only 9% indicate
being dissatisfied.
WMU 1A
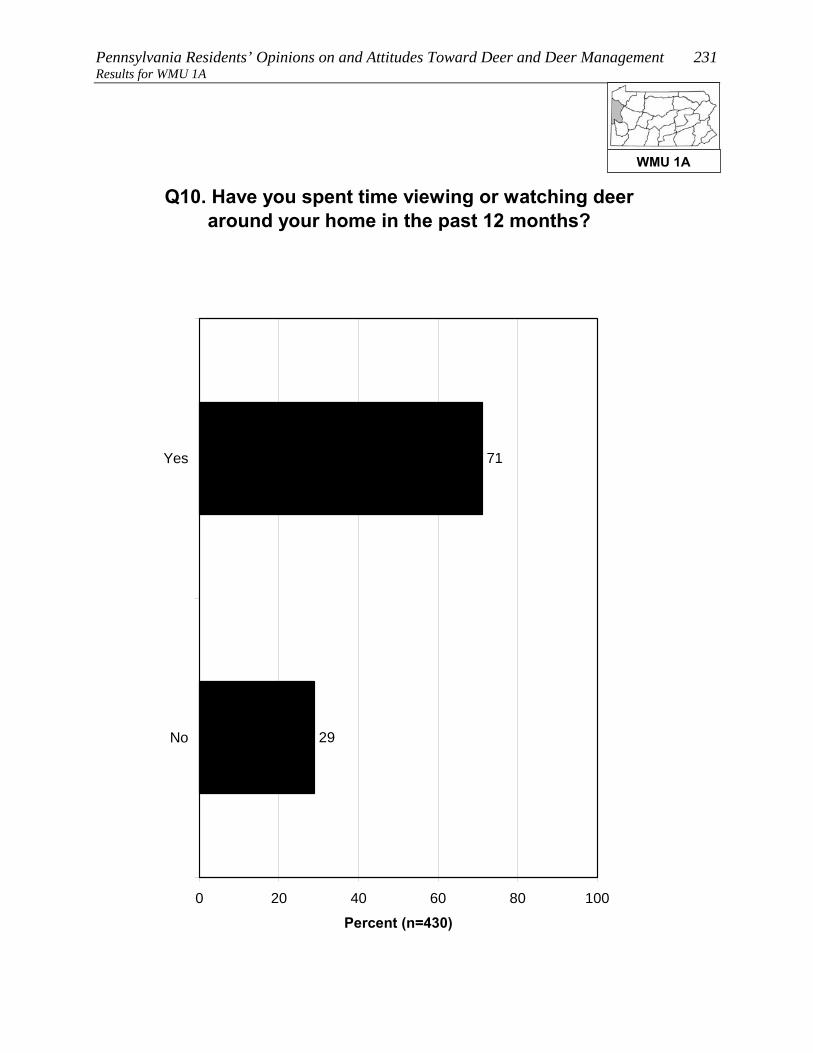
Pennsylvania Residents’ Opinions on and Attitudes Toward Deer and Deer Management 231 Results for WMU 1A
Q10. Have you spent time viewing or watching deer around your home in the past 12 months?
29
71
0 20 40 60 80 100
Yes
No
Percent (n=430)
WMU 1A

232 Responsive Management Results for WMU 1A
Q11. Have you taken a trip at least 1 mile from your home for the primary purpose of viewing or
watching deer in the past 12 months?
70
30
0 20 40 60 80 100
Yes
No
Percent (n=430)
WMU 1A
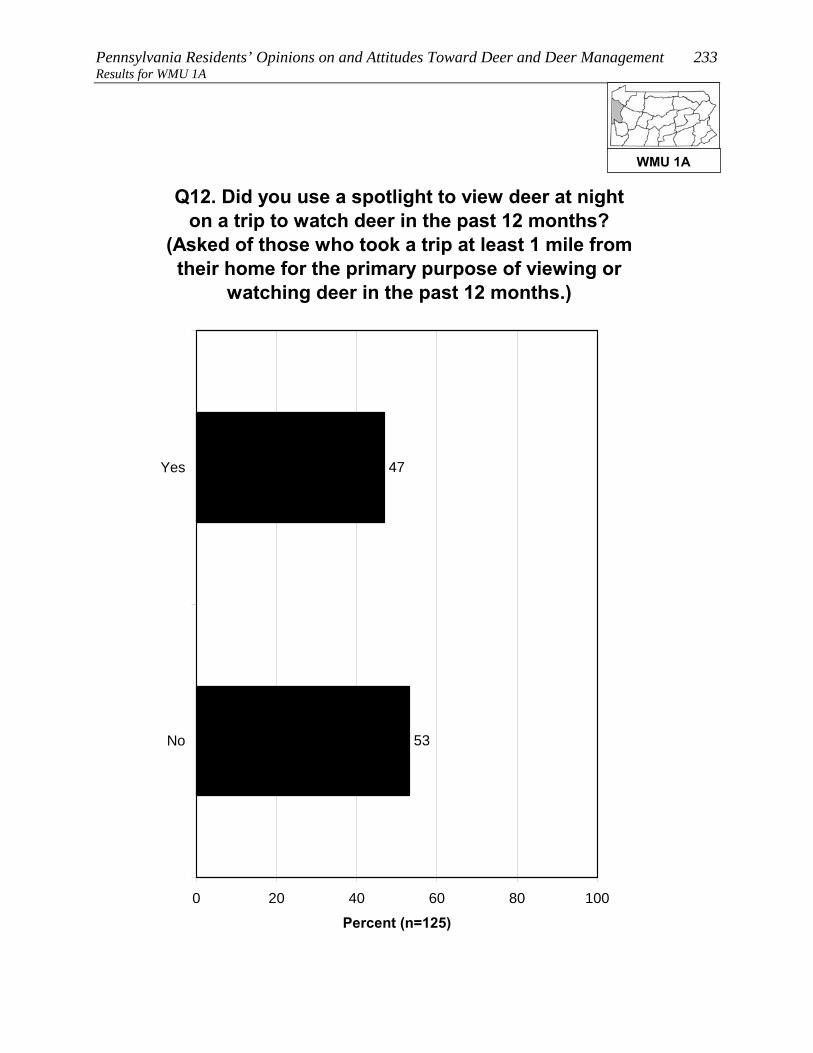
Pennsylvania Residents’ Opinions on and Attitudes Toward Deer and Deer Management 233 Results for WMU 1A
Q12. Did you use a spotlight to view deer at night on a trip to watch deer in the past 12 months?
(Asked of those who took a trip at least 1 mile from their home for the primary purpose of viewing or
watching deer in the past 12 months.)
53
47
0 20 40 60 80 100
Yes
No
Percent (n=125)
WMU 1A
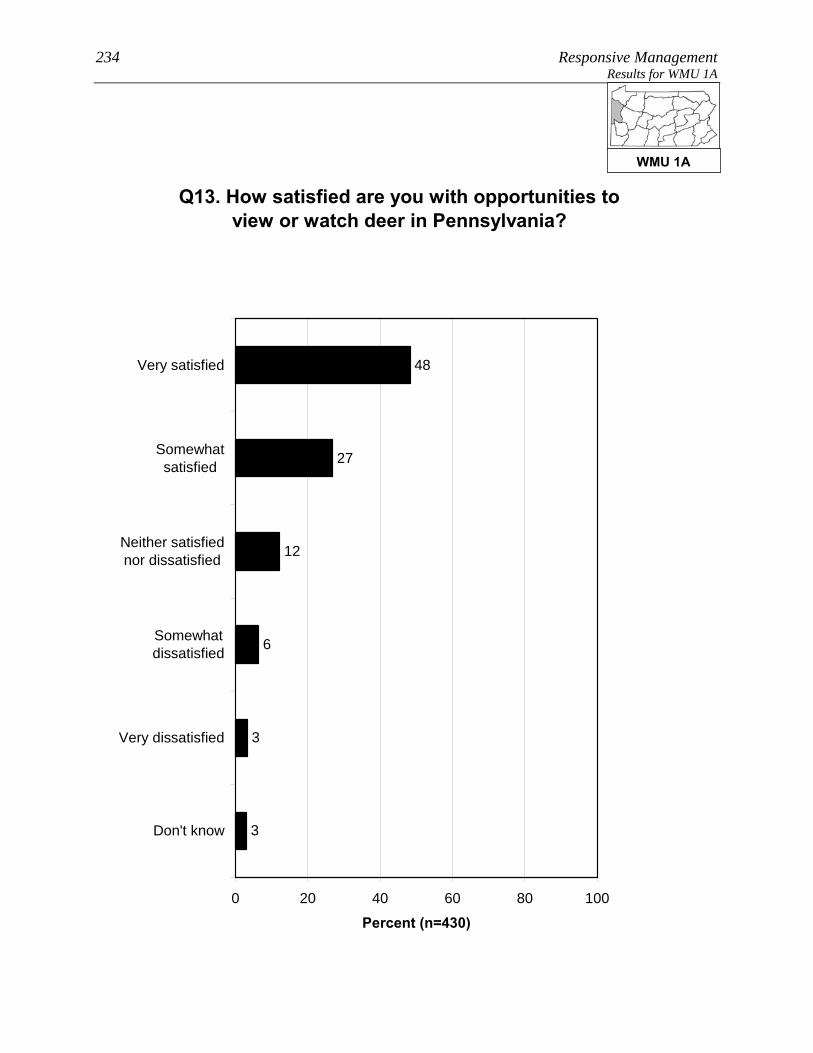
234 Responsive Management Results for WMU 1A
Q13. How satisfied are you with opportunities to view or watch deer in Pennsylvania?
3
3
6
12
27
48
0 20 40 60 80 100
Very satisfied
Somewhatsatisfied
Neither satisfiednor dissatisfied
Somewhatdissatisfied
Very dissatisfied
Don't know
Percent (n=430)
WMU 1A

Pennsylvania Residents’ Opinions on and Attitudes Toward Deer and Deer Management 235 Results for WMU 1A OPINIONS ON DEER IN GENERAL AND THE SIZE AND HEALTH OF THE DEER HERD
Opinion on deer is mostly favorable: 54% of residents of WMU 1A
say with no caveats that they like having deer around, another 26%
like having deer around but worry about the problems they may cause,
and only 6% generally regard them as a nuisance. The remainder have
no particular feeling about deer.
Another question asked residents of WMU 1A how deer-related issues compared to other
issues in their life, on a scale of 0 to 10, with the most importance being 10: the median
rating is “5.” The most common ratings are the midpoint of “5” (23%), “0” (16%), and “10”
(11%). In general, ratings are well spread across the scale.
Two other ratings questions asked respondents to rate their concern about deer-related issues.
The median level of concern is “6” for the quality of deer habitat in Pennsylvania and “6” for
the health of the deer population in Pennsylvania.
The survey asked about the perceived size of the deer herd in the respondent’s area. The
majority of residents of WMU 1A say that the herd size is just right (54%); otherwise, more
say that it is too low (23%) than too high (16%).
• Those who own their home are more likely, compared to those who do not own their
home, to say that the deer population in their area is too high.
• Those who consider themselves to be a hunter are much more likely to say that the deer
population in their area is too low, compared to those who are not hunters.
WMU 1A
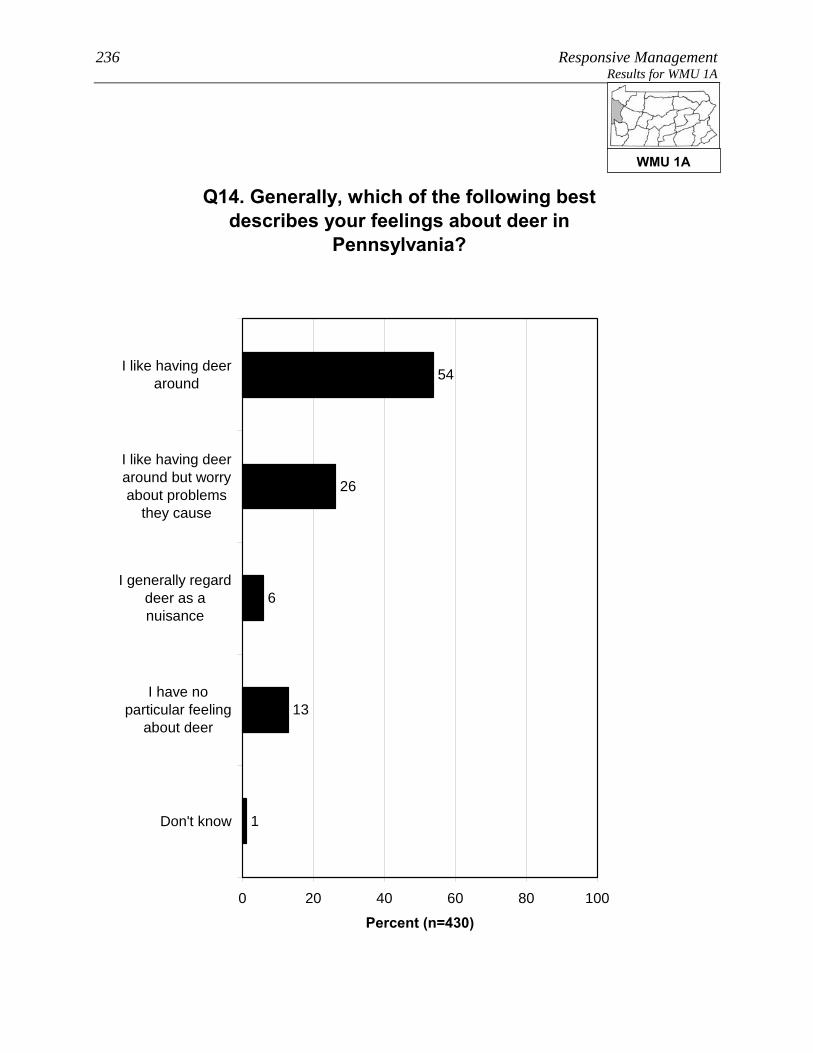
236 Responsive Management Results for WMU 1A
Q14. Generally, which of the following best describes your feelings about deer in
Pennsylvania?
1
13
6
26
54
0 20 40 60 80 100
I like having deeraround
I like having deeraround but worryabout problems
they cause
I generally regarddeer as anuisance
I have noparticular feeling
about deer
Don't know
Percent (n=430)
WMU 1A

Pennsylvania Residents’ Opinions on and Attitudes Toward Deer and Deer Management 237 Results for WMU 1A
Q15. Compared to other issues in your life, how important to you, personally, are deer-related
issues on a scale of 0 to 10 where 0 is not at all important and 10 is extremely important?
2
16
7
23
8
6
8
2
11
5
6
7
0 20 40 60 80 100
10
9
8
7
6
5
4
3
2
1
0
Don't know
Percent (n=430)
Mean = 4.61Median = 5
WMU 1A
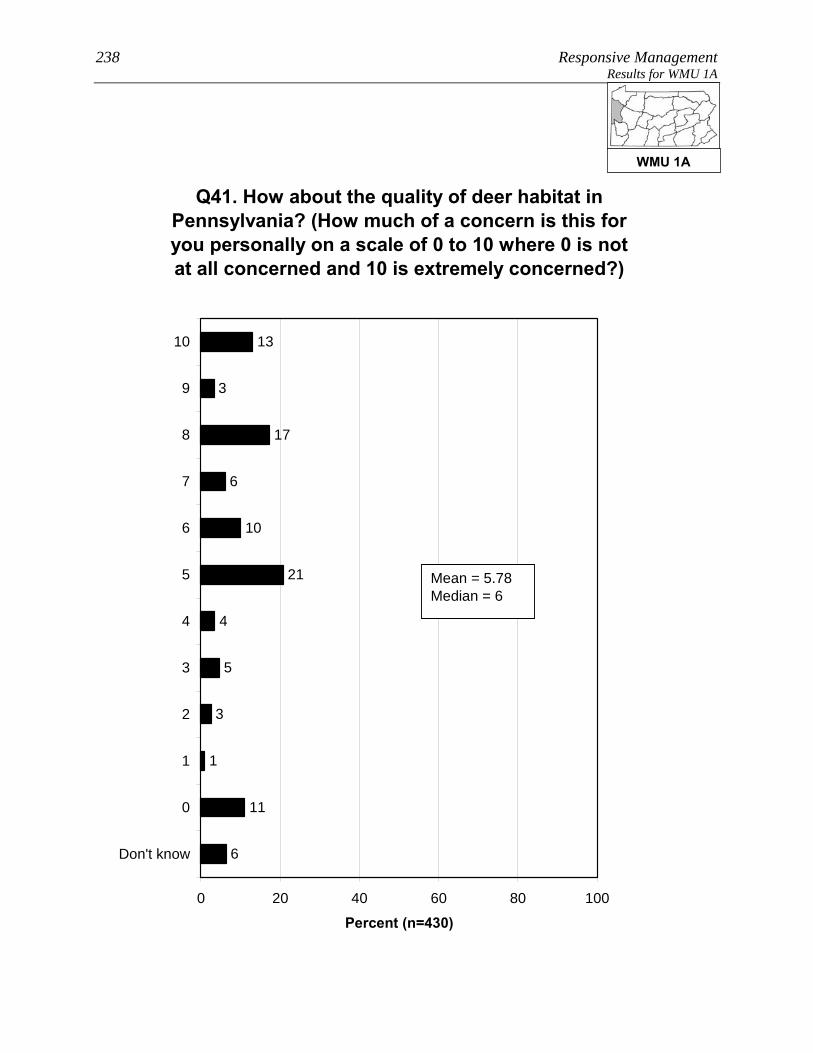
238 Responsive Management Results for WMU 1A
Q41. How about the quality of deer habitat in Pennsylvania? (How much of a concern is this for you personally on a scale of 0 to 10 where 0 is not at all concerned and 10 is extremely concerned?)
6
11
1
21
10
6
17
3
13
4
5
3
0 20 40 60 80 100
10
9
8
7
6
5
4
3
2
1
0
Don't know
Percent (n=430)
Mean = 5.78Median = 6
WMU 1A
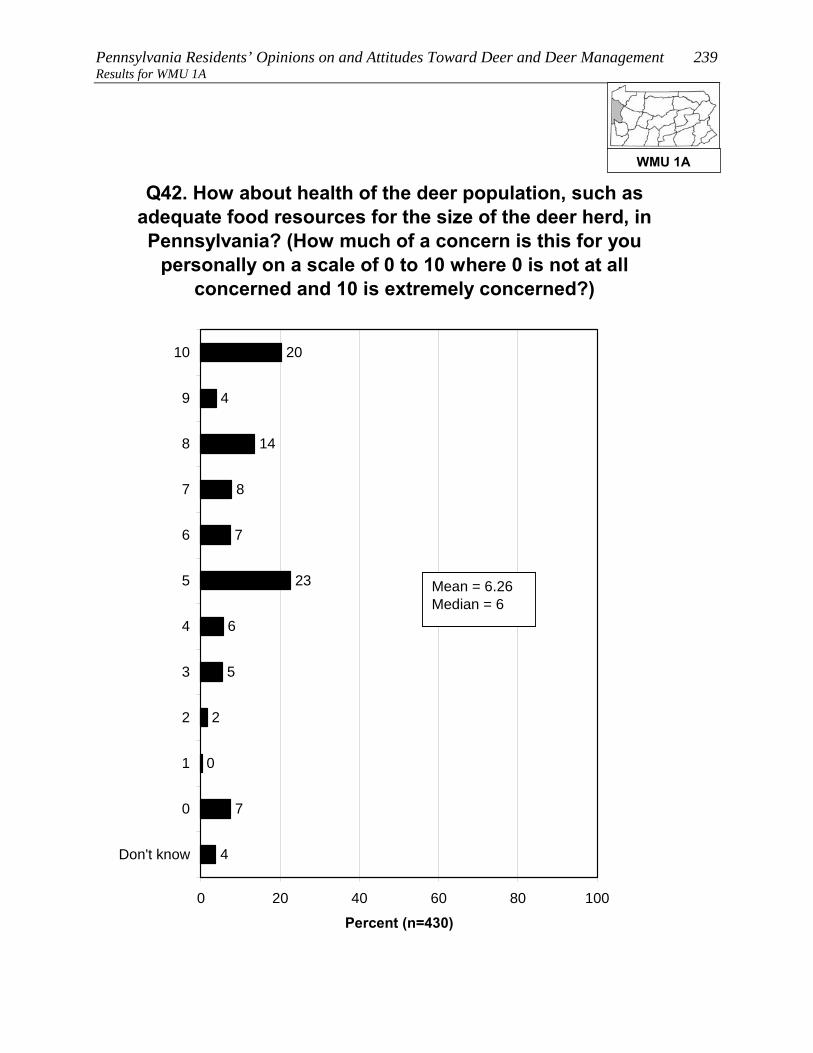
Pennsylvania Residents’ Opinions on and Attitudes Toward Deer and Deer Management 239 Results for WMU 1A
4
7
0
23
7
8
14
4
20
6
5
2
0 20 40 60 80 100
10
9
8
7
6
5
4
3
2
1
0
Don't know
Percent (n=430)
Q42. How about health of the deer population, such as adequate food resources for the size of the deer herd, in Pennsylvania? (How much of a concern is this for you
personally on a scale of 0 to 10 where 0 is not at all concerned and 10 is extremely concerned?)
Mean = 6.26Median = 6
WMU 1A
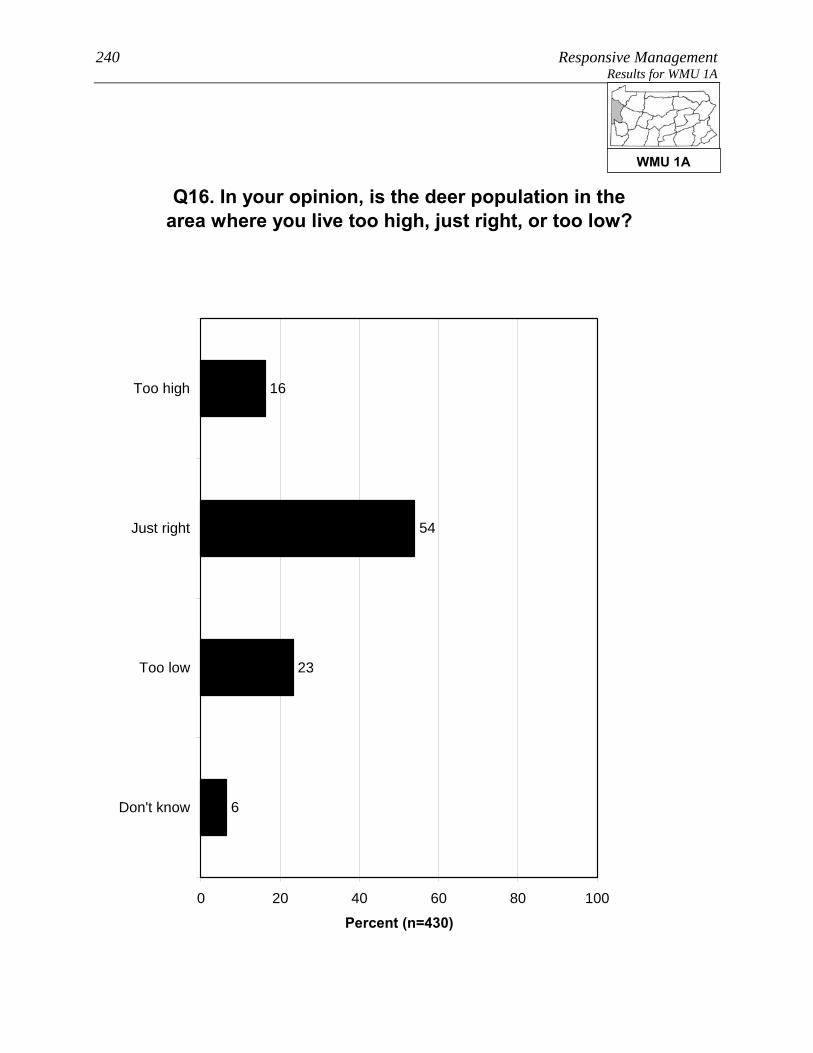
240 Responsive Management Results for WMU 1A
Q16. In your opinion, is the deer population in the area where you live too high, just right, or too low?
6
23
54
16
0 20 40 60 80 100
Too high
Just right
Too low
Don't know
Percent (n=430)
WMU 1A

Pennsylvania Residents’ Opinions on and Attitudes Toward Deer and Deer Management 241 Results for WMU 1A
Q16. In your opinion, is the deer population in the area where you live too high, just right, or too low?
5
25
53
17
19
5
57
18
0 20 40 60 80 100
Too high
Just right
Too low
Don't know
Percent
Owns home (n=372)Does not own home (n=24)
WMU 1A

242 Responsive Management Results for WMU 1A
Q16. In your opinion, is the deer population in the area where you live too high, just right, or too low?
2
42
48
8
9
21
58
11
0 20 40 60 80 100
Too high
Just right
Too low
Don't know
Percent
Consider themselves ahunter (n=168)Do not consider themselvesa hunter (n=262)
WMU 1A
Pennsylvania Residents’ Opinions on and Attitudes Toward Deer and Deer Management 243 Results for WMU 1A OPINIONS ON MANAGEMENT EFFORTS AND MANAGEMENT GOALS
The survey asked about three deer population management goals. For
all three, a large majority agree with the management goal: 89% agree
with managing for healthy and sustainable deer populations, 84%
agree with managing the deer for a healthy and sustainable forest
habitat, and 83% agree with managing for safe, acceptable levels of
deer-human conflicts.
Residents of WMU 1A who said that the deer population in their area is too high or too low
were asked to indicate the reasonable number of years it should take to achieve an acceptable
deer population. The mean amount is 3.92 years. While 43% said that they do not know,
nearly all the rest gave a number of years of 10 or less. Note that this is only among those
who said the deer population was too high or too low.
• Because management plans typically look at a time frame of about 10 years to effect
change, the survey specifically asked if these respondents would be willing to wait
more than 10 years to achieve an acceptable deer population: just over half (52%)
indicated that they would be willing to wait that long.
WMU 1A

244 Responsive Management Results for WMU 1A
Q24-26. Deer populations should be managed for the following. (Do you agree or disagree with this
deer management goal?)
64
25
3
3
4
1
4
3
4
6
2
4
27
57
4
30
53
5
0 20 40 60 80 100
Strongly agree
Moderatelyagree
Neither agreenor disagree
Moderatelydisagree
Stronglydisagree
Don't know
Percent
Healthy and substainable forest habitat
Healthy and substainable deer populations
Safe and acceptable levels of deer-humanconflicts
WMU 1A

Pennsylvania Residents’ Opinions on and Attitudes Toward Deer and Deer Management 245 Results for WMU 1A
8
12
6
17
5
0
6
3
43
0 20 40 60 80 100
More than 10years
6-10 years
5 years
4 years
3 years
2 years
1 year
Less than a year
Don't know
Percent (n=177)
Q18. You said the deer population in the area where you live is [too high / too low]. In years, what is a
reasonable amount of time to achieve an acceptable deer population in the area where you live? (Asked of those who think the deer population in the area where
they live is too high or too low.)
Mean = 3.92Median = 3
WMU 1A

246 Responsive Management Results for WMU 1A
Q21. Would you be willing to wait more than 10 years to achieve an acceptable deer population in the area where you live? (Among those who think the deer population in the area where they live is
too high or too low.)
9
38
52
0 20 40 60 80 100
Yes
No
Don't know
Percent (n=177)
WMU 1A

Pennsylvania Residents’ Opinions on and Attitudes Toward Deer and Deer Management 247 Results for WMU 1A OPINIONS ON METHODS FOR MANAGING DEER, INCLUDING HUNTING
Just under two-thirds of residents of WMU 1A (63%) support lethal
methods to manage deer populations in Pennsylvania; nonetheless,
25% oppose, mostly strong opposition.
• Those residents of WMU 1A who live in a single-family home and own their home are
slightly more likely to oppose lethal methods, compared to those who live in a single-
family home but do not own their home.
• The survey asked about four methods of controlling deer populations (three of them
lethal). The most support is for legal, regulated hunting (94% of respondents support
this method), distantly followed by fertility/birth control (34%), trapping and killing
(30%), and professionals or sharpshooters (28%).
Two questions asked respondents about hunting on their land (among those who live in a
single-family home), the first question about hunting by the respondents themselves (18% do
so) and the second regarding allowing others to hunt on their land (26% do so). In
combining the results, 30% of residents of WMU 1A who live in a single-family home either
hunt on their own land or allow others to do so (it is not simply a sum of the two questions
because some hunt on their property and allow others to do so as well).
• There was interest in seeing how a particular subgroup responded on this question, the
subgroup being those who live in a single-family home; who live on 1 acre or less; and
who live in an urban, suburban area, or a small city/town. Among this subgroup, 10%
either hunt on their own property or allow others to hunt on the property.
• Those respondents who do not allow hunting on their property were asked to indicate
why they prohibit it. The most common reasons are that their property is too small
and/or that they live in an urban or suburban area in which hunting is not possible or
feasible. Other minor reasons are concerns about safety, a general opposition to
hunting, and liability concerns.
• Those same respondents who do not allow hunting on their property were asked about
their likelihood of ever allowing others to hunt deer on their property; they
overwhelmingly say this is very unlikely (93%). They were then asked if there is
WMU 1A
248 Responsive Management Results for WMU 1A
anything that would make them more likely to allow deer hunting;
an overwhelming majority (92%) say that there is nothing that would
make them more likely to allow deer hunting.
• The question about allowing others to hunt on their property was examined among the
subgroup previously discussed (those who live in a single-family home; who live on 1
acre or less; and who live in an urban, suburban area, or a small city/town). Among
this group who got the question, an overwhelming majority say that it is very unlikely
that they would ever allow hunting.
o Additional follow-up questions to be asked of those who indicated that something
might prompt them to allow hunting on their property did not have enough
respondents for statistical validity; therefore, they are not shown.
WMU 1A

Pennsylvania Residents’ Opinions on and Attitudes Toward Deer and Deer Management 249 Results for WMU 1A
Q27. In general, do you support or oppose lethal methods to manage deer populations in
Pennsylvania?
4
19
6
8
23
40
0 20 40 60 80 100
Strongly support
Moderatelysupport
Neither supportnor oppose
Moderatelyoppose
Strongly oppose
Don't know
Percent (n=430)
WMU 1A
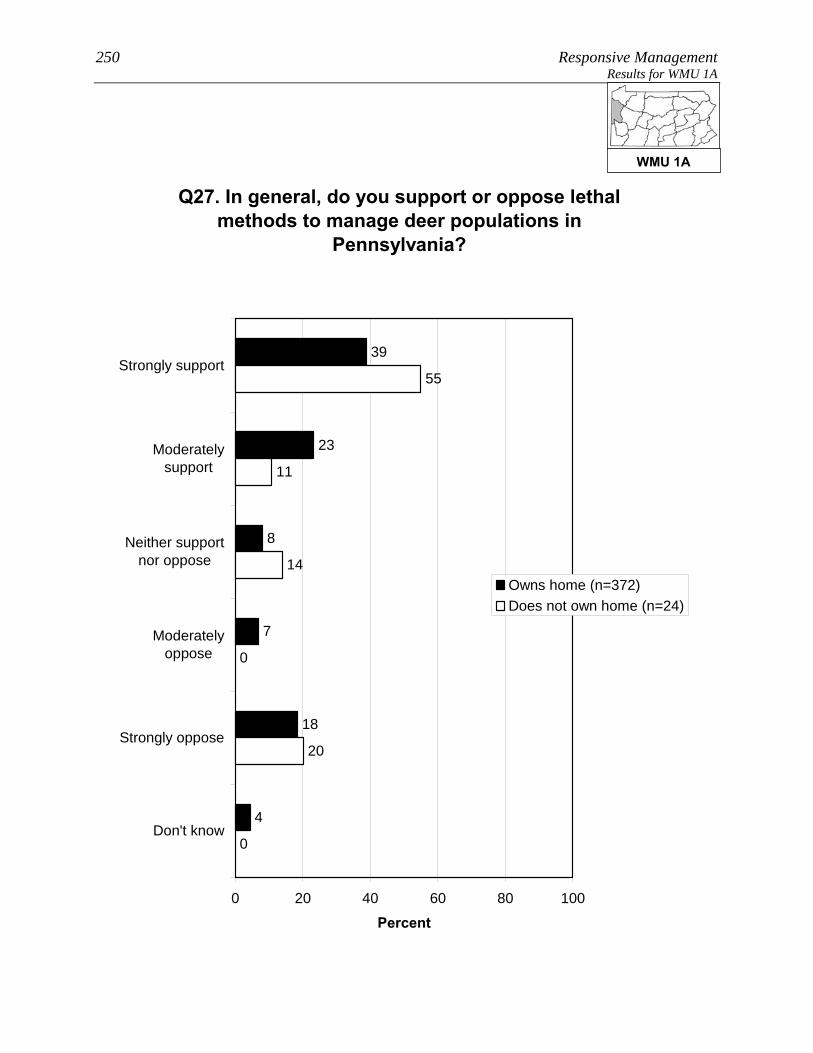
250 Responsive Management Results for WMU 1A
Q27. In general, do you support or oppose lethal methods to manage deer populations in
Pennsylvania?
4
18
7
8
23
39
0
20
0
55
11
14
0 20 40 60 80 100
Strongly support
Moderatelysupport
Neither supportnor oppose
Moderatelyoppose
Strongly oppose
Don't know
Percent
Owns home (n=372)Does not own home (n=24)
WMU 1A

Pennsylvania Residents’ Opinions on and Attitudes Toward Deer and Deer Management 251 Results for WMU 1A
Q30-Q33. Percent who strongly support each of the following methods of controlling deer populations
in Pennsylvania:
15
16
19
75
0 20 40 60 80 100
Q30. Legal,regulated hunting
Q33. Fertility orbirth control
Q32. Trappingand killing
Q31.Professionals orsharpshooters
Percent
WMU 1A

252 Responsive Management Results for WMU 1A
Q30-Q33. Percent who strongly or moderately support each of the following methods of
controlling deer populations in Pennsylvania:
28
30
34
94
0 20 40 60 80 100
Q30. Legal,regulated hunting
Q33. Fertility orbirth control
Q32. Trappingand killing
Q31.Professionals orsharpshooters
Percent
WMU 1A

Pennsylvania Residents’ Opinions on and Attitudes Toward Deer and Deer Management 253 Results for WMU 1A
Q30-Q33. Percent who strongly or moderately oppose each of the following methods of
controlling deer populations in Pennsylvania:
4
52
61
66
0 20 40 60 80 100
Q32. Trappingand killing
Q31.Professionals orsharpshooters
Q33. Fertility orbirth control
Q30. Legal,regulated hunting
Percent
WMU 1A

254 Responsive Management Results for WMU 1A
Q30-Q33. Percent who strongly oppose each of the following methods of controlling deer populations
in Pennsylvania:
3
40
46
55
0 20 40 60 80 100
Q32. Trappingand killing
Q31.Professionals orsharpshooters
Q33. Fertility orbirth control
Q30. Legal,regulated hunting
Percent
WMU 1A

Pennsylvania Residents’ Opinions on and Attitudes Toward Deer and Deer Management 255 Results for WMU 1A
Q59/60. Deer hunts and/or allows others to deer hunt on property. (Among respondents living in a
single-family home.)
1
69
30
0 20 40 60 80 100
Yes
No
Don't know
Percent (n=396)
WMU 1A

256 Responsive Management Results for WMU 1A
Q59/60. Deer hunts and/or allows others to deer hunt on property. (Among respondents living in a
single-family home.)
90
10
0 20 40 60 80 100
Yes
No
Percent
Lives in a single family home on 1 acre or lessin an urban area, suburban area, or a smallcity/town (n=136)
WMU 1A

Pennsylvania Residents’ Opinions on and Attitudes Toward Deer and Deer Management 257 Results for WMU 1A
Q63. What are the main reasons you do not allow others to hunt deer on your property? (Asked of
those whose primary place of residence is a single-family home and who do not allow others to hunt
deer on their property.)
1
1
1
4
4
7
30
59
1
1
1
0 20 40 60 80 100
Property is too small / neighbors tooclose
Live in residential neighborhood /suburban or urban area
Concerned about safety
Oppose hunting in general
Liability
Concerned about bad behavior byhunters
Not interested in allowing hunting onproperty, but did not indicate
opposition to hunting in general
Want to save hunting opportunities forself / family
No one has asked for hunting access
Not enough deer on property / notenough habitat
Don't know
Mul
tiple
Res
pons
es A
llow
ed
Percent (n=294)
WMU 1A
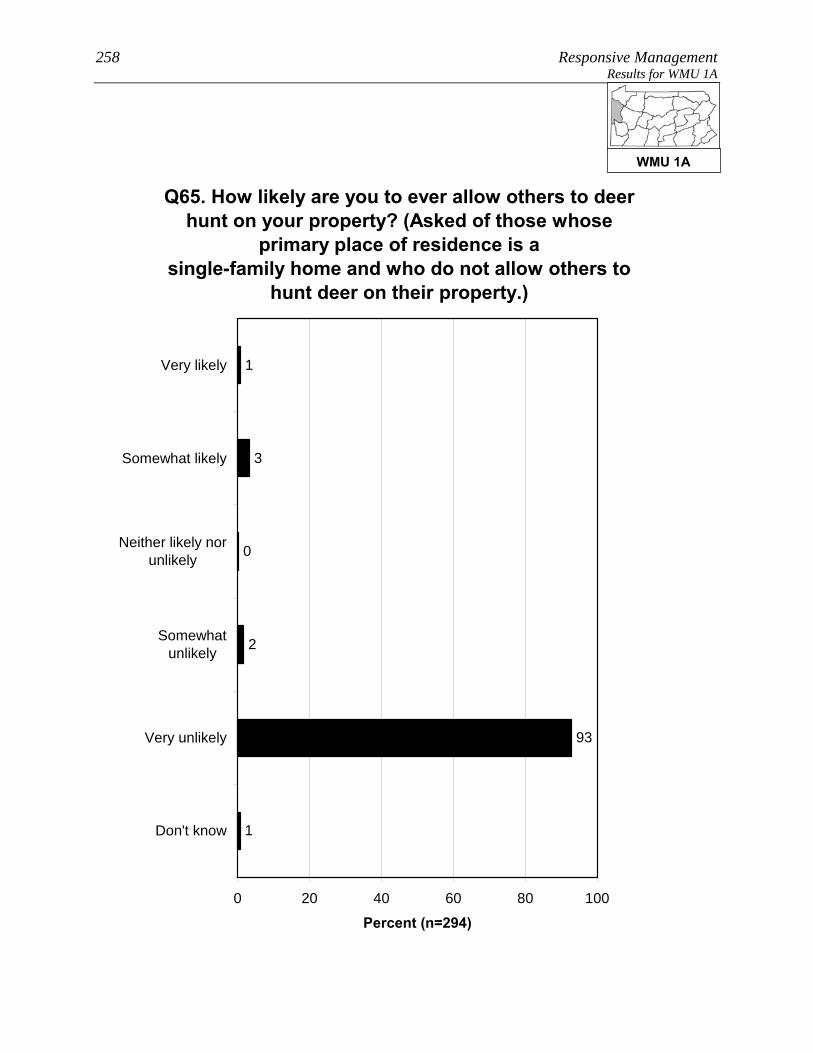
258 Responsive Management Results for WMU 1A
Q65. How likely are you to ever allow others to deer hunt on your property? (Asked of those whose
primary place of residence is a single-family home and who do not allow others to
hunt deer on their property.)
1
93
2
0
3
1
0 20 40 60 80 100
Very likely
Somewhat likely
Neither likely norunlikely
Somewhatunlikely
Very unlikely
Don't know
Percent (n=294)
WMU 1A
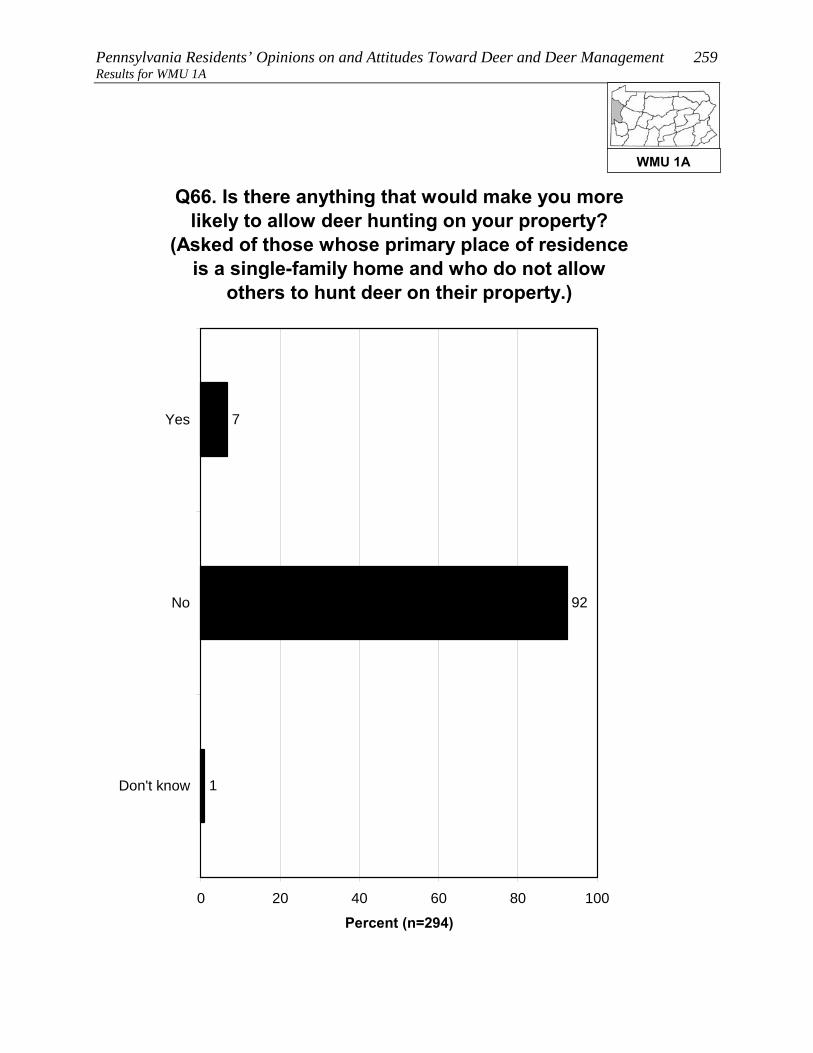
Pennsylvania Residents’ Opinions on and Attitudes Toward Deer and Deer Management 259 Results for WMU 1A
Q66. Is there anything that would make you more likely to allow deer hunting on your property?
(Asked of those whose primary place of residence is a single-family home and who do not allow
others to hunt deer on their property.)
1
92
7
0 20 40 60 80 100
Yes
No
Don't know
Percent (n=294)
WMU 1A

260 Responsive Management Results for WMU 1A
Q65. How likely are you to ever allow others to deer hunt on your property? (Asked of those whose
primary place of residence is a single-family home and who do not allow others to
hunt deer on their property.)
1
94
2
1
0
2
0 20 40 60 80 100
Very likely
Somewhat likely
Neither likely norunlikely
Somewhatunlikely
Very unlikely
Don't know
Percent
Lives in a single family home on 1 acre orless in an urban area, suburban area, or asmall city/town (n=128)
WMU 1A

Pennsylvania Residents’ Opinions on and Attitudes Toward Deer and Deer Management 261 Results for WMU 1A CONCERNS ABOUT DEER AND DEER NUISANCE PROBLEMS
Seven questions asked about respondents’ level of concern about
issues associated with deer. For each issue, respondents rated their
level of concern about it using a 10-point scale, with 10 being the most
concerned.
• The most concern was for tick-borne diseases (mean rating of 7.3), followed by three
whose means are fairly close to one another: deer-vehicle accidents (6.8), the health of
the deer population (6.3), and the quality of deer habitat (5.8).
• At the bottom are concern about deer impacts on habitat and other wildlife (even
though this can be considerable) (3.4) and the two impacts to residents’ landscaping:
deer damage to plants and landscaping (2.6) and deer droppings in the yard (1.7).
o Another graph shows the percentage who gave a high rating (a “9” or “10”),
providing an idea of the percentage who feel strongly about the issues.
Among residents of WMU 1A, 80% indicated that they saw deer on their property in the past
12 months, with 41% saying that they saw deer frequently.
• Respondents who fed birds were more likely to indicate seeing deer, as were
respondents who fed deer or put out attractants or were aware of neighbors who fed
deer or put out attractants.
The survey asked about specific nuisance problems with deer that residents of WMU 1A may
have experienced: 12% indicated that they experienced problems with deer at their primary
place of residence in the past 12 months; 19% indicated that they or another household
member had been in a vehicle collision with a deer (fortunately, a very low portion of
drivers/passengers were injured); and 2% indicated that they or a household member had
been diagnosed with a tick-borne disease.
• Crosstabulations show that those who fed birds were about the same as those who did
not regarding experiencing deer problems. However, those who were aware of
neighbors feeding deer or putting out attractants were more likely to experience deer
problems, compared to those who did not indicate that neighbors had fed deer.
WMU 1A

262 Responsive Management Results for WMU 1A
Q36-Q42. Mean rating of respondents' concern about each of the following on a 10-point scale:
2.6
3.4
5.8
6.3
6.8
7.3
1.7
0 2 4 6 8 10
Q36. Tick-borne diseases, such asLyme disease, in Pennsylvania
Q40. Deer-vehicle accidents inPennsylvania
Q42. The health of the deerpopulation, such as adequate foodresources for the size of the deer
herd, in Pennsylvania
Q41. The quality of deer habitat inPennsylvania
Q39. Deer impacts on the habitat andother wildlife in Pennsylvania
Q38. Deer damage to plants andlandscaping in his/her yard
Q37. Deer droppings in his/her yard
Mean
WMU 1A
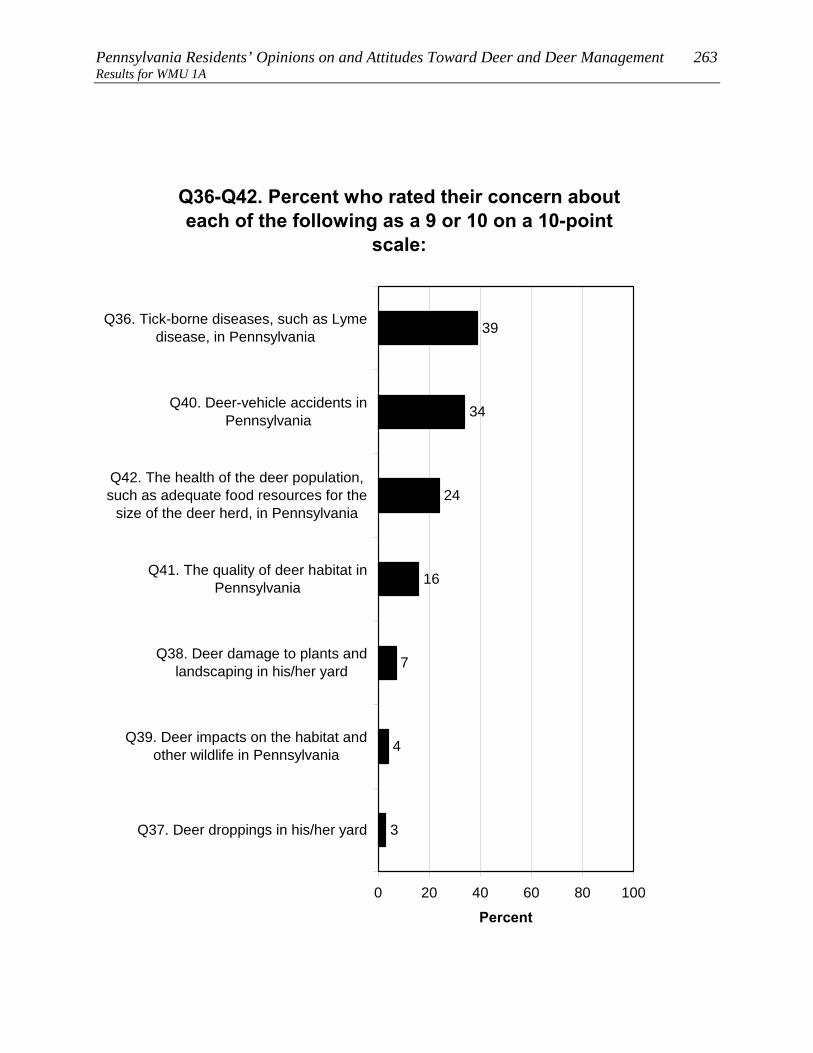
Pennsylvania Residents’ Opinions on and Attitudes Toward Deer and Deer Management 263 Results for WMU 1A
Q36-Q42. Percent who rated their concern about each of the following as a 9 or 10 on a 10-point
scale:
4
7
16
24
34
39
3
0 20 40 60 80 100
Q36. Tick-borne diseases, such as Lymedisease, in Pennsylvania
Q40. Deer-vehicle accidents inPennsylvania
Q42. The health of the deer population,such as adequate food resources for the
size of the deer herd, in Pennsylvania
Q41. The quality of deer habitat inPennsylvania
Q38. Deer damage to plants andlandscaping in his/her yard
Q39. Deer impacts on the habitat andother wildlife in Pennsylvania
Q37. Deer droppings in his/her yard
Percent
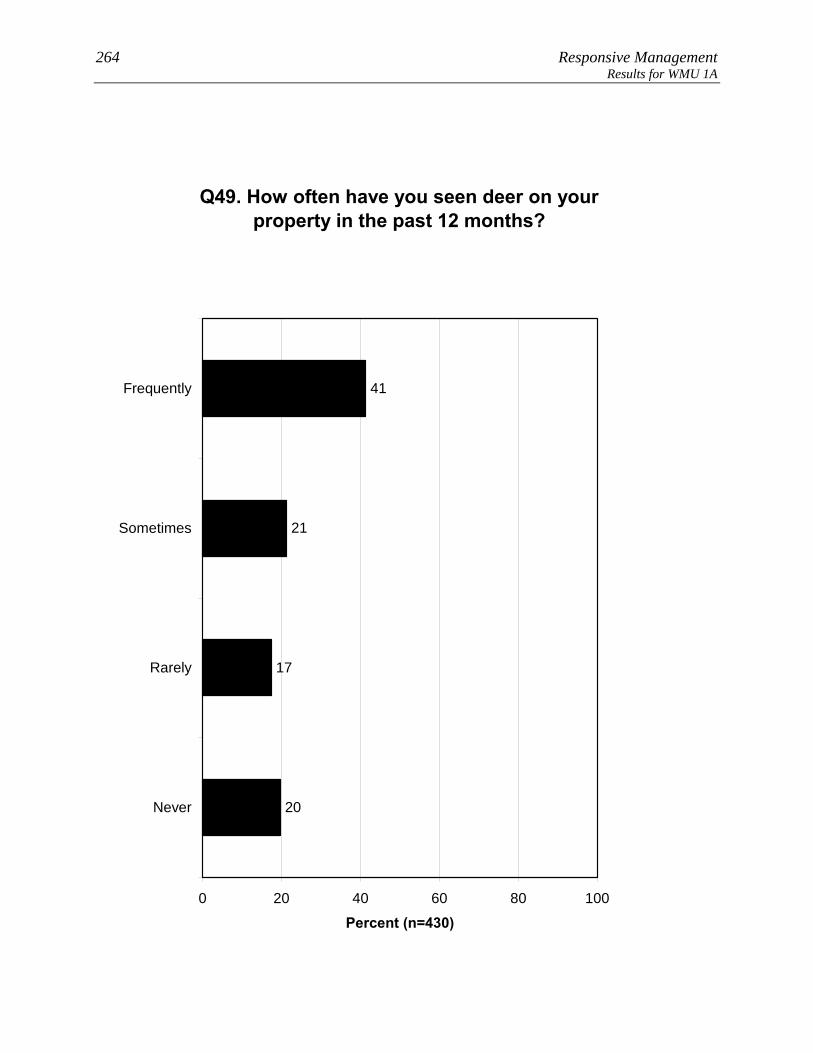
264 Responsive Management Results for WMU 1A
Q49. How often have you seen deer on your property in the past 12 months?
20
17
21
41
0 20 40 60 80 100
Frequently
Sometimes
Rarely
Never
Percent (n=430)

Pennsylvania Residents’ Opinions on and Attitudes Toward Deer and Deer Management 265 Results for WMU 1A
Q49. How often have you seen deer on your property in the past 12 months?
13
18
23
46
27
36
20
17
0 20 40 60 80 100
Frequently
Sometimes
Rarely
Never
Percent
Fed birds on his / herproperty in the past 12months (n=212)
Did not feed birds on his /her property in the past12 months (n=218)
WMU 1A

266 Responsive Management Results for WMU 1A
Q49. How often have you seen deer on your property in the past 12 months?
6
8
23
63
22
38
21
19
0 20 40 60 80 100
Frequently
Sometimes
Rarely
Never
Percent
Has fed deer or put outattractants in the past 12months (n=58)
Has not fed deer or putout attractants in the past12 months (n=371)
WMU 1A

Pennsylvania Residents’ Opinions on and Attitudes Toward Deer and Deer Management 267 Results for WMU 1A
Q49. How often have you seen deer on your property in the past 12 months?
8
9
34
48
22
40
19
19
0 20 40 60 80 100
Frequently
Sometimes
Rarely
Never
Percent
Is aware of neighborsfeeding deer or putting outattractants in the past 12months (n=72)
Is not aware of neighborsfeeding deer or putting outattractants in the past 12months (n=354)
WMU 1A

268 Responsive Management Results for WMU 1A
Q43. In the past 12 months, have you experienced any problems with deer at your primary place of
residence?
88
12
0 20 40 60 80 100
Yes
No
Percent (n=430)
WMU 1A

Pennsylvania Residents’ Opinions on and Attitudes Toward Deer and Deer Management 269 Results for WMU 1A
Q43. In the past 12 months, have you experienced any problems with deer at your primary place of
residence?
90
10
14
86
0 20 40 60 80 100
Yes
No
Percent
Fed birds on his / herproperty in the past 12months (n=212)
Did not feed birds on his /her property in the past12 months (n=218)
WMU 1A

270 Responsive Management Results for WMU 1A
Q43. In the past 12 months, have you experienced any problems with deer at your primary place of
residence?
20
80
90
10
0 20 40 60 80 100
Yes
No
Percent
Is aware of neighborsfeeding deer or putting outattractants in the past 12months (n=72)
Is not aware of neighborsfeeding deer or putting outattractants in the past 12months (n=354)
WMU 1A
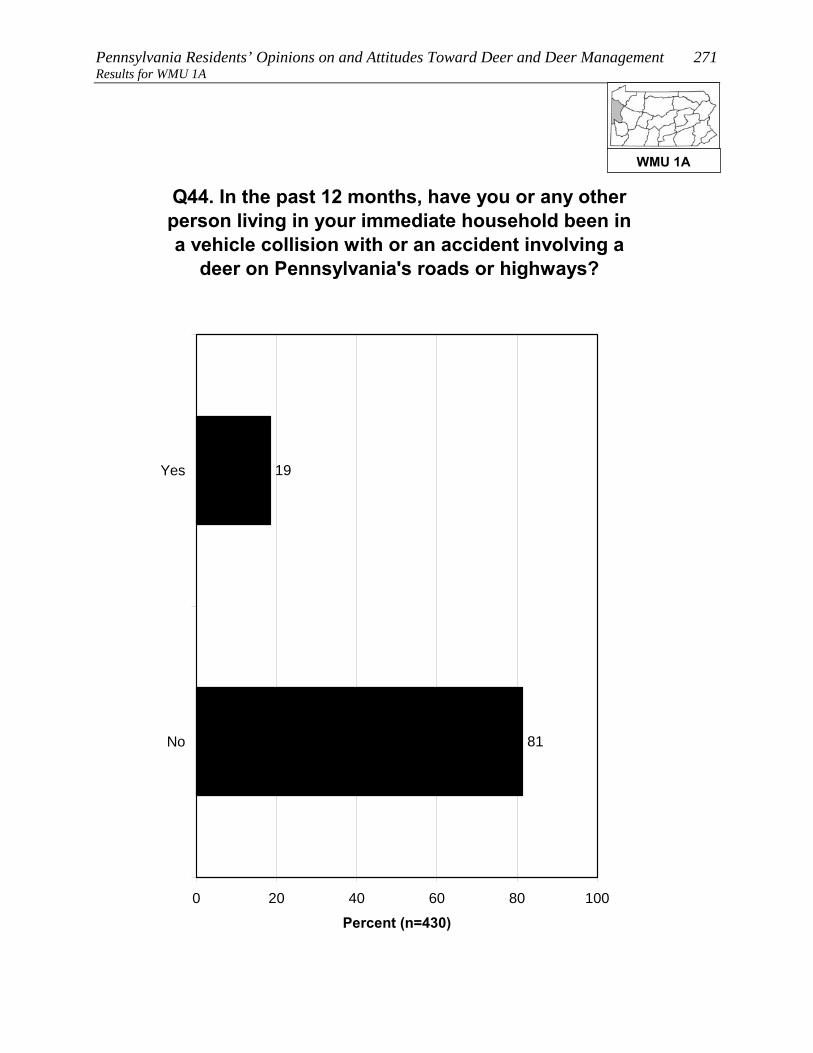
Pennsylvania Residents’ Opinions on and Attitudes Toward Deer and Deer Management 271 Results for WMU 1A
Q44. In the past 12 months, have you or any other person living in your immediate household been in a vehicle collision with or an accident involving a
deer on Pennsylvania's roads or highways?
81
19
0 20 40 60 80 100
Yes
No
Percent (n=430)
WMU 1A

272 Responsive Management Results for WMU 1A
Q45. Were you or anyone else injured? (Asked of those who had a household member who was in or
who have personally been in a vehicle collision with or an accident involving a deer on
Pennsylvania's roads or highways in the past 12 months.)
97
3
0 20 40 60 80 100
Yes
No
Percent (n=78)
WMU 1A

Pennsylvania Residents’ Opinions on and Attitudes Toward Deer and Deer Management 273 Results for WMU 1A
Q46. In the past 12 months, have you or any other person living in your immediate household been
diagnosed by a physician with a tick-borne disease, such as Lyme disease?
98
2
0 20 40 60 80 100
Yes
No
Percent (n=430)
WMU 1A

274 Responsive Management Results for WMU 1A
FEEDING WILDLIFE AND HUNTING DEER Several questions asked about feeding wildlife.
• Feeding deer or putting out deer attractants: 16% of residents of
WMU 1A did this, and 15% are aware of neighbors who did this.
o The most typical feeds or attractants put out by respondents are salt/mineral blocks,
corn, and apples.
• Feeding birds: 53% of residents of WMU 1A did this.
There is no consensus on whether it is okay for private citizens to feed or attract deer in
Pennsylvania: 50% agree that this is okay, but 37% disagree (the rest are neutral).
More than a third of residents of WMU 1A (39%) consider themselves to be a hunter, about
three quarters of whom have a Pennsylvania hunting license.
• Among residents of WMU 1A who live in a single-family home, 18% personally hunt
deer on their property.
• A large majority of residents of WMU 1A (76%) say that they, family members, and/or
friends hunt.
WMU 1A
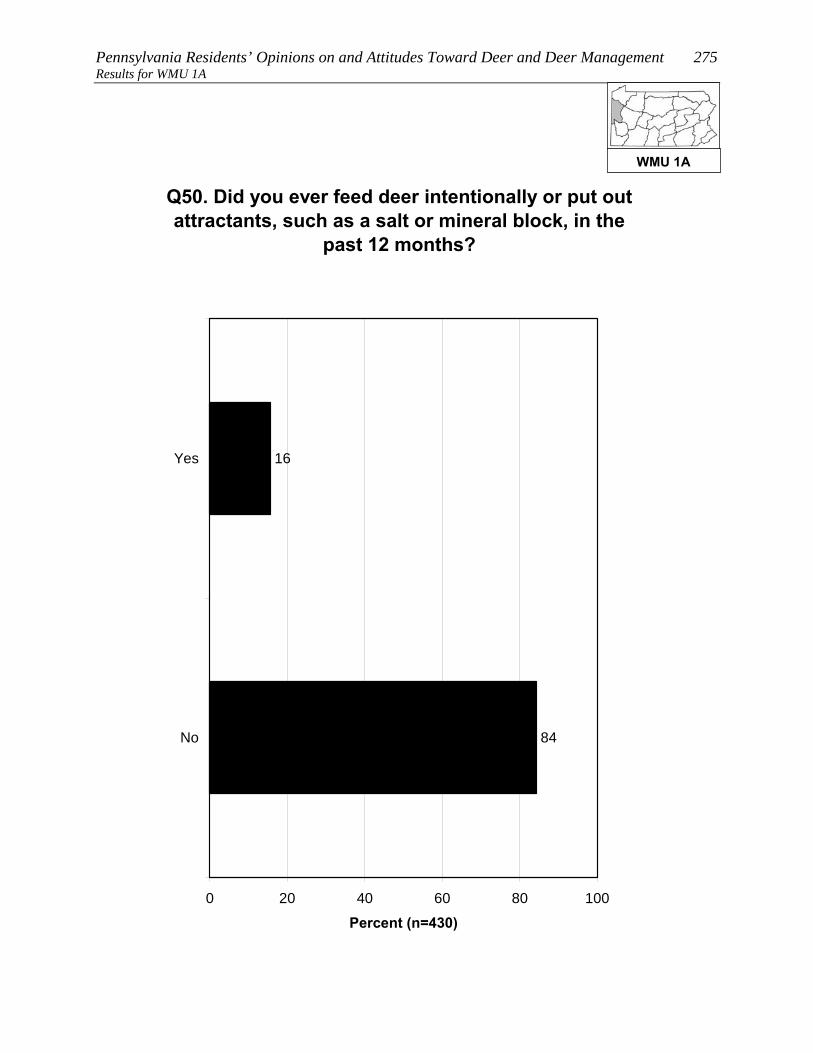
Pennsylvania Residents’ Opinions on and Attitudes Toward Deer and Deer Management 275 Results for WMU 1A
Q50. Did you ever feed deer intentionally or put out attractants, such as a salt or mineral block, in the
past 12 months?
84
16
0 20 40 60 80 100
Yes
No
Percent (n=430)
WMU 1A
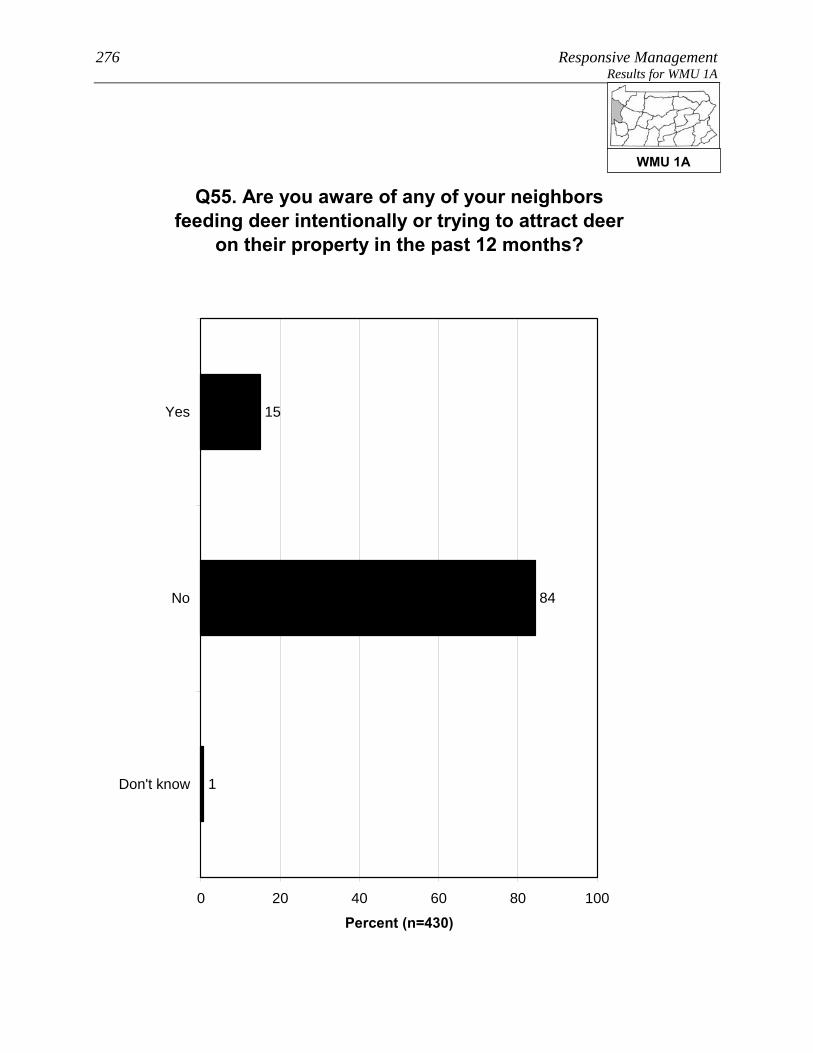
276 Responsive Management Results for WMU 1A
Q55. Are you aware of any of your neighbors feeding deer intentionally or trying to attract deer
on their property in the past 12 months?
1
84
15
0 20 40 60 80 100
Yes
No
Don't know
Percent (n=430)
WMU 1A
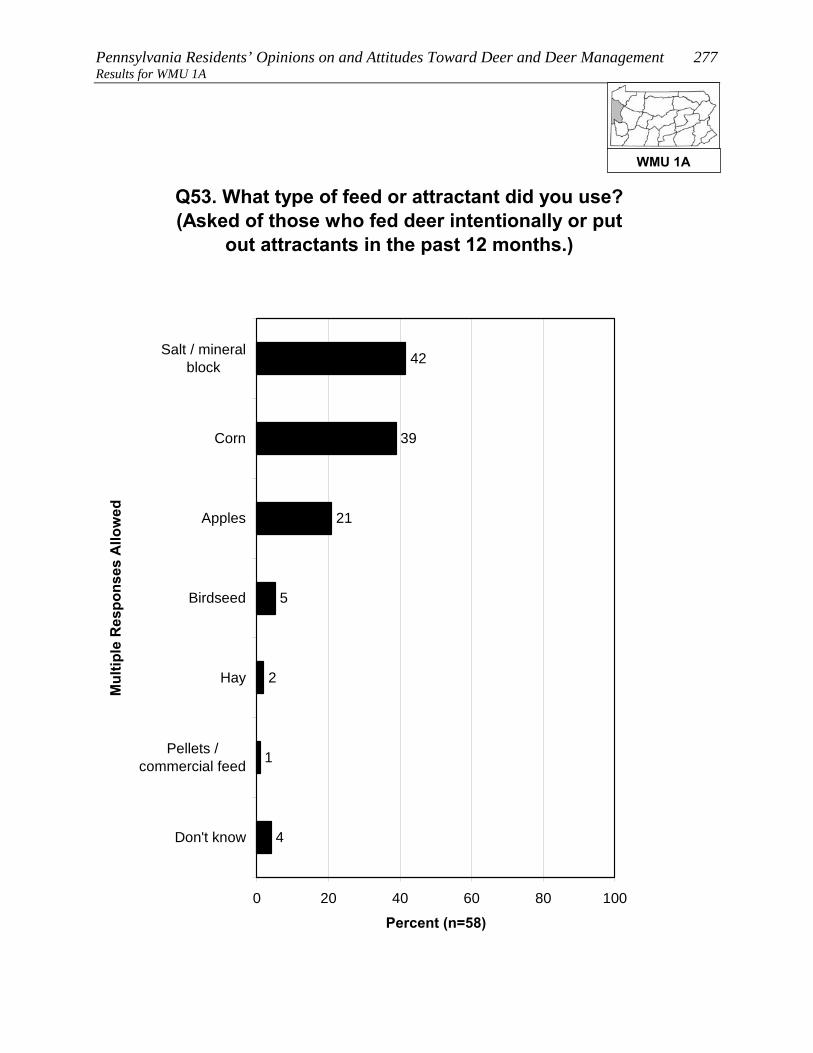
Pennsylvania Residents’ Opinions on and Attitudes Toward Deer and Deer Management 277 Results for WMU 1A
Q53. What type of feed or attractant did you use? (Asked of those who fed deer intentionally or put
out attractants in the past 12 months.)
1
2
5
21
39
42
4
0 20 40 60 80 100
Salt / mineralblock
Corn
Apples
Birdseed
Hay
Pellets /commercial feed
Don't know
Mul
tiple
Res
pons
es A
llow
ed
Percent (n=58)
WMU 1A
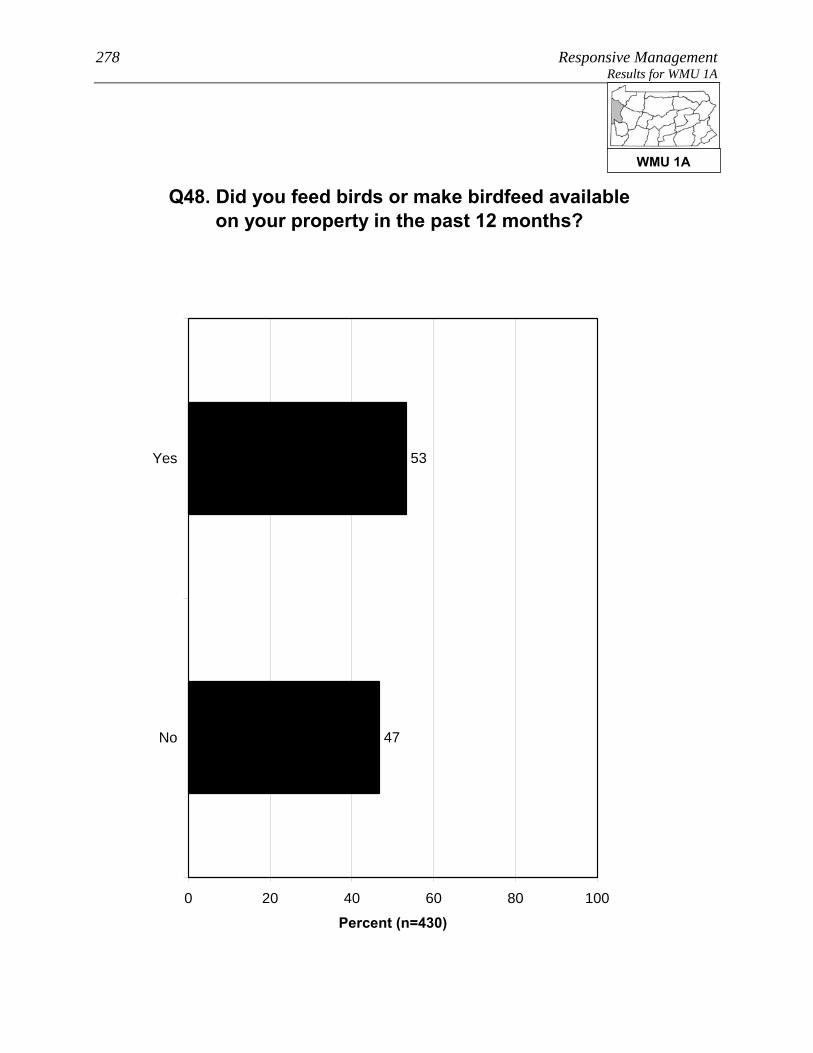
278 Responsive Management Results for WMU 1A
Q48. Did you feed birds or make birdfeed available on your property in the past 12 months?
47
53
0 20 40 60 80 100
Yes
No
Percent (n=430)
WMU 1A

Pennsylvania Residents’ Opinions on and Attitudes Toward Deer and Deer Management 279 Results for WMU 1A
Q56. Do you agree or disagree that it is OK for private citizens to feed or attract deer in
Pennsylvania?
3
26
11
10
22
28
0 20 40 60 80 100
Strongly agree
Moderately agree
Neither agree nordisagree
Moderatelydisagree
Strongly disagree
Don't know
Percent (n=430)
WMU 1AWMU 1A
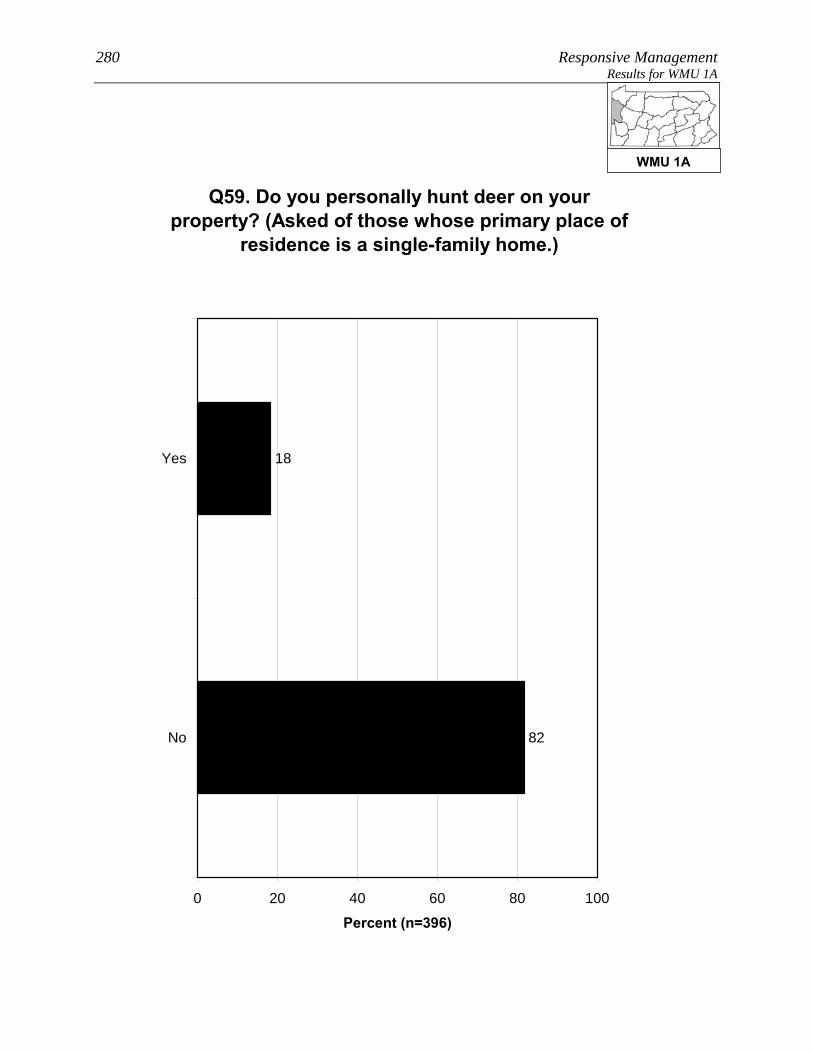
280 Responsive Management Results for WMU 1A
Q59. Do you personally hunt deer on your property? (Asked of those whose primary place of
residence is a single-family home.)
82
18
0 20 40 60 80 100
Yes
No
Percent (n=396)
WMU 1A
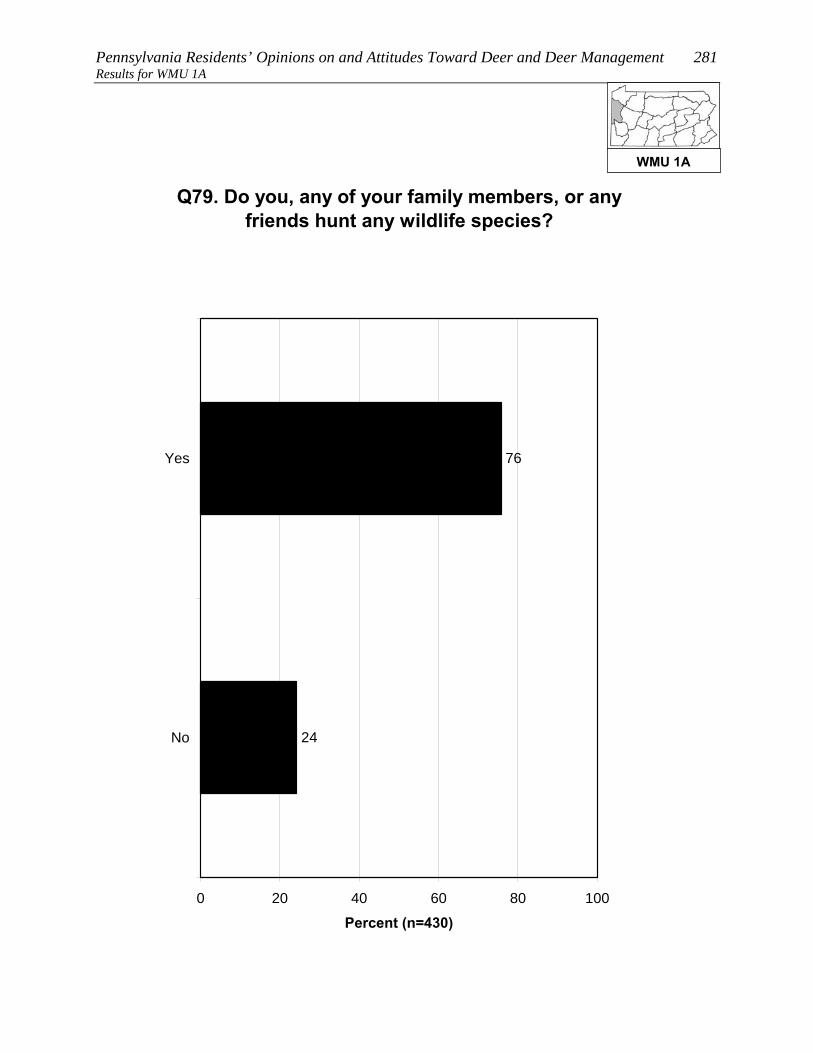
Pennsylvania Residents’ Opinions on and Attitudes Toward Deer and Deer Management 281 Results for WMU 1A
Q79. Do you, any of your family members, or any friends hunt any wildlife species?
24
76
0 20 40 60 80 100
Yes
No
Percent (n=430)
WMU 1A

282 Responsive Management Results for WMU 1A
SOURCES OF INFORMATION Most commonly, residents of WMU 1A say that the best way to
provide them with information about deer in Pennsylvania is through
direct mail (45% gave this response), distantly followed by newspaper
(21%), the Internet (15% saying an Internet site other than the PGC
and 3% saying the agency website; note that some said both), and
email (12%).
Just over a third of residents of WMU 1A (37%) use social media, the most common primary
site being Facebook.
WMU 1A

Pennsylvania Residents’ Opinions on and Attitudes Toward Deer and Deer Management 283 Results for WMU 1A
Q82. What is the best way to provide you with information about deer in Pennsylvania? We are not sending out information at this time; we are
just measuring interest.
1
1
1
1
2
8
9
12
15
21
45
4
3
2
0 20 40 60 80 100
Direct mail
Newspaper
Internet / website other thanPGC website
TV
Magazines
Radio
PA Game Commission website
Brochures or pamphlets
PA Game Commission offices
PA Hunting and Trapping Digest
Social media
Public presentations
Telephone
Mul
tiple
Res
pons
es A
llow
ed
Percent (n=430)
WMU 1A

284 Responsive Management Results for WMU 1A
Q84. Do you use social media, such as Facebook, Twitter, or YouTube?
63
37
0 20 40 60 80 100
Yes
No
Percent (n=430)
WMU 1A

Pennsylvania Residents’ Opinions on and Attitudes Toward Deer and Deer Management 285 Results for WMU 1A
Q85. Which social media site do you use most often? (Asked of those who use social media.)
2
2
9
3
85
0 20 40 60 80 100
YouTube
Other
Don't know
Percent (n=156)
WMU 1A

286 Responsive Management Results for WMU 1B
RESULTS FOR WMU 1B Location: From the New York/PA state line, US Rt. 62 south to US Rt. 6 near Warren; US Rt. 6 west to PA Rt. 27 at Pittsfield; PA Rt. 27 south to PA Rt. 8 at Titusville; PA Rt. 8 south to US Rt. 322 at Franklin; US Rt. 322 west to US Rt. 6 to Conneaut Lake; US Rt. 6 west to the Ohio/PA state line.
8. Lives in WMU 1B 2. Has seen deer frequently on his/her property in the past 12 months (p < 0.05). 3. Has used a spotlight to view deer at night on a trip to watch deer in the past 12 months (p < 0.001). 3. Fed birds or make birdfeed available on his/her property in the past 12 months (p < 0.001). 3. Has spent time viewing or watching deer around home in the past 12 months (p < 0.01). 3. Indicates that he/she or a family member hunts (p < 0.05). 3. Has a valid 2011 PA general hunting license (p < 0.05). 4. Strongly or moderately supports lethal methods to manage deer populations in PA (p < 0.01). 4. Does not strongly or moderately support fertility or birth control as a method of controlling deer populations in PA (p < 0.01). 4. Strongly or moderately supports legal, regulated hunting as a method of controlling deer populations in PA (p < 0.01). 5. Does not indicate that he/she or another person living in the immediate household has been diagnosed by a physician with a tick-borne disease in the past 12 months (p < 0.001). 5. Does not rate concern about tick-borne diseases in PA as a 9 or a 10 (p < 0.05). 5. Indicates that he/she or another person living in the immediate household has been in a vehicle collision with or an accident involving a deer on PA's roads or highways in the past 12 months (p < 0.05). 8. Primary place of residence is not a single-family home (p < 0.001). 8. Has lived at his/her primary place of residence for more than the median number of years (p < 0.01). See page 9 through 11 for explanation of how to interpret z-score tables.
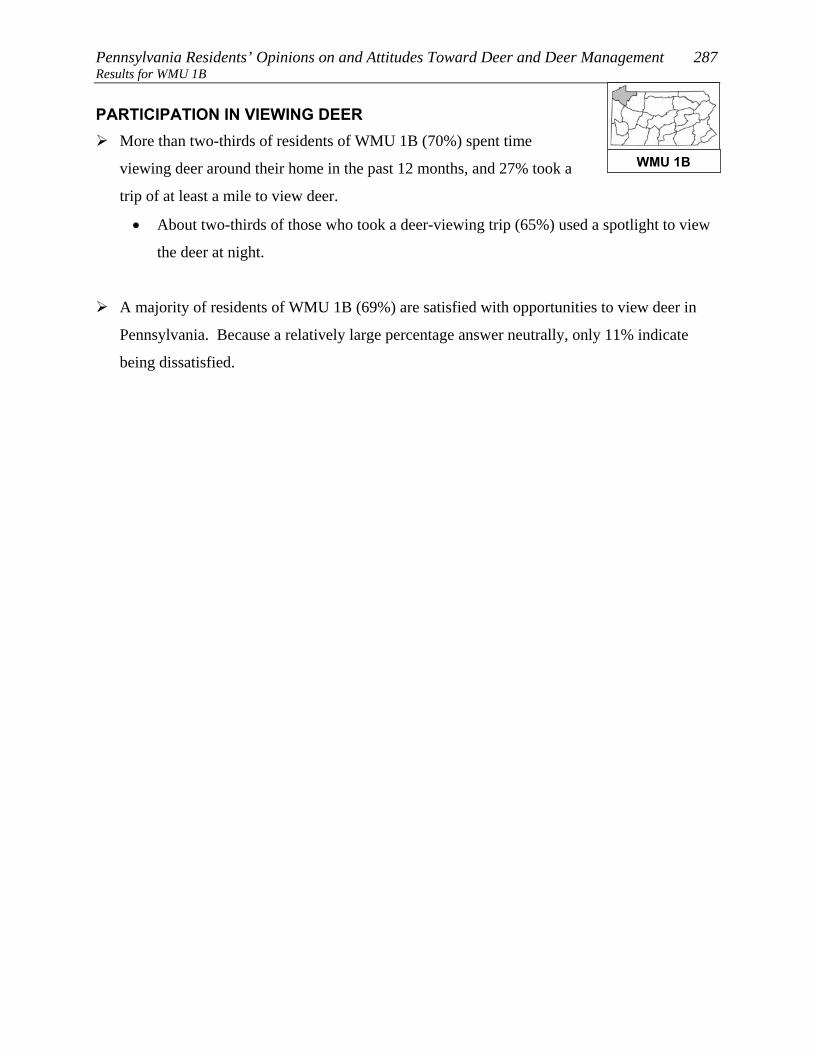
Pennsylvania Residents’ Opinions on and Attitudes Toward Deer and Deer Management 287 Results for WMU 1B PARTICIPATION IN VIEWING DEER
More than two-thirds of residents of WMU 1B (70%) spent time
viewing deer around their home in the past 12 months, and 27% took a
trip of at least a mile to view deer.
• About two-thirds of those who took a deer-viewing trip (65%) used a spotlight to view
the deer at night.
A majority of residents of WMU 1B (69%) are satisfied with opportunities to view deer in
Pennsylvania. Because a relatively large percentage answer neutrally, only 11% indicate
being dissatisfied.
WMU 1B
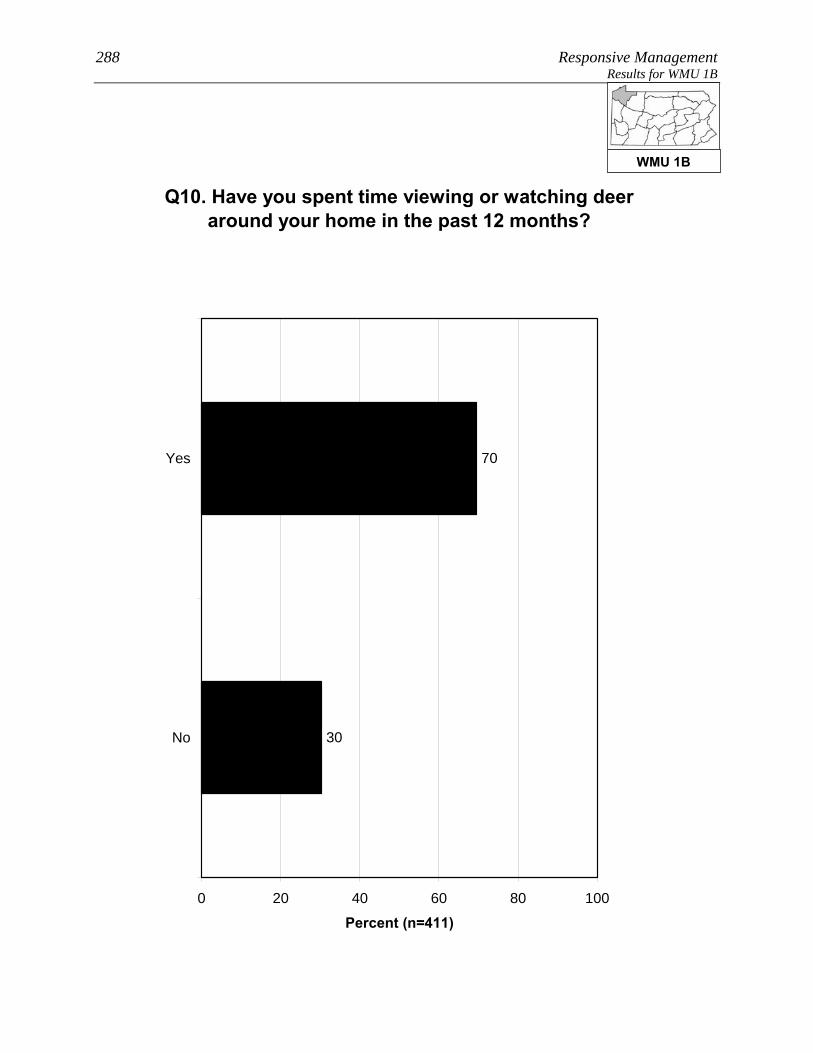
288 Responsive Management Results for WMU 1B
Q10. Have you spent time viewing or watching deer around your home in the past 12 months?
30
70
0 20 40 60 80 100
Yes
No
Percent (n=411)
WMU 1B
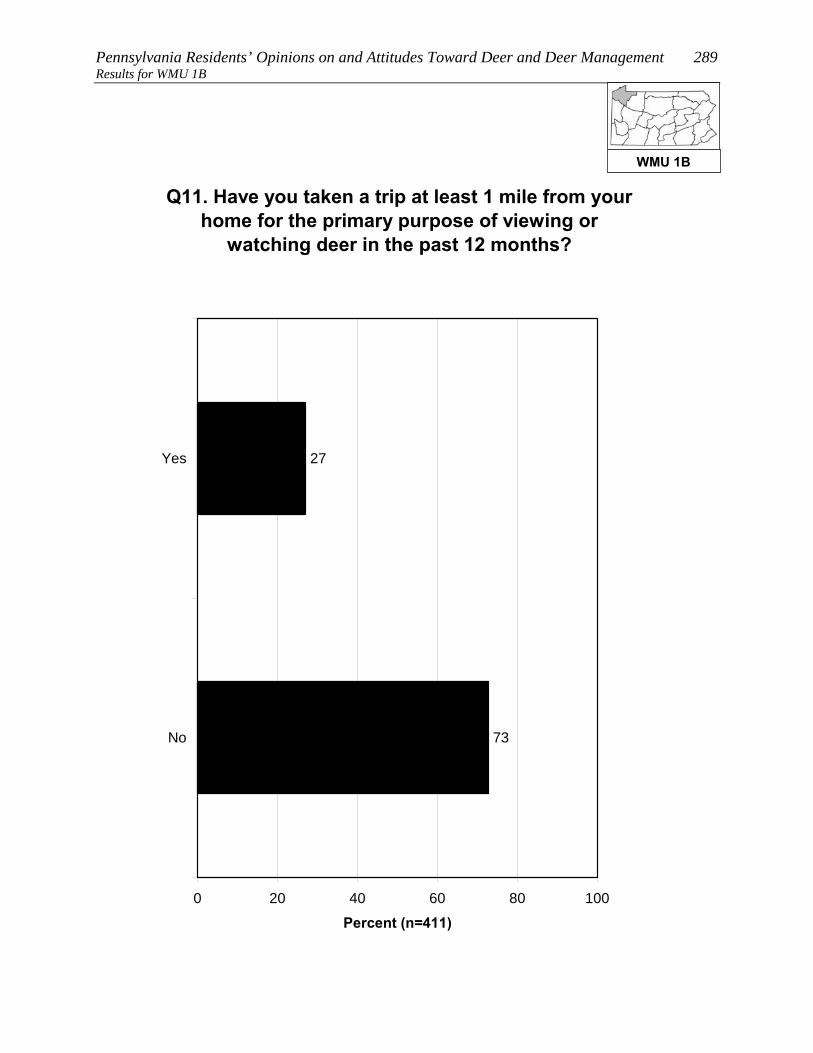
Pennsylvania Residents’ Opinions on and Attitudes Toward Deer and Deer Management 289 Results for WMU 1B
Q11. Have you taken a trip at least 1 mile from your home for the primary purpose of viewing or
watching deer in the past 12 months?
73
27
0 20 40 60 80 100
Yes
No
Percent (n=411)
WMU 1B
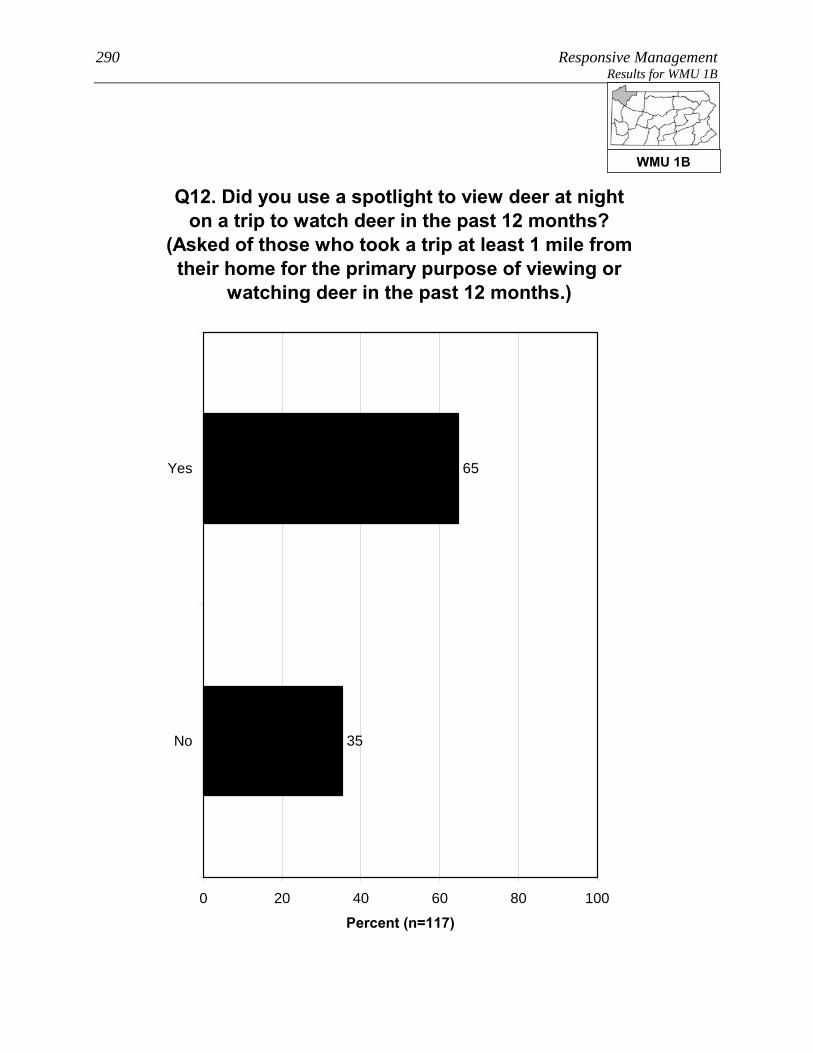
290 Responsive Management Results for WMU 1B
Q12. Did you use a spotlight to view deer at night on a trip to watch deer in the past 12 months?
(Asked of those who took a trip at least 1 mile from their home for the primary purpose of viewing or
watching deer in the past 12 months.)
35
65
0 20 40 60 80 100
Yes
No
Percent (n=117)
WMU 1B

Pennsylvania Residents’ Opinions on and Attitudes Toward Deer and Deer Management 291 Results for WMU 1B
Q13. How satisfied are you with opportunities to view or watch deer in Pennsylvania?
2
6
5
17
28
41
0 20 40 60 80 100
Very satisfied
Somewhatsatisfied
Neither satisfiednor dissatisfied
Somewhatdissatisfied
Very dissatisfied
Don't know
Percent (n=411)
WMU 1B

292 Responsive Management Results for WMU 1B
OPINIONS ON DEER IN GENERAL AND THE SIZE AND HEALTH OF THE DEER HERD
Opinion on deer is mostly favorable: 58% of residents of WMU 1B
say with no caveats that they like having deer around, another 28%
like having deer around but worry about the problems they may cause,
and only 5% generally regard them as a nuisance. The remainder have
no particular feeling about deer.
Another question asked residents of WMU 1B how deer-related issues compared to other
issues in their life, on a scale of 0 to 10, with the most importance being 10: the median
rating is “5.” The most common ratings are the midpoint of “5” (21%) and “0” (14%). In
general, ratings are well spread across the scale.
Two other ratings questions asked respondents to rate their concern about deer-related issues.
The median level of concern is “6” for the quality of deer habitat in Pennsylvania and “7” for
the health of the deer population in Pennsylvania.
The survey asked about the perceived size of the deer herd in the respondent’s area. The
majority of residents of WMU 1B say that the herd size is just right (56%); otherwise, more
say that it is too low (26%) than too high (11%).
• Those who own their home in WMU 1B are more likely, compared to those who do not
own their home, to say that the deer population in their area is too low.
• Those who consider themselves to be a hunter are much more likely to say that the deer
population in their area is too low, compared to those who are not hunters.
WMU 1B

Pennsylvania Residents’ Opinions on and Attitudes Toward Deer and Deer Management 293 Results for WMU 1B
Q14. Generally, which of the following best describes your feelings about deer in
Pennsylvania?
1
9
5
28
58
0 20 40 60 80 100
I like having deeraround
I like having deeraround but worryabout problems
they cause
I generally regarddeer as anuisance
I have noparticular feeling
about deer
Don't know
Percent (n=411)
WMU 1B
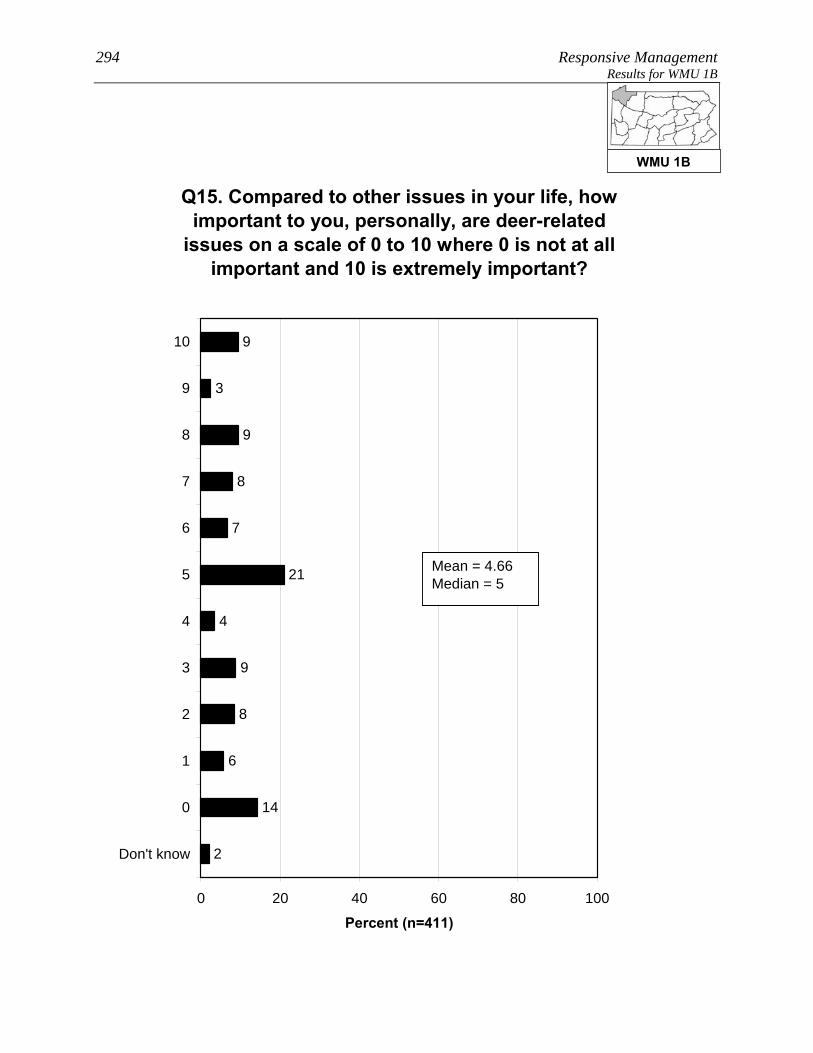
294 Responsive Management Results for WMU 1B
Q15. Compared to other issues in your life, how important to you, personally, are deer-related
issues on a scale of 0 to 10 where 0 is not at all important and 10 is extremely important?
2
14
6
21
7
8
9
3
9
4
9
8
0 20 40 60 80 100
10
9
8
7
6
5
4
3
2
1
0
Don't know
Percent (n=411)
Mean = 4.66Median = 5
WMU 1B
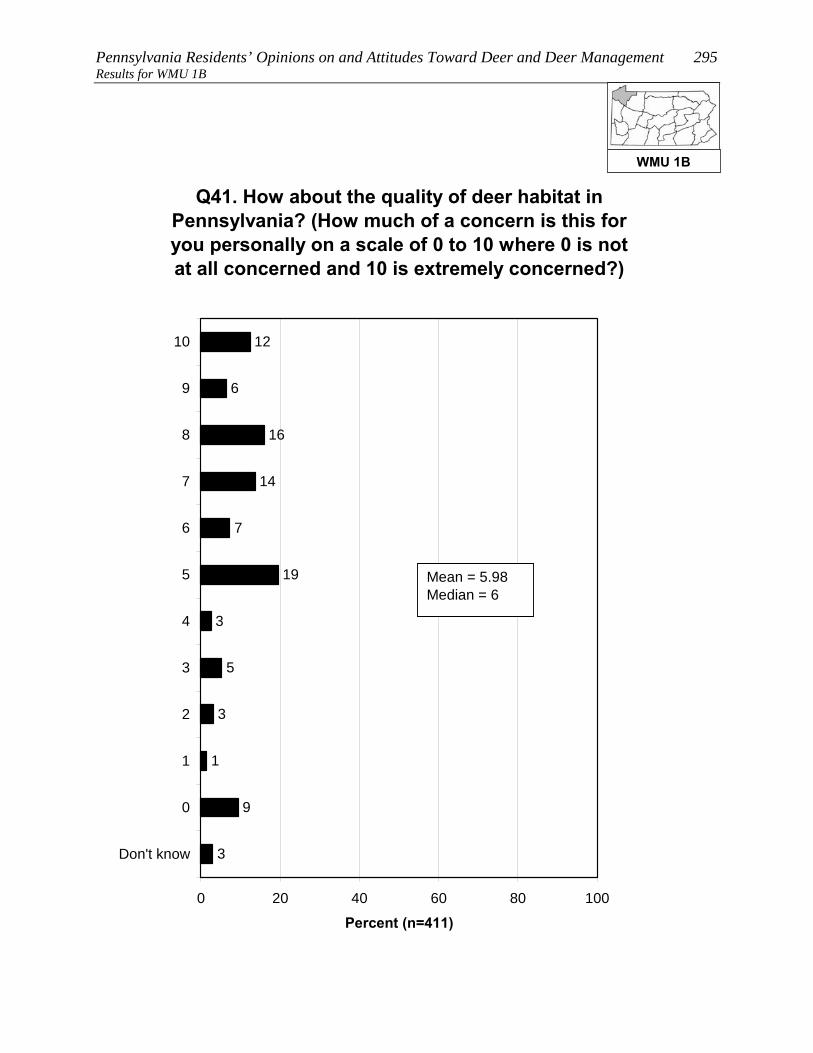
Pennsylvania Residents’ Opinions on and Attitudes Toward Deer and Deer Management 295 Results for WMU 1B
Q41. How about the quality of deer habitat in Pennsylvania? (How much of a concern is this for you personally on a scale of 0 to 10 where 0 is not at all concerned and 10 is extremely concerned?)
3
9
1
19
7
14
16
6
12
3
5
3
0 20 40 60 80 100
10
9
8
7
6
5
4
3
2
1
0
Don't know
Percent (n=411)
Mean = 5.98Median = 6
WMU 1B
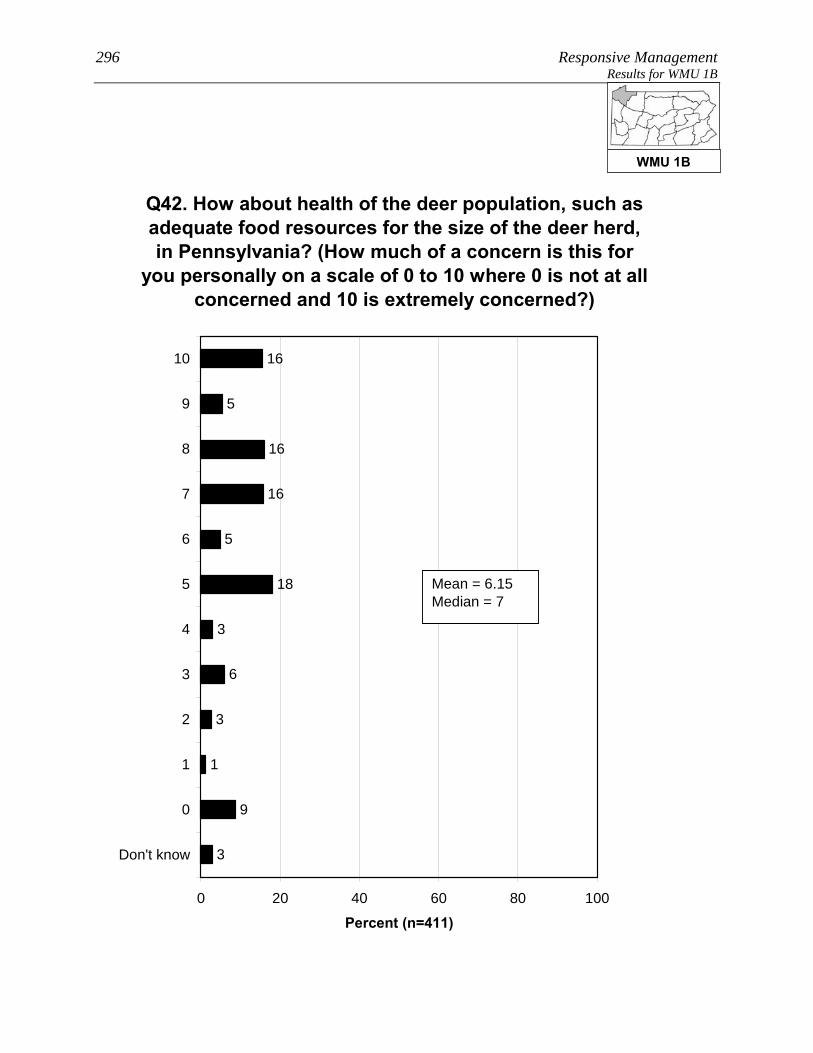
296 Responsive Management Results for WMU 1B
3
9
1
18
5
16
16
5
16
3
6
3
0 20 40 60 80 100
10
9
8
7
6
5
4
3
2
1
0
Don't know
Percent (n=411)
Q42. How about health of the deer population, such as adequate food resources for the size of the deer herd, in Pennsylvania? (How much of a concern is this for
you personally on a scale of 0 to 10 where 0 is not at all concerned and 10 is extremely concerned?)
Mean = 6.15Median = 7
WMU 1B

Pennsylvania Residents’ Opinions on and Attitudes Toward Deer and Deer Management 297 Results for WMU 1B
Q16. In your opinion, is the deer population in the area where you live too high, just right, or too low?
8
26
56
11
0 20 40 60 80 100
Too high
Just right
Too low
Don't know
Percent (n=411)
WMU 1B

298 Responsive Management Results for WMU 1B
Q16. In your opinion, is the deer population in the area where you live too high, just right, or too low?
7
27
55
11
8
12
63
17
0 20 40 60 80 100
Too high
Just right
Too low
Don't know
Percent
Owns home (n=361)Does not own home (n=28)
WMU 1B
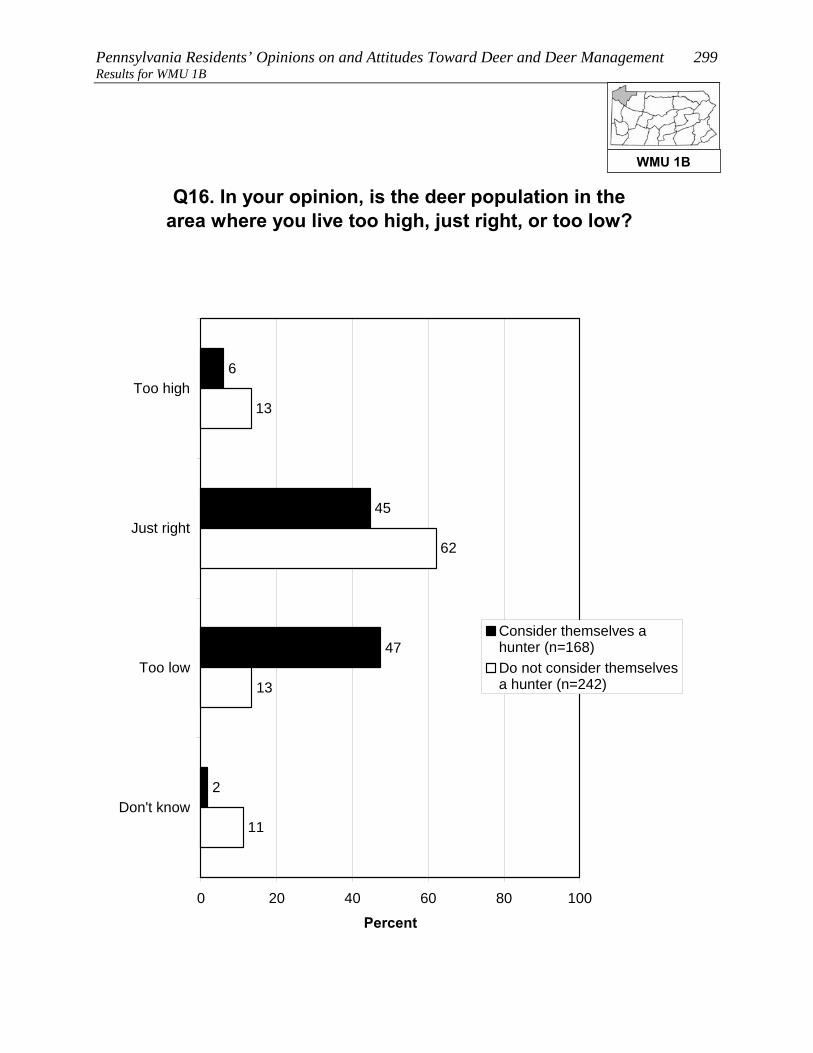
Pennsylvania Residents’ Opinions on and Attitudes Toward Deer and Deer Management 299 Results for WMU 1B
Q16. In your opinion, is the deer population in the area where you live too high, just right, or too low?
2
47
45
6
11
13
62
13
0 20 40 60 80 100
Too high
Just right
Too low
Don't know
Percent
Consider themselves ahunter (n=168)Do not consider themselvesa hunter (n=242)
WMU 1B

300 Responsive Management Results for WMU 1B
OPINIONS ON MANAGEMENT EFFORTS AND MANAGEMENT GOALS
The survey asked about three deer population management goals. For
all three, a large majority agree with the management goal, but the
most support is for goals that address ecological concerns rather than
human concerns: 92% agree with managing for healthy and
sustainable deer populations, 89% agree with managing the deer for a
healthy and sustainable forest habitat, and 83% agree with managing
for safe, acceptable levels of deer-human conflicts.
Residents of WMU 1B who said that the deer population in their area is too high or too low
were asked to indicate the reasonable number of years it should take to achieve an acceptable
deer population. The mean amount is 3.93 years. While 38% said that they do not know,
nearly all the rest gave a number of years of 10 or less. Note that this is only among those
who said the deer population was too high or too low.
• Because management plans typically look at a time frame of about 10 years to effect
change, the survey specifically asked if these respondents would be willing to wait
more than 10 years to achieve an acceptable deer population: a majority (55%)
indicated that they would be willing to wait that long.
WMU 1B
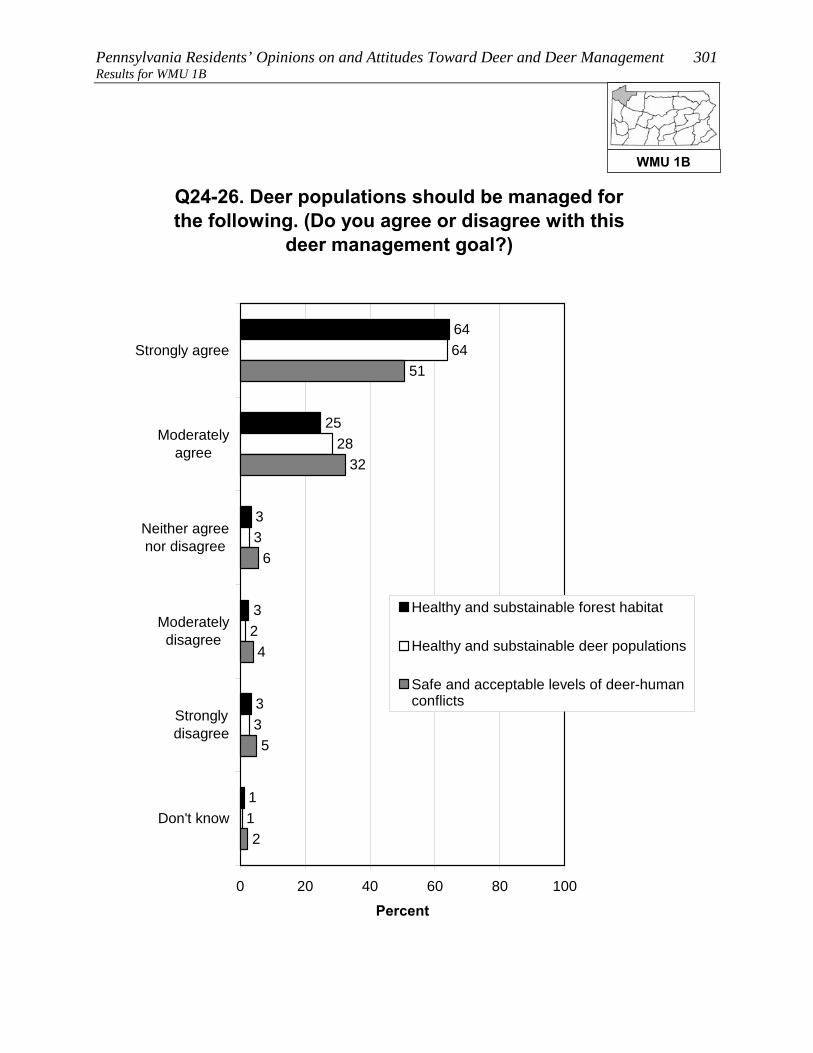
Pennsylvania Residents’ Opinions on and Attitudes Toward Deer and Deer Management 301 Results for WMU 1B
Q24-26. Deer populations should be managed for the following. (Do you agree or disagree with this
deer management goal?)
64
28
3
2
3
1
5
2
1
3
3
3
25
64
6
32
51
4
0 20 40 60 80 100
Strongly agree
Moderatelyagree
Neither agreenor disagree
Moderatelydisagree
Stronglydisagree
Don't know
Percent
Healthy and substainable forest habitat
Healthy and substainable deer populations
Safe and acceptable levels of deer-humanconflicts
WMU 1B
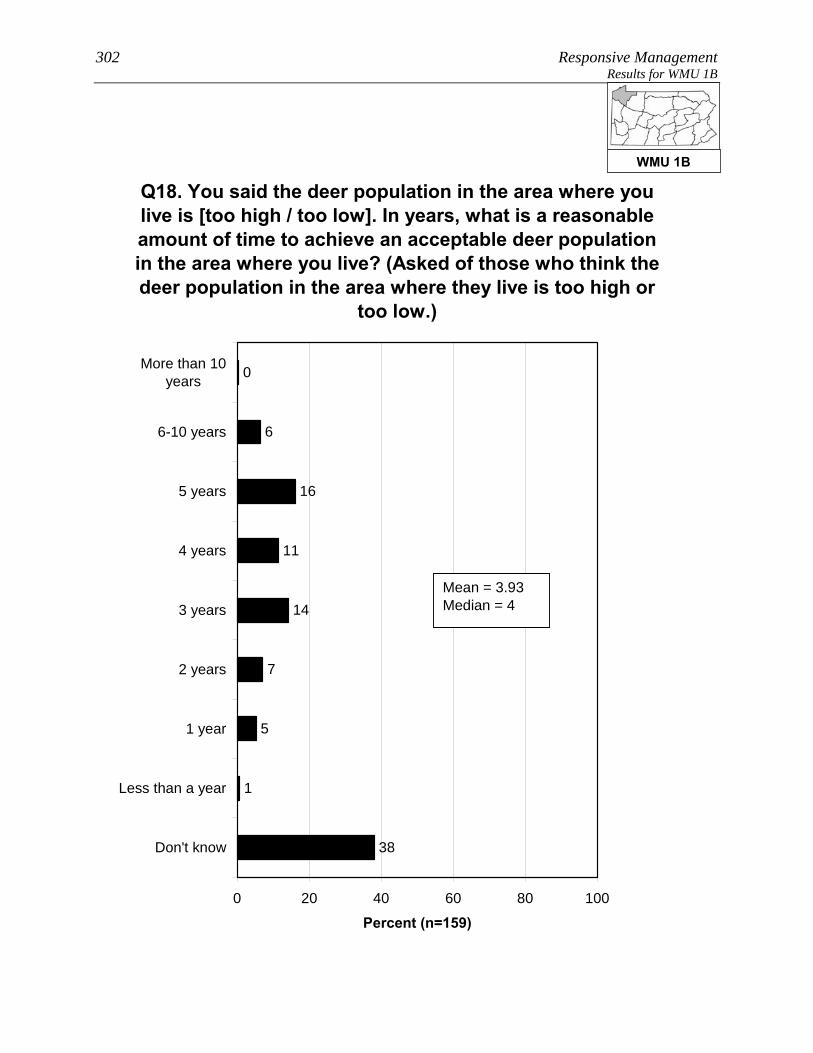
302 Responsive Management Results for WMU 1B
7
14
11
16
6
0
5
1
38
0 20 40 60 80 100
More than 10years
6-10 years
5 years
4 years
3 years
2 years
1 year
Less than a year
Don't know
Percent (n=159)
Q18. You said the deer population in the area where you live is [too high / too low]. In years, what is a reasonable amount of time to achieve an acceptable deer population in the area where you live? (Asked of those who think the deer population in the area where they live is too high or
too low.)
Mean = 3.93Median = 4
WMU 1B
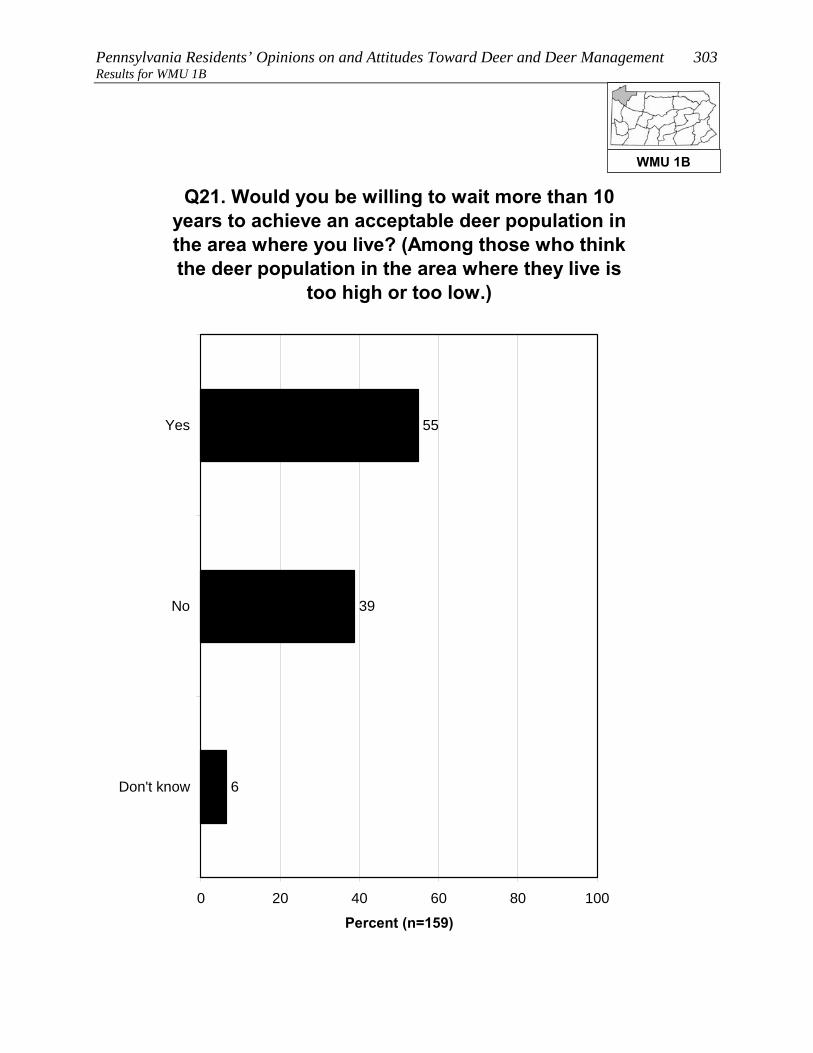
Pennsylvania Residents’ Opinions on and Attitudes Toward Deer and Deer Management 303 Results for WMU 1B
Q21. Would you be willing to wait more than 10 years to achieve an acceptable deer population in the area where you live? (Among those who think the deer population in the area where they live is
too high or too low.)
6
39
55
0 20 40 60 80 100
Yes
No
Don't know
Percent (n=159)
WMU 1B

304 Responsive Management Results for WMU 1B
OPINIONS ON METHODS FOR MANAGING DEER, INCLUDING HUNTING
A large majority of residents of WMU 1B (70%) support lethal
methods to manage deer populations in Pennsylvania; nonetheless,
21% oppose, mostly strong opposition.
• Those residents of WMU 1B who live in a single-family home and own their home are
much more likely to strongly support lethal methods, compared to those who live in a
single-family home but do not own their home.
• The survey asked about four methods of controlling deer populations (three of them
lethal). The most support is for legal, regulated hunting (94% of respondents support
this method), distantly followed by fertility/birth control (34%), trapping and killing
(30%), and professionals or sharpshooters (28%).
Two questions asked respondents about hunting on their land (among those who live in a
single-family home), the first question about hunting by the respondents themselves (21% do
so) and the second regarding allowing others to hunt on their land (39% do so). In
combining the results, 41% of residents of WMU 1B who live in a single-family home either
hunt on their own land or allow others to do so (it is not simply a sum of the two questions
because some hunt on their property and allow others to do so as well).
• There was interest in seeing how a particular subgroup responded on this question, the
subgroup being those who live in a single-family home; who live on 1 acre or less; and
who live in an urban, suburban area, or a small city/town. Among this subgroup, 9%
either hunt on their own property or allow others to hunt on the property.
• Those respondents who do not allow hunting on their property were asked to indicate
why they prohibit it. The most common reasons are that their property is too small
and/or that they live in an urban or suburban area in which hunting is not possible or
feasible. Other minor reasons are concerns about safety and a general opposition to
hunting.
• Those same respondents who do not allow hunting on their property were asked about
their likelihood of ever allowing others to hunt deer on their property; they
overwhelmingly say this is very unlikely (89%). They were then asked if there is
WMU 1B

Pennsylvania Residents’ Opinions on and Attitudes Toward Deer and Deer Management 305 Results for WMU 1B
anything that would make them more likely to allow deer hunting;
they are almost unanimous (96%) in saying that there is nothing
that would make them more likely to allow deer hunting.
• The question about allowing others to hunt on their property was examined among the
subgroup previously discussed (those who live in a single-family home; who live on 1
acre or less; and who live in an urban, suburban area, or a small city/town). Among
this group who got the question, nearly all say that they would never allow hunting.
o Additional follow-up questions to be asked of those who indicated that something
might prompt them to allow hunting on their property did not have enough
respondents for statistical validity; therefore, they are not shown.
WMU 1B
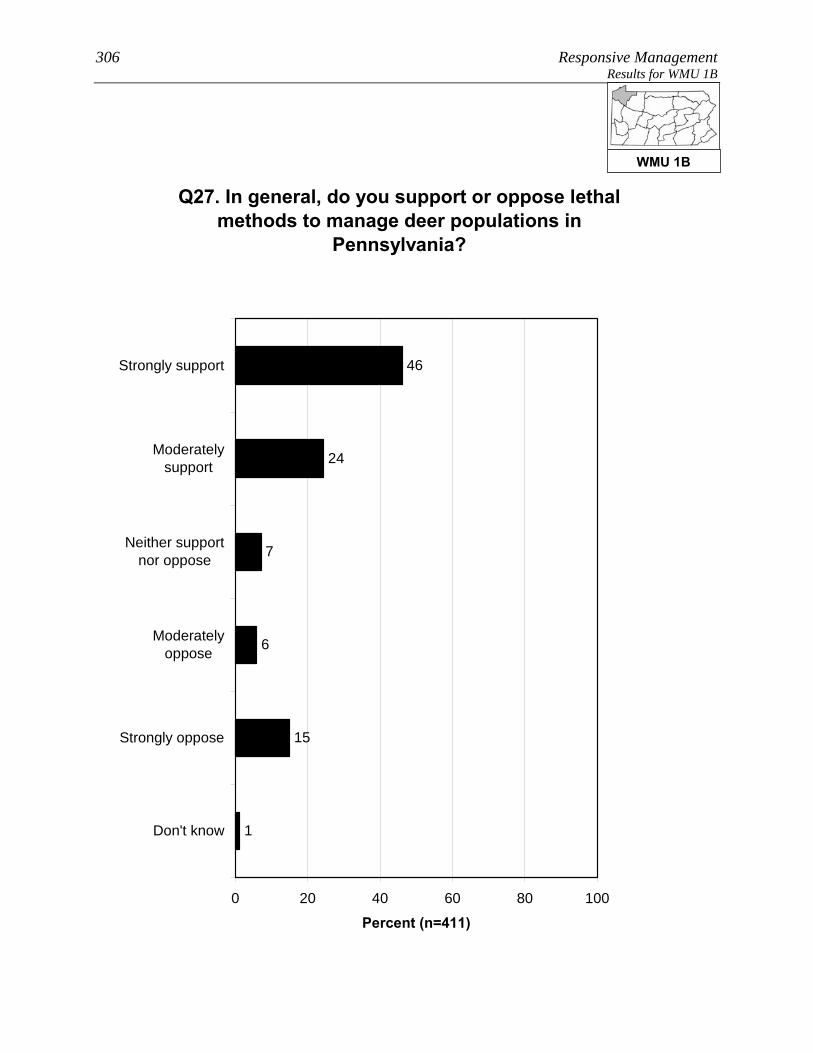
306 Responsive Management Results for WMU 1B
Q27. In general, do you support or oppose lethal methods to manage deer populations in
Pennsylvania?
1
15
6
7
24
46
0 20 40 60 80 100
Strongly support
Moderatelysupport
Neither supportnor oppose
Moderatelyoppose
Strongly oppose
Don't know
Percent (n=411)
WMU 1B
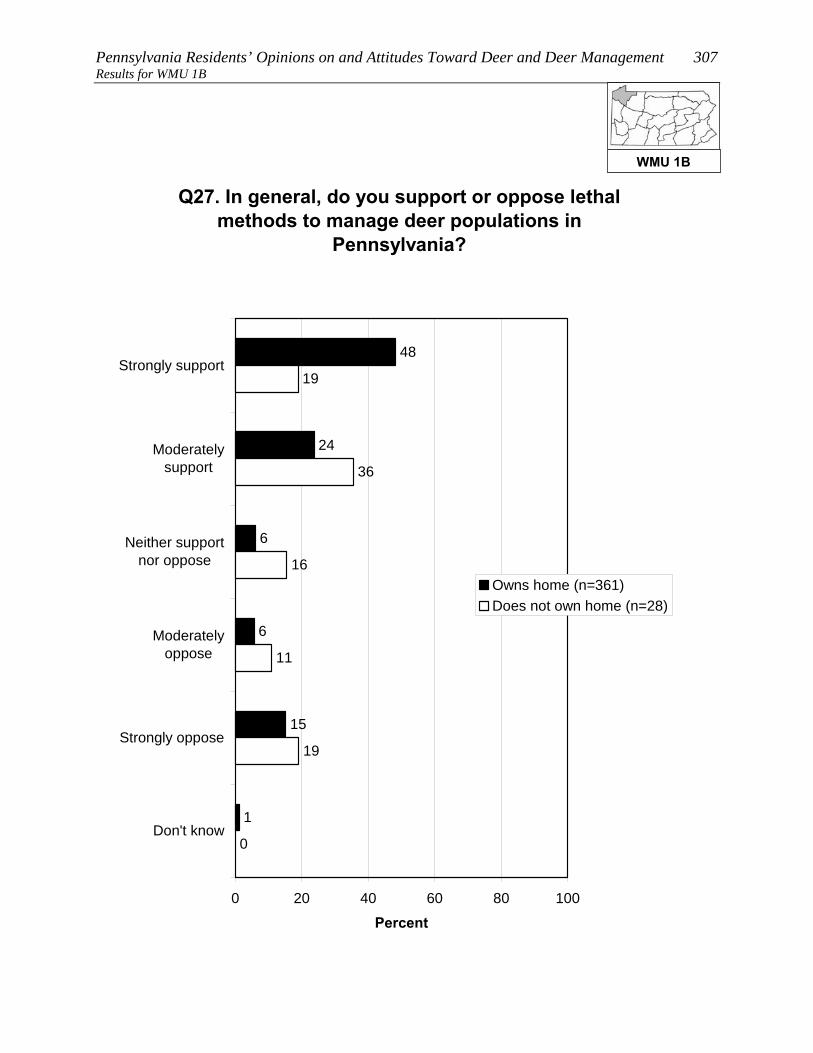
Pennsylvania Residents’ Opinions on and Attitudes Toward Deer and Deer Management 307 Results for WMU 1B
Q27. In general, do you support or oppose lethal methods to manage deer populations in
Pennsylvania?
1
15
6
6
24
48
0
19
11
19
36
16
0 20 40 60 80 100
Strongly support
Moderatelysupport
Neither supportnor oppose
Moderatelyoppose
Strongly oppose
Don't know
Percent
Owns home (n=361)Does not own home (n=28)
WMU 1B
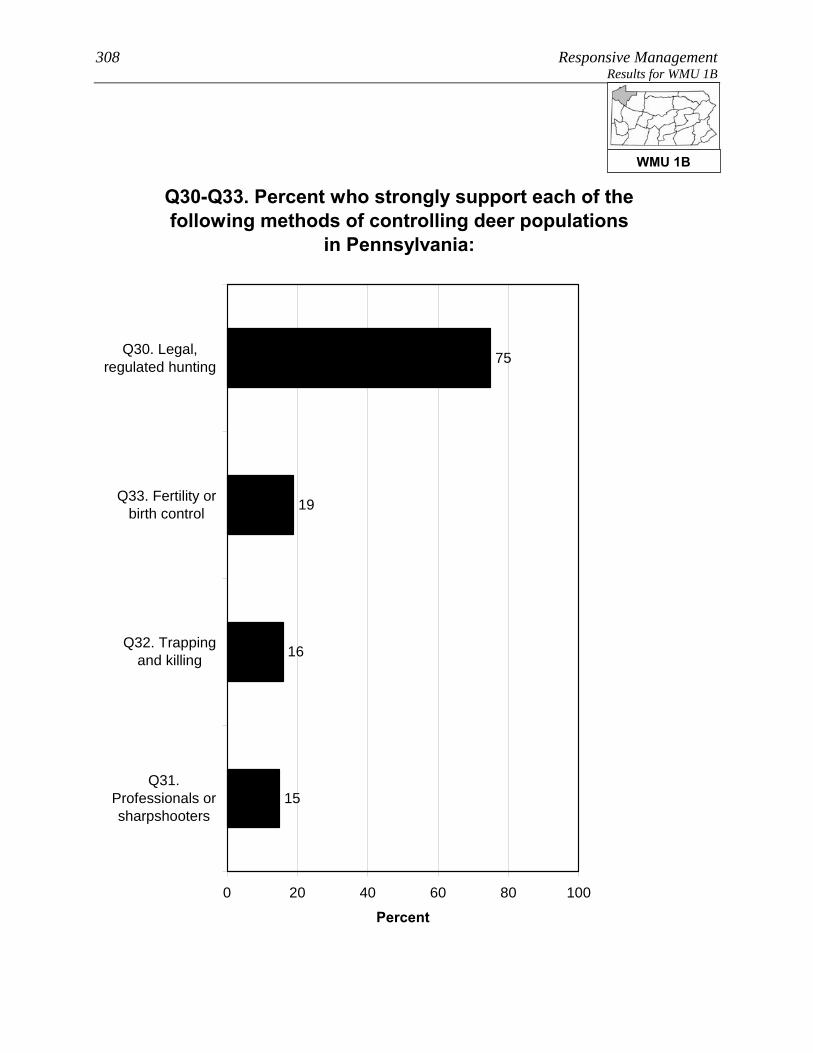
308 Responsive Management Results for WMU 1B
Q30-Q33. Percent who strongly support each of the following methods of controlling deer populations
in Pennsylvania:
15
16
19
75
0 20 40 60 80 100
Q30. Legal,regulated hunting
Q33. Fertility orbirth control
Q32. Trappingand killing
Q31.Professionals orsharpshooters
Percent
WMU 1B
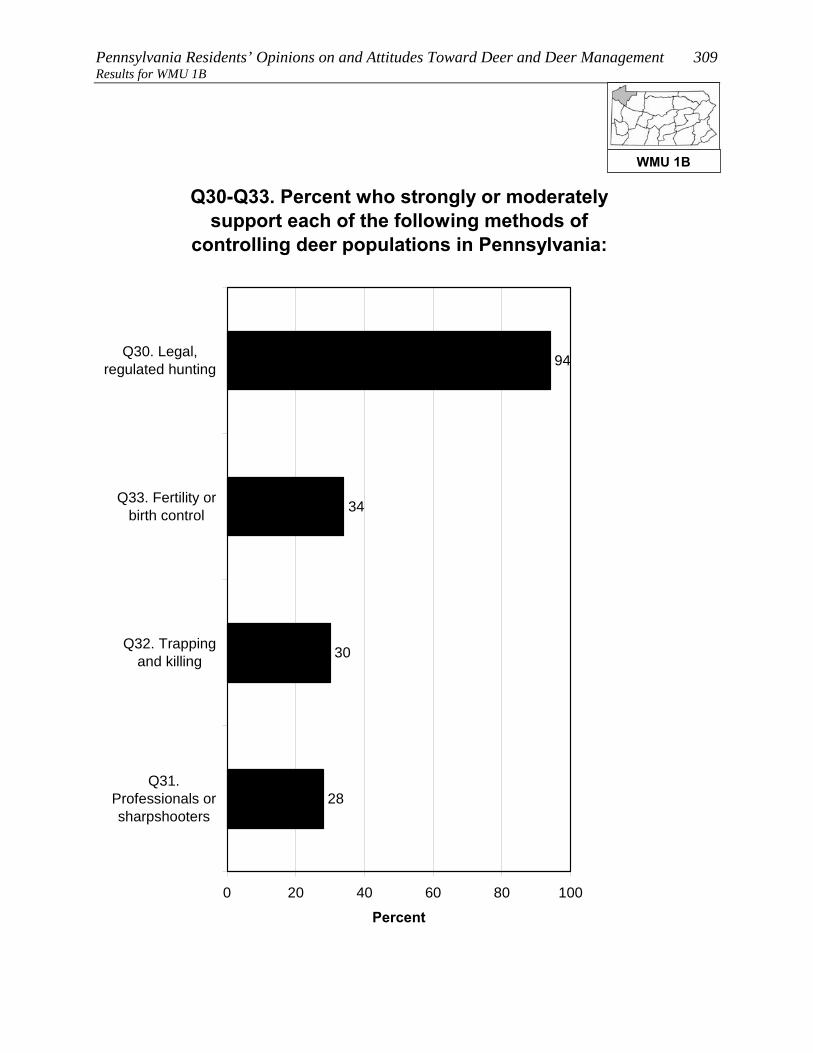
Pennsylvania Residents’ Opinions on and Attitudes Toward Deer and Deer Management 309 Results for WMU 1B
Q30-Q33. Percent who strongly or moderately support each of the following methods of
controlling deer populations in Pennsylvania:
28
30
34
94
0 20 40 60 80 100
Q30. Legal,regulated hunting
Q33. Fertility orbirth control
Q32. Trappingand killing
Q31.Professionals orsharpshooters
Percent
WMU 1B
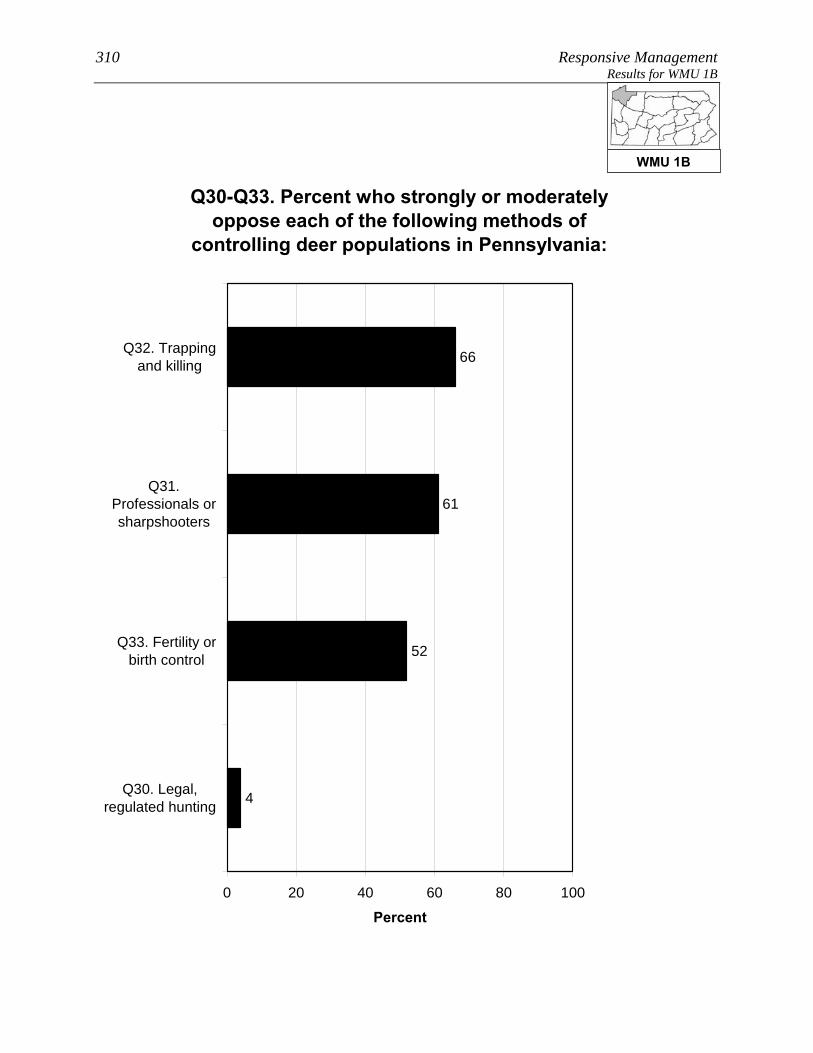
310 Responsive Management Results for WMU 1B
Q30-Q33. Percent who strongly or moderately oppose each of the following methods of
controlling deer populations in Pennsylvania:
4
52
61
66
0 20 40 60 80 100
Q32. Trappingand killing
Q31.Professionals orsharpshooters
Q33. Fertility orbirth control
Q30. Legal,regulated hunting
Percent
WMU 1B

Pennsylvania Residents’ Opinions on and Attitudes Toward Deer and Deer Management 311 Results for WMU 1B
Q30-Q33. Percent who strongly oppose each of the following methods of controlling deer populations
in Pennsylvania:
3
40
46
55
0 20 40 60 80 100
Q32. Trappingand killing
Q31.Professionals orsharpshooters
Q33. Fertility orbirth control
Q30. Legal,regulated hunting
Percent
WMU 1B
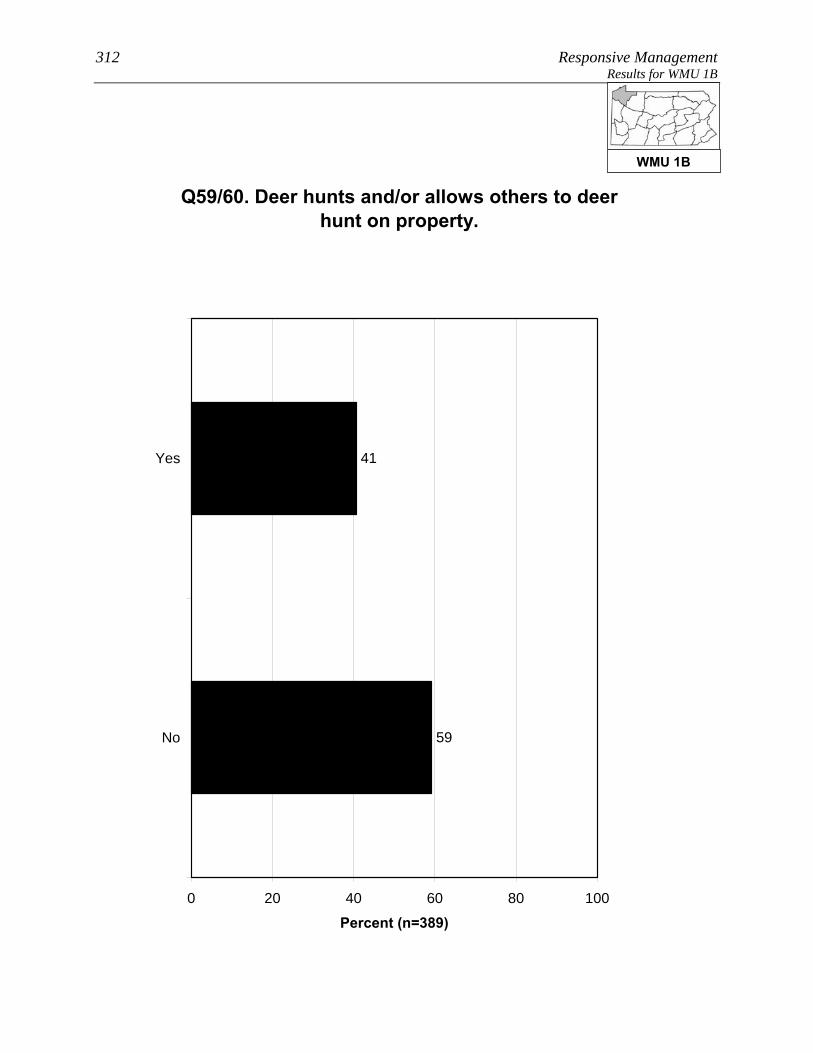
312 Responsive Management Results for WMU 1B
Q59/60. Deer hunts and/or allows others to deer hunt on property.
59
41
0 20 40 60 80 100
Yes
No
Percent (n=389)
WMU 1B
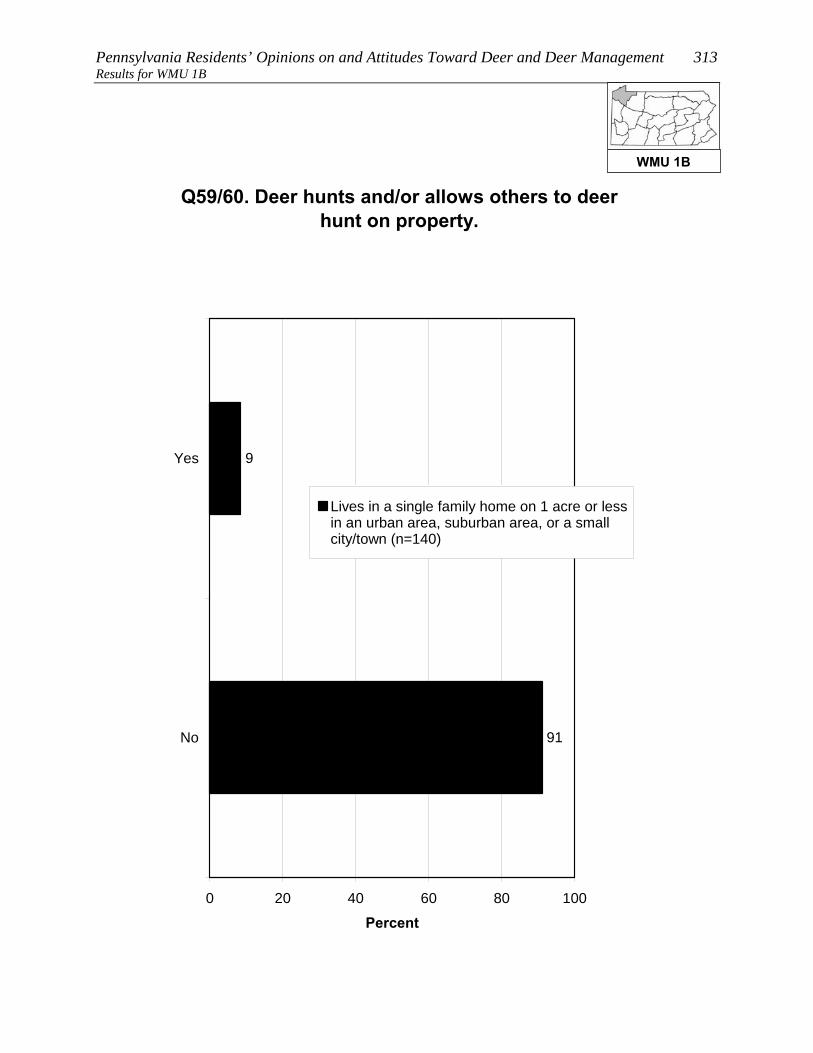
Pennsylvania Residents’ Opinions on and Attitudes Toward Deer and Deer Management 313 Results for WMU 1B
Q59/60. Deer hunts and/or allows others to deer hunt on property.
91
9
0 20 40 60 80 100
Yes
No
Percent
Lives in a single family home on 1 acre or lessin an urban area, suburban area, or a smallcity/town (n=140)
WMU 1B

314 Responsive Management Results for WMU 1B
Q63. What are the main reasons you do not allow others to hunt deer on your property? (Asked of
those whose primary place of residence is a single-family home and who do not allow others to hunt
deer on their property.)
2
2
3
3
9
42
53
1
1
1
0 20 40 60 80 100
Property is too small / neighbors tooclose
Live in residential neighborhood /suburban or urban area
Concerned about safety
Oppose hunting in general
Not enough deer on property / notenough habitat
Live on rented property
Want to save hunting opportunities forself / family
Not interested in allowing hunting onproperty, but did not indicate
opposition to hunting in general
No one has asked for hunting access
Don't know
Mul
tiple
Res
pons
es A
llow
ed
Percent (n=233)
WMU 1B

Pennsylvania Residents’ Opinions on and Attitudes Toward Deer and Deer Management 315 Results for WMU 1B
Q65. How likely are you to ever allow others to deer hunt on your property? (Asked of those whose
primary place of residence is a single-family home and who do not allow others to
hunt deer on their property.)
2
89
2
5
2
0 20 40 60 80 100
Very likely
Somewhat likely
Somewhatunlikely
Very unlikely
Don't know
Percent (n=233)
WMU 1B

316 Responsive Management Results for WMU 1B
Q66. Is there anything that would make you more likely to allow deer hunting on your property?
(Asked of those whose primary place of residence is a single-family home and who do not allow
others to hunt deer on their property.)
96
4
0 20 40 60 80 100
Yes
No
Percent (n=233)
WMU 1B
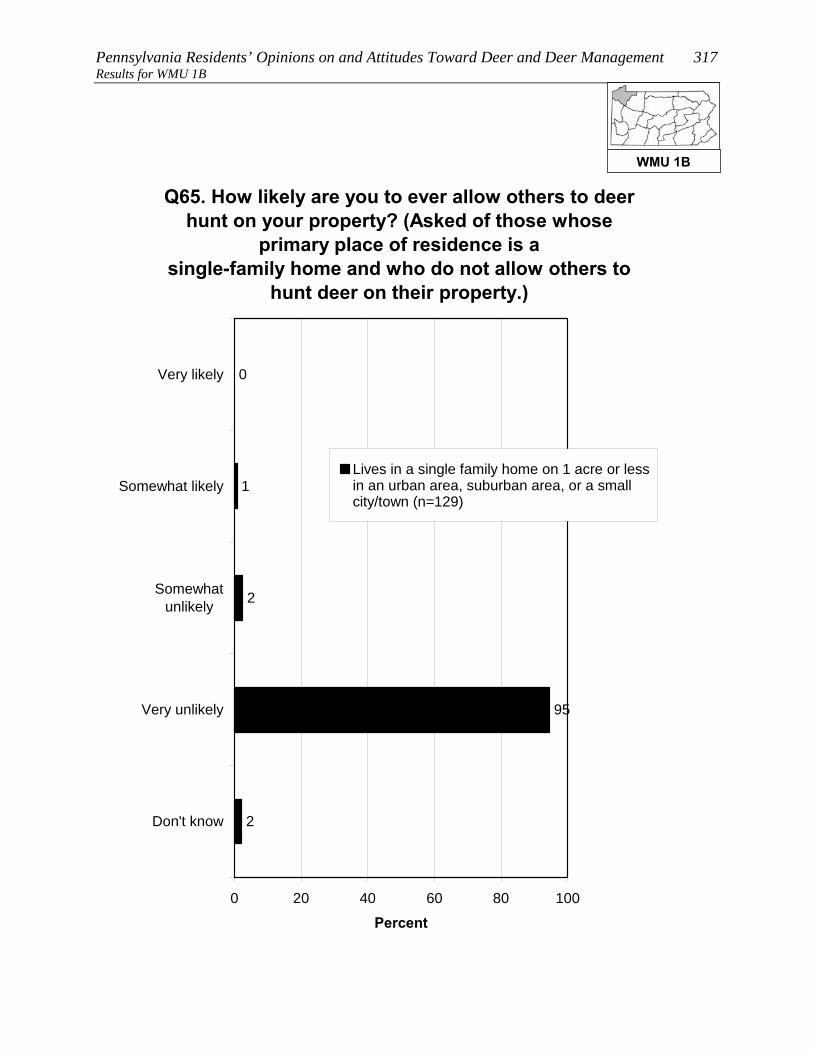
Pennsylvania Residents’ Opinions on and Attitudes Toward Deer and Deer Management 317 Results for WMU 1B
Q65. How likely are you to ever allow others to deer hunt on your property? (Asked of those whose
primary place of residence is a single-family home and who do not allow others to
hunt deer on their property.)
2
95
2
1
0
0 20 40 60 80 100
Very likely
Somewhat likely
Somewhatunlikely
Very unlikely
Don't know
Percent
Lives in a single family home on 1 acre or lessin an urban area, suburban area, or a smallcity/town (n=129)
WMU 1B

318 Responsive Management Results for WMU 1B
CONCERNS ABOUT DEER AND DEER NUISANCE PROBLEMS Seven questions asked about respondents’ level of concern about
issues associated with deer. For each issue, respondents rated their
level of concern about it using a 10-point scale, with 10 being the most
concerned.
• The most concern was for tick-borne diseases (mean rating of 6.9), followed by three
whose means are fairly close to one another: deer-vehicle accidents (6.6), the health of
the deer population (6.2), and the quality of deer habitat (6.0).
• At the bottom are concern about deer impacts on habitat and other wildlife (even
though this can be considerable) (3.5) and the two impacts to residents’ landscaping:
deer damage to plants and landscaping (2.3) and deer droppings in the yard (1.1).
o Another graph shows the percentage who gave a high rating (a “9” or “10”),
providing an idea of the percentage who feel strongly about the issues.
Among residents of WMU 1B, 73% indicated that they saw deer on their property in the past
12 months.
• Respondents who fed birds were more likely to indicate seeing deer, as were
respondents who fed deer or put out attractants or were aware of neighbors who fed
deer or put out attractants.
The survey asked about specific nuisance problems with deer that residents of WMU 1B may
have experienced: 9% indicated that they experienced problems with deer at their primary
place of residence in the past 12 months; 19% indicated that they or another household
member had been in a vehicle collision with a deer (fortunately, a very low portion of
drivers/passengers were injured); and 1% indicated that they or a household member had
been diagnosed with a tick-borne disease.
• Crosstabulations show that those who fed birds were about the same as those who did
not regarding nuisance deer, but those who were aware of neighbors feeding deer or
putting out attractants, compared to those who did not indicate that neighbors fed deer
or put out attractants, were more likely to experience deer problems.
WMU 1B

Pennsylvania Residents’ Opinions on and Attitudes Toward Deer and Deer Management 319 Results for WMU 1B
Q36-Q42. Mean rating of respondents' concern about each of the following on a 10-point scale:
2.3
3.5
6.0
6.2
6.6
6.9
1.1
0 2 4 6 8 10
Q36. Tick-borne diseases, such asLyme disease, in Pennsylvania
Q40. Deer-vehicle accidents inPennsylvania
Q42. The health of the deerpopulation, such as adequate foodresources for the size of the deer
herd, in Pennsylvania
Q41. The quality of deer habitat inPennsylvania
Q39. Deer impacts on the habitat andother wildlife in Pennsylvania
Q38. Deer damage to plants andlandscaping in his/her yard
Q37. Deer droppings in his/her yard
Mean
WMU 1B
320 Responsive Management Results for WMU 1B
Q36-Q42. Percent who rated their concern about each of the following as a 9 or 10 on a 10-point
scale:
4
7
16
24
34
39
3
0 20 40 60 80 100
Q36. Tick-borne diseases, such as Lymedisease, in Pennsylvania
Q40. Deer-vehicle accidents inPennsylvania
Q42. The health of the deer population,such as adequate food resources for the
size of the deer herd, in Pennsylvania
Q41. The quality of deer habitat inPennsylvania
Q38. Deer damage to plants andlandscaping in his/her yard
Q39. Deer impacts on the habitat andother wildlife in Pennsylvania
Q37. Deer droppings in his/her yard
Percent
WMU 1B
Pennsylvania Residents’ Opinions on and Attitudes Toward Deer and Deer Management 321 Results for WMU 1B
Q49. How often have you seen deer on your property in the past 12 months?
27
17
19
37
0 20 40 60 80 100
Frequently
Sometimes
Rarely
Never
Percent (n=411)
WMU 1B
322 Responsive Management Results for WMU 1B
Q49. How often have you seen deer on your property in the past 12 months?
24
15
23
38
31
35
13
20
0 20 40 60 80 100
Frequently
Sometimes
Rarely
Never
Percent
Fed birds on his / her property inthe past 12 months (n=241)
Did not feed birds on his / herproperty in the past 12 months(n=170)
WMU 1B
Pennsylvania Residents’ Opinions on and Attitudes Toward Deer and Deer Management 323 Results for WMU 1B
Q49. How often have you seen deer on your property in the past 12 months?
1
12
18
69
30
33
19
18
0 20 40 60 80 100
Frequently
Sometimes
Rarely
Never
Percent
Has fed deer or put outattractants in the past 12 months(n=50)
Has not fed deer or put outattractants in the past 12 months(n=361)
WMU 1B
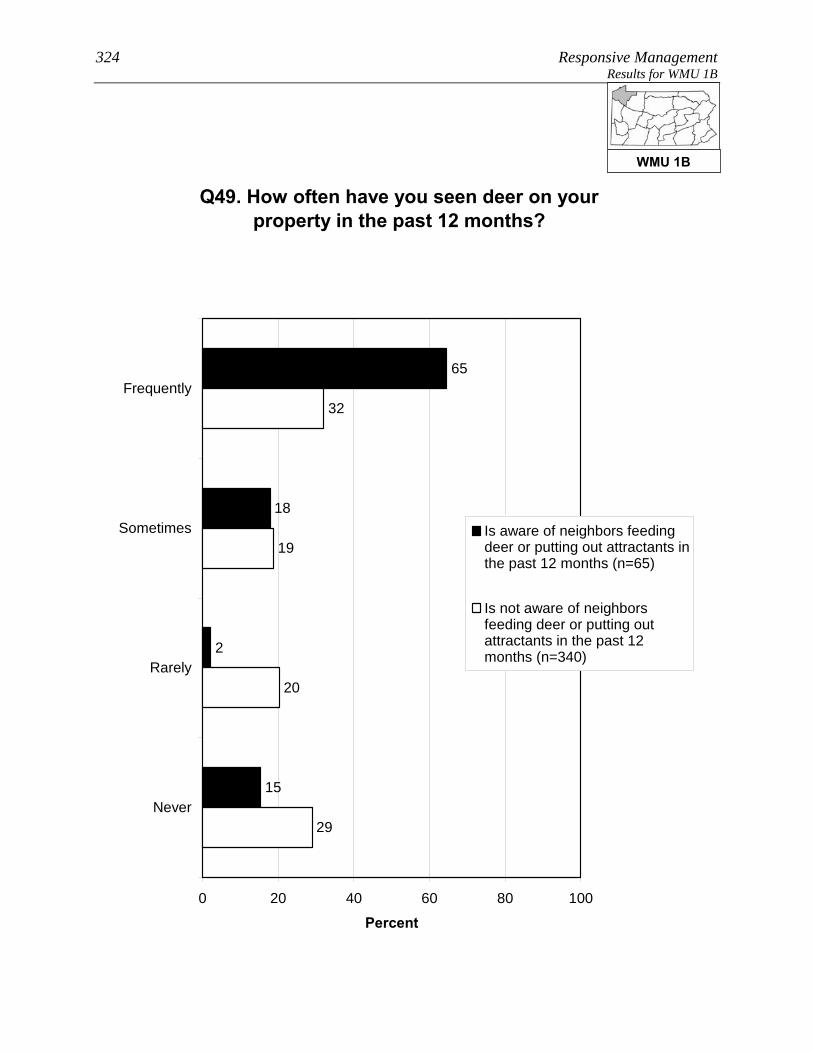
324 Responsive Management Results for WMU 1B
Q49. How often have you seen deer on your property in the past 12 months?
15
2
18
65
29
32
19
20
0 20 40 60 80 100
Frequently
Sometimes
Rarely
Never
Percent
Is aware of neighbors feedingdeer or putting out attractants inthe past 12 months (n=65)
Is not aware of neighborsfeeding deer or putting outattractants in the past 12months (n=340)
WMU 1B
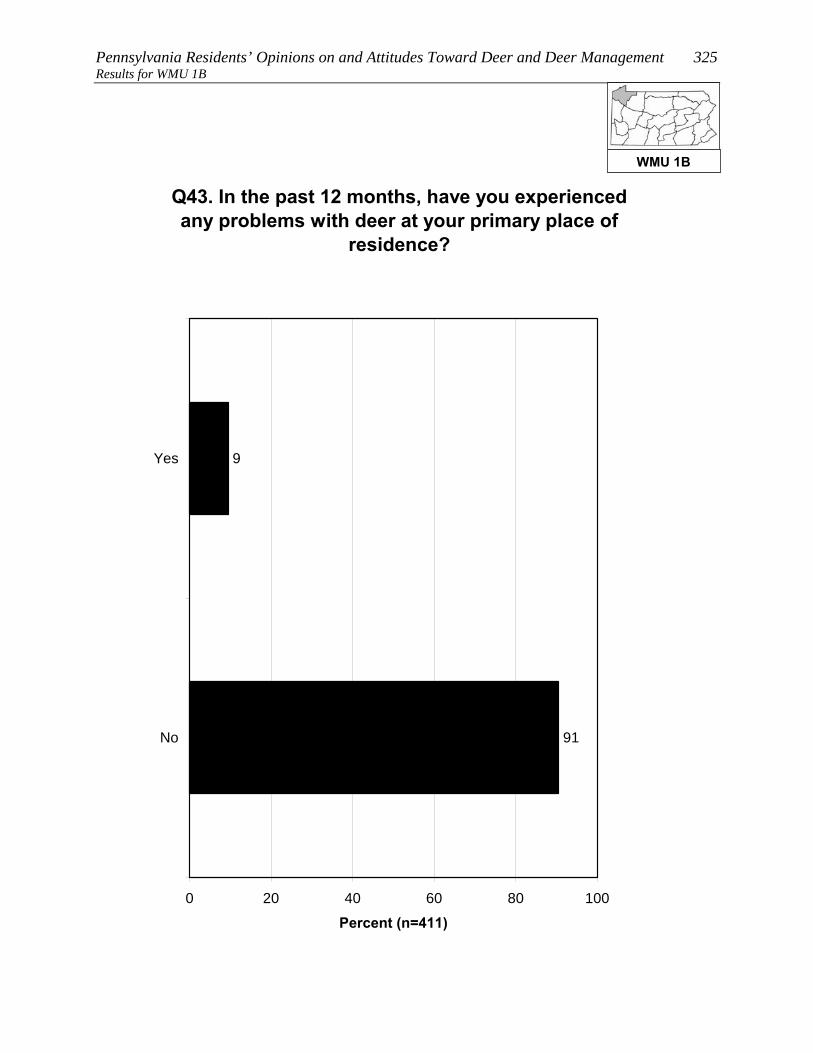
Pennsylvania Residents’ Opinions on and Attitudes Toward Deer and Deer Management 325 Results for WMU 1B
Q43. In the past 12 months, have you experienced any problems with deer at your primary place of
residence?
91
9
0 20 40 60 80 100
Yes
No
Percent (n=411)
WMU 1B

326 Responsive Management Results for WMU 1B
Q43. In the past 12 months, have you experienced any problems with deer at your primary place of
residence?
9
91
90
10
0 20 40 60 80 100
Yes
No
Percent
Fed birds on his / her property inthe past 12 months (n=241)
Did not feed birds on his / herproperty in the past 12 months(n=170)
WMU 1B

Pennsylvania Residents’ Opinions on and Attitudes Toward Deer and Deer Management 327 Results for WMU 1B
Q43. In the past 12 months, have you experienced any problems with deer at your primary place of
residence?
83
17
8
92
0 20 40 60 80 100
Yes
No
Percent
Is aware of neighbors feedingdeer or putting out attractants inthe past 12 months (n=65)
Is not aware of neighborsfeeding deer or putting outattractants in the past 12 months(n=340)
WMU 1B

328 Responsive Management Results for WMU 1B
Q44. In the past 12 months, have you or any other person living in your immediate household been in a vehicle collision with or an accident involving a
deer on Pennsylvania's roads or highways?
81
19
0 20 40 60 80 100
Yes
No
Percent (n=411)
WMU 1B

Pennsylvania Residents’ Opinions on and Attitudes Toward Deer and Deer Management 329 Results for WMU 1B
Q45. Were you or anyone else injured? (Asked of those who had a household member who was in or
who have personally been in a vehicle collision with or an accident involving a deer on
Pennsylvania's roads or highways in the past 12 months.)
99
1
0 20 40 60 80 100
Yes
No
Percent (n=81)
WMU 1B
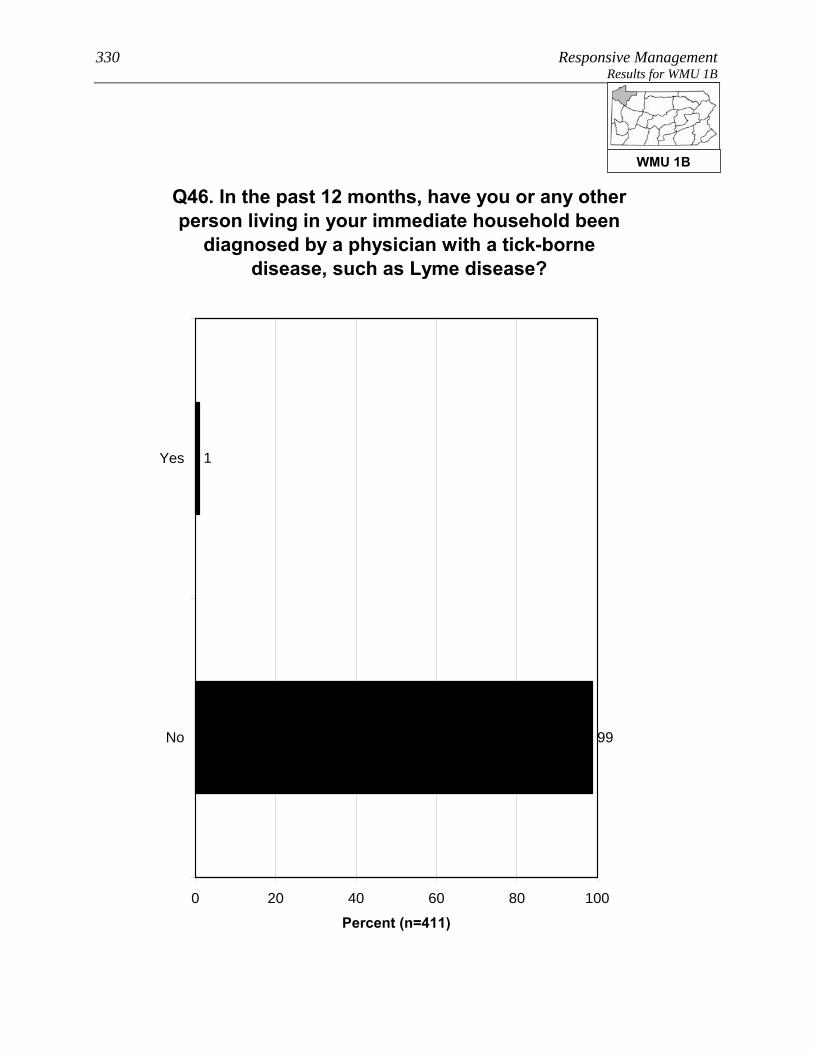
330 Responsive Management Results for WMU 1B
Q46. In the past 12 months, have you or any other person living in your immediate household been
diagnosed by a physician with a tick-borne disease, such as Lyme disease?
99
1
0 20 40 60 80 100
Yes
No
Percent (n=411)
WMU 1B

Pennsylvania Residents’ Opinions on and Attitudes Toward Deer and Deer Management 331 Results for WMU 1B FEEDING WILDLIFE AND HUNTING DEER
Several questions asked about feeding wildlife.
• Feeding deer or putting out deer attractants: 11% of residents of
WMU 1B did this, and 15% are aware of neighbors who did this.
o The most typical feeds or attractants put out by respondents are corn, salt/mineral
blocks, and apples.
• Feeding birds: 59% of residents of WMU 1B did this.
There is no consensus on whether it is okay for private citizens to feed or attract deer in
Pennsylvania: 53% agree that this is okay, but 35% disagree (the rest are neutral).
More than a third of residents of WMU 1B (36%) consider themselves to be a hunter, the
majority of whom have a Pennsylvania hunting license.
• Among residents of WMU 1B who live in a single-family home, 21% personally hunt
deer on their property.
• A large majority of residents of WMU 1B (85%) say that they, family members, and/or
friends hunt.
WMU 1B
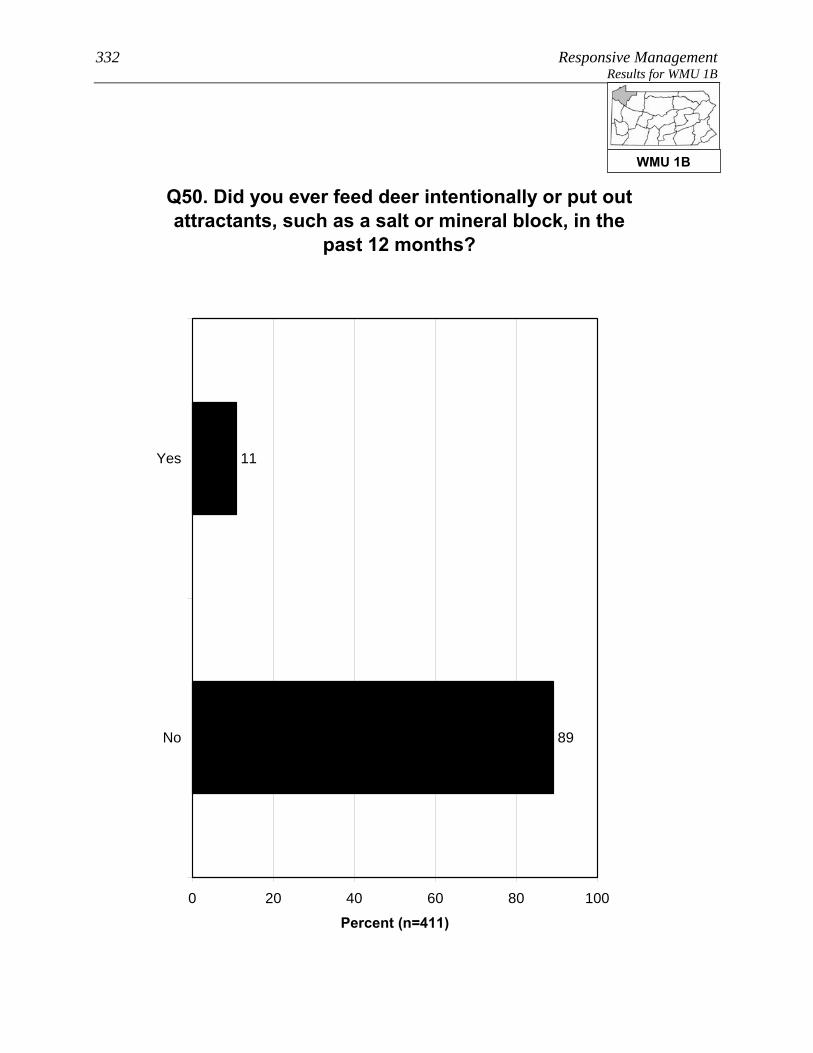
332 Responsive Management Results for WMU 1B
Q50. Did you ever feed deer intentionally or put out attractants, such as a salt or mineral block, in the
past 12 months?
89
11
0 20 40 60 80 100
Yes
No
Percent (n=411)
WMU 1B

Pennsylvania Residents’ Opinions on and Attitudes Toward Deer and Deer Management 333 Results for WMU 1B
Q55. Are you aware of any of your neighbors feeding deer intentionally or trying to attract deer
on their property in the past 12 months?
2
83
15
0 20 40 60 80 100
Yes
No
Don't know
Percent (n=411)
WMU 1B

334 Responsive Management Results for WMU 1B
Q53. What type of feed or attractant did you use? (Asked of those who fed deer intentionally or put
out attractants in the past 12 months.)
3
7
8
22
41
45
1
0 20 40 60 80 100
Corn
Salt / mineralblock
Apples
Other foodproducts
Pellets /commercial
feed
Horse feed
Other
Mul
tiple
Res
pons
es A
llow
ed
Percent (n=50)
WMU 1B
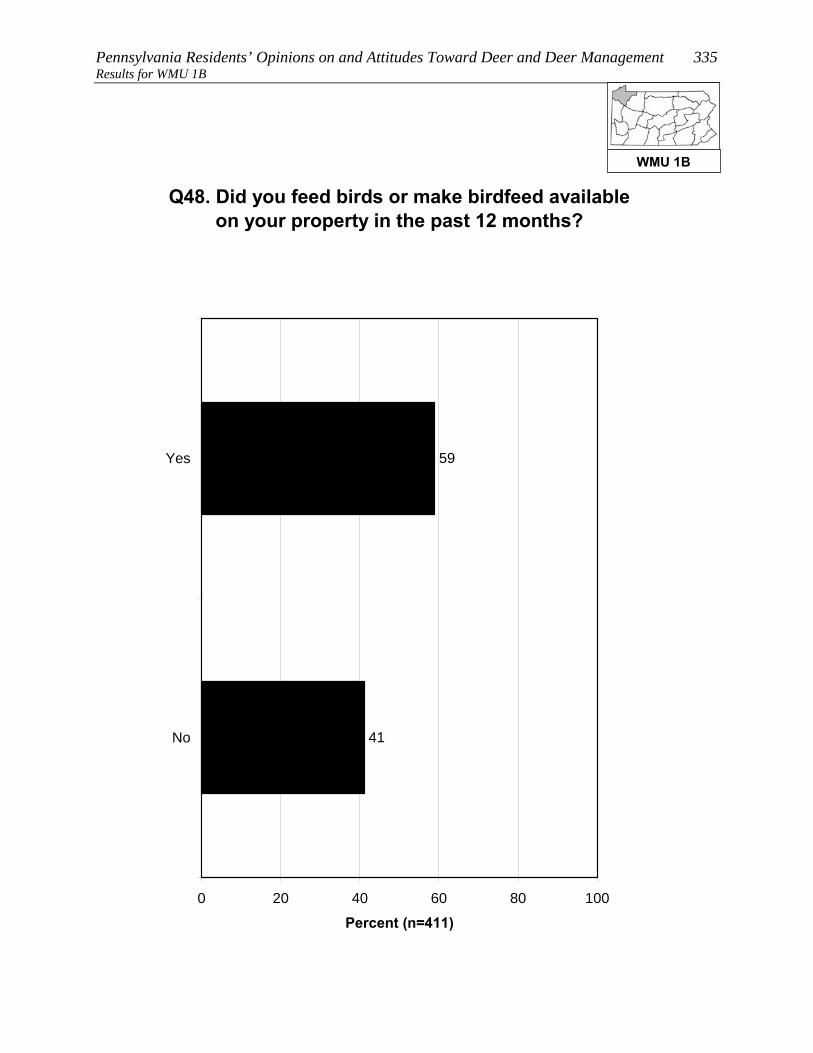
Pennsylvania Residents’ Opinions on and Attitudes Toward Deer and Deer Management 335 Results for WMU 1B
Q48. Did you feed birds or make birdfeed available on your property in the past 12 months?
59
41
0 20 40 60 80 100
Yes
No
Percent (n=411)
WMU 1B
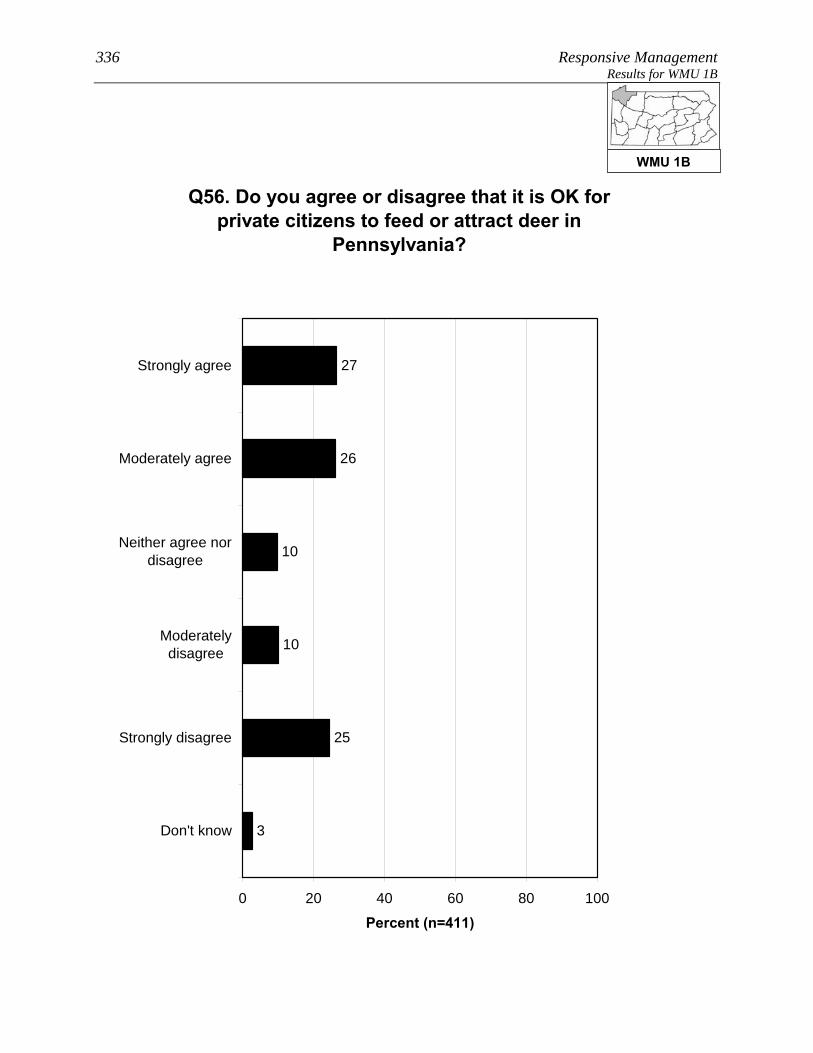
336 Responsive Management Results for WMU 1B
Q56. Do you agree or disagree that it is OK for private citizens to feed or attract deer in
Pennsylvania?
3
25
10
10
26
27
0 20 40 60 80 100
Strongly agree
Moderately agree
Neither agree nordisagree
Moderatelydisagree
Strongly disagree
Don't know
Percent (n=411)
WMU 1B
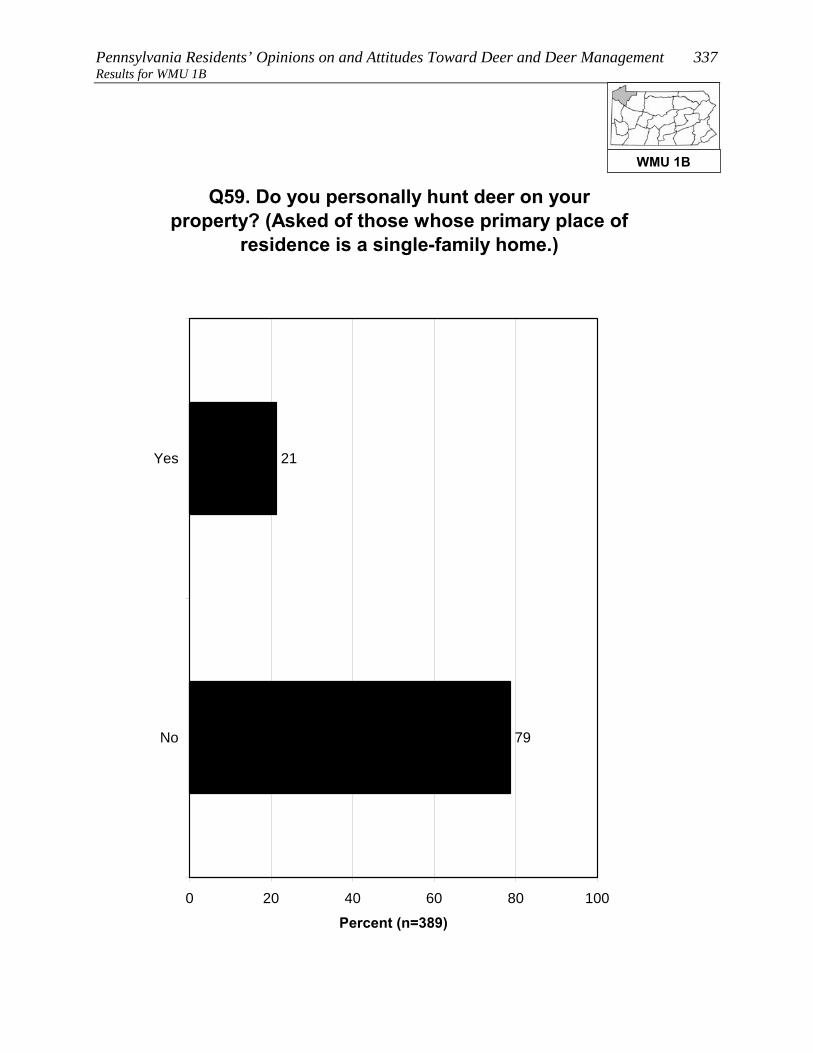
Pennsylvania Residents’ Opinions on and Attitudes Toward Deer and Deer Management 337 Results for WMU 1B
Q59. Do you personally hunt deer on your property? (Asked of those whose primary place of
residence is a single-family home.)
79
21
0 20 40 60 80 100
Yes
No
Percent (n=389)
WMU 1B
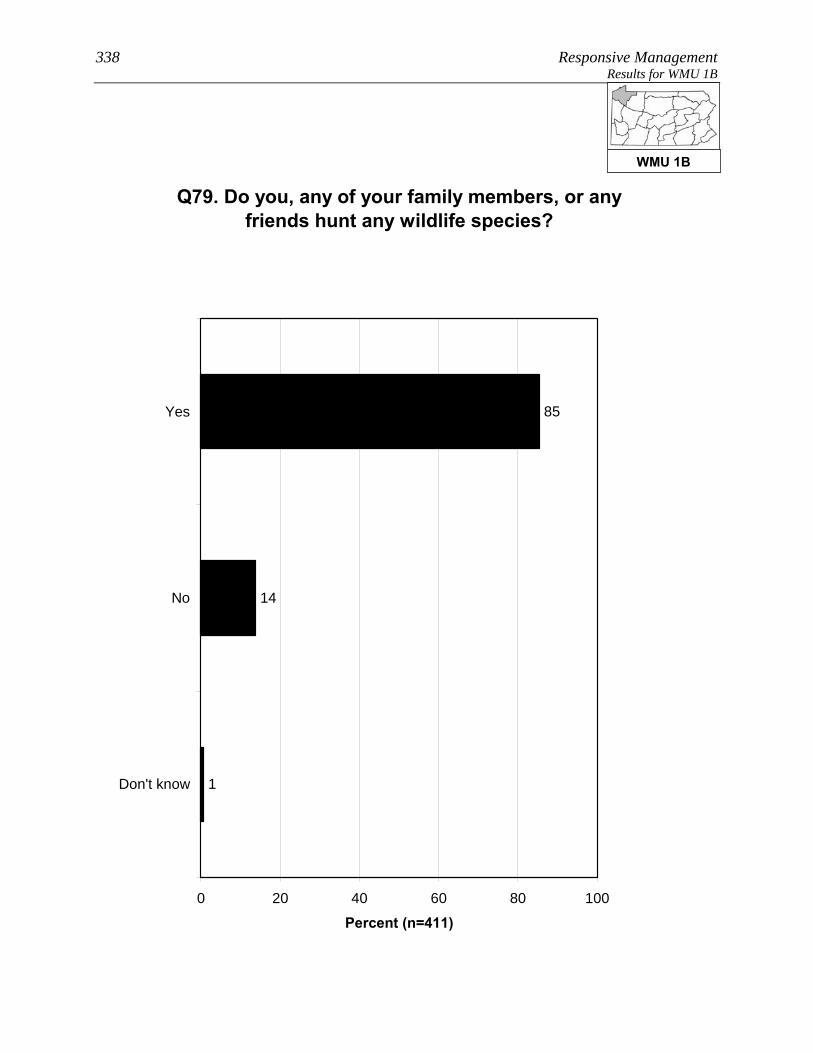
338 Responsive Management Results for WMU 1B
Q79. Do you, any of your family members, or any friends hunt any wildlife species?
1
14
85
0 20 40 60 80 100
Yes
No
Don't know
Percent (n=411)
WMU 1B

Pennsylvania Residents’ Opinions on and Attitudes Toward Deer and Deer Management 339 Results for WMU 1B SOURCES OF INFORMATION
Most commonly, residents of WMU 1B say that the best way to
provide them with information about deer in Pennsylvania is through
direct mail (46% gave this response), followed by newspaper (23%),
email (15%), the Internet (11% saying an Internet site other than the
PGC and 3% saying the agency website; note that some said both).
Just about two-fifths of residents of WMU 1B (42%) use social media, the most common
primary site being Facebook.
WMU 1B

340 Responsive Management Results for WMU 1B
Q82. What is the best way to provide you with information about deer in Pennsylvania?
5
1
1
1
1
1
1
6
11
11
15
23
46
4
3
2
0 20 40 60 80 100
Direct mail
Newspaper
Internet / website other thanPGC website
TV
Magazines
Brochures or pamphlets
PA Game Commission website
Radio
PA Game Commission offices
Telephone
Public presentations
PA Hunting and TrappingDigest
Social media
Other
Don't know
Mul
tiple
Res
pons
es A
llow
ed
Percent (n=411)
WMU 1B

Pennsylvania Residents’ Opinions on and Attitudes Toward Deer and Deer Management 341 Results for WMU 1B
Q84. Do you use social media, such as Facebook, Twitter, or YouTube?
1
57
42
0 20 40 60 80 100
Yes
No
Don't know
Percent (n=411)
WMU 1B
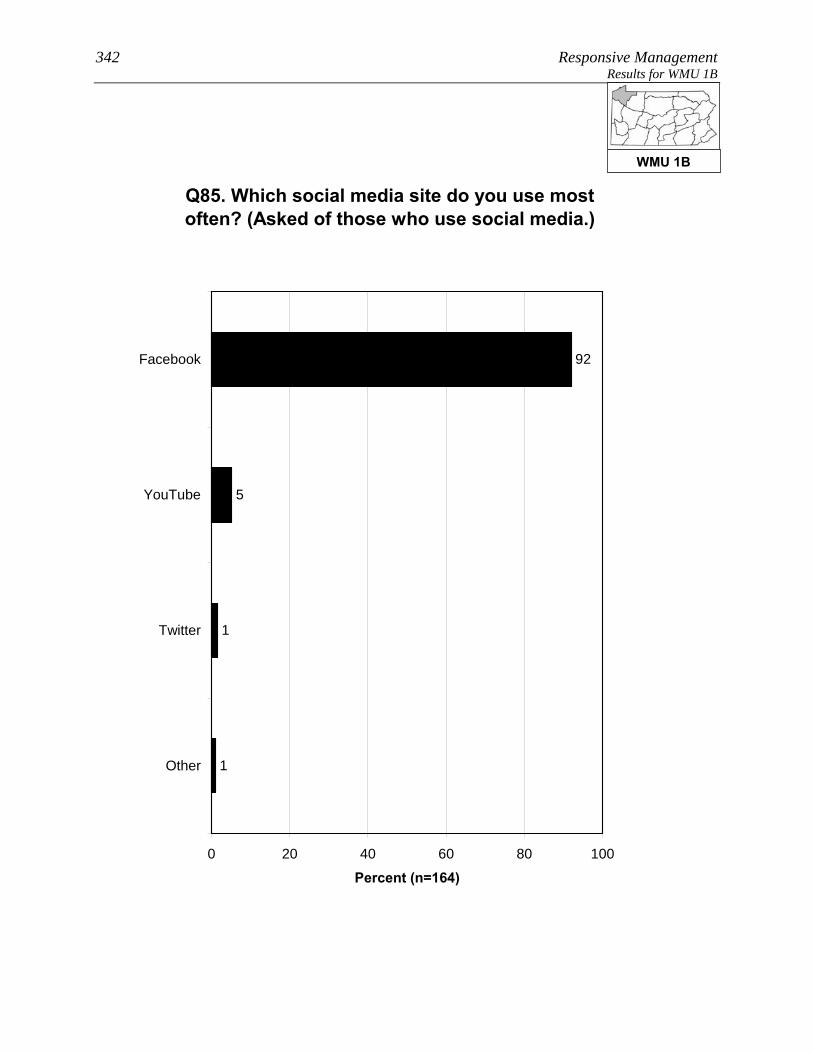
342 Responsive Management Results for WMU 1B
Q85. Which social media site do you use most often? (Asked of those who use social media.)
1
1
5
92
0 20 40 60 80 100
YouTube
Other
Percent (n=164)
WMU 1B
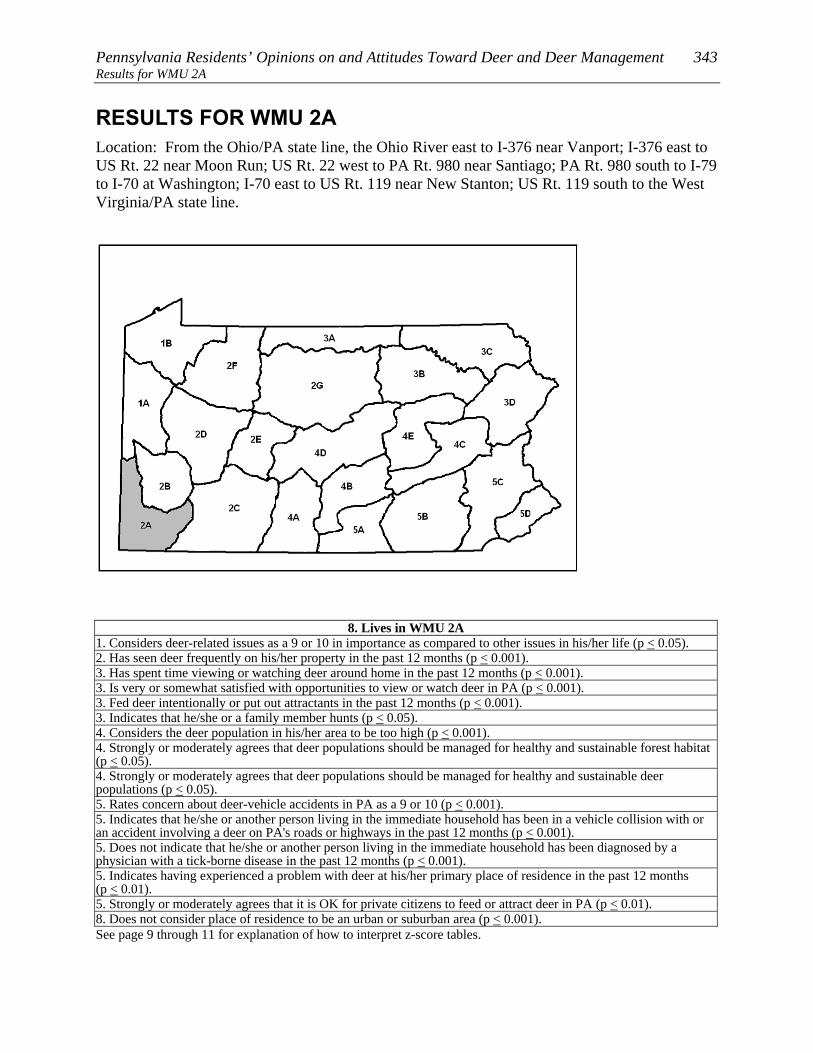
Pennsylvania Residents’ Opinions on and Attitudes Toward Deer and Deer Management 343 Results for WMU 2A
RESULTS FOR WMU 2A Location: From the Ohio/PA state line, the Ohio River east to I-376 near Vanport; I-376 east to US Rt. 22 near Moon Run; US Rt. 22 west to PA Rt. 980 near Santiago; PA Rt. 980 south to I-79 to I-70 at Washington; I-70 east to US Rt. 119 near New Stanton; US Rt. 119 south to the West Virginia/PA state line.
8. Lives in WMU 2A 1. Considers deer-related issues as a 9 or 10 in importance as compared to other issues in his/her life (p < 0.05). 2. Has seen deer frequently on his/her property in the past 12 months (p < 0.001). 3. Has spent time viewing or watching deer around home in the past 12 months (p < 0.001). 3. Is very or somewhat satisfied with opportunities to view or watch deer in PA (p < 0.001). 3. Fed deer intentionally or put out attractants in the past 12 months (p < 0.001). 3. Indicates that he/she or a family member hunts (p < 0.05). 4. Considers the deer population in his/her area to be too high (p < 0.001). 4. Strongly or moderately agrees that deer populations should be managed for healthy and sustainable forest habitat (p < 0.05). 4. Strongly or moderately agrees that deer populations should be managed for healthy and sustainable deer populations (p < 0.05). 5. Rates concern about deer-vehicle accidents in PA as a 9 or 10 (p < 0.001). 5. Indicates that he/she or another person living in the immediate household has been in a vehicle collision with or an accident involving a deer on PA's roads or highways in the past 12 months (p < 0.001). 5. Does not indicate that he/she or another person living in the immediate household has been diagnosed by a physician with a tick-borne disease in the past 12 months (p < 0.001). 5. Indicates having experienced a problem with deer at his/her primary place of residence in the past 12 months (p < 0.01). 5. Strongly or moderately agrees that it is OK for private citizens to feed or attract deer in PA (p < 0.01). 8. Does not consider place of residence to be an urban or suburban area (p < 0.001). See page 9 through 11 for explanation of how to interpret z-score tables.

344 Responsive Management Results for WMU 2A
PARTICIPATION IN VIEWING DEER A large majority of residents of WMU 2A (81%) spent time viewing
deer around their home in the past 12 months, and 29% took a trip of
at least a mile to view deer.
• About two-fifths of those who took a deer-viewing trip (42%) used a spotlight to view
the deer at night.
A large majority of residents of WMU 2A (78%) are satisfied with opportunities to view deer
in Pennsylvania; only 7% indicate being dissatisfied.
WMU 2A

Pennsylvania Residents’ Opinions on and Attitudes Toward Deer and Deer Management 345 Results for WMU 2A
Q10. Have you spent time viewing or watching deer around your home in the past 12 months?
81
19
0 20 40 60 80 100
Yes
No
Percent (n=415)
WMU 2A

346 Responsive Management Results for WMU 2A
Q11. Have you taken a trip at least 1 mile from your home for the primary purpose of viewing or
watching deer in the past 12 months?
29
71
0 20 40 60 80 100
Yes
No
Percent (n=415)
WMU 2A

Pennsylvania Residents’ Opinions on and Attitudes Toward Deer and Deer Management 347 Results for WMU 2A
Q12. Did you use a spotlight to view deer at night on a trip to watch deer in the past 12 months?
(Asked of those who took a trip at least 1 mile from their home for the primary purpose of viewing or
watching deer in the past 12 months.)
42
58
0 20 40 60 80 100
Yes
No
Percent (n=122)
WMU 2A

348 Responsive Management Results for WMU 2A
Q13. How satisfied are you with opportunities to view or watch deer in Pennsylvania?
51
27
11
4
3
4
0 20 40 60 80 100
Very satisfied
Somewhatsatisfied
Neither satisfiednor dissatisfied
Somewhatdissatisfied
Very dissatisfied
Don't know
Percent (n=415)
WMU 2A
Pennsylvania Residents’ Opinions on and Attitudes Toward Deer and Deer Management 349 Results for WMU 2A OPINIONS ON DEER IN GENERAL AND THE SIZE AND HEALTH OF THE DEER HERD
Opinion on deer is mostly favorable: 48% of residents of WMU 2A
say with no caveats that they like having deer around, another 30%
like having deer around but worry about the problems they may cause,
and only 7% generally regard them as a nuisance. The remainder have
no particular feeling about deer.
Another question asked residents of WMU 2A how deer-related issues compared to other
issues in their life, on a scale of 0 to 10, with the most importance being 10: the median
rating is “5.” The most common ratings are “0” (22%), the midpoint of “5” (19%), and “10”
(14%). In general, ratings are well spread across the scale.
Two other ratings questions asked respondents to rate their concern about deer-related issues.
The median level of concern is “6” for the quality of deer habitat in Pennsylvania and “7” for
the health of the deer population in Pennsylvania. The ratings of the latter are mostly
concentrated in the upper end of the scale.
The survey asked about the perceived size of the deer herd in the respondent’s area. The
majority of residents of WMU 2A say that the herd size is just right (56%); otherwise, more
say that it is too high (25%) than too low (13%).
• Those who own their home are more likely, compared to those who do not own their
home, to say that the deer population in their area is just right or too low; they are less
likely to say that the deer population is too high.
• Those who consider themselves to be a hunter are much more likely to say that the deer
population in their area is too low, compared to those who are not hunters.
WMU 2A

350 Responsive Management Results for WMU 2A
Q14. Generally, which of the following best describes your feelings about deer in
Pennsylvania?
48
30
7
15
1
0 20 40 60 80 100
I like having deeraround
I like having deeraround but worryabout problems
they caus
I generally regarddeer as a nuisance
I have noparticular feeling
about deer
Don't know
Percent (n=415)
WMU 2A

Pennsylvania Residents’ Opinions on and Attitudes Toward Deer and Deer Management 351 Results for WMU 2A
Q15. Compared to other issues in your life, how important to you, personally, are deer-related
issues on a scale of 0 to 10 where 0 is not at all important and 10 is extremely important?
2
22
4
19
3
5
8
3
14
6
6
9
0 20 40 60 80 100
10
9
8
7
6
5
4
3
2
1
0
Don't know
Percent (n=415)
Mean = 4.47Median = 5
WMU 2A
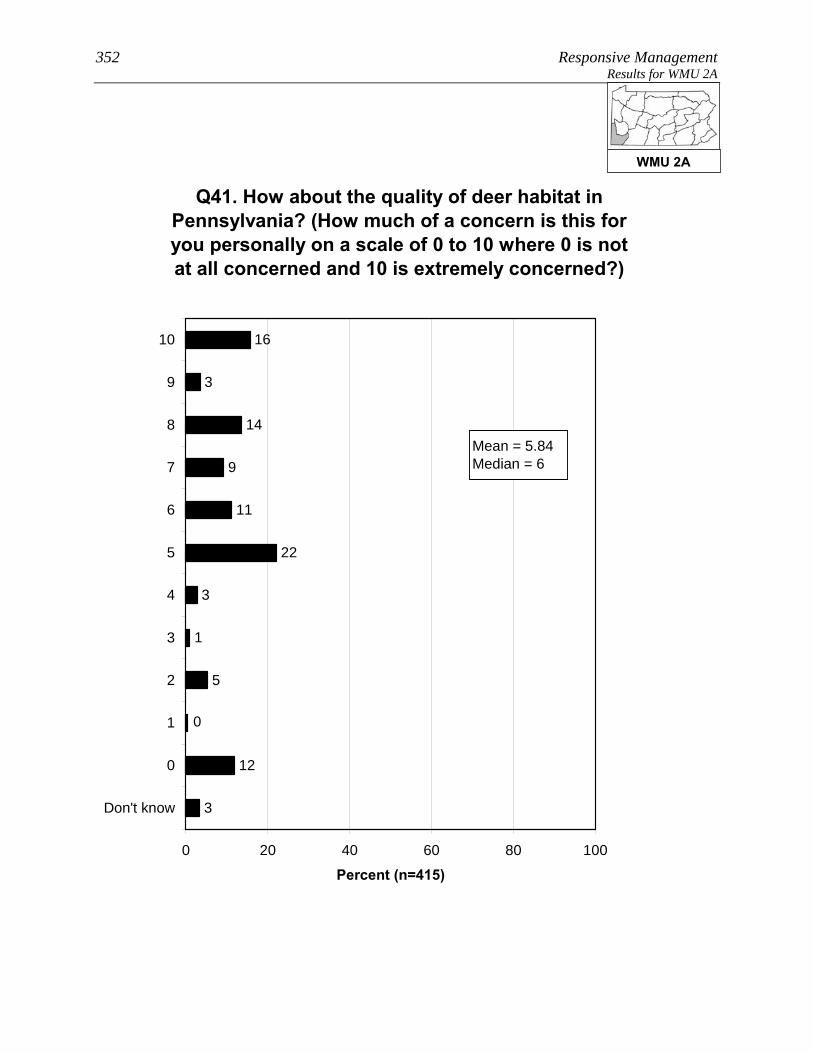
352 Responsive Management Results for WMU 2A
Q41. How about the quality of deer habitat in Pennsylvania? (How much of a concern is this for you personally on a scale of 0 to 10 where 0 is not at all concerned and 10 is extremely concerned?)
5
1
3
16
3
14
9
11
22
0
12
3
0 20 40 60 80 100
10
9
8
7
6
5
4
3
2
1
0
Don't know
Percent (n=415)
Mean = 5.84Median = 6
WMU 2A
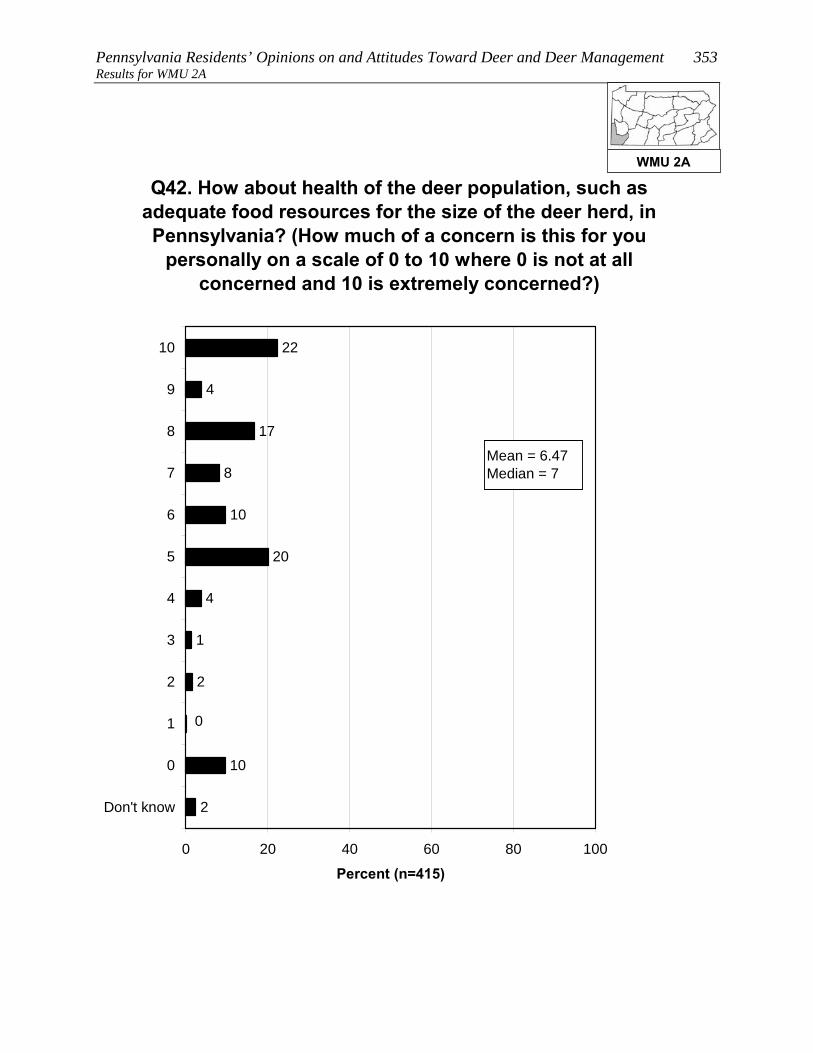
Pennsylvania Residents’ Opinions on and Attitudes Toward Deer and Deer Management 353 Results for WMU 2A
2
1
4
22
4
17
8
10
20
0
10
2
0 20 40 60 80 100
10
9
8
7
6
5
4
3
2
1
0
Don't know
Percent (n=415)
Mean = 6.47Median = 7
Q42. How about health of the deer population, such as adequate food resources for the size of the deer herd, in Pennsylvania? (How much of a concern is this for you
personally on a scale of 0 to 10 where 0 is not at all concerned and 10 is extremely concerned?)
WMU 2A

354 Responsive Management Results for WMU 2A
Q16. In your opinion, is the deer population in the area where you live too high, just right, or too low?
25
56
13
7
0 20 40 60 80 100
Too high
Just right
Too low
Don't know
Percent (n=415)
WMU 2A
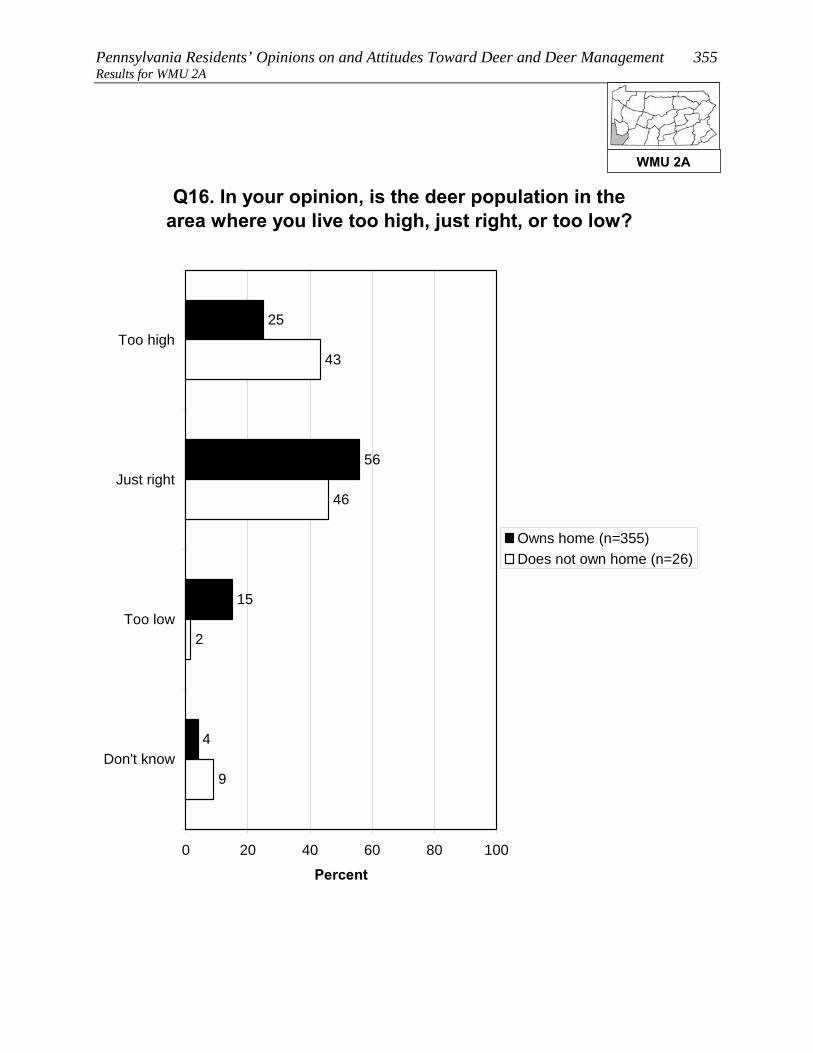
Pennsylvania Residents’ Opinions on and Attitudes Toward Deer and Deer Management 355 Results for WMU 2A
Q16. In your opinion, is the deer population in the area where you live too high, just right, or too low?
25
56
15
4
2
46
43
9
0 20 40 60 80 100
Too high
Just right
Too low
Don't know
Percent
Owns home (n=355)Does not own home (n=26)
WMU 2A

356 Responsive Management Results for WMU 2A
Q16. In your opinion, is the deer population in the area where you live too high, just right, or too low?
19
50
27
3
5
58
28
9
0 20 40 60 80 100
Too high
Just right
Too low
Don't know
Percent
Consider themselves ahunter (n=154)Do not consider themselvesa hunter (n=260)
WMU 2A

Pennsylvania Residents’ Opinions on and Attitudes Toward Deer and Deer Management 357 Results for WMU 2A OPINIONS ON MANAGEMENT EFFORTS AND MANAGEMENT GOALS
The survey asked about three deer population management goals. For
all three, a large majority agree with the management goal, but the
most support is for goals that address ecological concerns rather than
human concerns: 94% agree with managing for healthy and
sustainable deer populations, 91% agree with managing the deer for a
healthy and sustainable forest habitat, and 83% agree with managing
for safe, acceptable levels of deer-human conflicts.
Residents of WMU 2A who said that the deer population in their area is too high or too low
were asked to indicate the reasonable number of years it should take to achieve an acceptable
deer population. The mean amount is 4.00 years. While 34% said that they do not know,
nearly all the rest gave a number of years of 10 or less. Note that this is only among those
who said the deer population was too high or too low.
• Because management plans typically look at a time frame of about 10 years to effect
change, the survey specifically asked if these respondents would be willing to wait
more than 10 years to achieve an acceptable deer population: a majority (56%)
indicated that they would be willing to wait that long.
WMU 2A

358 Responsive Management Results for WMU 2A
Q24-26. Deer populations should be managed for the following. (Do you agree or disagree with this
deer management goal?)
61
30
2
2
2
3
1
30
64
1
3
2
5
53
30
4
6
2
0 20 40 60 80 100
Strongly agree
Moderately agree
Neither agree nordisagree
Moderatelydisagree
Strongly disagree
Don't know
Percent (n=415)
Healthy and sustainable forest habitat
Healthy and sustainable deer populations
Safe and acceptable levels of deer-humanconflicts
WMU 2A
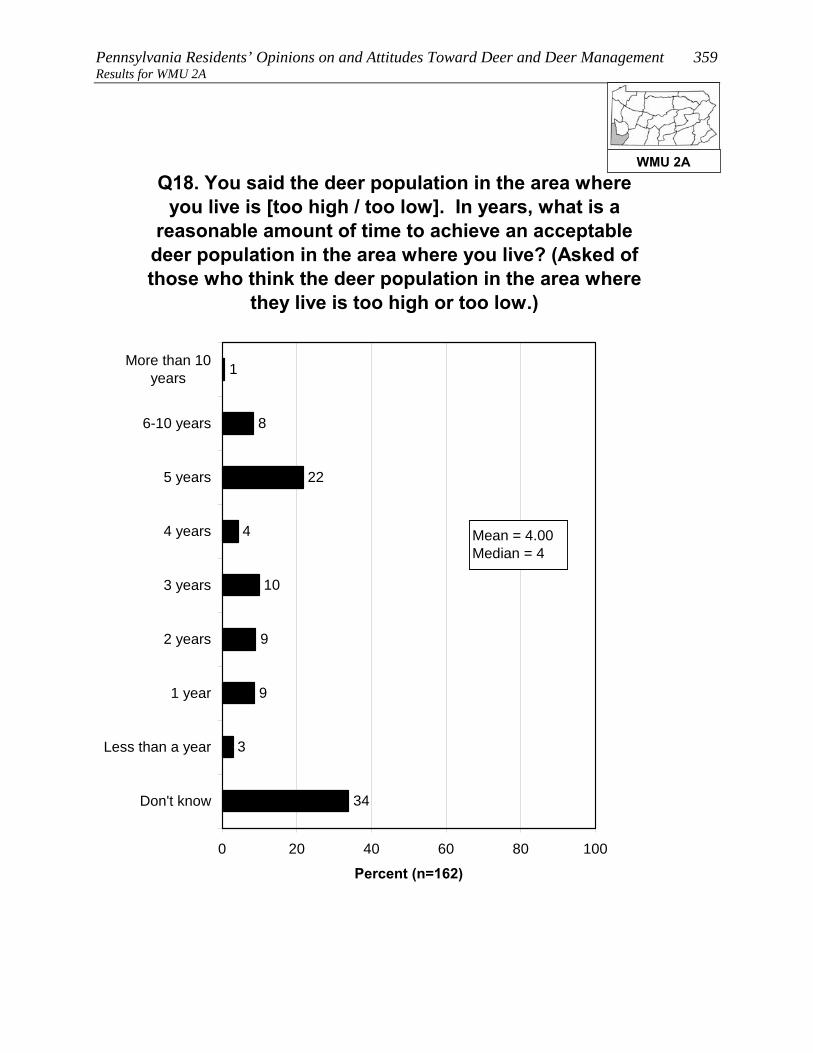
Pennsylvania Residents’ Opinions on and Attitudes Toward Deer and Deer Management 359 Results for WMU 2A
34
3
9
1
8
22
4
10
9
0 20 40 60 80 100
More than 10years
6-10 years
5 years
4 years
3 years
2 years
1 year
Less than a year
Don't know
Percent (n=162)
Mean = 4.00Median = 4
Q18. You said the deer population in the area where you live is [too high / too low]. In years, what is a
reasonable amount of time to achieve an acceptable deer population in the area where you live? (Asked of those who think the deer population in the area where
they live is too high or too low.)
WMU 2A
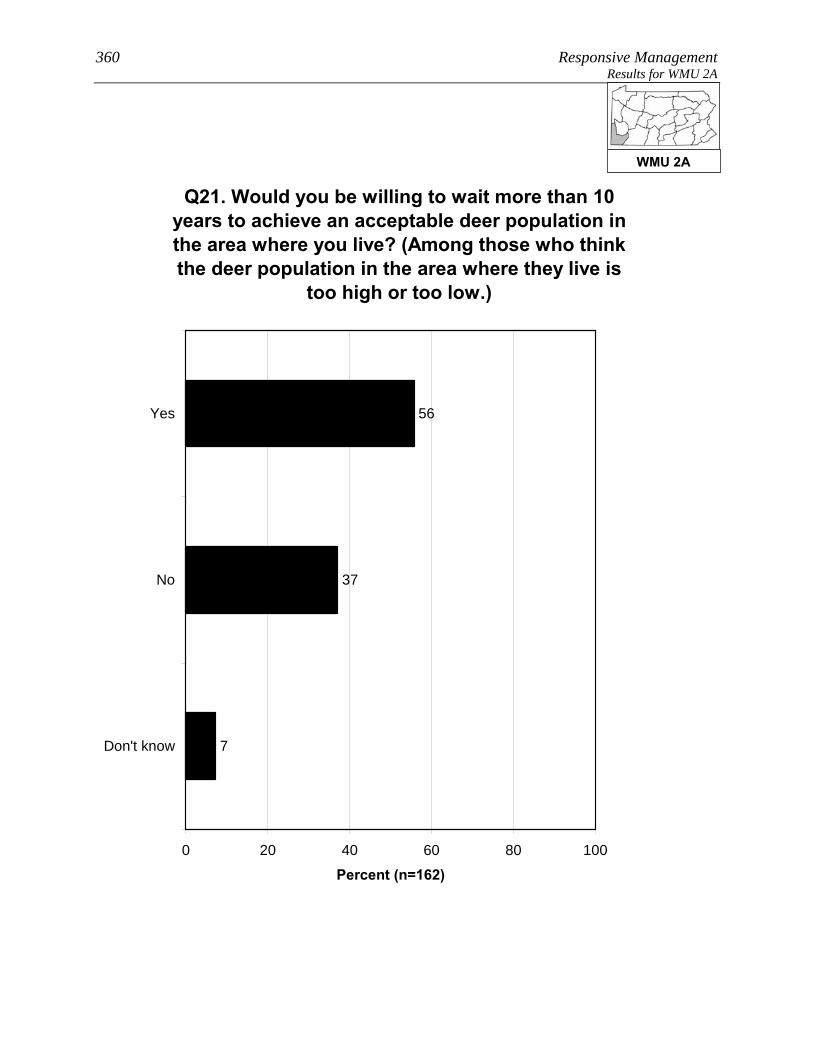
360 Responsive Management Results for WMU 2A
Q21. Would you be willing to wait more than 10 years to achieve an acceptable deer population in the area where you live? (Among those who think the deer population in the area where they live is
too high or too low.)
56
37
7
0 20 40 60 80 100
Yes
No
Don't know
Percent (n=162)
WMU 2A
Pennsylvania Residents’ Opinions on and Attitudes Toward Deer and Deer Management 361 Results for WMU 2A OPINIONS ON METHODS FOR MANAGING DEER, INCLUDING HUNTING
A majority of residents of WMU 2A (62%) support lethal methods to
manage deer populations in Pennsylvania; nonetheless, 31% oppose,
mostly strong opposition.
• Those residents of WMU 2A who live in a single-family home and own their home are
more likely to support lethal methods, compared to those who live in a single-family
home but do not own their home.
• The survey asked about four methods of controlling deer populations (three of them
lethal). The most support is for legal, regulated hunting (90% of respondents support
this method), distantly followed by fertility/birth control (36%), professionals or
sharpshooters (29%), and trapping and killing (25%).
Two questions asked respondents about hunting on their land (among those who live in a
single-family home), the first question about hunting by the respondents themselves (24% do
so) and the second regarding allowing others to hunt on their land (33% do so). In
combining the results, 38% of residents of WMU 2A who live in a single-family home either
hunt on their own land or allow others to do so (it is not simply a sum of the two questions
because some hunt on their property and allow others to do so as well).
• There was interest in seeing how a particular subgroup responded on this question, the
subgroup being those who live in a single-family home; who live on 1 acre or less; and
who live in an urban, suburban area, or a small city/town. Among this subgroup, 3%
either hunt on their own property or allow others to hunt on the property.
• Those respondents who do not allow hunting on their property were asked to indicate
why they prohibit it. The most common reasons are that their property is too small
and/or that they live in a residential area in which hunting is not possible or feasible.
Other minor reasons are concerns about safety, liability concerns, and a general
opposition to hunting.
• Those same respondents who do not allow hunting on their property were asked about
their likelihood of ever allowing others to hunt deer on their property; a very large
percentage say this is very unlikely (87%). They were then asked if there is anything
WMU 2A
362 Responsive Management Results for WMU 2A
that would make them more likely to allow deer hunting; a very
large percentage (96%) say that there is nothing that would make
them more likely to allow deer hunting.
• The question about allowing others to hunt on their property was examined among the
subgroup previously discussed (those who live in a single-family home; who live on 1
acre or less; and who live in an urban, suburban area, or a small city/town). Among
this group who got the question, 96% say that they would be very unlikely to ever
allow hunting.
o Additional follow-up questions to be asked of those who indicated that something
might prompt them to allow hunting on their property did not have enough
respondents for statistical validity; therefore, they are not shown.
WMU 2A

Pennsylvania Residents’ Opinions on and Attitudes Toward Deer and Deer Management 363 Results for WMU 2A
Q27. In general, do you support or oppose lethal methods to manage deer populations in
Pennsylvania?
39
23
4
11
20
3
0 20 40 60 80 100
Strongly support
Moderatelysupport
Neither supportnor oppose
Moderatelyoppose
Strongly oppose
Don't know
Percent (n=415)
WMU 2A

364 Responsive Management Results for WMU 2A
Q27. In general, do you support or oppose lethal methods to manage deer populations in
Pennsylvania?
39
21
4
10
23
3
9
7
35
41
8
0
0 20 40 60 80 100
Stronglysupport
Moderatelysupport
Neithersupport nor
oppose
Moderatelyoppose
Stronglyoppose
Don't know
Percent
Owns home (n=355)Does not own home (n=26)
WMU 2A
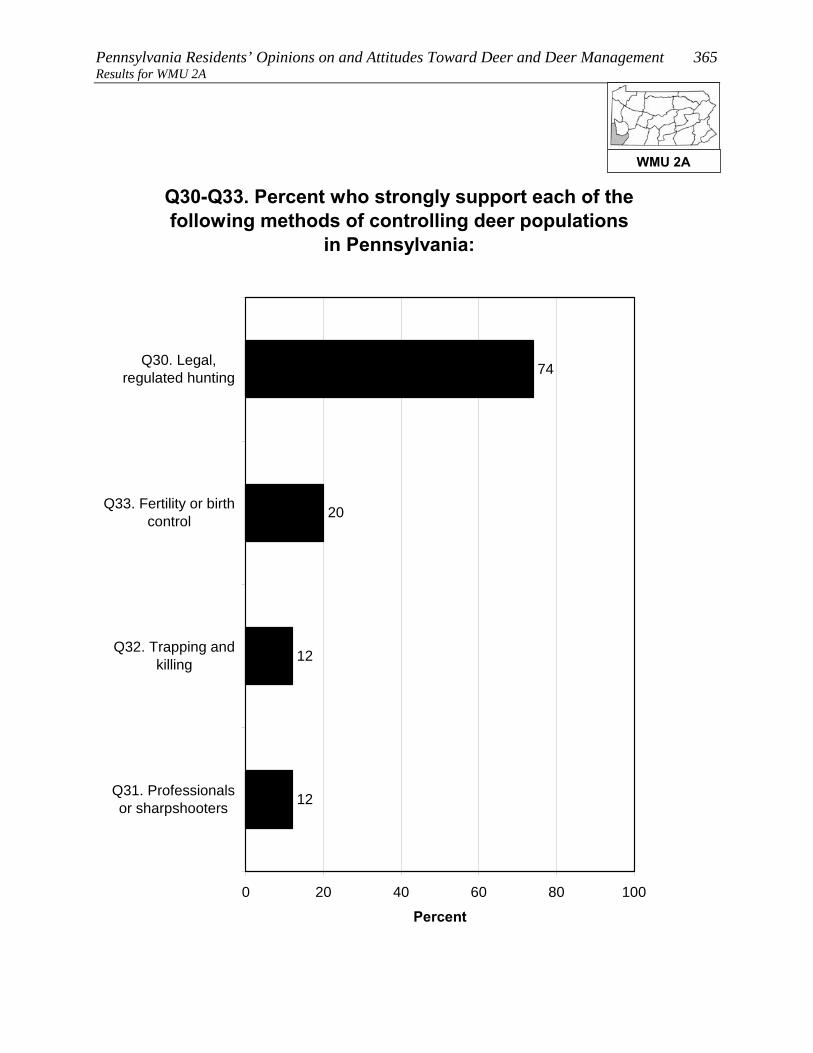
Pennsylvania Residents’ Opinions on and Attitudes Toward Deer and Deer Management 365 Results for WMU 2A
Q30-Q33. Percent who strongly support each of the following methods of controlling deer populations
in Pennsylvania:
12
12
20
74
0 20 40 60 80 100
Q30. Legal,regulated hunting
Q33. Fertility or birthcontrol
Q32. Trapping andkilling
Q31. Professionalsor sharpshooters
Percent
WMU 2A

366 Responsive Management Results for WMU 2A
Q30-Q33. Percent who strongly or moderately support each of the following methods of
controlling deer populations in Pennsylvania:
25
29
36
90
0 20 40 60 80 100
Q30. Legal,regulated hunting
Q33. Fertility or birthcontrol
Q31. Professionalsor sharpshooters
Q32. Trapping andkilling
Percent
WMU 2A

Pennsylvania Residents’ Opinions on and Attitudes Toward Deer and Deer Management 367 Results for WMU 2A
Q30-Q33. Percent who strongly or moderately oppose each of the following methods of
controlling deer populations in Pennsylvania:
8
53
65
69
0 20 40 60 80 100
Q32. Trapping andkilling
Q31. Professionalsor sharpshooters
Q33. Fertility or birthcontrol
Q30. Legal,regulated hunting
Percent
WMU 2A

368 Responsive Management Results for WMU 2A
Q30-Q33. Percent who strongly oppose each of the following methods of controlling deer populations
in Pennsylvania:
4
40
51
53
0 20 40 60 80 100
Q32. Trapping andkilling
Q31. Professionalsor sharpshooters
Q33. Fertility or birthcontrol
Q30. Legal,regulated hunting
Percent
WMU 2A

Pennsylvania Residents’ Opinions on and Attitudes Toward Deer and Deer Management 369 Results for WMU 2A
Q59/60. Deer hunts and/or allows others to deer hunt on property.
38
62
0 20 40 60 80 100
Yes
No
Percent (n=381)
WMU 2A

370 Responsive Management Results for WMU 2A
Q59/60. Deer hunts and/or allows others to deer hunt on property.
3
97
0 20 40 60 80 100
Yes
No
Percent
Lives in a single-family home on 1 acre orless in an urban area, a suburban area, ora small city/town (n=105)
WMU 2A
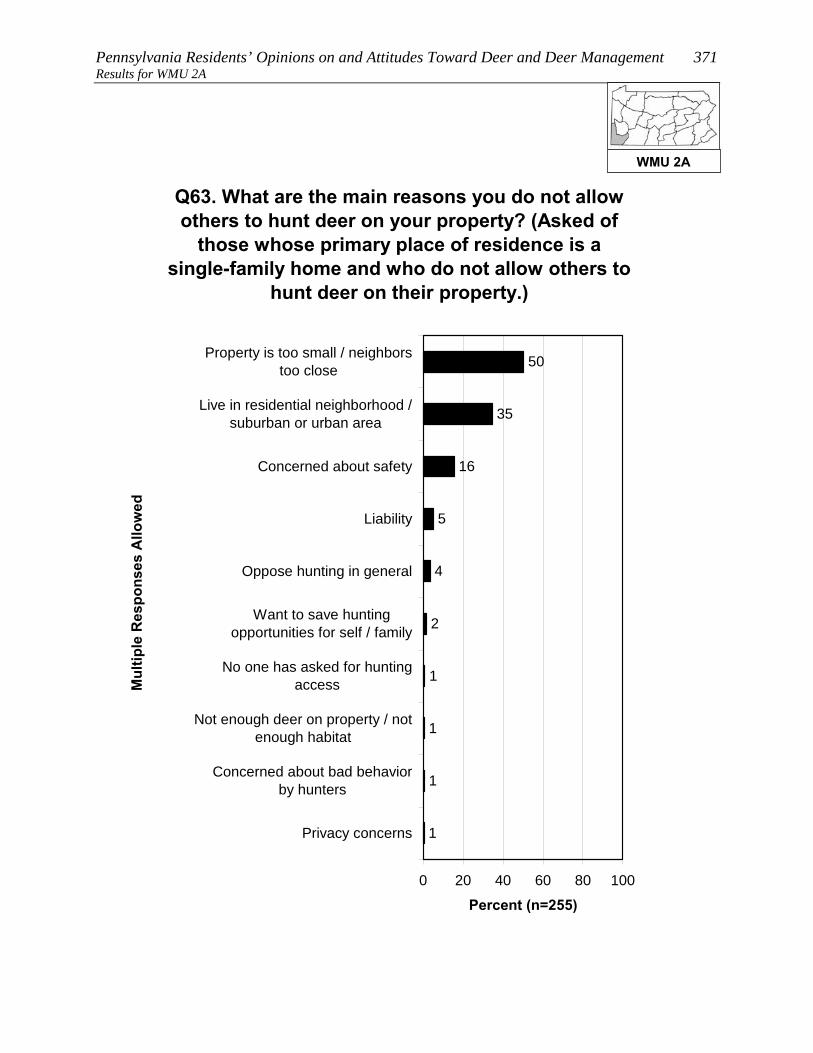
Pennsylvania Residents’ Opinions on and Attitudes Toward Deer and Deer Management 371 Results for WMU 2A
Q63. What are the main reasons you do not allow others to hunt deer on your property? (Asked of
those whose primary place of residence is a single-family home and who do not allow others to
hunt deer on their property.)
1
1
1
50
35
16
5
4
2
1
0 20 40 60 80 100
Property is too small / neighborstoo close
Live in residential neighborhood /suburban or urban area
Concerned about safety
Liability
Oppose hunting in general
Want to save huntingopportunities for self / family
No one has asked for huntingaccess
Not enough deer on property / notenough habitat
Concerned about bad behaviorby hunters
Privacy concerns
Mul
tiple
Res
pons
es A
llow
ed
Percent (n=255)
WMU 2A

372 Responsive Management Results for WMU 2A
Q65. How likely are you to ever allow others to deer hunt on your property? (Asked of those whose
primary place of residence is a single-family home and who do not allow others to hunt deer on their
property.)
2
3
1
6
87
1
0 20 40 60 80 100
Very likely
Somewhat likely
Neither likely norunlikely
Somewhat unlikely
Very unlikely
Don't know
Percent (n=255)
WMU 2A
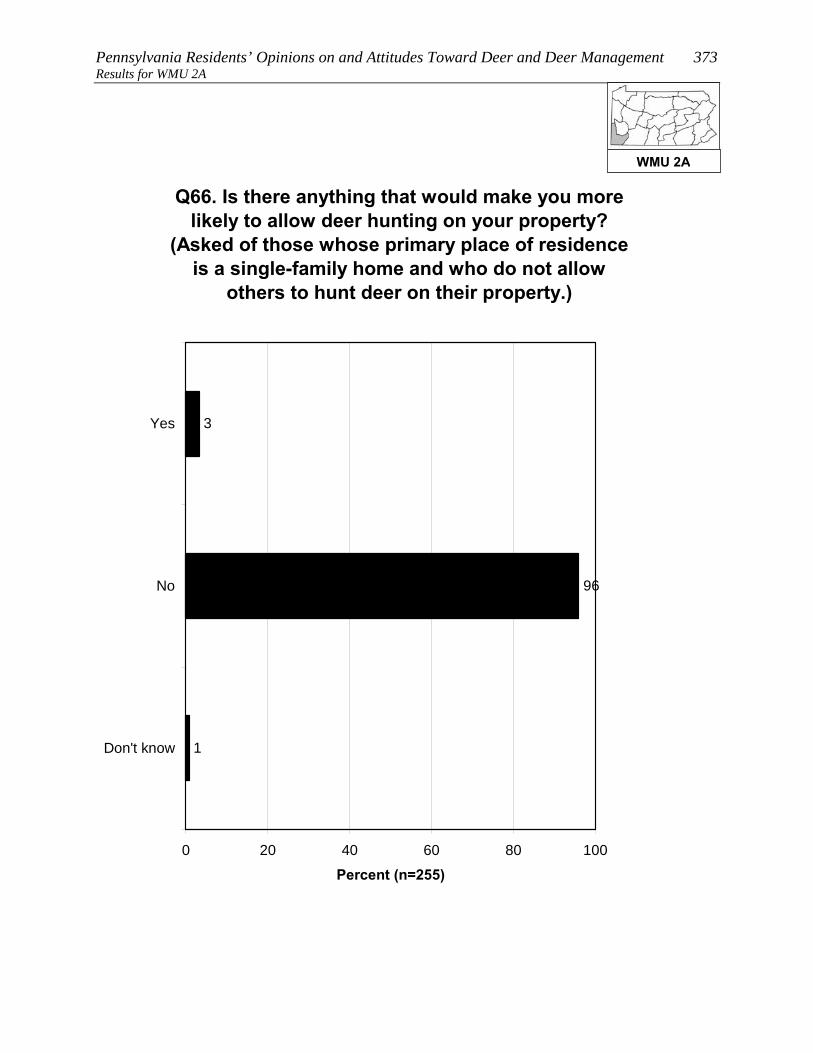
Pennsylvania Residents’ Opinions on and Attitudes Toward Deer and Deer Management 373 Results for WMU 2A
Q66. Is there anything that would make you more likely to allow deer hunting on your property?
(Asked of those whose primary place of residence is a single-family home and who do not allow
others to hunt deer on their property.)
3
96
1
0 20 40 60 80 100
Yes
No
Don't know
Percent (n=255)
WMU 2A

374 Responsive Management Results for WMU 2A
Q65. How likely are you to ever allow others to deer hunt on your property? (Asked of those whose
primary place of residence is a single-family home and who do not allow others to hunt deer on their
property.)
3
0
1
0
96
1
0 20 40 60 80 100
Very likely
Somewhat likely
Neither likely norunlikely
Somewhatunlikely
Very unlikely
Don't know
Percent
Lives in a single-family home on 1 acreor less in an urban area, a suburbanarea, or a small city/town (n=101)
WMU 2A

Pennsylvania Residents’ Opinions on and Attitudes Toward Deer and Deer Management 375 Results for WMU 2A CONCERNS ABOUT DEER AND DEER NUISANCE PROBLEMS
Seven questions asked about respondents’ level of concern about
issues associated with deer. For each issue, respondents rated their
level of concern about it using a 10-point scale, with 10 being the most
concerned.
• The most concern was for deer-vehicle accidents (mean rating of 7.5) and tick-borne
diseases (7.2), followed by two more whose means are just under those top two: the
health of the deer population (6.5) and the quality of deer habitat (5.8).
• At the bottom are concern about deer impacts on habitat and other wildlife (even
though this can be considerable) (3.6) and the two impacts to residents’ landscaping:
deer damage to plants and landscaping (3.0) and deer droppings in the yard (1.9).
o Another graph shows the percentage who gave a high rating (a “9” or “10”),
providing an idea of the percentage who feel strongly about the issues.
Among residents of WMU 2A, 87% indicated that they saw deer on their property in the past
12 months.
• Respondents who fed birds were more likely to indicate seeing deer, as were
respondents who fed deer or put out attractants or were aware of neighbors who fed
deer or put out attractants.
The survey asked about specific nuisance problems with deer that residents of WMU 2A may
have experienced: 15% indicated that they experienced problems with deer at their primary
place of residence in the past 12 months; 23% indicated that they or another household
member had been in a vehicle collision with a deer (respondents report that almost 1 in 10 of
these accidents caused an injury to the driver and/or a passenger); and 1% indicated that they
or a household member had been diagnosed with a tick-borne disease.
• A crosstabulation shows that those who fed birds and those who did not were about the
same regarding experiencing deer problems. However, those who were aware of
neighbors feeding deer or putting out attractants were about twice as likely to
experience deer problems, compared to those who did not say that they were aware of
neighbors doing this.
WMU 2A

376 Responsive Management Results for WMU 2A
Q36-Q42. Mean rating of respondents' concern about each of the following on a 10-point scale:
3.0
3.6
5.8
6.5
7.2
7.5
1.9
0 2 4 6 8 10
Q40. Deer-vehicle accidents inPennsylvania
Q36. Tick-borne diseases, such as Lymedisease, in Pennsylvania
Q42. The health of the deer population,such as adequate food resources for the
size of the deer herd, in Pennsylvania
Q41. The quality of deer habitat inPennsylvania
Q39. Deer impacts on the habitat andother wildlife in Pennsylvania
Q38. Deer damage to plants andlandscaping in his/her yard
Q37. Deer droppings in his/her yard
Mean
WMU 2A

Pennsylvania Residents’ Opinions on and Attitudes Toward Deer and Deer Management 377 Results for WMU 2A
Q36-Q42. Percent who rated their concern about each of the following as a 9 or 10 on a 10-point
scale:
7
9
19
26
43
47
6
0 20 40 60 80 100
Q40. Deer-vehicle accidents inPennsylvania
Q36. Tick-borne diseases, such as Lymedisease, in Pennsylvania
Q42. The health of the deer population,such as adequate food resources for the
size of the deer herd, in Pennsylvania
Q41. The quality of deer habitat inPennsylvania
Q38. Deer damage to plants andlandscaping in his/her yard
Q39. Deer impacts on the habitat andother wildlife in Pennsylvania
Q37. Deer droppings in his/her yard
Percent
WMU 2A

378 Responsive Management Results for WMU 2A
Q49. How often have you seen deer on your property in the past 12 months?
60
15
11
12
1
0 20 40 60 80 100
Frequently
Sometimes
Rarely
Never
Don't know
Percent (n=415)
WMU 2A

Pennsylvania Residents’ Opinions on and Attitudes Toward Deer and Deer Management 379 Results for WMU 2A
Q49. How often have you seen deer on your property in the past 12 months?
68
16
9
6
1
14
14
54
18
0
0 20 40 60 80 100
Frequently
Sometimes
Rarely
Never
Don't know
Percent
Fed birds on his / herproperty in the past 12months (n=199)Did not feed birds on his /her property in the past 12months (n=214)
WMU 2A
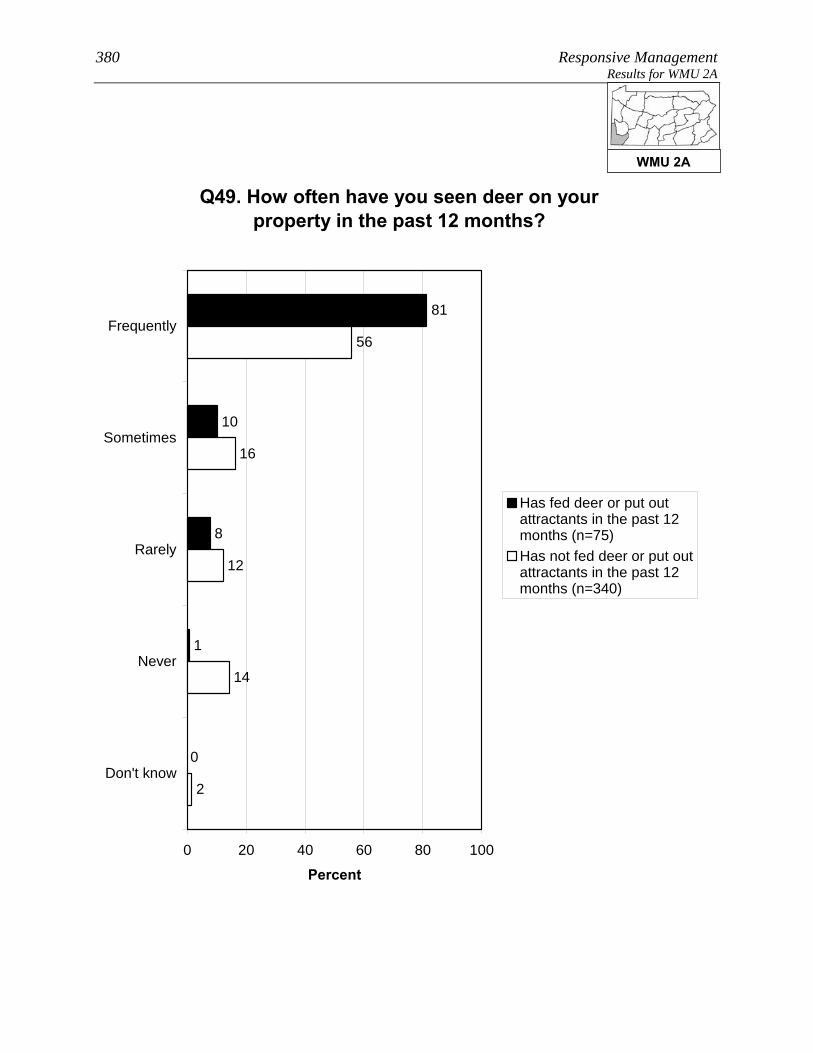
380 Responsive Management Results for WMU 2A
Q49. How often have you seen deer on your property in the past 12 months?
81
10
8
1
0
12
16
56
14
2
0 20 40 60 80 100
Frequently
Sometimes
Rarely
Never
Don't know
Percent
Has fed deer or put outattractants in the past 12months (n=75)Has not fed deer or put outattractants in the past 12months (n=340)
WMU 2A

Pennsylvania Residents’ Opinions on and Attitudes Toward Deer and Deer Management 381 Results for WMU 2A
Q49. How often have you seen deer on your property in the past 12 months?
71
15
8
7
0
13
16
56
14
1
0 20 40 60 80 100
Frequently
Sometimes
Rarely
Never
Don't know
Percent
Is aware of neighborsfeeding deer or putting outattractants in the past 12months (n=95)Is not aware of neighborsfeeding deer or putting outattractants in the past 12months (n=310)
WMU 2A

382 Responsive Management Results for WMU 2A
Q43. In the past 12 months, have you experienced any problems with deer at your primary place of
residence?
15
85
0 20 40 60 80 100
Yes
No
Percent (n=415)
WMU 2A

Pennsylvania Residents’ Opinions on and Attitudes Toward Deer and Deer Management 383 Results for WMU 2A
Q43. In the past 12 months, have you experienced any problems with deer at your primary place of
residence?
15
85
85
15
0 20 40 60 80 100
Yes
No
Percent
Fed birds on his / herproperty in the past 12months (n=199)Did not feed birds on his /her property in the past 12months (n=214)
WMU 2A

384 Responsive Management Results for WMU 2A
Q43. In the past 12 months, have you experienced any problems with deer at your primary place of
residence?
24
76
88
12
0 20 40 60 80 100
Yes
No
Percent
Is aware of neighborsfeeding deer or putting outattractants in the past 12months (n=95)Is not aware of neighborsfeeding deer or putting outattractants in the past 12months (n=310)
WMU 2A

Pennsylvania Residents’ Opinions on and Attitudes Toward Deer and Deer Management 385 Results for WMU 2A
Q44. In the past 12 months, have you or any other person living in your immediate household been in a vehicle collision with or an accident involving a
deer on Pennsylvania's roads or highways?
23
77
0 20 40 60 80 100
Yes
No
Percent (n=415)
WMU 2A

386 Responsive Management Results for WMU 2A
Q45. Were you or anyone else injured? (Asked of those who had a household member who was in or
who have personally been in a vehicle collision with or an accident involving a deer on
Pennsylvania's roads or highways in the past 12 months.)
9
91
0 20 40 60 80 100
Yes
No
Percent (n=90)
WMU 2A

Pennsylvania Residents’ Opinions on and Attitudes Toward Deer and Deer Management 387 Results for WMU 2A
Q46. In the past 12 months, have you or any other person living in your immediate household been
diagnosed by a physician with a tick-borne disease, such as Lyme disease?
1
99
0 20 40 60 80 100
Yes
No
Percent (n=415)
WMU 2A
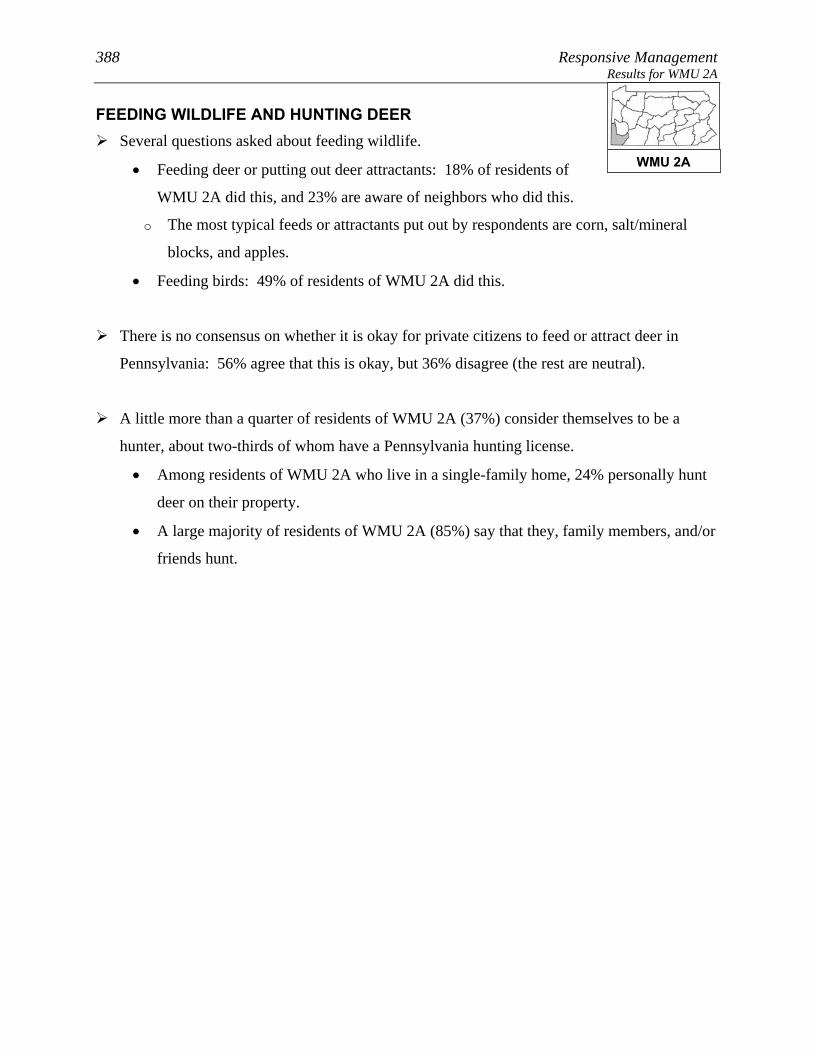
388 Responsive Management Results for WMU 2A
FEEDING WILDLIFE AND HUNTING DEER Several questions asked about feeding wildlife.
• Feeding deer or putting out deer attractants: 18% of residents of
WMU 2A did this, and 23% are aware of neighbors who did this.
o The most typical feeds or attractants put out by respondents are corn, salt/mineral
blocks, and apples.
• Feeding birds: 49% of residents of WMU 2A did this.
There is no consensus on whether it is okay for private citizens to feed or attract deer in
Pennsylvania: 56% agree that this is okay, but 36% disagree (the rest are neutral).
A little more than a quarter of residents of WMU 2A (37%) consider themselves to be a
hunter, about two-thirds of whom have a Pennsylvania hunting license.
• Among residents of WMU 2A who live in a single-family home, 24% personally hunt
deer on their property.
• A large majority of residents of WMU 2A (85%) say that they, family members, and/or
friends hunt.
WMU 2A

Pennsylvania Residents’ Opinions on and Attitudes Toward Deer and Deer Management 389 Results for WMU 2A
Q50. Did you ever feed deer intentionally or put out attractants, such as a salt or mineral block, in the
past 12 months?
18
82
0 20 40 60 80 100
Yes
No
Percent (n=415)
WMU 2A
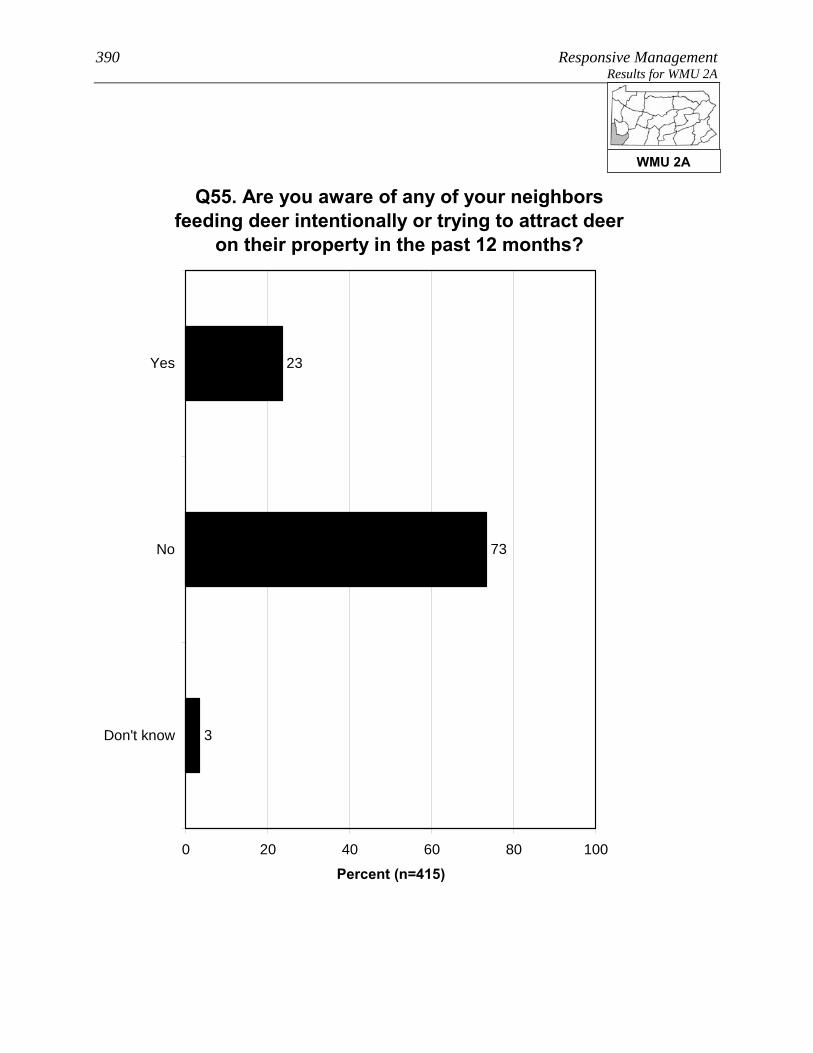
390 Responsive Management Results for WMU 2A
Q55. Are you aware of any of your neighbors feeding deer intentionally or trying to attract deer
on their property in the past 12 months?
23
73
3
0 20 40 60 80 100
Yes
No
Don't know
Percent (n=415)
WMU 2A
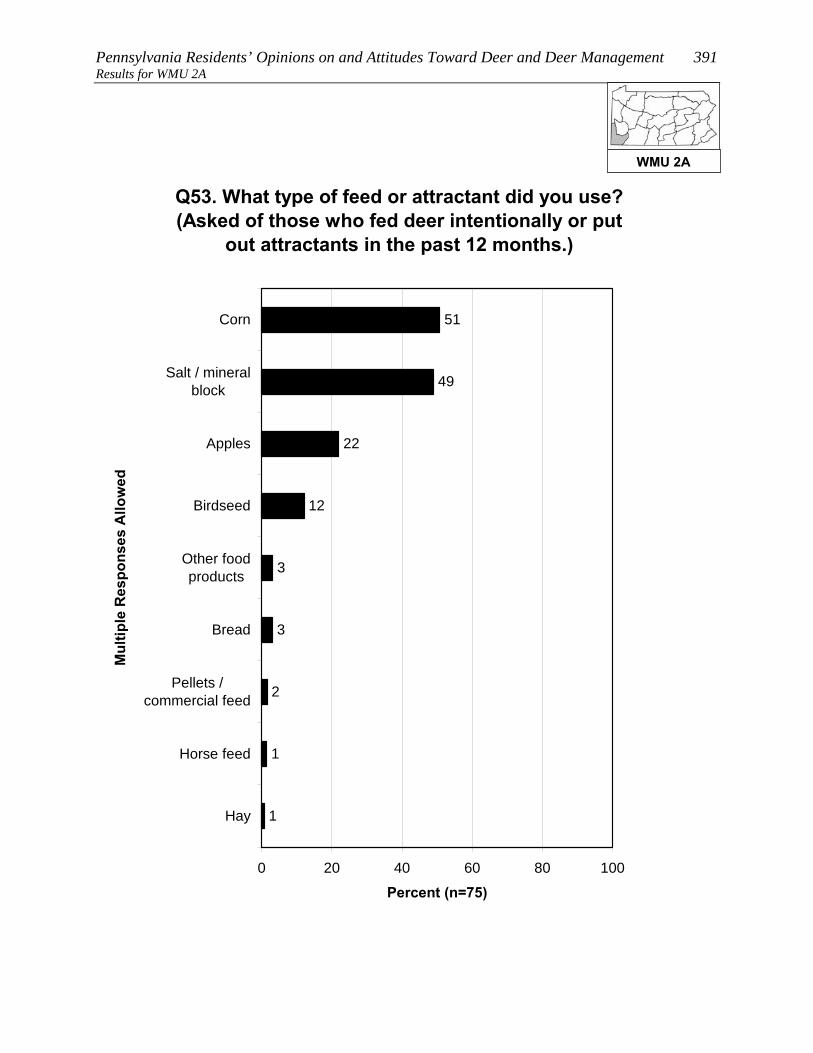
Pennsylvania Residents’ Opinions on and Attitudes Toward Deer and Deer Management 391 Results for WMU 2A
Q53. What type of feed or attractant did you use? (Asked of those who fed deer intentionally or put
out attractants in the past 12 months.)
1
1
2
51
49
22
12
3
3
0 20 40 60 80 100
Corn
Salt / mineralblock
Apples
Birdseed
Other foodproducts
Bread
Pellets /commercial feed
Horse feed
Hay
Mul
tiple
Res
pons
es A
llow
ed
Percent (n=75)
WMU 2A

392 Responsive Management Results for WMU 2A
Q48. Did you feed birds or make birdfeed available on your property in the past 12 months?
49
50
1
0 20 40 60 80 100
Yes
No
Don't know
Percent (n=415)
WMU 2A
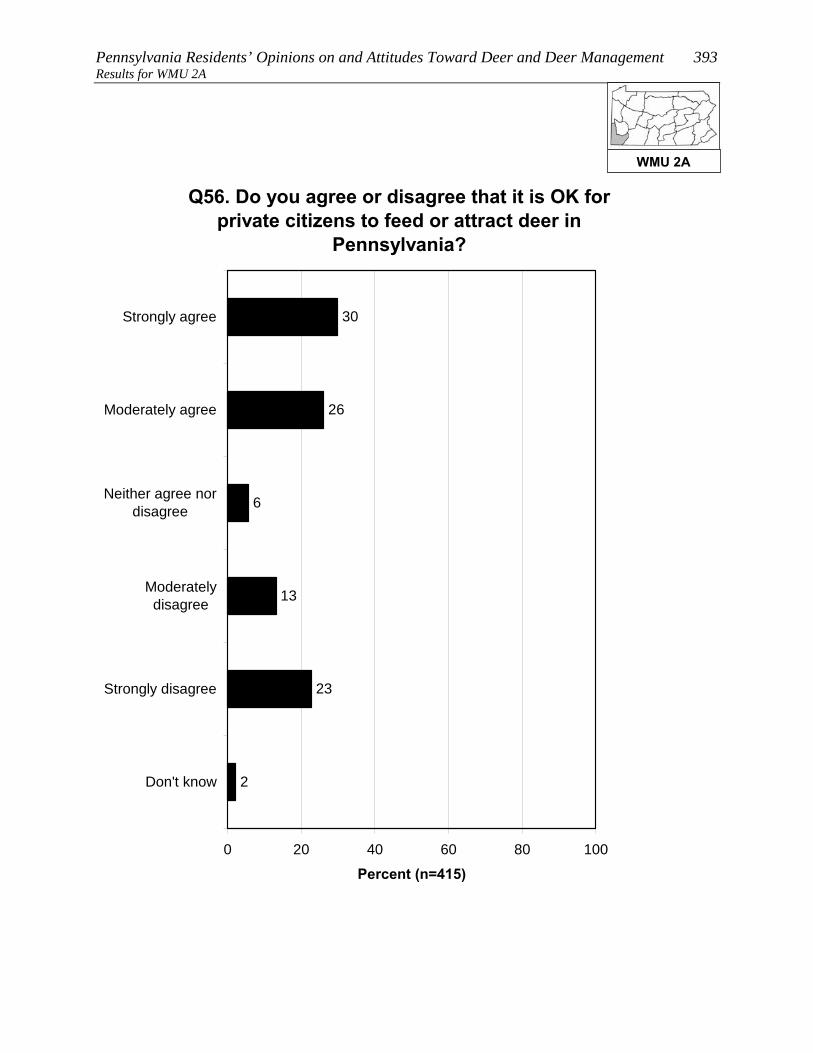
Pennsylvania Residents’ Opinions on and Attitudes Toward Deer and Deer Management 393 Results for WMU 2A
Q56. Do you agree or disagree that it is OK for private citizens to feed or attract deer in
Pennsylvania?
30
26
6
13
23
2
0 20 40 60 80 100
Strongly agree
Moderately agree
Neither agree nordisagree
Moderatelydisagree
Strongly disagree
Don't know
Percent (n=415)
WMU 2A
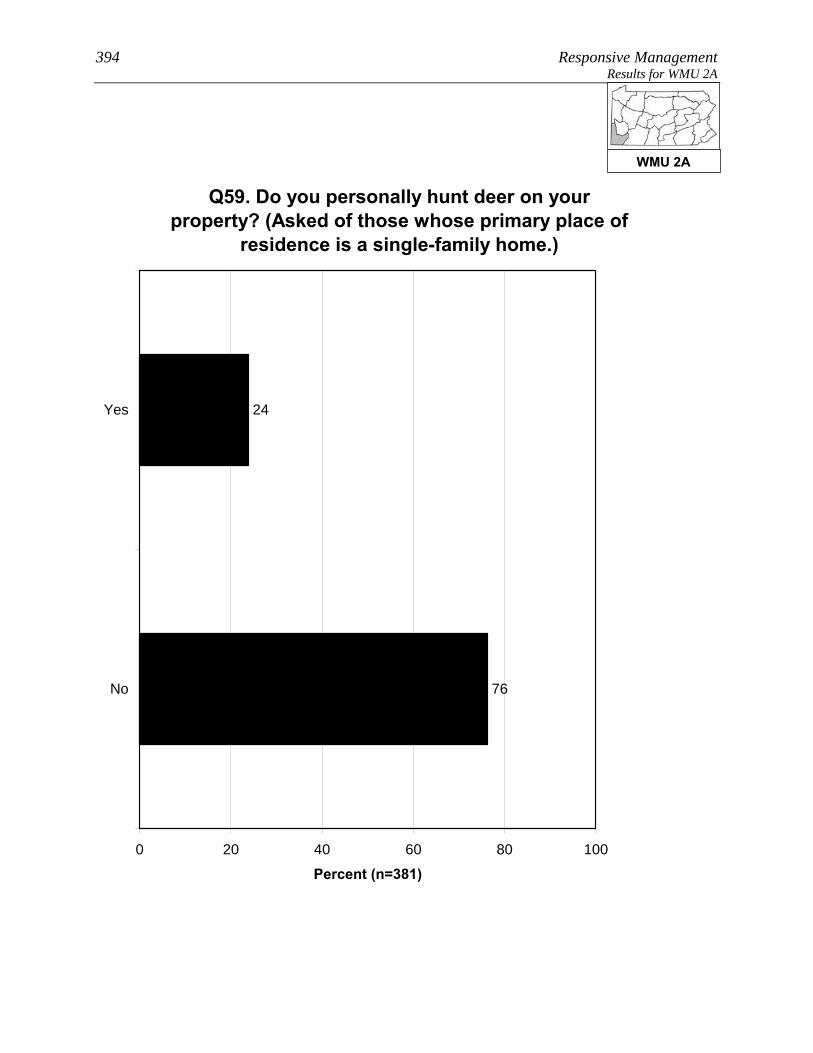
394 Responsive Management Results for WMU 2A
Q59. Do you personally hunt deer on your property? (Asked of those whose primary place of
residence is a single-family home.)
24
76
0 20 40 60 80 100
Yes
No
Percent (n=381)
WMU 2A

Pennsylvania Residents’ Opinions on and Attitudes Toward Deer and Deer Management 395 Results for WMU 2A
Q79. Do you, any of your family members, or any friends hunt any wildlife species?
85
15
1
0 20 40 60 80 100
Yes
No
Don't know
Percent (n=415)
WMU 2A

396 Responsive Management Results for WMU 2A
SOURCES OF INFORMATION Most commonly, residents of WMU 2A say that the best way to
provide them with information about deer in Pennsylvania is through
direct mail (47% gave this response), followed by newspaper (19%),
the Internet (12% saying an Internet site other than the PGC and 2%
saying the agency website; note that some said both) and email (12%).
A little more than a third of residents of WMU 2A (39%) use social media, the most common
primary site being Facebook.
WMU 2A

Pennsylvania Residents’ Opinions on and Attitudes Toward Deer and Deer Management 397 Results for WMU 2A
Q82. What is the best way to provide you with information about deer in Pennsylvania?
10
2
3
4
47
19
12
12
9
5
2
1
1
1
1
2
0 20 40 60 80 100
Direct mail
Newspaper
Internet / website other than PGCwebsite
TV
Telephone
Brochures or pamphlets
Social media
Radio
PA Game Commission website
PA Hunting and Trapping Digest
Magazines
Public presentations
PA Game Commission offices
Other
Don't know
Mul
tiple
Res
pons
es A
llow
ed
Percent (n=415)
WMU 2A

398 Responsive Management Results for WMU 2A
Q84. Do you use social media, such as Facebook, Twitter, or YouTube?
39
61
0 20 40 60 80 100
Yes
No
Percent (n=415)
WMU 2A
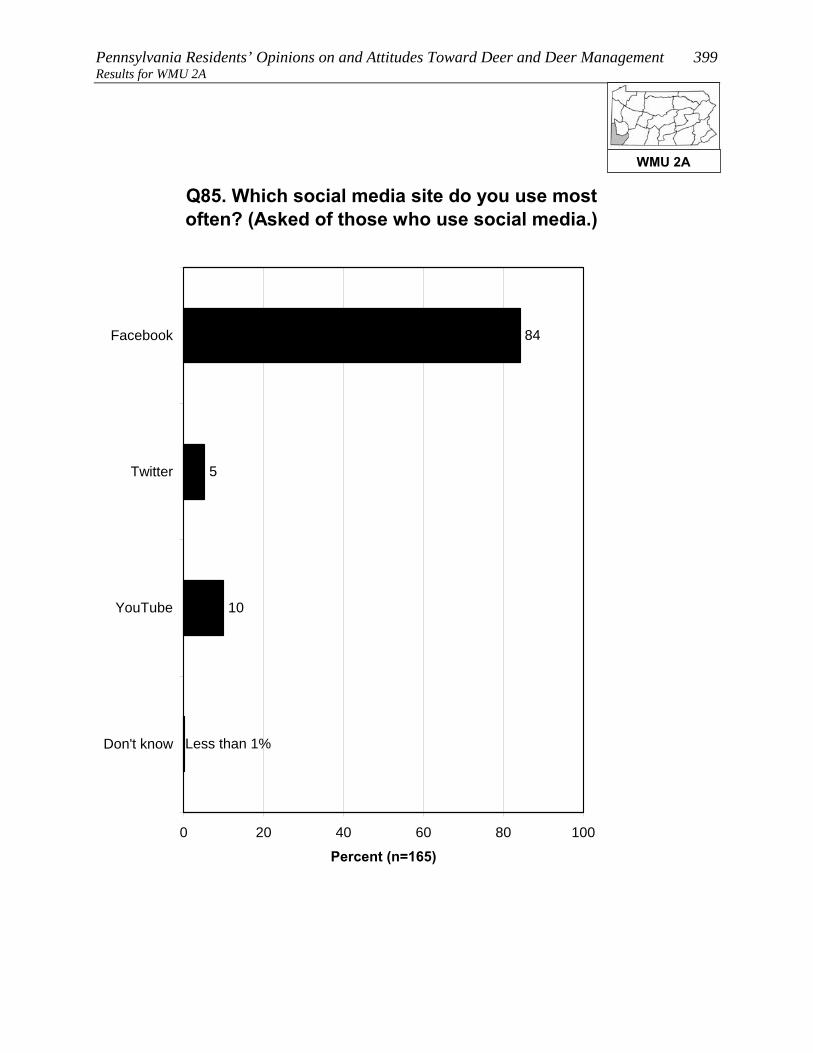
Pennsylvania Residents’ Opinions on and Attitudes Toward Deer and Deer Management 399 Results for WMU 2A
Q85. Which social media site do you use most often? (Asked of those who use social media.)
84
5
10
Less than 1%
0 20 40 60 80 100
YouTube
Don't know
Percent (n=165)
WMU 2A

400 Responsive Management Results for WMU 2B
RESULTS FOR WMU 2B Location: From Washington, I-79 north to PA Rt. 980 near Canonsburg; PA Rt. 980 north to US Rt. 22 near Santiago; US Rt. 22 east to I-376 near Moon Run; I-376 west to I-76 near New Beaver; I-76 east to PA Rt. 228 at Cranberry to PA Rt. 356 near Sarver to PA Rt. 66 near North Washington; Toll Road Rt. 66 south to US Rt. 119 south to I-70 near New Stanton; I-70 west to I-79 at Washington.

Pennsylvania Residents’ Opinions on and Attitudes Toward Deer and Deer Management 401 Results for WMU 2B
8. Lives in WMU 2B 2. Has seen deer frequently on his/her property in the past 12 months (p < 0.01). 3. Does not indicate having taken a trip more than a mile from home for the primary purpose of viewing or watching deer in the past 12 months (p < 0.001). 3. Does not indicate having fed birds or made birdfeed available on his/her property in the past 12 months (p < 0.001). 3. Does not Indicate that he/she or any of his/her family members hunt (p < 0.001). 3. Does not indicate having a valid 2011 PA general hunting license (p < 0.001). 3. Does not indicate having used a spotlight to view deer at night on a trip to watch deer in the past 12 months (p < 0.01). 3. Does not indicate having fed deer intentionally or having put out attractants in the past 12 months (p < 0.01). 3. Does not indicate considering himself/herself to be a hunter (p < 0.05). 3. Has spent time viewing or watching deer around home in the past 12 months (p < 0.05). 4. Considers the deer population in his/her area to be too high (p < 0.001). 4. Strongly or moderately supports fertility or birth control as a method of controlling deer populations in PA (p < 0.001). 4. Strongly or moderately supports professionals or sharpshooters as a method of controlling deer populations in PA (p < 0.001). 4. Strongly or moderately agrees that deer populations should be managed for safe and acceptable levels of deer-human conflicts (p < 0.01). 5. Rates concern about deer-vehicle accidents in PA as a 9 or 10 (p < 0.001). 5. Rates concern about deer damage to plants and landscaping in their yard as a 9 or 10 (p < 0.001). 5. Indicates having experienced a problem with deer at his/her primary place of residence in the past 12 months (p < 0.001). 5. Rates concern about deer droppings in their yard as a 9 or a 10 (p < 0.001). 5. Does not strongly or moderately agree that it is OK for private citizens to feed or attract deer in PA (p < 0.001). 5. Does not indicate that he/she or another person living in the immediate household has been diagnosed by a physician with a tick-borne disease in the past 12 months (p < 0.001). 6. Does not rate concern about the health of the deer population in PA as a 9 or 10 (p < 0.01). 8. Considers place of residence to be an urban or suburban area (p < 0.001). 8. Primary place of residence is a single-family home (p < 0.05). See page 9 through 11 for explanation of how to interpret z-score tables.
WMU 2B
402 Responsive Management Results for WMU 2B
PARTICIPATION IN VIEWING DEER Just over two-thirds of residents of WMU 2B (68%) spent time
viewing deer around their home in the past 12 months, and 16% took a
trip of at least a mile to view deer.
• About a fifth of those who took a deer-viewing trip (22%) used a spotlight to view the
deer at night.
A majority of residents of WMU 2B (72%) are satisfied with opportunities to view deer in
Pennsylvania. Because a relatively large percentage answer neutrally, only 9% indicate
being dissatisfied.
WMU 2B

Pennsylvania Residents’ Opinions on and Attitudes Toward Deer and Deer Management 403 Results for WMU 2B
Q10. Have you spent time viewing or watching deer around your home in the past 12 months?
68
32
0 20 40 60 80 100
Yes
No
Percent (n=429)
WMU 2B

404 Responsive Management Results for WMU 2B
Q11. Have you taken a trip at least 1 mile from your home for the primary purpose of viewing or
watching deer in the past 12 months?
16
84
0 20 40 60 80 100
Yes
No
Percent (n=429)
WMU 2B

Pennsylvania Residents’ Opinions on and Attitudes Toward Deer and Deer Management 405 Results for WMU 2B
Q12. Did you use a spotlight to view deer at night on a trip to watch deer in the past 12 months?
(Asked of those who took a trip at least 1 mile from their home for the primary purpose of viewing or
watching deer in the past 12 months.)
22
78
0 20 40 60 80 100
Yes
No
Percent (n=73)
WMU 2B
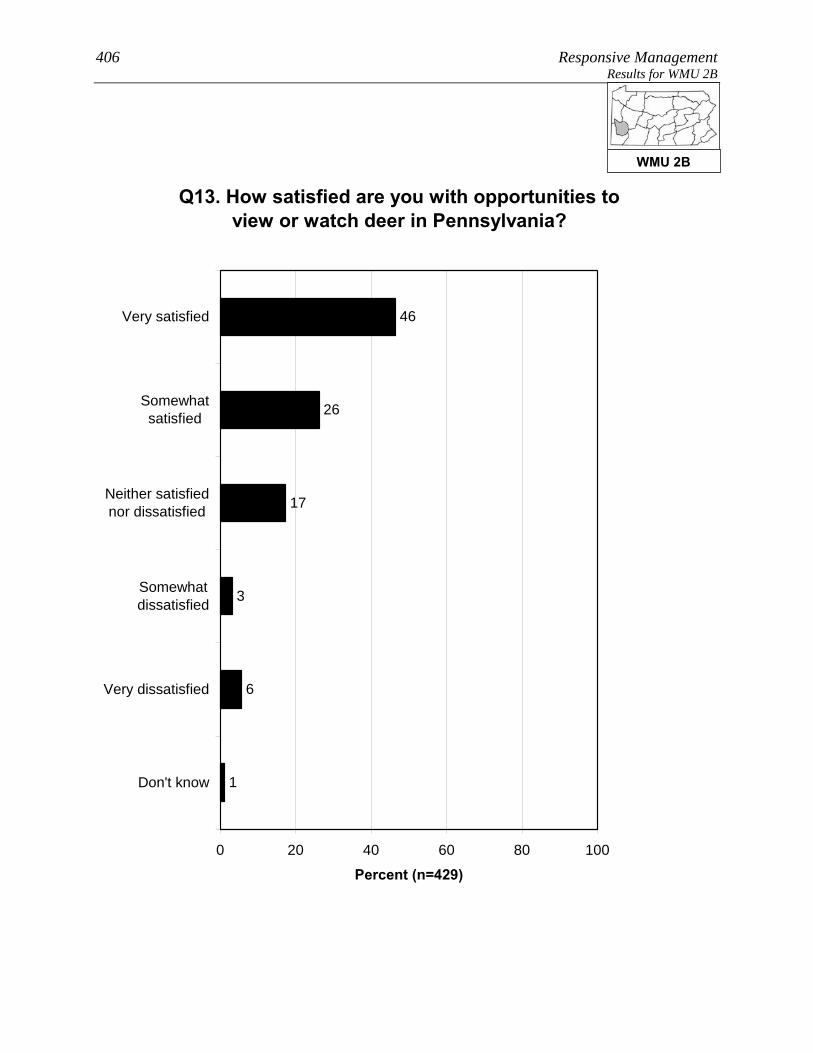
406 Responsive Management Results for WMU 2B
Q13. How satisfied are you with opportunities to view or watch deer in Pennsylvania?
46
26
17
3
6
1
0 20 40 60 80 100
Very satisfied
Somewhatsatisfied
Neither satisfiednor dissatisfied
Somewhatdissatisfied
Very dissatisfied
Don't know
Percent (n=429)
WMU 2B

Pennsylvania Residents’ Opinions on and Attitudes Toward Deer and Deer Management 407 Results for WMU 2B OPINIONS ON DEER IN GENERAL AND THE SIZE AND HEALTH OF THE DEER HERD
Opinion on deer is mostly favorable: 41% of residents of WMU 2B
say with no caveats that they like having deer around, another 34%
like having deer around but worry about the problems they may cause,
and only 8% generally regard them as a nuisance. The remainder have
no particular feeling about deer.
Another question asked residents of WMU 2B how deer-related issues compared to other
issues in their life, on a scale of 0 to 10, with the most importance being 10: the median
rating is “5.” The most common ratings are the midpoint of “5” (20%) and “0” (18%). In
general, ratings are well spread across the scale.
Two other ratings questions asked respondents to rate their concern about deer-related issues.
The median level of concern is “6” for the quality of deer habitat in Pennsylvania and “6” for
the health of the deer population in Pennsylvania.
The survey asked about the perceived size of the deer herd in the respondent’s area. The
majority of residents of WMU 2B say that the herd size is just right (52%); otherwise, more
say that it is too high (32%) than too low (9%).
• Those who own their home are about the same as those who do not own their home
regarding their feelings about the deer population in their area.
• Those who consider themselves to be a hunter are more likely to say that the deer
population in their area is too low, compared to those who are not hunters.
WMU 2B

408 Responsive Management Results for WMU 2B
Q14. Generally, which of the following best describes your feelings about deer in
Pennsylvania?
41
34
8
16
1
0 20 40 60 80 100
I like having deeraround
I like having deeraround but worryabout problems
they cause
I generally regarddeer as a nuisance
I have no particularfeeling about deer
Don't know
Percent (n=429)
WMU 2B
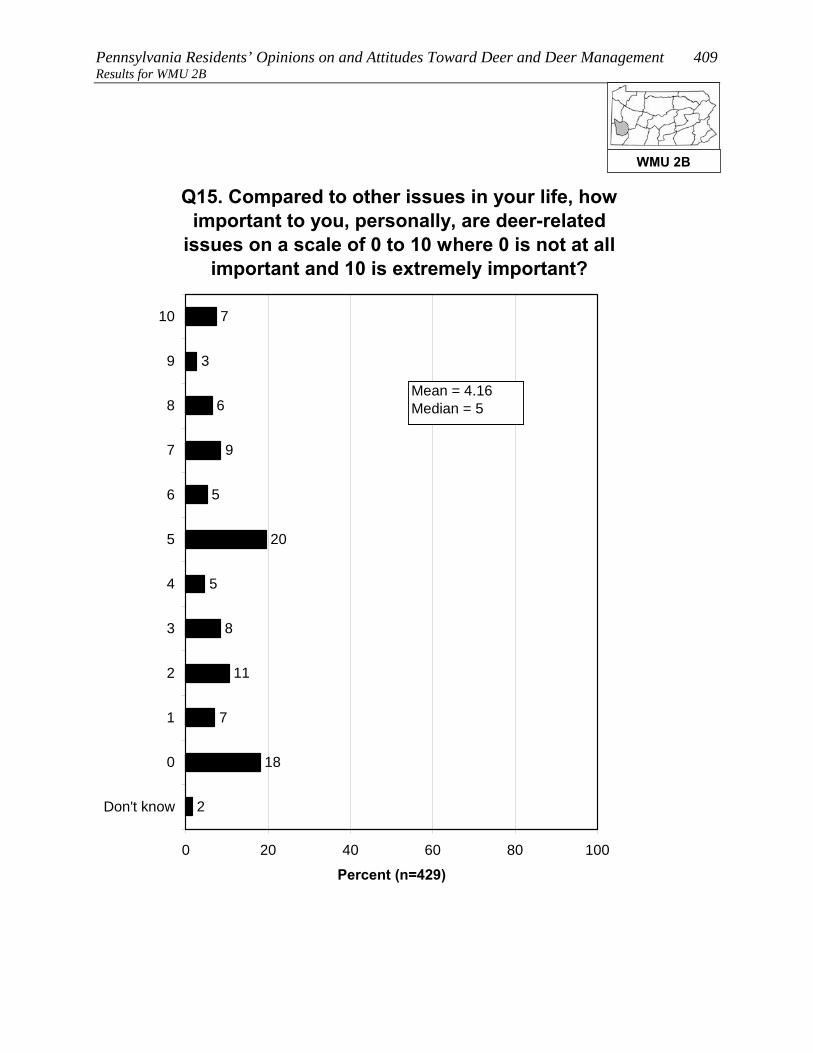
Pennsylvania Residents’ Opinions on and Attitudes Toward Deer and Deer Management 409 Results for WMU 2B
Q15. Compared to other issues in your life, how important to you, personally, are deer-related
issues on a scale of 0 to 10 where 0 is not at all important and 10 is extremely important?
11
8
5
7
3
6
9
5
20
7
18
2
0 20 40 60 80 100
10
9
8
7
6
5
4
3
2
1
0
Don't know
Percent (n=429)
Mean = 4.16Median = 5
WMU 2B

410 Responsive Management Results for WMU 2B
Q41. How about the quality of deer habitat in Pennsylvania? (How much of a concern is this for you personally on a scale of 0 to 10 where 0 is not at all concerned and 10 is extremely concerned?)
3
4
3
12
4
16
11
10
22
1
9
3
0 20 40 60 80 100
10
9
8
7
6
5
4
3
2
1
0
Don't know
Percent (n=429)
Mean = 5.93Median = 6
WMU 2B
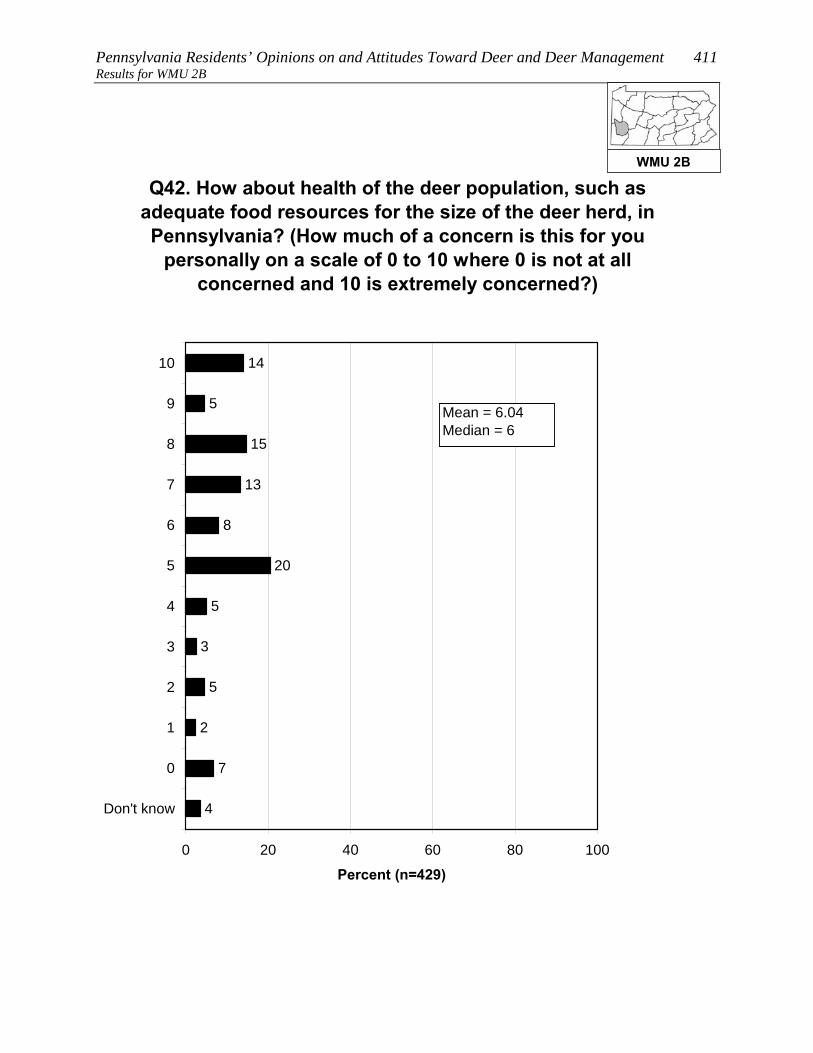
Pennsylvania Residents’ Opinions on and Attitudes Toward Deer and Deer Management 411 Results for WMU 2B
5
3
5
14
5
15
13
8
20
2
7
4
0 20 40 60 80 100
10
9
8
7
6
5
4
3
2
1
0
Don't know
Percent (n=429)
Q42. How about health of the deer population, such as adequate food resources for the size of the deer herd, in Pennsylvania? (How much of a concern is this for you
personally on a scale of 0 to 10 where 0 is not at all concerned and 10 is extremely concerned?)
Mean = 6.04Median = 6
WMU 2B
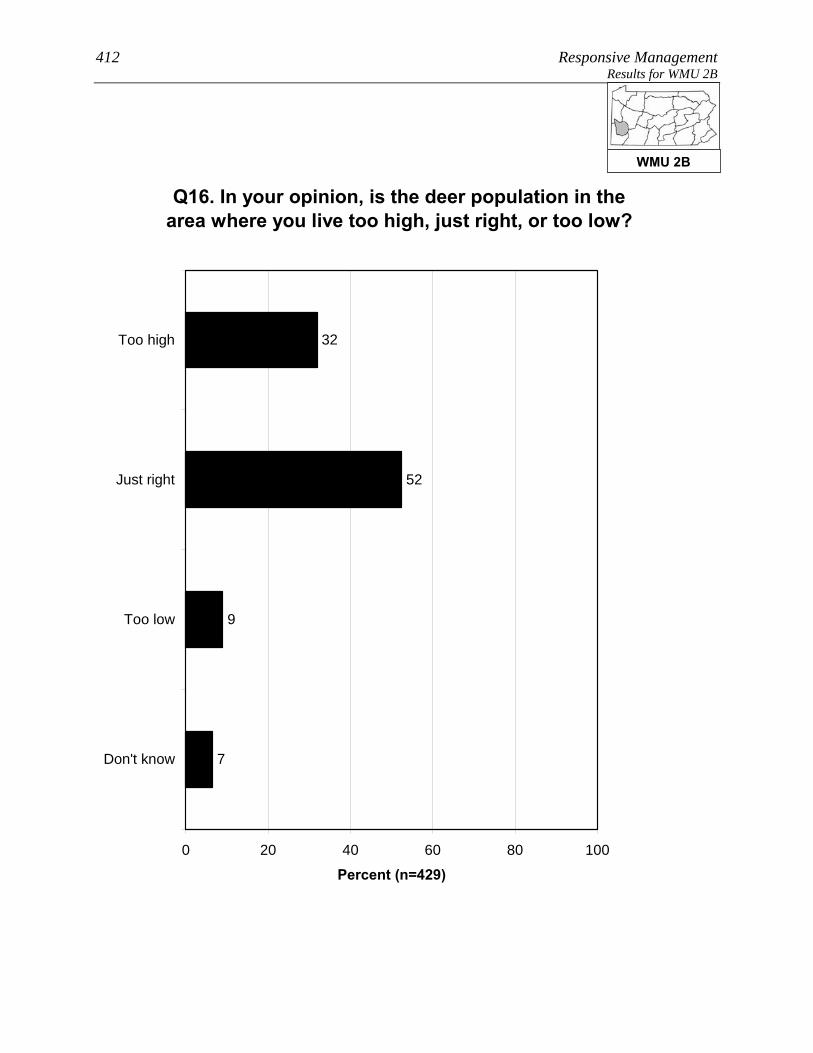
412 Responsive Management Results for WMU 2B
Q16. In your opinion, is the deer population in the area where you live too high, just right, or too low?
32
52
9
7
0 20 40 60 80 100
Too high
Just right
Too low
Don't know
Percent (n=429)
WMU 2B
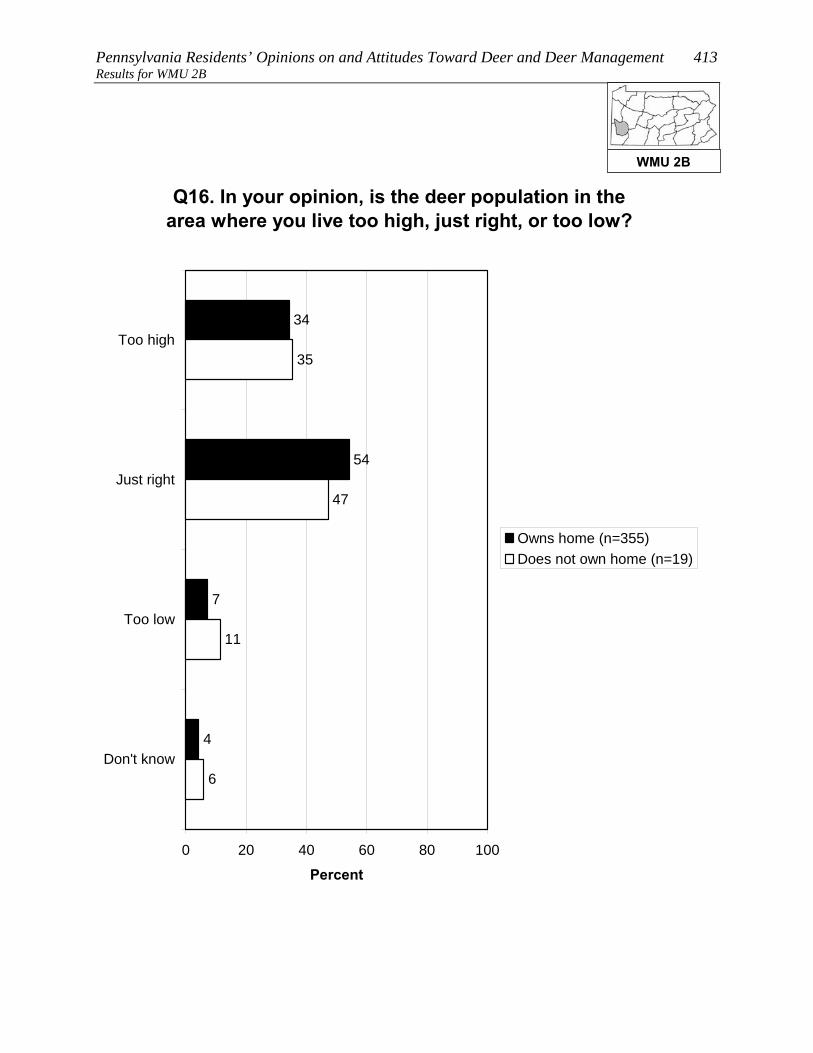
Pennsylvania Residents’ Opinions on and Attitudes Toward Deer and Deer Management 413 Results for WMU 2B
Q16. In your opinion, is the deer population in the area where you live too high, just right, or too low?
34
54
7
4
11
47
35
6
0 20 40 60 80 100
Too high
Just right
Too low
Don't know
Percent
Owns home (n=355)Does not own home (n=19)
WMU 2B

414 Responsive Management Results for WMU 2B
Q16. In your opinion, is the deer population in the area where you live too high, just right, or too low?
23
50
23
4
4
53
36
7
0 20 40 60 80 100
Too high
Just right
Too low
Don't know
Percent
Consider themselves ahunter (n=112)Do not consider themselvesa hunter (n=316)
WMU 2B
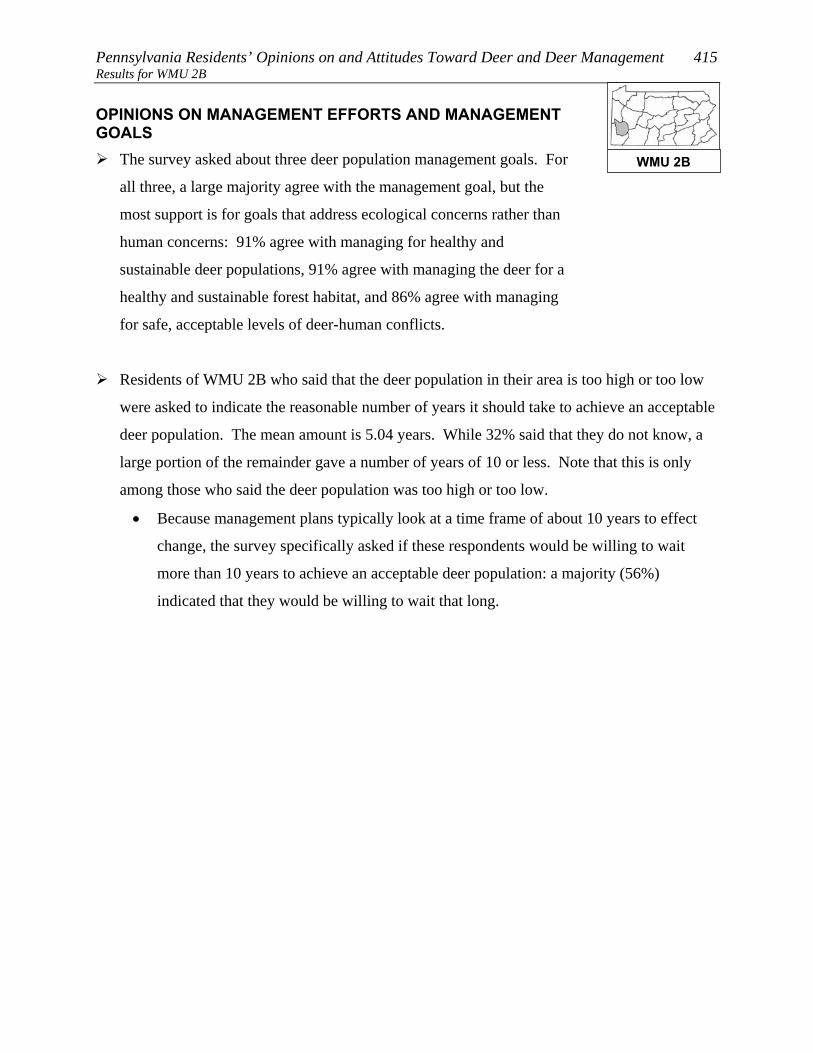
Pennsylvania Residents’ Opinions on and Attitudes Toward Deer and Deer Management 415 Results for WMU 2B OPINIONS ON MANAGEMENT EFFORTS AND MANAGEMENT GOALS
The survey asked about three deer population management goals. For
all three, a large majority agree with the management goal, but the
most support is for goals that address ecological concerns rather than
human concerns: 91% agree with managing for healthy and
sustainable deer populations, 91% agree with managing the deer for a
healthy and sustainable forest habitat, and 86% agree with managing
for safe, acceptable levels of deer-human conflicts.
Residents of WMU 2B who said that the deer population in their area is too high or too low
were asked to indicate the reasonable number of years it should take to achieve an acceptable
deer population. The mean amount is 5.04 years. While 32% said that they do not know, a
large portion of the remainder gave a number of years of 10 or less. Note that this is only
among those who said the deer population was too high or too low.
• Because management plans typically look at a time frame of about 10 years to effect
change, the survey specifically asked if these respondents would be willing to wait
more than 10 years to achieve an acceptable deer population: a majority (56%)
indicated that they would be willing to wait that long.
WMU 2B

416 Responsive Management Results for WMU 2B
Q24-26. Deer populations should be managed for the following. (Do you agree or disagree with this
deer management goal?)
63
28
3
3
4
1
2
27
64
2
4
1
5
56
30
3
4
2
0 20 40 60 80 100
Stronglyagree
Moderatelyagree
Neither agreenor disagree
Moderatelydisagree
Stronglydisagree
Don't know
Percent (n=429)
Healthy and sustainableforest habitatHealthy and sustainabledeer populationsSafe and acceptable levelsof deer-human conflicts
WMU 2B
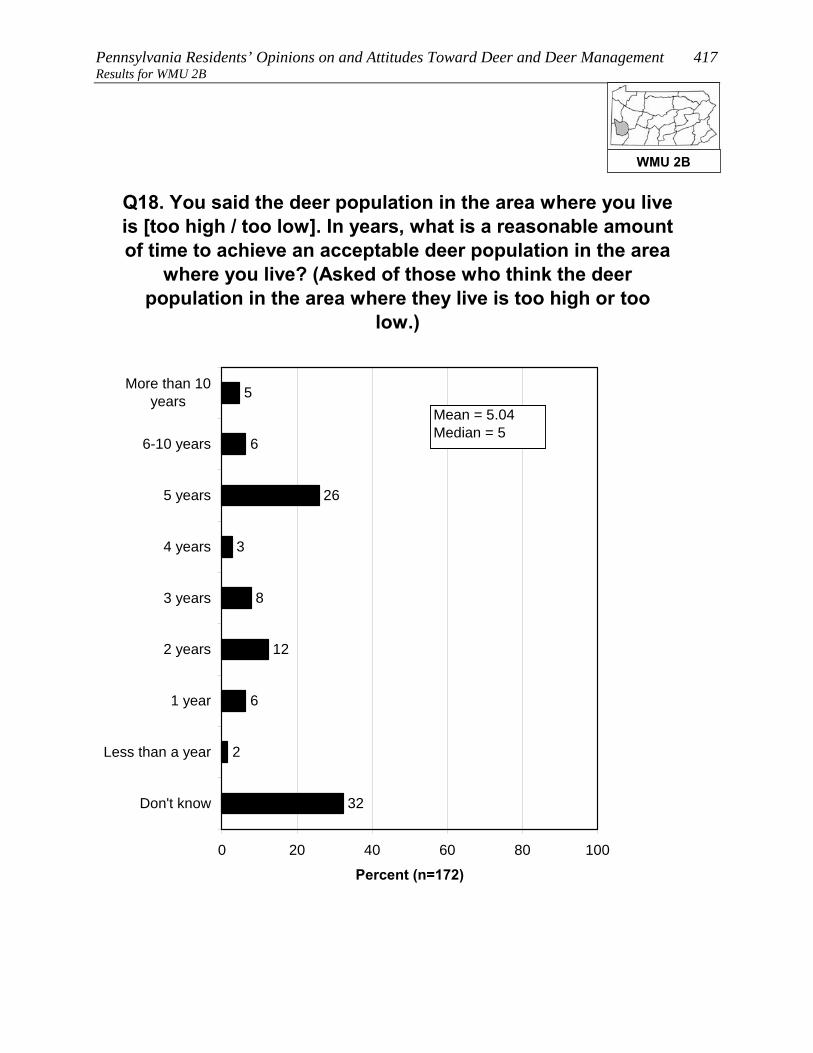
Pennsylvania Residents’ Opinions on and Attitudes Toward Deer and Deer Management 417 Results for WMU 2B
32
2
6
5
6
26
3
8
12
0 20 40 60 80 100
More than 10years
6-10 years
5 years
4 years
3 years
2 years
1 year
Less than a year
Don't know
Percent (n=172)
Q18. You said the deer population in the area where you live is [too high / too low]. In years, what is a reasonable amount of time to achieve an acceptable deer population in the area
where you live? (Asked of those who think the deer population in the area where they live is too high or too
low.)
Mean = 5.04Median = 5
WMU 2B

418 Responsive Management Results for WMU 2B
Q21. Would you be willing to wait more than 10 years to achieve an acceptable deer population in the area where you live? (Among those who think the deer population in the area where they live is
too high or too low.)
56
39
5
0 20 40 60 80 100
Yes
No
Don't know
Percent (n=172)
WMU 2B

Pennsylvania Residents’ Opinions on and Attitudes Toward Deer and Deer Management 419 Results for WMU 2B OPINIONS ON METHODS FOR MANAGING DEER, INCLUDING HUNTING
A large majority of residents of WMU 2B (66%) support lethal
methods to manage deer populations in Pennsylvania; nonetheless,
29% oppose, mostly strong opposition.
• Those residents of WMU 2B who live in a single-family home and own their home are
less likely to strongly support lethal methods, compared to those who live in a single-
family home but do not own their home.
• The survey asked about four methods of controlling deer populations (three of them
lethal). The most support is for legal, regulated hunting (89% of respondents support
this method), distantly followed by fertility/birth control (54%), professionals or
sharpshooters (44%), and trapping and killing (26%).
Two questions asked respondents about hunting on their land (among those who live in a
single-family home), the first question about hunting by the respondents themselves (5% do
so) and the second regarding allowing others to hunt on their land (10% do so). In
combining the results, 12% of residents of WMU 2B who live in a single-family home either
hunt on their own land or allow others to do so (it is not simply a sum of the two questions
because some hunt on their property and allow others to do so as well).
• There was interest in seeing how a particular subgroup responded on this question, the
subgroup being those who live in a single-family home; who live on 1 acre or less; and
who live in an urban, suburban area, or a small city/town. Among this subgroup, 5%
either hunt on their own property or allow others to hunt on the property.
• Those respondents who do not allow hunting on their property were asked to indicate
why they prohibit it. The most common reasons are that they live in an urban or
suburban area in which hunting is not possible or feasible and/or that their property is
too small. Other minor reasons are concerns about safety, a general opposition to
hunting, and liability concerns.
• Those same respondents who do not allow hunting on their property were asked about
their likelihood of ever allowing others to hunt deer on their property; they
overwhelmingly say this is very unlikely (96%). They were then asked if there is
WMU 2B

420 Responsive Management Results for WMU 2B
anything that would make them more likely to allow deer hunting;
they are almost unanimous (98%) in saying that there is nothing
that would make them more likely to allow deer hunting.
• The question about allowing others to hunt on their property was examined among the
subgroup previously discussed (those who live in a single-family home; who live on 1
acre or less; and who live in an urban, suburban area, or a small city/town). Among
this group who got the question, nearly all say that they would never allow hunting.
o Additional follow-up questions to be asked of those who indicated that something
might prompt them to allow hunting on their property did not have enough
respondents for statistical validity; therefore, they are not shown.
WMU 2B

Pennsylvania Residents’ Opinions on and Attitudes Toward Deer and Deer Management 421 Results for WMU 2B
Q27. In general, do you support or oppose lethal methods to manage deer populations in
Pennsylvania?
42
24
4
9
20
1
0 20 40 60 80 100
Strongly support
Moderatelysupport
Neither supportnor oppose
Moderately oppose
Strongly oppose
Don't know
Percent (n=429)
WMU 2B

422 Responsive Management Results for WMU 2B
Q27. In general, do you support or oppose lethal methods to manage deer populations in
Pennsylvania?
41
25
3
10
20
1
4
18
56
3
19
0
0 20 40 60 80 100
Stronglysupport
Moderatelysupport
Neithersupport nor
oppose
Moderatelyoppose
Stronglyoppose
Don't know
Percent
Owns home (n=355)Does not own home (n=19)
WMU 2B
Pennsylvania Residents’ Opinions on and Attitudes Toward Deer and Deer Management 423 Results for WMU 2B
Q30-Q33. Percent who strongly support each of the following methods of controlling deer populations
in Pennsylvania:
15
24
33
74
0 20 40 60 80 100
Q30. Legal,regulated hunting
Q33. Fertility or birthcontrol
Q31. Professionalsor sharpshooters
Q32. Trapping andkilling
Percent
WMU 2B
424 Responsive Management Results for WMU 2B
Q30-Q33. Percent who strongly or moderately support each of the following methods of
controlling deer populations in Pennsylvania:
89
54
44
26
0 20 40 60 80 100
Q30. Legal,regulated hunting
Q33. Fertility or birthcontrol
Q31. Professionalsor sharpshooters
Q32. Trapping andkilling
Percent
WMU 2B

Pennsylvania Residents’ Opinions on and Attitudes Toward Deer and Deer Management 425 Results for WMU 2B
Q30-Q33. Percent who strongly or moderately oppose each of the following methods of
controlling deer populations in Pennsylvania:
9
37
49
71
0 20 40 60 80 100
Q32. Trapping andkilling
Q31. Professionalsor sharpshooters
Q33. Fertility or birthcontrol
Q30. Legal,regulated hunting
Percent
WMU 2B
426 Responsive Management Results for WMU 2B
Q30-Q33. Percent who strongly oppose each of the following methods of controlling deer populations
in Pennsylvania:
7
30
37
57
0 20 40 60 80 100
Q32. Trapping andkilling
Q31. Professionalsor sharpshooters
Q33. Fertility or birthcontrol
Q30. Legal,regulated hunting
Percent
WMU 2B

Pennsylvania Residents’ Opinions on and Attitudes Toward Deer and Deer Management 427 Results for WMU 2B
Q59/60. Deer hunts and/or allows others to deer hunt on property. (Among respondents living in a
single-family home.)
88
12
0 20 40 60 80 100
Yes
No
Percent (n=374)
WMU 2B
428 Responsive Management Results for WMU 2B
Q59/60. Deer hunts and/or allows others to deer hunt on property. (Among respondents living in a
single-family home.)
5
94
Less than 1%
0 20 40 60 80 100
Yes
No
Don't know
Percent
Lives in a single familyhome on 1 acre or less inan urban area, a suburbanarea, or a small city/town(n=245)
WMU 2B
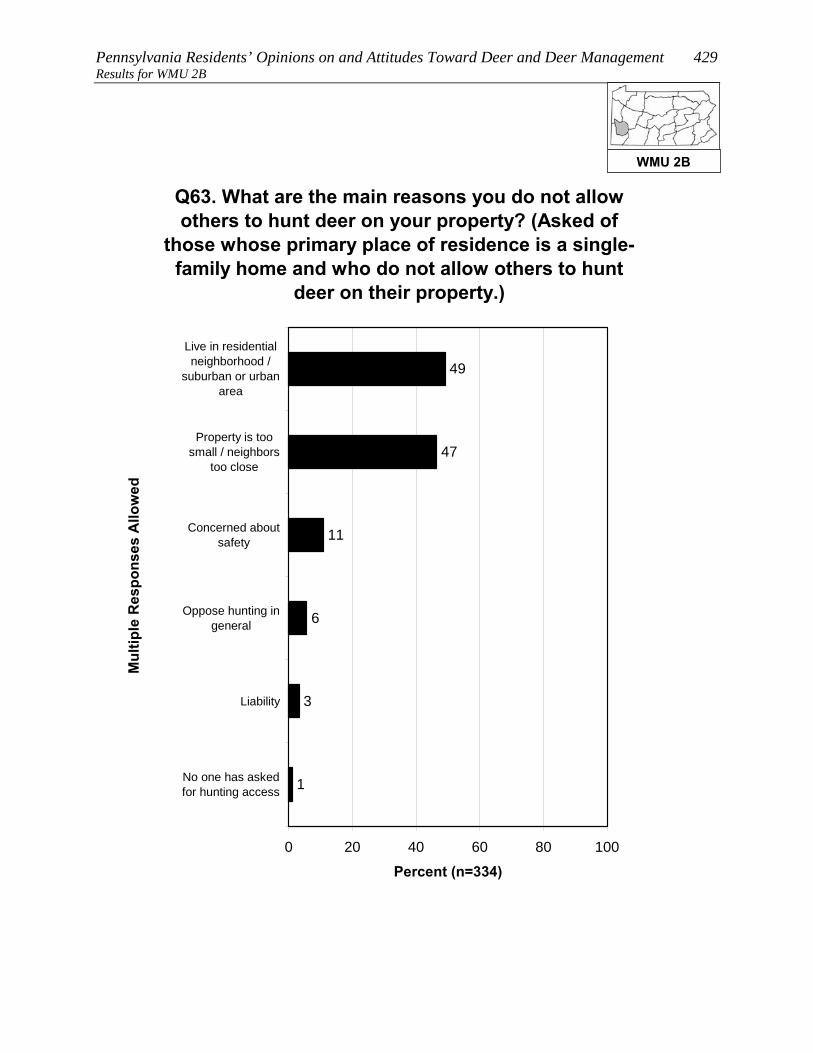
Pennsylvania Residents’ Opinions on and Attitudes Toward Deer and Deer Management 429 Results for WMU 2B
Q63. What are the main reasons you do not allow others to hunt deer on your property? (Asked of
those whose primary place of residence is a single-family home and who do not allow others to hunt
deer on their property.)
49
47
11
6
3
1
0 20 40 60 80 100
Live in residentialneighborhood /
suburban or urbanarea
Property is toosmall / neighbors
too close
Concerned aboutsafety
Oppose hunting ingeneral
Liability
No one has askedfor hunting access
Mul
tiple
Res
pons
es A
llow
ed
Percent (n=334)
WMU 2B
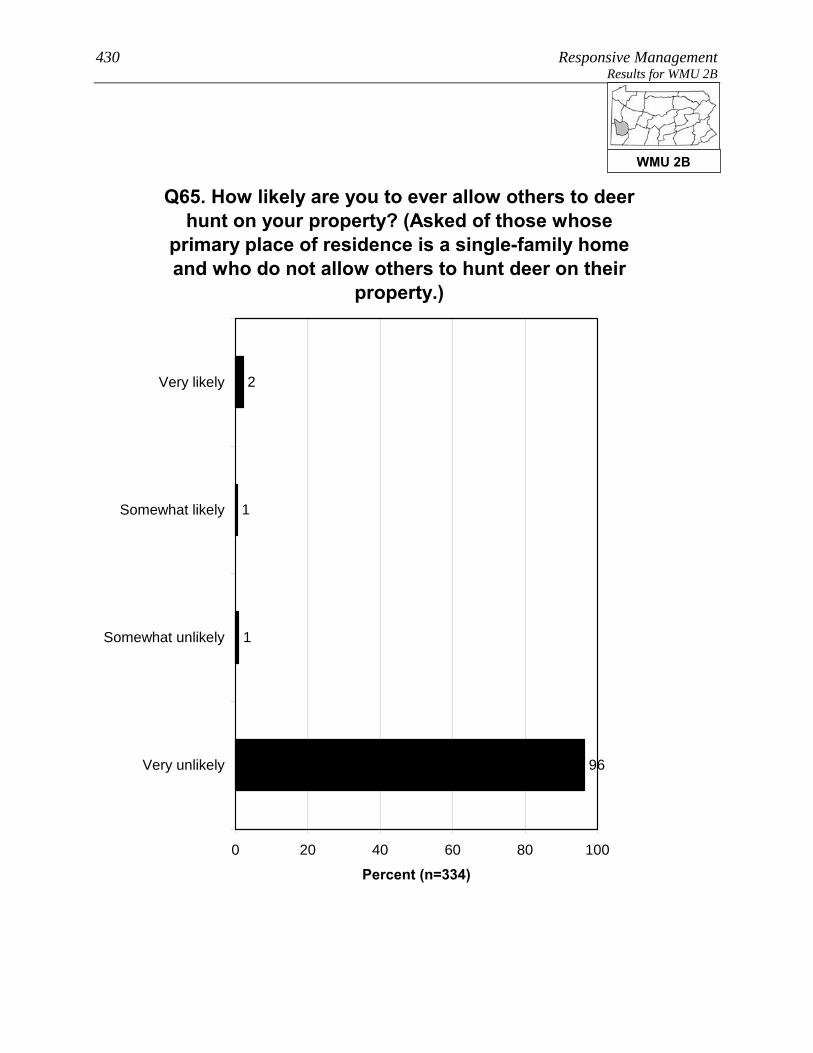
430 Responsive Management Results for WMU 2B
Q65. How likely are you to ever allow others to deer hunt on your property? (Asked of those whose
primary place of residence is a single-family home and who do not allow others to hunt deer on their
property.)
2
1
1
96
0 20 40 60 80 100
Very likely
Somewhat likely
Somewhat unlikely
Very unlikely
Percent (n=334)
WMU 2B

Pennsylvania Residents’ Opinions on and Attitudes Toward Deer and Deer Management 431 Results for WMU 2B
Q66. Is there anything that would make you more likely to allow deer hunting on your property?
(Asked of those whose primary place of residence is a single-family home and who do not allow
others to hunt deer on their property.)
2
98
0 20 40 60 80 100
Yes
No
Percent (n=334)
WMU 2B

432 Responsive Management Results for WMU 2B
Q65. How likely are you to ever allow others to deer hunt on your property? (Asked of those whose
primary place of residence is a single-family home and who do not allow others to hunt deer on their
property.)
2
0
1
97
0 20 40 60 80 100
Very likely
Somewhatlikely
Somewhatunlikely
Very unlikely
Percent
Lives in a single familyhome on 1 acre or less inan urban area, a suburbanarea, or a small city/town(n=235)
WMU 2B

Pennsylvania Residents’ Opinions on and Attitudes Toward Deer and Deer Management 433 Results for WMU 2B CONCERNS ABOUT DEER AND DEER NUISANCE PROBLEMS
Seven questions asked about respondents’ level of concern about issues
associated with deer. For each issue, respondents rated their level of
concern about it using a 10-point scale, with 10 being the most concerned.
• The most concern was for deer-vehicle accidents (mean rating of 7.6) and tick-borne
diseases (7.5), followed by two more whose means are just under those top two: the
health of the deer population (6.0) and the quality of deer habitat (5.9).
• At the bottom are concern about deer impacts on habitat and other wildlife (even
though this can be considerable) (4.2) and the two impacts to residents’ landscaping:
deer damage to plants and landscaping (3.6) and deer droppings in the yard (2.6).
o Another graph shows the percentage who gave a high rating (a “9” or “10”),
providing an idea of the percentage who feel strongly about the issues.
Among residents of WMU 2B, 80% indicated that they saw deer on their property in the past
12 months.
• Respondents who fed birds were about the same as those who did not in their
likelihood to see deer. Respondents who fed deer or put out attractants or were aware
of neighbors who fed deer or put out attractants were more likely to see deer than were
those who did not feed deer or were not aware of neighbors doing so.
The survey asked about specific nuisance problems with deer that residents of WMU 2B may
have experienced: 19% indicated that they experienced problems with deer at their primary
place of residence in the past 12 months; 16% indicated that they or another household
member had been in a vehicle collision with a deer (fortunately, a low portion of
drivers/passengers were injured); and 1% indicated that they or a household member had
been diagnosed with a tick-borne disease.
• Crosstabulations show that those who fed birds were slightly more likely to have
experienced deer problems. Likewise, those who were aware of neighbors feeding deer
or putting out attractants, compared to those who were not, were much more likely to
experience deer problems.
WMU 2B
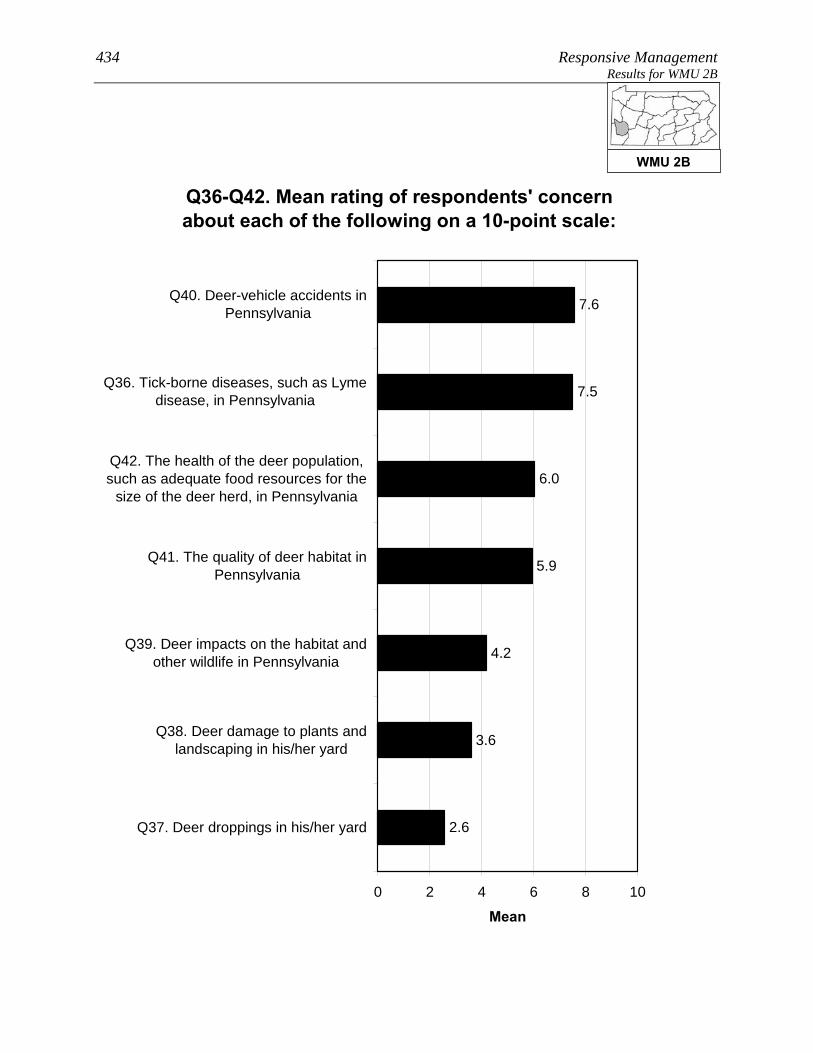
434 Responsive Management Results for WMU 2B
Q36-Q42. Mean rating of respondents' concern about each of the following on a 10-point scale:
3.6
4.2
5.9
6.0
7.5
7.6
2.6
0 2 4 6 8 10
Q40. Deer-vehicle accidents inPennsylvania
Q36. Tick-borne diseases, such as Lymedisease, in Pennsylvania
Q42. The health of the deer population,such as adequate food resources for the
size of the deer herd, in Pennsylvania
Q41. The quality of deer habitat inPennsylvania
Q39. Deer impacts on the habitat andother wildlife in Pennsylvania
Q38. Deer damage to plants andlandscaping in his/her yard
Q37. Deer droppings in his/her yard
Mean
WMU 2B
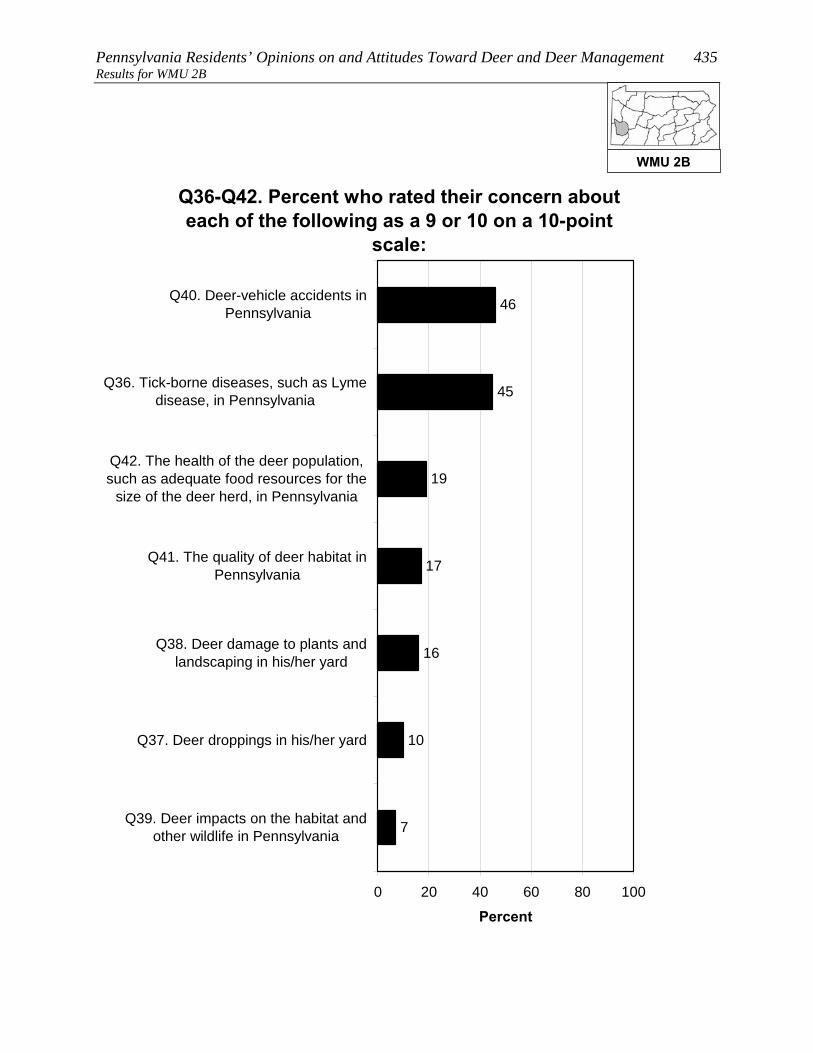
Pennsylvania Residents’ Opinions on and Attitudes Toward Deer and Deer Management 435 Results for WMU 2B
Q36-Q42. Percent who rated their concern about each of the following as a 9 or 10 on a 10-point
scale:
10
16
17
19
45
46
7
0 20 40 60 80 100
Q40. Deer-vehicle accidents inPennsylvania
Q36. Tick-borne diseases, such as Lymedisease, in Pennsylvania
Q42. The health of the deer population,such as adequate food resources for the
size of the deer herd, in Pennsylvania
Q41. The quality of deer habitat inPennsylvania
Q38. Deer damage to plants andlandscaping in his/her yard
Q37. Deer droppings in his/her yard
Q39. Deer impacts on the habitat andother wildlife in Pennsylvania
Percent
WMU 2B

436 Responsive Management Results for WMU 2B
Q49. How often have you seen deer on your property in the past 12 months?
38
18
24
20
0 20 40 60 80 100
Frequently
Sometimes
Rarely
Never
Percent (n=429)
WMU 2B
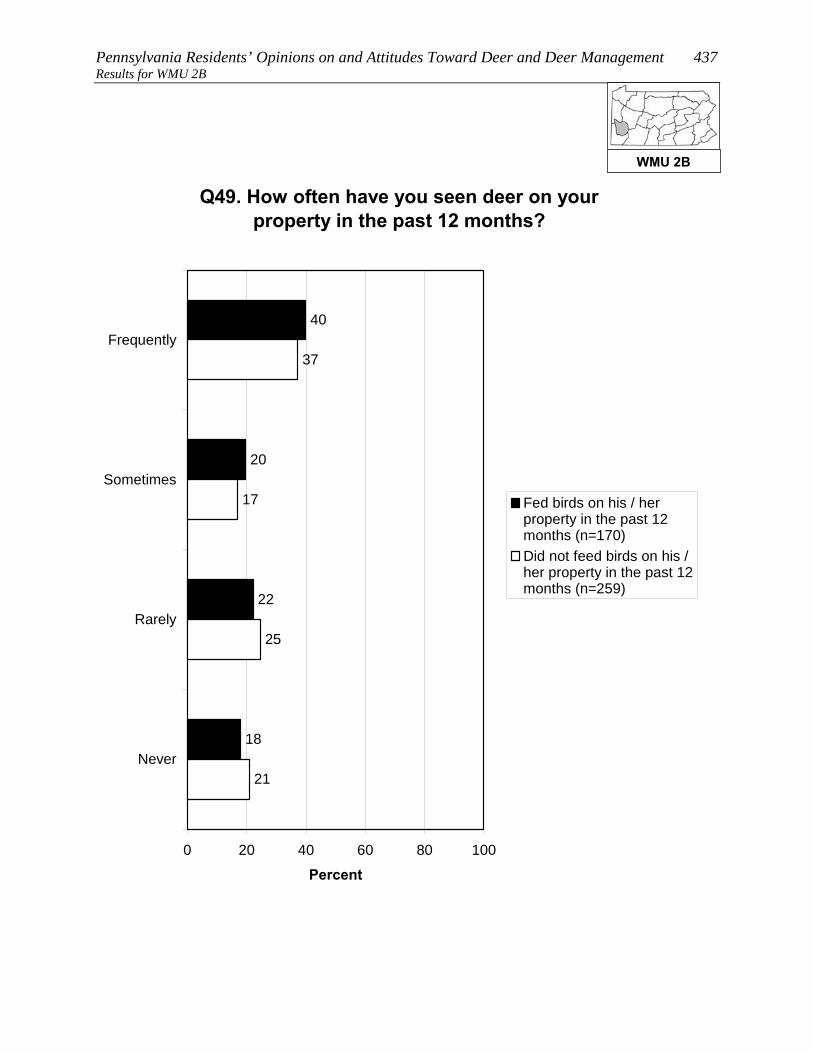
Pennsylvania Residents’ Opinions on and Attitudes Toward Deer and Deer Management 437 Results for WMU 2B
Q49. How often have you seen deer on your property in the past 12 months?
40
20
22
18
25
17
37
21
0 20 40 60 80 100
Frequently
Sometimes
Rarely
Never
Percent
Fed birds on his / herproperty in the past 12months (n=170)Did not feed birds on his /her property in the past 12months (n=259)
WMU 2B
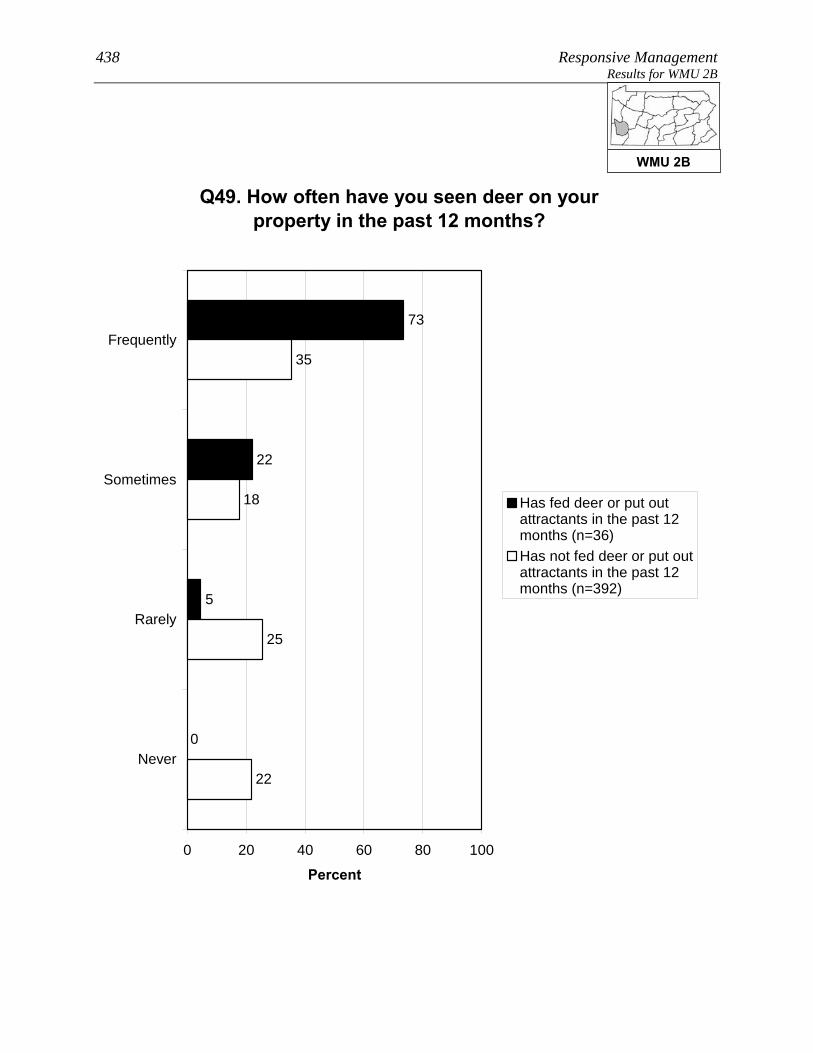
438 Responsive Management Results for WMU 2B
Q49. How often have you seen deer on your property in the past 12 months?
73
22
5
0
25
18
35
22
0 20 40 60 80 100
Frequently
Sometimes
Rarely
Never
Percent
Has fed deer or put outattractants in the past 12months (n=36)Has not fed deer or put outattractants in the past 12months (n=392)
WMU 2B
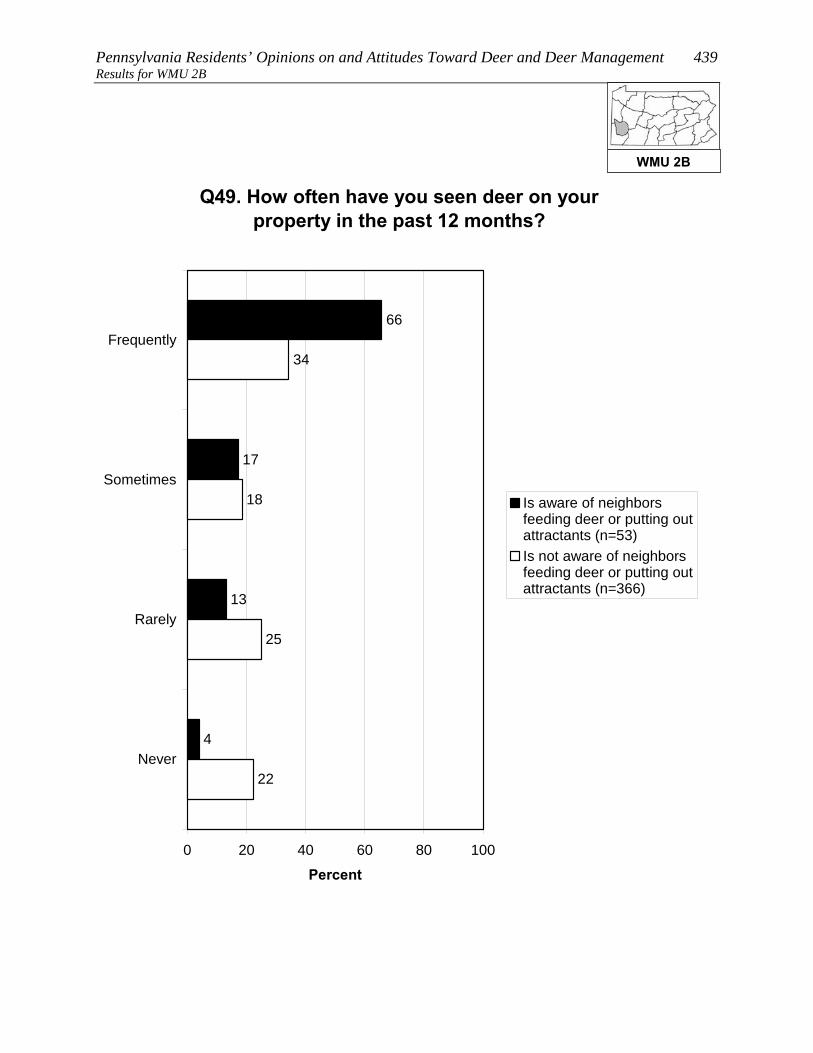
Pennsylvania Residents’ Opinions on and Attitudes Toward Deer and Deer Management 439 Results for WMU 2B
Q49. How often have you seen deer on your property in the past 12 months?
66
17
13
4
25
18
34
22
0 20 40 60 80 100
Frequently
Sometimes
Rarely
Never
Percent
Is aware of neighborsfeeding deer or putting outattractants (n=53)Is not aware of neighborsfeeding deer or putting outattractants (n=366)
WMU 2B
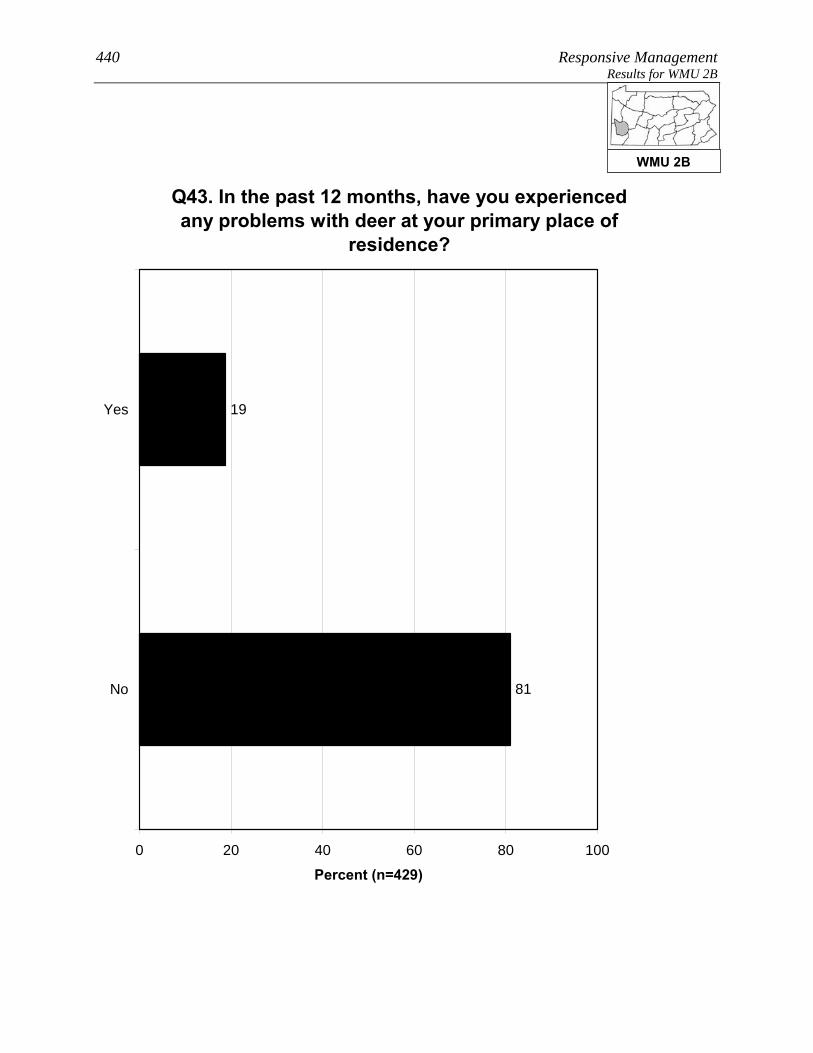
440 Responsive Management Results for WMU 2B
Q43. In the past 12 months, have you experienced any problems with deer at your primary place of
residence?
19
81
0 20 40 60 80 100
Yes
No
Percent (n=429)
WMU 2B

Pennsylvania Residents’ Opinions on and Attitudes Toward Deer and Deer Management 441 Results for WMU 2B
Q43. In the past 12 months, have you experienced any problems with deer at your primary place of
residence?
22
78
83
17
0 20 40 60 80 100
Yes
No
Percent
Fed birds on his / herproperty in the past 12months (n=170)Did not feed birds on his /her property in the past 12months (n=259)
WMU 2B

442 Responsive Management Results for WMU 2B
Q43. In the past 12 months, have you experienced any problems with deer at your primary place of
residence?
31
69
82
18
0 20 40 60 80 100
Yes
No
Percent
Is aware of neighborsfeeding deer or putting outattractants (n=53)Is not aware of neighborsfeeding deer or putting outattractants (n=366)
WMU 2B

Pennsylvania Residents’ Opinions on and Attitudes Toward Deer and Deer Management 443 Results for WMU 2B
Q44. In the past 12 months, have you or any other person living in your immediate household been in a vehicle collision with or an accident involving a
deer on Pennsylvania's roads or highways?
16
84
0 20 40 60 80 100
Yes
No
Percent (n=429)
WMU 2B
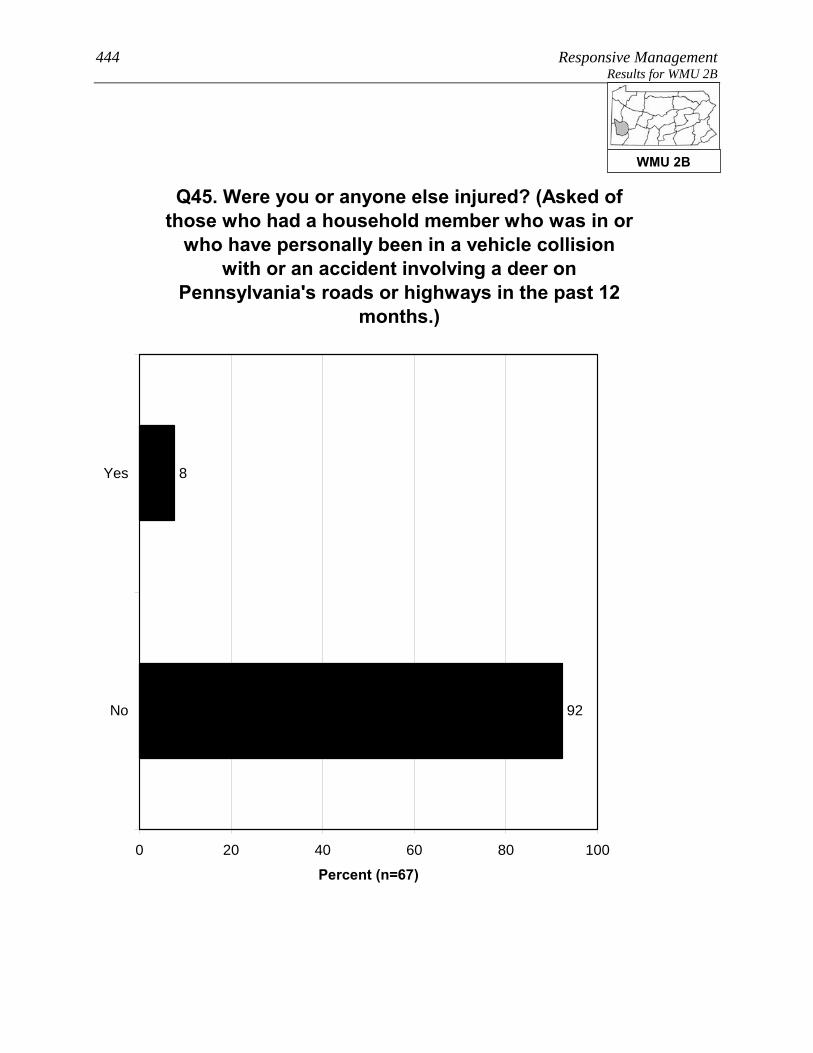
444 Responsive Management Results for WMU 2B
Q45. Were you or anyone else injured? (Asked of those who had a household member who was in or
who have personally been in a vehicle collision with or an accident involving a deer on
Pennsylvania's roads or highways in the past 12 months.)
8
92
0 20 40 60 80 100
Yes
No
Percent (n=67)
WMU 2B

Pennsylvania Residents’ Opinions on and Attitudes Toward Deer and Deer Management 445 Results for WMU 2B
Q46. In the past 12 months, have you or any other person living in your immediate household been
diagnosed by a physician with a tick-borne disease, such as Lyme disease?
1
99
0 20 40 60 80 100
Yes
No
Percent (n=429)
WMU 2B

446 Responsive Management Results for WMU 2B
FEEDING WILDLIFE AND HUNTING DEER Several questions asked about feeding wildlife.
• Feeding deer or putting out deer attractants: 8% of residents of
WMU 2B did this, and 12% are aware of neighbors who did this.
o The most typical feeds or attractants put out by respondents are salt/mineral blocks,
corn, and apples.
• Feeding birds: 38% of residents of WMU 2B did this.
There is no consensus on whether it is okay for private citizens to feed or attract deer in
Pennsylvania: 41% agree that this is okay, but 51% disagree (the rest are neutral).
More than a quarter of residents of WMU 2B (28%) consider themselves to be a hunter,
about two-thirds of whom have a Pennsylvania hunting license.
• Among residents of WMU 2B who live in a single-family home, 5% personally hunt
deer on their property.
• A large majority of residents of WMU 2B (72%) say that they, family members, and/or
friends hunt.
WMU 2B

Pennsylvania Residents’ Opinions on and Attitudes Toward Deer and Deer Management 447 Results for WMU 2B
Q50. Did you ever feed deer intentionally or put out attractants, such as a salt or mineral block, in the
past 12 months?
8
92
0 20 40 60 80 100
Yes
No
Percent (n=429)
WMU 2B

448 Responsive Management Results for WMU 2B
Q55. Are you aware of any of your neighbors feeding deer intentionally or trying to attract deer
on their property in the past 12 months?
12
86
2
0 20 40 60 80 100
Yes
No
Don't know
Percent (n=429)
WMU 2B
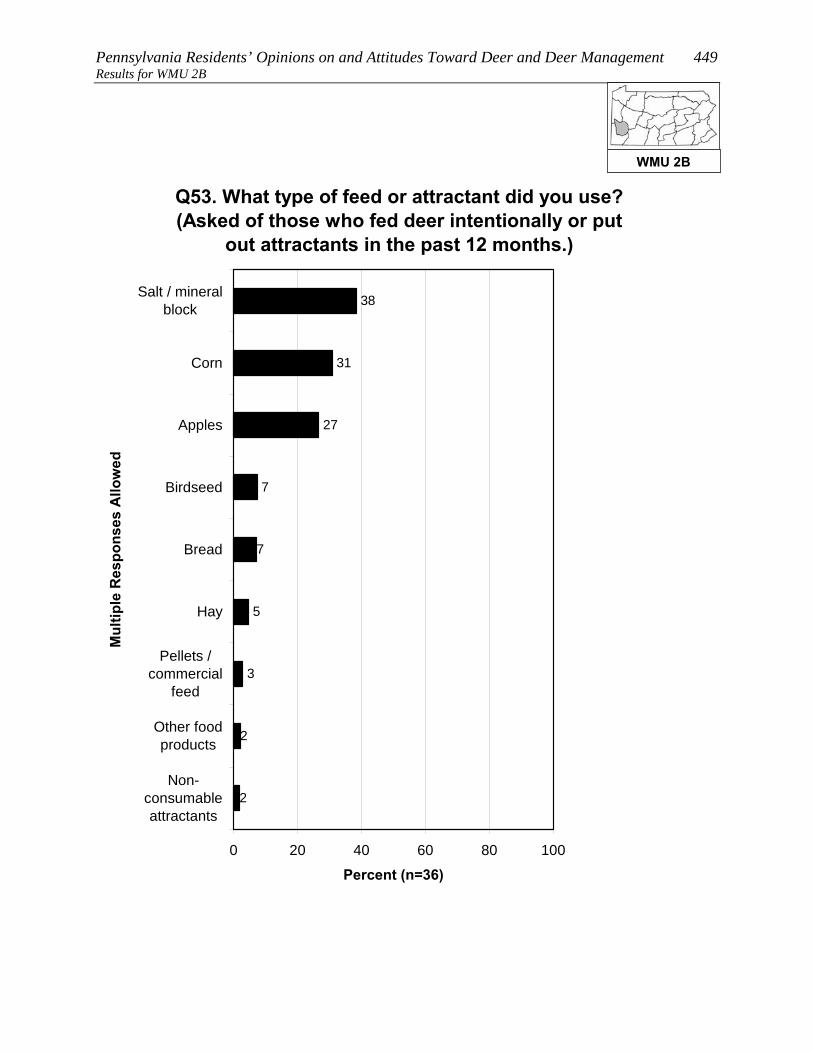
Pennsylvania Residents’ Opinions on and Attitudes Toward Deer and Deer Management 449 Results for WMU 2B
Q53. What type of feed or attractant did you use? (Asked of those who fed deer intentionally or put
out attractants in the past 12 months.)
2
2
3
38
31
27
7
7
5
0 20 40 60 80 100
Salt / mineralblock
Corn
Apples
Birdseed
Bread
Hay
Pellets /commercial
feed
Other foodproducts
Non-consumableattractants
Mul
tiple
Res
pons
es A
llow
ed
Percent (n=36)
WMU 2B
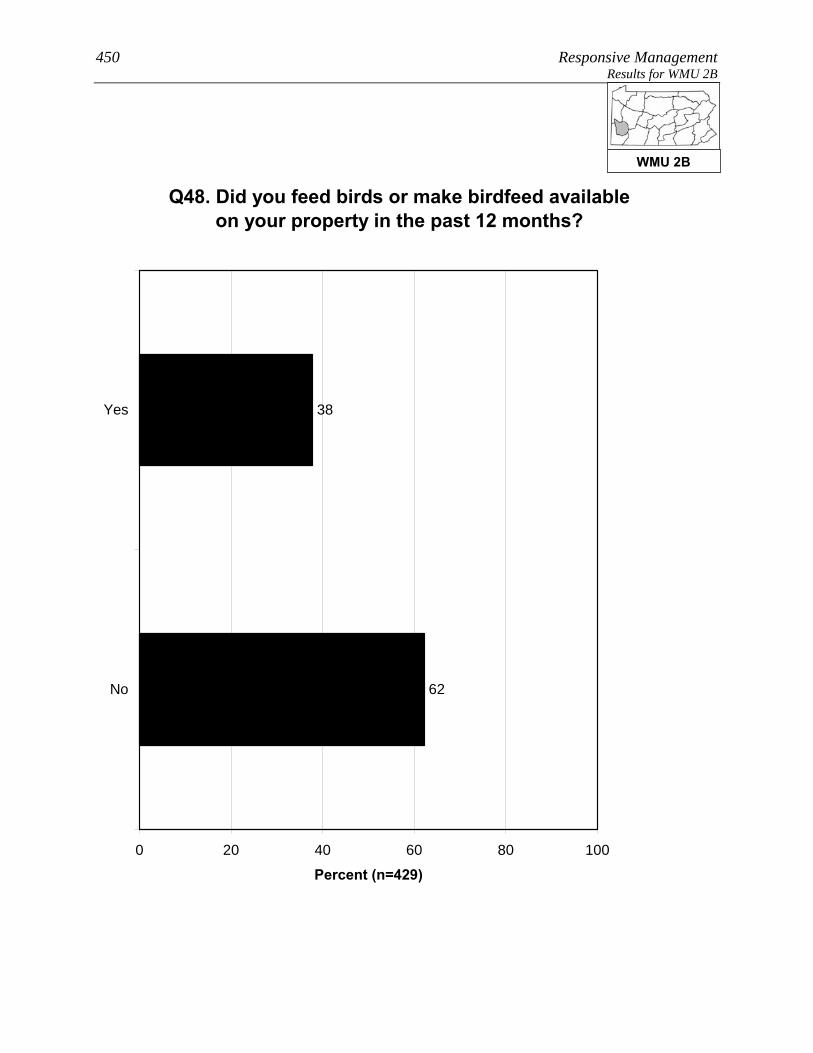
450 Responsive Management Results for WMU 2B
Q48. Did you feed birds or make birdfeed available on your property in the past 12 months?
38
62
0 20 40 60 80 100
Yes
No
Percent (n=429)
WMU 2B

Pennsylvania Residents’ Opinions on and Attitudes Toward Deer and Deer Management 451 Results for WMU 2B
Q56. Do you agree or disagree that it is OK for private citizens to feed or attract deer in
Pennsylvania?
19
22
7
18
33
2
0 20 40 60 80 100
Strongly agree
Moderately agree
Neither agree nordisagree
Moderatelydisagree
Strongly disagree
Don't know
Percent (n=429)
WMU 2B
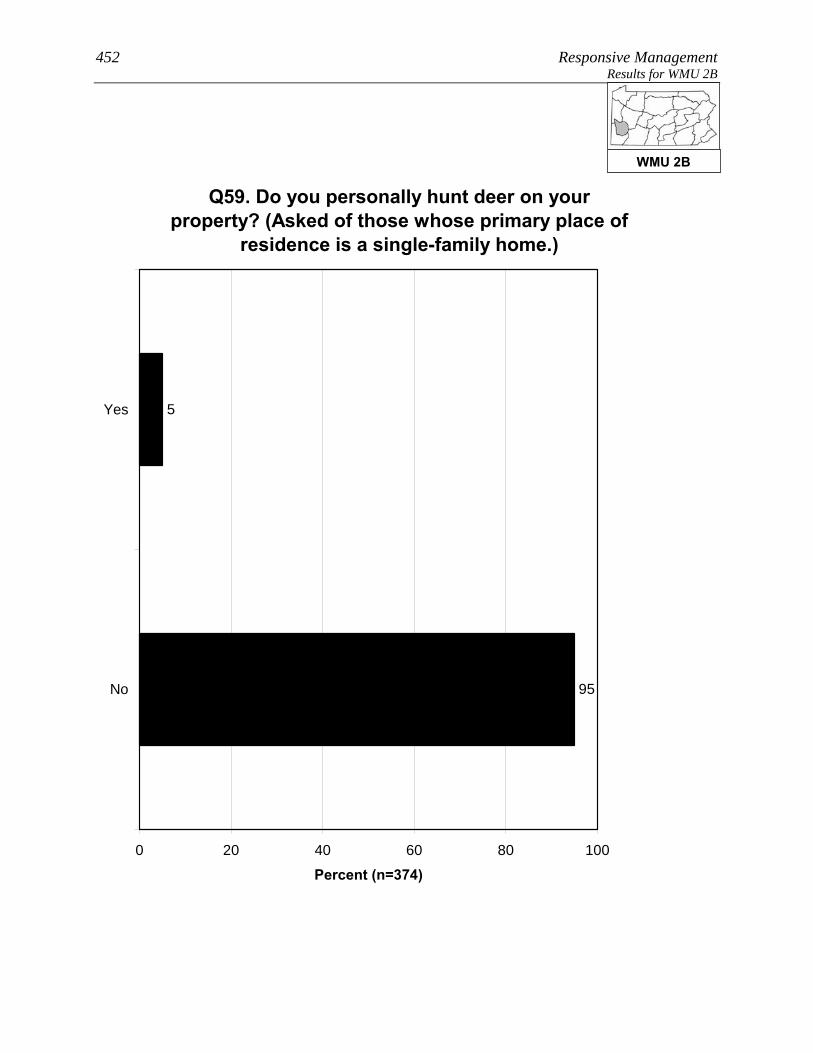
452 Responsive Management Results for WMU 2B
Q59. Do you personally hunt deer on your property? (Asked of those whose primary place of
residence is a single-family home.)
5
95
0 20 40 60 80 100
Yes
No
Percent (n=374)
WMU 2B
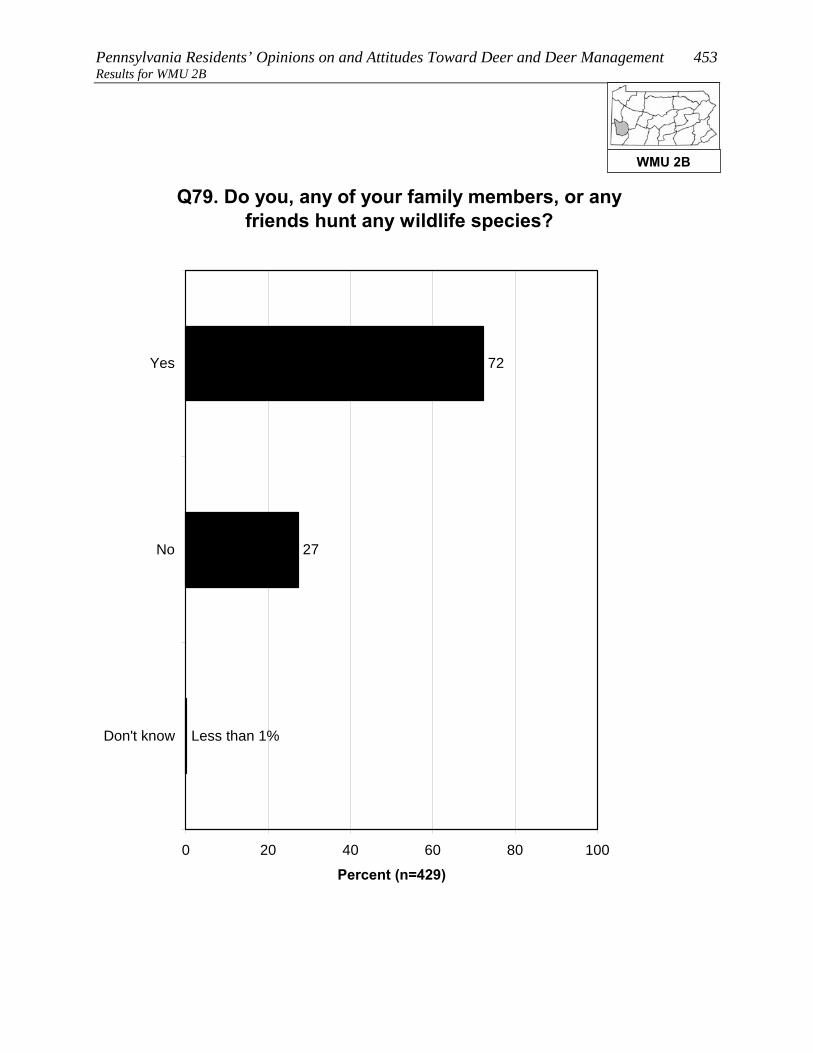
Pennsylvania Residents’ Opinions on and Attitudes Toward Deer and Deer Management 453 Results for WMU 2B
Q79. Do you, any of your family members, or any friends hunt any wildlife species?
72
27
Less than 1%
0 20 40 60 80 100
Yes
No
Don't know
Percent (n=429)
WMU 2B

454 Responsive Management Results for WMU 2B
SOURCES OF INFORMATION Most commonly, residents of WMU 2B say that the best way to
provide them with information about deer in Pennsylvania is through
direct mail (36% gave this response), followed by newspaper (20%),
the Internet (16% saying an Internet site other than the PGC and 4%
saying the agency website; note that some said both), TV (15%), and
email (14%).
Just over two-fifths of residents of WMU 2B (42%) use social media, the most common
primary site being Facebook.
WMU 2B

Pennsylvania Residents’ Opinions on and Attitudes Toward Deer and Deer Management 455 Results for WMU 2B
Q82. What is the best way to provide you with information about deer in Pennsylvania? We are not sending out information at this time; we are
just measuring interest.
3
4
5
36
20
16
15
14
5
2
1
1
1
1
9
0 20 40 60 80 100
Direct mail
Newspaper
Internet / website other thanPGC website
TV
Magazines
Telephone
PA Game Commission website
Radio
Brochures or pamphlets
Public presentations
Social media
PA Game Commission offices
PA Hunting and Trapping Digest
Don't know
Mul
tiple
Res
pons
es A
llow
ed
Percent (n=429)
WMU 2B

456 Responsive Management Results for WMU 2B
Q84. Do you use social media, such as Facebook, Twitter, or YouTube?
42
58
1
0 20 40 60 80 100
Yes
No
Don't know
Percent (n=429)
WMU 2B
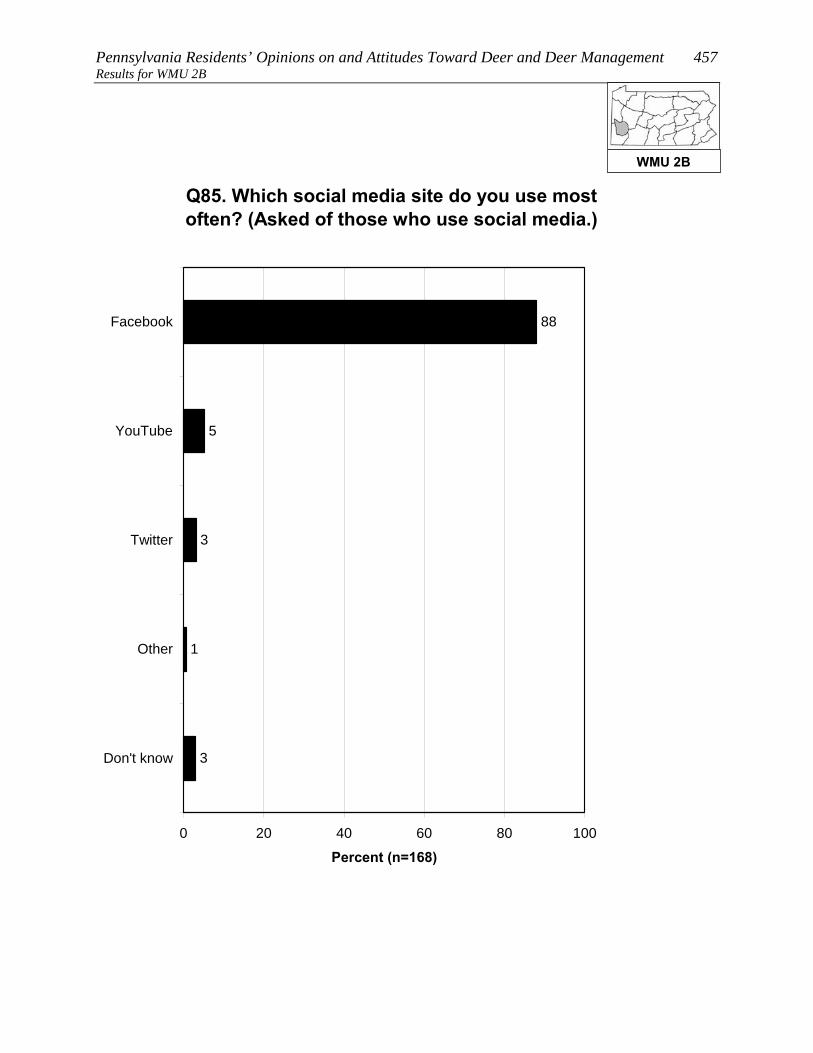
Pennsylvania Residents’ Opinions on and Attitudes Toward Deer and Deer Management 457 Results for WMU 2B
Q85. Which social media site do you use most often? (Asked of those who use social media.)
88
5
3
1
3
0 20 40 60 80 100
YouTube
Other
Don't know
Percent (n=168)
WMU 2B
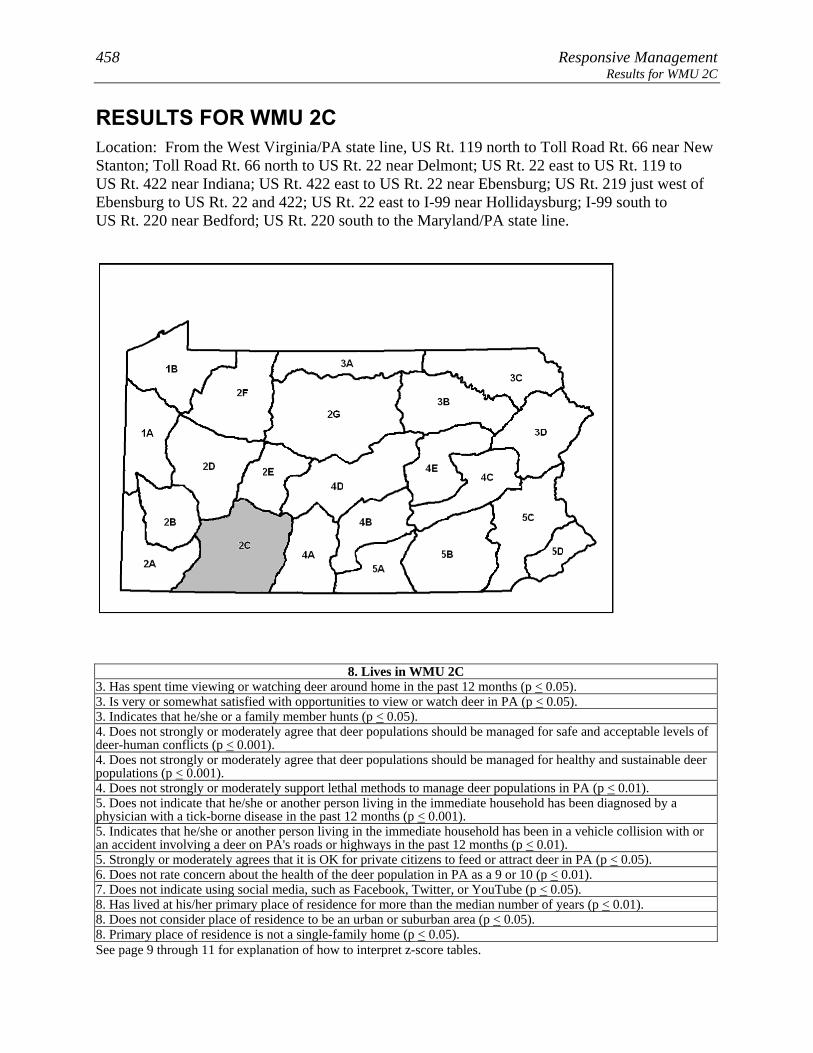
458 Responsive Management Results for WMU 2C
RESULTS FOR WMU 2C Location: From the West Virginia/PA state line, US Rt. 119 north to Toll Road Rt. 66 near New Stanton; Toll Road Rt. 66 north to US Rt. 22 near Delmont; US Rt. 22 east to US Rt. 119 to US Rt. 422 near Indiana; US Rt. 422 east to US Rt. 22 near Ebensburg; US Rt. 219 just west of Ebensburg to US Rt. 22 and 422; US Rt. 22 east to I-99 near Hollidaysburg; I-99 south to US Rt. 220 near Bedford; US Rt. 220 south to the Maryland/PA state line.
8. Lives in WMU 2C 3. Has spent time viewing or watching deer around home in the past 12 months (p < 0.05). 3. Is very or somewhat satisfied with opportunities to view or watch deer in PA (p < 0.05). 3. Indicates that he/she or a family member hunts (p < 0.05). 4. Does not strongly or moderately agree that deer populations should be managed for safe and acceptable levels of deer-human conflicts (p < 0.001). 4. Does not strongly or moderately agree that deer populations should be managed for healthy and sustainable deer populations (p < 0.001). 4. Does not strongly or moderately support lethal methods to manage deer populations in PA (p < 0.01). 5. Does not indicate that he/she or another person living in the immediate household has been diagnosed by a physician with a tick-borne disease in the past 12 months (p < 0.001). 5. Indicates that he/she or another person living in the immediate household has been in a vehicle collision with or an accident involving a deer on PA's roads or highways in the past 12 months (p < 0.01). 5. Strongly or moderately agrees that it is OK for private citizens to feed or attract deer in PA (p < 0.05). 6. Does not rate concern about the health of the deer population in PA as a 9 or 10 (p < 0.01). 7. Does not indicate using social media, such as Facebook, Twitter, or YouTube (p < 0.05). 8. Has lived at his/her primary place of residence for more than the median number of years (p < 0.01). 8. Does not consider place of residence to be an urban or suburban area (p < 0.05). 8. Primary place of residence is not a single-family home (p < 0.05). See page 9 through 11 for explanation of how to interpret z-score tables.
Pennsylvania Residents’ Opinions on and Attitudes Toward Deer and Deer Management 459 Results for WMU 2C PARTICIPATION IN VIEWING DEER
Just more than two-thirds of residents of WMU 2C (68%) spent time
viewing deer around their home in the past 12 months, and 32% took a
trip of at least a mile to view deer.
• Two-fifths of those who took a deer-viewing trip (40%) used a spotlight to view the
deer at night.
A majority of residents of WMU 2C (75%) are satisfied with opportunities to view deer in
Pennsylvania. Because a relatively large percentage answer neutrally, only 11% indicate
being dissatisfied.
WMU 2C
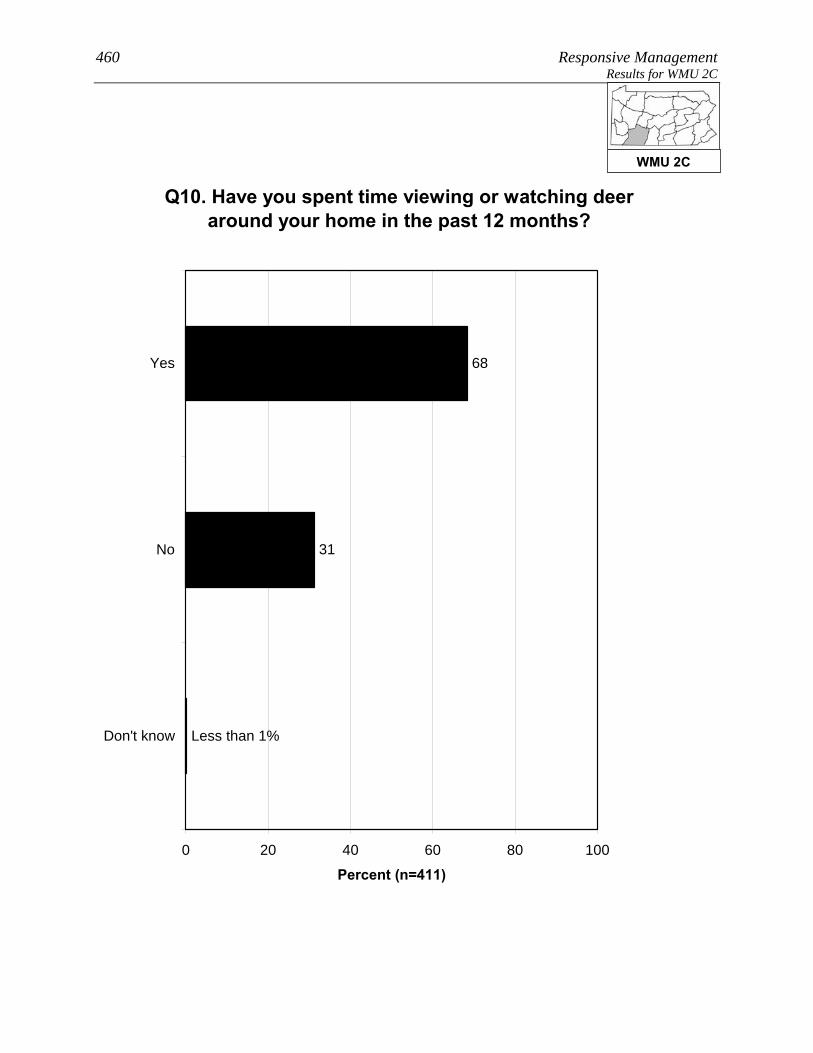
460 Responsive Management Results for WMU 2C
Q10. Have you spent time viewing or watching deer around your home in the past 12 months?
68
31
Less than 1%
0 20 40 60 80 100
Yes
No
Don't know
Percent (n=411)
WMU 2C

Pennsylvania Residents’ Opinions on and Attitudes Toward Deer and Deer Management 461 Results for WMU 2C
Q11. Have you taken a trip at least 1 mile from your home for the primary purpose of viewing or
watching deer in the past 12 months?
32
68
0 20 40 60 80 100
Yes
No
Percent (n=411)
WMU 2C

462 Responsive Management Results for WMU 2C
Q12. Did you use a spotlight to view deer at night on a trip to watch deer in the past 12 months?
(Asked of those who took a trip at least 1 mile from their home for the primary purpose of viewing or
watching deer in the past 12 months.)
40
60
0 20 40 60 80 100
Yes
No
Percent (n=131)
WMU 2C

Pennsylvania Residents’ Opinions on and Attitudes Toward Deer and Deer Management 463 Results for WMU 2C
Q13. How satisfied are you with opportunities to view or watch deer in Pennsylvania?
50
25
11
7
4
3
0 20 40 60 80 100
Very satisfied
Somewhatsatisfied
Neither satisfiednor dissatisfied
Somewhatdissatisfied
Very dissatisfied
Don't know
Percent (n=411)
WMU 2C

464 Responsive Management Results for WMU 2C
OPINIONS ON DEER IN GENERAL AND THE SIZE AND HEALTH OF THE DEER HERD
Opinion on deer is mostly favorable: 58% of residents of WMU 2C
say with no caveats that they like having deer around, another 21%
like having deer around but worry about the problems they may cause,
and only 4% generally regard them as a nuisance. The remainder have
no particular feeling about deer.
Another question asked residents of WMU 2C how deer-related issues compared to other
issues in their life, on a scale of 0 to 10, with the most importance being 10: the median
rating is “5.” The most common ratings are the midpoint of “5” (20%), “0” (18%), and “10”
(12%). In general, ratings are well spread across the scale.
Two other ratings questions asked respondents to rate their concern about deer-related issues.
The median level of concern is “5” for the quality of deer habitat in Pennsylvania and “5” for
the health of the deer population in Pennsylvania.
The survey asked about the perceived size of the deer herd in the respondent’s area. Half of
residents of WMU 2C say that the herd size is just right (50%); otherwise, more say that it is
too low (26%) than too high (13%).
• Those who own their home are about the same as those who do not own their home
regarding the deer population in their area.
• Those who consider themselves to be a hunter are much more likely to say that the deer
population in their area is too low, compared to those who are not hunters.
WMU 2C

Pennsylvania Residents’ Opinions on and Attitudes Toward Deer and Deer Management 465 Results for WMU 2C
Q14. Generally, which of the following best describes your feelings about deer in
Pennsylvania?
58
21
4
16
1
0 20 40 60 80 100
I like having deeraround
I like having deeraround but worryabout problems
they cause
I generally regarddeer as a nuisance
I have no particularfeeling about deer
Don't know
Percent (n=411)
WMU 2C

466 Responsive Management Results for WMU 2C
Q15. Compared to other issues in your life, how important to you, personally, are deer-related
issues on a scale of 0 to 10 where 0 is not at all important and 10 is extremely important?
8
8
4
12
3
6
9
5
20
6
18
1
0 20 40 60 80 100
10
9
8
7
6
5
4
3
2
1
0
Don't know
Percent (n=411)
Mean = 4.57Median = 5
WMU 2C

Pennsylvania Residents’ Opinions on and Attitudes Toward Deer and Deer Management 467 Results for WMU 2C
Q41. How about the quality of deer habitat in Pennsylvania? (How much of a concern is this for you personally on a scale of 0 to 10 where 0 is not at all concerned and 10 is extremely concerned?)
4
5
4
12
3
9
11
7
29
1
11
5
0 20 40 60 80 100
10
9
8
7
6
5
4
3
2
1
0
Don't know
Percent (n=411)
Mean = 5.55Median = 5
WMU 2C

468 Responsive Management Results for WMU 2C
4
2
4
14
3
14
11
5
27
2
10
4
0 20 40 60 80 100
10
9
8
7
6
5
4
3
2
1
0
Don't know
Percent (n=411)
Q42. How about health of the deer population, such as adequate food resources for the size of the deer herd, in Pennsylvania? (How much of a concern is this for you
personally on a scale of 0 to 10 where 0 is not at all concerned and 10 is extremely concerned?)
Mean = 5.77Median = 5
WMU 2C

Pennsylvania Residents’ Opinions on and Attitudes Toward Deer and Deer Management 469 Results for WMU 2C
Q16. In your opinion, is the deer population in the area where you live too high, just right, or too low?
13
50
26
10
0 20 40 60 80 100
Too high
Just right
Too low
Don't know
Percent (n=411)
WMU 2C

470 Responsive Management Results for WMU 2C
Q16. In your opinion, is the deer population in the area where you live too high, just right, or too low?
14
51
27
8
22
51
11
16
0 20 40 60 80 100
Too high
Just right
Too low
Don't know
Percent
Owns home (n=358)Does not own home (n=21)
WMU 2C

Pennsylvania Residents’ Opinions on and Attitudes Toward Deer and Deer Management 471 Results for WMU 2C
Q16. In your opinion, is the deer population in the area where you live too high, just right, or too low?
4
35
58
4
14
57
17
13
0 20 40 60 80 100
Too high
Just right
Too low
Don't know
Percent
Consider themselves ahunter (n=119)Do not consider themselvesa hunter (n=292)
WMU 2C

472 Responsive Management Results for WMU 2C
OPINIONS ON MANAGEMENT EFFORTS AND MANAGEMENT GOALS
The survey asked about three deer population management goals. For
all three, a large majority agree with the management goal, but the
most support is for goals that address ecological concerns rather than
human concerns: 87% agree with managing for healthy and
sustainable deer populations, 84% agree with managing the deer for a
healthy and sustainable forest habitat, and 75% agree with managing
for safe, acceptable levels of deer-human conflicts.
Residents of WMU 2C who said that the deer population in their area is too high or too low
were asked to indicate the reasonable number of years it should take to achieve an acceptable
deer population. The mean amount is 4.08 years. While 27% said that they do not know,
nearly all the rest gave a number of years of 10 or less. Note that this is only among those
who said the deer population was too high or too low.
• Because management plans typically look at a time frame of about 10 years to effect
change, the survey specifically asked if these respondents would be willing to wait
more than 10 years to achieve an acceptable deer population: just less than a majority
(45%) indicated that they would be willing to wait that long.
WMU 2C

Pennsylvania Residents’ Opinions on and Attitudes Toward Deer and Deer Management 473 Results for WMU 2C
Q24-26. Deer populations should be managed for the following. (Do you agree or disagree with this
deer management goal?)
54
30
5
4
5
1
4
29
58
2
5
2
7
48
27
6
9
3
0 20 40 60 80 100
Stronglyagree
Moderatelyagree
Neither agreenor disagree
Moderatelydisagree
Stronglydisagree
Don't know
Percent (n=411)
Healthy and sustainableforest habitatHealthy and sustainabledeer populationsSafe and acceptable levelsof deer-human conflicts
WMU 2C
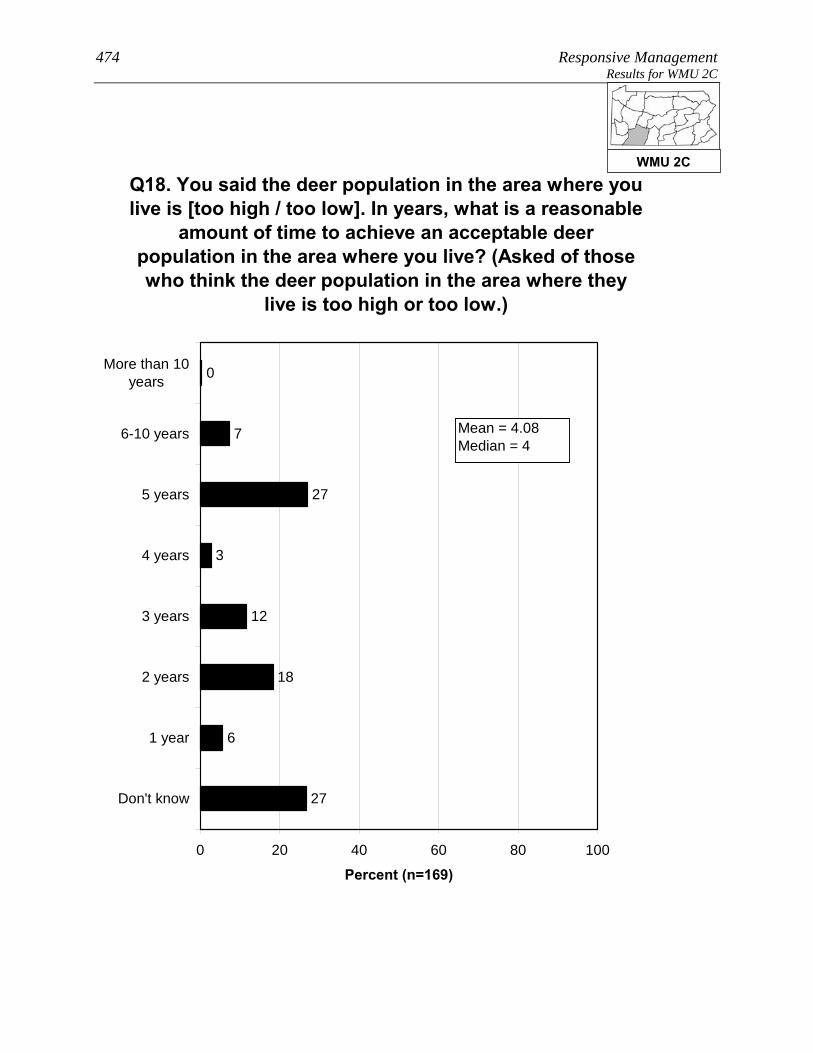
474 Responsive Management Results for WMU 2C
27
6
0
7
27
3
12
18
0 20 40 60 80 100
More than 10years
6-10 years
5 years
4 years
3 years
2 years
1 year
Don't know
Percent (n=169)
Q18. You said the deer population in the area where you live is [too high / too low]. In years, what is a reasonable
amount of time to achieve an acceptable deer population in the area where you live? (Asked of those who think the deer population in the area where they
live is too high or too low.)
Mean = 4.08Median = 4
WMU 2C
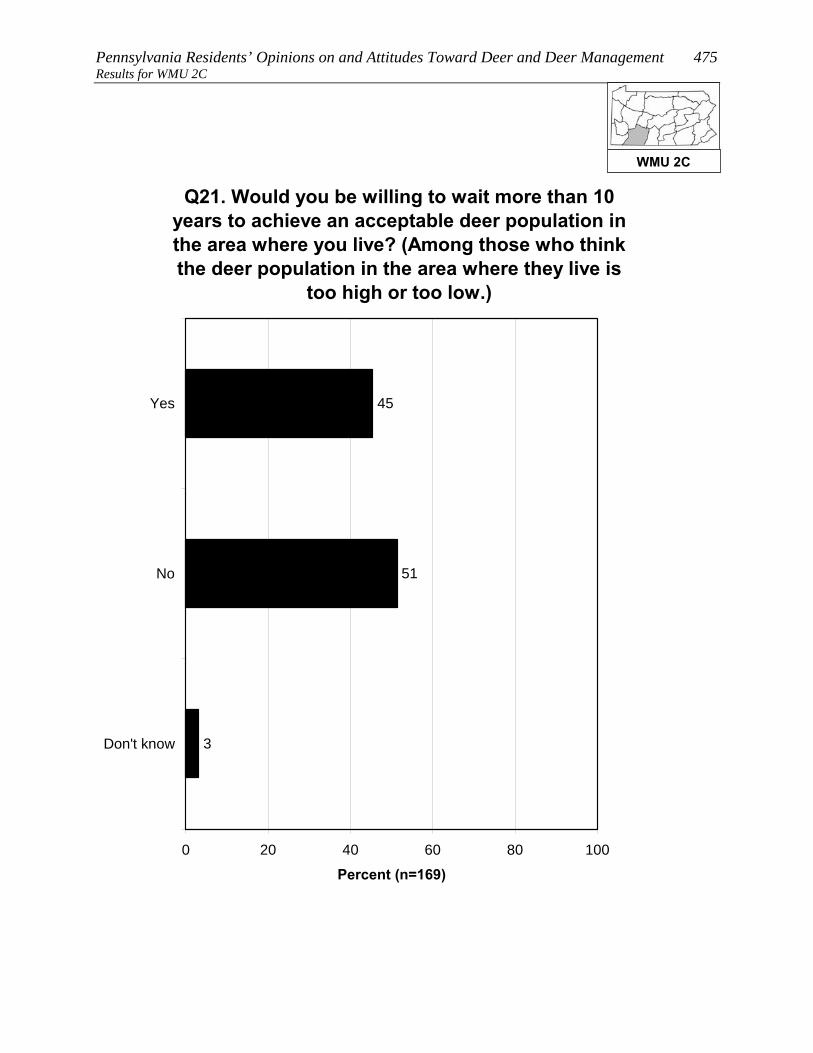
Pennsylvania Residents’ Opinions on and Attitudes Toward Deer and Deer Management 475 Results for WMU 2C
Q21. Would you be willing to wait more than 10 years to achieve an acceptable deer population in the area where you live? (Among those who think the deer population in the area where they live is
too high or too low.)
45
51
3
0 20 40 60 80 100
Yes
No
Don't know
Percent (n=169)
WMU 2C
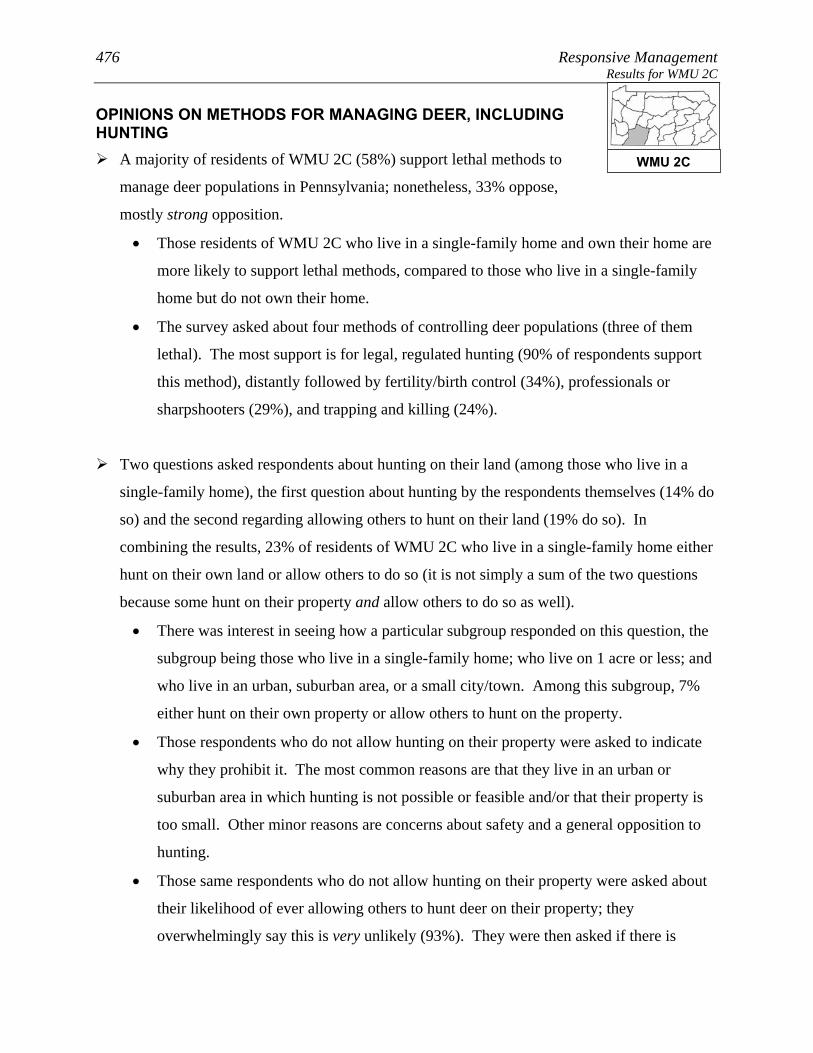
476 Responsive Management Results for WMU 2C
OPINIONS ON METHODS FOR MANAGING DEER, INCLUDING HUNTING
A majority of residents of WMU 2C (58%) support lethal methods to
manage deer populations in Pennsylvania; nonetheless, 33% oppose,
mostly strong opposition.
• Those residents of WMU 2C who live in a single-family home and own their home are
more likely to support lethal methods, compared to those who live in a single-family
home but do not own their home.
• The survey asked about four methods of controlling deer populations (three of them
lethal). The most support is for legal, regulated hunting (90% of respondents support
this method), distantly followed by fertility/birth control (34%), professionals or
sharpshooters (29%), and trapping and killing (24%).
Two questions asked respondents about hunting on their land (among those who live in a
single-family home), the first question about hunting by the respondents themselves (14% do
so) and the second regarding allowing others to hunt on their land (19% do so). In
combining the results, 23% of residents of WMU 2C who live in a single-family home either
hunt on their own land or allow others to do so (it is not simply a sum of the two questions
because some hunt on their property and allow others to do so as well).
• There was interest in seeing how a particular subgroup responded on this question, the
subgroup being those who live in a single-family home; who live on 1 acre or less; and
who live in an urban, suburban area, or a small city/town. Among this subgroup, 7%
either hunt on their own property or allow others to hunt on the property.
• Those respondents who do not allow hunting on their property were asked to indicate
why they prohibit it. The most common reasons are that they live in an urban or
suburban area in which hunting is not possible or feasible and/or that their property is
too small. Other minor reasons are concerns about safety and a general opposition to
hunting.
• Those same respondents who do not allow hunting on their property were asked about
their likelihood of ever allowing others to hunt deer on their property; they
overwhelmingly say this is very unlikely (93%). They were then asked if there is
WMU 2C
Pennsylvania Residents’ Opinions on and Attitudes Toward Deer and Deer Management 477 Results for WMU 2C
anything that would make them more likely to allow deer hunting;
they are almost unanimous (97%) in saying that there is nothing
that would make them more likely to allow deer hunting.
• The question about allowing others to hunt on their property was examined among the
subgroup previously discussed (those who live in a single-family home; who live on 1
acre or less; and who live in an urban, suburban area, or a small city/town). Among
this group who got the question, nearly all say that they would never allow hunting.
o Additional follow-up questions to be asked of those who indicated that something
might prompt them to allow hunting on their property did not have enough
respondents for statistical validity; therefore, they are not shown.
WMU 2C
478 Responsive Management Results for WMU 2C
Q27. In general, do you support or oppose lethal methods to manage deer populations in
Pennsylvania?
36
22
8
8
25
2
0 20 40 60 80 100
Strongly support
Moderatelysupport
Neither supportnor oppose
Moderately oppose
Strongly oppose
Don't know
Percent (n=411)
WMU 2C
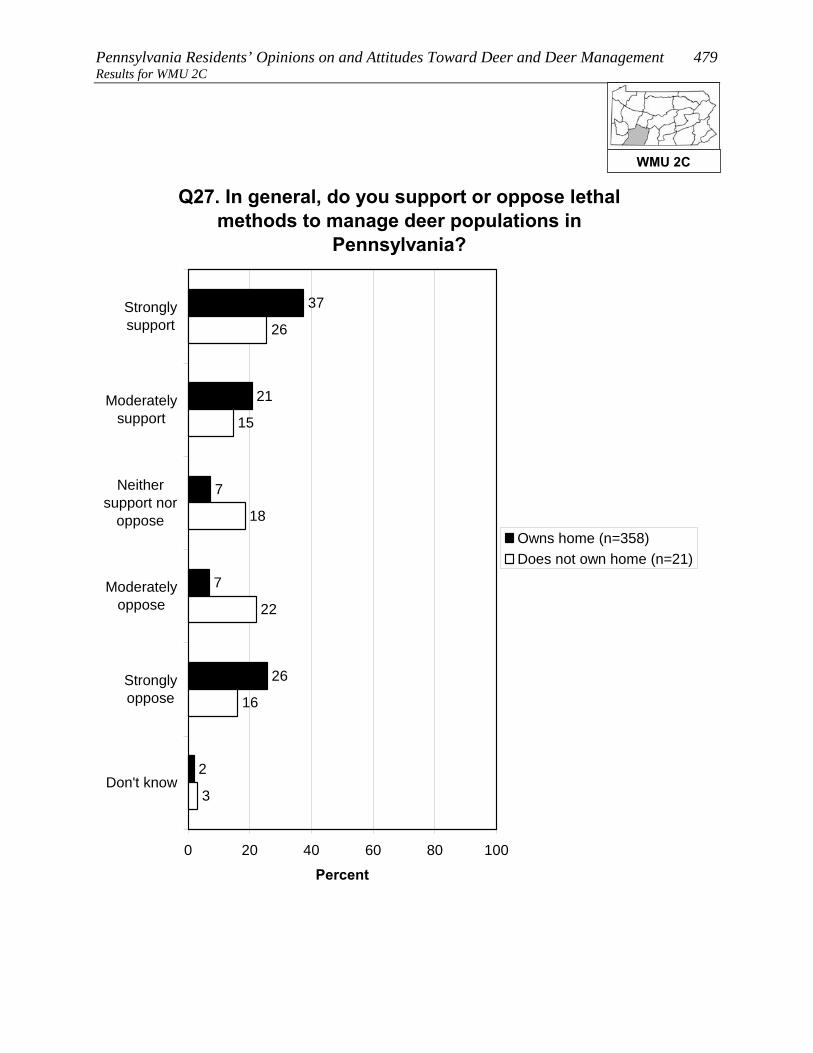
Pennsylvania Residents’ Opinions on and Attitudes Toward Deer and Deer Management 479 Results for WMU 2C
Q27. In general, do you support or oppose lethal methods to manage deer populations in
Pennsylvania?
37
21
7
7
26
2
18
15
26
22
16
3
0 20 40 60 80 100
Stronglysupport
Moderatelysupport
Neithersupport nor
oppose
Moderatelyoppose
Stronglyoppose
Don't know
Percent
Owns home (n=358)Does not own home (n=21)
WMU 2C

480 Responsive Management Results for WMU 2C
Q30-Q33. Percent who strongly support each of the following methods of controlling deer populations
in Pennsylvania:
13
16
18
73
0 20 40 60 80 100
Q30. Legal,regulated hunting
Q33. Fertility or birthcontrol
Q31. Professionalsor sharpshooters
Q32. Trapping andkilling
Percent
WMU 2C

Pennsylvania Residents’ Opinions on and Attitudes Toward Deer and Deer Management 481 Results for WMU 2C
Q30-Q33. Percent who strongly or moderately support each of the following methods of
controlling deer populations in Pennsylvania:
24
29
34
90
0 20 40 60 80 100
Q30. Legal,regulated hunting
Q33. Fertility or birthcontrol
Q31. Professionalsor sharpshooters
Q32. Trapping andkilling
Percent
WMU 2C
482 Responsive Management Results for WMU 2C
Q30-Q33. Percent who strongly or moderately oppose each of the following methods of
controlling deer populations in Pennsylvania:
9
55
63
68
0 20 40 60 80 100
Q32. Trapping andkilling
Q31. Professionalsor sharpshooters
Q33. Fertility or birthcontrol
Q30. Legal,regulated hunting
Percent
WMU 2C

Pennsylvania Residents’ Opinions on and Attitudes Toward Deer and Deer Management 483 Results for WMU 2C
Q30-Q33. Percent who strongly oppose each of the following methods of controlling deer populations
in Pennsylvania:
6
44
47
58
0 20 40 60 80 100
Q32. Trapping andkilling
Q31. Professionalsor sharpshooters
Q33. Fertility or birthcontrol
Q30. Legal,regulated hunting
Percent
WMU 2C

484 Responsive Management Results for WMU 2C
Q59/60. Deer hunts and/or allows others to deer hunt on property. (Among respondents living in a
single-family home.)
23
77
1
0 20 40 60 80 100
Yes
No
Don't know
Percent (n=379)
WMU 2C

Pennsylvania Residents’ Opinions on and Attitudes Toward Deer and Deer Management 485 Results for WMU 2C
Q59/60. Deer hunts and/or allows others to deer hunt on property. (Among respondents living in a
single-family home.)
7
93
0 20 40 60 80 100
Yes
No
Percent
Lives in a single familyhome on 1 acre or less inan urban area, a suburbanarea, or a small city/town(n=161)
WMU 2C

486 Responsive Management Results for WMU 2C
Q63. What are the main reasons you do not allow others to hunt deer on your property? (Asked of
those whose primary place of residence is a single-family home and who do not allow others to hunt
deer on their property.)
1
50
49
9
5
4
2
0 20 40 60 80 100
Live in residentialneighborhood /
suburban or urbanarea
Property is too small/ neighbors too close
Concerned aboutsafety
Oppose hunting ingeneral
Not enough deer onproperty / not
enough habitat
Want to savehunting opportunities
for self / family
Liability
Mul
tiple
Res
pons
es A
llow
ed
Percent (n=309)
WMU 2C

Pennsylvania Residents’ Opinions on and Attitudes Toward Deer and Deer Management 487 Results for WMU 2C
Q65. How likely are you to ever allow others to deer hunt on your property? (Asked of those whose
primary place of residence is a single-family home and who do not allow others to hunt deer on their
property.)
1
2
1
1
93
1
0 20 40 60 80 100
Very likely
Somewhat likely
Neither likely norunlikely
Somewhat unlikely
Very unlikely
Don't know
Percent (n=309)
WMU 2C
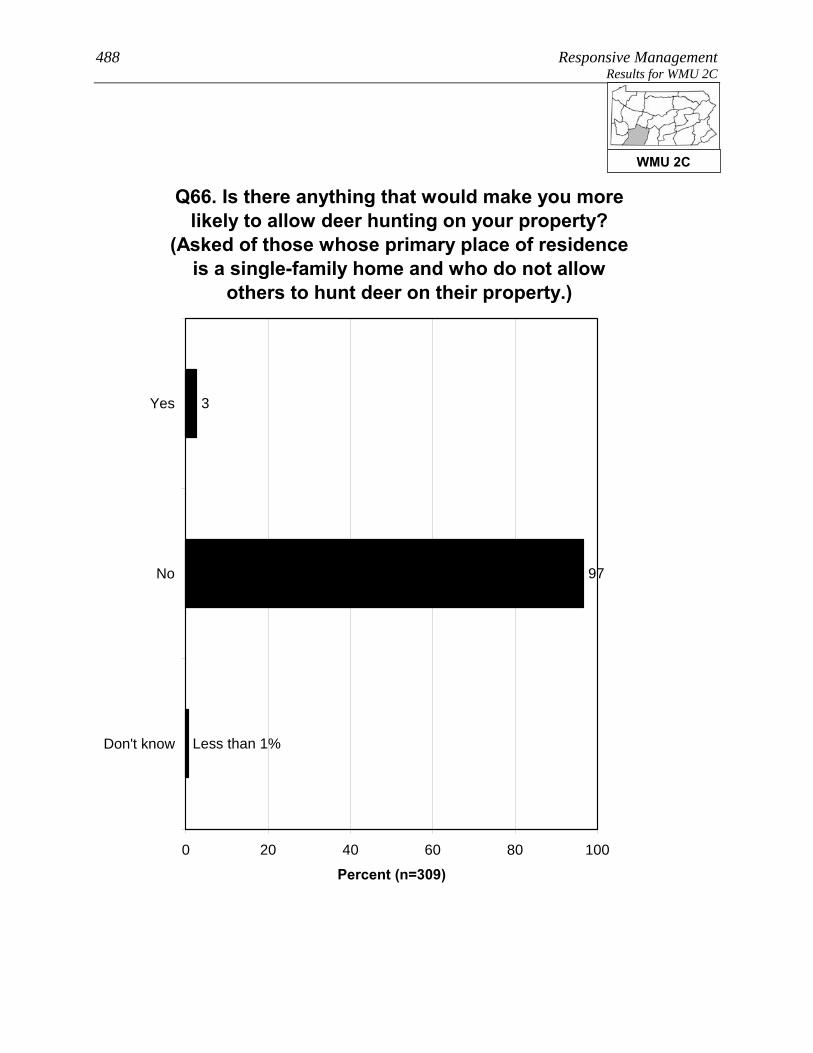
488 Responsive Management Results for WMU 2C
Q66. Is there anything that would make you more likely to allow deer hunting on your property?
(Asked of those whose primary place of residence is a single-family home and who do not allow
others to hunt deer on their property.)
3
97
Less than 1%
0 20 40 60 80 100
Yes
No
Don't know
Percent (n=309)
WMU 2C

Pennsylvania Residents’ Opinions on and Attitudes Toward Deer and Deer Management 489 Results for WMU 2C
Q65. How likely are you to ever allow others to deer hunt on your property? (Asked of those whose
primary place of residence is a single-family home and who do not allow others to hunt deer on their
property.)
2
1
0
0
97
0 20 40 60 80 100
Very likely
Somewhatlikely
Neither likelynor unlikely
Somewhatunlikely
Very unlikely
Percent
Lives in a single familyhome on 1 acre or less inan urban area, a suburbanarea, or a small city/town(n=155)
WMU 2C
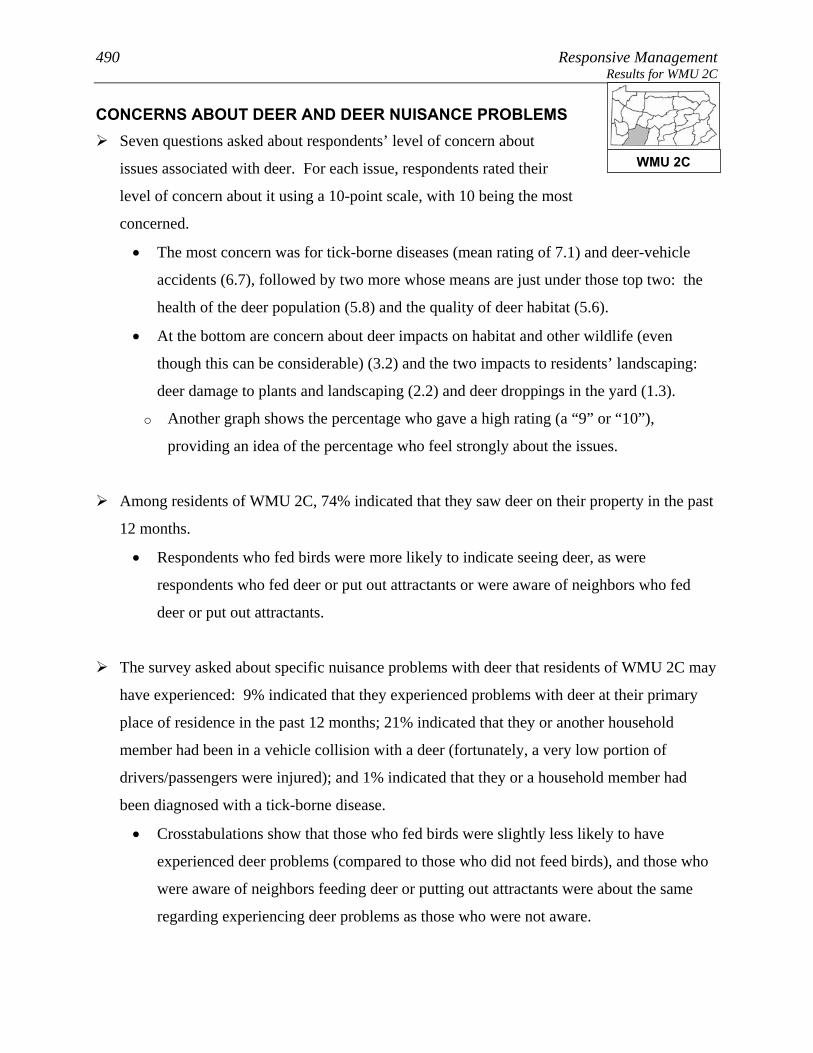
490 Responsive Management Results for WMU 2C
CONCERNS ABOUT DEER AND DEER NUISANCE PROBLEMS Seven questions asked about respondents’ level of concern about
issues associated with deer. For each issue, respondents rated their
level of concern about it using a 10-point scale, with 10 being the most
concerned.
• The most concern was for tick-borne diseases (mean rating of 7.1) and deer-vehicle
accidents (6.7), followed by two more whose means are just under those top two: the
health of the deer population (5.8) and the quality of deer habitat (5.6).
• At the bottom are concern about deer impacts on habitat and other wildlife (even
though this can be considerable) (3.2) and the two impacts to residents’ landscaping:
deer damage to plants and landscaping (2.2) and deer droppings in the yard (1.3).
o Another graph shows the percentage who gave a high rating (a “9” or “10”),
providing an idea of the percentage who feel strongly about the issues.
Among residents of WMU 2C, 74% indicated that they saw deer on their property in the past
12 months.
• Respondents who fed birds were more likely to indicate seeing deer, as were
respondents who fed deer or put out attractants or were aware of neighbors who fed
deer or put out attractants.
The survey asked about specific nuisance problems with deer that residents of WMU 2C may
have experienced: 9% indicated that they experienced problems with deer at their primary
place of residence in the past 12 months; 21% indicated that they or another household
member had been in a vehicle collision with a deer (fortunately, a very low portion of
drivers/passengers were injured); and 1% indicated that they or a household member had
been diagnosed with a tick-borne disease.
• Crosstabulations show that those who fed birds were slightly less likely to have
experienced deer problems (compared to those who did not feed birds), and those who
were aware of neighbors feeding deer or putting out attractants were about the same
regarding experiencing deer problems as those who were not aware.
WMU 2C
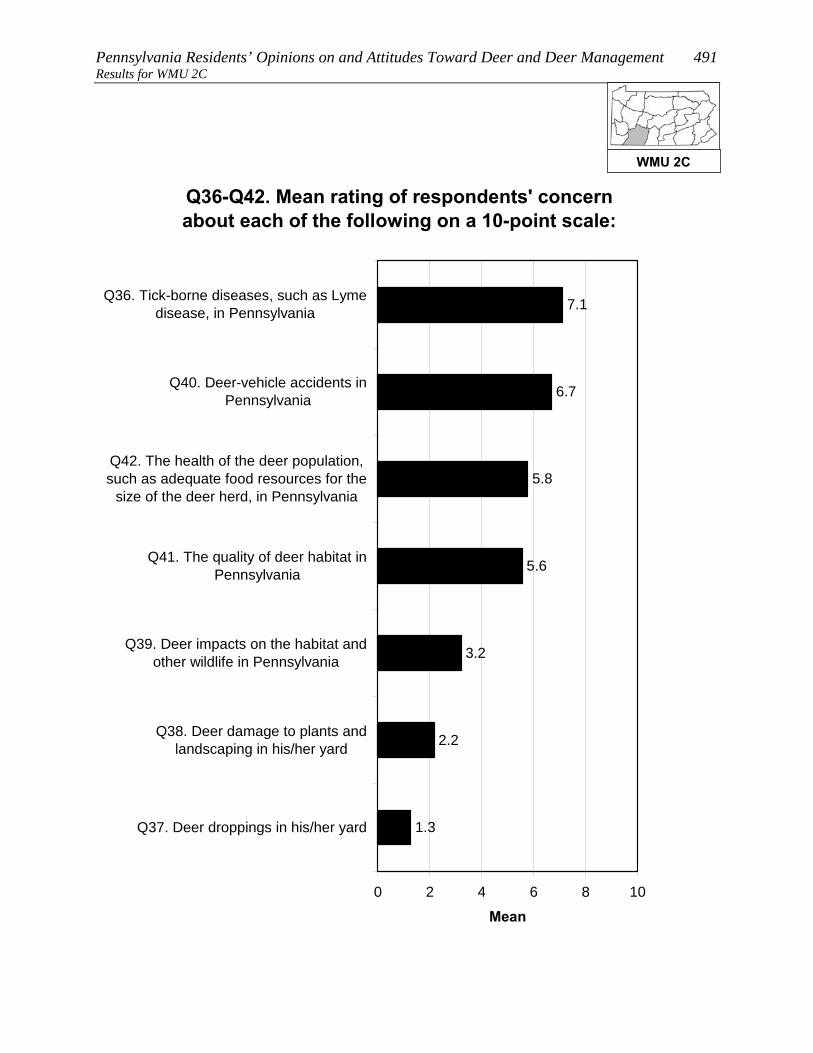
Pennsylvania Residents’ Opinions on and Attitudes Toward Deer and Deer Management 491 Results for WMU 2C
Q36-Q42. Mean rating of respondents' concern about each of the following on a 10-point scale:
2.2
3.2
5.6
5.8
6.7
7.1
1.3
0 2 4 6 8 10
Q36. Tick-borne diseases, such as Lymedisease, in Pennsylvania
Q40. Deer-vehicle accidents inPennsylvania
Q42. The health of the deer population,such as adequate food resources for the
size of the deer herd, in Pennsylvania
Q41. The quality of deer habitat inPennsylvania
Q39. Deer impacts on the habitat andother wildlife in Pennsylvania
Q38. Deer damage to plants andlandscaping in his/her yard
Q37. Deer droppings in his/her yard
Mean
WMU 2C
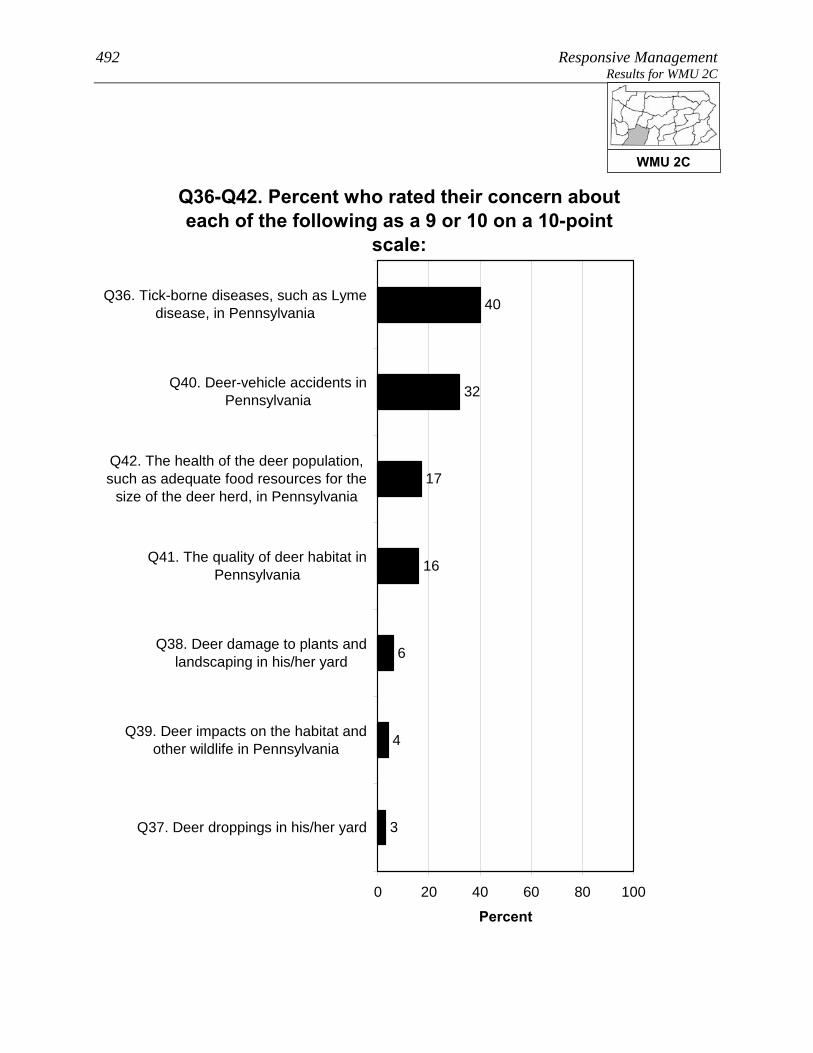
492 Responsive Management Results for WMU 2C
Q36-Q42. Percent who rated their concern about each of the following as a 9 or 10 on a 10-point
scale:
4
6
16
17
32
40
3
0 20 40 60 80 100
Q36. Tick-borne diseases, such as Lymedisease, in Pennsylvania
Q40. Deer-vehicle accidents inPennsylvania
Q42. The health of the deer population,such as adequate food resources for the
size of the deer herd, in Pennsylvania
Q41. The quality of deer habitat inPennsylvania
Q38. Deer damage to plants andlandscaping in his/her yard
Q39. Deer impacts on the habitat andother wildlife in Pennsylvania
Q37. Deer droppings in his/her yard
Percent
WMU 2C

Pennsylvania Residents’ Opinions on and Attitudes Toward Deer and Deer Management 493 Results for WMU 2C
Q49. How often have you seen deer on your property in the past 12 months?
35
21
19
26
0 20 40 60 80 100
Frequently
Sometimes
Rarely
Never
Percent (n=411)
WMU 2C
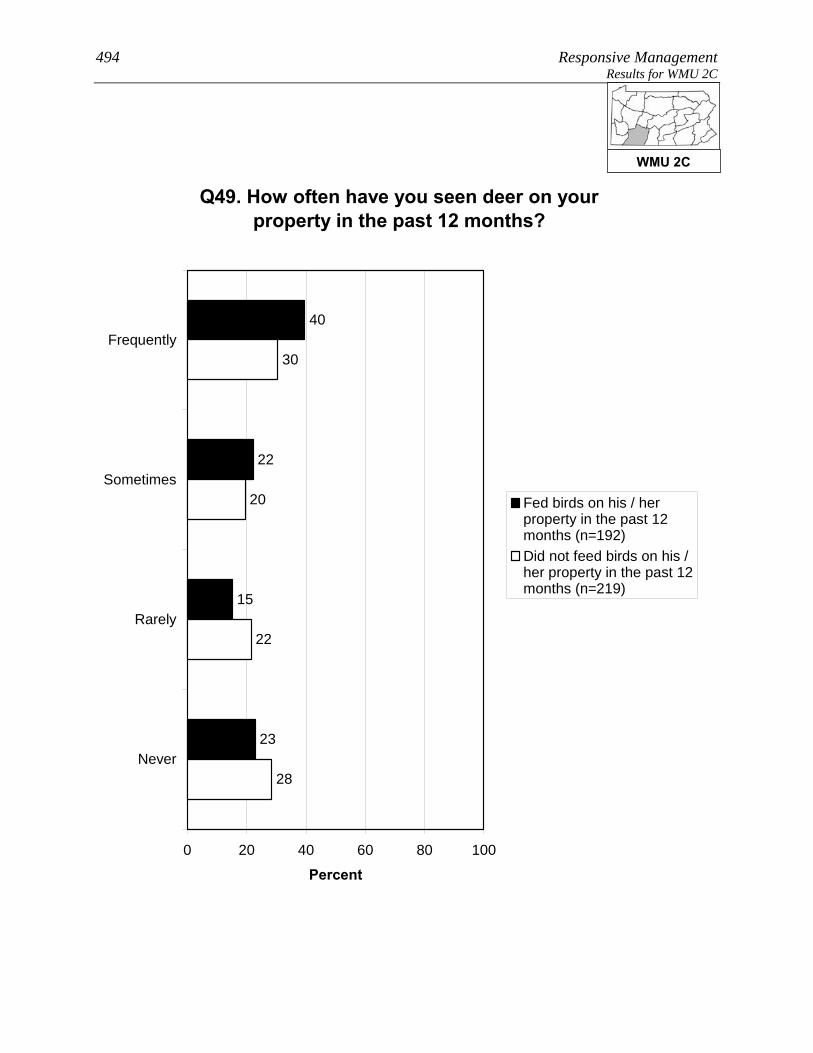
494 Responsive Management Results for WMU 2C
Q49. How often have you seen deer on your property in the past 12 months?
40
22
15
23
22
20
30
28
0 20 40 60 80 100
Frequently
Sometimes
Rarely
Never
Percent
Fed birds on his / herproperty in the past 12months (n=192)Did not feed birds on his /her property in the past 12months (n=219)
WMU 2C

Pennsylvania Residents’ Opinions on and Attitudes Toward Deer and Deer Management 495 Results for WMU 2C
Q49. How often have you seen deer on your property in the past 12 months?
59
34
6
1
20
19
32
29
0 20 40 60 80 100
Frequently
Sometimes
Rarely
Never
Percent
Has fed deer or put outattractants in the past 12months (n=50)Has not fed deer or put outattractants in the past 12months (n=361)
WMU 2C
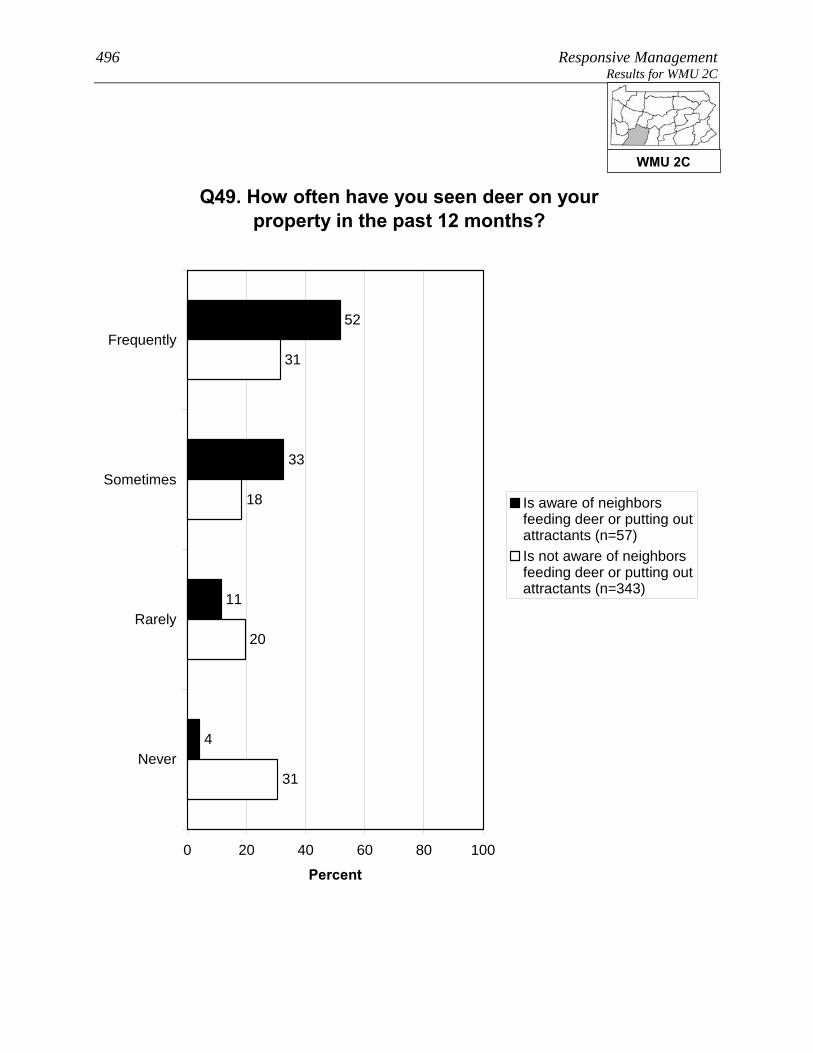
496 Responsive Management Results for WMU 2C
Q49. How often have you seen deer on your property in the past 12 months?
52
33
11
4
20
18
31
31
0 20 40 60 80 100
Frequently
Sometimes
Rarely
Never
Percent
Is aware of neighborsfeeding deer or putting outattractants (n=57)Is not aware of neighborsfeeding deer or putting outattractants (n=343)
WMU 2C

Pennsylvania Residents’ Opinions on and Attitudes Toward Deer and Deer Management 497 Results for WMU 2C
Q43. In the past 12 months, have you experienced any problems with deer at your primary place of
residence?
9
91
0 20 40 60 80 100
Yes
No
Percent (n=411)
WMU 2C
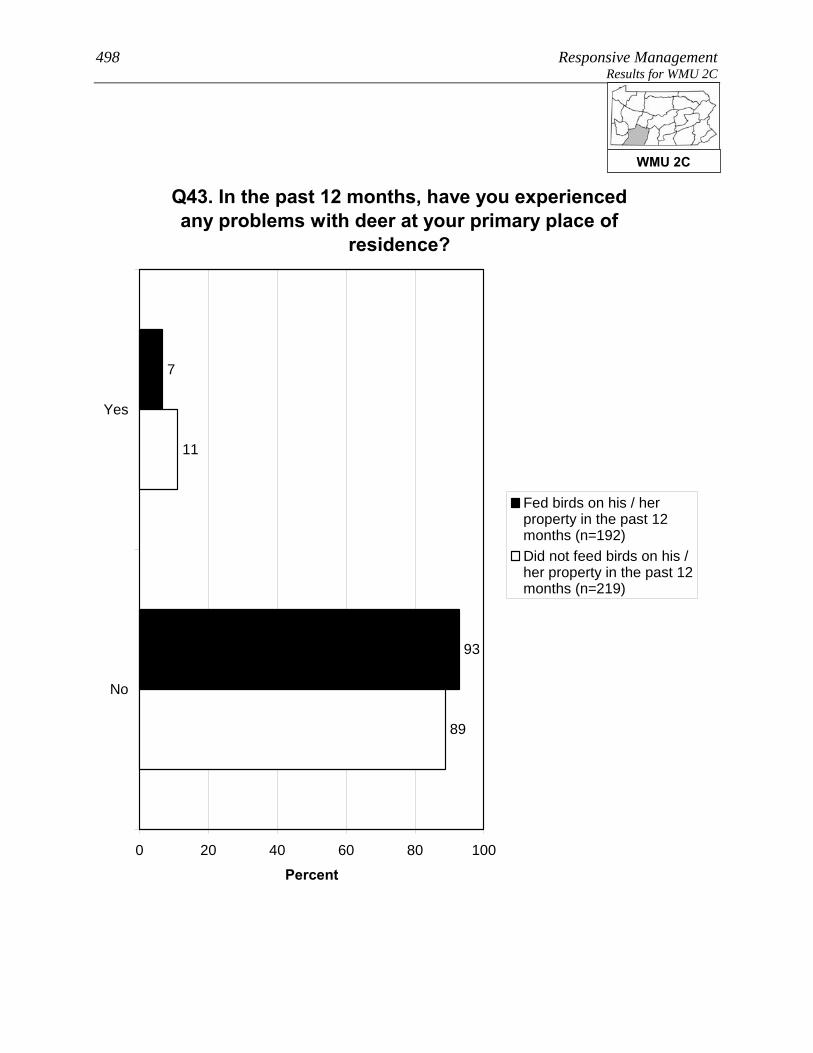
498 Responsive Management Results for WMU 2C
Q43. In the past 12 months, have you experienced any problems with deer at your primary place of
residence?
7
93
89
11
0 20 40 60 80 100
Yes
No
Percent
Fed birds on his / herproperty in the past 12months (n=192)Did not feed birds on his /her property in the past 12months (n=219)
WMU 2C

Pennsylvania Residents’ Opinions on and Attitudes Toward Deer and Deer Management 499 Results for WMU 2C
Q43. In the past 12 months, have you experienced any problems with deer at your primary place of
residence?
10
90
91
9
0 20 40 60 80 100
Yes
No
Percent
Is aware of neighborsfeeding deer or putting outattractants (n=57)Is not aware of neighborsfeeding deer or putting outattractants (n=343)
WMU 2C

500 Responsive Management Results for WMU 2C
Q44. In the past 12 months, have you or any other person living in your immediate household been in a vehicle collision with or an accident involving a
deer on Pennsylvania's roads or highways?
21
79
0 20 40 60 80 100
Yes
No
Percent (n=411)
WMU 2C
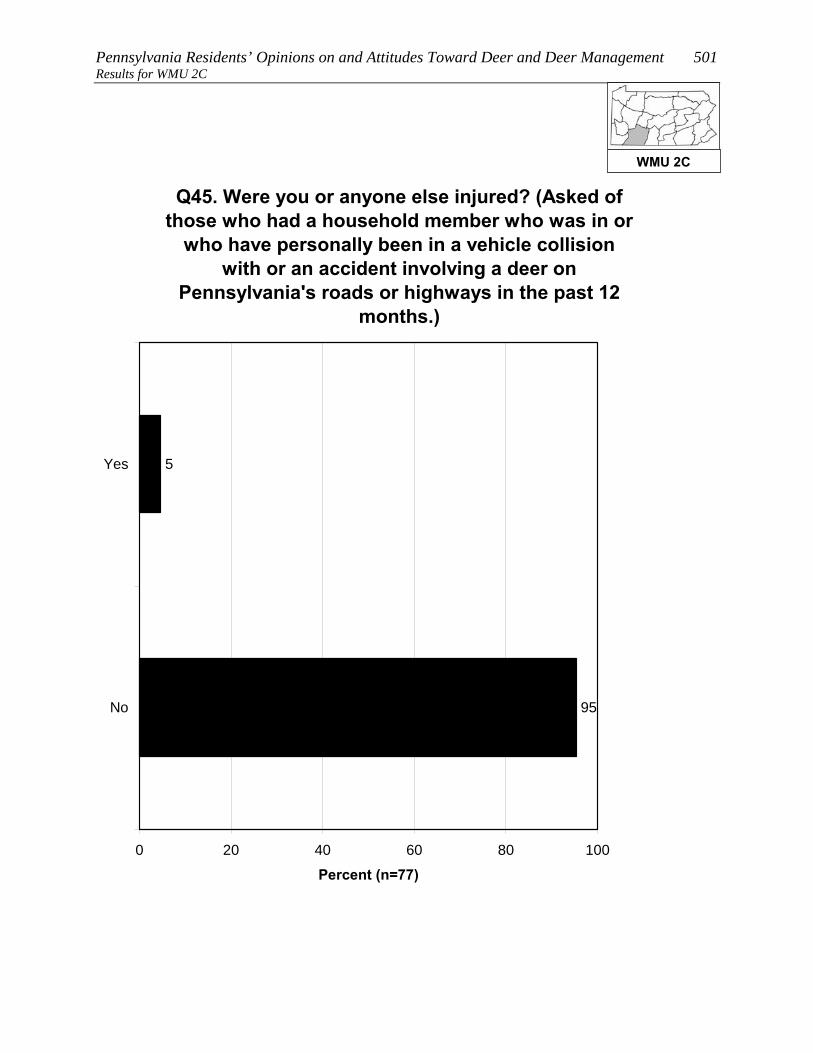
Pennsylvania Residents’ Opinions on and Attitudes Toward Deer and Deer Management 501 Results for WMU 2C
Q45. Were you or anyone else injured? (Asked of those who had a household member who was in or
who have personally been in a vehicle collision with or an accident involving a deer on
Pennsylvania's roads or highways in the past 12 months.)
5
95
0 20 40 60 80 100
Yes
No
Percent (n=77)
WMU 2C
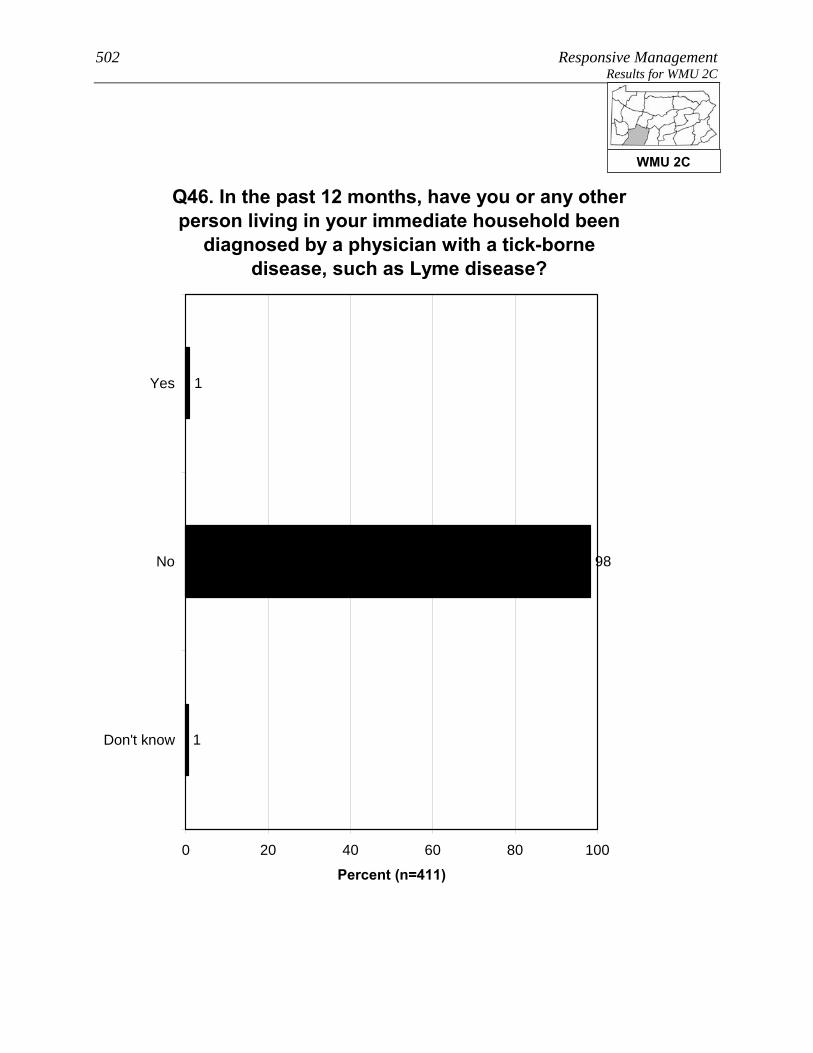
502 Responsive Management Results for WMU 2C
Q46. In the past 12 months, have you or any other person living in your immediate household been
diagnosed by a physician with a tick-borne disease, such as Lyme disease?
1
98
1
0 20 40 60 80 100
Yes
No
Don't know
Percent (n=411)
WMU 2C

Pennsylvania Residents’ Opinions on and Attitudes Toward Deer and Deer Management 503 Results for WMU 2C FEEDING WILDLIFE AND HUNTING DEER
Several questions asked about feeding wildlife.
• Feeding deer or putting out deer attractants: 12% of residents of
WMU 2C did this, and 16% are aware of neighbors who did this.
o The most typical feeds or attractants put out by respondents are corn, salt/mineral
blocks, and apples.
• Feeding birds: 48% of residents of WMU 2C did this.
There is no consensus on whether it is okay for private citizens to feed or attract deer in
Pennsylvania: 55% agree that this is okay, but 35% disagree (the rest are neutral).
More than a quarter of residents of WMU 2C (29%) consider themselves to be a hunter,
about three-fourths of whom have a Pennsylvania hunting license.
• Among residents of WMU 2C who live in a single-family home, 14% personally hunt
deer on their property.
• A large majority of residents of WMU 2C (85%) say that they, family members, and/or
friends hunt.
WMU 2C
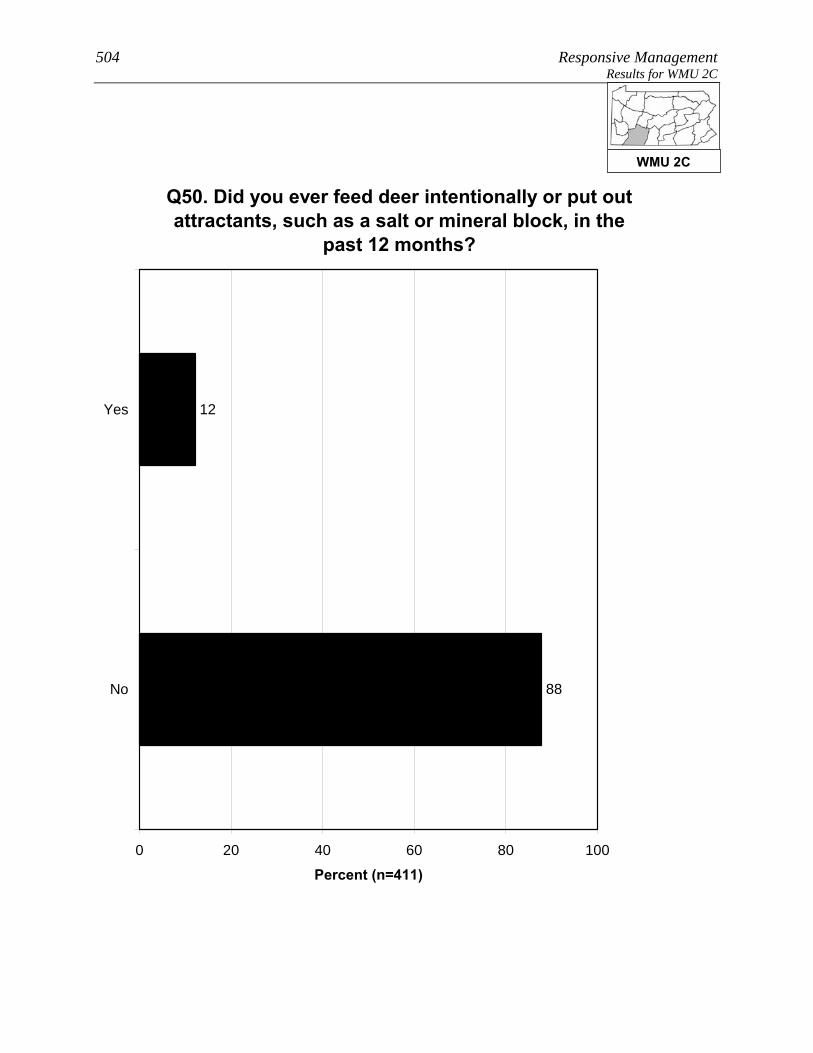
504 Responsive Management Results for WMU 2C
Q50. Did you ever feed deer intentionally or put out attractants, such as a salt or mineral block, in the
past 12 months?
12
88
0 20 40 60 80 100
Yes
No
Percent (n=411)
WMU 2C

Pennsylvania Residents’ Opinions on and Attitudes Toward Deer and Deer Management 505 Results for WMU 2C
Q55. Are you aware of any of your neighbors feeding deer intentionally or trying to attract deer
on their property in the past 12 months?
16
82
2
0 20 40 60 80 100
Yes
No
Don't know
Percent (n=411)
WMU 2C
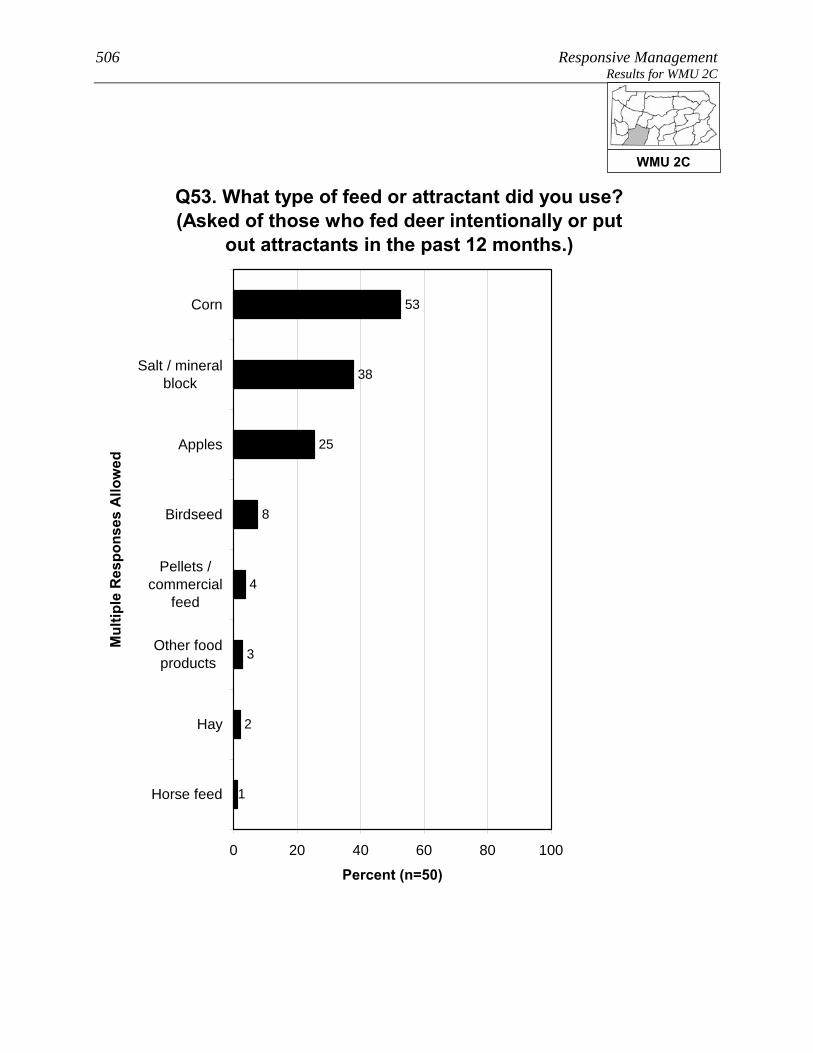
506 Responsive Management Results for WMU 2C
Q53. What type of feed or attractant did you use? (Asked of those who fed deer intentionally or put
out attractants in the past 12 months.)
1
2
53
38
25
8
4
3
0 20 40 60 80 100
Corn
Salt / mineralblock
Apples
Birdseed
Pellets /commercial
feed
Other foodproducts
Hay
Horse feed
Mul
tiple
Res
pons
es A
llow
ed
Percent (n=50)
WMU 2C

Pennsylvania Residents’ Opinions on and Attitudes Toward Deer and Deer Management 507 Results for WMU 2C
Q48. Did you feed birds or make birdfeed available on your property in the past 12 months?
48
52
0 20 40 60 80 100
Yes
No
Percent (n=411)
WMU 2C

508 Responsive Management Results for WMU 2C
Q56. Do you agree or disagree that it is OK for private citizens to feed or attract deer in
Pennsylvania?
30
25
7
11
24
2
0 20 40 60 80 100
Strongly agree
Moderately agree
Neither agree nordisagree
Moderatelydisagree
Strongly disagree
Don't know
Percent (n=411)
WMU 2C

Pennsylvania Residents’ Opinions on and Attitudes Toward Deer and Deer Management 509 Results for WMU 2C
Q59. Do you personally hunt deer on your property? (Asked of those whose primary place of
residence is a single-family home.)
14
86
0 20 40 60 80 100
Yes
No
Percent (n=379)
WMU 2C
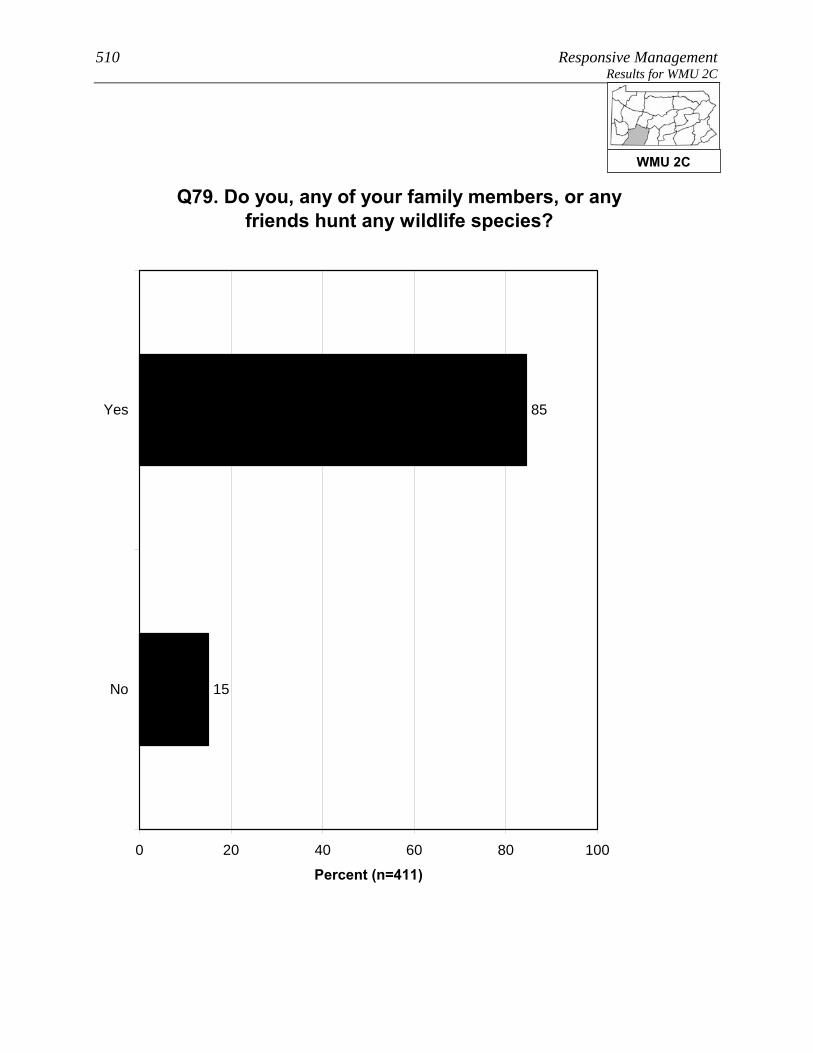
510 Responsive Management Results for WMU 2C
Q79. Do you, any of your family members, or any friends hunt any wildlife species?
85
15
0 20 40 60 80 100
Yes
No
Percent (n=411)
WMU 2C

Pennsylvania Residents’ Opinions on and Attitudes Toward Deer and Deer Management 511 Results for WMU 2C SOURCES OF INFORMATION
Most commonly, residents of WMU 2C say that the best way to
provide them with information about deer in Pennsylvania is through
direct mail (45% gave this response), followed by newspaper (19%),
email (11%), TV (11%), and the Internet (10% saying an Internet site
other than the PGC and 3% saying the agency website; note that some
said both).
More than a third of residents of WMU 2C (38%) use social media, the most common
primary site being Facebook.
WMU 2C
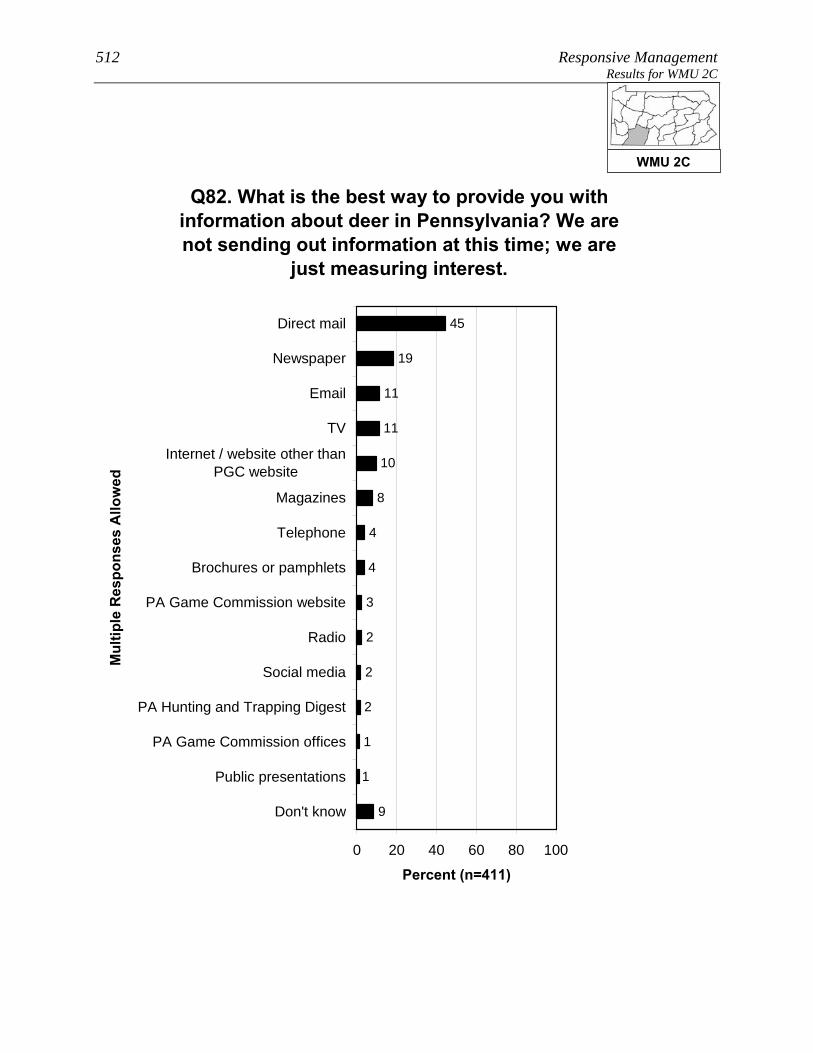
512 Responsive Management Results for WMU 2C
Q82. What is the best way to provide you with information about deer in Pennsylvania? We are not sending out information at this time; we are
just measuring interest.
3
4
4
45
19
11
11
10
8
2
2
2
1
1
9
0 20 40 60 80 100
Direct mail
Newspaper
TV
Internet / website other thanPGC website
Magazines
Telephone
Brochures or pamphlets
PA Game Commission website
Radio
Social media
PA Hunting and Trapping Digest
PA Game Commission offices
Public presentations
Don't know
Mul
tiple
Res
pons
es A
llow
ed
Percent (n=411)
WMU 2C

Pennsylvania Residents’ Opinions on and Attitudes Toward Deer and Deer Management 513 Results for WMU 2C
Q84. Do you use social media, such as Facebook, Twitter, or YouTube?
38
62
0 20 40 60 80 100
Yes
No
Percent (n=411)
WMU 2C

514 Responsive Management Results for WMU 2C
Q85. Which social media site do you use most often? (Asked of those who use social media.)
90
7
3
0 20 40 60 80 100
YouTube
Percent (n=166)
WMU 2C
Pennsylvania Residents’ Opinions on and Attitudes Toward Deer and Deer Management 515 Results for WMU 2D
RESULTS FOR WMU 2D Location: From Franklin, US Rt. 322 east to I-80 near Corsica; I-80 east to US Rt. 219 near DuBois; US Rt. 219 south to US Rt. 119 near DuBois; US Rt. 119 south to US Rt. 22 near Black Lick; US Rt. 22 west to PA Rt. 66 near Delmont; PA Rt. 66 north to PA Rt. 356 to PA Rt. 228 near Sarver; PA Rt. 228 west to PA Rt. 8 near Gibsonia; PA Rt. 8 north to US Rt. 322 at Franklin.
8. Lives in WMU 2D 2. Has seen deer frequently on his/her property in the past 12 months (p < 0.01). 3. Has spent time viewing or watching deer around home in the past 12 months (p < 0.001). 3. Is very or somewhat satisfied with opportunities to view or watch deer in PA (p < 0.001). 4. Considers the deer population in his/her area to be too high (p < 0.001). 4. Strongly or moderately agrees that deer populations should be managed for safe and acceptable levels of deer-human conflicts (p < 0.001). 4. Strongly or moderately supports trapping and killing as a method of controlling deer populations in PA (p < 0.001). 4. Strongly or moderately supports lethal methods to manage deer populations in PA (p < 0.01). 4. Strongly or moderately supports professionals or sharpshooters as a method of controlling deer populations in PA (p < 0.01). 4. Does not strongly or moderately agree that deer populations should be managed for healthy and sustainable deer populations (p < 0.05). 4. Strongly or moderately supports legal, regulated hunting as a method of controlling deer populations in PA (p < 0.05). 5. Rates concern about tick-borne diseases in PA as a 9 or a 10 (p < 0.001). 5. Rates concern about deer-vehicle accidents in PA as a 9 or 10 (p < 0.001). 5. Indicates having experienced a problem with deer at his/her primary place of residence in the past 12 months (p < 0.001). 5. Indicates that he/she or another person living in the immediate household has been diagnosed by a physician with a tick-borne disease in the past 12 months (p < 0.01). 5. Indicates that he/she or another person living in the immediate household has been in a vehicle collision with or an accident involving a deer on PA's roads or highways in the past 12 months (p < 0.05). 5. Rates concern about deer damage to plants and landscaping in their yard as a 9 or 10 (p < 0.05). 8. Does not consider place of residence to be an urban or suburban area (p < 0.001). See page 9 through 11 for explanation of how to interpret z-score tables.

516 Responsive Management Results for WMU 2D
PARTICIPATION IN VIEWING DEER A large majority of residents of WMU 2D (72%) spent time viewing
deer around their home in the past 12 months, and 31% took a trip of
at least a mile to view deer.
• About two-fifths of those who took a deer-viewing trip (41%) used a spotlight to view
the deer at night.
A majority of residents of WMU 2D (77%) are satisfied with opportunities to view deer in
Pennsylvania. Because a relatively large percentage answer neutrally, only 8% indicate
being dissatisfied.
WMU 2D

Pennsylvania Residents’ Opinions on and Attitudes Toward Deer and Deer Management 517 Results for WMU 2D
Q10. Have you spent time viewing or watching deer around your home in the past 12 months?
72
28
0 20 40 60 80 100
Yes
No
Percent (n=405)
WMU 2D

518 Responsive Management Results for WMU 2D
Q11. Have you taken a trip at least 1 mile from your home for the primary purpose of viewing or
watching deer in the past 12 months?
31
69
0 20 40 60 80 100
Yes
No
Percent (n=405)
WMU 2D

Pennsylvania Residents’ Opinions on and Attitudes Toward Deer and Deer Management 519 Results for WMU 2D
Q12. Did you use a spotlight to view deer at night on a trip to watch deer in the past 12 months?
(Asked of those who took a trip at least 1 mile from their home for the primary purpose of viewing or
watching deer in the past 12 months.)
41
59
0 20 40 60 80 100
Yes
No
Percent (n=131)
WMU 2D

520 Responsive Management Results for WMU 2D
Q13. How satisfied are you with opportunities to view or watch deer in Pennsylvania?
47
30
10
3
5
4
0 20 40 60 80 100
Very satisfied
Somewhatsatisfied
Neither satisfiednor dissatisfied
Somewhatdissatisfied
Very dissatisfied
Don't know
Percent (n=405)
WMU 2D
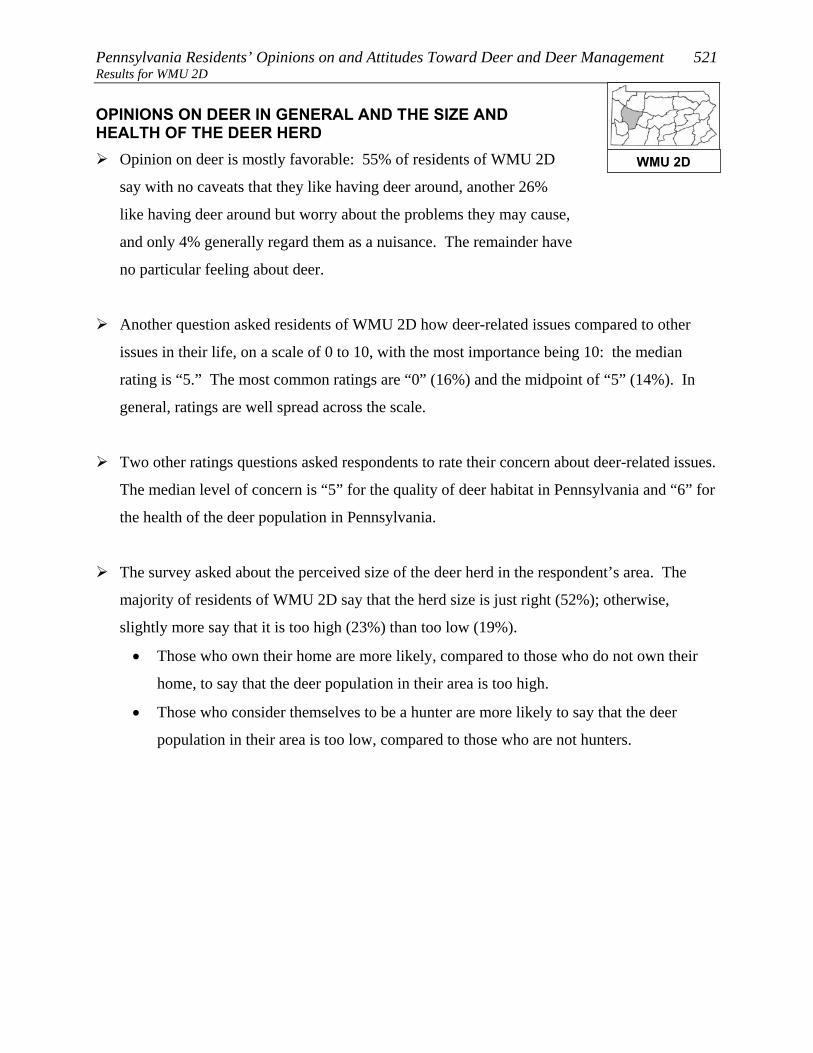
Pennsylvania Residents’ Opinions on and Attitudes Toward Deer and Deer Management 521 Results for WMU 2D OPINIONS ON DEER IN GENERAL AND THE SIZE AND HEALTH OF THE DEER HERD
Opinion on deer is mostly favorable: 55% of residents of WMU 2D
say with no caveats that they like having deer around, another 26%
like having deer around but worry about the problems they may cause,
and only 4% generally regard them as a nuisance. The remainder have
no particular feeling about deer.
Another question asked residents of WMU 2D how deer-related issues compared to other
issues in their life, on a scale of 0 to 10, with the most importance being 10: the median
rating is “5.” The most common ratings are “0” (16%) and the midpoint of “5” (14%). In
general, ratings are well spread across the scale.
Two other ratings questions asked respondents to rate their concern about deer-related issues.
The median level of concern is “5” for the quality of deer habitat in Pennsylvania and “6” for
the health of the deer population in Pennsylvania.
The survey asked about the perceived size of the deer herd in the respondent’s area. The
majority of residents of WMU 2D say that the herd size is just right (52%); otherwise,
slightly more say that it is too high (23%) than too low (19%).
• Those who own their home are more likely, compared to those who do not own their
home, to say that the deer population in their area is too high.
• Those who consider themselves to be a hunter are more likely to say that the deer
population in their area is too low, compared to those who are not hunters.
WMU 2D

522 Responsive Management Results for WMU 2D
Q14. Generally, which of the following best describes your feelings about deer in
Pennsylvania?
55
26
4
15
0 20 40 60 80 100
I like having deeraround
I like having deeraround but worryabout problems
they cause
I generally regarddeer as a nuisance
I have no particularfeeling about deer
Percent (n=405)
WMU 2D
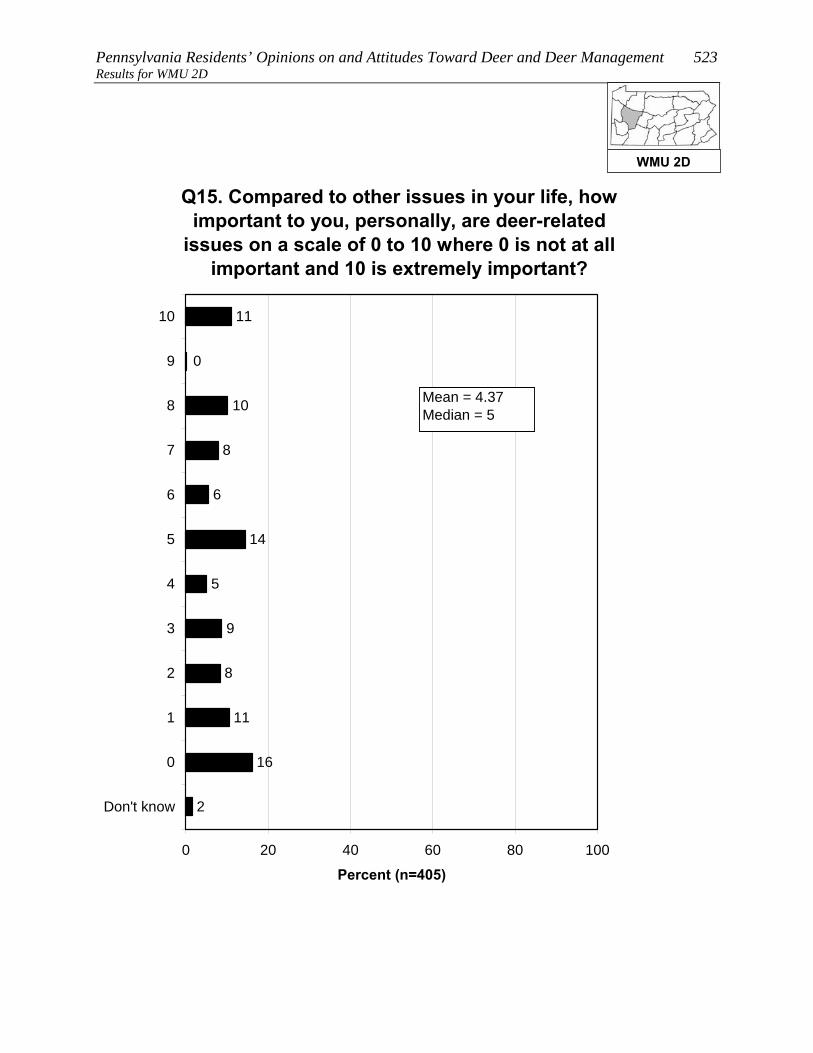
Pennsylvania Residents’ Opinions on and Attitudes Toward Deer and Deer Management 523 Results for WMU 2D
Q15. Compared to other issues in your life, how important to you, personally, are deer-related
issues on a scale of 0 to 10 where 0 is not at all important and 10 is extremely important?
8
9
5
11
0
10
8
6
14
11
16
2
0 20 40 60 80 100
10
9
8
7
6
5
4
3
2
1
0
Don't know
Percent (n=405)
Mean = 4.37Median = 5
WMU 2D
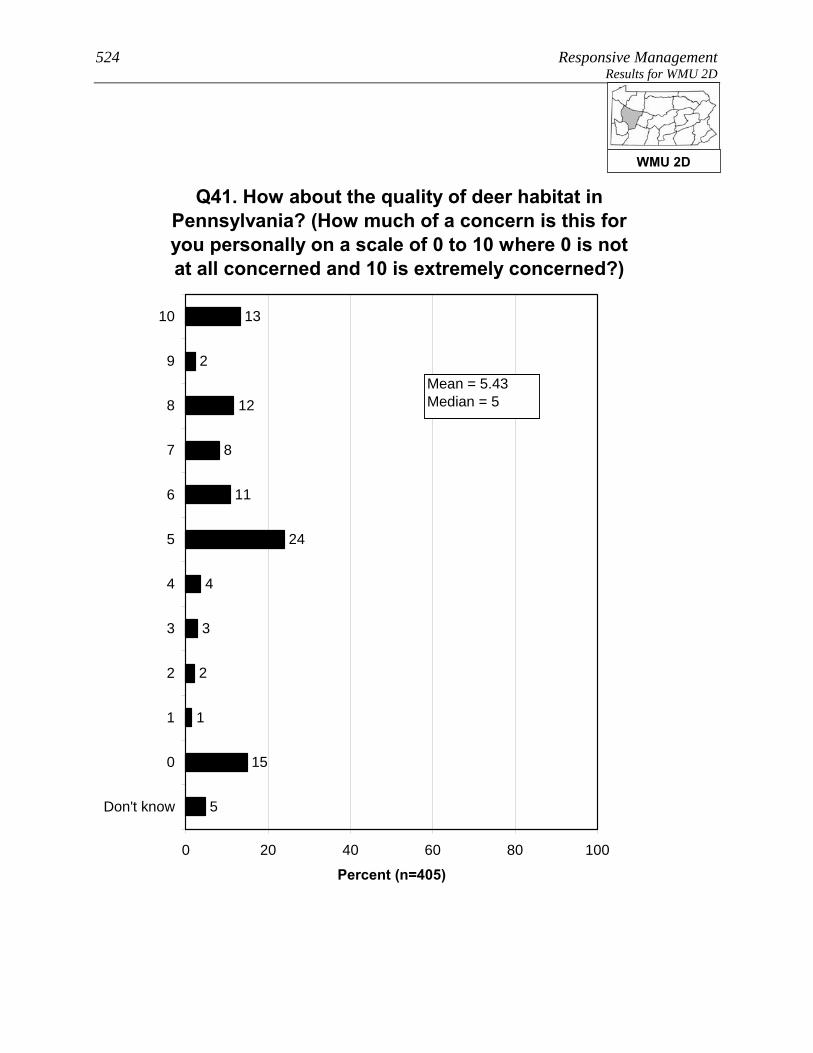
524 Responsive Management Results for WMU 2D
Q41. How about the quality of deer habitat in Pennsylvania? (How much of a concern is this for you personally on a scale of 0 to 10 where 0 is not at all concerned and 10 is extremely concerned?)
2
3
4
13
2
12
8
11
24
1
15
5
0 20 40 60 80 100
10
9
8
7
6
5
4
3
2
1
0
Don't know
Percent (n=405)
Mean = 5.43Median = 5
WMU 2D

Pennsylvania Residents’ Opinions on and Attitudes Toward Deer and Deer Management 525 Results for WMU 2D
2
2
3
17
4
14
11
10
17
2
13
4
0 20 40 60 80 100
10
9
8
7
6
5
4
3
2
1
0
Don't know
Percent (n=405)
Q42. How about health of the deer population, such as adequate food resources for the size of the deer herd, in Pennsylvania? (How much of a concern is this for you
personally on a scale of 0 to 10 where 0 is not at all concerned and 10 is extremely concerned?)
Mean = 5.91Median = 6
WMU 2D
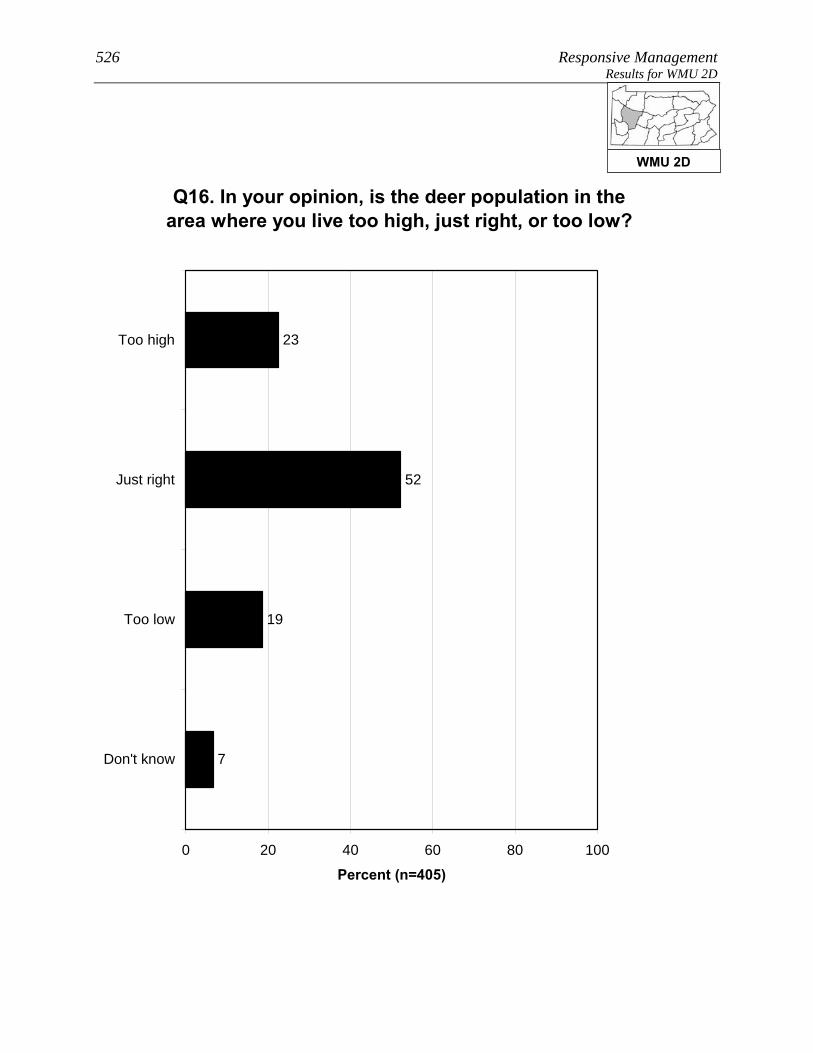
526 Responsive Management Results for WMU 2D
Q16. In your opinion, is the deer population in the area where you live too high, just right, or too low?
23
52
19
7
0 20 40 60 80 100
Too high
Just right
Too low
Don't know
Percent (n=405)
WMU 2D

Pennsylvania Residents’ Opinions on and Attitudes Toward Deer and Deer Management 527 Results for WMU 2D
Q16. In your opinion, is the deer population in the area where you live too high, just right, or too low?
22
53
20
5
25
50
6
19
0 20 40 60 80 100
Too high
Just right
Too low
Don't know
Percent
Owns home (n=339)Does not own home (n=28)
WMU 2D
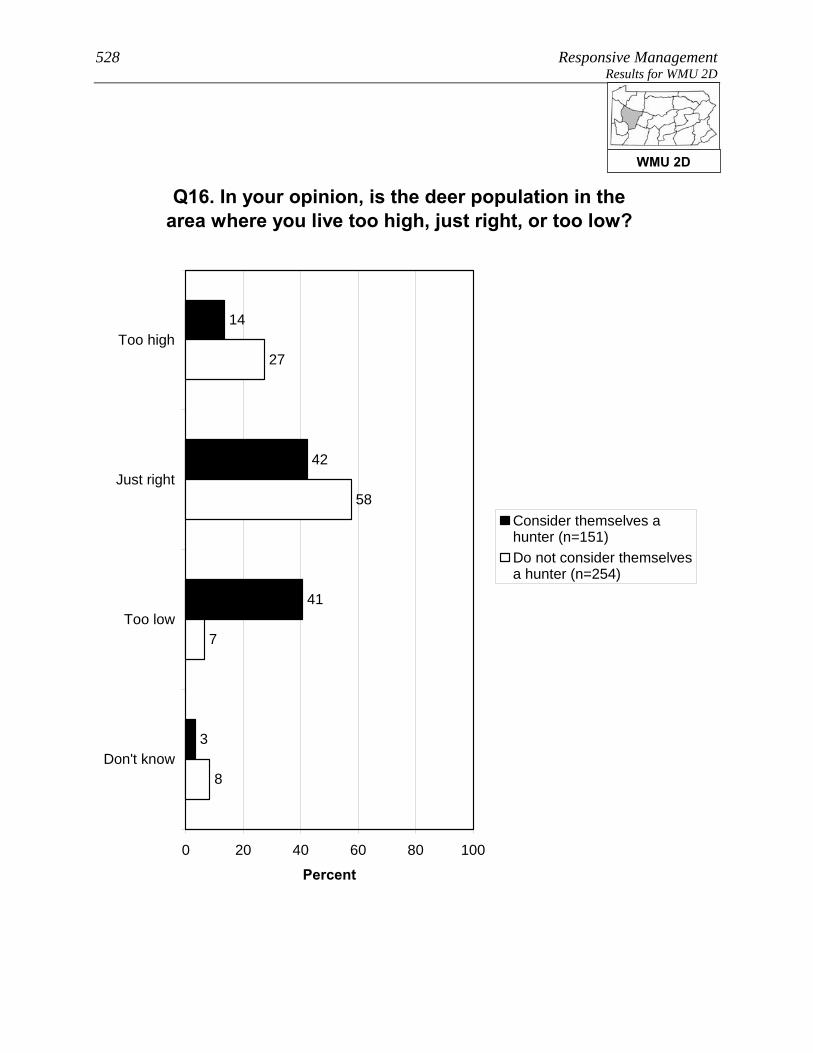
528 Responsive Management Results for WMU 2D
Q16. In your opinion, is the deer population in the area where you live too high, just right, or too low?
14
42
41
3
7
58
27
8
0 20 40 60 80 100
Too high
Just right
Too low
Don't know
Percent
Consider themselves ahunter (n=151)Do not consider themselvesa hunter (n=254)
WMU 2D

Pennsylvania Residents’ Opinions on and Attitudes Toward Deer and Deer Management 529 Results for WMU 2D OPINIONS ON MANAGEMENT EFFORTS AND MANAGEMENT GOALS
The survey asked about three deer population management goals. For
all three, a large majority agree with the management goal: 89% agree
with managing the deer for a healthy and sustainable forest habitat,
88% agree with managing for healthy and sustainable deer
populations, and 89% agree with managing for safe, acceptable levels
of deer-human conflicts.
Residents of WMU 2D who said that the deer population in their area is too high or too low
were asked to indicate the reasonable number of years it should take to achieve an acceptable
deer population. The mean amount is 4.16 years. While 40% said that they do not know, all
the rest gave a number of years of 10 or less. Note that this is only among those who said the
deer population was too high or too low.
• Because management plans typically look at a time frame of about 10 years to effect
change, the survey specifically asked if these respondents would be willing to wait
more than 10 years to achieve an acceptable deer population: just less than a majority
(47%) indicated that they would be willing to wait that long.
WMU 2D

530 Responsive Management Results for WMU 2D
Q24-26. Deer populations should be managed for the following. (Do you agree or disagree with this
deer management goal?)
59
30
1
4
4
2
2
23
65
5
3
2
5
60
29
3
3
1
0 20 40 60 80 100
Stronglyagree
Moderatelyagree
Neither agreenor disagree
Moderatelydisagree
Stronglydisagree
Don't know
Percent (n=405)
Healthy and sustainableforest habitatHealthy and sustainabledeer populationsSafe and acceptable levelsof deer-human conflicts
WMU 2D
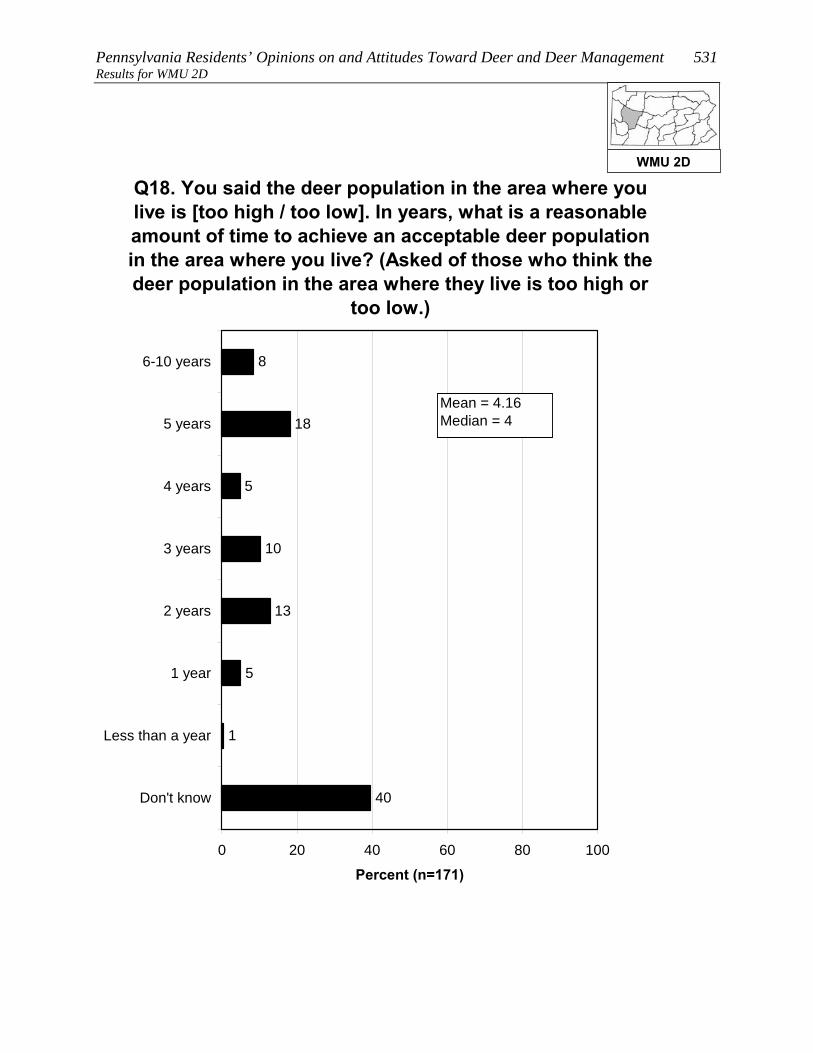
Pennsylvania Residents’ Opinions on and Attitudes Toward Deer and Deer Management 531 Results for WMU 2D
40
1
8
18
5
10
13
5
0 20 40 60 80 100
6-10 years
5 years
4 years
3 years
2 years
1 year
Less than a year
Don't know
Percent (n=171)
Q18. You said the deer population in the area where you live is [too high / too low]. In years, what is a reasonable amount of time to achieve an acceptable deer population in the area where you live? (Asked of those who think the deer population in the area where they live is too high or
too low.)
Mean = 4.16Median = 4
WMU 2D

532 Responsive Management Results for WMU 2D
Q21. Would you be willing to wait more than 10 years to achieve an acceptable deer population in the area where you live? (Among those who think the deer population in the area where they live is
too high or too low.)
47
49
4
0 20 40 60 80 100
Yes
No
Don't know
Percent (n=171)
WMU 2D
Pennsylvania Residents’ Opinions on and Attitudes Toward Deer and Deer Management 533 Results for WMU 2D OPINIONS ON METHODS FOR MANAGING DEER, INCLUDING HUNTING
A majority of residents of WMU 2D (71%) support lethal methods to
manage deer populations in Pennsylvania; nonetheless, 20% oppose,
mostly strong opposition.
• Those residents of WMU 2D who live in a single-family home and own their home are
not markedly different from those who live in a single-family home but do not own
their home regarding support or opposition to lethal methods for managing deer.
• The survey asked about four methods of controlling deer populations (three of them
lethal). The most support is for legal, regulated hunting (94% of respondents support
this method), distantly followed by professionals or sharpshooters (37%), fertility/birth
control (34%), and trapping and killing (31%).
Two questions asked respondents about hunting on their land (among those who live in a
single-family home), the first question about hunting by the respondents themselves (16% do
so) and the second regarding allowing others to hunt on their land (24% do so). In
combining the results, 29% of residents of WMU 2D who live in a single-family home either
hunt on their own land or allow others to do so (it is not simply a sum of the two questions
because some hunt on their property and allow others to do so as well).
• There was interest in seeing how a particular subgroup responded on this question, the
subgroup being those who live in a single-family home; who live on 1 acre or less; and
who live in an urban, suburban area, or a small city/town. Among this subgroup, 3%
either hunt on their own property or allow others to hunt on the property.
• Those respondents who do not allow hunting on their property were asked to indicate
why they prohibit it. The most common reasons are that their property is too small
and/or that they live in an urban or suburban area in which hunting is not possible or
feasible. Other minor reasons are concerns about safety and a general opposition to
hunting.
• Those same respondents who do not allow hunting on their property were asked about
their likelihood of ever allowing others to hunt deer on their property; they
overwhelmingly say this is very unlikely (92%). They were then asked if there is
WMU 2D

534 Responsive Management Results for WMU 2D
anything that would make them more likely to allow deer hunting;
they are almost unanimous (98%) in saying that there is nothing
that would make them more likely to allow deer hunting.
• The question about allowing others to hunt on their property was examined among the
subgroup previously discussed (those who live in a single-family home; who live on 1
acre or less; and who live in an urban, suburban area, or a small city/town). Among
this group who got the question, nearly all say that it is unlikely that they would allow
hunting.
o Additional follow-up questions to be asked of those who indicated that something
might prompt them to allow hunting on their property did not have enough
respondents for statistical validity; therefore, they are not shown.
WMU 2D

Pennsylvania Residents’ Opinions on and Attitudes Toward Deer and Deer Management 535 Results for WMU 2D
Q27. In general, do you support or oppose lethal methods to manage deer populations in
Pennsylvania?
47
24
5
4
16
4
0 20 40 60 80 100
Strongly support
Moderatelysupport
Neither supportnor oppose
Moderately oppose
Strongly oppose
Don't know
Percent (n=405)
WMU 2D
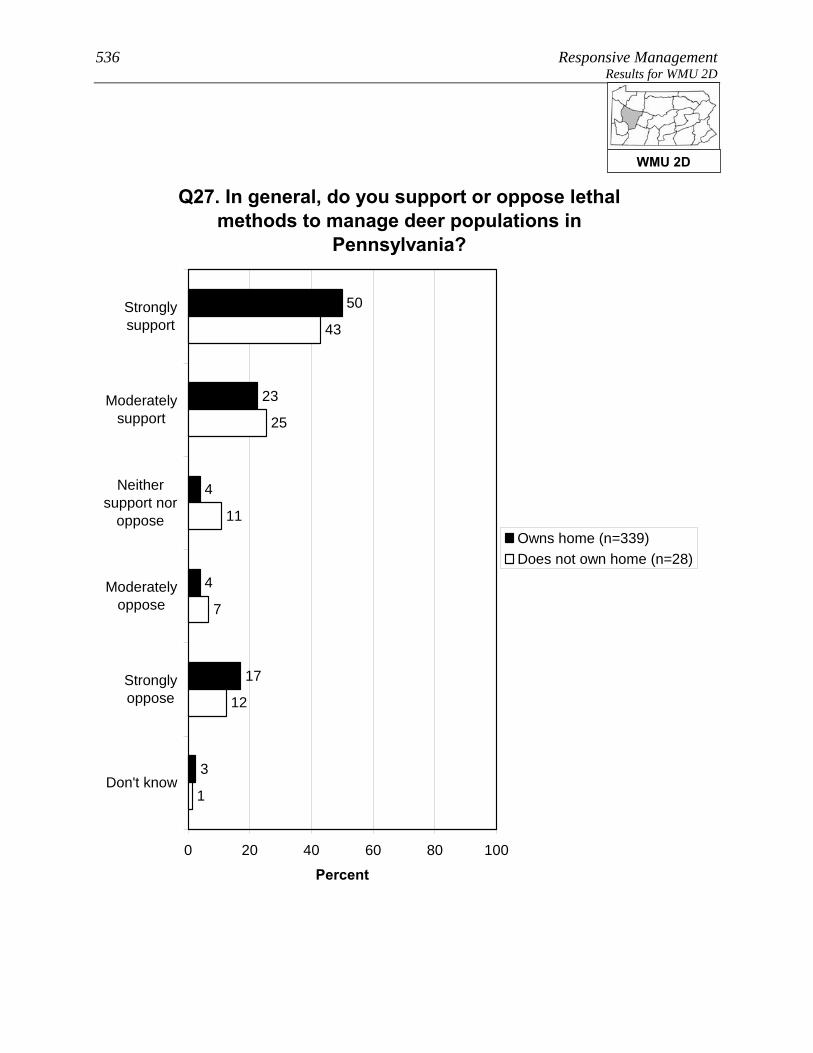
536 Responsive Management Results for WMU 2D
Q27. In general, do you support or oppose lethal methods to manage deer populations in
Pennsylvania?
50
23
4
4
17
3
11
25
43
7
12
1
0 20 40 60 80 100
Stronglysupport
Moderatelysupport
Neithersupport nor
oppose
Moderatelyoppose
Stronglyoppose
Don't know
Percent
Owns home (n=339)Does not own home (n=28)
WMU 2D

Pennsylvania Residents’ Opinions on and Attitudes Toward Deer and Deer Management 537 Results for WMU 2D
Q30-Q33. Percent who strongly support each of the following methods of controlling deer populations
in Pennsylvania:
14
19
20
79
0 20 40 60 80 100
Q30. Legal,regulated hunting
Q31. Professionalsor sharpshooters
Q33. Fertility or birthcontrol
Q32. Trapping andkilling
Percent
WMU 2D

538 Responsive Management Results for WMU 2D
Q30-Q33. Percent who strongly or moderately support each of the following methods of
controlling deer populations in Pennsylvania:
31
34
37
94
0 20 40 60 80 100
Q30. Legal,regulated hunting
Q31. Professionalsor sharpshooters
Q33. Fertility or birthcontrol
Q32. Trapping andkilling
Percent
WMU 2D

Pennsylvania Residents’ Opinions on and Attitudes Toward Deer and Deer Management 539 Results for WMU 2D
Q30-Q33. Percent who strongly or moderately oppose each of the following methods of
controlling deer populations in Pennsylvania:
5
52
56
61
0 20 40 60 80 100
Q32. Trapping andkilling
Q31. Professionalsor sharpshooters
Q33. Fertility or birthcontrol
Q30. Legal,regulated hunting
Percent
WMU 2D

540 Responsive Management Results for WMU 2D
Q30-Q33. Percent who strongly oppose each of the following methods of controlling deer populations
in Pennsylvania:
3
41
43
49
0 20 40 60 80 100
Q32. Trapping andkilling
Q33. Fertility or birthcontrol
Q31. Professionalsor sharpshooters
Q30. Legal,regulated hunting
Percent
WMU 2D

Pennsylvania Residents’ Opinions on and Attitudes Toward Deer and Deer Management 541 Results for WMU 2D
Q59/60. Deer hunts and/or allows others to deer hunt on property. (Among respondents living in a
single-family home.)
71
29
0 20 40 60 80 100
Yes
No
Percent (n=367)
WMU 2D

542 Responsive Management Results for WMU 2D
Q59/60. Deer hunts and/or allows others to deer hunt on property. (Among respondents living in a
single-family home.)
3
97
0 20 40 60 80 100
Yes
No
Percent
Lives in a single familyhome on 1 acre or less inan urban area, a suburbanarea, or a small city/town(n=148)
WMU 2D

Pennsylvania Residents’ Opinions on and Attitudes Toward Deer and Deer Management 543 Results for WMU 2D
Q63. What are the main reasons you do not allow others to hunt deer on your property? (Asked of
those whose primary place of residence is a single-family home and who do not allow others to hunt
deer on their property.)
1
65
43
9
3
2
1
0 20 40 60 80 100
Property is too small/ neighbors too close
Live in residentialneighborhood /
suburban or urbanarea
Concerned aboutsafety
Oppose hunting ingeneral
Liability
Want to save huntingopportunities for self
/ family
Live on rentedproperty
Mul
tiple
Res
pons
es A
llow
ed
Percent (n=280)
WMU 2D

544 Responsive Management Results for WMU 2D
Q65. How likely are you to ever allow others to deer hunt on your property? (Asked of those whose
primary place of residence is a single-family home and who do not allow others to hunt deer on their
property.)
2
2
0
3
92
2
0 20 40 60 80 100
Very likely
Somewhat likely
Neither likely norunlikely
Somewhat unlikely
Very unlikely
Don't know
Percent (n=280)
WMU 2D

Pennsylvania Residents’ Opinions on and Attitudes Toward Deer and Deer Management 545 Results for WMU 2D
Q66. Is there anything that would make you more likely to allow deer hunting on your property?
(Asked of those whose primary place of residence is a single-family home and who do not allow
others to hunt deer on their property.)
2
98
0 20 40 60 80 100
Yes
No
Percent (n=280)
WMU 2D

546 Responsive Management Results for WMU 2D
Q65. How likely are you to ever allow others to deer hunt on your property? (Asked of those whose
primary place of residence is a single-family home and who do not allow others to hunt deer on their
property.)
0
0
0
2
96
1
0 20 40 60 80 100
Very likely
Somewhatlikely
Neither likelynor unlikely
Somewhatunlikely
Very unlikely
Don't know
Percent
Lives in a single familyhome on 1 acre or less inan urban area, a suburbanarea, or a small city/town(n=141)
WMU 2D
Pennsylvania Residents’ Opinions on and Attitudes Toward Deer and Deer Management 547 Results for WMU 2D CONCERNS ABOUT DEER AND DEER NUISANCE PROBLEMS
Seven questions asked about respondents’ level of concern about
issues associated with deer. For each issue, respondents rated their
level of concern about it using a 10-point scale, with 10 being the most
concerned.
• The most concern was for tick-borne diseases (mean rating of 7.9) and deer-vehicle
accidents (6.9), followed by two more whose means are just under those top two: the
health of the deer population (5.9) and the quality of deer habitat (5.4).
• At the bottom are concern about deer impacts on habitat and other wildlife (even
though this can be considerable) (3.5) and the two impacts to residents’ landscaping:
deer damage to plants and landscaping (2.5) and deer droppings in the yard (1.5).
o Another graph shows the percentage who gave a high rating (a “9” or “10”),
providing an idea of the percentage who feel strongly about the issues.
Among residents of WMU 2D, 81% indicated that they saw deer on their property in the past
12 months.
• Respondents who fed birds were more likely to indicate seeing deer, as were
respondents who fed deer or put out attractants or were aware of neighbors who fed
deer or put out attractants.
The survey asked about specific nuisance problems with deer that residents of WMU 2D may
have experienced: 16% indicated that they experienced problems with deer at their primary
place of residence in the past 12 months; 20% indicated that they or another household
member had been in a vehicle collision with a deer (fortunately, a very low portion of
drivers/passengers were injured); and 8% indicated that they or a household member had
been diagnosed with a tick-borne disease.
• Crosstabulations show that those who fed birds were nearly identical regarding
experiencing deer problems to those who do had not fed birds. However, those who
were aware of neighbors feeding deer or putting out attractants were more likely to
experience deer problems than were those who were not aware of neighbors doing this.
WMU 2D

548 Responsive Management Results for WMU 2D
Q36-Q42. Mean rating of respondents' concern about each of the following on a 10-point scale:
2.5
3.5
5.4
5.9
6.9
7.9
1.5
0 2 4 6 8 10
Q36. Tick-borne diseases, such as Lymedisease, in Pennsylvania
Q40. Deer-vehicle accidents inPennsylvania
Q42. The health of the deer population,such as adequate food resources for the
size of the deer herd, in Pennsylvania
Q41. The quality of deer habitat inPennsylvania
Q39. Deer impacts on the habitat andother wildlife in Pennsylvania
Q38. Deer damage to plants andlandscaping in his/her yard
Q37. Deer droppings in his/her yard
Mean
WMU 2D

Pennsylvania Residents’ Opinions on and Attitudes Toward Deer and Deer Management 549 Results for WMU 2D
Q36-Q42. Percent who rated their concern about each of the following as a 9 or 10 on a 10-point
scale:
7
10
16
21
39
55
6
0 20 40 60 80 100
Q36. Tick-borne diseases, such as Lymedisease, in Pennsylvania
Q40. Deer-vehicle accidents inPennsylvania
Q42. The health of the deer population,such as adequate food resources for the
size of the deer herd, in Pennsylvania
Q41. The quality of deer habitat inPennsylvania
Q38. Deer damage to plants andlandscaping in his/her yard
Q39. Deer impacts on the habitat andother wildlife in Pennsylvania
Q37. Deer droppings in his/her yard
Percent
WMU 2D

550 Responsive Management Results for WMU 2D
Q49. How often have you seen deer on your property in the past 12 months?
37
22
22
19
0 20 40 60 80 100
Frequently
Sometimes
Rarely
Never
Percent (n=405)
WMU 2D

Pennsylvania Residents’ Opinions on and Attitudes Toward Deer and Deer Management 551 Results for WMU 2D
Q49. How often have you seen deer on your property in the past 12 months?
42
26
23
10
21
19
33
27
0 20 40 60 80 100
Frequently
Sometimes
Rarely
Never
Percent
Fed birds on his / herproperty in the past 12months (n=195)Did not feed birds on his /her property in the past 12months (n=210)
WMU 2D

552 Responsive Management Results for WMU 2D
Q49. How often have you seen deer on your property in the past 12 months?
63
19
15
3
23
23
33
21
0 20 40 60 80 100
Frequently
Sometimes
Rarely
Never
Percent
Has fed deer or put outattractants in the past 12months (n=47)Has not fed deer or put outattractants in the past 12months (n=356)
WMU 2D
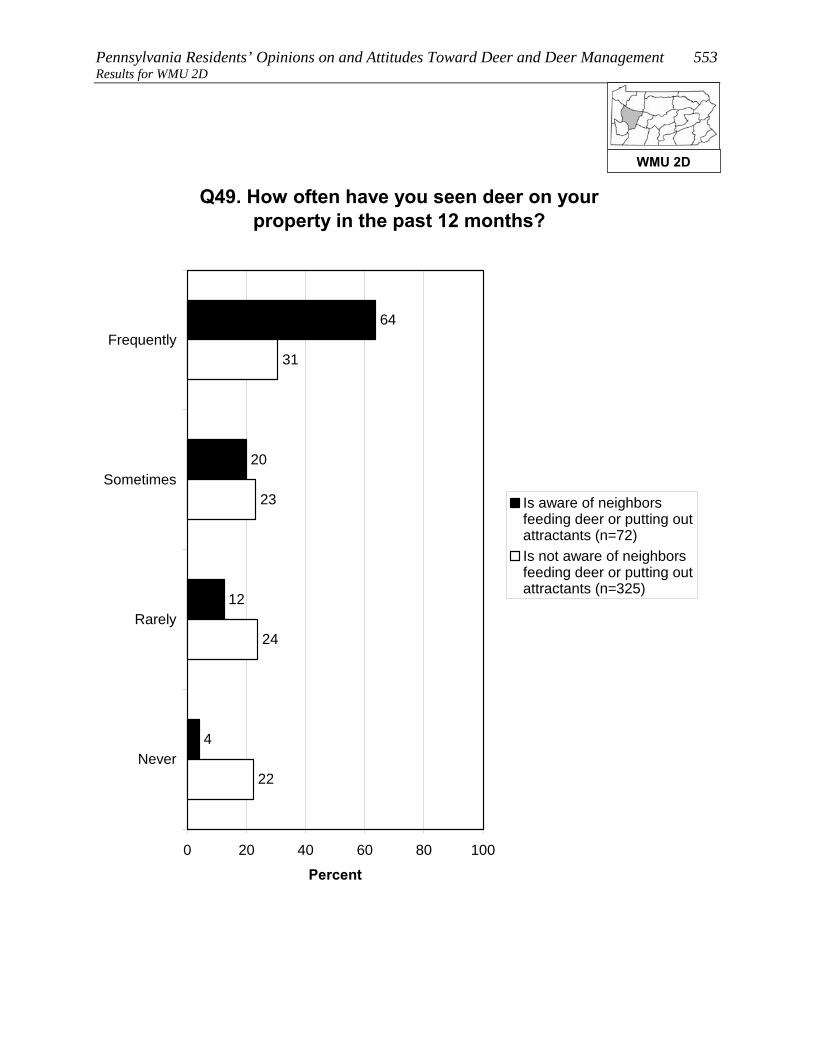
Pennsylvania Residents’ Opinions on and Attitudes Toward Deer and Deer Management 553 Results for WMU 2D
Q49. How often have you seen deer on your property in the past 12 months?
64
20
12
4
24
23
31
22
0 20 40 60 80 100
Frequently
Sometimes
Rarely
Never
Percent
Is aware of neighborsfeeding deer or putting outattractants (n=72)Is not aware of neighborsfeeding deer or putting outattractants (n=325)
WMU 2D

554 Responsive Management Results for WMU 2D
Q43. In the past 12 months, have you experienced any problems with deer at your primary place of
residence?
16
84
0 20 40 60 80 100
Yes
No
Percent (n=405)
WMU 2D

Pennsylvania Residents’ Opinions on and Attitudes Toward Deer and Deer Management 555 Results for WMU 2D
Q43. In the past 12 months, have you experienced any problems with deer at your primary place of
residence?
16
84
84
16
0 20 40 60 80 100
Yes
No
Percent
Fed birds on his / herproperty in the past 12months (n=195)Did not feed birds on his /her property in the past 12months (n=210)
WMU 2D

556 Responsive Management Results for WMU 2D
Q43. In the past 12 months, have you experienced any problems with deer at your primary place of
residence?
20
80
86
14
0 20 40 60 80 100
Yes
No
Percent
Is aware of neighborsfeeding deer or putting outattractants (n=72)Is not aware of neighborsfeeding deer or putting outattractants (n=325)
WMU 2D
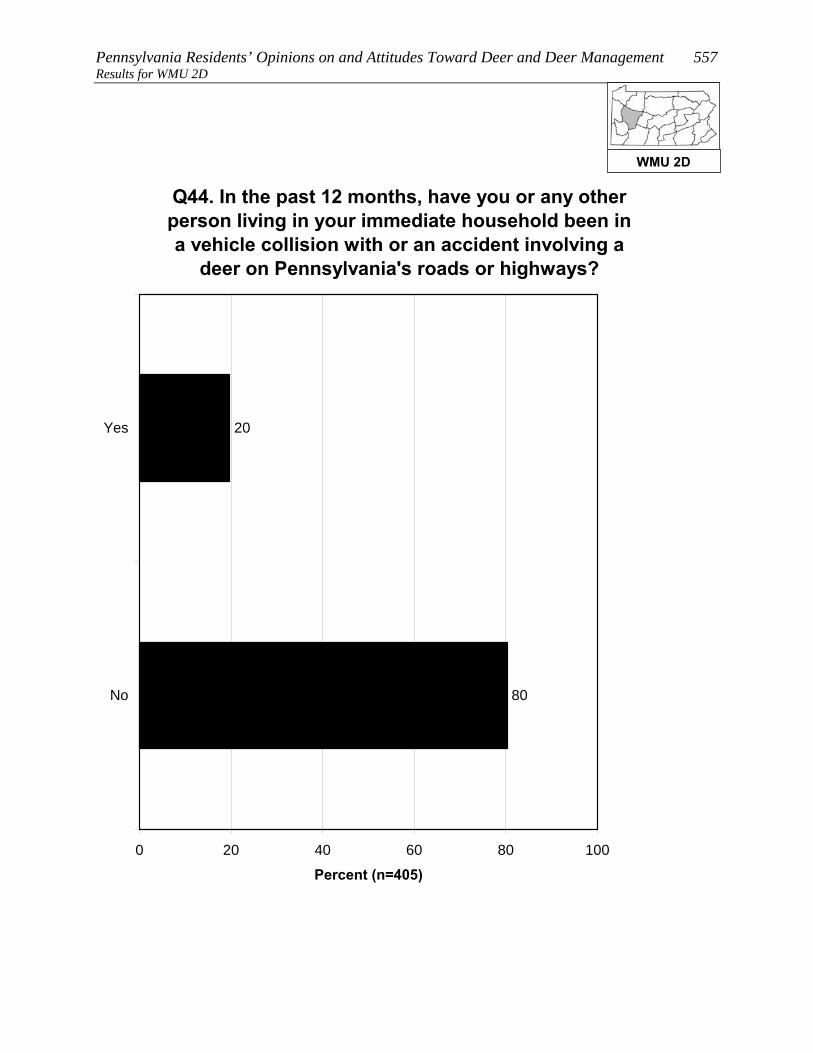
Pennsylvania Residents’ Opinions on and Attitudes Toward Deer and Deer Management 557 Results for WMU 2D
Q44. In the past 12 months, have you or any other person living in your immediate household been in a vehicle collision with or an accident involving a
deer on Pennsylvania's roads or highways?
20
80
0 20 40 60 80 100
Yes
No
Percent (n=405)
WMU 2D

558 Responsive Management Results for WMU 2D
Q45. Were you or anyone else injured? (Asked of those who had a household member who was in or
who have personally been in a vehicle collision with or an accident involving a deer on
Pennsylvania's roads or highways in the past 12 months.)
1
99
0 20 40 60 80 100
Yes
No
Percent (n=89)
WMU 2D

Pennsylvania Residents’ Opinions on and Attitudes Toward Deer and Deer Management 559 Results for WMU 2D
Q46. In the past 12 months, have you or any other person living in your immediate household been
diagnosed by a physician with a tick-borne disease, such as Lyme disease?
8
92
0 20 40 60 80 100
Yes
No
Percent (n=405)
WMU 2D

560 Responsive Management Results for WMU 2D
FEEDING WILDLIFE AND HUNTING DEER Several questions asked about feeding wildlife.
• Feeding deer or putting out deer attractants: 12% of residents of
WMU 2D did this, and 19% are aware of neighbors who did this.
o The most typical feeds or attractants put out by respondents are corn, salt/mineral
blocks, and apples.
• Feeding birds: 49% of residents of WMU 2D did this.
There is no consensus on whether it is okay for private citizens to feed or attract deer in
Pennsylvania: 49% agree that this is okay, but 37% disagree (the rest are neutral).
More than a third of residents of WMU 2D (35%) consider themselves to be a hunter, about
four-fifths of whom have a Pennsylvania hunting license.
• Among residents of WMU 2D who live in a single-family home, 16% personally hunt
deer on their property.
• A large majority of residents of WMU 2D (83%) say that they, family members, and/or
friends hunt.
WMU 2D

Pennsylvania Residents’ Opinions on and Attitudes Toward Deer and Deer Management 561 Results for WMU 2D
Q50. Did you ever feed deer intentionally or put out attractants, such as a salt or mineral block, in the
past 12 months?
12
88
0 20 40 60 80 100
Yes
No
Percent (n=405)
WMU 2D
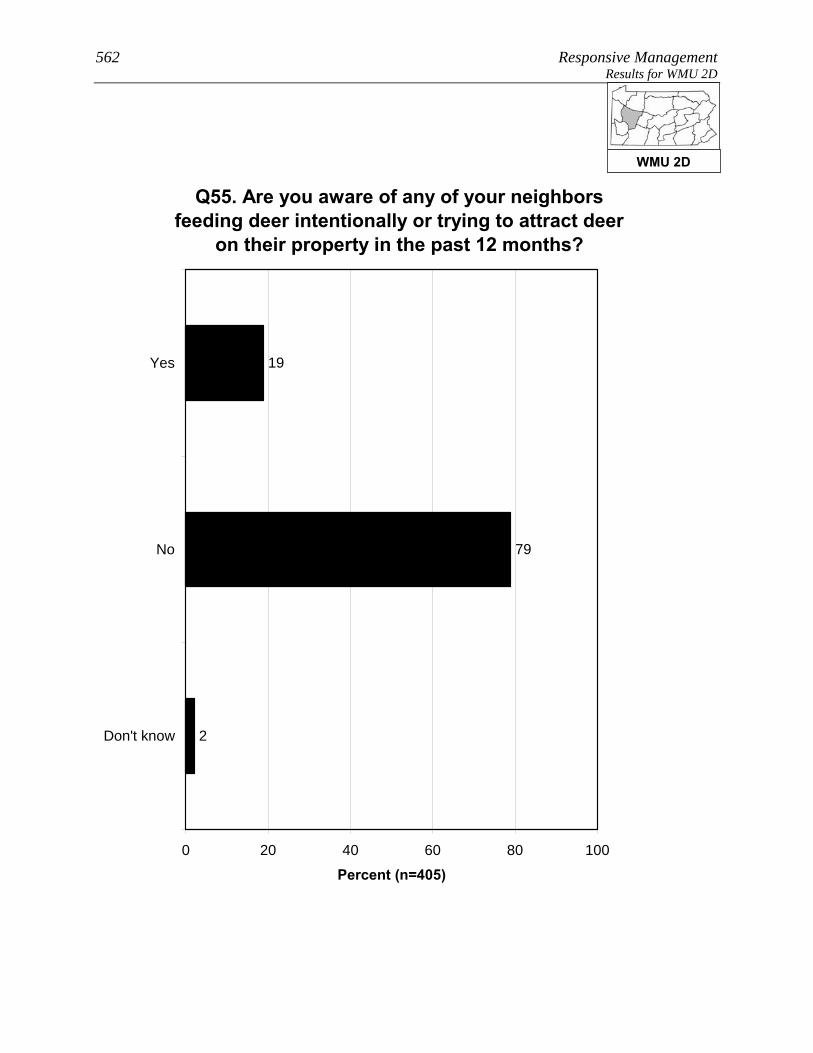
562 Responsive Management Results for WMU 2D
Q55. Are you aware of any of your neighbors feeding deer intentionally or trying to attract deer
on their property in the past 12 months?
19
79
2
0 20 40 60 80 100
Yes
No
Don't know
Percent (n=405)
WMU 2D
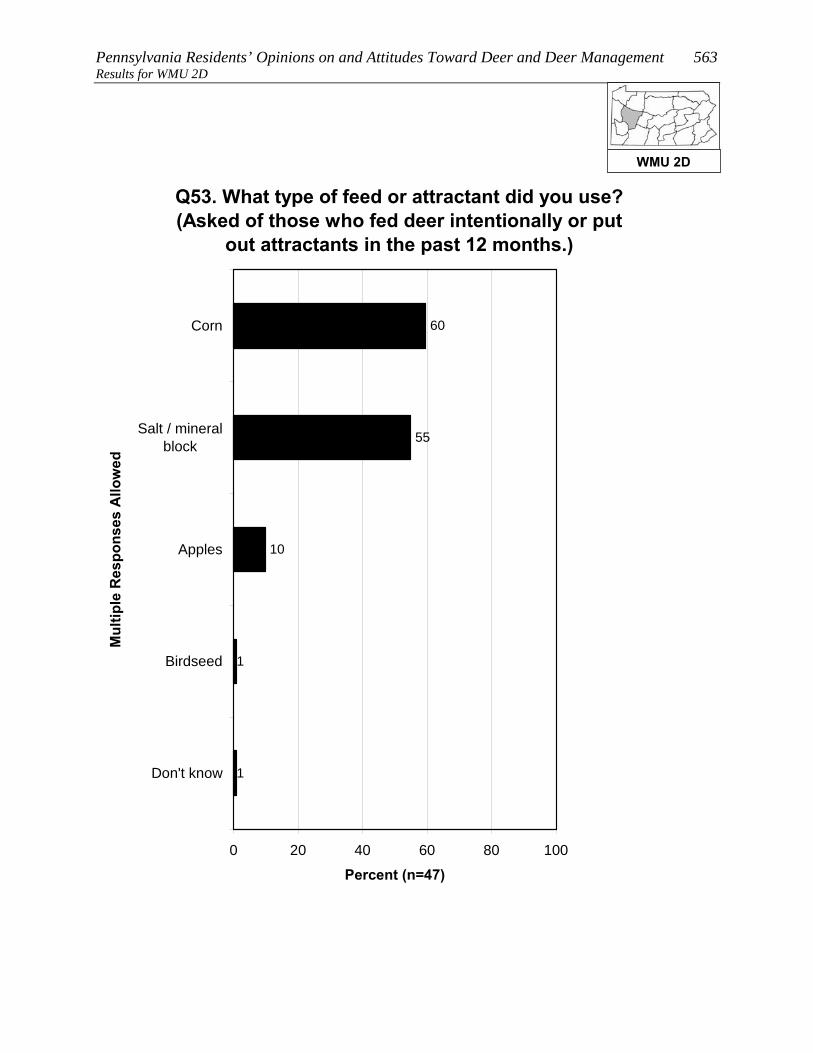
Pennsylvania Residents’ Opinions on and Attitudes Toward Deer and Deer Management 563 Results for WMU 2D
Q53. What type of feed or attractant did you use? (Asked of those who fed deer intentionally or put
out attractants in the past 12 months.)
60
55
10
1
1
0 20 40 60 80 100
Corn
Salt / mineralblock
Apples
Birdseed
Don't know
Mul
tiple
Res
pons
es A
llow
ed
Percent (n=47)
WMU 2D

564 Responsive Management Results for WMU 2D
Q48. Did you feed birds or make birdfeed available on your property in the past 12 months?
49
51
0 20 40 60 80 100
Yes
No
Percent (n=405)
WMU 2D

Pennsylvania Residents’ Opinions on and Attitudes Toward Deer and Deer Management 565 Results for WMU 2D
Q56. Do you agree or disagree that it is OK for private citizens to feed or attract deer in
Pennsylvania?
26
23
12
15
22
1
0 20 40 60 80 100
Strongly agree
Moderately agree
Neither agree nordisagree
Moderatelydisagree
Strongly disagree
Don't know
Percent (n=405)
WMU 2D

566 Responsive Management Results for WMU 2D
Q59. Do you personally hunt deer on your property? (Asked of those whose primary place of
residence is a single-family home.)
16
84
0 20 40 60 80 100
Yes
No
Percent (n=367)
WMU 2D
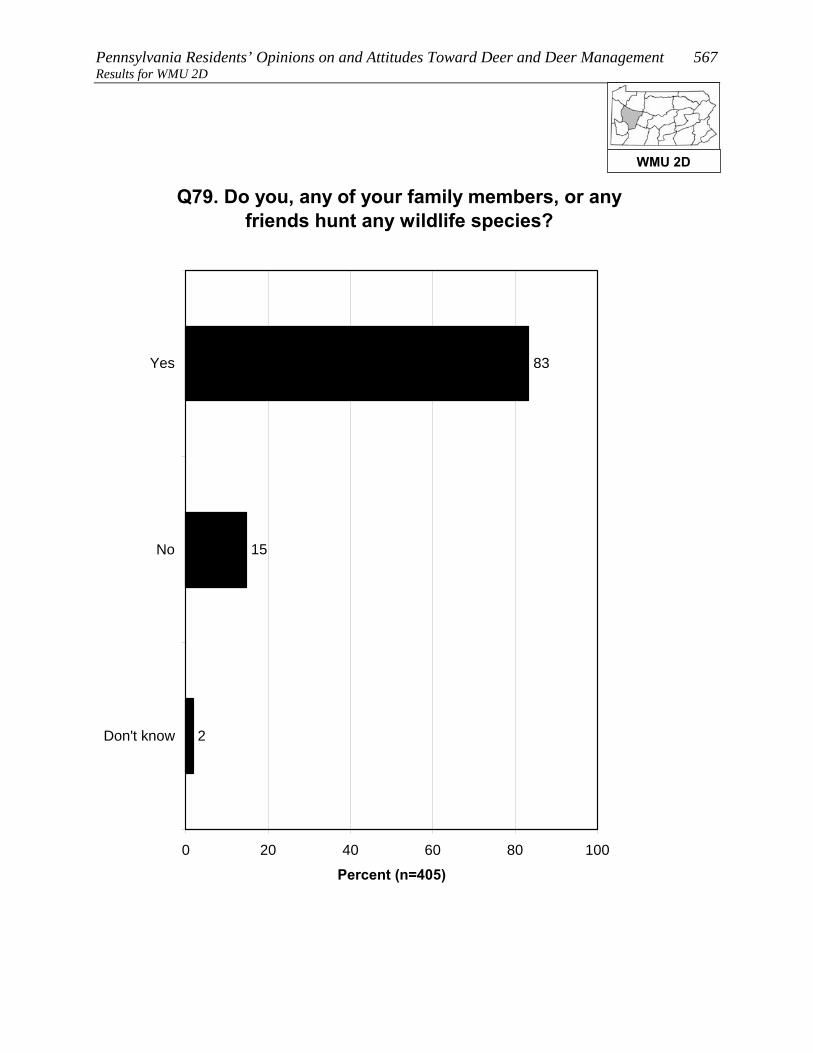
Pennsylvania Residents’ Opinions on and Attitudes Toward Deer and Deer Management 567 Results for WMU 2D
Q79. Do you, any of your family members, or any friends hunt any wildlife species?
83
15
2
0 20 40 60 80 100
Yes
No
Don't know
Percent (n=405)
WMU 2D

568 Responsive Management Results for WMU 2D
SOURCES OF INFORMATION Most commonly, residents of WMU 2D say that the best way to
provide them with information about deer in Pennsylvania is through
direct mail (38% gave this response), followed by newspaper (20%),
email (17%), and the Internet (13% saying an Internet site other than
the PGC and 3% saying the agency website; note that some said both).
More than two-fifths of residents of WMU 2D (43%) use social media, the most common
primary site being Facebook.
WMU 2D
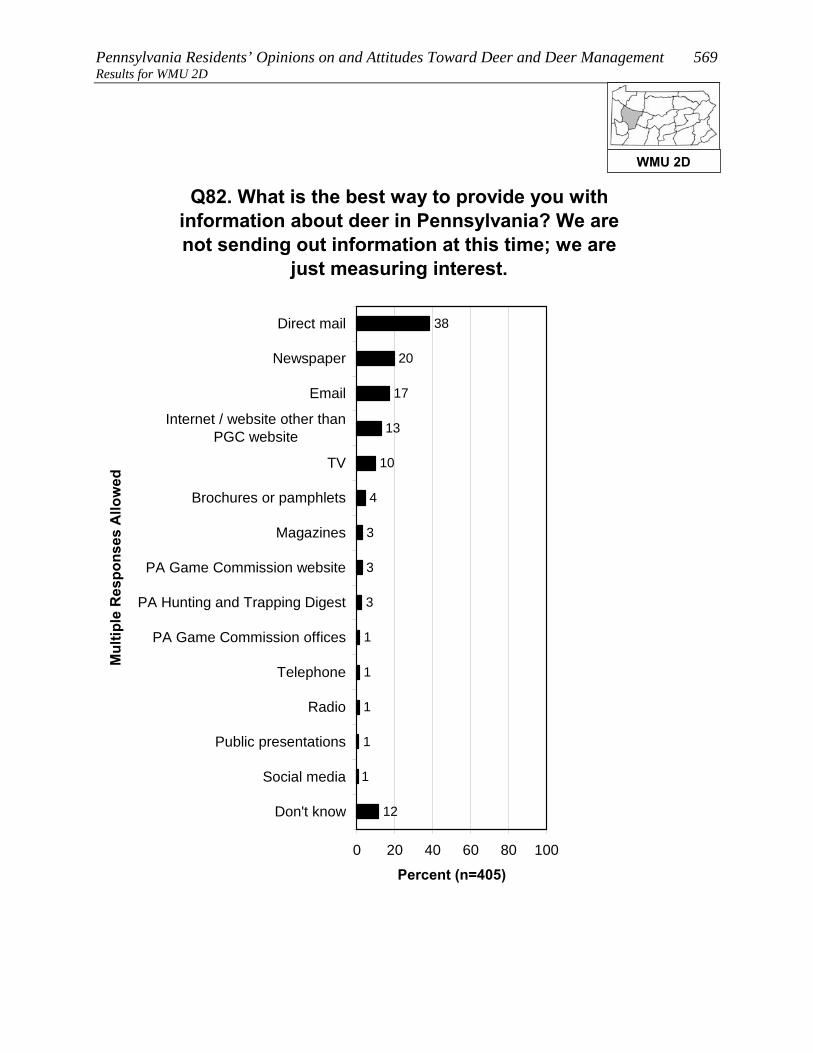
Pennsylvania Residents’ Opinions on and Attitudes Toward Deer and Deer Management 569 Results for WMU 2D
Q82. What is the best way to provide you with information about deer in Pennsylvania? We are not sending out information at this time; we are
just measuring interest.
3
3
3
38
20
17
13
10
4
1
1
1
1
1
12
0 20 40 60 80 100
Direct mail
Newspaper
Internet / website other thanPGC website
TV
Brochures or pamphlets
Magazines
PA Game Commission website
PA Hunting and Trapping Digest
PA Game Commission offices
Telephone
Radio
Public presentations
Social media
Don't know
Mul
tiple
Res
pons
es A
llow
ed
Percent (n=405)
WMU 2D
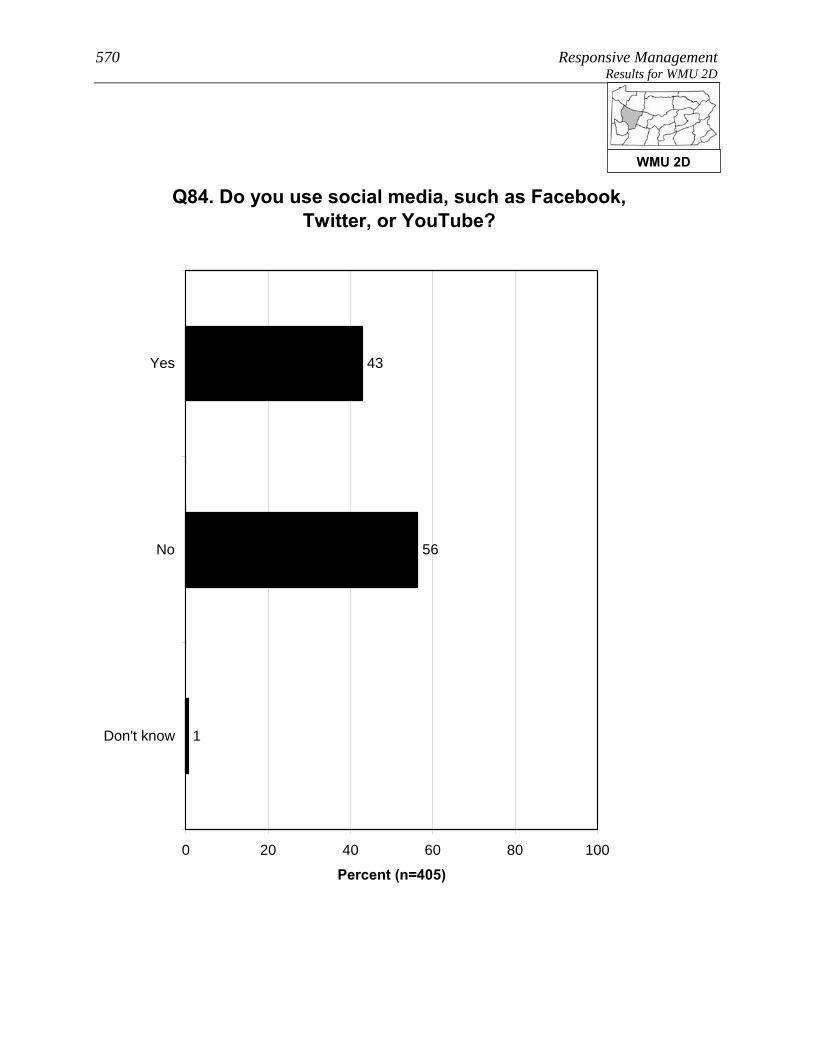
570 Responsive Management Results for WMU 2D
Q84. Do you use social media, such as Facebook, Twitter, or YouTube?
43
56
1
0 20 40 60 80 100
Yes
No
Don't know
Percent (n=405)
WMU 2D

Pennsylvania Residents’ Opinions on and Attitudes Toward Deer and Deer Management 571 Results for WMU 2D
Q85. Which social media site do you use most often? (Asked of those who use social media.)
84
12
3
1
0 20 40 60 80 100
YouTube
Don't know
Percent (n=180)
WMU 2D

572 Responsive Management Results for WMU 2E
RESULTS FOR WMU 2E Location: From near DuBois, I-80 east to PA Rt. 53 near Klyertown; PA Rt. 53 south to US Rt. 22 near Cresson; US Rt. 22 west to US Rt. 422 near Ebensburg; US Rt. 422 west to US Rt. 119 near Indiana; US Rt. 119 north to US Rt. 219 near DuBois; US Rt. 219 north to I-80 near DuBois.
8. Lives in WMU 2E 1. Considers deer-related issues as a 9 or 10 in importance as compared to other issues in his/her life (p < 0.01). 3. Indicates that he/she or a family member hunts (p < 0.001). 3. Has taken a trip more than a mile from home for the primary purpose of viewing or watching deer in the past 12 months (p < 0.001). 3. Has a valid 2011 PA general hunting license (p < 0.001). 3. Considers himself/herself to be a hunter (p < 0.01). 3. Is very or somewhat satisfied with opportunities to view or watch deer in PA (p < 0.05). 4. Strongly or moderately supports lethal methods to manage deer populations in PA (p < 0.01). 4. Does not strongly or moderately support fertility or birth control as a method of controlling deer populations in PA (p < 0.05). 5. Indicates that he/she or another person living in the immediate household has been in a vehicle collision with or an accident involving a deer on PA's roads or highways in the past 12 months (p < 0.001). 5. Indicates that he/she or another person living in the immediate household has been diagnosed by a physician with a tick-borne disease in the past 12 months (p < 0.001). 5. Rates concern about tick-borne diseases in PA as a 9 or a 10 (p < 0.01). 7. Uses Facebook (p < 0.001). 7. Uses social media, such as Facebook, Twitter, or YouTube (p < 0.001). 8. Does not consider place of residence to be an urban or suburban area (p < 0.001). 8. Primary place of residence is not a single-family home (p < 0.05). 8. Has more than median number of people living in his/her household (p < 0.05). See page 9 through 11 for explanation of how to interpret z-score tables.

Pennsylvania Residents’ Opinions on and Attitudes Toward Deer and Deer Management 573 Results for WMU 2E PARTICIPATION IN VIEWING DEER
Two-thirds of residents of WMU 2E (66%) spent time viewing deer
around their home in the past 12 months, and 39% took a trip of at
least a mile to view deer.
• Just under half of those who took a deer-viewing trip (44%) used a spotlight to view the
deer at night.
A majority of residents of WMU 2E (74%) are satisfied with opportunities to view deer in
Pennsylvania. Because a relatively large percentage answer neutrally, only 10% indicate
being dissatisfied.
WMU 2E

574 Responsive Management Results for WMU 2E
Q10. Have you spent time viewing or watching deer around your home in the past 12 months?
66
34
0 20 40 60 80 100
Yes
No
Percent (n=406)
WMU 2E
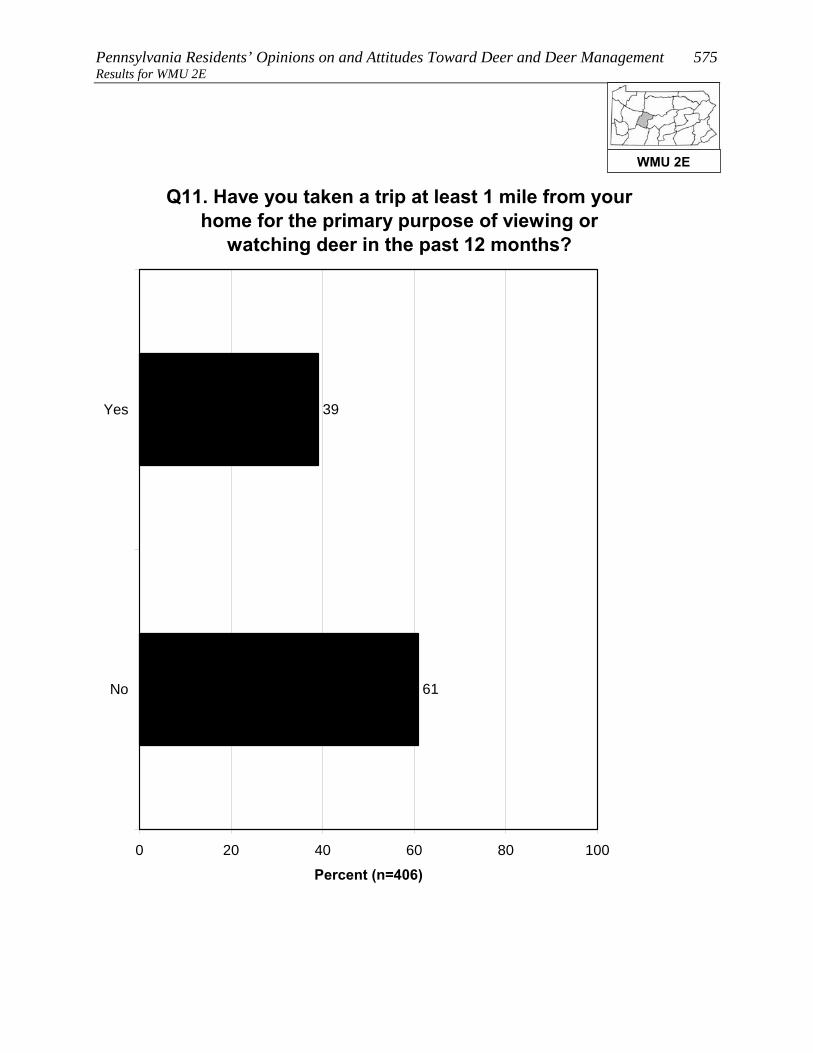
Pennsylvania Residents’ Opinions on and Attitudes Toward Deer and Deer Management 575 Results for WMU 2E
Q11. Have you taken a trip at least 1 mile from your home for the primary purpose of viewing or
watching deer in the past 12 months?
39
61
0 20 40 60 80 100
Yes
No
Percent (n=406)
WMU 2E
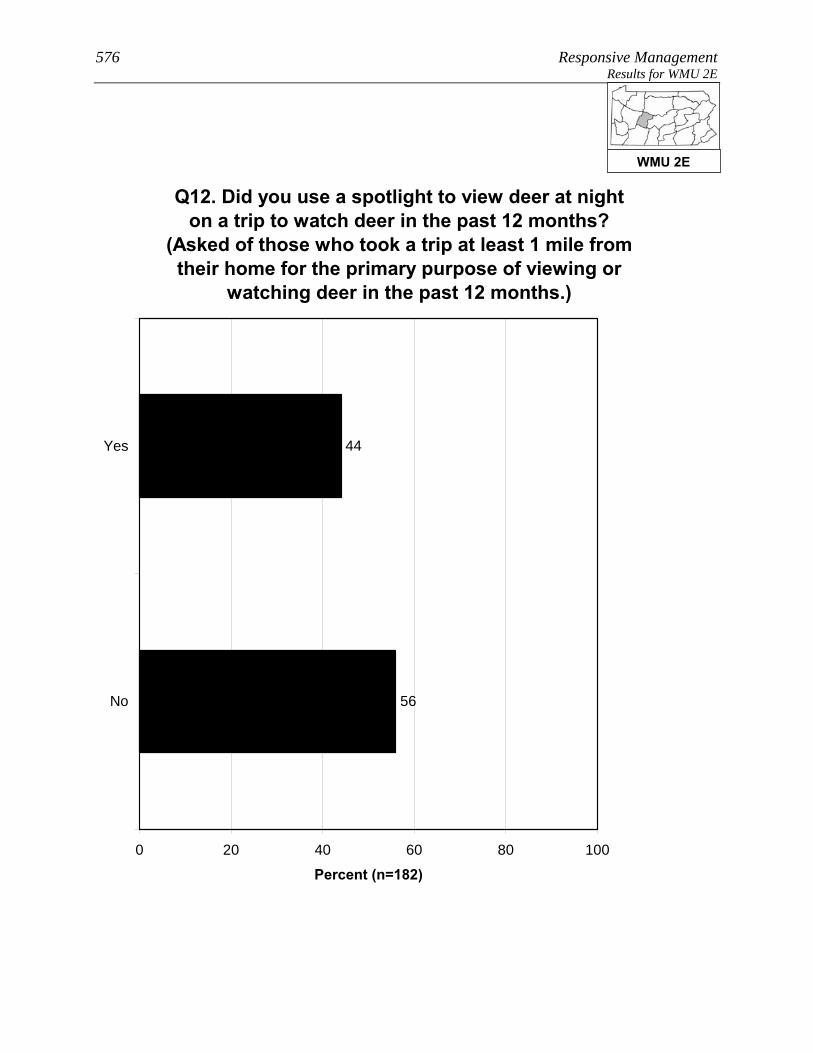
576 Responsive Management Results for WMU 2E
Q12. Did you use a spotlight to view deer at night on a trip to watch deer in the past 12 months?
(Asked of those who took a trip at least 1 mile from their home for the primary purpose of viewing or
watching deer in the past 12 months.)
44
56
0 20 40 60 80 100
Yes
No
Percent (n=182)
WMU 2E

Pennsylvania Residents’ Opinions on and Attitudes Toward Deer and Deer Management 577 Results for WMU 2E
Q13. How satisfied are you with opportunities to view or watch deer in Pennsylvania?
43
31
13
3
7
2
0 20 40 60 80 100
Very satisfied
Somewhatsatisfied
Neither satisfiednor dissatisfied
Somewhatdissatisfied
Very dissatisfied
Don't know
Percent (n=406)
WMU 2E

578 Responsive Management Results for WMU 2E
OPINIONS ON DEER IN GENERAL AND THE SIZE AND HEALTH OF THE DEER HERD
Opinion on deer is mostly favorable: 59% of residents of WMU 2E
say with no caveats that they like having deer around, another 21%
like having deer around but worry about the problems they may cause,
and only 5% generally regard them as a nuisance. The remainder have
no particular feeling about deer.
Another question asked residents of WMU 2E how deer-related issues compared to other
issues in their life, on a scale of 0 to 10, with the most importance being 10: the median
rating is “5.” The most common ratings are “0” (18%) and the midpoint of “5” (18%). In
general, ratings are well spread across the scale.
Two other ratings questions asked respondents to rate their concern about deer-related issues.
The median level of concern is “6” for the quality of deer habitat in Pennsylvania and “7” for
the health of the deer population in Pennsylvania. The ratings of the latter are mostly
concentrated in the upper end of the scale.
The survey asked about the perceived size of the deer herd in the respondent’s area. Just
under half of residents of WMU 2E say that the herd size is just right (48%); otherwise, many
more say that it is too low (31%) than too high (13%).
• Those who own their home are less likely, compared to those who do not own their
home, to say that the deer population in their area is just right; they are more likely to
say that the deer population is either too high or too low.
• Those who consider themselves to be a hunter are more likely to say that the deer
population in their area is too low, compared to those who are not hunters.
WMU 2E
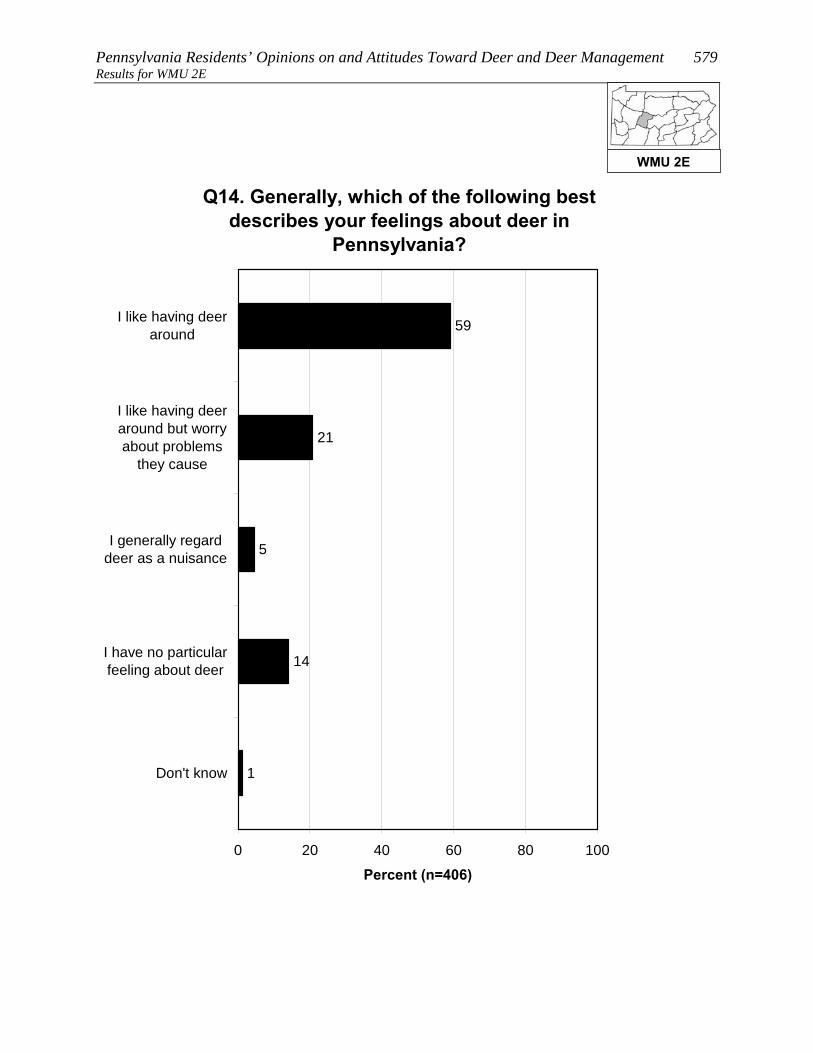
Pennsylvania Residents’ Opinions on and Attitudes Toward Deer and Deer Management 579 Results for WMU 2E
Q14. Generally, which of the following best describes your feelings about deer in
Pennsylvania?
59
21
5
14
1
0 20 40 60 80 100
I like having deeraround
I like having deeraround but worryabout problems
they cause
I generally regarddeer as a nuisance
I have no particularfeeling about deer
Don't know
Percent (n=406)
WMU 2E

580 Responsive Management Results for WMU 2E
Q15. Compared to other issues in your life, how important to you, personally, are deer-related
issues on a scale of 0 to 10 where 0 is not at all important and 10 is extremely important?
7
4
5
10
8
10
5
5
18
8
18
3
0 20 40 60 80 100
10
9
8
7
6
5
4
3
2
1
0
Don't know
Percent (n=406)
Mean = 4.67Median = 5
WMU 2E
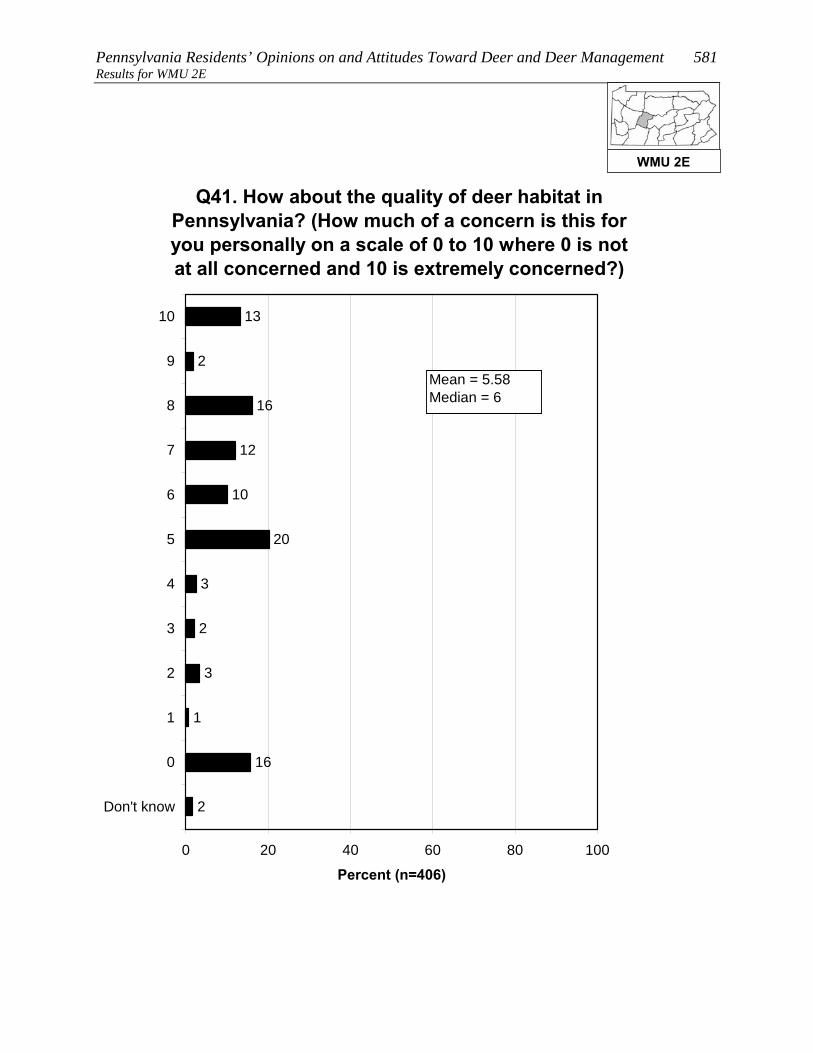
Pennsylvania Residents’ Opinions on and Attitudes Toward Deer and Deer Management 581 Results for WMU 2E
Q41. How about the quality of deer habitat in Pennsylvania? (How much of a concern is this for you personally on a scale of 0 to 10 where 0 is not at all concerned and 10 is extremely concerned?)
3
2
3
13
2
16
12
10
20
1
16
2
0 20 40 60 80 100
10
9
8
7
6
5
4
3
2
1
0
Don't know
Percent (n=406)
Mean = 5.58Median = 6
WMU 2E
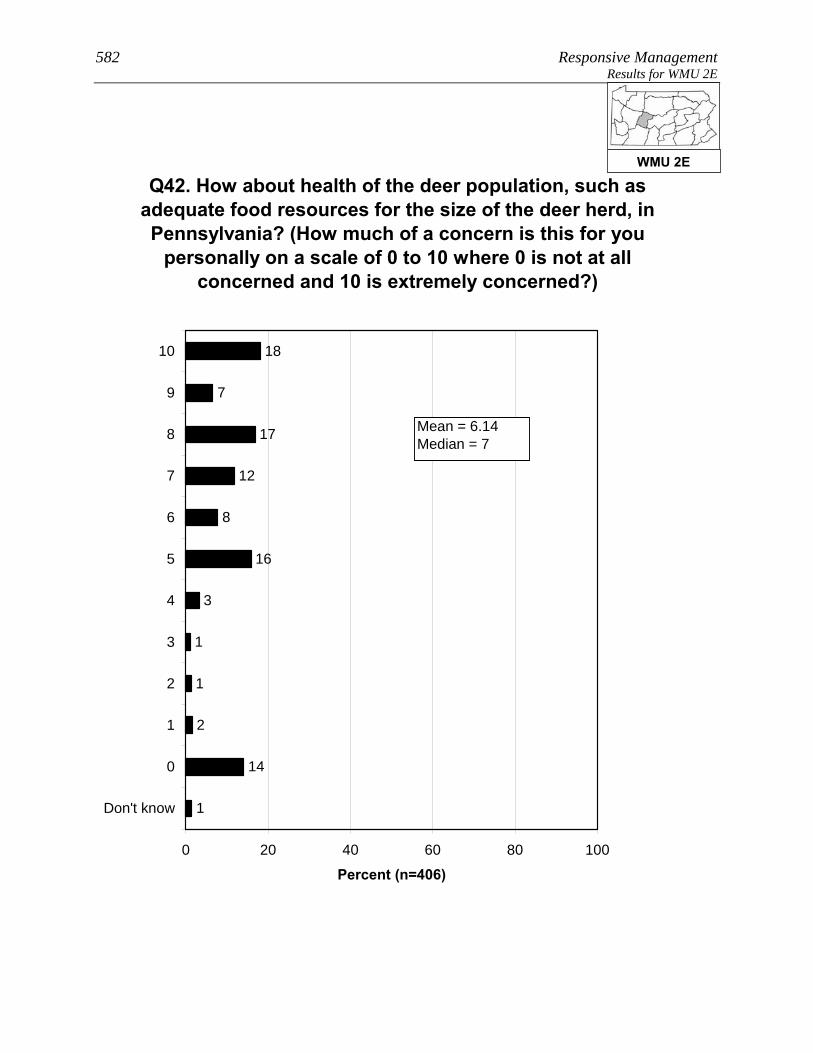
582 Responsive Management Results for WMU 2E
1
1
3
18
7
17
12
8
16
2
14
1
0 20 40 60 80 100
10
9
8
7
6
5
4
3
2
1
0
Don't know
Percent (n=406)
Q42. How about health of the deer population, such as adequate food resources for the size of the deer herd, in Pennsylvania? (How much of a concern is this for you
personally on a scale of 0 to 10 where 0 is not at all concerned and 10 is extremely concerned?)
Mean = 6.14Median = 7
WMU 2E

Pennsylvania Residents’ Opinions on and Attitudes Toward Deer and Deer Management 583 Results for WMU 2E
Q16. In your opinion, is the deer population in the area where you live too high, just right, or too low?
13
48
31
8
0 20 40 60 80 100
Too high
Just right
Too low
Don't know
Percent (n=406)
WMU 2E

584 Responsive Management Results for WMU 2E
Q16. In your opinion, is the deer population in the area where you live too high, just right, or too low?
14
44
35
6
19
66
8
7
0 20 40 60 80 100
Too high
Just right
Too low
Don't know
Percent
Owns home (n=343)Does not own home (n=33)
WMU 2E

Pennsylvania Residents’ Opinions on and Attitudes Toward Deer and Deer Management 585 Results for WMU 2E
Q16. In your opinion, is the deer population in the area where you live too high, just right, or too low?
4
55
36
5
10
18
55
16
0 20 40 60 80 100
Too high
Just right
Too low
Don't know
Percent
Consider themselves ahunter (n=184)Do not consider themselvesa hunter (n=220)
WMU 2E
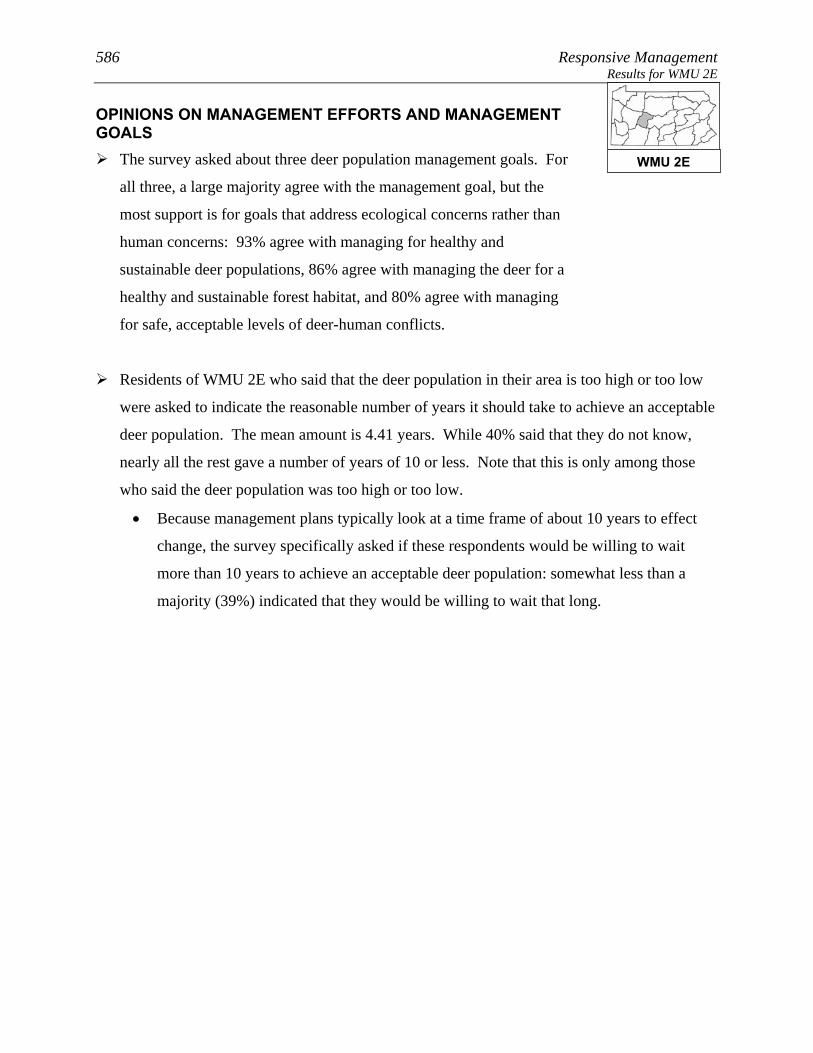
586 Responsive Management Results for WMU 2E
OPINIONS ON MANAGEMENT EFFORTS AND MANAGEMENT GOALS
The survey asked about three deer population management goals. For
all three, a large majority agree with the management goal, but the
most support is for goals that address ecological concerns rather than
human concerns: 93% agree with managing for healthy and
sustainable deer populations, 86% agree with managing the deer for a
healthy and sustainable forest habitat, and 80% agree with managing
for safe, acceptable levels of deer-human conflicts.
Residents of WMU 2E who said that the deer population in their area is too high or too low
were asked to indicate the reasonable number of years it should take to achieve an acceptable
deer population. The mean amount is 4.41 years. While 40% said that they do not know,
nearly all the rest gave a number of years of 10 or less. Note that this is only among those
who said the deer population was too high or too low.
• Because management plans typically look at a time frame of about 10 years to effect
change, the survey specifically asked if these respondents would be willing to wait
more than 10 years to achieve an acceptable deer population: somewhat less than a
majority (39%) indicated that they would be willing to wait that long.
WMU 2E

Pennsylvania Residents’ Opinions on and Attitudes Toward Deer and Deer Management 587 Results for WMU 2E
Q24-26. Deer populations should be managed for the following. (Do you agree or disagree with this
deer management goal?)
57
29
2
4
5
4
1
26
67
1
3
1
4
52
28
5
10
2
0 20 40 60 80 100
Stronglyagree
Moderatelyagree
Neither agreenor disagree
Moderatelydisagree
Stronglydisagree
Don't know
Percent (n=406)
Healthy and sustainableforest habitatHealthy and sustainabledeer populationsSafe and acceptable levelsof deer-human conflicts
WMU 2E
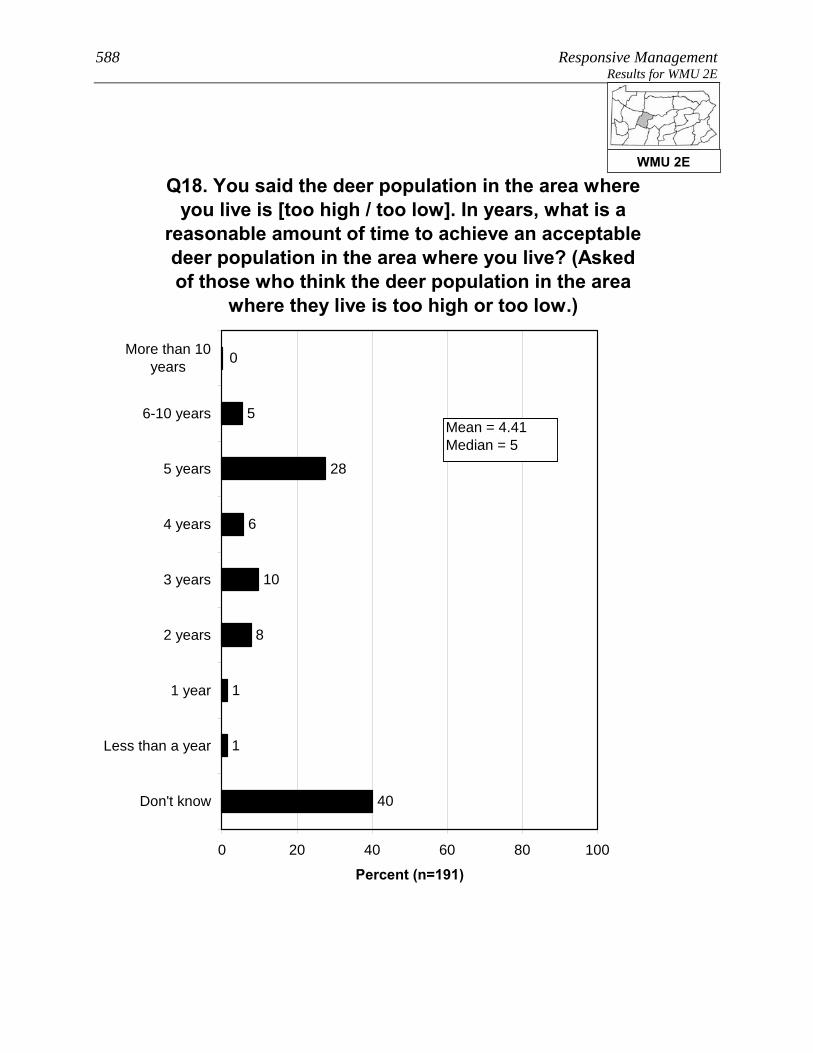
588 Responsive Management Results for WMU 2E
40
1
1
0
5
28
6
10
8
0 20 40 60 80 100
More than 10years
6-10 years
5 years
4 years
3 years
2 years
1 year
Less than a year
Don't know
Percent (n=191)
Q18. You said the deer population in the area where you live is [too high / too low]. In years, what is a
reasonable amount of time to achieve an acceptable deer population in the area where you live? (Asked of those who think the deer population in the area
where they live is too high or too low.)
Mean = 4.41Median = 5
WMU 2E
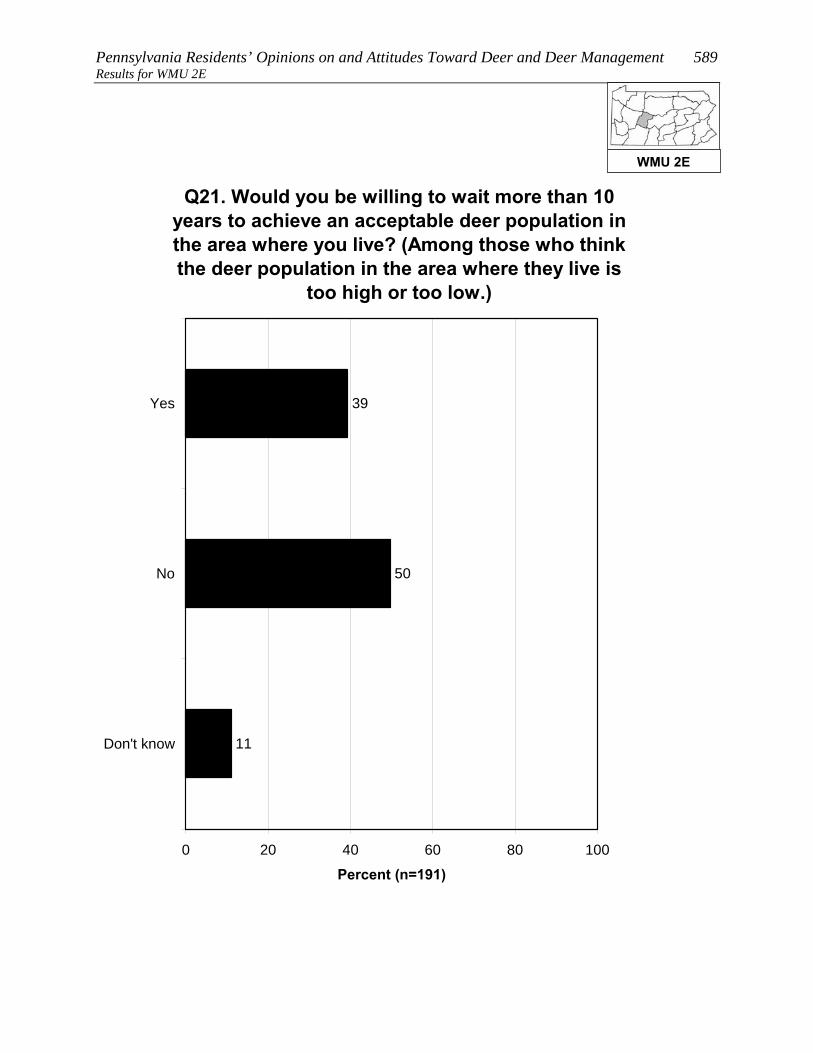
Pennsylvania Residents’ Opinions on and Attitudes Toward Deer and Deer Management 589 Results for WMU 2E
Q21. Would you be willing to wait more than 10 years to achieve an acceptable deer population in the area where you live? (Among those who think the deer population in the area where they live is
too high or too low.)
39
50
11
0 20 40 60 80 100
Yes
No
Don't know
Percent (n=191)
WMU 2E

590 Responsive Management Results for WMU 2E
OPINIONS ON METHODS FOR MANAGING DEER, INCLUDING HUNTING
A large majority of residents of WMU 2E (71%) support lethal
methods to manage deer populations in Pennsylvania; nonetheless,
20% oppose, mostly strong opposition.
• Those residents of WMU 2E who live in a single-family home and own their home are
less likely to support lethal methods, compared to those who live in a single-family
home but do not own their home.
• The survey asked about four methods of controlling deer populations (three of them
lethal). The most support is for legal, regulated hunting (93% of respondents support
this method), distantly followed by professionals or sharpshooters (31%), fertility/birth
control (30%), and trapping and killing (26%).
Two questions asked respondents about hunting on their land (among those who live in a
single-family home), the first question about hunting by the respondents themselves (18% do
so) and the second regarding allowing others to hunt on their land (33% do so). In
combining the results, 34% of residents of WMU 2E who live in a single-family home either
hunt on their own land or allow others to do so (it is not simply a sum of the two questions
because some hunt on their property and allow others to do so as well).
• There was interest in seeing how a particular subgroup responded on this question, the
subgroup being those who live in a single-family home; who live on 1 acre or less; and
who live in an urban, suburban area, or a small city/town. Among this subgroup, 2%
either hunt on their own property or allow others to hunt on the property.
• Those respondents who do not allow hunting on their property were asked to indicate
why they prohibit it. The most common reasons are that their property is too small
and/or that they live in an urban or suburban area in which hunting is not possible or
feasible. Other minor reasons are concerns about safety, liability concerns, and a
general opposition to hunting.
• Those same respondents who do not allow hunting on their property were asked about
their likelihood of ever allowing others to hunt deer on their property; they
overwhelmingly say this is very unlikely (96%). They were then asked if there is
WMU 2E

Pennsylvania Residents’ Opinions on and Attitudes Toward Deer and Deer Management 591 Results for WMU 2E
anything that would make them more likely to allow deer hunting;
an overwhelming majority (96%) say that there is nothing
that would make them more likely to allow deer hunting.
• The question about allowing others to hunt on their property was examined among the
subgroup previously discussed (those who live in a single-family home; who live on 1
acre or less; and who live in an urban, suburban area, or a small city/town). Among
this group who got the question, nearly all say that they would never allow hunting.
o Additional follow-up questions to be asked of those who indicated that something
might prompt them to allow hunting on their property did not have enough
respondents for statistical validity; therefore, they are not shown.
WMU 2E

592 Responsive Management Results for WMU 2E
Q27. In general, do you support or oppose lethal methods to manage deer populations in
Pennsylvania?
54
17
7
6
14
2
0 20 40 60 80 100
Strongly support
Moderatelysupport
Neither supportnor oppose
Moderately oppose
Strongly oppose
Don't know
Percent (n=406)
WMU 2E

Pennsylvania Residents’ Opinions on and Attitudes Toward Deer and Deer Management 593 Results for WMU 2E
Q27. In general, do you support or oppose lethal methods to manage deer populations in
Pennsylvania?
57
16
7
6
13
1
3
24
57
3
12
1
0 20 40 60 80 100
Stronglysupport
Moderatelysupport
Neither supportnor oppose
Moderatelyoppose
Stronglyoppose
Don't know
Percent
Owns home (n=343)Does not own home (n=33)
WMU 2E

594 Responsive Management Results for WMU 2E
Q30-Q33. Percent who strongly support each of the following methods of controlling deer populations
in Pennsylvania:
16
18
19
81
0 20 40 60 80 100
Q30. Legal,regulated hunting
Q33. Fertility or birthcontrol
Q31. Professionalsor sharpshooters
Q32. Trapping andkilling
Percent
WMU 2E

Pennsylvania Residents’ Opinions on and Attitudes Toward Deer and Deer Management 595 Results for WMU 2E
Q30-Q33. Percent who strongly or moderately support each of the following methods of
controlling deer populations in Pennsylvania:
26
30
31
93
0 20 40 60 80 100
Q30. Legal,regulated hunting
Q31. Professionalsor sharpshooters
Q33. Fertility or birthcontrol
Q32. Trapping andkilling
Percent
WMU 2E

596 Responsive Management Results for WMU 2E
Q30-Q33. Percent who strongly or moderately oppose each of the following methods of
controlling deer populations in Pennsylvania:
6
58
65
71
0 20 40 60 80 100
Q32. Trapping andkilling
Q31. Professionalsor sharpshooters
Q33. Fertility or birthcontrol
Q30. Legal,regulated hunting
Percent
WMU 2E

Pennsylvania Residents’ Opinions on and Attitudes Toward Deer and Deer Management 597 Results for WMU 2E
Q30-Q33. Percent who strongly oppose each of the following methods of controlling deer populations
in Pennsylvania:
5
47
57
64
0 20 40 60 80 100
Q32. Trapping andkilling
Q31. Professionalsor sharpshooters
Q33. Fertility or birthcontrol
Q30. Legal,regulated hunting
Percent
WMU 2E

598 Responsive Management Results for WMU 2E
Q59/60. Deer hunts and/or allows others to deer hunt on property. (Among respondents living in a
single-family home.)
34
66
0 20 40 60 80 100
Yes
No
Percent (n=376)
WMU 2E
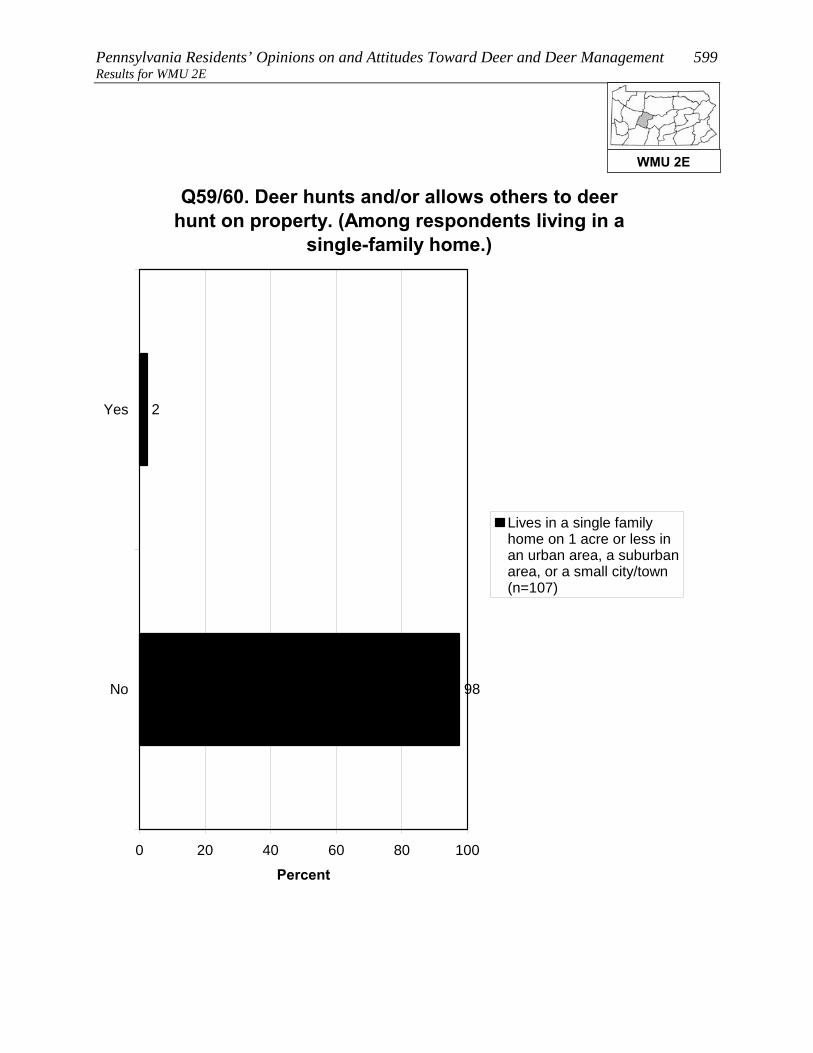
Pennsylvania Residents’ Opinions on and Attitudes Toward Deer and Deer Management 599 Results for WMU 2E
Q59/60. Deer hunts and/or allows others to deer hunt on property. (Among respondents living in a
single-family home.)
2
98
0 20 40 60 80 100
Yes
No
Percent
Lives in a single familyhome on 1 acre or less inan urban area, a suburbanarea, or a small city/town(n=107)
WMU 2E

600 Responsive Management Results for WMU 2E
Q63. What are the main reasons you do not allow others to hunt deer on your property? (Asked of
those whose primary place of residence is a single-family home and who do not allow others to hunt
deer on their property.)
1
1
58
47
9
6
6
2
0 20 40 60 80 100
Property is too small / neighbors too close
Live in residential neighborhood /suburban or urban area
Concerned about safety
Liability
Oppose hunting in general
No one has asked for hunting access
Not interested in allowing hunting onproperty, but did not indicate opposition to
hunting in general
Concerned about bad behavior by hunters
Mul
tiple
Res
pons
es A
llow
ed
Percent (n=235)
WMU 2E
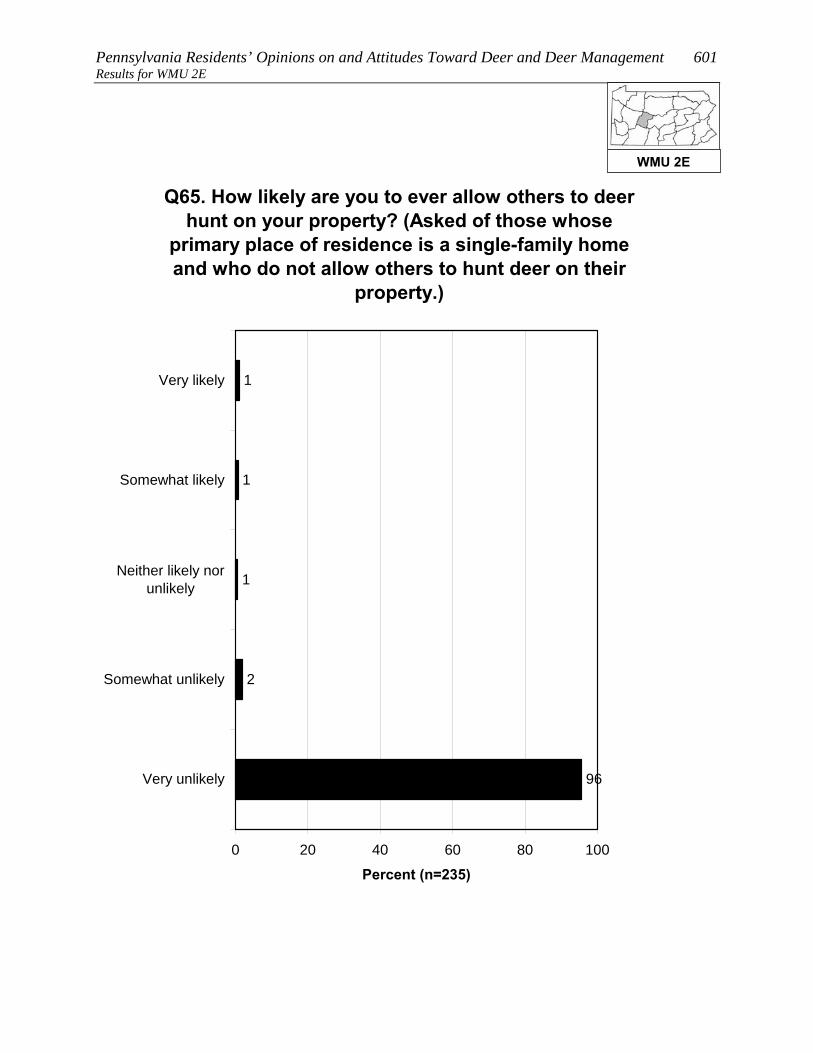
Pennsylvania Residents’ Opinions on and Attitudes Toward Deer and Deer Management 601 Results for WMU 2E
Q65. How likely are you to ever allow others to deer hunt on your property? (Asked of those whose
primary place of residence is a single-family home and who do not allow others to hunt deer on their
property.)
1
1
1
2
96
0 20 40 60 80 100
Very likely
Somewhat likely
Neither likely norunlikely
Somewhat unlikely
Very unlikely
Percent (n=235)
WMU 2E
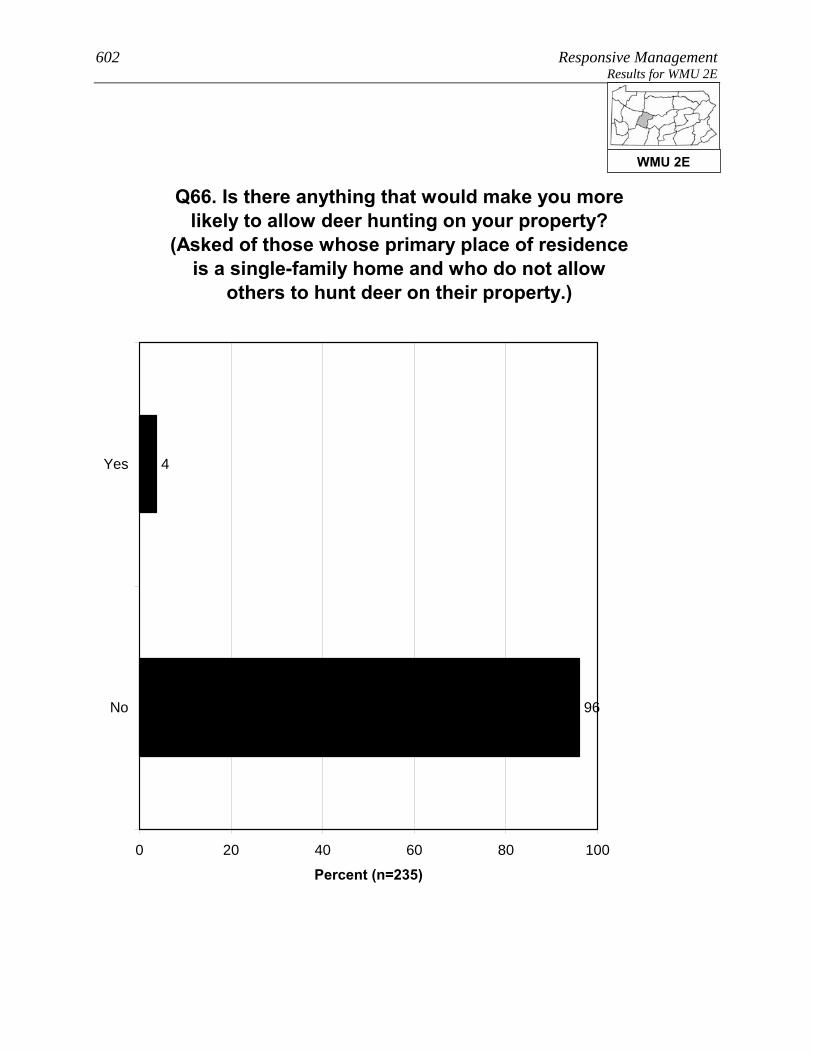
602 Responsive Management Results for WMU 2E
Q66. Is there anything that would make you more likely to allow deer hunting on your property?
(Asked of those whose primary place of residence is a single-family home and who do not allow
others to hunt deer on their property.)
4
96
0 20 40 60 80 100
Yes
No
Percent (n=235)
WMU 2E
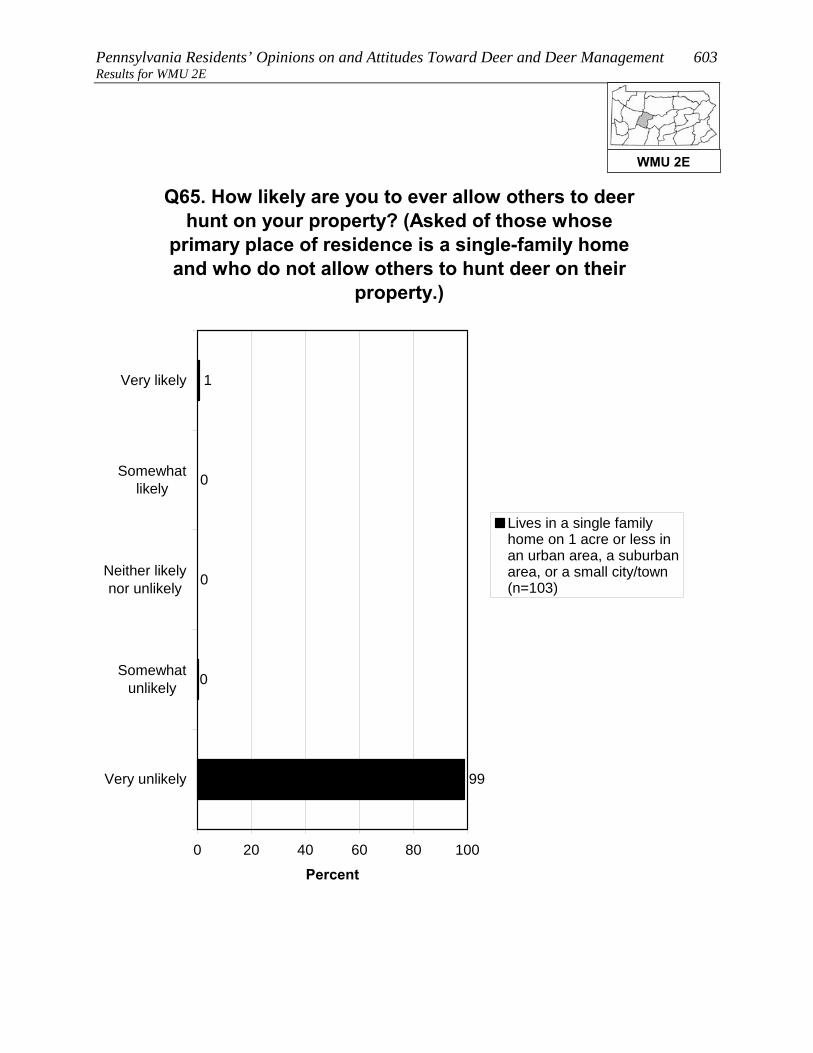
Pennsylvania Residents’ Opinions on and Attitudes Toward Deer and Deer Management 603 Results for WMU 2E
Q65. How likely are you to ever allow others to deer hunt on your property? (Asked of those whose
primary place of residence is a single-family home and who do not allow others to hunt deer on their
property.)
99
0
0
0
1
0 20 40 60 80 100
Very likely
Somewhatlikely
Neither likelynor unlikely
Somewhatunlikely
Very unlikely
Percent
Lives in a single familyhome on 1 acre or less inan urban area, a suburbanarea, or a small city/town(n=103)
WMU 2E

604 Responsive Management Results for WMU 2E
CONCERNS ABOUT DEER AND DEER NUISANCE PROBLEMS Seven questions asked about respondents’ level of concern about
issues associated with deer. For each issue, respondents rated their
level of concern about it using a 10-point scale, with 10 being the most
concerned.
• The most concern was for tick-borne diseases (mean rating of 7.6), followed by three
whose means are fairly close to one another: deer-vehicle accidents (6.2), the health of
the deer population (6.1), and the quality of deer habitat (5.6).
• At the bottom are concern about deer impacts on habitat and other wildlife (even
though this can be considerable) (3.2) and the two impacts to residents’ landscaping:
deer damage to plants and landscaping (2.0) and deer droppings in the yard (1.3).
o Another graph shows the percentage who gave a high rating (a “9” or “10”),
providing an idea of the percentage who feel strongly about the issues.
Among residents of WMU 2E, 75% indicated that they saw deer on their property in the past
12 months.
• Respondents who fed birds were about the same regarding seeing deer, compared to
those who did not feed birds. However, those who fed deer or put out attractants or
were aware of neighbors who fed deer or put out attractants were more likely to see
deer, compared to their counterparts.
The survey asked about specific nuisance problems with deer that residents of WMU 2E may
have experienced: 11% indicated that they experienced problems with deer at their primary
place of residence in the past 12 months; 23% indicated that they or another household
member had been in a vehicle collision with a deer (fortunately, a very low portion of
drivers/passengers were injured); and 9% indicated that they or a household member had
been diagnosed with a tick-borne disease.
• Crosstabulations show that those who fed birds were slightly less likely to have
experienced deer problems, compared to those who had not fed birds. On the other
hand, those who were aware of neighbors feeding deer or putting out attractants were
more likely to experience deer problems than were those not aware.
WMU 2E

Pennsylvania Residents’ Opinions on and Attitudes Toward Deer and Deer Management 605 Results for WMU 2E
Q36-Q42. Mean rating of respondents' concern about each of the following on a 10-point scale:
2.0
3.2
5.6
6.1
6.2
7.6
1.3
0 2 4 6 8 10
Q36. Tick-borne diseases, such as Lymedisease, in Pennsylvania
Q40. Deer-vehicle accidents inPennsylvania
Q42. The health of the deer population,such as adequate food resources for the
size of the deer herd, in Pennsylvania
Q41. The quality of deer habitat inPennsylvania
Q39. Deer impacts on the habitat andother wildlife in Pennsylvania
Q38. Deer damage to plants andlandscaping in his/her yard
Q37. Deer droppings in his/her yard
Mean
WMU 2E
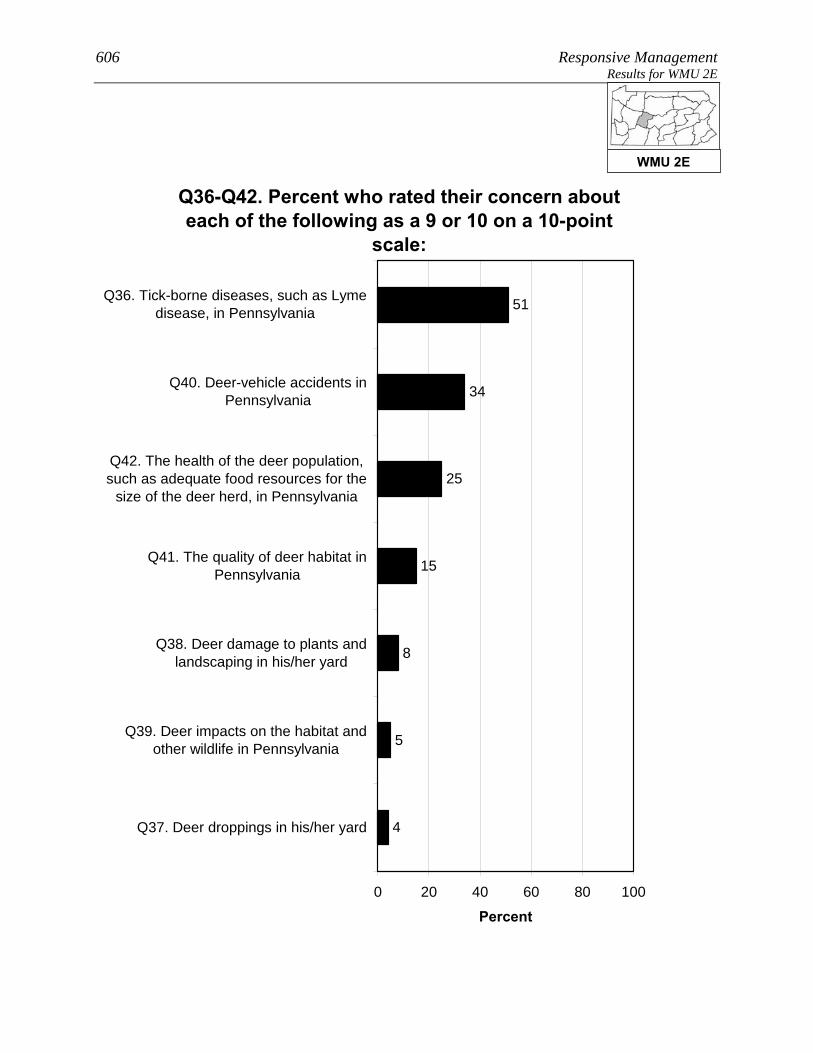
606 Responsive Management Results for WMU 2E
Q36-Q42. Percent who rated their concern about each of the following as a 9 or 10 on a 10-point
scale:
5
8
15
25
34
51
4
0 20 40 60 80 100
Q36. Tick-borne diseases, such as Lymedisease, in Pennsylvania
Q40. Deer-vehicle accidents inPennsylvania
Q42. The health of the deer population,such as adequate food resources for the
size of the deer herd, in Pennsylvania
Q41. The quality of deer habitat inPennsylvania
Q38. Deer damage to plants andlandscaping in his/her yard
Q39. Deer impacts on the habitat andother wildlife in Pennsylvania
Q37. Deer droppings in his/her yard
Percent
WMU 2E

Pennsylvania Residents’ Opinions on and Attitudes Toward Deer and Deer Management 607 Results for WMU 2E
Q49. How often have you seen deer on your property in the past 12 months?
34
19
22
25
0 20 40 60 80 100
Frequently
Sometimes
Rarely
Never
Percent (n=406)
WMU 2E

608 Responsive Management Results for WMU 2E
Q49. How often have you seen deer on your property in the past 12 months?
32
19
22
27
22
18
37
24
0 20 40 60 80 100
Frequently
Sometimes
Rarely
Never
Percent
Fed birds on his / herproperty in the past 12months (n=206)Did not feed birds on his /her property in the past 12months (n=199)
WMU 2E
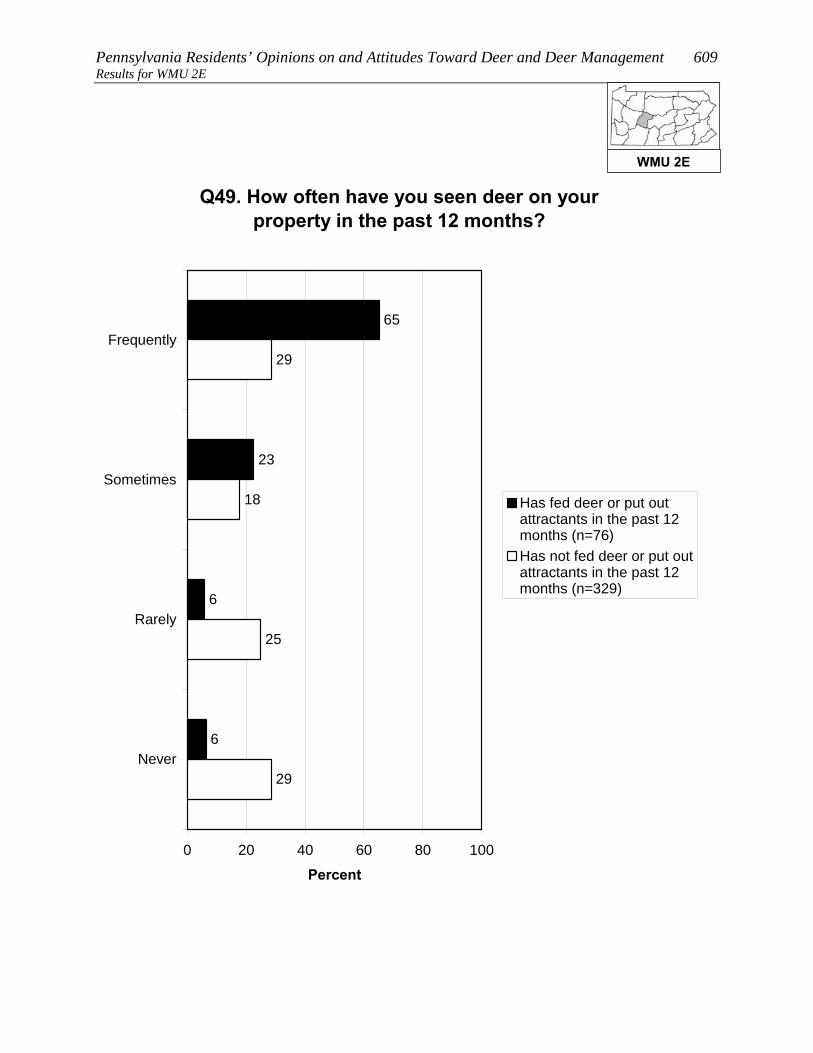
Pennsylvania Residents’ Opinions on and Attitudes Toward Deer and Deer Management 609 Results for WMU 2E
Q49. How often have you seen deer on your property in the past 12 months?
65
23
6
6
25
18
29
29
0 20 40 60 80 100
Frequently
Sometimes
Rarely
Never
Percent
Has fed deer or put outattractants in the past 12months (n=76)Has not fed deer or put outattractants in the past 12months (n=329)
WMU 2E

610 Responsive Management Results for WMU 2E
Q49. How often have you seen deer on your property in the past 12 months?
60
25
11
3
24
17
29
29
0 20 40 60 80 100
Frequently
Sometimes
Rarely
Never
Percent
Is aware of neighborsfeeding deer or putting outattractants (n=63)Is not aware of neighborsfeeding deer or putting outattractants (n=334)
WMU 2E

Pennsylvania Residents’ Opinions on and Attitudes Toward Deer and Deer Management 611 Results for WMU 2E
Q43. In the past 12 months, have you experienced any problems with deer at your primary place of
residence?
11
89
0 20 40 60 80 100
Yes
No
Percent (n=406)
WMU 2E

612 Responsive Management Results for WMU 2E
Q43. In the past 12 months, have you experienced any problems with deer at your primary place of
residence?
7
93
86
14
0 20 40 60 80 100
Yes
No
Percent
Fed birds on his / herproperty in the past 12months (n=206)Did not feed birds on his /her property in the past 12months (n=199)
WMU 2E

Pennsylvania Residents’ Opinions on and Attitudes Toward Deer and Deer Management 613 Results for WMU 2E
Q43. In the past 12 months, have you experienced any problems with deer at your primary place of
residence?
15
85
90
10
0 20 40 60 80 100
Yes
No
Percent
Is aware of neighborsfeeding deer or putting outattractants (n=63)Is not aware of neighborsfeeding deer or putting outattractants (n=334)
WMU 2E

614 Responsive Management Results for WMU 2E
Q44. In the past 12 months, have you or any other person living in your immediate household been in a vehicle collision with or an accident involving a
deer on Pennsylvania's roads or highways?
23
77
0 20 40 60 80 100
Yes
No
Percent (n=406)
WMU 2E

Pennsylvania Residents’ Opinions on and Attitudes Toward Deer and Deer Management 615 Results for WMU 2E
Q45. Were you or anyone else injured? (Asked of those who had a household member who was in or
who have personally been in a vehicle collision with or an accident involving a deer on
Pennsylvania's roads or highways in the past 12 months.)
4
96
0 20 40 60 80 100
Yes
No
Percent (n=98)
WMU 2E

616 Responsive Management Results for WMU 2E
Q46. In the past 12 months, have you or any other person living in your immediate household been
diagnosed by a physician with a tick-borne disease, such as Lyme disease?
9
91
0 20 40 60 80 100
Yes
No
Percent (n=406)
WMU 2E

Pennsylvania Residents’ Opinions on and Attitudes Toward Deer and Deer Management 617 Results for WMU 2E FEEDING WILDLIFE AND HUNTING DEER
Several questions asked about feeding wildlife.
• Feeding deer or putting out deer attractants: 15% of residents of
WMU 2E did this, and 15% are aware of neighbors who did this.
o The most typical feeds or attractants put out by respondents are corn, salt/mineral
blocks, and apples.
• Feeding birds: 51% of residents of WMU 2E did this.
There is no consensus on whether it is okay for private citizens to feed or attract deer in
Pennsylvania: 54% agree that this is okay, but 36% disagree (the rest are neutral).
More than a third of residents of WMU 2E (39%) consider themselves to be a hunter, most of
whom have a Pennsylvania hunting license.
• Among residents of WMU 2E who live in a single-family home, 18% personally hunt
deer on their property.
• A large majority of residents of WMU 2E (91%) say that they, family members, and/or
friends hunt.
WMU 2E
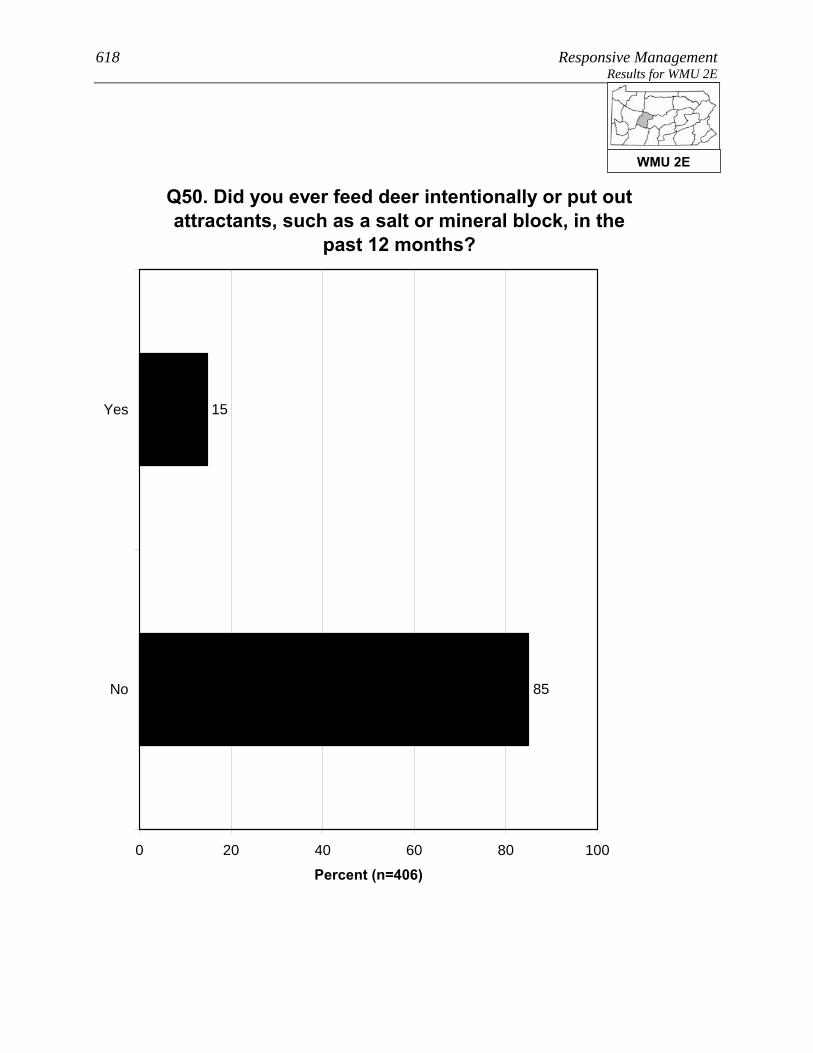
618 Responsive Management Results for WMU 2E
Q50. Did you ever feed deer intentionally or put out attractants, such as a salt or mineral block, in the
past 12 months?
15
85
0 20 40 60 80 100
Yes
No
Percent (n=406)
WMU 2E

Pennsylvania Residents’ Opinions on and Attitudes Toward Deer and Deer Management 619 Results for WMU 2E
Q55. Are you aware of any of your neighbors feeding deer intentionally or trying to attract deer
on their property in the past 12 months?
15
83
2
0 20 40 60 80 100
Yes
No
Don't know
Percent (n=406)
WMU 2E
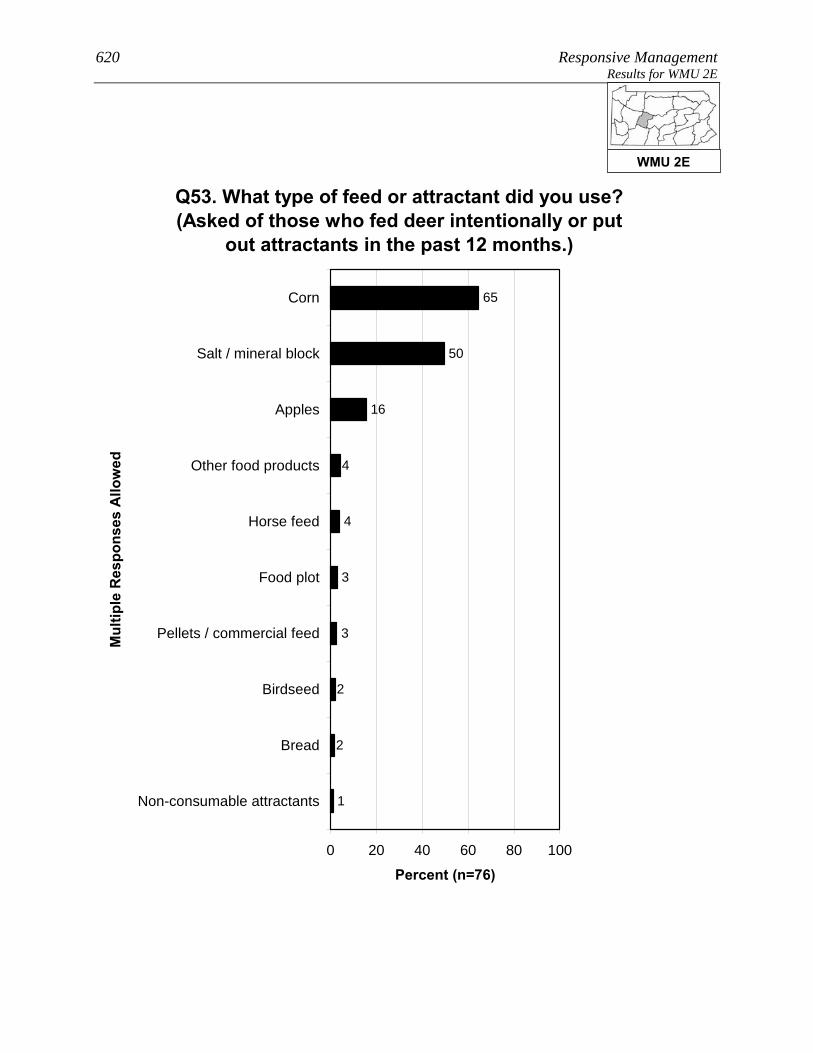
620 Responsive Management Results for WMU 2E
Q53. What type of feed or attractant did you use? (Asked of those who fed deer intentionally or put
out attractants in the past 12 months.)
2
2
3
65
50
16
4
4
3
1
0 20 40 60 80 100
Corn
Salt / mineral block
Apples
Other food products
Horse feed
Food plot
Pellets / commercial feed
Birdseed
Bread
Non-consumable attractants
Mul
tiple
Res
pons
es A
llow
ed
Percent (n=76)
WMU 2E

Pennsylvania Residents’ Opinions on and Attitudes Toward Deer and Deer Management 621 Results for WMU 2E
Q48. Did you feed birds or make birdfeed available on your property in the past 12 months?
51
48
Less than 1%
0 20 40 60 80 100
Yes
No
Don't know
Percent (n=406)
WMU 2E
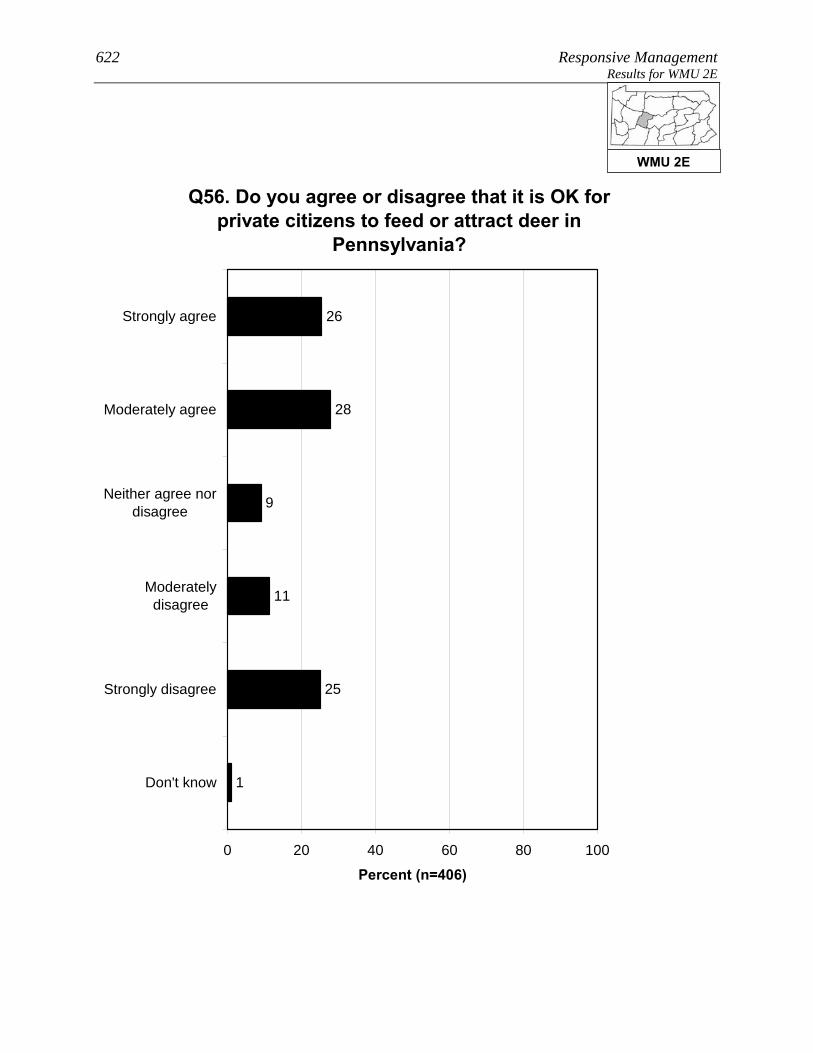
622 Responsive Management Results for WMU 2E
Q56. Do you agree or disagree that it is OK for private citizens to feed or attract deer in
Pennsylvania?
26
28
9
11
25
1
0 20 40 60 80 100
Strongly agree
Moderately agree
Neither agree nordisagree
Moderatelydisagree
Strongly disagree
Don't know
Percent (n=406)
WMU 2E

Pennsylvania Residents’ Opinions on and Attitudes Toward Deer and Deer Management 623 Results for WMU 2E
Q59. Do you personally hunt deer on your property? (Asked of those whose primary place of
residence is a single-family home.)
18
82
0 20 40 60 80 100
Yes
No
Percent (n=376)
WMU 2E
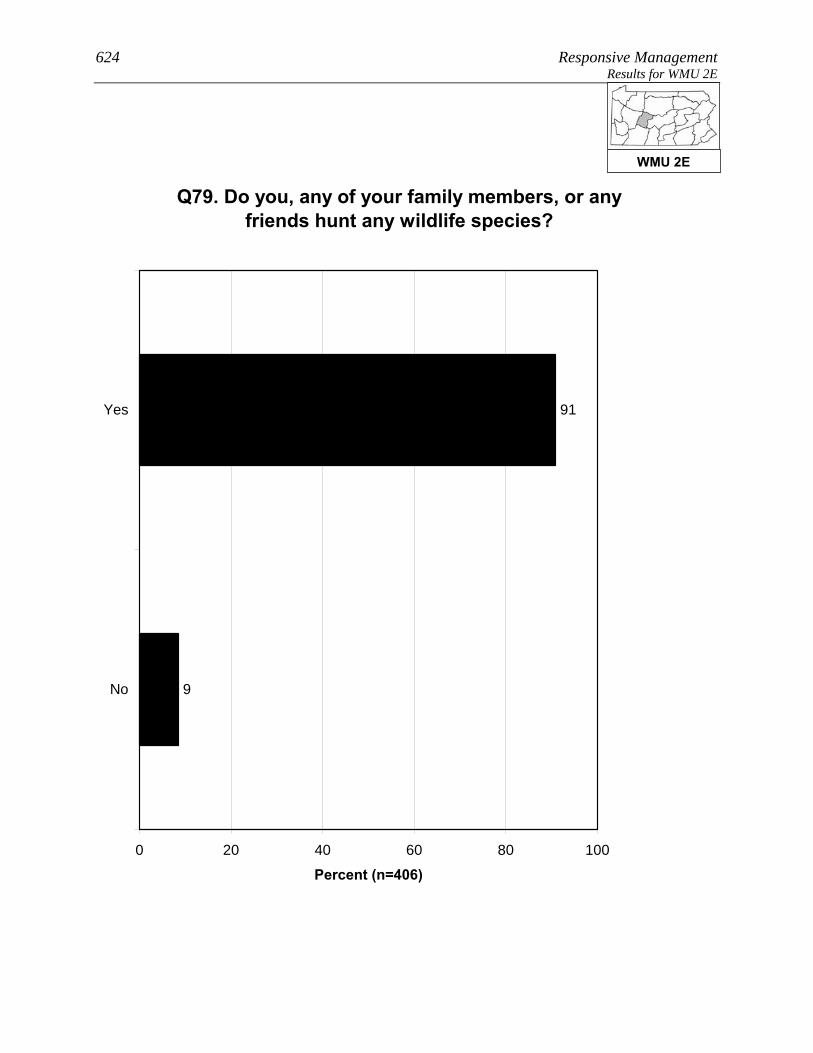
624 Responsive Management Results for WMU 2E
Q79. Do you, any of your family members, or any friends hunt any wildlife species?
91
9
0 20 40 60 80 100
Yes
No
Percent (n=406)
WMU 2E
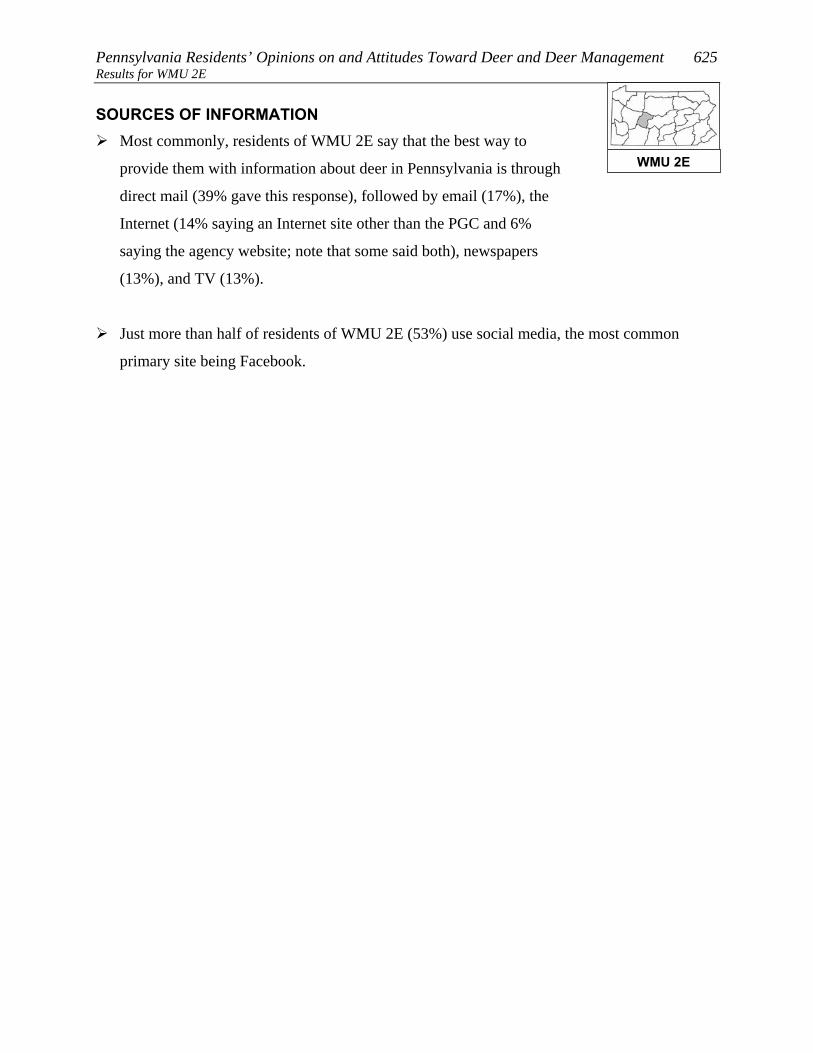
Pennsylvania Residents’ Opinions on and Attitudes Toward Deer and Deer Management 625 Results for WMU 2E SOURCES OF INFORMATION
Most commonly, residents of WMU 2E say that the best way to
provide them with information about deer in Pennsylvania is through
direct mail (39% gave this response), followed by email (17%), the
Internet (14% saying an Internet site other than the PGC and 6%
saying the agency website; note that some said both), newspapers
(13%), and TV (13%).
Just more than half of residents of WMU 2E (53%) use social media, the most common
primary site being Facebook.
WMU 2E
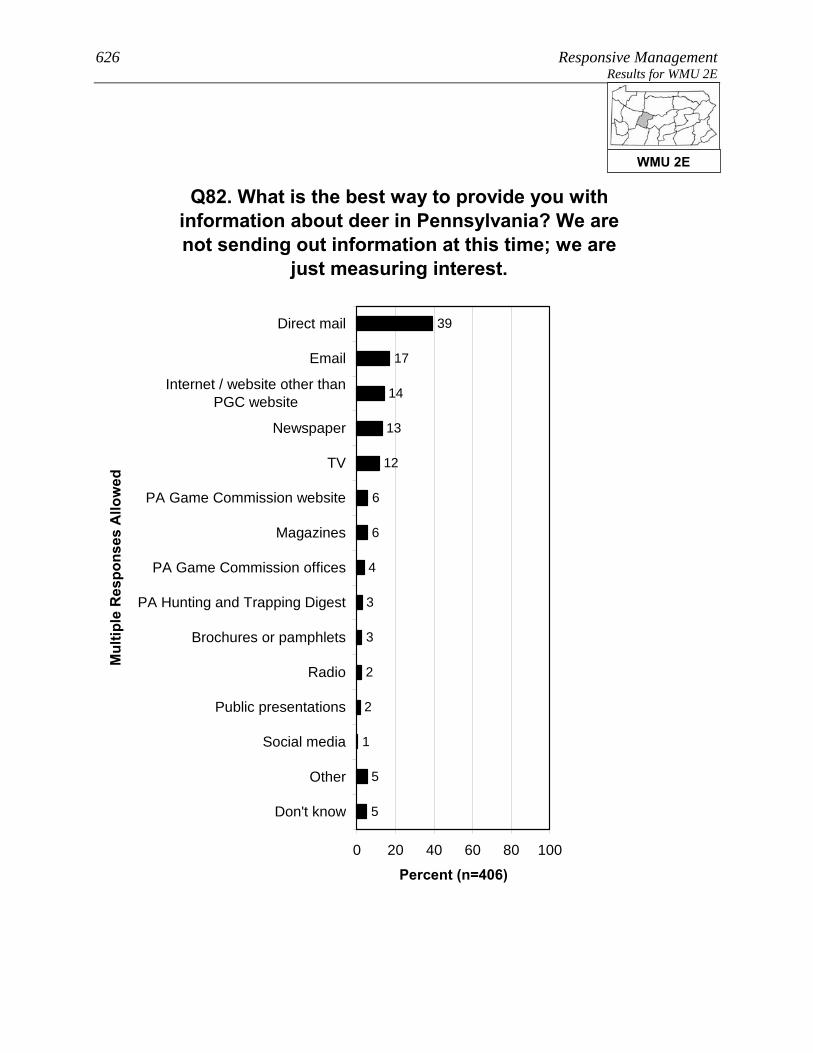
626 Responsive Management Results for WMU 2E
Q82. What is the best way to provide you with information about deer in Pennsylvania? We are not sending out information at this time; we are
just measuring interest.
3
4
6
39
17
14
13
12
6
3
2
2
1
5
5
0 20 40 60 80 100
Direct mail
Internet / website other thanPGC website
Newspaper
TV
PA Game Commission website
Magazines
PA Game Commission offices
PA Hunting and Trapping Digest
Brochures or pamphlets
Radio
Public presentations
Social media
Other
Don't know
Mul
tiple
Res
pons
es A
llow
ed
Percent (n=406)
WMU 2E
Pennsylvania Residents’ Opinions on and Attitudes Toward Deer and Deer Management 627 Results for WMU 2E
Q84. Do you use social media, such as Facebook, Twitter, or YouTube?
53
47
0 20 40 60 80 100
Yes
No
Percent (n=406)
WMU 2E

628 Responsive Management Results for WMU 2E
Q85. Which social media site do you use most often? (Asked of those who use social media.)
93
3
3
0 20 40 60 80 100
YouTube
Percent (n=191)
WMU 2E

Pennsylvania Residents’ Opinions on and Attitudes Toward Deer and Deer Management 629 Results for WMU 2F
RESULTS FOR WMU 2F Location: From the New York/PA state line, US Rt. 219 south to I-80 near DuBois; I-80 west to US Rt. 322 near Corsica; US Rt. 322 west to PA Rt. 8 at Franklin; PA Rt. 8 north to PA Rt. 27 at Titusville; PA Rt. 27 north to US Rt. 6 at Pittsfield; US Rt. 6 east to US Rt. 62 near Warren; US Rt. 62 north to the New York/PA state line.
8. Lives in WMU 2F 3. Indicates that he/she or a family member hunts (p < 0.001). 3. Has taken a trip more than a mile from home for the primary purpose of viewing or watching deer in the past 12 months (p < 0.001). 3. Has spent time viewing or watching deer around home in the past 12 months (p < 0.001). 3. Has a valid 2011 PA general hunting license (p < 0.01). 3. Considers himself/herself to be a hunter (p < 0.01). 4. Strongly or moderately supports legal, regulated hunting as a method of controlling deer populations in PA (p < 0.001). 4. Does not strongly or moderately support professionals or sharpshooters as a method of controlling deer populations in PA (p < 0.001). 4. Does not strongly or moderately support fertility or birth control as a method of controlling deer populations in PA (p < 0.001). 4. Strongly or moderately agrees that deer populations should be managed for healthy and sustainable deer populations (p < 0.05). 5. Indicates that he/she or another person living in the immediate household has been in a vehicle collision with or an accident involving a deer on PA's roads or highways in the past 12 months (p < 0.001). 6. Does not rate concern about the quality of deer habitat in PA as a 9 or 10 (p < 0.05). 7. Uses Facebook (p < 0.05). 8. Does not consider place of residence to be an urban or suburban area (p < 0.001). 8. Primary place of residence is not a single-family home (p < 0.01). See page 9 through 11 for explanation of how to interpret z-score tables.

630 Responsive Management Results for WMU 2F
PARTICIPATION IN VIEWING DEER A large majority of residents of WMU 2F (71%) spent time viewing
deer around their home in the past 12 months, and 37% took a trip of
at least a mile to view deer.
• Just under half of those who took a deer-viewing trip (44%) used a spotlight to view the
deer at night.
A majority of residents of WMU 2F (69%) are satisfied with opportunities to view deer in
Pennsylvania. Because a relatively large percentage answer neutrally, only 20% indicate
being dissatisfied.
WMU 2F
Pennsylvania Residents’ Opinions on and Attitudes Toward Deer and Deer Management 631 Results for WMU 2F
Q10. Have you spent time viewing or watching deer around your home in the past 12 months?
71
29
0 20 40 60 80 100
Yes
No
Percent (n=405)
WMU 2F

632 Responsive Management Results for WMU 2F
Q11. Have you taken a trip at least 1 mile from your home for the primary purpose of viewing or
watching deer in the past 12 months?
37
63
0 20 40 60 80 100
Yes
No
Percent (n=405)
WMU 2F
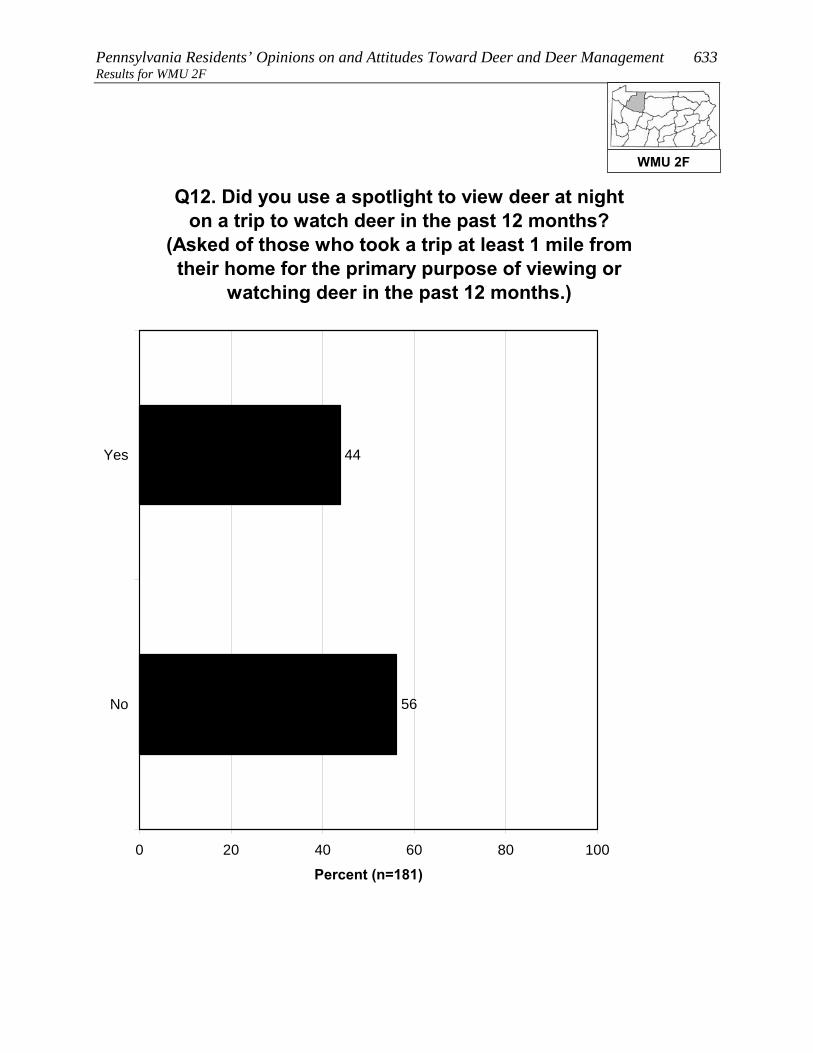
Pennsylvania Residents’ Opinions on and Attitudes Toward Deer and Deer Management 633 Results for WMU 2F
Q12. Did you use a spotlight to view deer at night on a trip to watch deer in the past 12 months?
(Asked of those who took a trip at least 1 mile from their home for the primary purpose of viewing or
watching deer in the past 12 months.)
44
56
0 20 40 60 80 100
Yes
No
Percent (n=181)
WMU 2F
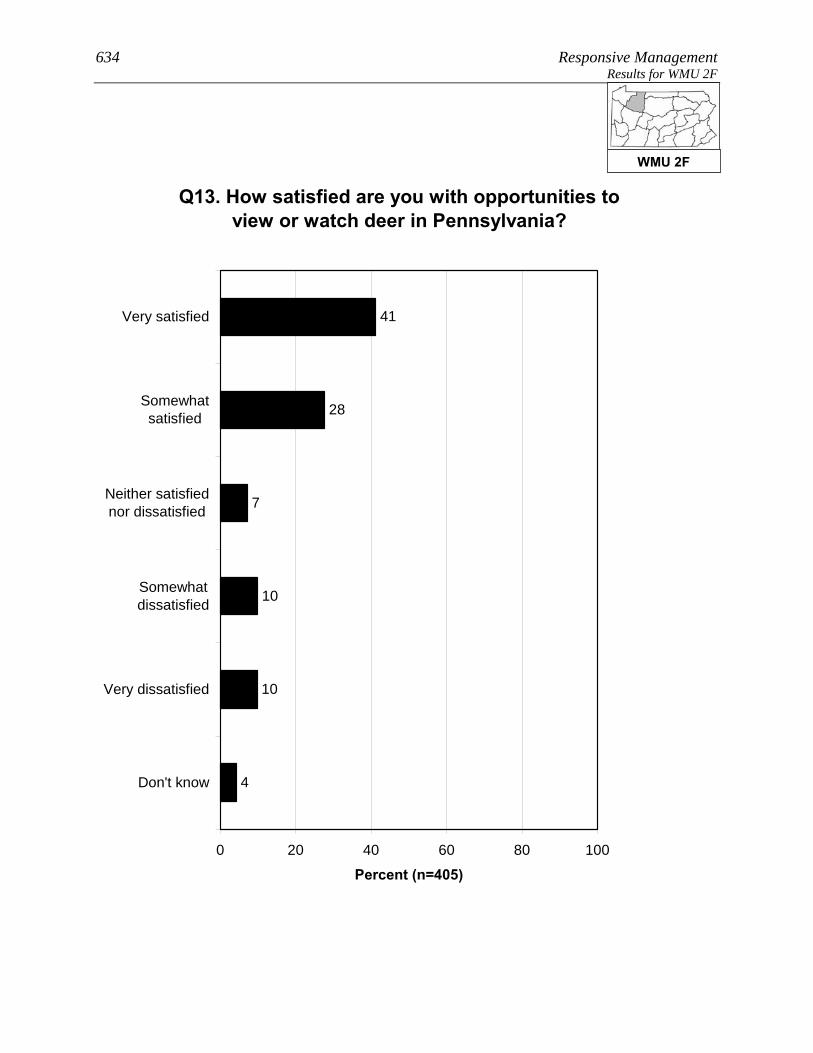
634 Responsive Management Results for WMU 2F
Q13. How satisfied are you with opportunities to view or watch deer in Pennsylvania?
41
28
7
10
10
4
0 20 40 60 80 100
Very satisfied
Somewhatsatisfied
Neither satisfiednor dissatisfied
Somewhatdissatisfied
Very dissatisfied
Don't know
Percent (n=405)
WMU 2F
Pennsylvania Residents’ Opinions on and Attitudes Toward Deer and Deer Management 635 Results for WMU 2F OPINIONS ON DEER IN GENERAL AND THE SIZE AND HEALTH OF THE DEER HERD
Opinion on deer is mostly favorable: 66% of residents of WMU 2F
say with no caveats that they like having deer around, another 20%
like having deer around but worry about the problems they may cause,
and only 3% generally regard them as a nuisance. The remainder have
no particular feeling about deer.
Another question asked residents of WMU 2F how deer-related issues compared to other
issues in their life, on a scale of 0 to 10, with the most importance being 10: the median
rating is “5.” The most common ratings are the midpoint of “5” (22%) and “0” (15%). In
general, ratings are well spread across the scale.
Two other ratings questions asked respondents to rate their concern about deer-related issues.
The median level of concern is “7” for the quality of deer habitat in Pennsylvania and “7” for
the health of the deer population in Pennsylvania.
The survey asked about the perceived size of the deer herd in the respondent’s area. The
most common answer among residents of WMU 2F is that the deer population in their area is
too low (42%), closely followed by that the deer population is just right (39%); only 10% say
it is too high.
• Those who own their home are more likely, compared to those who do not own their
home, to say that the deer population in their area is too high.
• Those who consider themselves to be a hunter are more likely to say that the deer
population in their area is too low, compared to those who are not hunters.
WMU 2F
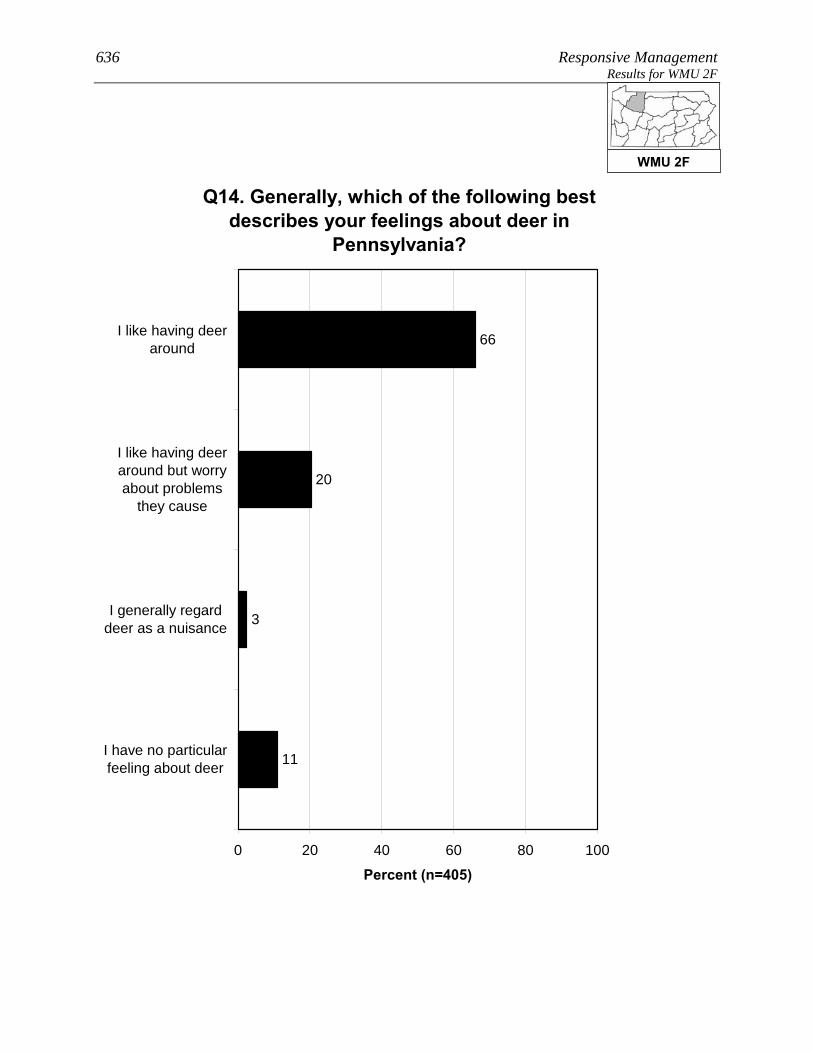
636 Responsive Management Results for WMU 2F
Q14. Generally, which of the following best describes your feelings about deer in
Pennsylvania?
66
20
3
11
0 20 40 60 80 100
I like having deeraround
I like having deeraround but worryabout problems
they cause
I generally regarddeer as a nuisance
I have no particularfeeling about deer
Percent (n=405)
WMU 2F
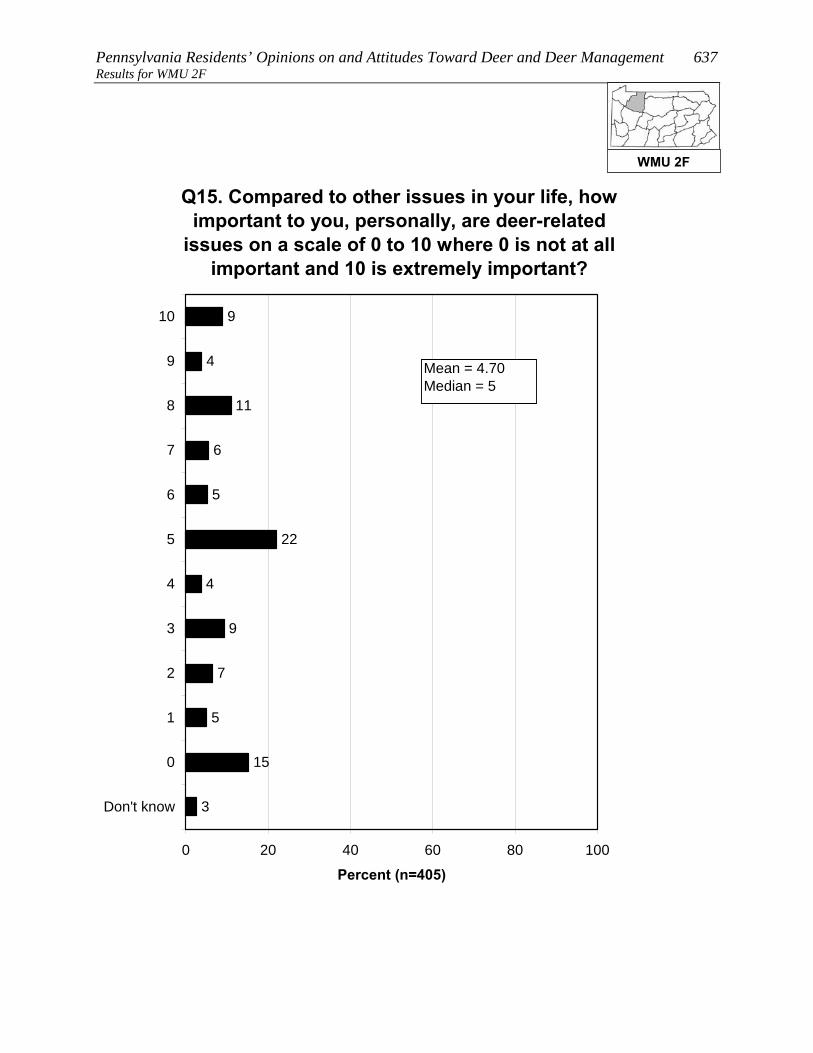
Pennsylvania Residents’ Opinions on and Attitudes Toward Deer and Deer Management 637 Results for WMU 2F
Q15. Compared to other issues in your life, how important to you, personally, are deer-related
issues on a scale of 0 to 10 where 0 is not at all important and 10 is extremely important?
7
9
4
9
4
11
6
5
22
5
15
3
0 20 40 60 80 100
10
9
8
7
6
5
4
3
2
1
0
Don't know
Percent (n=405)
Mean = 4.70Median = 5
WMU 2F

638 Responsive Management Results for WMU 2F
Q41. How about the quality of deer habitat in Pennsylvania? (How much of a concern is this for you personally on a scale of 0 to 10 where 0 is not at all concerned and 10 is extremely concerned?)
2
3
2
12
2
23
13
8
21
3
9
2
0 20 40 60 80 100
10
9
8
7
6
5
4
3
2
1
0
Don't know
Percent (n=405)
Mean = 6.01Median = 7
WMU 2F

Pennsylvania Residents’ Opinions on and Attitudes Toward Deer and Deer Management 639 Results for WMU 2F
2
2
4
19
5
19
9
7
17
2
13
2
0 20 40 60 80 100
10
9
8
7
6
5
4
3
2
1
0
Don't know
Percent (n=405)
Q42. How about health of the deer population, such as adequate food resources for the size of the deer herd, in Pennsylvania? (How much of a concern is this for you
personally on a scale of 0 to 10 where 0 is not at all concerned and 10 is extremely concerned?)
Mean = 6.16Median = 7
WMU 2F
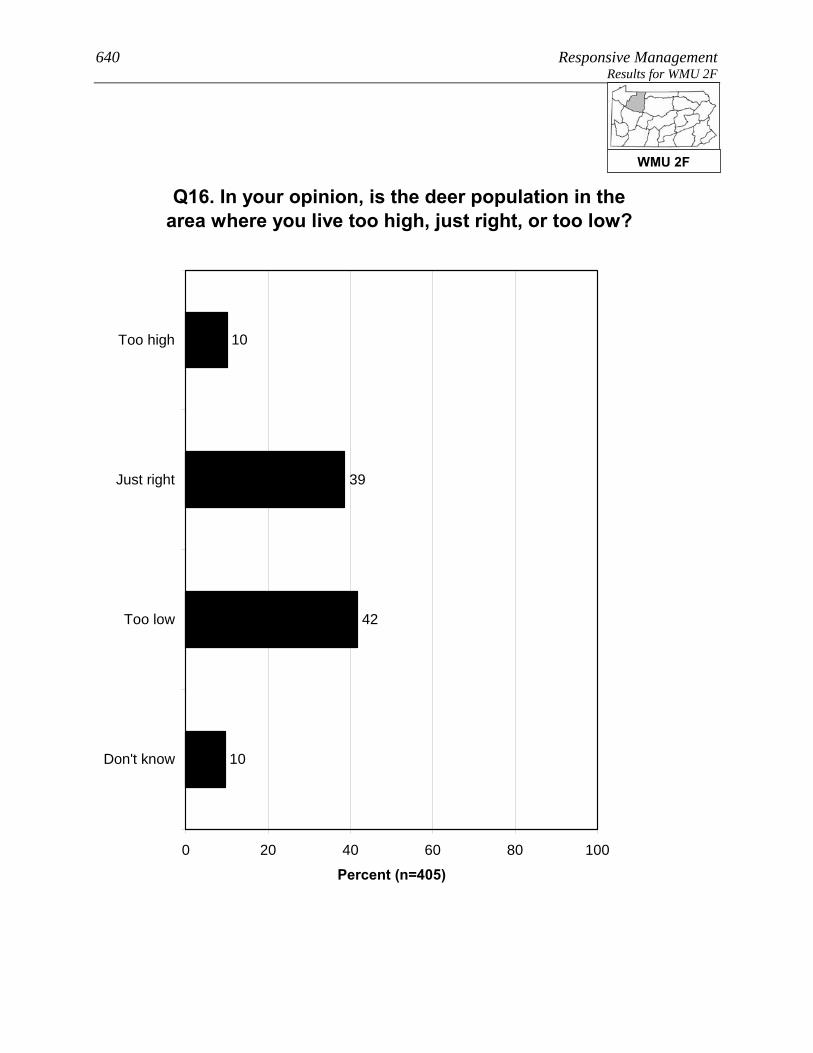
640 Responsive Management Results for WMU 2F
Q16. In your opinion, is the deer population in the area where you live too high, just right, or too low?
10
39
42
10
0 20 40 60 80 100
Too high
Just right
Too low
Don't know
Percent (n=405)
WMU 2F
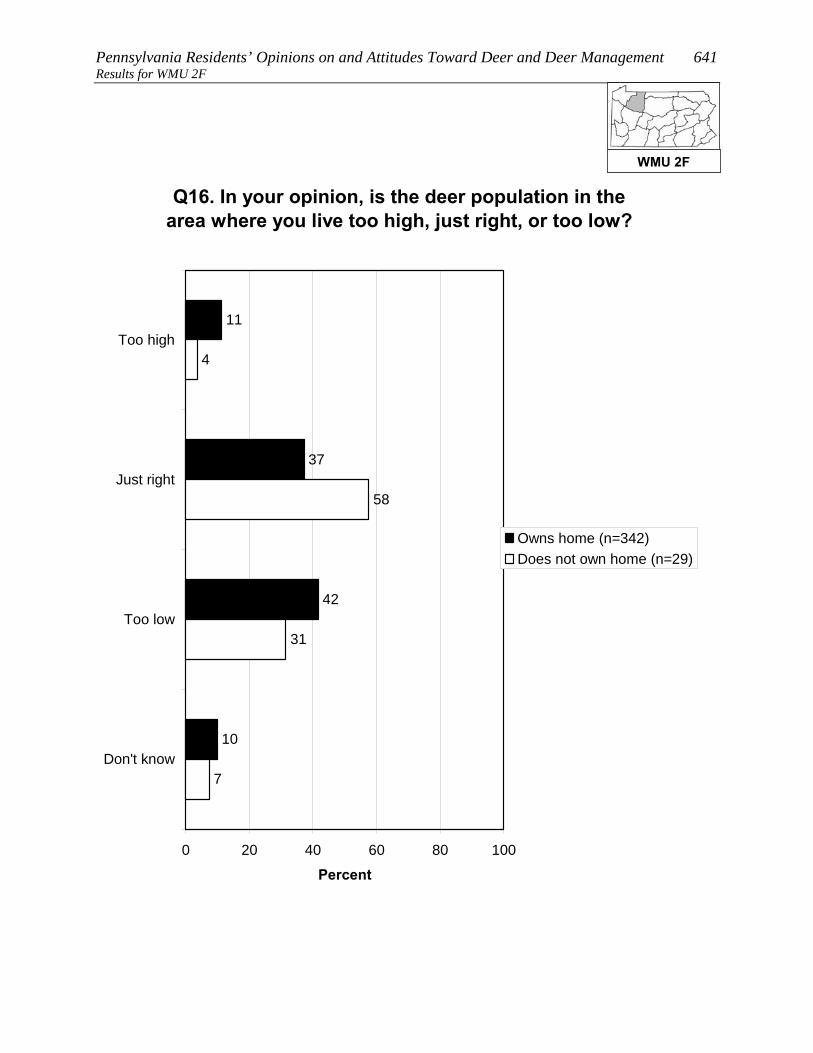
Pennsylvania Residents’ Opinions on and Attitudes Toward Deer and Deer Management 641 Results for WMU 2F
Q16. In your opinion, is the deer population in the area where you live too high, just right, or too low?
11
37
42
10
31
58
4
7
0 20 40 60 80 100
Too high
Just right
Too low
Don't know
Percent
Owns home (n=342)Does not own home (n=29)
WMU 2F
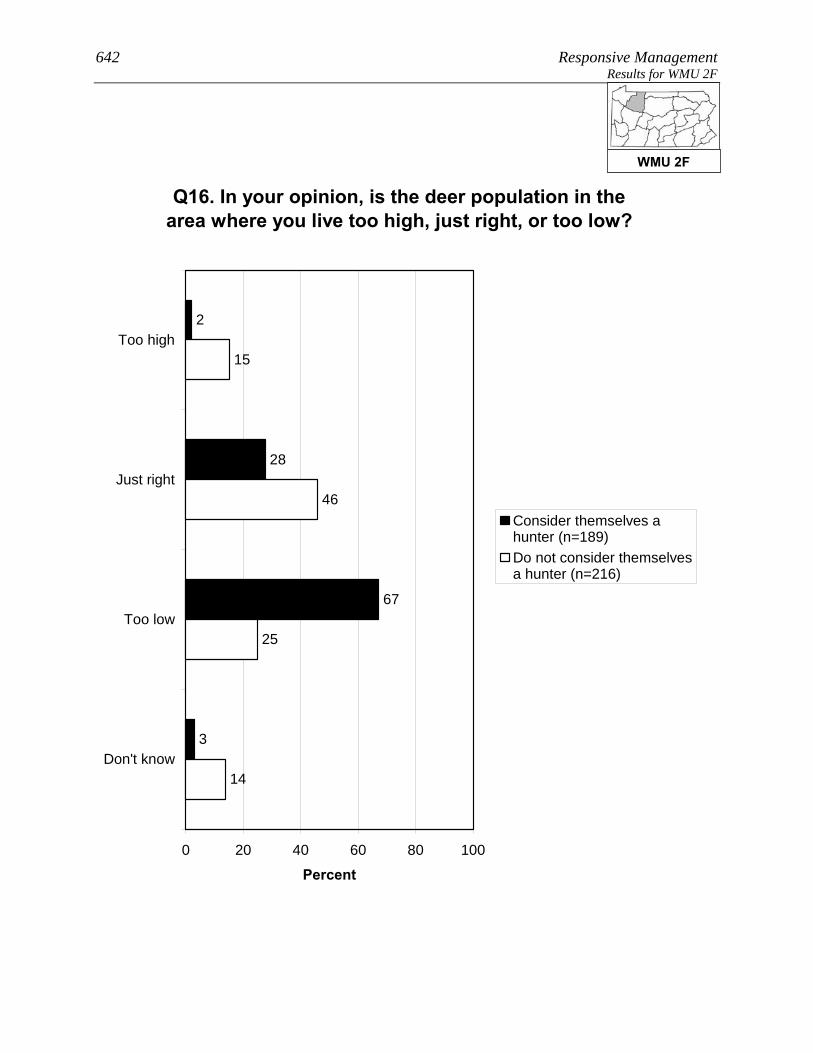
642 Responsive Management Results for WMU 2F
Q16. In your opinion, is the deer population in the area where you live too high, just right, or too low?
2
28
67
3
25
46
15
14
0 20 40 60 80 100
Too high
Just right
Too low
Don't know
Percent
Consider themselves ahunter (n=189)Do not consider themselvesa hunter (n=216)
WMU 2F
Pennsylvania Residents’ Opinions on and Attitudes Toward Deer and Deer Management 643 Results for WMU 2F OPINIONS ON MANAGEMENT EFFORTS AND MANAGEMENT GOALS
The survey asked about three deer population management goals. For
all three, a large majority agree with the management goal, but the
most support is for goals that address ecological concerns rather than
human concerns: 95% agree with managing for healthy and
sustainable deer populations, 88% agree with managing the deer for a
healthy and sustainable forest habitat, and 78% agree with managing
for safe, acceptable levels of deer-human conflicts.
Residents of WMU 2F who said that the deer population in their area is too high or too low
were asked to indicate the reasonable number of years it should take to achieve an acceptable
deer population. The mean amount is 4.21 years. While 36% said that they do not know,
nearly all of the remainder gave a number of years of 10 or less. Note that this is only among
those who said the deer population was too high or too low.
• Because management plans typically look at a time frame of about 10 years to effect
change, the survey specifically asked if these respondents would be willing to wait
more than 10 years to achieve an acceptable deer population: somewhat less than a
majority (43%) indicated that they would be willing to wait that long.
WMU 2F

644 Responsive Management Results for WMU 2F
Q24-26. Deer populations should be managed for the following. (Do you agree or disagree with this
deer management goal?)
57
31
1
3
5
3
1
25
70
2
2
0
7
43
35
3
8
4
0 20 40 60 80 100
Stronglyagree
Moderatelyagree
Neither agreenor disagree
Moderatelydisagree
Stronglydisagree
Don't know
Percent (n=405)
Healthy and sustainableforest habitatHealthy and sustainabledeer populationsSafe and acceptable levelsof deer-human conflicts
WMU 2F

Pennsylvania Residents’ Opinions on and Attitudes Toward Deer and Deer Management 645 Results for WMU 2F
36
2
5
1
9
20
7
11
9
0 20 40 60 80 100
More than 10years
6-10 years
5 years
4 years
3 years
2 years
1 year
Less than a year
Don't know
Percent (n=216)
Q18. You said the deer population in the area where you live is [too high / too low]. In years, what is a
reasonable amount of time to achieve an acceptable deer population in the area where you live? (Asked of those who think the deer population in the area where
they live is too high or too low.)
Mean = 4.21Median = 4
WMU 2F

646 Responsive Management Results for WMU 2F
Q21. Would you be willing to wait more than 10 years to achieve an acceptable deer population in the area where you live? (Among those who think the deer population in the area where they live is
too high or too low.)
43
51
6
0 20 40 60 80 100
Yes
No
Don't know
Percent (n=216)
WMU 2F
Pennsylvania Residents’ Opinions on and Attitudes Toward Deer and Deer Management 647 Results for WMU 2F OPINIONS ON METHODS FOR MANAGING DEER, INCLUDING HUNTING
A majority of residents of WMU 2F (63%) support lethal methods to
manage deer populations in Pennsylvania; nonetheless, 26% oppose,
mostly strong opposition.
• Those residents of WMU 2F who live in a single-family home and own their home are
less likely to strongly support lethal methods but more likely to moderately support so
that overall support is about the same, compared to those who live in a single-family
home but do not own their home.
• The survey asked about four methods of controlling deer populations (three of them
lethal). The most support is for legal, regulated hunting (96% of respondents support
this method), distantly followed by fertility/birth control (27%), trapping and killing
(26%), and professionals or sharpshooters (23%).
Two questions asked respondents about hunting on their land (among those who live in a
single-family home), the first question about hunting by the respondents themselves (15% do
so) and the second regarding allowing others to hunt on their land (24% do so). In
combining the results, 27% of residents of WMU 2F who live in a single-family home either
hunt on their own land or allow others to do so (it is not simply a sum of the two questions
because some hunt on their property and allow others to do so as well).
• There was interest in seeing how a particular subgroup responded on this question, the
subgroup being those who live in a single-family home; who live on 1 acre or less; and
who live in an urban, suburban area, or a small city/town. Among this subgroup, 5%
either hunt on their own property or allow others to hunt on the property.
• Those respondents who do not allow hunting on their property were asked to indicate
why they prohibit it. The most common reasons are that they live in an urban or
suburban area in which hunting is not possible or feasible and/or that their property is
too small. Other minor reasons are a concerns about safety and liability concerns.
• Those same respondents who do not allow hunting on their property were asked about
their likelihood of ever allowing others to hunt deer on their property; they
overwhelmingly say this is very unlikely (94%). They were then asked if there is
WMU 2F

648 Responsive Management Results for WMU 2F
anything that would make them more likely to allow deer hunting;
they are almost unanimous (97%) in saying that there is nothing
that would make them more likely to allow deer hunting.
• The question about allowing others to hunt on their property was examined among the
subgroup previously discussed (those who live in a single-family home; who live on 1
acre or less; and who live in an urban, suburban area, or a small city/town). Among
this group who got the question, nearly all say that they would never allow hunting.
o Additional follow-up questions to be asked of those who indicated that something
might prompt them to allow hunting on their property did not have enough
respondents for statistical validity; therefore, they are not shown.
WMU 2F

Pennsylvania Residents’ Opinions on and Attitudes Toward Deer and Deer Management 649 Results for WMU 2F
Q27. In general, do you support or oppose lethal methods to manage deer populations in
Pennsylvania?
39
24
8
9
17
4
0 20 40 60 80 100
Strongly support
Moderatelysupport
Neither supportnor oppose
Moderately oppose
Strongly oppose
Don't know
Percent (n=405)
WMU 2F

650 Responsive Management Results for WMU 2F
Q27. In general, do you support or oppose lethal methods to manage deer populations in
Pennsylvania?
38
24
9
9
17
3
3
7
57
2
31
0
0 20 40 60 80 100
Stronglysupport
Moderatelysupport
Neither supportnor oppose
Moderatelyoppose
Stronglyoppose
Don't know
Percent
Owns home (n=342)Does not own home (n=29)
WMU 2F

Pennsylvania Residents’ Opinions on and Attitudes Toward Deer and Deer Management 651 Results for WMU 2F
Q30-Q33. Percent who strongly support each of the following methods of controlling deer populations
in Pennsylvania:
11
11
13
80
0 20 40 60 80 100
Q30. Legal,regulated hunting
Q31. Professionalsor sharpshooters
Q33. Fertility or birthcontrol
Q32. Trapping andkilling
Percent
WMU 2F

652 Responsive Management Results for WMU 2F
Q30-Q33. Percent who strongly or moderately support each of the following methods of
controlling deer populations in Pennsylvania:
23
26
27
96
0 20 40 60 80 100
Q30. Legal,regulated hunting
Q33. Fertility or birthcontrol
Q32. Trapping andkilling
Q31. Professionalsor sharpshooters
Percent
WMU 2F

Pennsylvania Residents’ Opinions on and Attitudes Toward Deer and Deer Management 653 Results for WMU 2F
Q30-Q33. Percent who strongly or moderately oppose each of the following methods of
controlling deer populations in Pennsylvania:
3
63
68
69
0 20 40 60 80 100
Q31. Professionalsor sharpshooters
Q32. Trapping andkilling
Q33. Fertility or birthcontrol
Q30. Legal,regulated hunting
Percent
WMU 2F

654 Responsive Management Results for WMU 2F
Q30-Q33. Percent who strongly oppose each of the following methods of controlling deer populations
in Pennsylvania:
2
49
53
55
0 20 40 60 80 100
Q32. Trapping andkilling
Q31. Professionalsor sharpshooters
Q33. Fertility or birthcontrol
Q30. Legal,regulated hunting
Percent
WMU 2F

Pennsylvania Residents’ Opinions on and Attitudes Toward Deer and Deer Management 655 Results for WMU 2F
Q59/60. Deer hunts and/or allows others to deer hunt on property. (Among respondents living in a
single-family home.)
27
73
0 20 40 60 80 100
Yes
No
Percent (n=371)
WMU 2F

656 Responsive Management Results for WMU 2F
Q59/60. Deer hunts and/or allows others to deer hunt on property. (Among respondents living in a
single-family home.)
5
95
0 20 40 60 80 100
Yes
No
Percent
Lives in a single familyhome on 1 acre or less inan urban area, a suburbanarea, or a small city/town(n=161)
WMU 2F

Pennsylvania Residents’ Opinions on and Attitudes Toward Deer and Deer Management 657 Results for WMU 2F
Q63. What are the main reasons you do not allow others to hunt deer on your property? (Asked of
those whose primary place of residence is a single-family home and who do not allow others to hunt
deer on their property.)
57
51
6
3
2
1
0 20 40 60 80 100
Live in residentialneighborhood /
suburban orurban area
Property is toosmall / neighbors
too close
Concerned aboutsafety
Liability
Oppose hunting ingeneral
Want to savehunting
opportunities forself / family
Mul
tiple
Res
pons
es A
llow
ed
Percent (n=283)
WMU 2F

658 Responsive Management Results for WMU 2F
Q65. How likely are you to ever allow others to deer hunt on your property? (Asked of those whose
primary place of residence is a single-family home and who do not allow others to hunt deer on their
property.)
1
2
0
3
94
0 20 40 60 80 100
Very likely
Somewhat likely
Neither likely norunlikely
Somewhat unlikely
Very unlikely
Percent (n=283)
WMU 2F
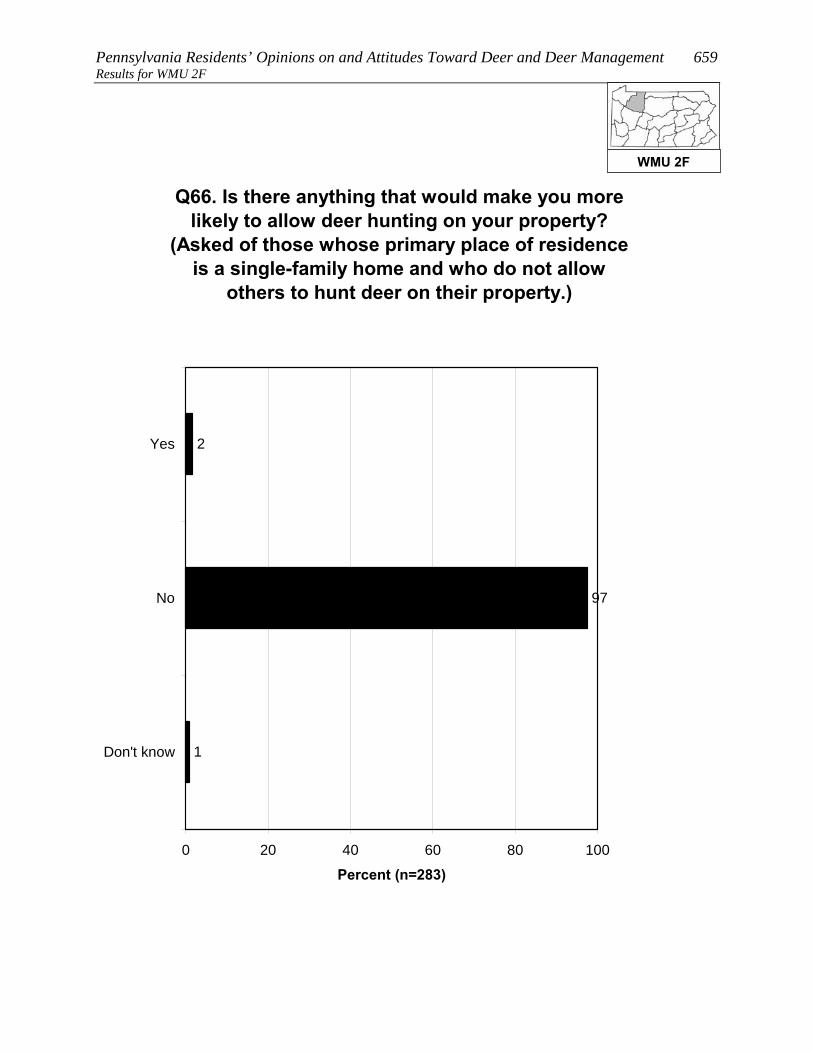
Pennsylvania Residents’ Opinions on and Attitudes Toward Deer and Deer Management 659 Results for WMU 2F
Q66. Is there anything that would make you more likely to allow deer hunting on your property?
(Asked of those whose primary place of residence is a single-family home and who do not allow
others to hunt deer on their property.)
2
97
1
0 20 40 60 80 100
Yes
No
Don't know
Percent (n=283)
WMU 2F

660 Responsive Management Results for WMU 2F
Q65. How likely are you to ever allow others to deer hunt on your property? (Asked of those whose
primary place of residence is a single-family home and who do not allow others to hunt deer on their
property.)
0
1
0
1
98
0 20 40 60 80 100
Very likely
Somewhatlikely
Neither likelynor unlikely
Somewhatunlikely
Very unlikely
Percent
Lives in a single familyhome on 1 acre or less inan urban area, a suburbanarea, or a small city/town(n=152)
WMU 2F
Pennsylvania Residents’ Opinions on and Attitudes Toward Deer and Deer Management 661 Results for WMU 2F CONCERNS ABOUT DEER AND DEER NUISANCE PROBLEMS
Seven questions asked about respondents’ level of concern about
issues associated with deer. For each issue, respondents rated their
level of concern about it using a 10-point scale, with 10 being the most
concerned.
• The most concern was for tick-borne diseases (mean rating of 7.1), followed by three
whose means are fairly close to one another: deer-vehicle accidents (6.2), the health of
the deer population (6.2), and the quality of deer habitat (6.0).
• At the bottom are concern about deer impacts on habitat and other wildlife (even
though this can be considerable) (3.3) and the two impacts to residents’ landscaping:
deer damage to plants and landscaping (2.2) and deer droppings in the yard (1.4).
o Another graph shows the percentage who gave a high rating (a “9” or “10”),
providing an idea of the percentage who feel strongly about the issues.
Among residents of WMU 2F, 73% indicated that they saw deer on their property in the past
12 months.
• Respondents who fed birds were more likely to indicate seeing deer, and respondents
who fed deer/put out attractants or were aware of neighbors who fed deer or put out
attractants were much more likely to see deer.
The survey asked about specific nuisance problems with deer that residents of WMU 2F may
have experienced: 11% indicated that they experienced problems with deer at their primary
place of residence in the past 12 months; 23% indicated that they or another household
member had been in a vehicle collision with a deer (fortunately, a very low portion of
drivers/passengers were injured); and 3% indicated that they or a household member had
been diagnosed with a tick-borne disease.
• Crosstabulations show that those who fed birds, compared to those who did not, were
about the same regarding experiencing deer problems. Likewise, those who were
aware of neighbors feeding deer or putting out attractants were about the same as their
counterparts in experiencing deer problems.
WMU 2F

662 Responsive Management Results for WMU 2F
Q36-Q42. Mean rating of respondents' concern about each of the following on a 10-point scale:
2.2
3.3
6.0
6.2
6.2
7.1
1.4
0 2 4 6 8 10
Q36. Tick-borne diseases, such as Lymedisease, in Pennsylvania
Q40. Deer-vehicle accidents inPennsylvania
Q42. The health of the deer population,such as adequate food resources for the
size of the deer herd, in Pennsylvania
Q41. The quality of deer habitat inPennsylvania
Q39. Deer impacts on the habitat andother wildlife in Pennsylvania
Q38. Deer damage to plants andlandscaping in his/her yard
Q37. Deer droppings in his/her yard
Mean
WMU 2F
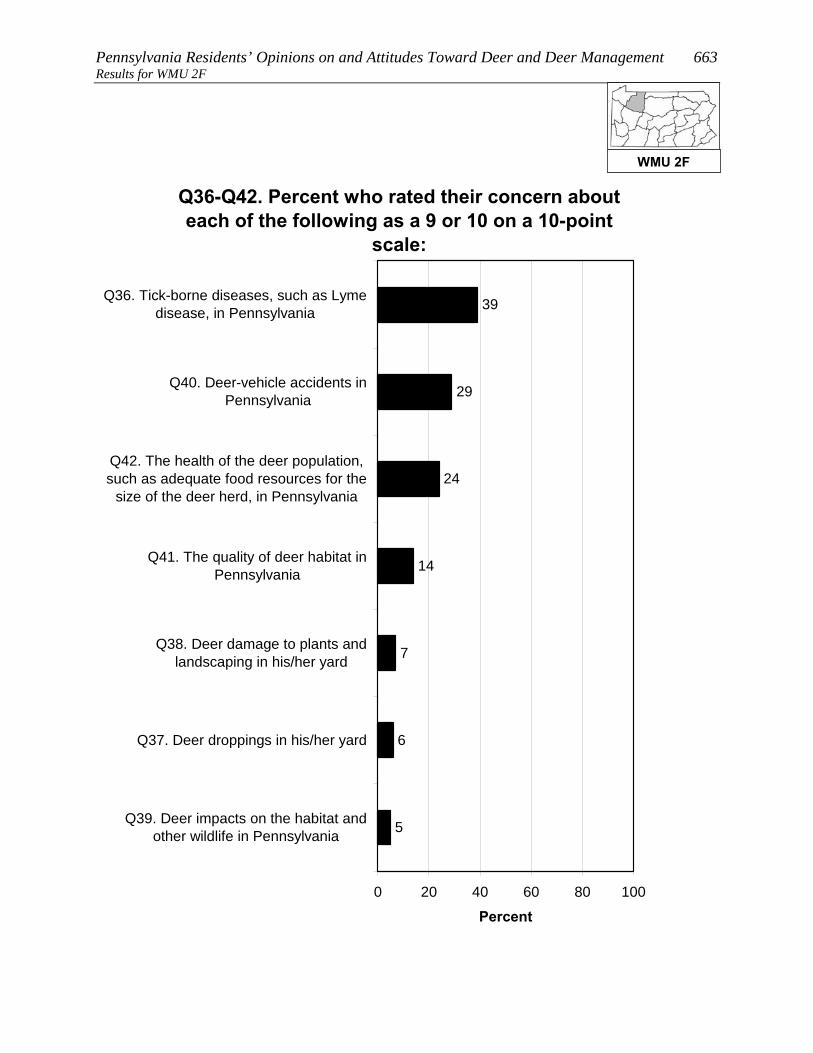
Pennsylvania Residents’ Opinions on and Attitudes Toward Deer and Deer Management 663 Results for WMU 2F
Q36-Q42. Percent who rated their concern about each of the following as a 9 or 10 on a 10-point
scale:
6
7
14
24
29
39
5
0 20 40 60 80 100
Q36. Tick-borne diseases, such as Lymedisease, in Pennsylvania
Q40. Deer-vehicle accidents inPennsylvania
Q42. The health of the deer population,such as adequate food resources for the
size of the deer herd, in Pennsylvania
Q41. The quality of deer habitat inPennsylvania
Q38. Deer damage to plants andlandscaping in his/her yard
Q37. Deer droppings in his/her yard
Q39. Deer impacts on the habitat andother wildlife in Pennsylvania
Percent
WMU 2F

664 Responsive Management Results for WMU 2F
Q49. How often have you seen deer on your property in the past 12 months?
36
21
16
27
0 20 40 60 80 100
Frequently
Sometimes
Rarely
Never
Percent (n=405)
WMU 2F

Pennsylvania Residents’ Opinions on and Attitudes Toward Deer and Deer Management 665 Results for WMU 2F
Q49. How often have you seen deer on your property in the past 12 months?
37
23
14
25
19
18
33
30
0 20 40 60 80 100
Frequently
Sometimes
Rarely
Never
Percent
Fed birds on his / herproperty in the past 12months (n=212)Did not feed birds on his /her property in the past 12months (n=193)
WMU 2F
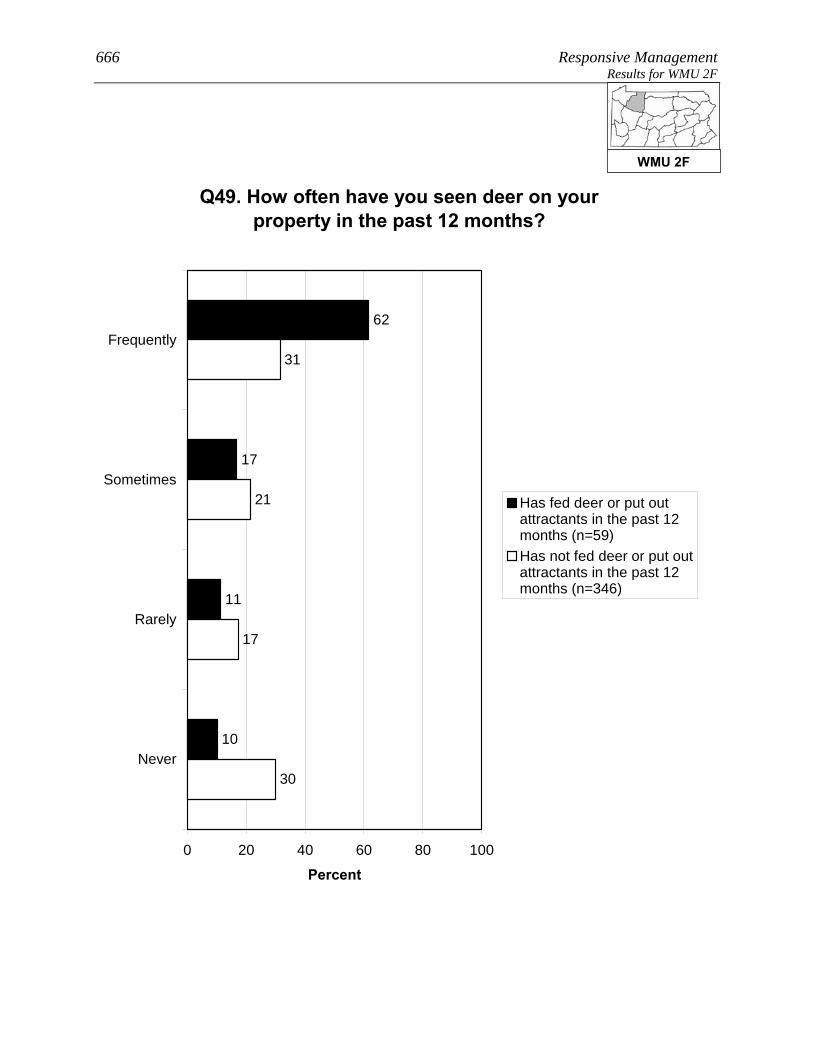
666 Responsive Management Results for WMU 2F
Q49. How often have you seen deer on your property in the past 12 months?
62
17
11
10
17
21
31
30
0 20 40 60 80 100
Frequently
Sometimes
Rarely
Never
Percent
Has fed deer or put outattractants in the past 12months (n=59)Has not fed deer or put outattractants in the past 12months (n=346)
WMU 2F

Pennsylvania Residents’ Opinions on and Attitudes Toward Deer and Deer Management 667 Results for WMU 2F
Q49. How often have you seen deer on your property in the past 12 months?
53
27
11
9
17
20
32
31
0 20 40 60 80 100
Frequently
Sometimes
Rarely
Never
Percent
Is aware of neighborsfeeding deer or putting outattractants (n=66)Is not aware of neighborsfeeding deer or putting outattractants (n=338)
WMU 2F

668 Responsive Management Results for WMU 2F
Q43. In the past 12 months, have you experienced any problems with deer at your primary place of
residence?
11
89
0 20 40 60 80 100
Yes
No
Percent (n=405)
WMU 2F
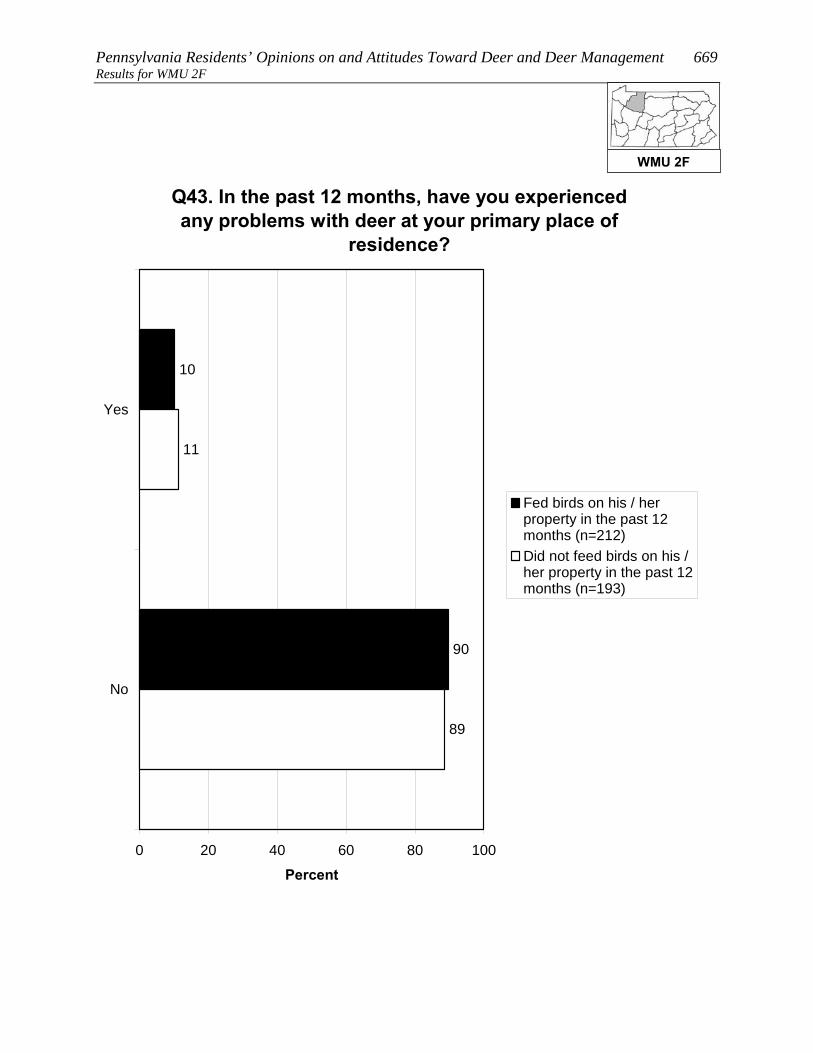
Pennsylvania Residents’ Opinions on and Attitudes Toward Deer and Deer Management 669 Results for WMU 2F
Q43. In the past 12 months, have you experienced any problems with deer at your primary place of
residence?
10
90
89
11
0 20 40 60 80 100
Yes
No
Percent
Fed birds on his / herproperty in the past 12months (n=212)Did not feed birds on his /her property in the past 12months (n=193)
WMU 2F

670 Responsive Management Results for WMU 2F
Q43. In the past 12 months, have you experienced any problems with deer at your primary place of
residence?
8
92
89
11
0 20 40 60 80 100
Yes
No
Percent
Is aware of neighborsfeeding deer or putting outattractants (n=66)Is not aware of neighborsfeeding deer or putting outattractants (n=338)
WMU 2F

Pennsylvania Residents’ Opinions on and Attitudes Toward Deer and Deer Management 671 Results for WMU 2F
Q44. In the past 12 months, have you or any other person living in your immediate household been in a vehicle collision with or an accident involving a
deer on Pennsylvania's roads or highways?
23
77
0 20 40 60 80 100
Yes
No
Percent (n=405)
WMU 2F

672 Responsive Management Results for WMU 2F
Q45. Were you or anyone else injured? (Asked of those who had a household member who was in or
who have personally been in a vehicle collision with or an accident involving a deer on
Pennsylvania's roads or highways in the past 12 months.)
4
96
0 20 40 60 80 100
Yes
No
Percent (n=82)
WMU 2F
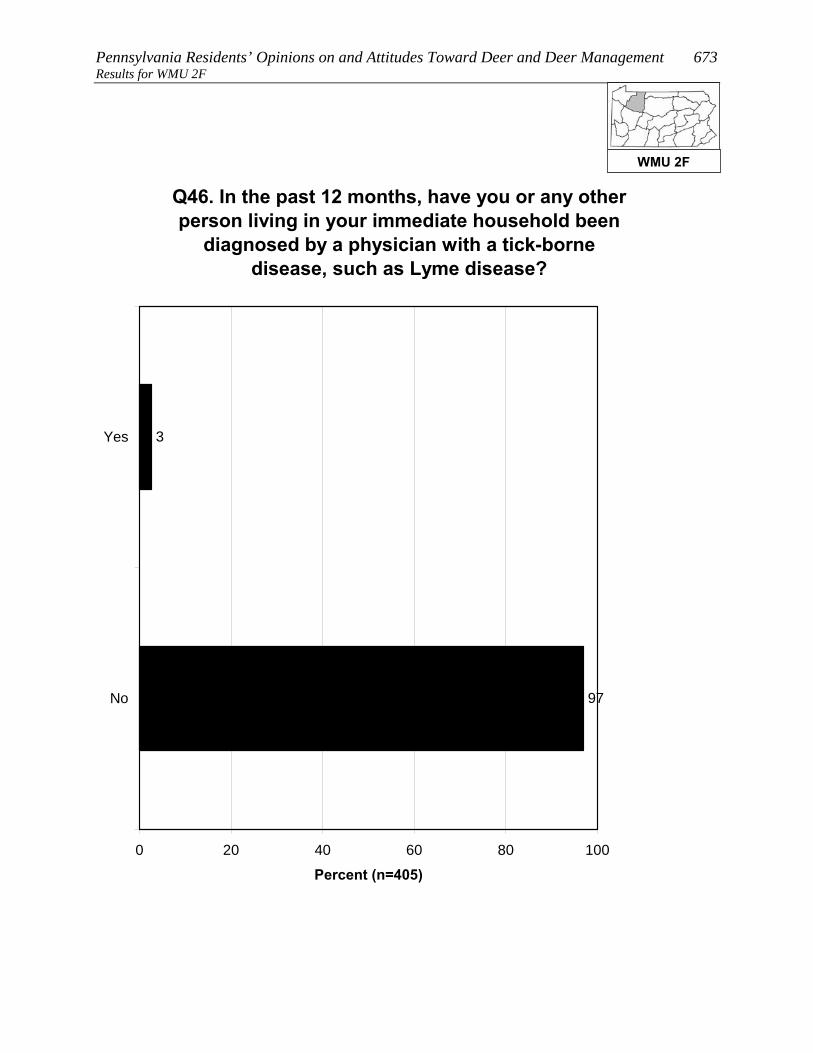
Pennsylvania Residents’ Opinions on and Attitudes Toward Deer and Deer Management 673 Results for WMU 2F
Q46. In the past 12 months, have you or any other person living in your immediate household been
diagnosed by a physician with a tick-borne disease, such as Lyme disease?
3
97
0 20 40 60 80 100
Yes
No
Percent (n=405)
WMU 2F

674 Responsive Management Results for WMU 2F
FEEDING WILDLIFE AND HUNTING DEER Several questions asked about feeding wildlife.
• Feeding deer or putting out deer attractants: 13% of residents of
WMU 2F did this, and 15% are aware of neighbors who did this.
o The most typical feeds or attractants put out by respondents are corn, salt/mineral
blocks, and apples.
• Feeding birds: 53% of residents of WMU 2F did this.
There is no consensus on whether it is okay for private citizens to feed or attract deer in
Pennsylvania: 53% agree that this is okay, but 36% disagree (the rest are neutral).
More than a quarter of residents of WMU 2F (40%) consider themselves to be a hunter,
about three-fourths of whom have a Pennsylvania hunting license.
• Among residents of WMU 2F who live in a single-family home, 15% personally hunt
deer on their property.
• A large majority of residents of WMU 2F (89%) say that they, family members, and/or
friends hunt.
WMU 2F

Pennsylvania Residents’ Opinions on and Attitudes Toward Deer and Deer Management 675 Results for WMU 2F
Q50. Did you ever feed deer intentionally or put out attractants, such as a salt or mineral block, in the
past 12 months?
13
87
0 20 40 60 80 100
Yes
No
Percent (n=405)
WMU 2F

676 Responsive Management Results for WMU 2F
Q55. Are you aware of any of your neighbors feeding deer intentionally or trying to attract deer
on their property in the past 12 months?
15
85
1
0 20 40 60 80 100
Yes
No
Don't know
Percent (n=405)
WMU 2F
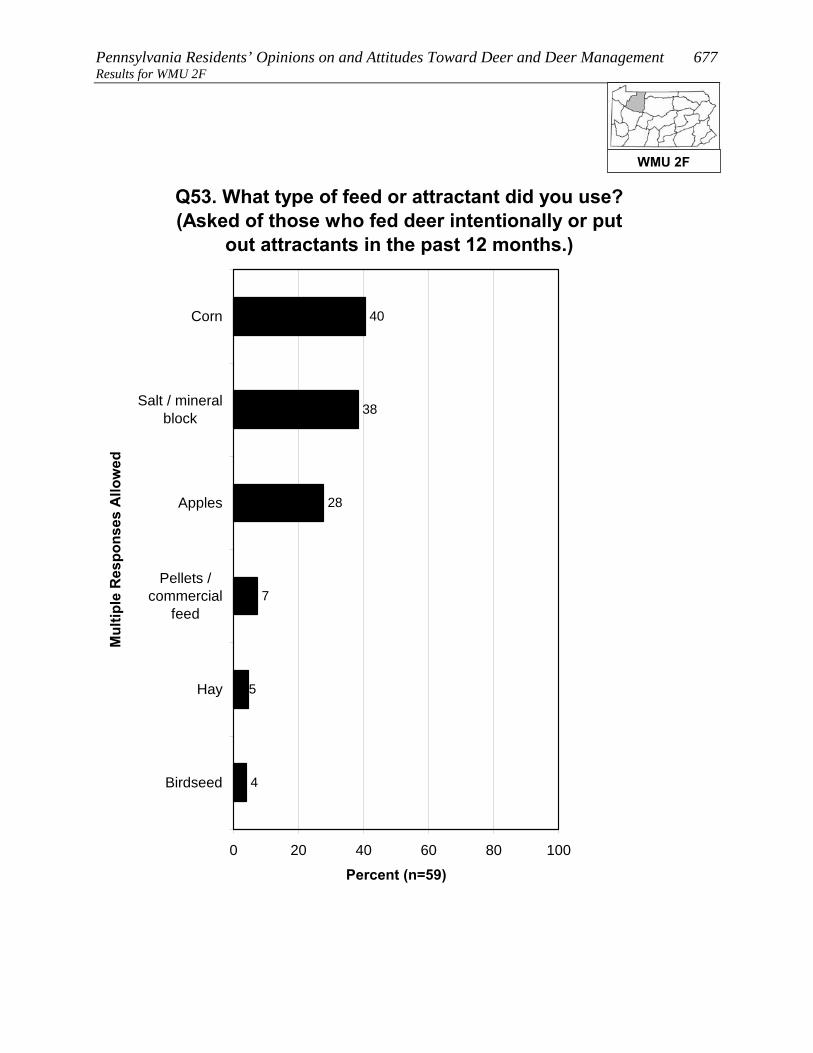
Pennsylvania Residents’ Opinions on and Attitudes Toward Deer and Deer Management 677 Results for WMU 2F
Q53. What type of feed or attractant did you use? (Asked of those who fed deer intentionally or put
out attractants in the past 12 months.)
40
38
28
7
5
4
0 20 40 60 80 100
Corn
Salt / mineralblock
Apples
Pellets /commercial
feed
Hay
Birdseed
Mul
tiple
Res
pons
es A
llow
ed
Percent (n=59)
WMU 2F

678 Responsive Management Results for WMU 2F
Q48. Did you feed birds or make birdfeed available on your property in the past 12 months?
53
47
0 20 40 60 80 100
Yes
No
Percent (n=405)
WMU 2F

Pennsylvania Residents’ Opinions on and Attitudes Toward Deer and Deer Management 679 Results for WMU 2F
Q56. Do you agree or disagree that it is OK for private citizens to feed or attract deer in
Pennsylvania?
28
25
7
9
27
4
0 20 40 60 80 100
Strongly agree
Moderately agree
Neither agree nordisagree
Moderatelydisagree
Strongly disagree
Don't know
Percent (n=405)
WMU 2F

680 Responsive Management Results for WMU 2F
Q59. Do you personally hunt deer on your property? (Asked of those whose primary place of
residence is a single-family home.)
15
85
0 20 40 60 80 100
Yes
No
Percent (n=371)
WMU 2F
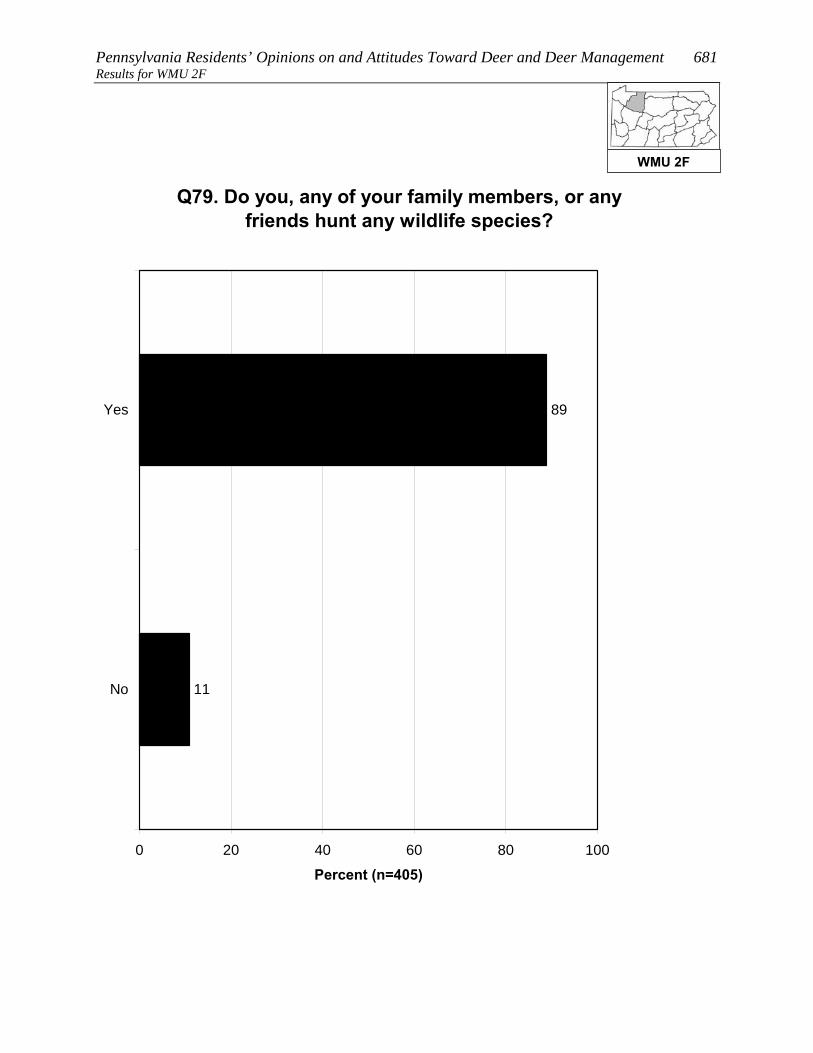
Pennsylvania Residents’ Opinions on and Attitudes Toward Deer and Deer Management 681 Results for WMU 2F
Q79. Do you, any of your family members, or any friends hunt any wildlife species?
89
11
0 20 40 60 80 100
Yes
No
Percent (n=405)
WMU 2F
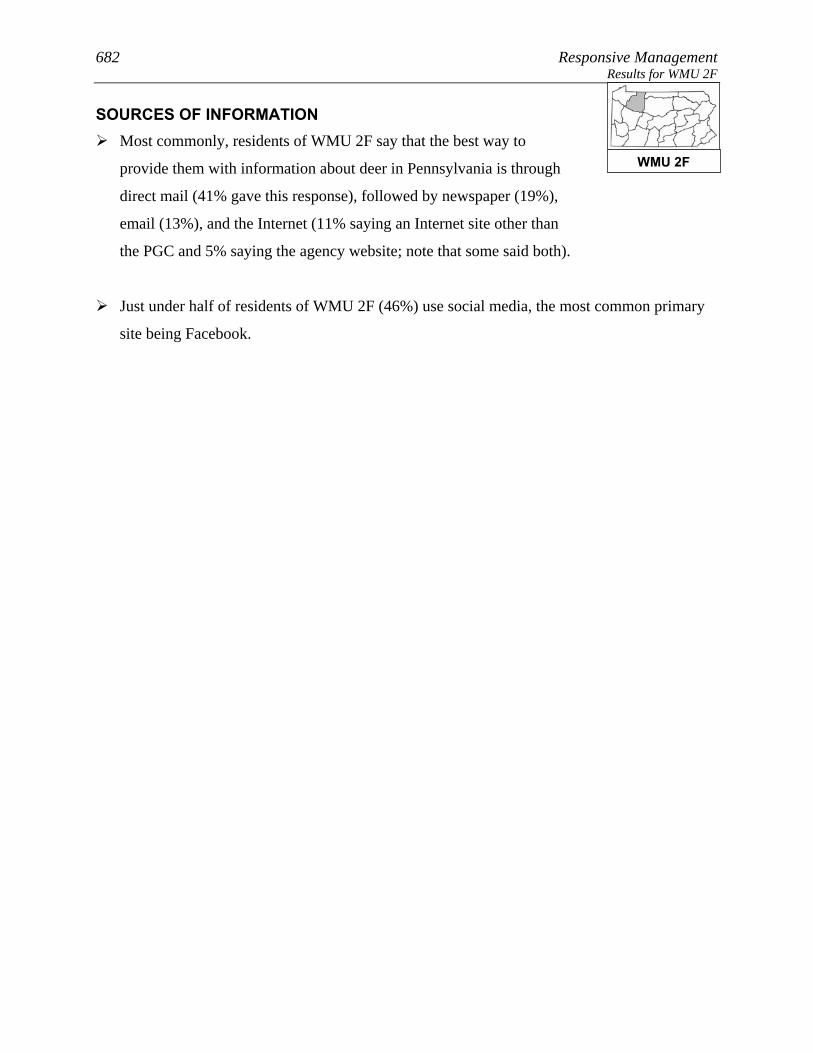
682 Responsive Management Results for WMU 2F
SOURCES OF INFORMATION Most commonly, residents of WMU 2F say that the best way to
provide them with information about deer in Pennsylvania is through
direct mail (41% gave this response), followed by newspaper (19%),
email (13%), and the Internet (11% saying an Internet site other than
the PGC and 5% saying the agency website; note that some said both).
Just under half of residents of WMU 2F (46%) use social media, the most common primary
site being Facebook.
WMU 2F
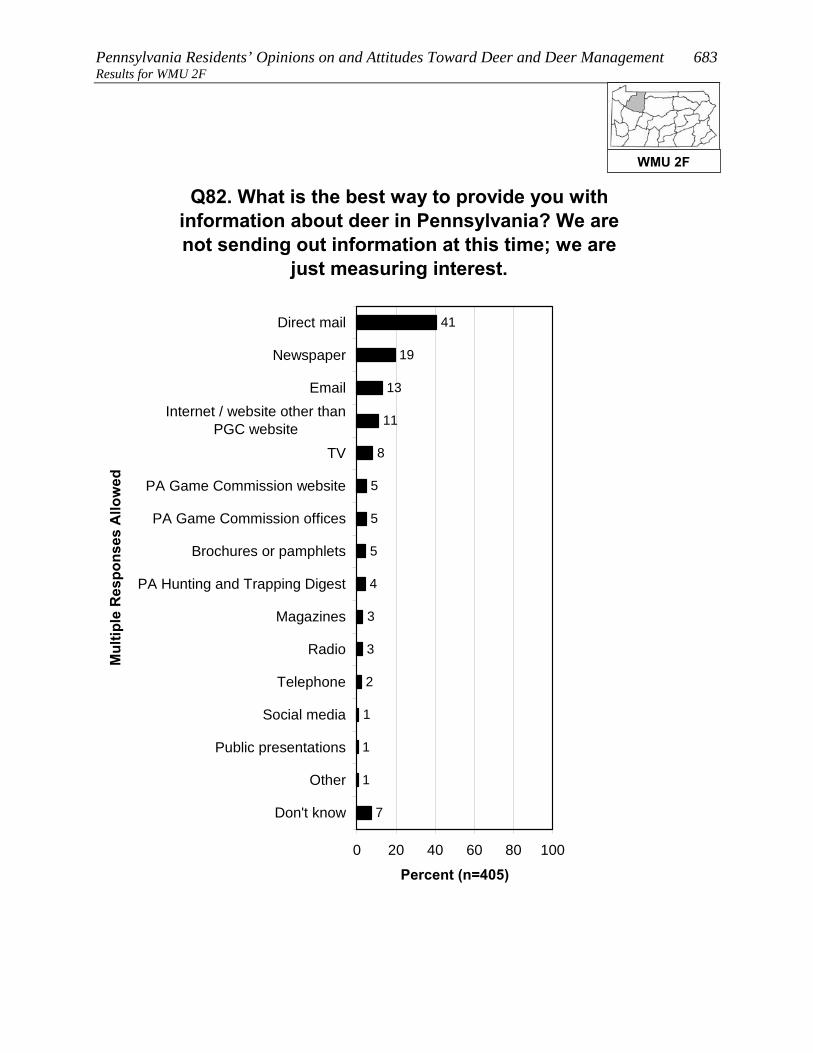
Pennsylvania Residents’ Opinions on and Attitudes Toward Deer and Deer Management 683 Results for WMU 2F
Q82. What is the best way to provide you with information about deer in Pennsylvania? We are not sending out information at this time; we are
just measuring interest.
7
4
5
5
41
19
13
11
8
5
3
3
2
1
1
1
0 20 40 60 80 100
Direct mail
Newspaper
EmailInternet / website other than
PGC websiteTV
PA Game Commission website
PA Game Commission offices
Brochures or pamphlets
PA Hunting and Trapping Digest
Magazines
Radio
Telephone
Social media
Public presentations
Other
Don't know
Mul
tiple
Res
pons
es A
llow
ed
Percent (n=405)
WMU 2F
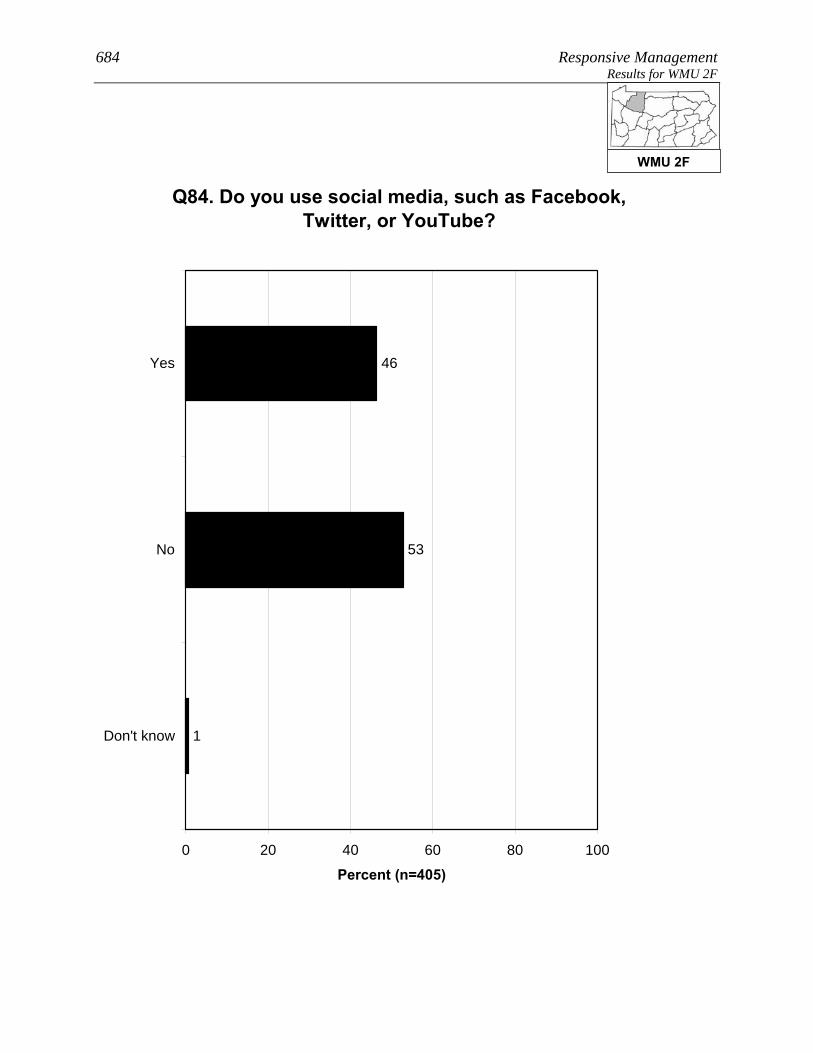
684 Responsive Management Results for WMU 2F
Q84. Do you use social media, such as Facebook, Twitter, or YouTube?
46
53
1
0 20 40 60 80 100
Yes
No
Don't know
Percent (n=405)
WMU 2F

Pennsylvania Residents’ Opinions on and Attitudes Toward Deer and Deer Management 685 Results for WMU 2F
Q85. Which social media site do you use most often? (Asked of those who use social media.)
91
5
3
1
0 20 40 60 80 100
YouTube
Other
Percent (n=195)
WMU 2F
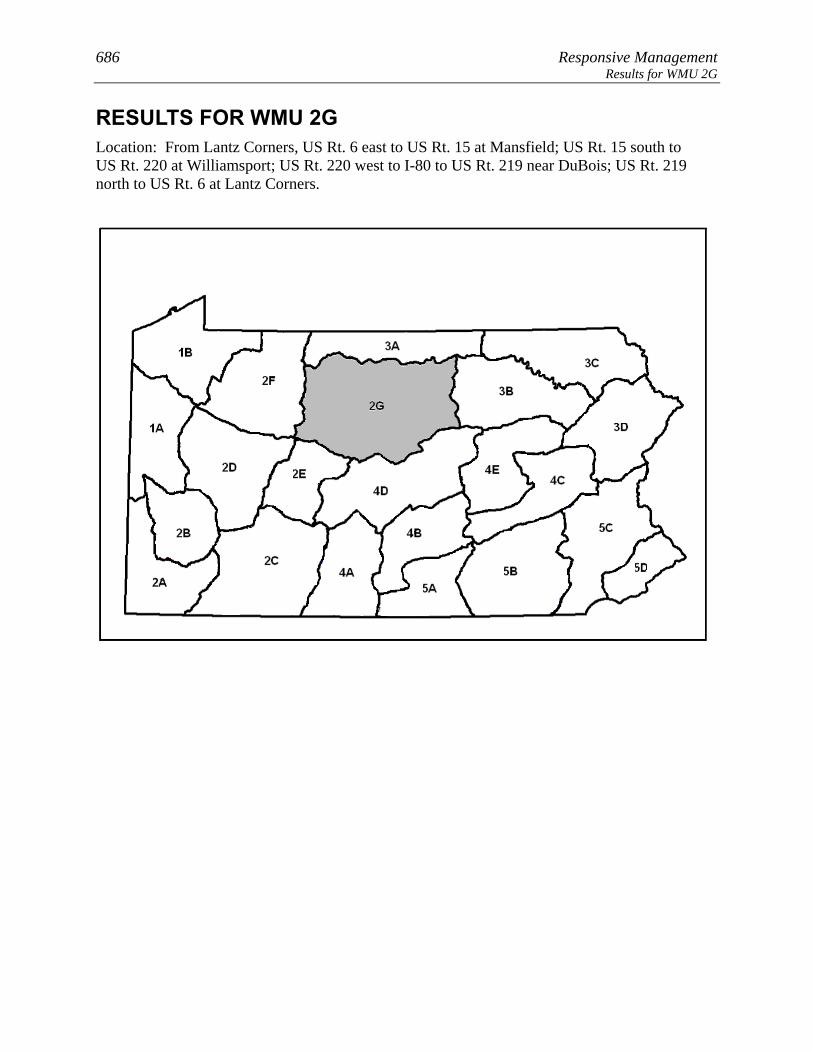
686 Responsive Management Results for WMU 2G
RESULTS FOR WMU 2G Location: From Lantz Corners, US Rt. 6 east to US Rt. 15 at Mansfield; US Rt. 15 south to US Rt. 220 at Williamsport; US Rt. 220 west to I-80 to US Rt. 219 near DuBois; US Rt. 219 north to US Rt. 6 at Lantz Corners.
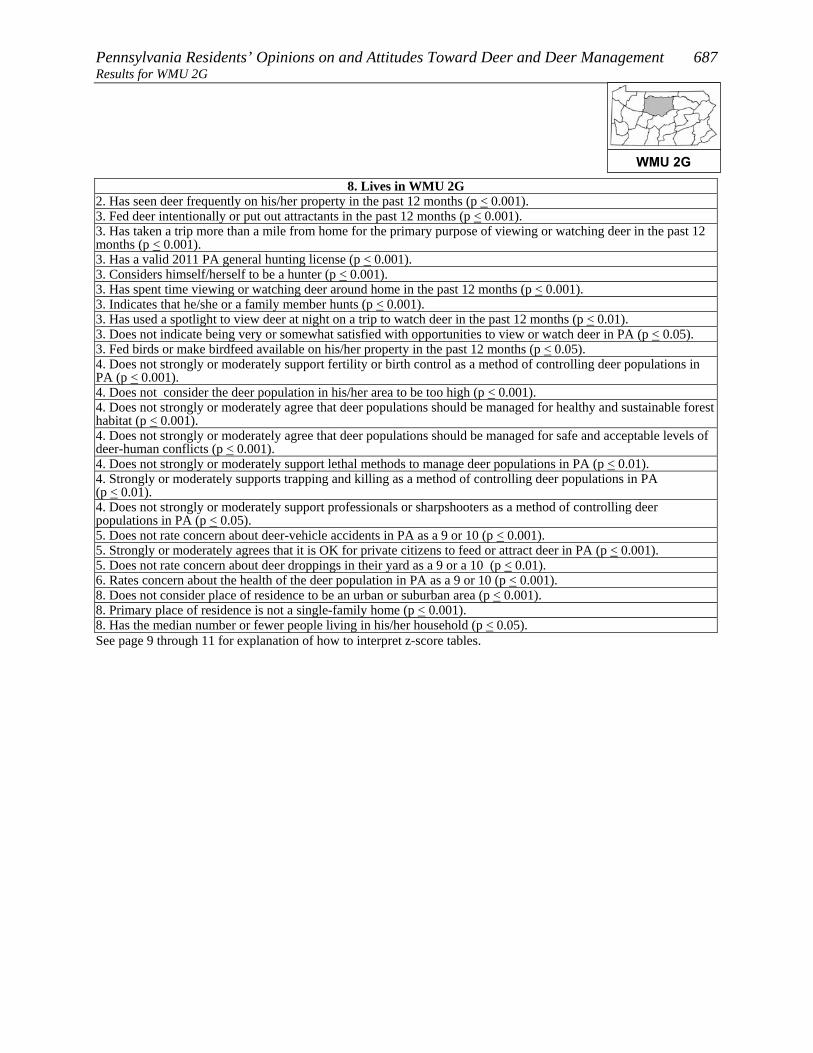
Pennsylvania Residents’ Opinions on and Attitudes Toward Deer and Deer Management 687 Results for WMU 2G
8. Lives in WMU 2G 2. Has seen deer frequently on his/her property in the past 12 months (p < 0.001). 3. Fed deer intentionally or put out attractants in the past 12 months (p < 0.001). 3. Has taken a trip more than a mile from home for the primary purpose of viewing or watching deer in the past 12 months (p < 0.001). 3. Has a valid 2011 PA general hunting license (p < 0.001). 3. Considers himself/herself to be a hunter (p < 0.001). 3. Has spent time viewing or watching deer around home in the past 12 months (p < 0.001). 3. Indicates that he/she or a family member hunts (p < 0.001). 3. Has used a spotlight to view deer at night on a trip to watch deer in the past 12 months (p < 0.01). 3. Does not indicate being very or somewhat satisfied with opportunities to view or watch deer in PA (p < 0.05). 3. Fed birds or make birdfeed available on his/her property in the past 12 months (p < 0.05). 4. Does not strongly or moderately support fertility or birth control as a method of controlling deer populations in PA (p < 0.001). 4. Does not consider the deer population in his/her area to be too high (p < 0.001). 4. Does not strongly or moderately agree that deer populations should be managed for healthy and sustainable forest habitat (p < 0.001). 4. Does not strongly or moderately agree that deer populations should be managed for safe and acceptable levels of deer-human conflicts (p < 0.001). 4. Does not strongly or moderately support lethal methods to manage deer populations in PA (p < 0.01). 4. Strongly or moderately supports trapping and killing as a method of controlling deer populations in PA (p < 0.01). 4. Does not strongly or moderately support professionals or sharpshooters as a method of controlling deer populations in PA (p < 0.05). 5. Does not rate concern about deer-vehicle accidents in PA as a 9 or 10 (p < 0.001). 5. Strongly or moderately agrees that it is OK for private citizens to feed or attract deer in PA (p < 0.001). 5. Does not rate concern about deer droppings in their yard as a 9 or a 10 (p < 0.01). 6. Rates concern about the health of the deer population in PA as a 9 or 10 (p < 0.001). 8. Does not consider place of residence to be an urban or suburban area (p < 0.001). 8. Primary place of residence is not a single-family home (p < 0.001). 8. Has the median number or fewer people living in his/her household (p < 0.05). See page 9 through 11 for explanation of how to interpret z-score tables.
WMU 2G

688 Responsive Management Results for WMU 2G
PARTICIPATION IN VIEWING DEER Nearly three-fourths of residents of WMU 2G (74%) spent time
viewing deer around their home in the past 12 months, and 43% took a
trip of at least a mile to view deer.
• Just under half of those who took a deer-viewing trip (46%) used a spotlight to view the
deer at night.
A majority of residents of WMU 2G (64%) are satisfied with opportunities to view deer in
Pennsylvania. Because a relatively large percentage answer neutrally, only 21% indicate
being dissatisfied.
WMU 2G

Pennsylvania Residents’ Opinions on and Attitudes Toward Deer and Deer Management 689 Results for WMU 2G
Q10. Have you spent time viewing or watching deer around your home in the past 12 months?
74
26
0 20 40 60 80 100
Yes
No
Percent (n=428)
WMU 2G

690 Responsive Management Results for WMU 2G
Q11. Have you taken a trip at least 1 mile from your home for the primary purpose of viewing or
watching deer in the past 12 months?
43
56
Less than 1%
0 20 40 60 80 100
Yes
No
Don't know
Percent (n=428)
WMU 2G

Pennsylvania Residents’ Opinions on and Attitudes Toward Deer and Deer Management 691 Results for WMU 2G
Q12. Did you use a spotlight to view deer at night on a trip to watch deer in the past 12 months?
(Asked of those who took a trip at least 1 mile from their home for the primary purpose of viewing or
watching deer in the past 12 months.)
46
54
0 20 40 60 80 100
Yes
No
Percent (n=208)
WMU 2G

692 Responsive Management Results for WMU 2G
Q13. How satisfied are you with opportunities to view or watch deer in Pennsylvania?
39
25
13
10
11
2
0 20 40 60 80 100
Very satisfied
Somewhatsatisfied
Neither satisfiednor dissatisfied
Somewhatdissatisfied
Very dissatisfied
Don't know
Percent (n=428)
WMU 2G

Pennsylvania Residents’ Opinions on and Attitudes Toward Deer and Deer Management 693 Results for WMU 2G OPINIONS ON DEER IN GENERAL AND THE SIZE AND HEALTH OF THE DEER HERD
Opinion on deer is mostly favorable: 73% of residents of WMU 2G
say with no caveats that they like having deer around, another 11%
like having deer around but worry about the problems they may cause,
and only 3% generally regard them as a nuisance. The remainder have
no particular feeling about deer.
Another question asked residents of WMU 2G how deer-related issues compared to other
issues in their life, on a scale of 0 to 10, with the most importance being 10: the median
rating is “5.” The most common ratings are the midpoint of “5” (22%) and “0” (17%). In
general, ratings are well spread across the scale.
Two other ratings questions asked respondents to rate their concern about deer-related issues.
The median level of concern is “6” for the quality of deer habitat in Pennsylvania and “8” for
the health of the deer population in Pennsylvania. The ratings of the latter are mostly
concentrated in the upper end of the scale.
The survey asked about the perceived size of the deer herd in the respondent’s area. The
majority of residents of WMU 2G say that the herd size is too low (55%), while the second
most common response is that it is just right (39%); only 3% say it is too high.
• Those who own their home are not markedly different from those who do not own their
home regarding their perceptions of the size of the deer population in their area.
• Those who consider themselves to be a hunter are more likely to say that the deer
population in their area is too low, compared to those who are not hunters.
WMU 2G

694 Responsive Management Results for WMU 2G
Q14. Generally, which of the following best describes your feelings about deer in
Pennsylvania?
73
11
3
12
0 20 40 60 80 100
I like having deeraround
I like having deeraround but worryabout problems
they cause
I generally regarddeer as a nuisance
I have no particularfeeling about deer
Percent (n=428)
WMU 2G
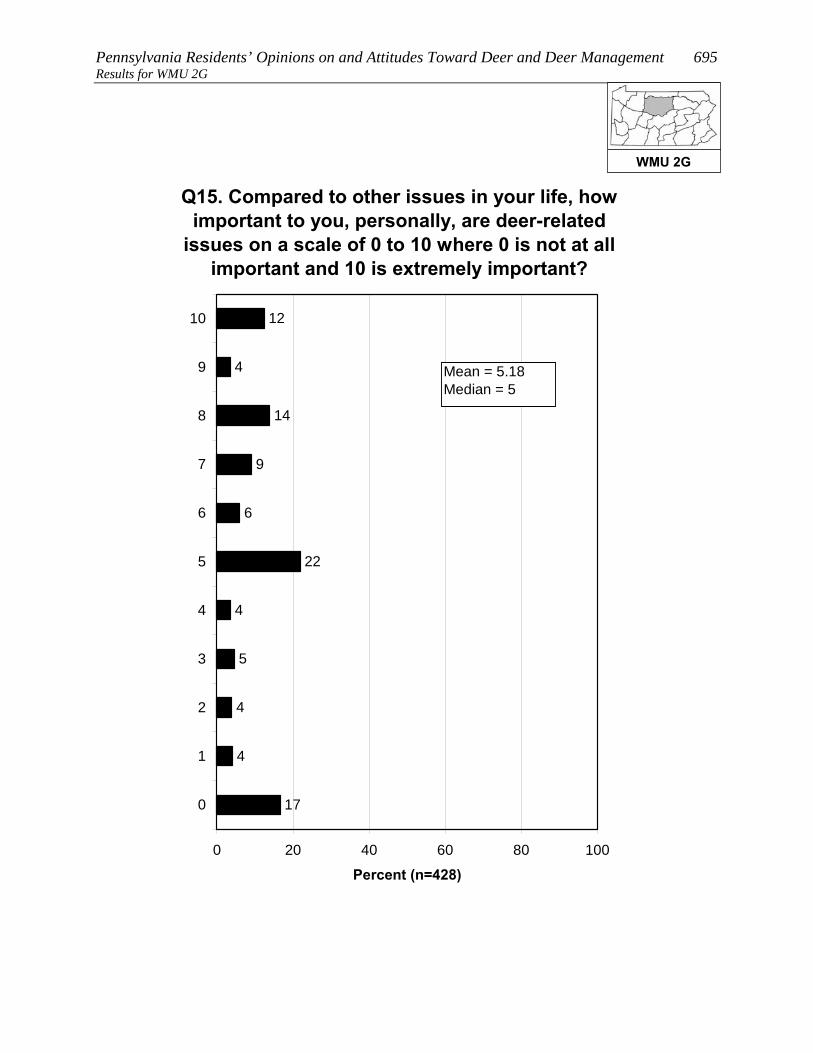
Pennsylvania Residents’ Opinions on and Attitudes Toward Deer and Deer Management 695 Results for WMU 2G
Q15. Compared to other issues in your life, how important to you, personally, are deer-related
issues on a scale of 0 to 10 where 0 is not at all important and 10 is extremely important?
17
4
22
6
9
14
4
12
4
5
4
0 20 40 60 80 100
10
9
8
7
6
5
4
3
2
1
0
Percent (n=428)
Mean = 5.18Median = 5
WMU 2G

696 Responsive Management Results for WMU 2G
Q41. How about the quality of deer habitat in Pennsylvania? (How much of a concern is this for you personally on a scale of 0 to 10 where 0 is not at all concerned and 10 is extremely concerned?)
2
3
2
17
3
18
8
8
24
2
13
1
0 20 40 60 80 100
10
9
8
7
6
5
4
3
2
1
0
Don't know
Percent (n=428)
Mean = 5.96Median = 6
WMU 2G
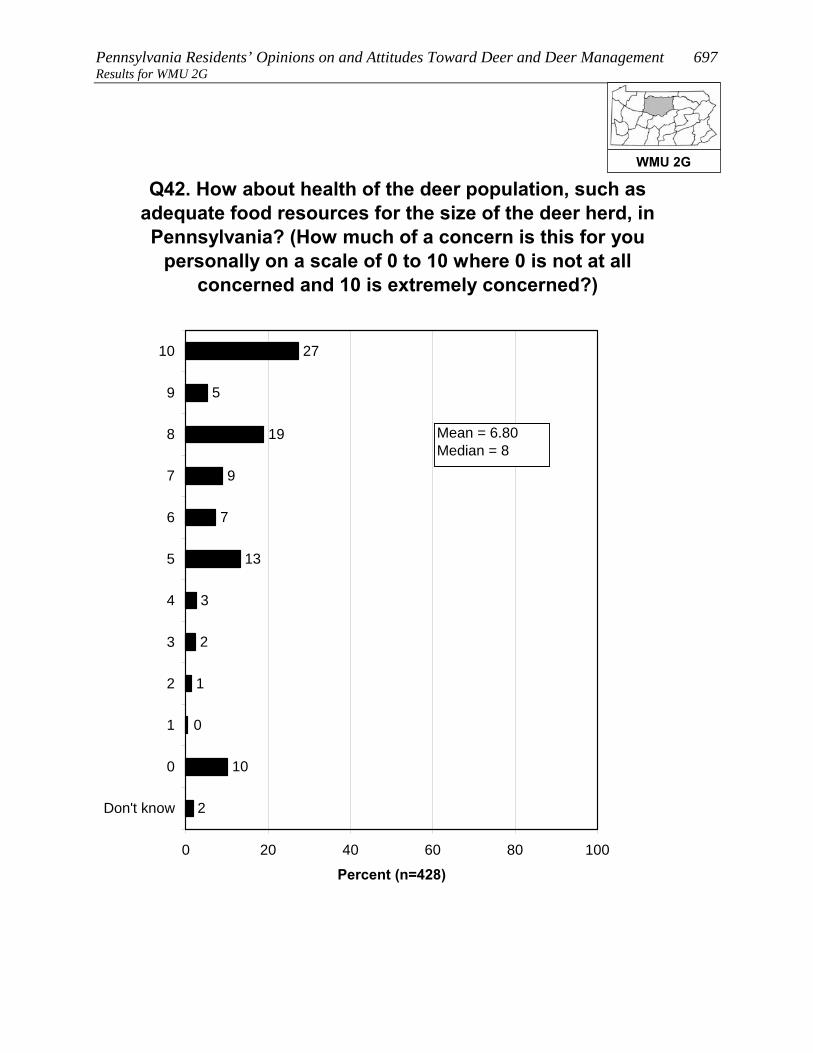
Pennsylvania Residents’ Opinions on and Attitudes Toward Deer and Deer Management 697 Results for WMU 2G
1
2
3
27
5
19
9
7
13
0
10
2
0 20 40 60 80 100
10
9
8
7
6
5
4
3
2
1
0
Don't know
Percent (n=428)
Q42. How about health of the deer population, such as adequate food resources for the size of the deer herd, in Pennsylvania? (How much of a concern is this for you
personally on a scale of 0 to 10 where 0 is not at all concerned and 10 is extremely concerned?)
Mean = 6.80Median = 8
WMU 2G

698 Responsive Management Results for WMU 2G
Q16. In your opinion, is the deer population in the area where you live too high, just right, or too low?
3
39
55
3
0 20 40 60 80 100
Too high
Just right
Too low
Don't know
Percent (n=428)
WMU 2G
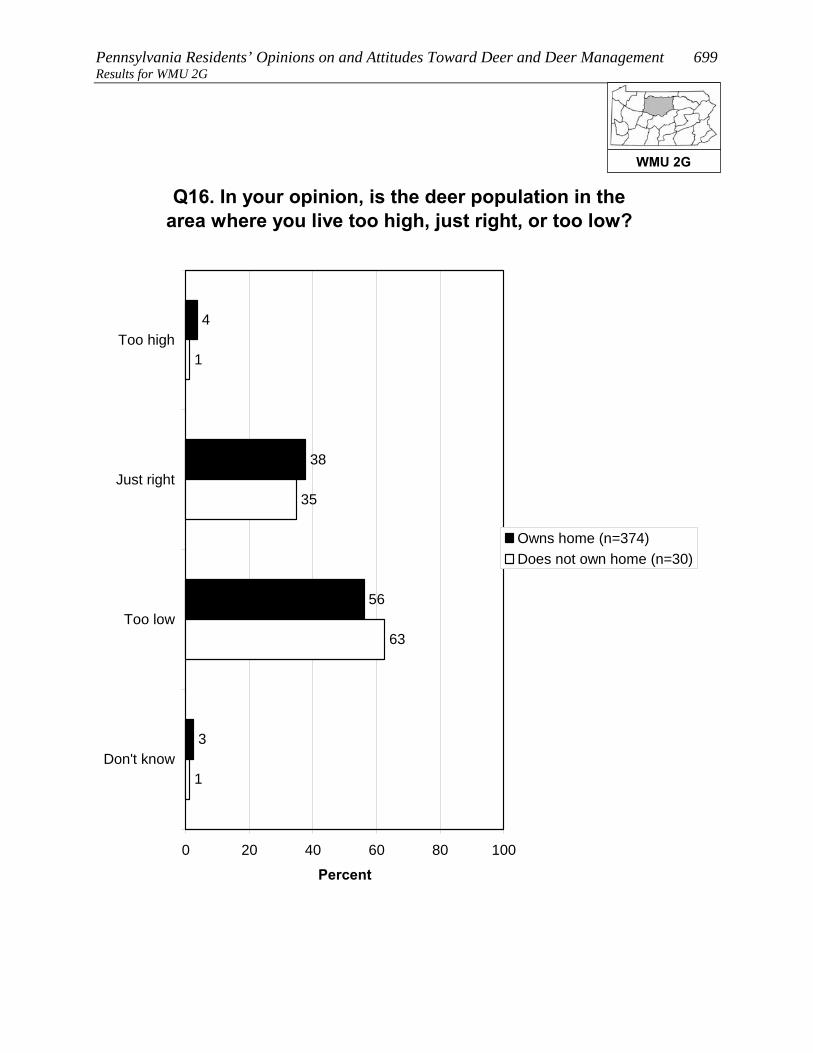
Pennsylvania Residents’ Opinions on and Attitudes Toward Deer and Deer Management 699 Results for WMU 2G
Q16. In your opinion, is the deer population in the area where you live too high, just right, or too low?
4
38
56
3
63
35
1
1
0 20 40 60 80 100
Too high
Just right
Too low
Don't know
Percent
Owns home (n=374)Does not own home (n=30)
WMU 2G

700 Responsive Management Results for WMU 2G
Q16. In your opinion, is the deer population in the area where you live too high, just right, or too low?
2
29
68
1
43
48
4
5
0 20 40 60 80 100
Too high
Just right
Too low
Don't know
Percent
Consider themselves ahunter (n=232)Do not consider themselvesa hunter (n=194)
WMU 2G

Pennsylvania Residents’ Opinions on and Attitudes Toward Deer and Deer Management 701 Results for WMU 2G OPINIONS ON MANAGEMENT EFFORTS AND MANAGEMENT GOALS
The survey asked about three deer population management goals. For
all three, a large majority agree with the management goal, with the
most support being for the ecological goals rather than the human-
centered goal: 81% agree with managing the deer for a healthy and
sustainable forest habitat and 89% agree with managing for healthy
and sustainable deer populations, while 75% agree with managing for
safe, acceptable levels of deer-human conflicts.
Residents of WMU 2G who said that the deer population in their area is too high or too low
were asked to indicate the reasonable number of years it should take to achieve an acceptable
deer population. The mean amount is 4.29 years. While 33% said that they do not know,
nearly all the rest gave a number of years of 10 or less. Note that this is only among those
who said the deer population was too high or too low.
• Because management plans typically look at a time frame of about 10 years to effect
change, the survey specifically asked if these respondents would be willing to wait
more than 10 years to achieve an acceptable deer population: just less than a majority
(48%) indicated that they would be willing to wait that long.
WMU 2G
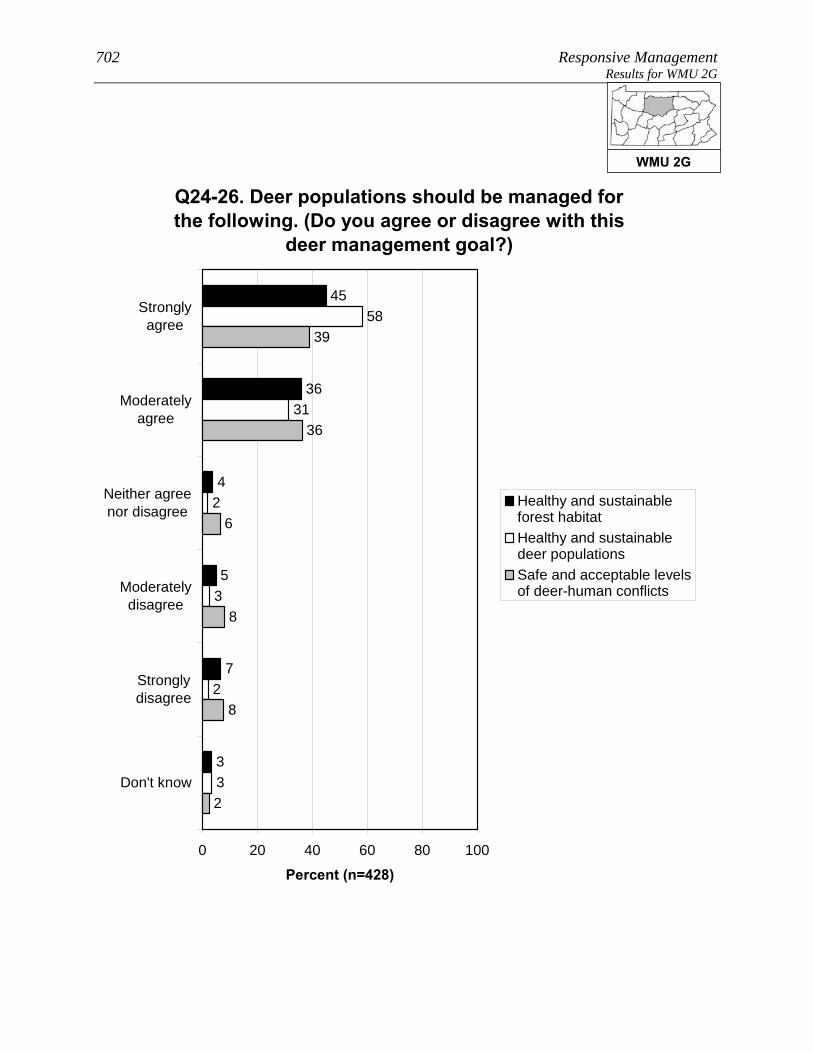
702 Responsive Management Results for WMU 2G
Q24-26. Deer populations should be managed for the following. (Do you agree or disagree with this
deer management goal?)
45
36
4
5
7
3
2
31
58
3
2
3
8
39
36
6
8
2
0 20 40 60 80 100
Stronglyagree
Moderatelyagree
Neither agreenor disagree
Moderatelydisagree
Stronglydisagree
Don't know
Percent (n=428)
Healthy and sustainableforest habitatHealthy and sustainabledeer populationsSafe and acceptable levelsof deer-human conflicts
WMU 2G
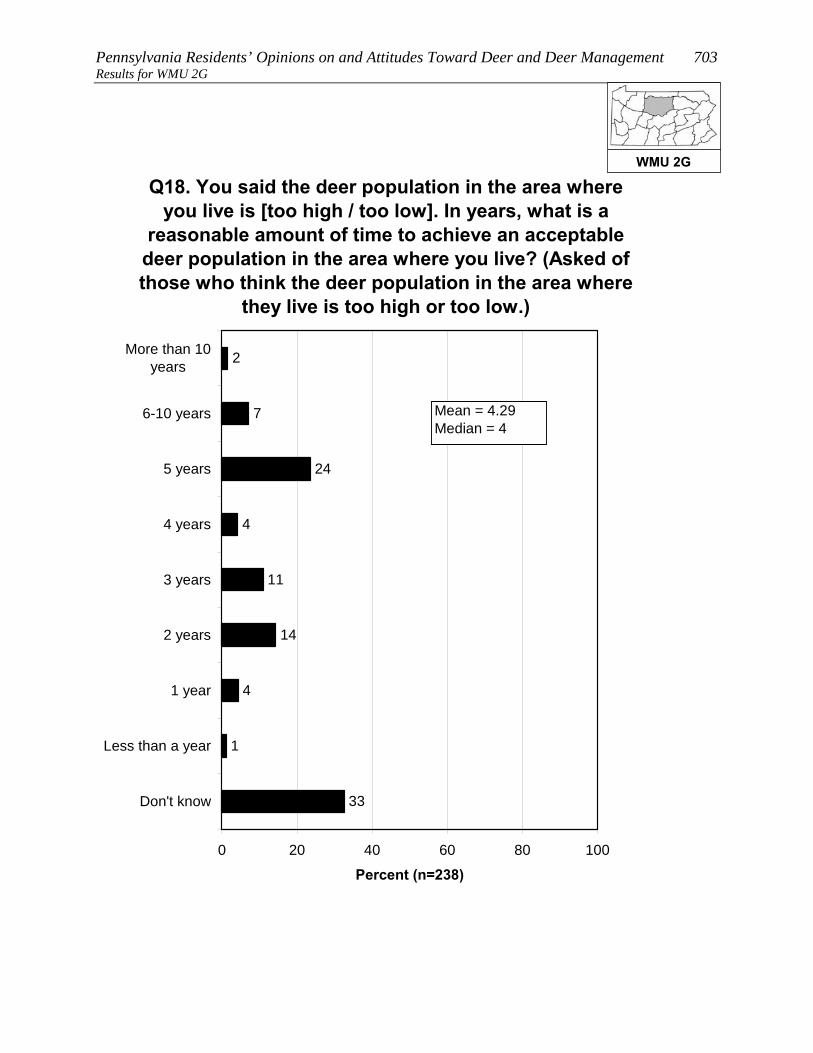
Pennsylvania Residents’ Opinions on and Attitudes Toward Deer and Deer Management 703 Results for WMU 2G
33
1
4
2
7
24
4
11
14
0 20 40 60 80 100
More than 10years
6-10 years
5 years
4 years
3 years
2 years
1 year
Less than a year
Don't know
Percent (n=238)
Q18. You said the deer population in the area where you live is [too high / too low]. In years, what is a
reasonable amount of time to achieve an acceptable deer population in the area where you live? (Asked of those who think the deer population in the area where
they live is too high or too low.)
Mean = 4.29Median = 4
WMU 2G
704 Responsive Management Results for WMU 2G
Q21. Would you be willing to wait more than 10 years to achieve an acceptable deer population in the area where you live? (Among those who think the deer population in the area where they live is
too high or too low.)
48
48
4
0 20 40 60 80 100
Yes
No
Don't know
Percent (n=238)
WMU 2G
Pennsylvania Residents’ Opinions on and Attitudes Toward Deer and Deer Management 705 Results for WMU 2G OPINIONS ON METHODS FOR MANAGING DEER, INCLUDING HUNTING
A majority of residents of WMU 2G (57%) support lethal methods to
manage deer populations in Pennsylvania; nonetheless, 34% oppose,
mostly strong opposition.
• Those residents of WMU 2G who live in a single-family home and own their home are
much less likely to strongly support lethal methods, compared to those who live in a
single-family home but do not own their home.
• The survey asked about four methods of controlling deer populations (three of them
lethal). The most support is for legal, regulated hunting (92% of respondents support
this method), distantly followed by trapping and killing (30%), professionals or
sharpshooters (26%), and fertility/birth control (18%).
Two questions asked respondents about hunting on their land (among those who live in a
single-family home), the first question about hunting by the respondents themselves (20% do
so) and the second regarding allowing others to hunt on their land (31% do so). In
combining the results, 37% of residents of WMU 2G who live in a single-family home either
hunt on their own land or allow others to do so (it is not simply a sum of the two questions
because some hunt on their property and allow others to do so as well).
• There was interest in seeing how a particular subgroup responded on this question, the
subgroup being those who live in a single-family home; who live on 1 acre or less; and
who live in an urban, suburban area, or a small city/town. Among this subgroup, 12%
either hunt on their own property or allow others to hunt on the property.
• Those respondents who do not allow hunting on their property were asked to indicate
why they prohibit it. The most common reasons are that their property is too small
and/or that they live in an urban or suburban area in which hunting is not possible or
feasible. Another common reason is concern about safety.
• Those same respondents who do not allow hunting on their property were asked about
their likelihood of ever allowing others to hunt deer on their property; they
overwhelmingly say this is very unlikely (91%). They were then asked if there is
anything that would make them more likely to allow deer hunting; they are almost
WMU 2G

706 Responsive Management Results for WMU 2G
unanimous (94%) in saying that there is nothing that would make
them more likely to allow deer hunting.
• The question about allowing others to hunt on their property was
examined among the subgroup previously discussed (those who live in a single-family
home; who live on 1 acre or less; and who live in an urban, suburban area, or a small
city/town). Among this group who got the question, nearly all say that they would
never allow hunting.
o Additional follow-up questions to be asked of those who indicated that something
might prompt them to allow hunting on their property did not have enough
respondents for statistical validity; therefore, they are not shown.
WMU 2G

Pennsylvania Residents’ Opinions on and Attitudes Toward Deer and Deer Management 707 Results for WMU 2G
Q27. In general, do you support or oppose lethal methods to manage deer populations in
Pennsylvania?
36
21
7
8
26
2
0 20 40 60 80 100
Strongly support
Moderatelysupport
Neither supportnor oppose
Moderately oppose
Strongly oppose
Don't know
Percent (n=428)
WMU 2G
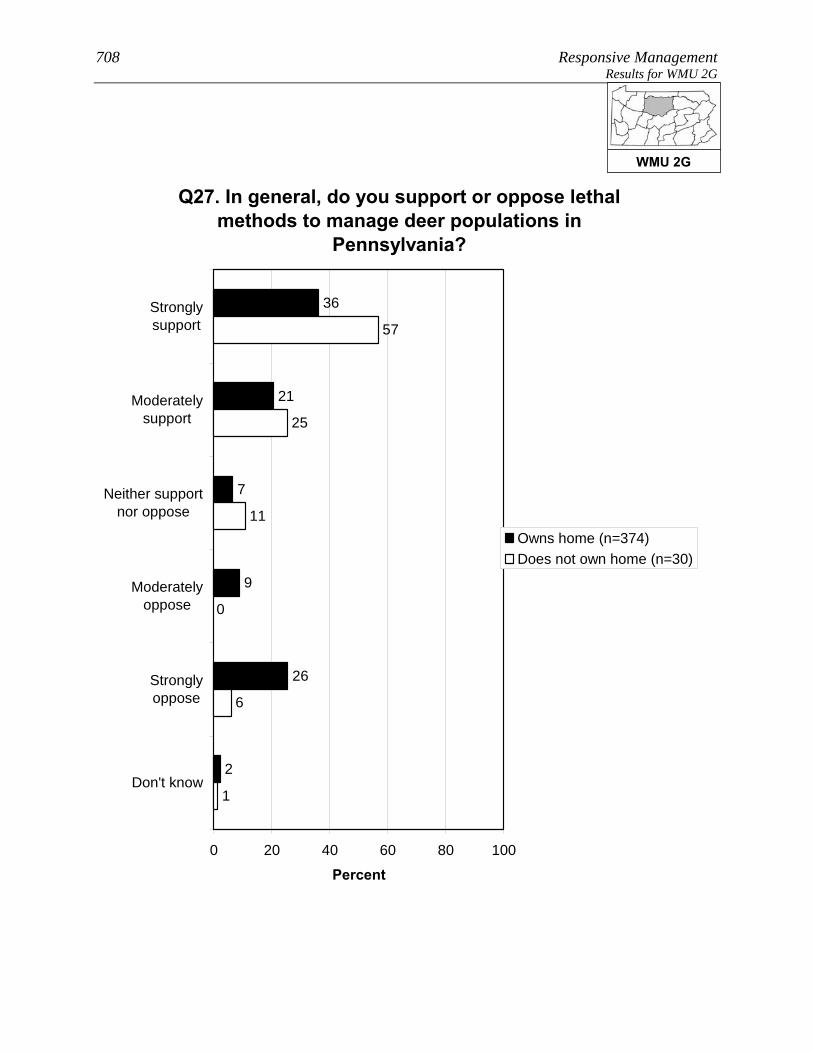
708 Responsive Management Results for WMU 2G
Q27. In general, do you support or oppose lethal methods to manage deer populations in
Pennsylvania?
36
21
7
9
26
2
11
25
57
0
6
1
0 20 40 60 80 100
Stronglysupport
Moderatelysupport
Neither supportnor oppose
Moderatelyoppose
Stronglyoppose
Don't know
Percent
Owns home (n=374)Does not own home (n=30)
WMU 2G
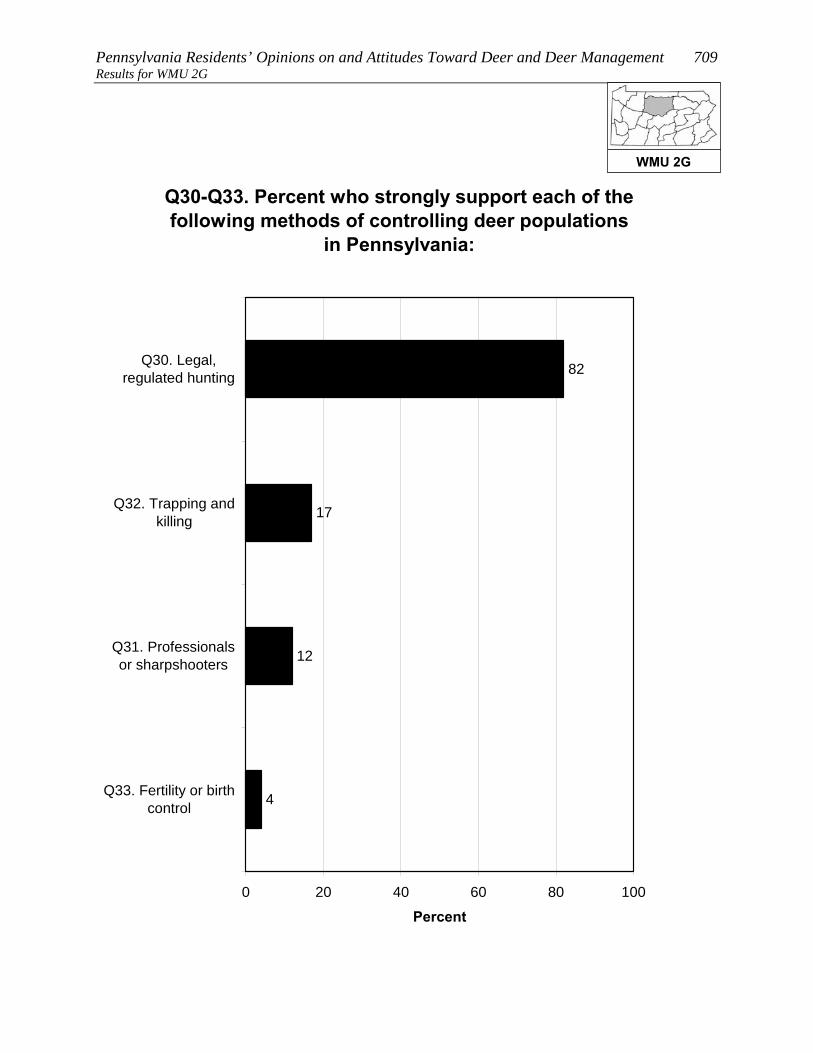
Pennsylvania Residents’ Opinions on and Attitudes Toward Deer and Deer Management 709 Results for WMU 2G
Q30-Q33. Percent who strongly support each of the following methods of controlling deer populations
in Pennsylvania:
4
12
17
82
0 20 40 60 80 100
Q30. Legal,regulated hunting
Q32. Trapping andkilling
Q31. Professionalsor sharpshooters
Q33. Fertility or birthcontrol
Percent
WMU 2G

710 Responsive Management Results for WMU 2G
Q30-Q33. Percent who strongly or moderately support each of the following methods of
controlling deer populations in Pennsylvania:
18
26
30
92
0 20 40 60 80 100
Q30. Legal,regulated hunting
Q32. Trapping andkilling
Q31. Professionalsor sharpshooters
Q33. Fertility or birthcontrol
Percent
WMU 2G
Pennsylvania Residents’ Opinions on and Attitudes Toward Deer and Deer Management 711 Results for WMU 2G
Q30-Q33. Percent who strongly or moderately oppose each of the following methods of
controlling deer populations in Pennsylvania:
7
65
70
70
0 20 40 60 80 100
Q31. Professionalsor sharpshooters
Q33. Fertility or birthcontrol
Q32. Trapping andkilling
Q30. Legal,regulated hunting
Percent
WMU 2G

712 Responsive Management Results for WMU 2G
Q30-Q33. Percent who strongly oppose each of the following methods of controlling deer populations
in Pennsylvania:
6
55
59
61
0 20 40 60 80 100
Q33. Fertility or birthcontrol
Q31. Professionalsor sharpshooters
Q32. Trapping andkilling
Q30. Legal,regulated hunting
Percent
WMU 2G

Pennsylvania Residents’ Opinions on and Attitudes Toward Deer and Deer Management 713 Results for WMU 2G
Q59/60. Deer hunts and/or allows others to deer hunt on property. (Among respondents living in a
single-family home.)
37
63
0 20 40 60 80 100
Yes
No
Percent (n=404)
WMU 2G
714 Responsive Management Results for WMU 2G
Q59/60. Deer hunts and/or allows others to deer hunt on property. (Among respondents living in a
single-family home.)
12
88
0 20 40 60 80 100
Yes
No
Percent
Lives in a single familyhome on 1 acre or less inan urban area, a suburbanarea, or a small city/town(n=97)
WMU 2G
Pennsylvania Residents’ Opinions on and Attitudes Toward Deer and Deer Management 715 Results for WMU 2G
Q63. What are the main reasons you do not allow others to hunt deer on your property? (Asked of
those whose primary place of residence is a single-family home and who do not allow others to hunt
deer on their property.)
1
2
47
40
15
4
3
3
0 20 40 60 80 100
Property is too small / neighbors too close
Live in residential neighborhood /suburban or urban area
Concerned about safety
Want to save hunting opportunities forself / family
Liability
Not enough deer on property / not enoughhabitat
Oppose hunting in general
Live on rented property
Mul
tiple
Res
pons
es A
llow
ed
Percent (n=274)
WMU 2G

716 Responsive Management Results for WMU 2G
Q65. How likely are you to ever allow others to deer hunt on your property? (Asked of those whose
primary place of residence is a single-family home and who do not allow others to hunt deer on their
property.)
1
2
4
91
3
0 20 40 60 80 100
Very likely
Somewhat likely
Somewhat unlikely
Very unlikely
Don't know
Percent (n=274)
WMU 2G

Pennsylvania Residents’ Opinions on and Attitudes Toward Deer and Deer Management 717 Results for WMU 2G
Q66. Is there anything that would make you more likely to allow deer hunting on your property?
(Asked of those whose primary place of residence is a single-family home and who do not allow
others to hunt deer on their property.)
3
94
3
0 20 40 60 80 100
Yes
No
Don't know
Percent (n=274)
WMU 2G

718 Responsive Management Results for WMU 2G
Q65. How likely are you to ever allow others to deer hunt on your property? (Asked of those whose
primary place of residence is a single-family home and who do not allow others to hunt deer on their
property.)
1
0
1
98
0 20 40 60 80 100
Very likely
Somewhatlikely
Somewhatunlikely
Very unlikely
Percent
Lives in a single familyhome on 1 acre or less inan urban area, a suburbanarea, or a small city/town(n=87)
WMU 2G
Pennsylvania Residents’ Opinions on and Attitudes Toward Deer and Deer Management 719 Results for WMU 2G CONCERNS ABOUT DEER AND DEER NUISANCE PROBLEMS
Seven questions asked about respondents’ level of concern about
issues associated with deer. For each issue, respondents rated their
level of concern about it using a 10-point scale, with 10 being the most
concerned.
• The most concern was for tick-borne diseases (mean rating of 7.3) and the health of the
deer population (6.8), followed by two more whose means are just under those top two:
the quality of deer habitat (6.0) and deer-vehicle accidents (5.1).
• At the bottom are concern about deer impacts on habitat and other wildlife (even
though this can be considerable) (2.5) and the two impacts to residents’ landscaping:
deer damage to plants and landscaping (1.8) and deer droppings in the yard (0.8).
o Another graph shows the percentage who gave a high rating (a “9” or “10”),
providing an idea of the percentage who feel strongly about the issues.
Among residents of WMU 2G, 84% indicated that they saw deer on their property in the past
12 months.
• Respondents who fed birds were more likely to indicate seeing deer, as were
respondents who fed deer or put out attractants or were aware of neighbors who fed
deer or put out attractants.
The survey asked about specific nuisance problems with deer that residents of WMU 2G may
have experienced: 8% indicated that they experienced problems with deer at their primary
place of residence in the past 12 months; 15% indicated that they or another household
member had been in a vehicle collision with a deer (fortunately, a very low portion of
drivers/passengers were injured); and 5% indicated that they or a household member had
been diagnosed with a tick-borne disease.
• Crosstabulations show that those who fed birds were slightly less likely to have
experienced deer problems. Also, those who were aware of neighbors feeding deer or
putting out attractants were less likely to experience deer problems.
WMU 2G

720 Responsive Management Results for WMU 2G
Q36-Q42. Mean rating of respondents' concern about each of the following on a 10-point scale:
1.8
2.5
5.1
6.0
6.8
7.3
0.8
0 2 4 6 8 10
Q36. Tick-borne diseases, such as Lymedisease, in Pennsylvania
Q42. The health of the deer population,such as adequate food resources for the
size of the deer herd, in Pennsylvania
Q41. The quality of deer habitat inPennsylvania
Q40. Deer-vehicle accidents inPennsylvania
Q39. Deer impacts on the habitat andother wildlife in Pennsylvania
Q38. Deer damage to plants andlandscaping in his/her yard
Q37. Deer droppings in his/her yard
Mean
WMU 2G
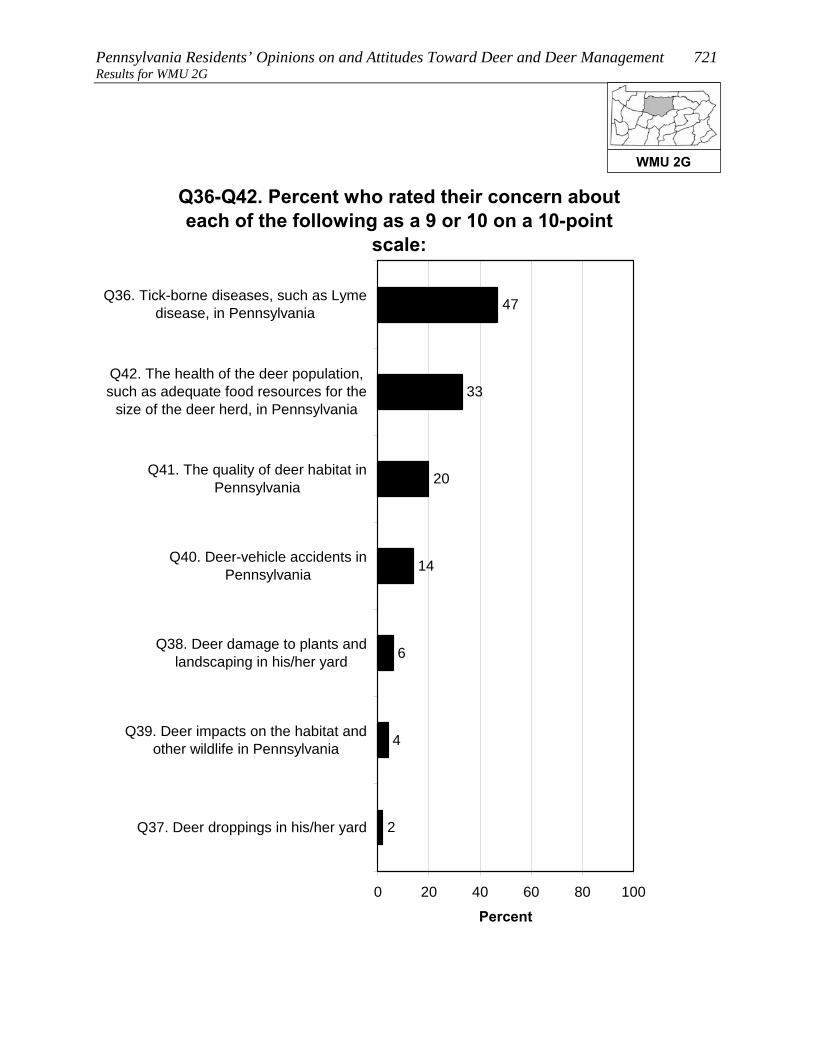
Pennsylvania Residents’ Opinions on and Attitudes Toward Deer and Deer Management 721 Results for WMU 2G
Q36-Q42. Percent who rated their concern about each of the following as a 9 or 10 on a 10-point
scale:
4
6
14
20
33
47
2
0 20 40 60 80 100
Q36. Tick-borne diseases, such as Lymedisease, in Pennsylvania
Q42. The health of the deer population,such as adequate food resources for the
size of the deer herd, in Pennsylvania
Q41. The quality of deer habitat inPennsylvania
Q40. Deer-vehicle accidents inPennsylvania
Q38. Deer damage to plants andlandscaping in his/her yard
Q39. Deer impacts on the habitat andother wildlife in Pennsylvania
Q37. Deer droppings in his/her yard
Percent
WMU 2G

722 Responsive Management Results for WMU 2G
Q49. How often have you seen deer on your property in the past 12 months?
46
18
20
16
0 20 40 60 80 100
Frequently
Sometimes
Rarely
Never
Percent (n=428)
WMU 2G

Pennsylvania Residents’ Opinions on and Attitudes Toward Deer and Deer Management 723 Results for WMU 2G
Q49. How often have you seen deer on your property in the past 12 months?
47
21
20
13
20
16
46
19
0 20 40 60 80 100
Frequently
Sometimes
Rarely
Never
Percent
Fed birds on his / herproperty in the past 12months (n=219)Did not feed birds on his /her property in the past 12months (n=208)
WMU 2G
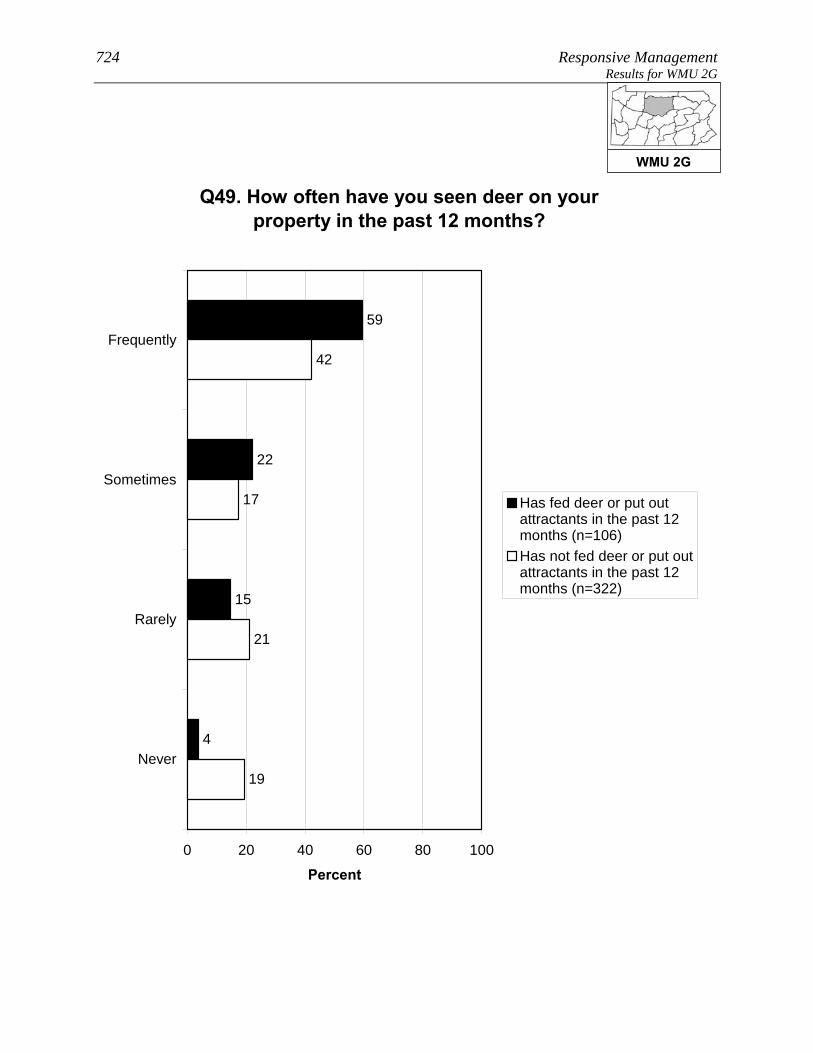
724 Responsive Management Results for WMU 2G
Q49. How often have you seen deer on your property in the past 12 months?
59
22
15
4
21
17
42
19
0 20 40 60 80 100
Frequently
Sometimes
Rarely
Never
Percent
Has fed deer or put outattractants in the past 12months (n=106)Has not fed deer or put outattractants in the past 12months (n=322)
WMU 2G

Pennsylvania Residents’ Opinions on and Attitudes Toward Deer and Deer Management 725 Results for WMU 2G
Q49. How often have you seen deer on your property in the past 12 months?
53
19
14
14
21
18
44
17
0 20 40 60 80 100
Frequently
Sometimes
Rarely
Never
Percent
Is aware of neighborsfeeding deer or putting outattractants (n=96)Is not aware of neighborsfeeding deer or putting outattractants (n=323)
WMU 2G

726 Responsive Management Results for WMU 2G
Q43. In the past 12 months, have you experienced any problems with deer at your primary place of
residence?
8
92
0 20 40 60 80 100
Yes
No
Percent (n=428)
WMU 2G

Pennsylvania Residents’ Opinions on and Attitudes Toward Deer and Deer Management 727 Results for WMU 2G
Q43. In the past 12 months, have you experienced any problems with deer at your primary place of
residence?
5
95
89
11
0 20 40 60 80 100
Yes
No
Percent
Fed birds on his / herproperty in the past 12months (n=219)Did not feed birds on his /her property in the past 12months (n=208)
WMU 2G
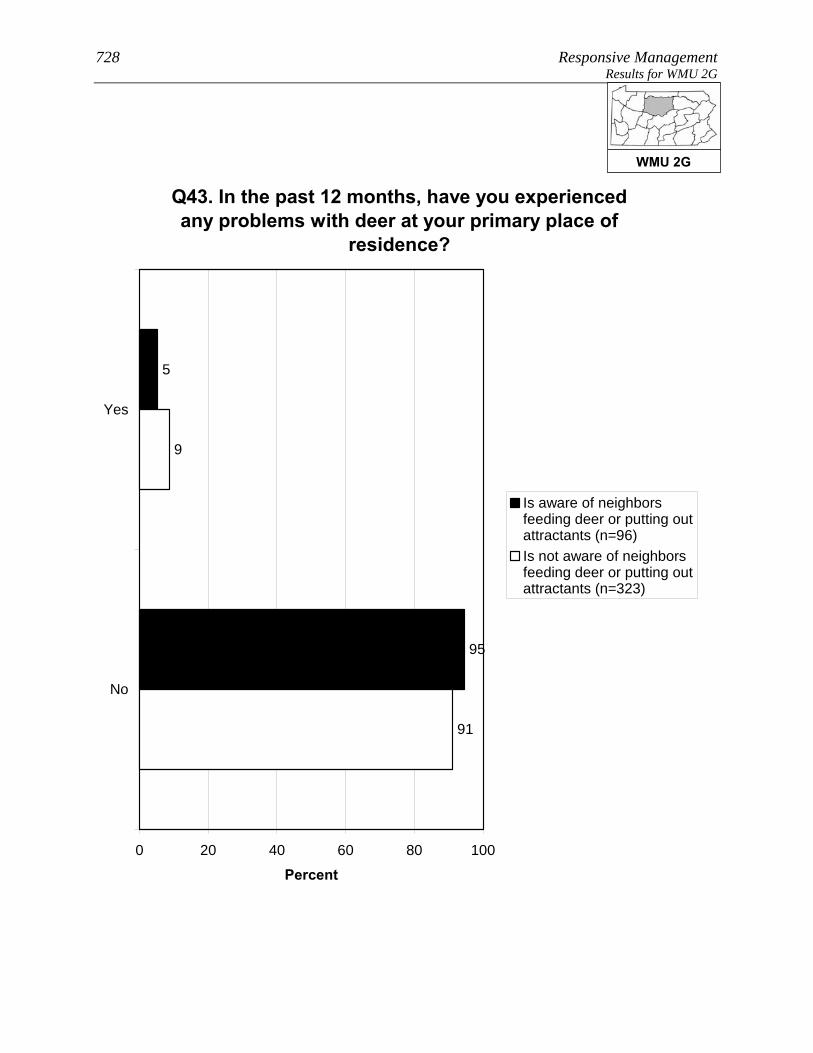
728 Responsive Management Results for WMU 2G
Q43. In the past 12 months, have you experienced any problems with deer at your primary place of
residence?
5
95
91
9
0 20 40 60 80 100
Yes
No
Percent
Is aware of neighborsfeeding deer or putting outattractants (n=96)Is not aware of neighborsfeeding deer or putting outattractants (n=323)
WMU 2G

Pennsylvania Residents’ Opinions on and Attitudes Toward Deer and Deer Management 729 Results for WMU 2G
Q44. In the past 12 months, have you or any other person living in your immediate household been in a vehicle collision with or an accident involving a
deer on Pennsylvania's roads or highways?
15
85
0 20 40 60 80 100
Yes
No
Percent (n=428)
WMU 2G

730 Responsive Management Results for WMU 2G
Q45. Were you or anyone else injured? (Asked of those who had a household member who was in or
who have personally been in a vehicle collision with or an accident involving a deer on
Pennsylvania's roads or highways in the past 12 months.)
2
98
0 20 40 60 80 100
Yes
No
Percent (n=62)
WMU 2G
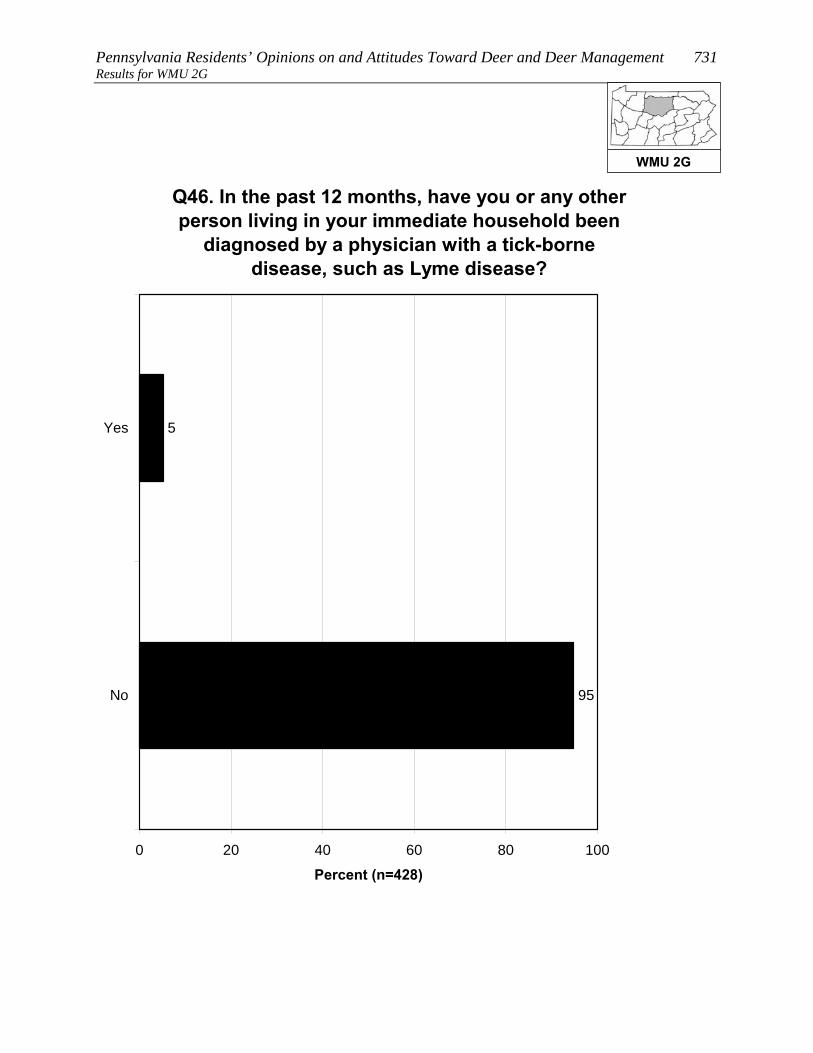
Pennsylvania Residents’ Opinions on and Attitudes Toward Deer and Deer Management 731 Results for WMU 2G
Q46. In the past 12 months, have you or any other person living in your immediate household been
diagnosed by a physician with a tick-borne disease, such as Lyme disease?
5
95
0 20 40 60 80 100
Yes
No
Percent (n=428)
WMU 2G
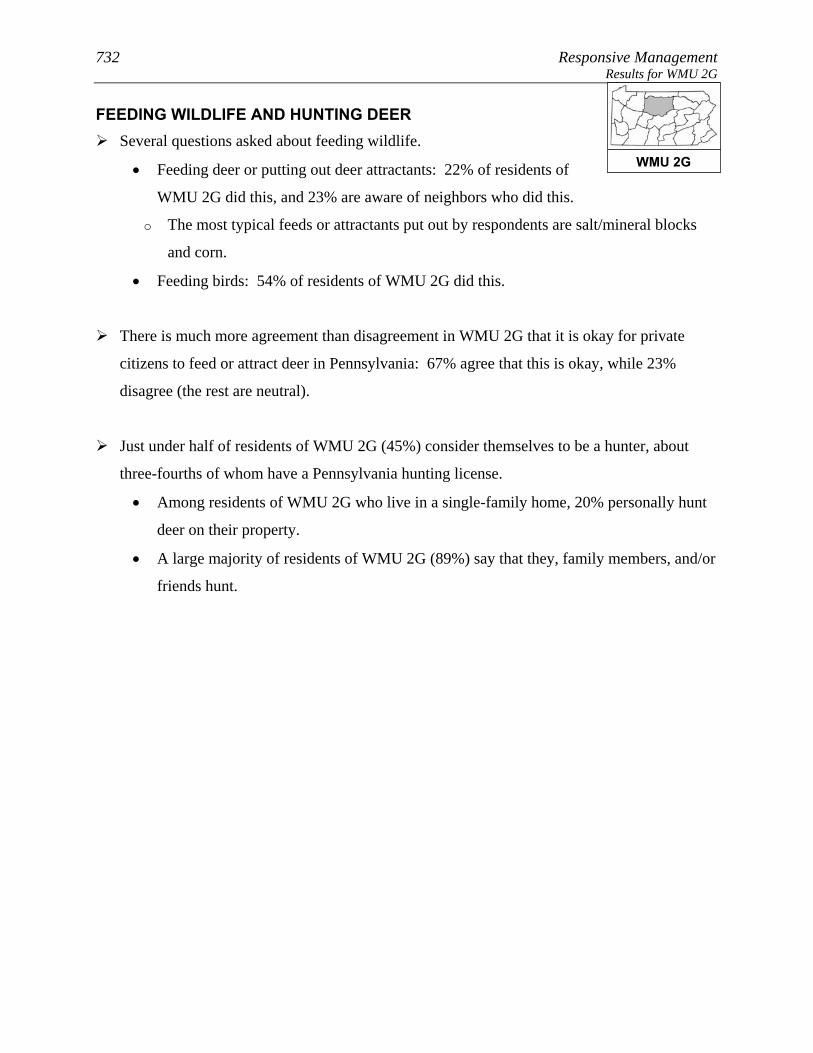
732 Responsive Management Results for WMU 2G
FEEDING WILDLIFE AND HUNTING DEER Several questions asked about feeding wildlife.
• Feeding deer or putting out deer attractants: 22% of residents of
WMU 2G did this, and 23% are aware of neighbors who did this.
o The most typical feeds or attractants put out by respondents are salt/mineral blocks
and corn.
• Feeding birds: 54% of residents of WMU 2G did this.
There is much more agreement than disagreement in WMU 2G that it is okay for private
citizens to feed or attract deer in Pennsylvania: 67% agree that this is okay, while 23%
disagree (the rest are neutral).
Just under half of residents of WMU 2G (45%) consider themselves to be a hunter, about
three-fourths of whom have a Pennsylvania hunting license.
• Among residents of WMU 2G who live in a single-family home, 20% personally hunt
deer on their property.
• A large majority of residents of WMU 2G (89%) say that they, family members, and/or
friends hunt.
WMU 2G

Pennsylvania Residents’ Opinions on and Attitudes Toward Deer and Deer Management 733 Results for WMU 2G
Q50. Did you ever feed deer intentionally or put out attractants, such as a salt or mineral block, in the
past 12 months?
22
78
0 20 40 60 80 100
Yes
No
Percent (n=428)
WMU 2G

734 Responsive Management Results for WMU 2G
Q55. Are you aware of any of your neighbors feeding deer intentionally or trying to attract deer
on their property in the past 12 months?
23
75
2
0 20 40 60 80 100
Yes
No
Don't know
Percent (n=428)
WMU 2G

Pennsylvania Residents’ Opinions on and Attitudes Toward Deer and Deer Management 735 Results for WMU 2G
Q53. What type of feed or attractant did you use? (Asked of those who fed deer intentionally or put
out attractants in the past 12 months.)
1
1
1
61
51
8
8
8
3
0 20 40 60 80 100
Salt / mineralblock
Corn
Pellets /commercial
feed
Apples
Birdseed
Other foodproducts
Food plot
Horse feed
Don't know
Mul
tiple
Res
pons
es A
llow
ed
Percent (n=106)
WMU 2G

736 Responsive Management Results for WMU 2G
Q48. Did you feed birds or make birdfeed available on your property in the past 12 months?
54
46
0 20 40 60 80 100
Yes
No
Percent (n=428)
WMU 2G

Pennsylvania Residents’ Opinions on and Attitudes Toward Deer and Deer Management 737 Results for WMU 2G
Q56. Do you agree or disagree that it is OK for private citizens to feed or attract deer in
Pennsylvania?
42
25
7
8
15
2
0 20 40 60 80 100
Strongly agree
Moderately agree
Neither agree nordisagree
Moderatelydisagree
Strongly disagree
Don't know
Percent (n=428)
WMU 2G

738 Responsive Management Results for WMU 2G
Q59. Do you personally hunt deer on your property? (Asked of those whose primary place of
residence is a single-family home.)
20
79
Less than 1%
0 20 40 60 80 100
Yes
No
Don't know
Percent (n=404)
WMU 2G

Pennsylvania Residents’ Opinions on and Attitudes Toward Deer and Deer Management 739 Results for WMU 2G
Q79. Do you, any of your family members, or any friends hunt any wildlife species?
89
9
2
0 20 40 60 80 100
Yes
No
Don't know
Percent (n=428)
WMU 2G
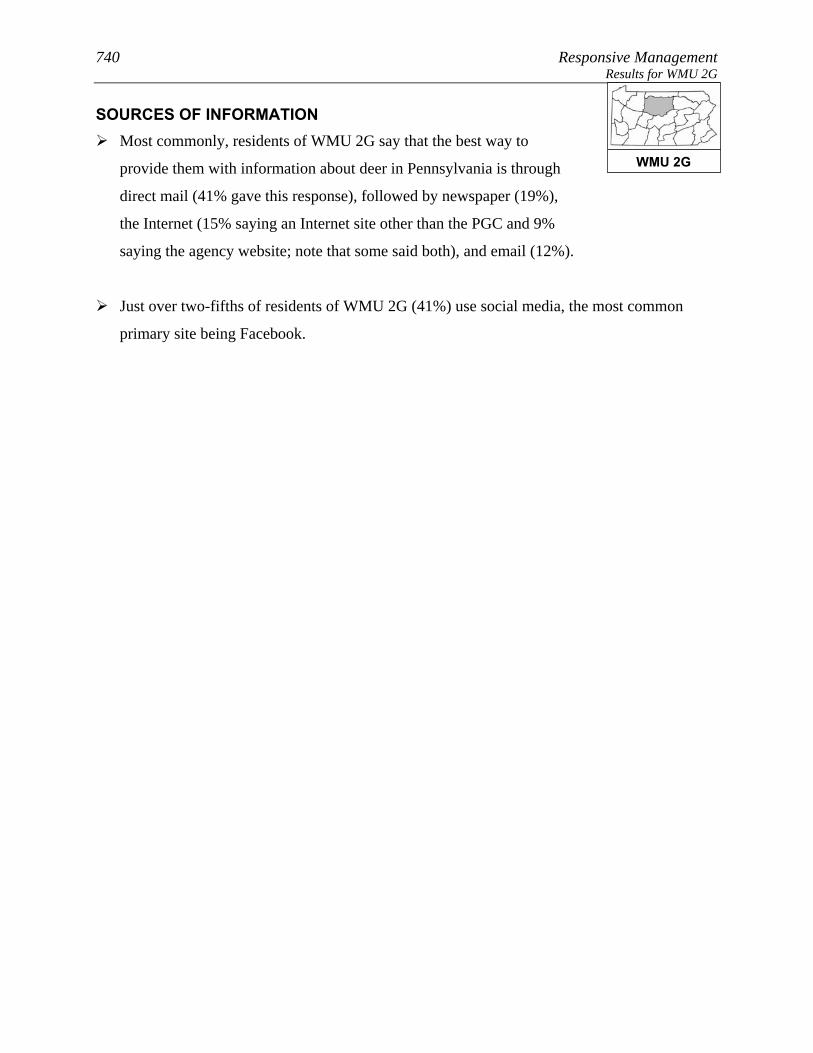
740 Responsive Management Results for WMU 2G
SOURCES OF INFORMATION Most commonly, residents of WMU 2G say that the best way to
provide them with information about deer in Pennsylvania is through
direct mail (41% gave this response), followed by newspaper (19%),
the Internet (15% saying an Internet site other than the PGC and 9%
saying the agency website; note that some said both), and email (12%).
Just over two-fifths of residents of WMU 2G (41%) use social media, the most common
primary site being Facebook.
WMU 2G

Pennsylvania Residents’ Opinions on and Attitudes Toward Deer and Deer Management 741 Results for WMU 2G
Q82. What is the best way to provide you with information about deer in Pennsylvania? We are not sending out information at this time; we are
just measuring interest.
7
3
5
7
41
19
15
12
9
9
2
1
1
1
1
1
0 20 40 60 80 100
Direct mail
NewspaperInternet / website other than PGC
websiteEmail
TV
PA Game Commission website
Brochures or pamphlets
Magazines
PA Hunting and Trapping Digest
Radio
PA Game Commission offices
Public presentations
Social media
Telephone
Other
Don't know
Mul
tiple
Res
pons
es A
llow
ed
Percent (n=428)
WMU 2G
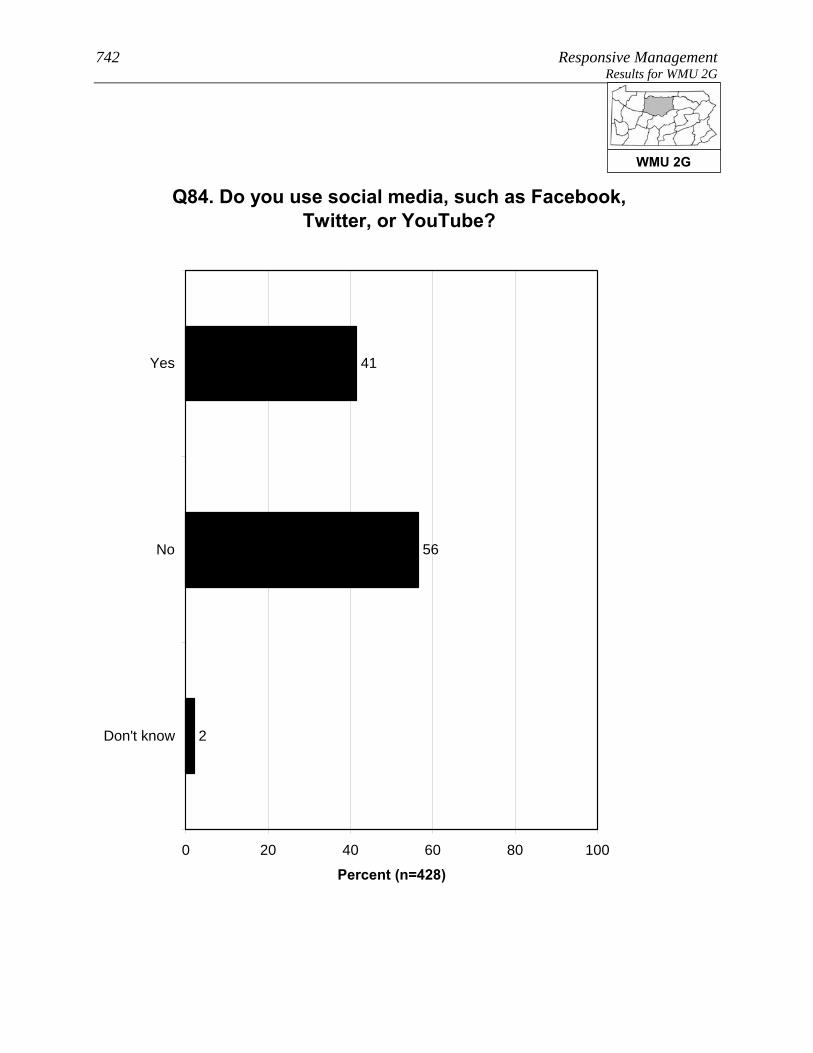
742 Responsive Management Results for WMU 2G
Q84. Do you use social media, such as Facebook, Twitter, or YouTube?
41
56
2
0 20 40 60 80 100
Yes
No
Don't know
Percent (n=428)
WMU 2G

Pennsylvania Residents’ Opinions on and Attitudes Toward Deer and Deer Management 743 Results for WMU 2G
Q85. Which social media site do you use most often? (Asked of those who use social media.)
94
4
1
1
0 20 40 60 80 100
YouTube
Other
Percent (n=201)
WMU 2G
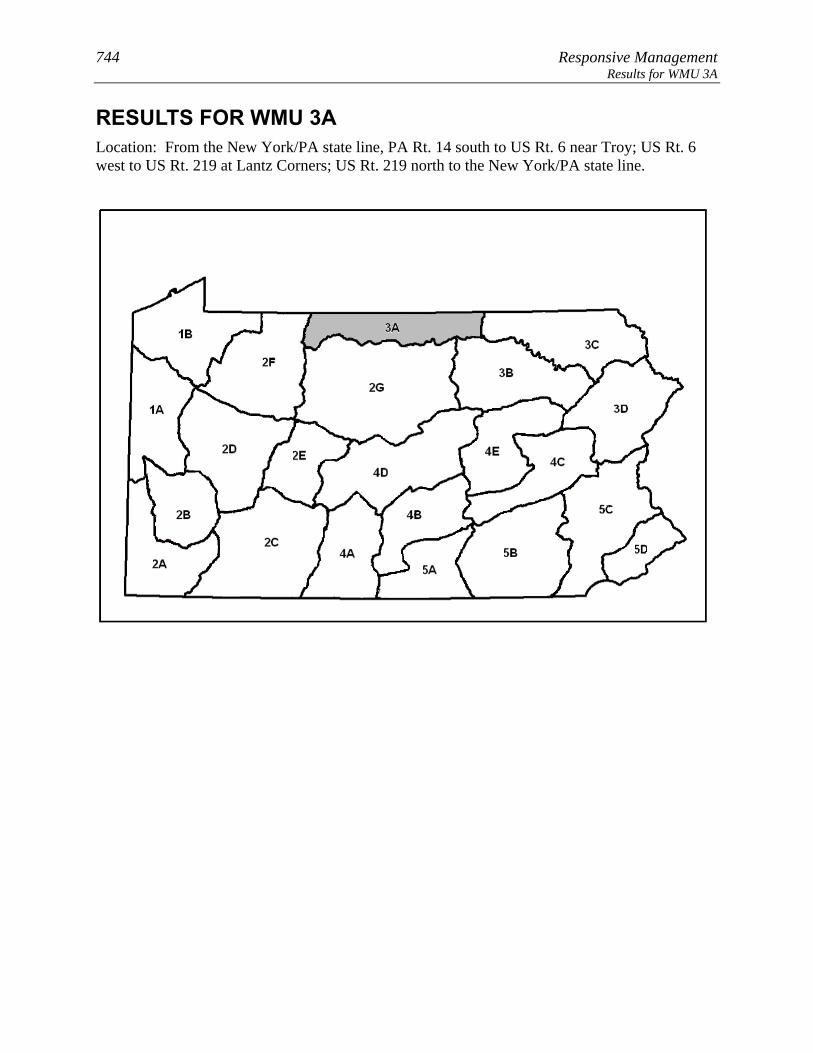
744 Responsive Management Results for WMU 3A
RESULTS FOR WMU 3A Location: From the New York/PA state line, PA Rt. 14 south to US Rt. 6 near Troy; US Rt. 6 west to US Rt. 219 at Lantz Corners; US Rt. 219 north to the New York/PA state line.

Pennsylvania Residents’ Opinions on and Attitudes Toward Deer and Deer Management 745 Results for WMU 3A
8. Lives in WMU 3A 1. Considers deer-related issues as a 9 or 10 in importance as compared to other issues in his/her life (p < 0.001). 3. Does not indicate being very or somewhat satisfied with opportunities to view or watch deer in PA (p < 0.001). 3. Considers himself/herself to be a hunter (p < 0.001). 3. Has taken a trip more than a mile from home for the primary purpose of viewing or watching deer in the past 12 months (p < 0.001). 3. Has a valid 2011 PA general hunting license (p < 0.001). 3. Has spent time viewing or watching deer around home in the past 12 months (p < 0.001). 3. Indicates that he/she or a family member hunts (p < 0.001). 4. Does not consider the deer population in his/her area to be too high (p < 0.001). 4. Does not strongly or moderately support professionals or sharpshooters as a method of controlling deer populations in PA (p < 0.001). 4. Does not strongly or moderately support fertility or birth control as a method of controlling deer populations in PA (p < 0.001). 4. Does not strongly or moderately agree that deer populations should be managed for healthy and sustainable forest habitat (p < 0.001). 4. Does not strongly or moderately agree that deer populations should be managed for safe and acceptable levels of deer-human conflicts (p < 0.01). 4. Does not strongly or moderately agree that deer populations should be managed for healthy and sustainable deer populations (p < 0.01). 4. Does not strongly or moderately support lethal methods to manage deer populations in PA (p < 0.05). 5. Does not rate concern about tick-borne diseases in PA as a 9 or a 10 (p < 0.001). 5. Does not rate concern about deer-vehicle accidents in PA as a 9 or 10 (p < 0.001). 5. Does not indicate having experienced any problems with deer at his/her primary place of residence in the past 12 months (p < 0.001). 5. Does not rate concern about deer damage to plants and landscaping in their yard as a 9 or 10 (p < 0.01). 5. Strongly or moderately agrees that it is OK for private citizens to feed or attract deer in PA (p < 0.01). 6. Rates concern about the health of the deer population in PA as a 9 or 10 (p < 0.01). 6. Rates concern about the quality of deer habitat in PA as a 9 or 10 (p < 0.05). 7. Does not indicate using social media, such as Facebook, Twitter, or YouTube (p < 0.001). 7. Does not indicate using Facebook (including not using any social media) (p < 0.01). 8. Does not consider place of residence to be an urban or suburban area (p < 0.001). 8. Has the median number or fewer people living in his/her household (p < 0.05). 8. Primary place of residence is not a single-family home (p < 0.05). See page 9 through 11 for explanation of how to interpret z-score tables.
WMU 3A

746 Responsive Management Results for WMU 3A
PARTICIPATION IN VIEWING DEER A large majority of residents of WMU 3A (70%) spent time viewing
deer around their home in the past 12 months, and 43% took a trip of
at least a mile to view deer.
• A little more than a third of those who took a deer-viewing trip (37%) used a spotlight
to view the deer at night.
A majority of residents of WMU 3A (53%) are satisfied with opportunities to view deer in
Pennsylvania, while 31% indicate being dissatisfied. The remainder are neutral.
WMU 3A

Pennsylvania Residents’ Opinions on and Attitudes Toward Deer and Deer Management 747 Results for WMU 3A
Q10. Have you spent time viewing or watching deer around your home in the past 12 months?
70
30
0 20 40 60 80 100
Yes
No
Percent (n=416)
WMU 3A
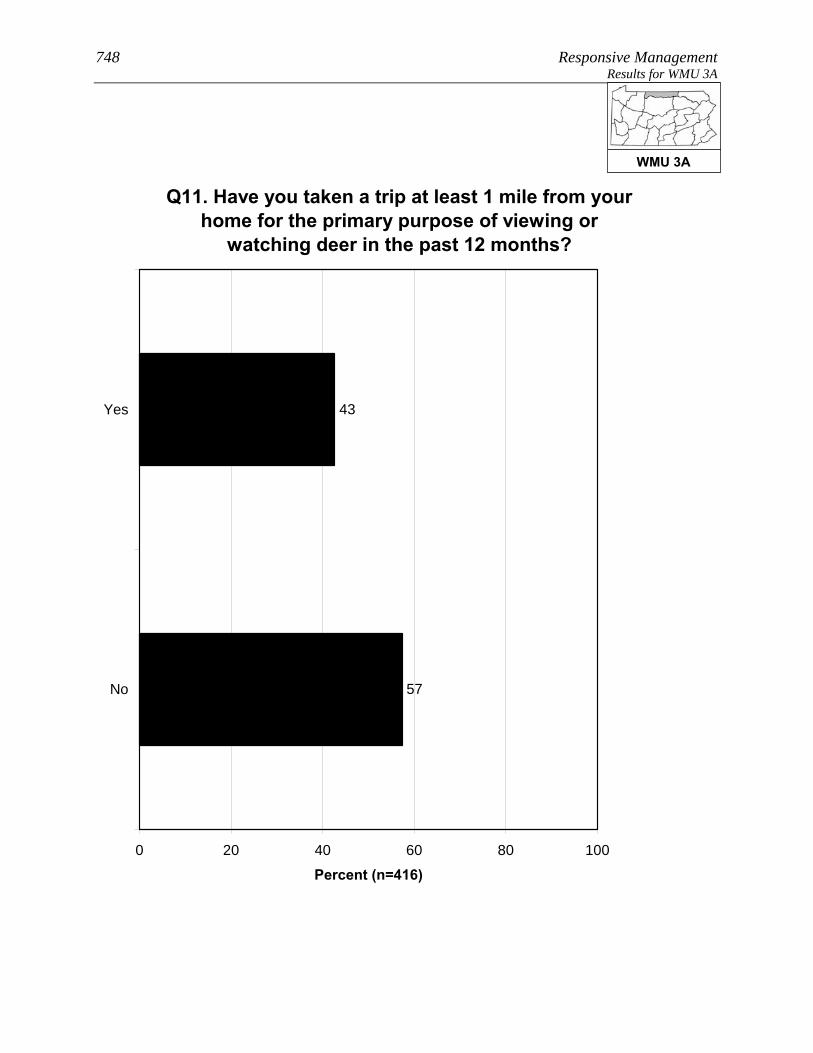
748 Responsive Management Results for WMU 3A
Q11. Have you taken a trip at least 1 mile from your home for the primary purpose of viewing or
watching deer in the past 12 months?
43
57
0 20 40 60 80 100
Yes
No
Percent (n=416)
WMU 3A

Pennsylvania Residents’ Opinions on and Attitudes Toward Deer and Deer Management 749 Results for WMU 3A
Q12. Did you use a spotlight to view deer at night on a trip to watch deer in the past 12 months?
(Asked of those who took a trip at least 1 mile from their home for the primary purpose of viewing or
watching deer in the past 12 months.)
37
63
0 20 40 60 80 100
Yes
No
Percent (n=194)
WMU 3A
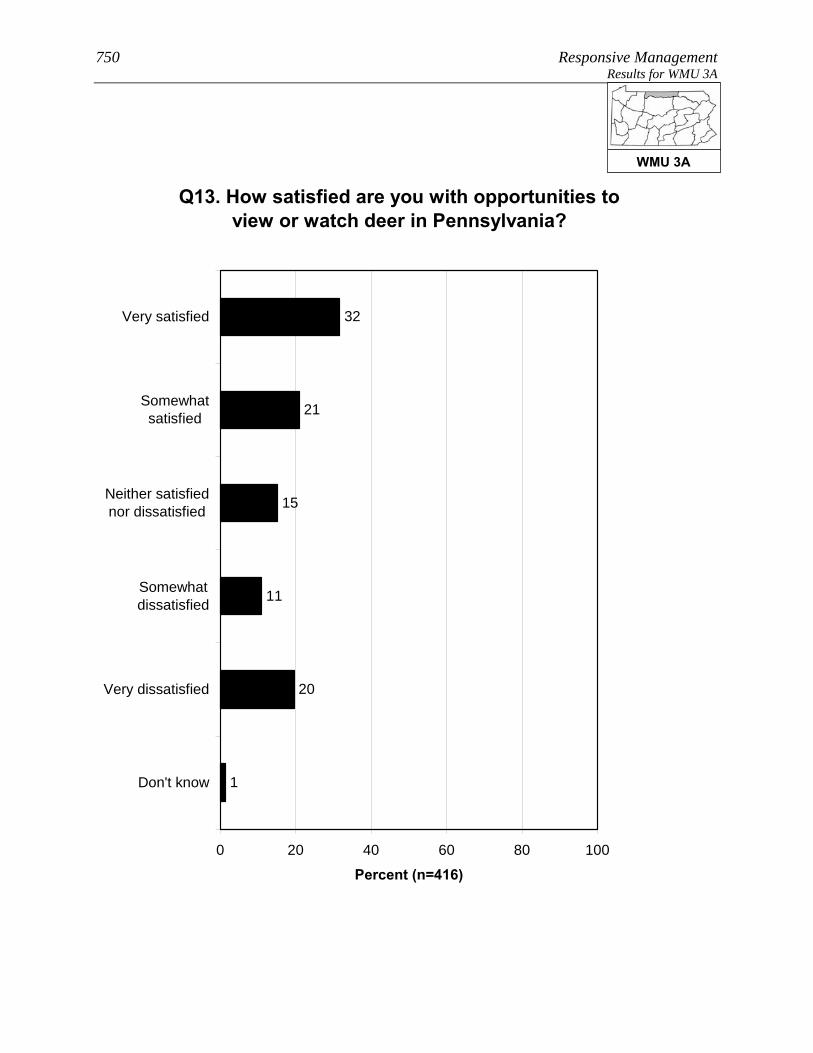
750 Responsive Management Results for WMU 3A
Q13. How satisfied are you with opportunities to view or watch deer in Pennsylvania?
32
21
15
11
20
1
0 20 40 60 80 100
Very satisfied
Somewhatsatisfied
Neither satisfiednor dissatisfied
Somewhatdissatisfied
Very dissatisfied
Don't know
Percent (n=416)
WMU 3A

Pennsylvania Residents’ Opinions on and Attitudes Toward Deer and Deer Management 751 Results for WMU 3A OPINIONS ON DEER IN GENERAL AND THE SIZE AND HEALTH OF THE DEER HERD
Opinion on deer is mostly favorable: 72% of residents of WMU 3A
say with no caveats that they like having deer around, another 14%
like having deer around but worry about the problems they may cause,
and only 3% generally regard them as a nuisance. The remainder have
no particular feeling about deer.
Another question asked residents of WMU 3A how deer-related issues compared to other
issues in their life, on a scale of 0 to 10, with the most importance being 10: the median
rating is “5.” The most common ratings are “10” (18%), the midpoint of “5” (18%), and “0”
(14%). In general, ratings are well spread across the scale.
Two other ratings questions asked respondents to rate their concern about deer-related issues.
The median level of concern is “6” for the quality of deer habitat in Pennsylvania and “7” for
the health of the deer population in Pennsylvania.
Most commonly, residents of WMU 3A say that the deer population in their area is too low
(59%), while 32% say it is just right and only 3% say it is too high.
• Those who own their home are more likely, compared to those who do not own their
home, to say that the deer population in their area is too low.
• Those who consider themselves to be a hunter are more likely to say that the deer
population in their area is too low, compared to those who are not hunters.
WMU 3A
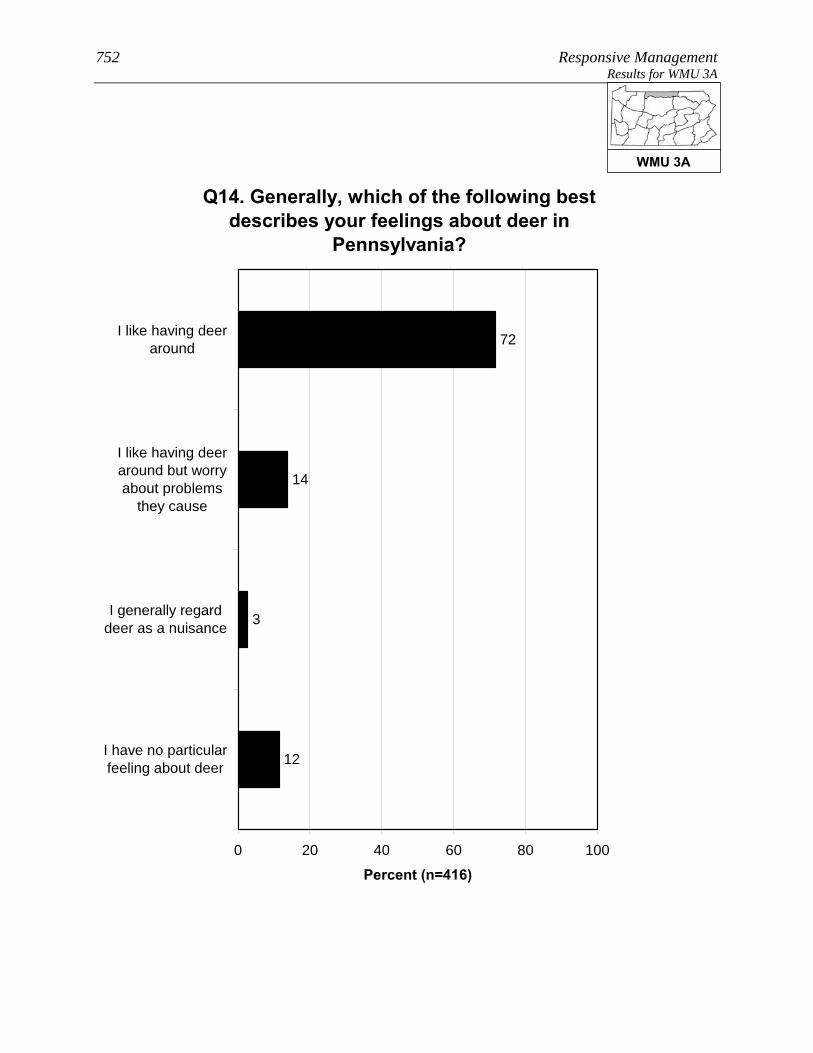
752 Responsive Management Results for WMU 3A
Q14. Generally, which of the following best describes your feelings about deer in
Pennsylvania?
72
14
3
12
0 20 40 60 80 100
I like having deeraround
I like having deeraround but worryabout problems
they cause
I generally regarddeer as a nuisance
I have no particularfeeling about deer
Percent (n=416)
WMU 3A

Pennsylvania Residents’ Opinions on and Attitudes Toward Deer and Deer Management 753 Results for WMU 3A
Q15. Compared to other issues in your life, how important to you, personally, are deer-related
issues on a scale of 0 to 10 where 0 is not at all important and 10 is extremely important?
5
6
5
18
3
11
8
5
18
3
14
4
0 20 40 60 80 100
10
9
8
7
6
5
4
3
2
1
0
Don't know
Percent (n=416)
Mean = 5.44Median = 5
WMU 3A
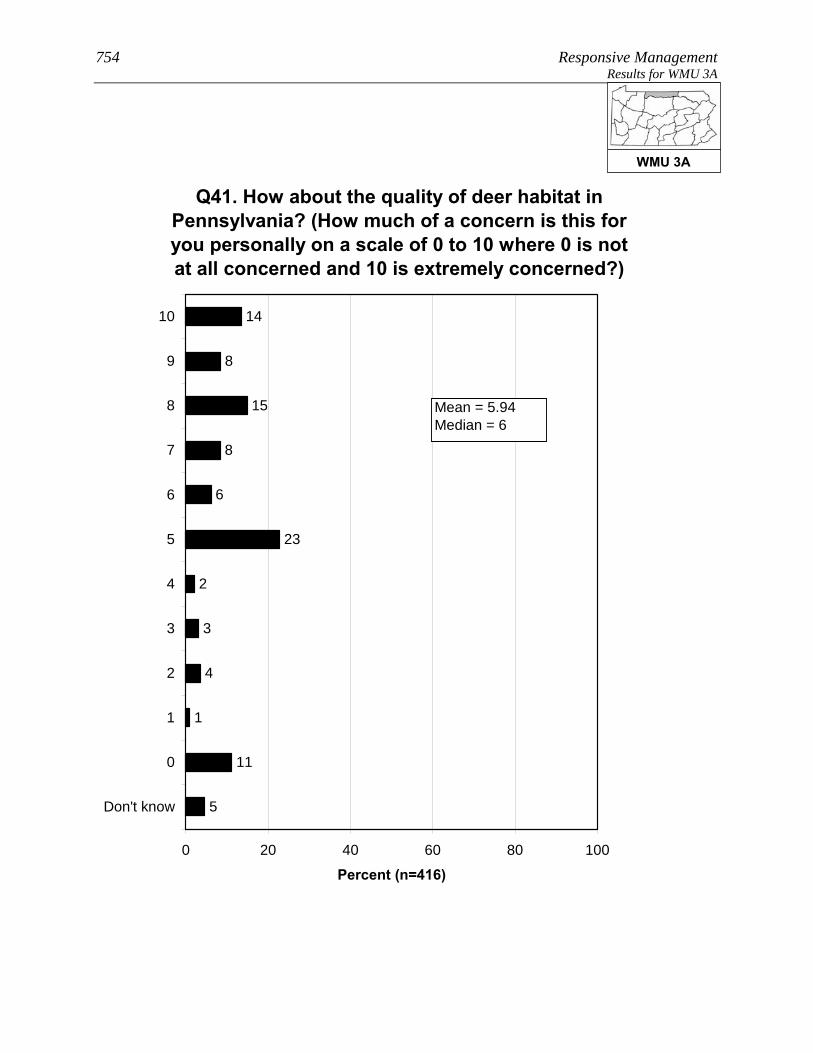
754 Responsive Management Results for WMU 3A
Q41. How about the quality of deer habitat in Pennsylvania? (How much of a concern is this for you personally on a scale of 0 to 10 where 0 is not at all concerned and 10 is extremely concerned?)
4
3
2
14
8
15
8
6
23
1
11
5
0 20 40 60 80 100
10
9
8
7
6
5
4
3
2
1
0
Don't know
Percent (n=416)
Mean = 5.94Median = 6
WMU 3A
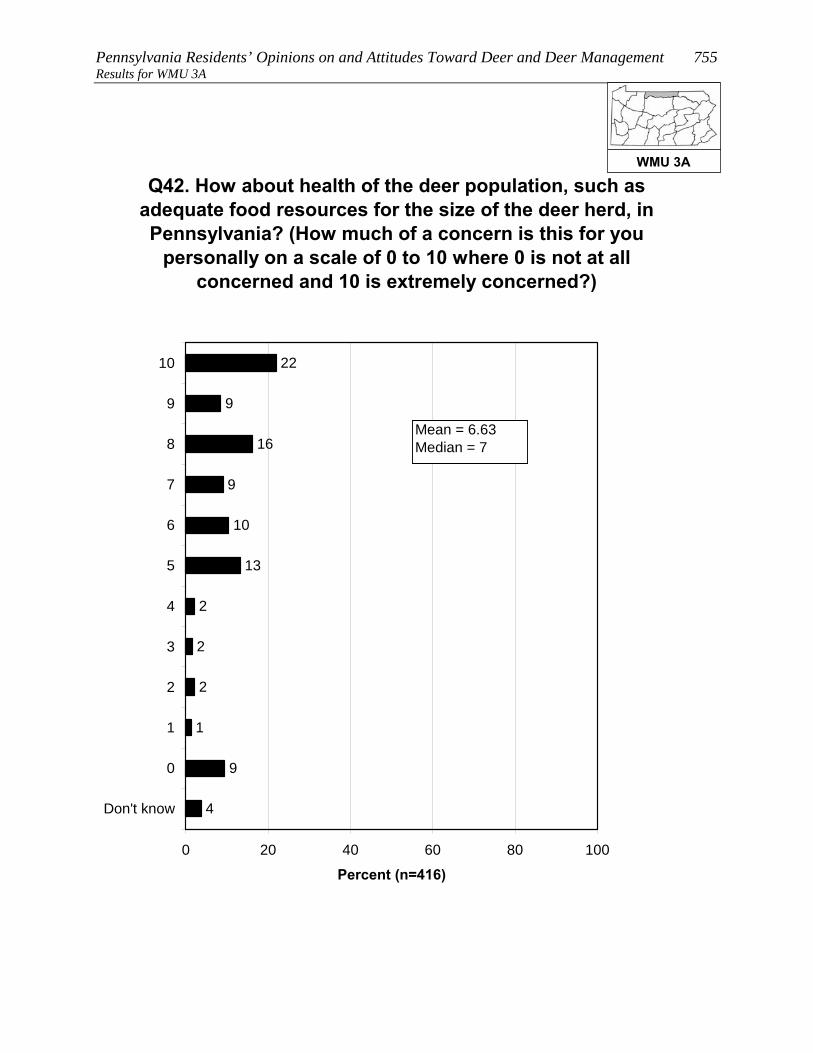
Pennsylvania Residents’ Opinions on and Attitudes Toward Deer and Deer Management 755 Results for WMU 3A
2
2
2
22
9
16
9
10
13
1
9
4
0 20 40 60 80 100
10
9
8
7
6
5
4
3
2
1
0
Don't know
Percent (n=416)
Q42. How about health of the deer population, such as adequate food resources for the size of the deer herd, in Pennsylvania? (How much of a concern is this for you
personally on a scale of 0 to 10 where 0 is not at all concerned and 10 is extremely concerned?)
Mean = 6.63Median = 7
WMU 3A
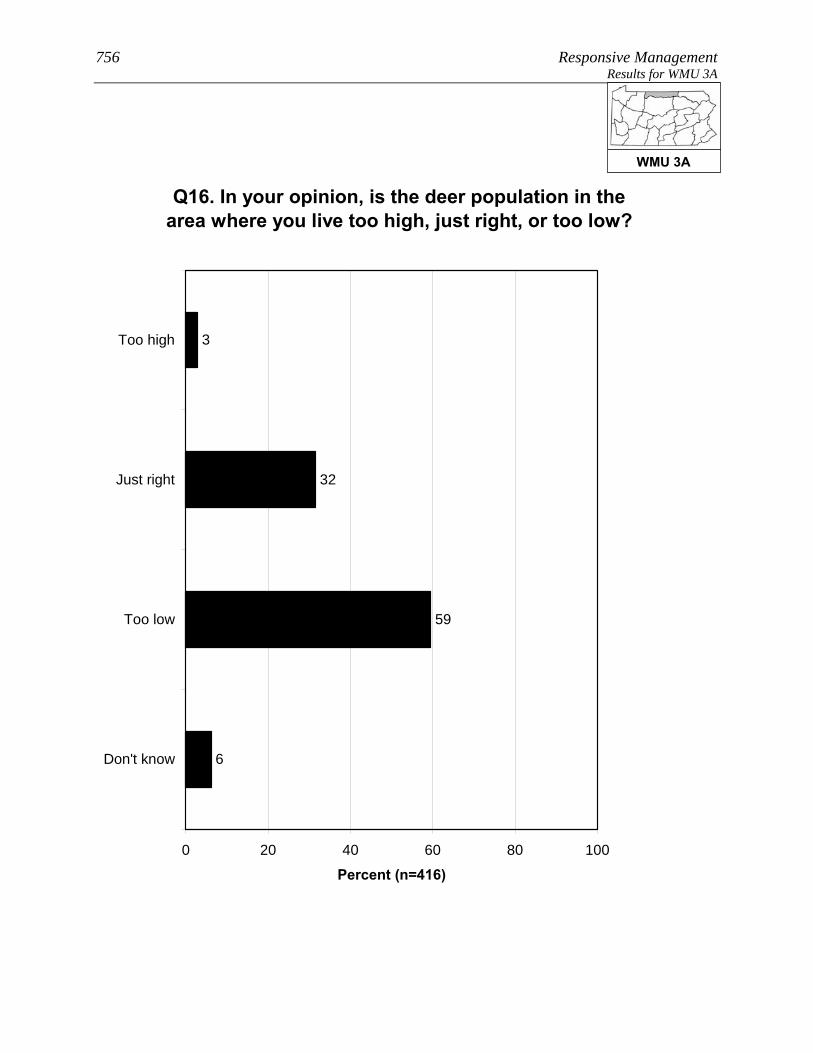
756 Responsive Management Results for WMU 3A
Q16. In your opinion, is the deer population in the area where you live too high, just right, or too low?
3
32
59
6
0 20 40 60 80 100
Too high
Just right
Too low
Don't know
Percent (n=416)
WMU 3A

Pennsylvania Residents’ Opinions on and Attitudes Toward Deer and Deer Management 757 Results for WMU 3A
Q16. In your opinion, is the deer population in the area where you live too high, just right, or too low?
3
29
63
5
46
41
7
5
0 20 40 60 80 100
Too high
Just right
Too low
Don't know
Percent
Owns home (n=353)Does not own home (n=31)
WMU 3A

758 Responsive Management Results for WMU 3A
Q16. In your opinion, is the deer population in the area where you live too high, just right, or too low?
1
19
78
1
41
43
5
11
0 20 40 60 80 100
Too high
Just right
Too low
Don't know
Percent
Consider themselves ahunter (n=213)Do not consider themselvesa hunter (n=202)
WMU 3A
Pennsylvania Residents’ Opinions on and Attitudes Toward Deer and Deer Management 759 Results for WMU 3A OPINIONS ON MANAGEMENT EFFORTS AND MANAGEMENT GOALS
The survey asked about three deer population management goals. For
all three, a large majority agree with the management goal: 82% agree
with managing the deer for a healthy and sustainable forest habitat,
88% agree with managing for healthy and sustainable deer
populations, and 77% agree with managing for safe, acceptable levels
of deer-human conflicts.
Residents of WMU 3A who said that the deer population in their area is too high or too low
were asked to indicate the reasonable number of years it should take to achieve an acceptable
deer population. The mean amount is 4.60 years. While 37% said that they do not know,
nearly all the rest gave a number of years of 10 or less. Note that this is only among those
who said the deer population was too high or too low.
• Because management plans typically look at a time frame of about 10 years to effect
change, the survey specifically asked if these respondents would be willing to wait
more than 10 years to achieve an acceptable deer population: just under a majority
(49%) indicated that they would be willing to wait that long.
WMU 3A

760 Responsive Management Results for WMU 3A
Q24-26. Deer populations should be managed for the following. (Do you agree or disagree with this
deer management goal?)
47
35
3
6
7
2
2
32
56
3
3
4
6
40
37
4
9
5
0 20 40 60 80 100
Stronglyagree
Moderatelyagree
Neither agreenor disagree
Moderatelydisagree
Stronglydisagree
Don't know
Percent (n=416)
Healthy and sustainableforest habitatHealthy and sustainabledeer populationsSafe and acceptable levelsof deer-human conflicts
WMU 3A
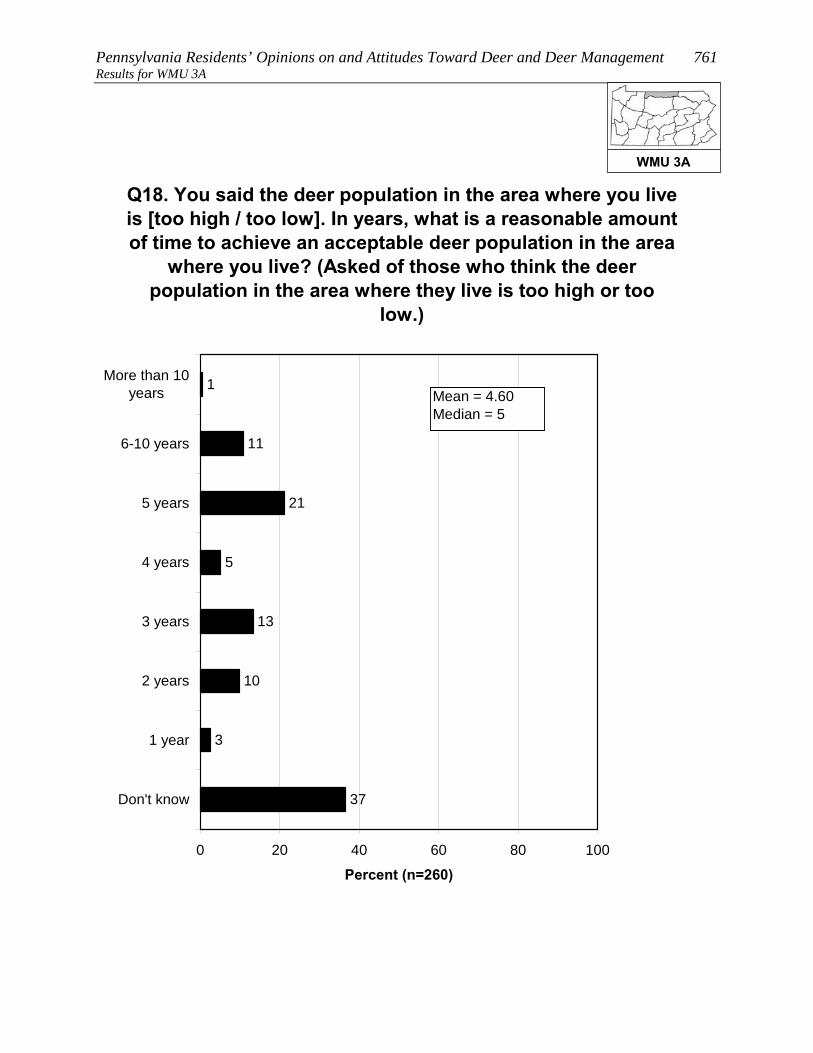
Pennsylvania Residents’ Opinions on and Attitudes Toward Deer and Deer Management 761 Results for WMU 3A
37
3
1
11
21
5
13
10
0 20 40 60 80 100
More than 10years
6-10 years
5 years
4 years
3 years
2 years
1 year
Don't know
Percent (n=260)
Q18. You said the deer population in the area where you live is [too high / too low]. In years, what is a reasonable amount of time to achieve an acceptable deer population in the area
where you live? (Asked of those who think the deer population in the area where they live is too high or too
low.)
Mean = 4.60Median = 5
WMU 3A
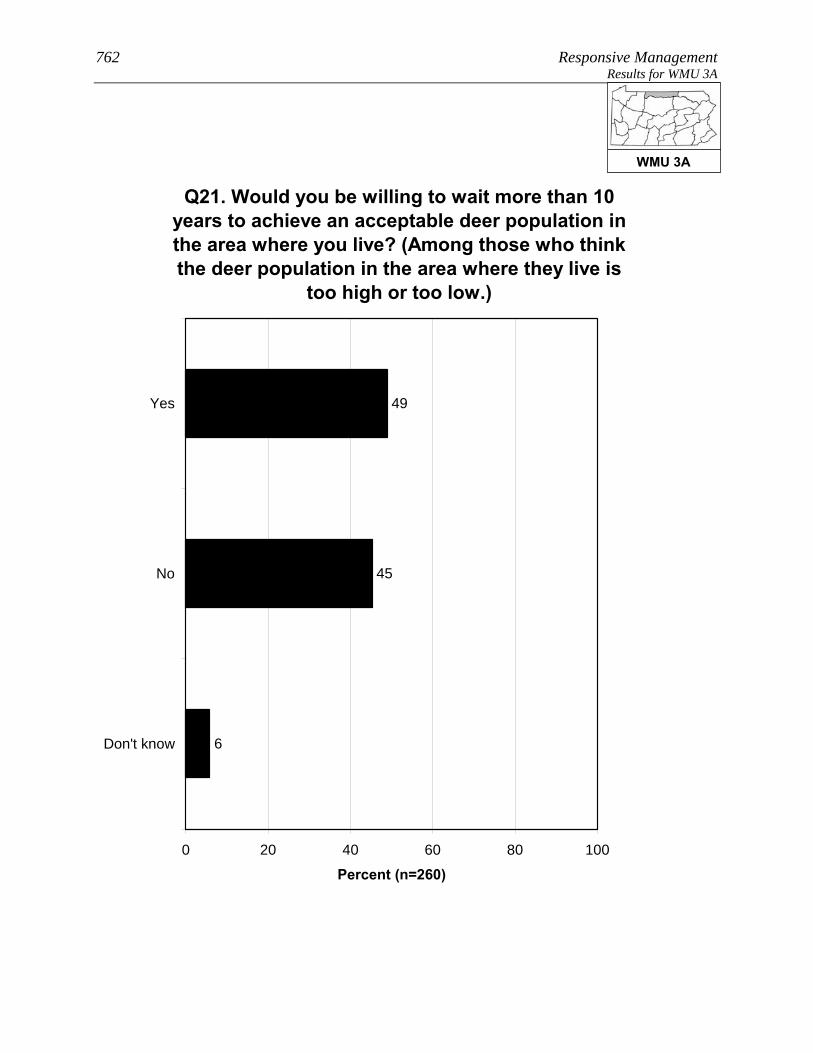
762 Responsive Management Results for WMU 3A
Q21. Would you be willing to wait more than 10 years to achieve an acceptable deer population in the area where you live? (Among those who think the deer population in the area where they live is
too high or too low.)
49
45
6
0 20 40 60 80 100
Yes
No
Don't know
Percent (n=260)
WMU 3A

Pennsylvania Residents’ Opinions on and Attitudes Toward Deer and Deer Management 763 Results for WMU 3A OPINIONS ON METHODS FOR MANAGING DEER, INCLUDING HUNTING
A majority of residents of WMU 3A (59%) support lethal methods to
manage deer populations in Pennsylvania; nonetheless, 34% oppose,
mostly strong opposition.
• Those residents of WMU 3A who live in a single-family home and own their home are
less likely to oppose lethal methods, compared to those who live in a single-family
home but do not own their home.
• The survey asked about four methods of controlling deer populations (three of them
lethal). The most support is for legal, regulated hunting (92% of respondents support
this method), distantly followed by fertility/birth control (25%), trapping and killing
(22%), and professionals or sharpshooters (19%).
Two questions asked respondents about hunting on their land (among those who live in a
single-family home), the first question about hunting by the respondents themselves (22% do
so) and the second regarding allowing others to hunt on their land (41% do so). In
combining the results, 42% of residents of WMU 3A who live in a single-family home either
hunt on their own land or allow others to do so (it is not simply a sum of the two questions
because some hunt on their property and allow others to do so as well).
• There was interest in seeing how a particular subgroup responded on this question, the
subgroup being those who live in a single-family home; who live on 1 acre or less; and
who live in an urban, suburban area, or a small city/town. Among this subgroup, 7%
either hunt on their own property or allow others to hunt on the property.
• Those respondents who do not allow hunting on their property were asked to indicate
why they prohibit it. The most common reasons are that they live in an urban or
suburban area in which hunting is not possible or feasible and/or that their property is
too small. Other minor reasons are concerns about safety, a general opposition to
hunting, and liability concerns.
• Those same respondents who do not allow hunting on their property were asked about
their likelihood of ever allowing others to hunt deer on their property; they
overwhelmingly say this is very unlikely (90%). They were then asked if there is
WMU 3A

764 Responsive Management Results for WMU 3A
anything that would make them more likely to allow deer hunting;
they are almost unanimous (96%) in saying that there is nothing
that would make them more likely to allow deer hunting.
• The question about allowing others to hunt on their property was examined among the
subgroup previously discussed (those who live in a single-family home; who live on 1
acre or less; and who live in an urban, suburban area, or a small city/town). Among
this group who got the question, nearly all say that they would never allow hunting.
o Additional follow-up questions to be asked of those who indicated that something
might prompt them to allow hunting on their property did not have enough
respondents for statistical validity; therefore, they are not shown.
WMU 3A

Pennsylvania Residents’ Opinions on and Attitudes Toward Deer and Deer Management 765 Results for WMU 3A
Q27. In general, do you support or oppose lethal methods to manage deer populations in
Pennsylvania?
36
23
6
12
22
2
0 20 40 60 80 100
Strongly support
Moderatelysupport
Neither supportnor oppose
Moderately oppose
Strongly oppose
Don't know
Percent (n=416)
WMU 3A
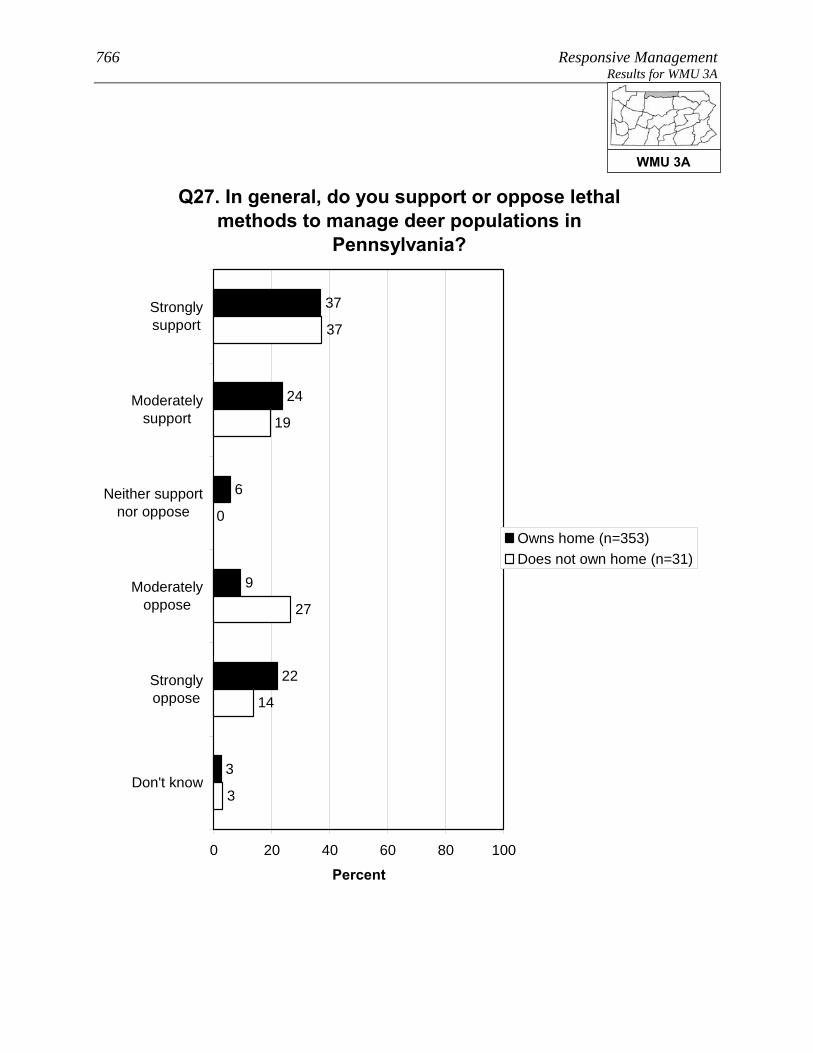
766 Responsive Management Results for WMU 3A
Q27. In general, do you support or oppose lethal methods to manage deer populations in
Pennsylvania?
37
24
6
9
22
3
0
19
37
27
14
3
0 20 40 60 80 100
Stronglysupport
Moderatelysupport
Neither supportnor oppose
Moderatelyoppose
Stronglyoppose
Don't know
Percent
Owns home (n=353)Does not own home (n=31)
WMU 3A
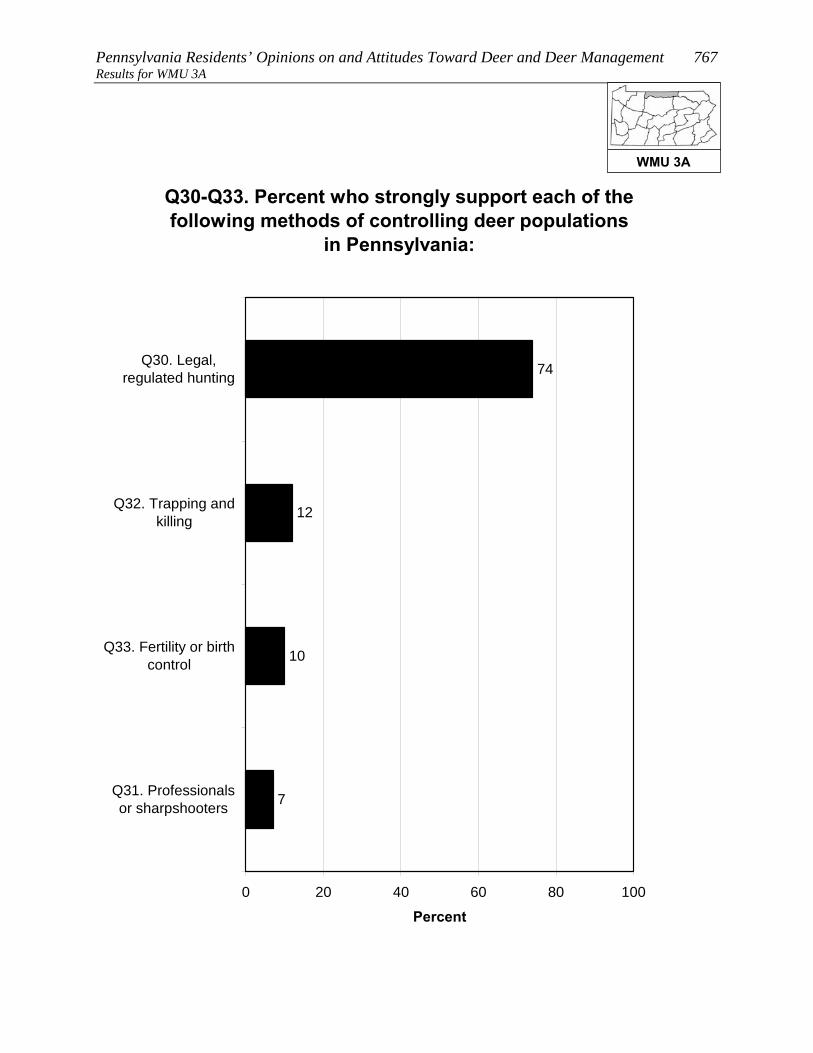
Pennsylvania Residents’ Opinions on and Attitudes Toward Deer and Deer Management 767 Results for WMU 3A
Q30-Q33. Percent who strongly support each of the following methods of controlling deer populations
in Pennsylvania:
7
10
12
74
0 20 40 60 80 100
Q30. Legal,regulated hunting
Q32. Trapping andkilling
Q33. Fertility or birthcontrol
Q31. Professionalsor sharpshooters
Percent
WMU 3A

768 Responsive Management Results for WMU 3A
Q30-Q33. Percent who strongly or moderately support each of the following methods of
controlling deer populations in Pennsylvania:
19
22
25
92
0 20 40 60 80 100
Q30. Legal,regulated hunting
Q33. Fertility or birthcontrol
Q32. Trapping andkilling
Q31. Professionalsor sharpshooters
Percent
WMU 3A

Pennsylvania Residents’ Opinions on and Attitudes Toward Deer and Deer Management 769 Results for WMU 3A
Q30-Q33. Percent who strongly or moderately oppose each of the following methods of
controlling deer populations in Pennsylvania:
7
61
72
74
0 20 40 60 80 100
Q32. Trapping andkilling
Q31. Professionalsor sharpshooters
Q33. Fertility or birthcontrol
Q30. Legal,regulated hunting
Percent
WMU 3A
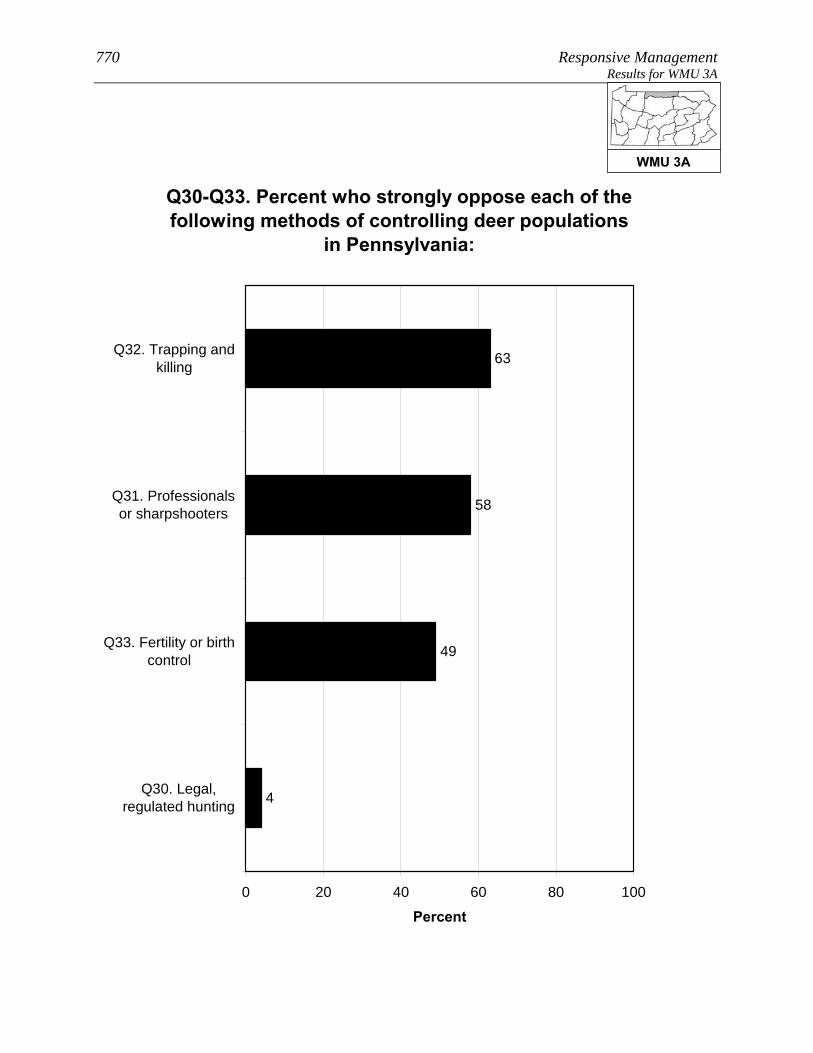
770 Responsive Management Results for WMU 3A
Q30-Q33. Percent who strongly oppose each of the following methods of controlling deer populations
in Pennsylvania:
4
49
58
63
0 20 40 60 80 100
Q32. Trapping andkilling
Q31. Professionalsor sharpshooters
Q33. Fertility or birthcontrol
Q30. Legal,regulated hunting
Percent
WMU 3A

Pennsylvania Residents’ Opinions on and Attitudes Toward Deer and Deer Management 771 Results for WMU 3A
Q59/60. Deer hunts and/or allows others to deer hunt on property. (Among respondents living in a
single-family home.)
42
58
0 20 40 60 80 100
Yes
No
Percent (n=384)
WMU 3A
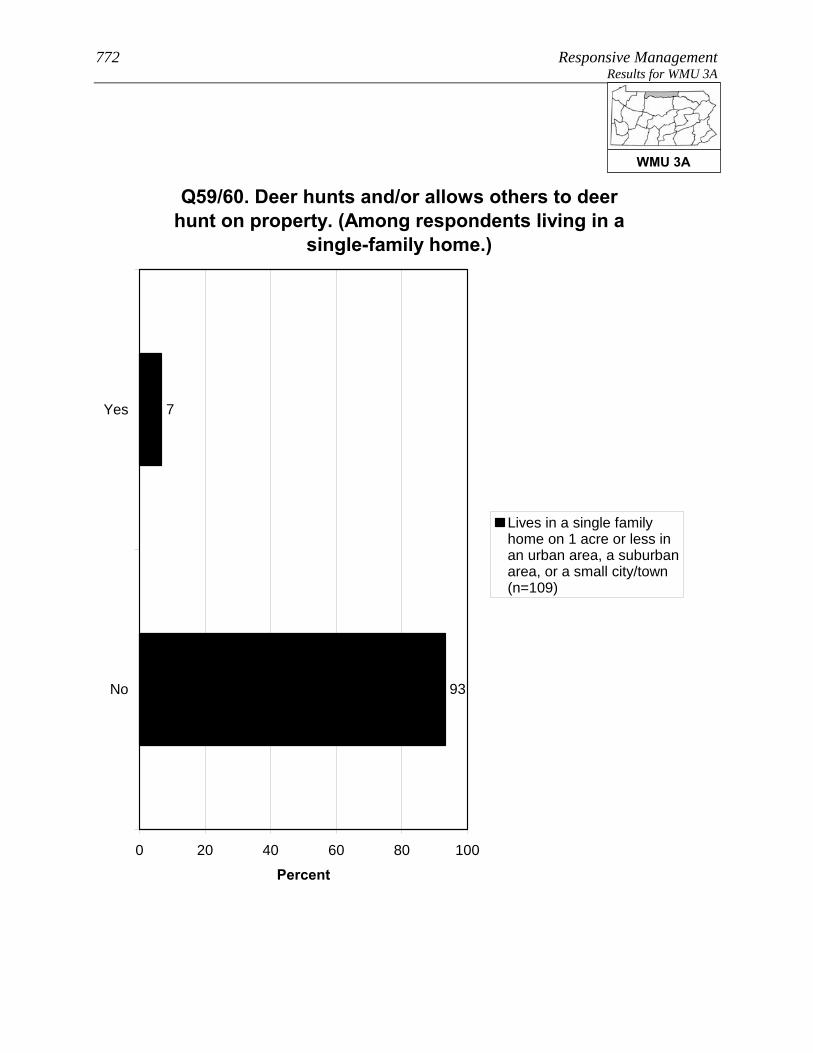
772 Responsive Management Results for WMU 3A
Q59/60. Deer hunts and/or allows others to deer hunt on property. (Among respondents living in a
single-family home.)
7
93
0 20 40 60 80 100
Yes
No
Percent
Lives in a single familyhome on 1 acre or less inan urban area, a suburbanarea, or a small city/town(n=109)
WMU 3A

Pennsylvania Residents’ Opinions on and Attitudes Toward Deer and Deer Management 773 Results for WMU 3A
Q63. What are the main reasons you do not allow others to hunt deer on your property? (Asked of
those whose primary place of residence is a single-family home and who do not allow others to hunt
deer on their property.)
1
52
47
12
5
3
1
0 20 40 60 80 100
Live in residentialneighborhood /
suburban or urbanarea
Property is too small/ neighbors too close
Concerned aboutsafety
Oppose hunting ingeneral
Liability
Not enough deer onproperty / not
enough habitat
Want to savehunting opportunities
for self / family
Mul
tiple
Res
pons
es A
llow
ed
Percent (n=226)
WMU 3A
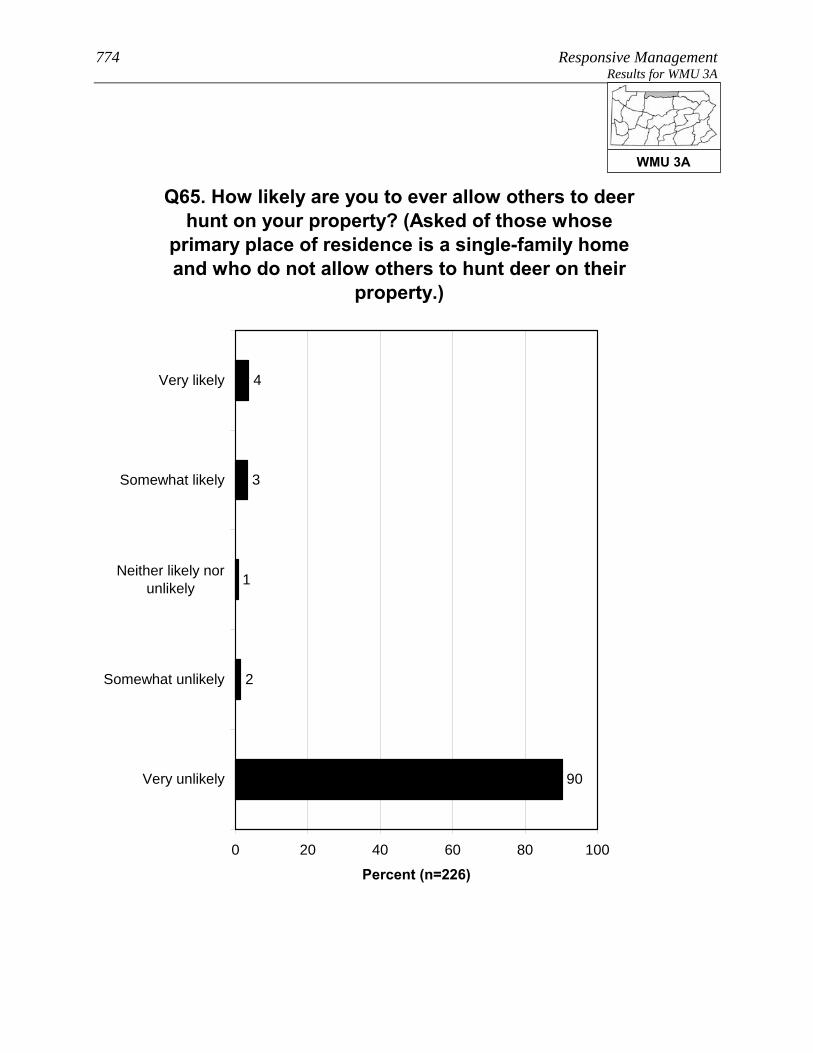
774 Responsive Management Results for WMU 3A
Q65. How likely are you to ever allow others to deer hunt on your property? (Asked of those whose
primary place of residence is a single-family home and who do not allow others to hunt deer on their
property.)
4
3
1
2
90
0 20 40 60 80 100
Very likely
Somewhat likely
Neither likely norunlikely
Somewhat unlikely
Very unlikely
Percent (n=226)
WMU 3A

Pennsylvania Residents’ Opinions on and Attitudes Toward Deer and Deer Management 775 Results for WMU 3A
Q66. Is there anything that would make you more likely to allow deer hunting on your property?
(Asked of those whose primary place of residence is a single-family home and who do not allow
others to hunt deer on their property.)
3
96
1
0 20 40 60 80 100
Yes
No
Don't know
Percent (n=226)
WMU 3A
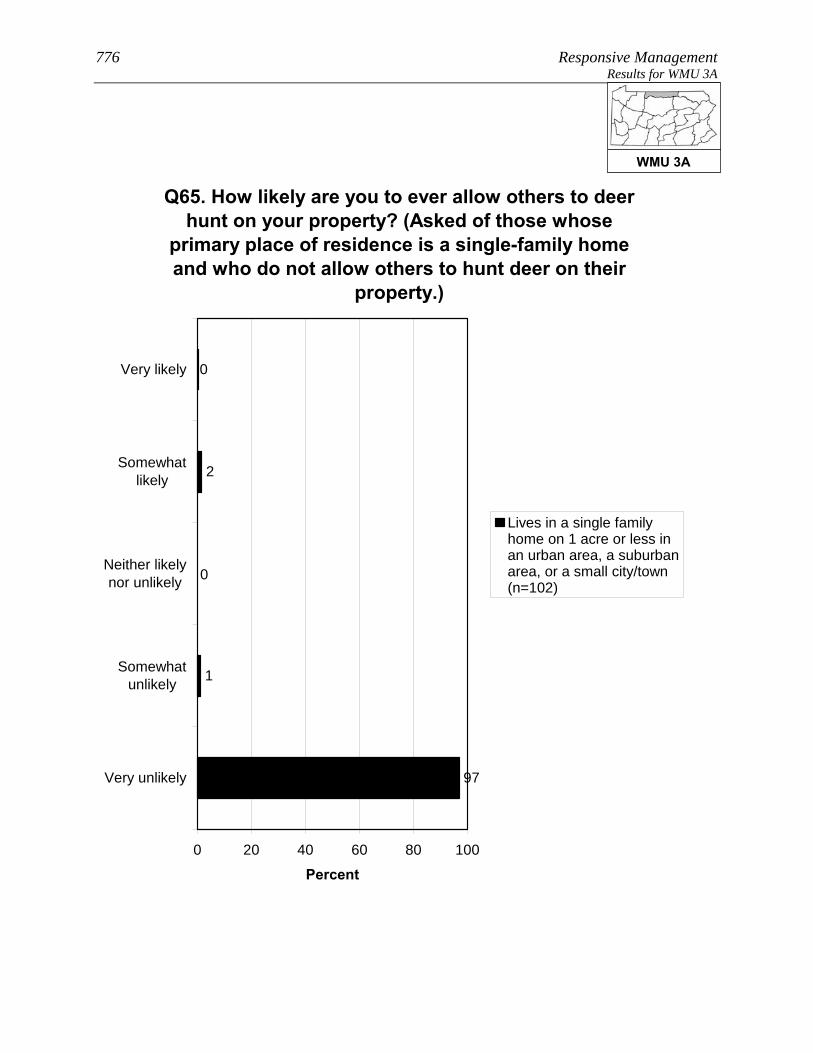
776 Responsive Management Results for WMU 3A
Q65. How likely are you to ever allow others to deer hunt on your property? (Asked of those whose
primary place of residence is a single-family home and who do not allow others to hunt deer on their
property.)
0
2
0
1
97
0 20 40 60 80 100
Very likely
Somewhatlikely
Neither likelynor unlikely
Somewhatunlikely
Very unlikely
Percent
Lives in a single familyhome on 1 acre or less inan urban area, a suburbanarea, or a small city/town(n=102)
WMU 3A

Pennsylvania Residents’ Opinions on and Attitudes Toward Deer and Deer Management 777 Results for WMU 3A CONCERNS ABOUT DEER AND DEER NUISANCE PROBLEMS
Seven questions asked about respondents’ level of concern about
issues associated with deer. For each issue, respondents rated their
level of concern about it using a 10-point scale, with 10 being the most
concerned.
• The most concern was for the health of the deer population (mean rating of 6.6) and
tick-borne diseases (6.6), followed by two more whose means are just under those top
two: the quality of deer habitat (5.9) and deer-vehicle accidents (5.8).
• At the bottom are concern about deer impacts on habitat and other wildlife (even
though this can be considerable) (3.3) and the two impacts to residents’ landscaping:
deer damage to plants and landscaping (1.6) and deer droppings in the yard (1.0).
o Another graph shows the percentage who gave a high rating (a “9” or “10”),
providing an idea of the percentage who feel strongly about the issues.
Among residents of WMU 3A, 70% indicated that they saw deer on their property in the past
12 months.
• Respondents who fed birds were more likely to indicate seeing deer, as were
respondents who fed deer or put out attractants or were aware of neighbors who fed
deer or put out attractants.
The survey asked about specific nuisance problems with deer that residents of WMU 3A may
have experienced: 5% indicated that they experienced problems with deer at their primary
place of residence in the past 12 months; 17% indicated that they or another household
member had been in a vehicle collision with a deer (fortunately, a very low portion of
drivers/passengers were injured); and 3% indicated that they or a household member had
been diagnosed with a tick-borne disease.
• Crosstabulations show that those who fed birds were about the same as those who did
not regarding experiencing deer problems. However, those who were aware of
neighbors feeding deer or putting out attractants were more likely to have experienced
deer problems.
WMU 3A
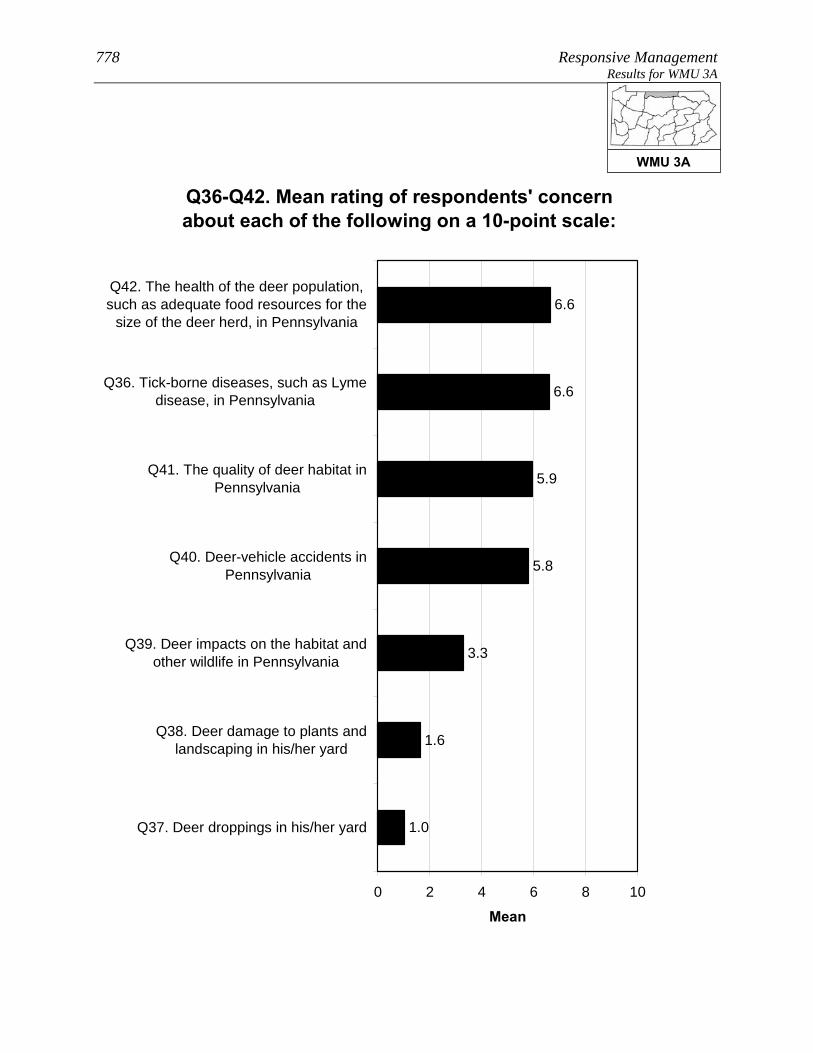
778 Responsive Management Results for WMU 3A
Q36-Q42. Mean rating of respondents' concern about each of the following on a 10-point scale:
1.6
3.3
5.8
5.9
6.6
6.6
1.0
0 2 4 6 8 10
Q42. The health of the deer population,such as adequate food resources for the
size of the deer herd, in Pennsylvania
Q36. Tick-borne diseases, such as Lymedisease, in Pennsylvania
Q41. The quality of deer habitat inPennsylvania
Q40. Deer-vehicle accidents inPennsylvania
Q39. Deer impacts on the habitat andother wildlife in Pennsylvania
Q38. Deer damage to plants andlandscaping in his/her yard
Q37. Deer droppings in his/her yard
Mean
WMU 3A
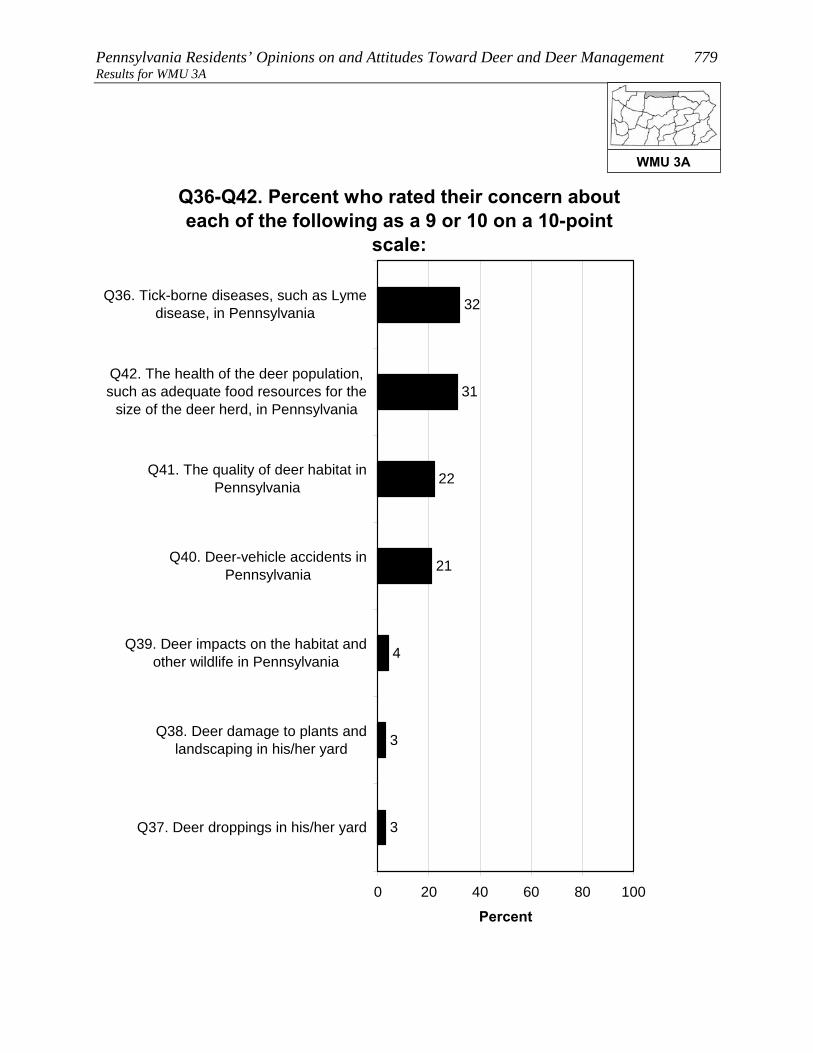
Pennsylvania Residents’ Opinions on and Attitudes Toward Deer and Deer Management 779 Results for WMU 3A
Q36-Q42. Percent who rated their concern about each of the following as a 9 or 10 on a 10-point
scale:
3
4
21
22
31
32
3
0 20 40 60 80 100
Q36. Tick-borne diseases, such as Lymedisease, in Pennsylvania
Q42. The health of the deer population,such as adequate food resources for the
size of the deer herd, in Pennsylvania
Q41. The quality of deer habitat inPennsylvania
Q40. Deer-vehicle accidents inPennsylvania
Q39. Deer impacts on the habitat andother wildlife in Pennsylvania
Q38. Deer damage to plants andlandscaping in his/her yard
Q37. Deer droppings in his/her yard
Percent
WMU 3A
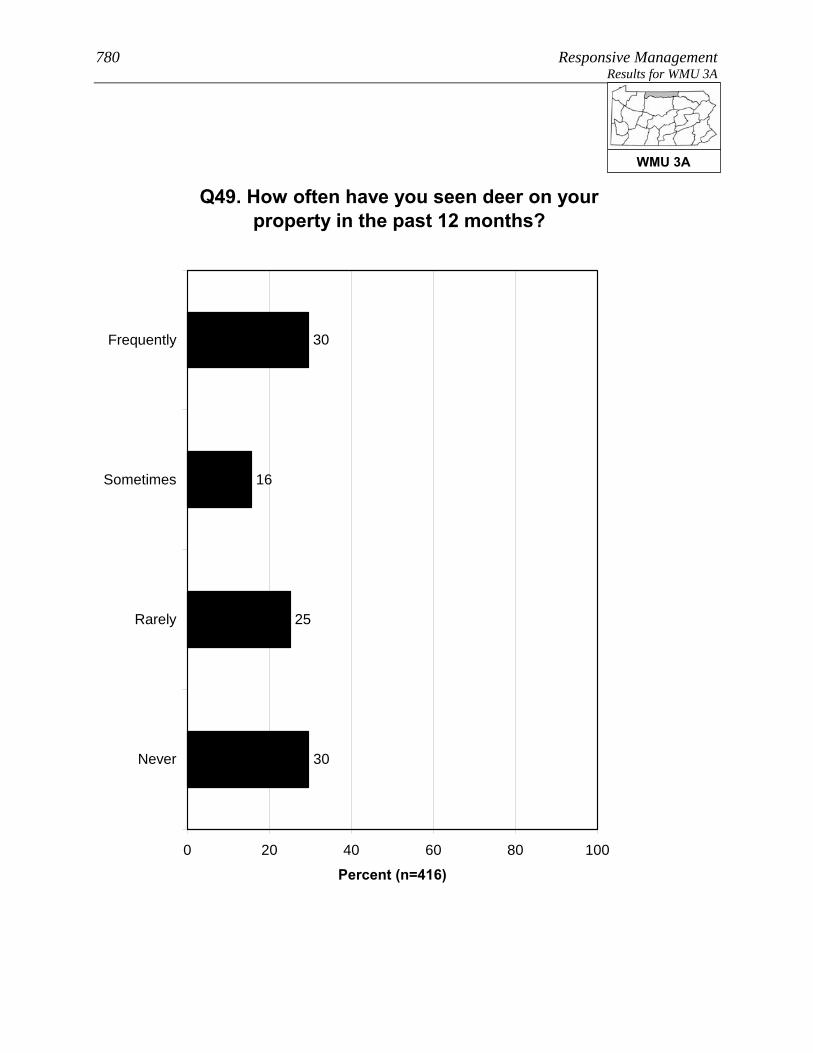
780 Responsive Management Results for WMU 3A
Q49. How often have you seen deer on your property in the past 12 months?
30
16
25
30
0 20 40 60 80 100
Frequently
Sometimes
Rarely
Never
Percent (n=416)
WMU 3A

Pennsylvania Residents’ Opinions on and Attitudes Toward Deer and Deer Management 781 Results for WMU 3A
Q49. How often have you seen deer on your property in the past 12 months?
32
16
27
26
24
15
27
34
0 20 40 60 80 100
Frequently
Sometimes
Rarely
Never
Percent
Fed birds on his / herproperty in the past 12months (n=216)Did not feed birds on his /her property in the past 12months (n=199)
WMU 3A

782 Responsive Management Results for WMU 3A
Q49. How often have you seen deer on your property in the past 12 months?
41
19
29
11
25
15
28
33
0 20 40 60 80 100
Frequently
Sometimes
Rarely
Never
Percent
Has fed deer or put outattractants in the past 12months (n=62)Has not fed deer or put outattractants in the past 12months (n=354)
WMU 3A
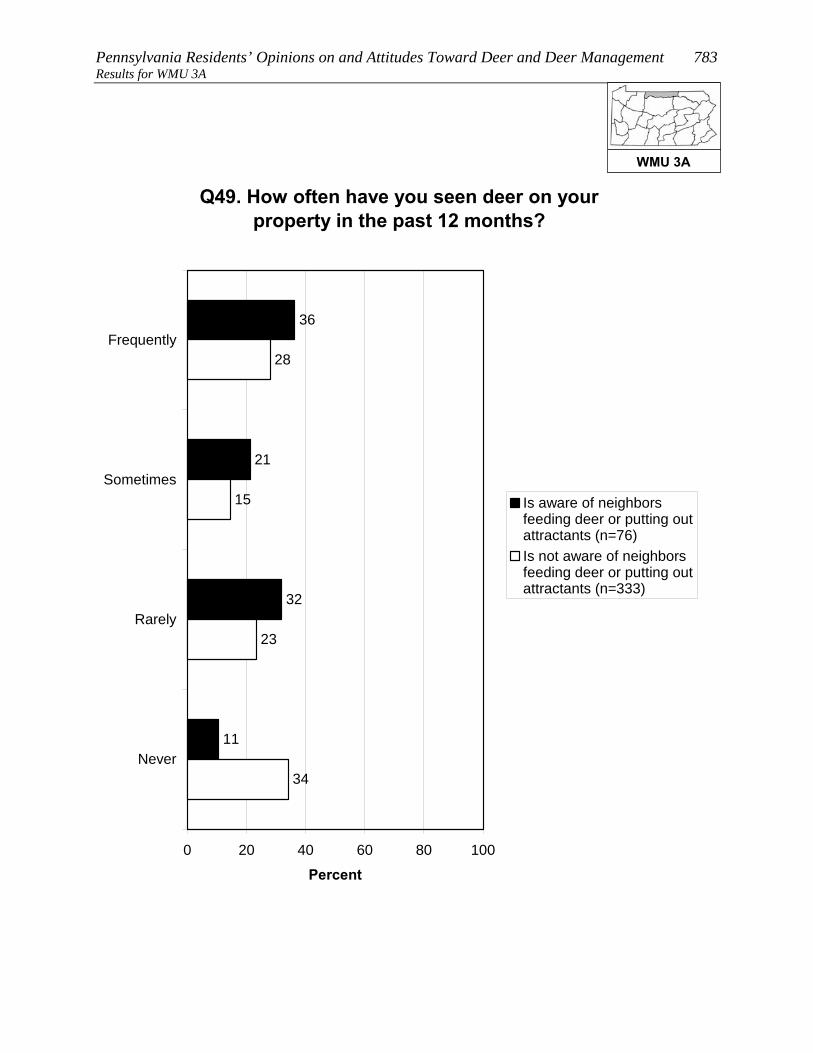
Pennsylvania Residents’ Opinions on and Attitudes Toward Deer and Deer Management 783 Results for WMU 3A
Q49. How often have you seen deer on your property in the past 12 months?
36
21
32
11
23
15
28
34
0 20 40 60 80 100
Frequently
Sometimes
Rarely
Never
Percent
Is aware of neighborsfeeding deer or putting outattractants (n=76)Is not aware of neighborsfeeding deer or putting outattractants (n=333)
WMU 3A

784 Responsive Management Results for WMU 3A
Q43. In the past 12 months, have you experienced any problems with deer at your primary place of
residence?
5
95
0 20 40 60 80 100
Yes
No
Percent (n=416)
WMU 3A
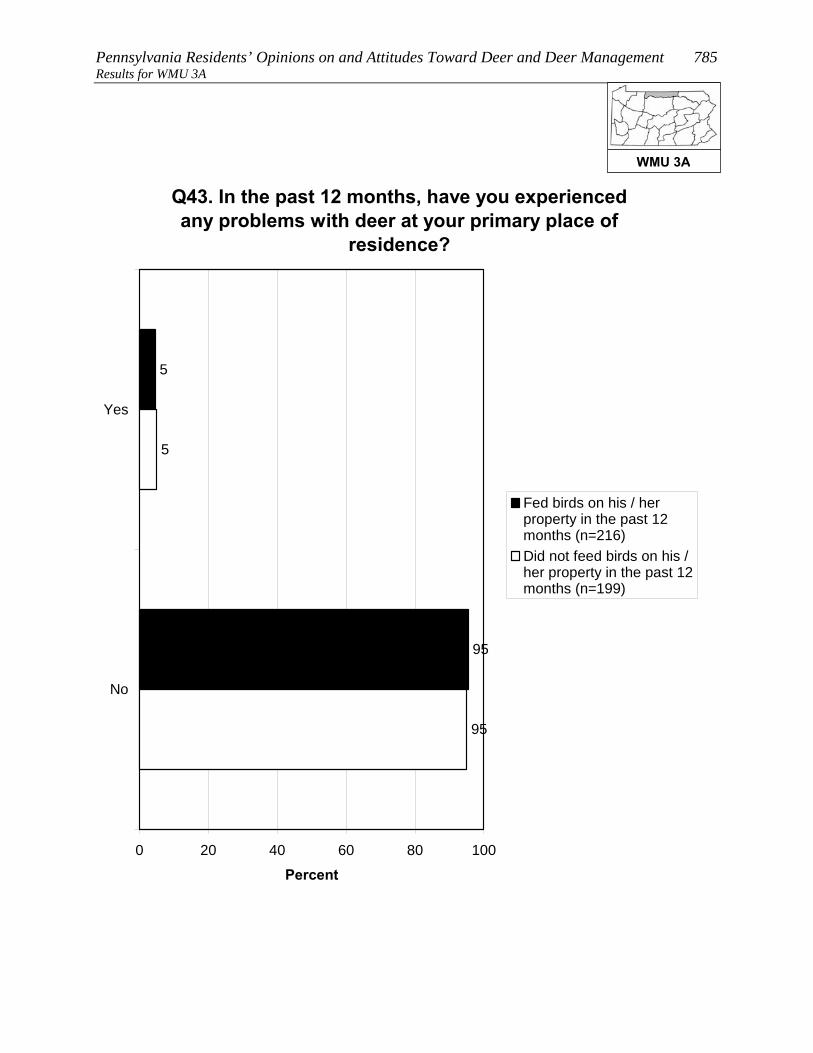
Pennsylvania Residents’ Opinions on and Attitudes Toward Deer and Deer Management 785 Results for WMU 3A
Q43. In the past 12 months, have you experienced any problems with deer at your primary place of
residence?
5
95
95
5
0 20 40 60 80 100
Yes
No
Percent
Fed birds on his / herproperty in the past 12months (n=216)Did not feed birds on his /her property in the past 12months (n=199)
WMU 3A
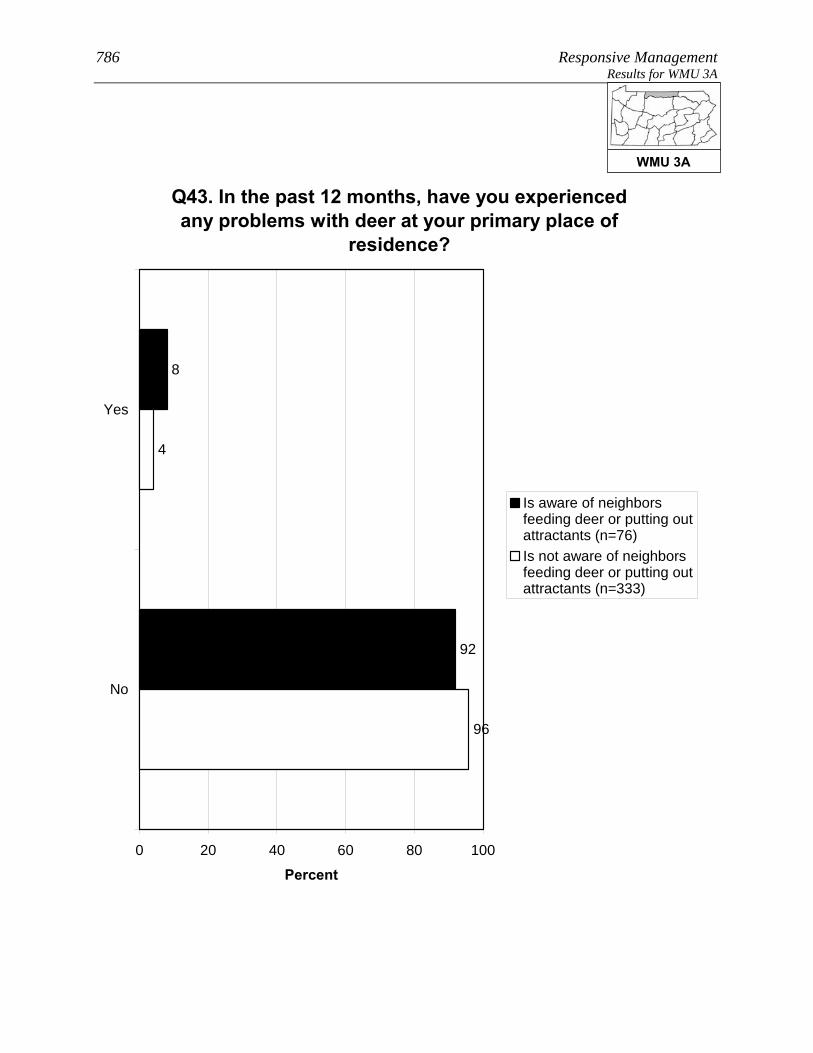
786 Responsive Management Results for WMU 3A
Q43. In the past 12 months, have you experienced any problems with deer at your primary place of
residence?
8
92
96
4
0 20 40 60 80 100
Yes
No
Percent
Is aware of neighborsfeeding deer or putting outattractants (n=76)Is not aware of neighborsfeeding deer or putting outattractants (n=333)
WMU 3A

Pennsylvania Residents’ Opinions on and Attitudes Toward Deer and Deer Management 787 Results for WMU 3A
Q44. In the past 12 months, have you or any other person living in your immediate household been in a vehicle collision with or an accident involving a
deer on Pennsylvania's roads or highways?
17
83
0 20 40 60 80 100
Yes
No
Percent (n=416)
WMU 3A
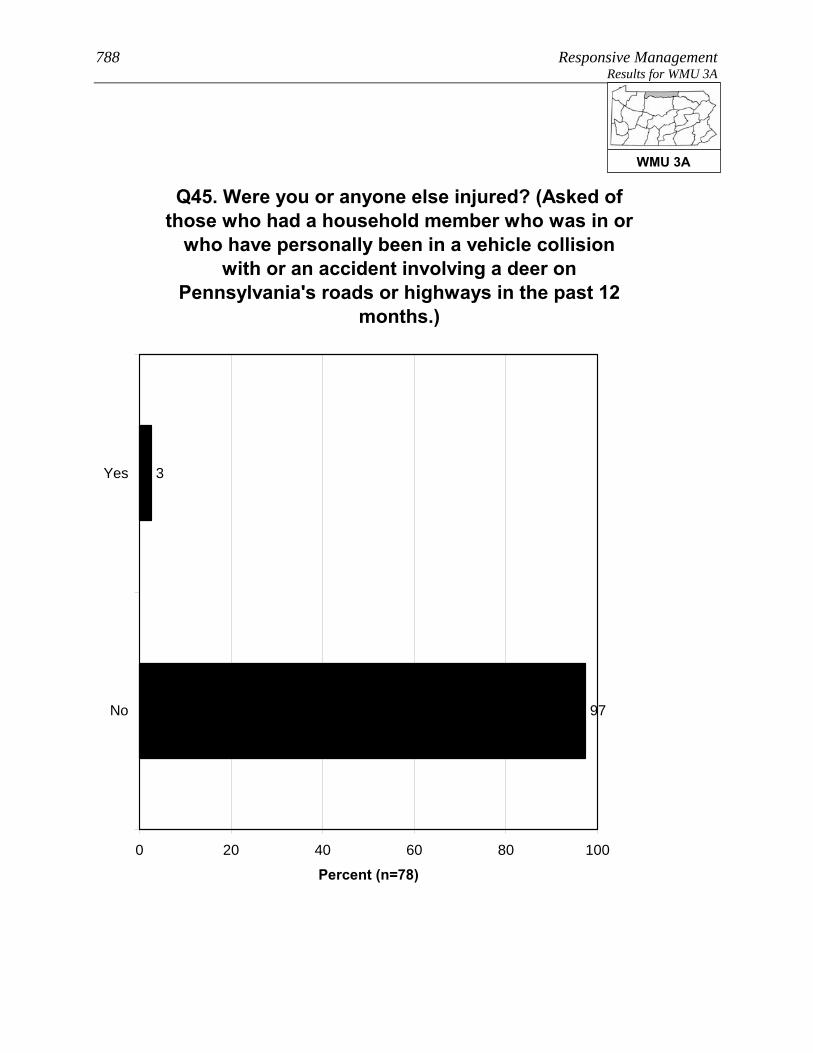
788 Responsive Management Results for WMU 3A
Q45. Were you or anyone else injured? (Asked of those who had a household member who was in or
who have personally been in a vehicle collision with or an accident involving a deer on
Pennsylvania's roads or highways in the past 12 months.)
3
97
0 20 40 60 80 100
Yes
No
Percent (n=78)
WMU 3A
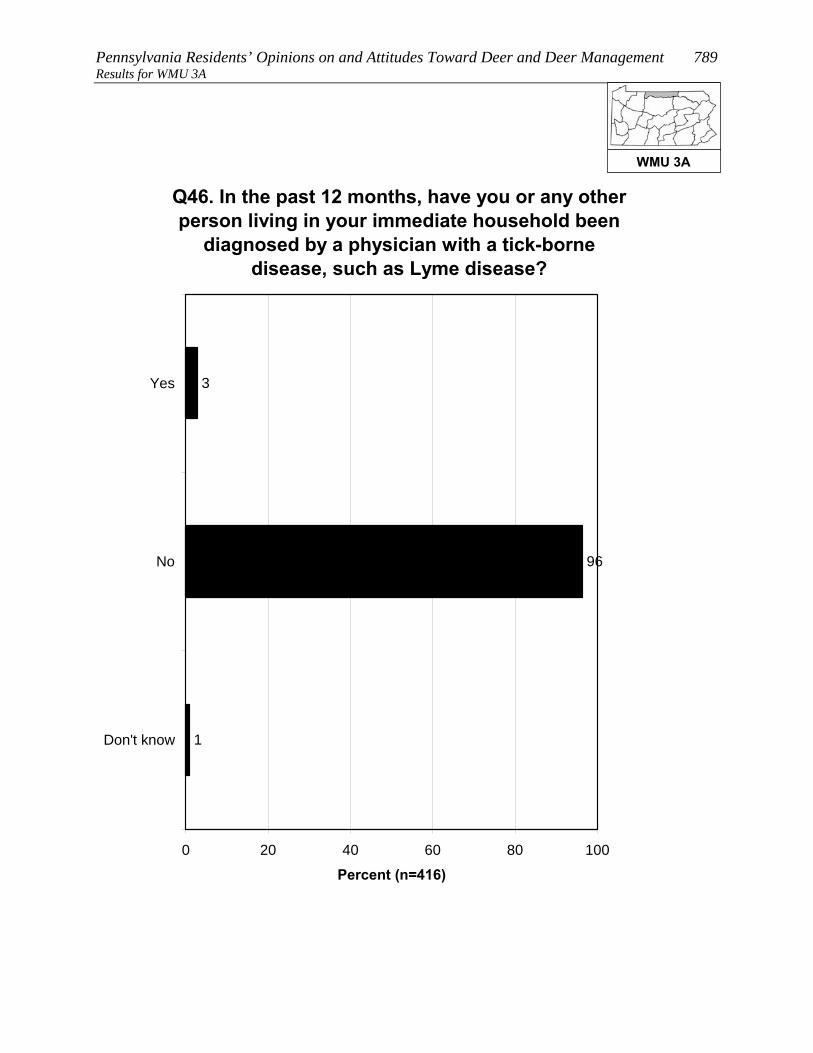
Pennsylvania Residents’ Opinions on and Attitudes Toward Deer and Deer Management 789 Results for WMU 3A
Q46. In the past 12 months, have you or any other person living in your immediate household been
diagnosed by a physician with a tick-borne disease, such as Lyme disease?
3
96
1
0 20 40 60 80 100
Yes
No
Don't know
Percent (n=416)
WMU 3A

790 Responsive Management Results for WMU 3A
FEEDING WILDLIFE AND HUNTING DEER Several questions asked about feeding wildlife.
• Feeding deer or putting out deer attractants: 14% of residents of
WMU 3A did this, and 17% are aware of neighbors who did this.
o The most typical feeds or attractants put out by respondents are corn, salt/mineral
blocks, and apples.
• Feeding birds: 52% of residents of WMU 3A did this.
There is no consensus on whether it is okay for private citizens to feed or attract deer in
Pennsylvania: 56% agree that this is okay, but 35% disagree (the rest are neutral).
Just under half of residents of WMU 3A (49%) consider themselves to be a hunter, a large
portion of whom have a Pennsylvania hunting license.
• Among residents of WMU 3A who live in a single-family home, 22% personally hunt
deer on their property.
• A large majority of residents of WMU 3A (87%) say that they, family members, and/or
friends hunt.
WMU 3A
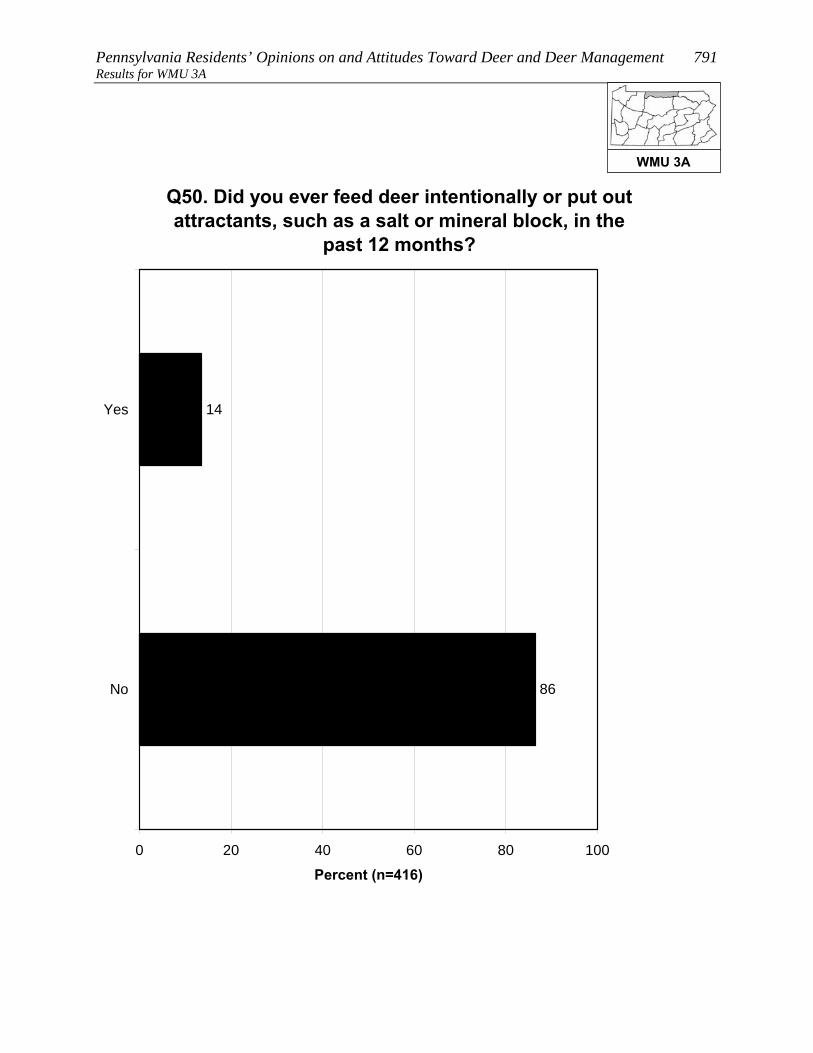
Pennsylvania Residents’ Opinions on and Attitudes Toward Deer and Deer Management 791 Results for WMU 3A
Q50. Did you ever feed deer intentionally or put out attractants, such as a salt or mineral block, in the
past 12 months?
14
86
0 20 40 60 80 100
Yes
No
Percent (n=416)
WMU 3A

792 Responsive Management Results for WMU 3A
Q55. Are you aware of any of your neighbors feeding deer intentionally or trying to attract deer
on their property in the past 12 months?
17
81
1
0 20 40 60 80 100
Yes
No
Don't know
Percent (n=416)
WMU 3A

Pennsylvania Residents’ Opinions on and Attitudes Toward Deer and Deer Management 793 Results for WMU 3A
Q53. What type of feed or attractant did you use? (Asked of those who fed deer intentionally or put
out attractants in the past 12 months.)
2
1
2
46
40
21
6
5
3
0 20 40 60 80 100
Corn
Salt / mineralblock
Apples
Food plot
Pellets /commercial
feed
Horse feed
Other foodproducts
Bread
Other
Mul
tiple
Res
pons
es A
llow
ed
Percent (n=62)
WMU 3A

794 Responsive Management Results for WMU 3A
Q48. Did you feed birds or make birdfeed available on your property in the past 12 months?
52
47
Less than 1%
0 20 40 60 80 100
Yes
No
Don't know
Percent (n=416)
WMU 3A
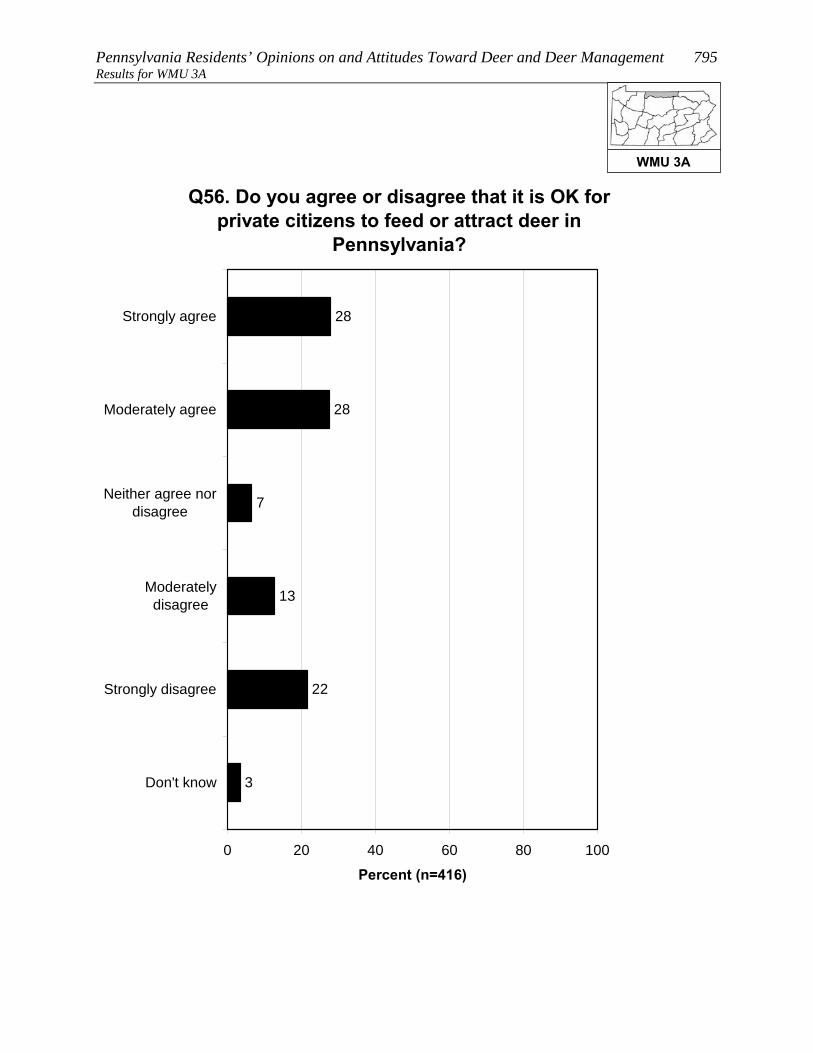
Pennsylvania Residents’ Opinions on and Attitudes Toward Deer and Deer Management 795 Results for WMU 3A
Q56. Do you agree or disagree that it is OK for private citizens to feed or attract deer in
Pennsylvania?
28
28
7
13
22
3
0 20 40 60 80 100
Strongly agree
Moderately agree
Neither agree nordisagree
Moderatelydisagree
Strongly disagree
Don't know
Percent (n=416)
WMU 3A
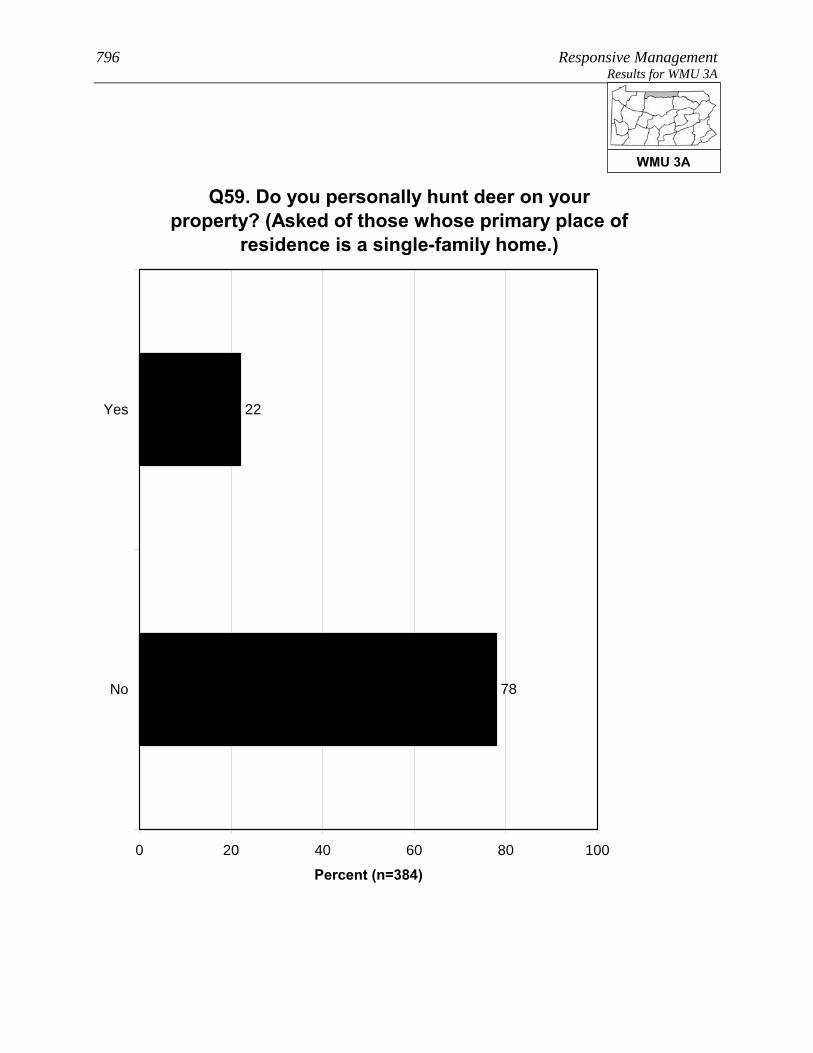
796 Responsive Management Results for WMU 3A
Q59. Do you personally hunt deer on your property? (Asked of those whose primary place of
residence is a single-family home.)
22
78
0 20 40 60 80 100
Yes
No
Percent (n=384)
WMU 3A
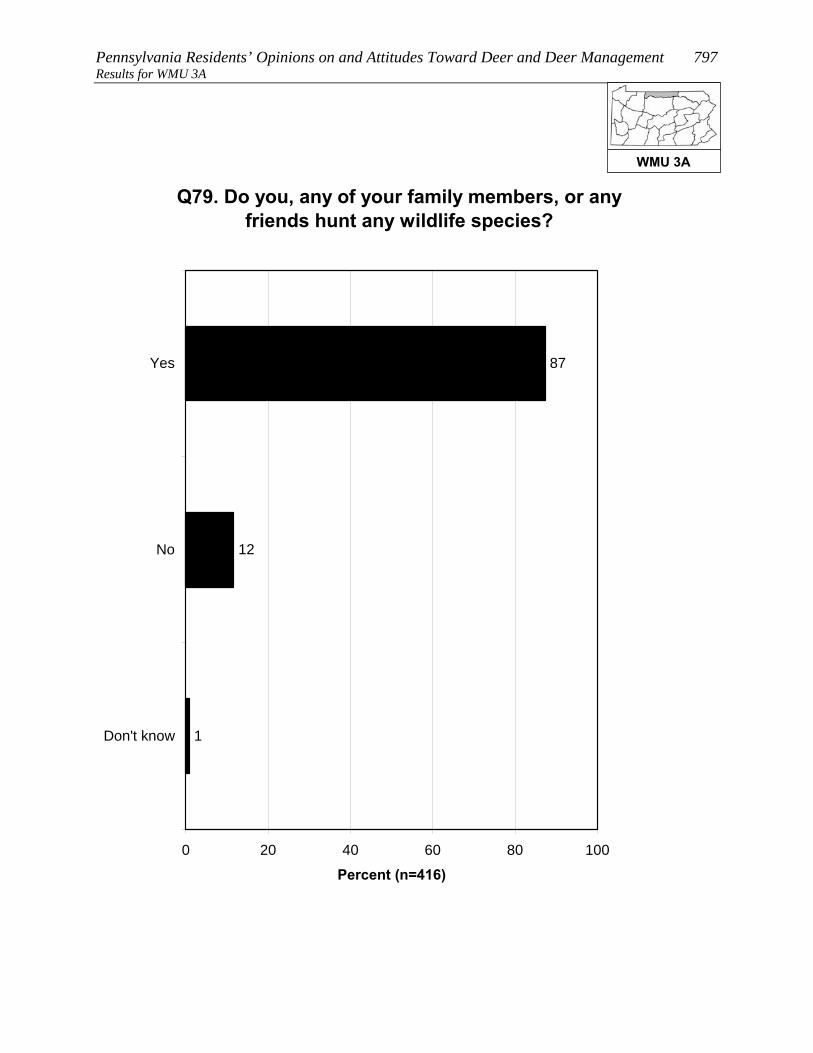
Pennsylvania Residents’ Opinions on and Attitudes Toward Deer and Deer Management 797 Results for WMU 3A
Q79. Do you, any of your family members, or any friends hunt any wildlife species?
87
12
1
0 20 40 60 80 100
Yes
No
Don't know
Percent (n=416)
WMU 3A
798 Responsive Management Results for WMU 3A
SOURCES OF INFORMATION Most commonly, residents of WMU 3A say that the best way to
provide them with information about deer in Pennsylvania is through
direct mail (36% gave this response), followed by newspaper (23%),
the Internet (10% saying an Internet site other than the PGC and 4%
saying the agency website; note that some said both), and email (10%).
Just about a third of residents of WMU 3A (34%) use social media, the most common
primary site being Facebook.
WMU 3A

Pennsylvania Residents’ Opinions on and Attitudes Toward Deer and Deer Management 799 Results for WMU 3A
Q82. What is the best way to provide you with information about deer in Pennsylvania? We are not sending out information at this time; we are
just measuring interest.
7
4
4
4
36
23
10
10
6
6
3
2
1
1
1
2
0 20 40 60 80 100
Direct mail
NewspaperInternet / website other than
PGC websiteEmail
Magazines
Brochures or pamphlets
PA Hunting and Trapping Digest
PA Game Commission website
TV
Telephone
Radio
PA Game Commission offices
Public presentations
Social media
Other
Don't know
Mul
tiple
Res
pons
es A
llow
ed
Percent (n=416)
WMU 3A

800 Responsive Management Results for WMU 3A
Q84. Do you use social media, such as Facebook, Twitter, or YouTube?
34
66
0 20 40 60 80 100
Yes
No
Percent (n=416)
WMU 3A

Pennsylvania Residents’ Opinions on and Attitudes Toward Deer and Deer Management 801 Results for WMU 3A
Q85. Which social media site do you use most often? (Asked of those who use social media.)
91
6
2
1
0 20 40 60 80 100
YouTube
Other
Percent (n=176)
WMU 3A

802 Responsive Management Results for WMU 3B
RESULTS FOR WMU 3B Location: From Mansfield, US Rt. 6 east to the Susquehanna River at Towanda; the Susquehanna River east to U.S. Rt. 6 at Tunkhannock; U.S. Rt. 6 east to I-81 near Scranton; I-81 south to PA Rt. 29 near Nanticoke; PA Rt. 29 north to PA Rt. 118 near Pikes Creek; PA Rt. 118 west to PA Rt. 405 at Hughesville; PA Rt. 405 south to the Susquehanna River at Muncy; the Susquehanna River north to US Rt. 15 at Williamsport; US Rt. 15 north to US Rt. 6 at Mansfield.

Pennsylvania Residents’ Opinions on and Attitudes Toward Deer and Deer Management 803 Results for WMU 3B
8. Lives in WMU 3B 1. Does not consider deer-related issues as a 9 or 10 in importance as compared to other issues in his/her life (p < 0.05). 2. Does not indicate having seen deer frequently on his/her property in the past 12 months (p < 0.001). 3. Does not indicate having spent time viewing or watching deer around home in the past 12 months (p < 0.001). 3. Does not indicate being very or somewhat satisfied with opportunities to view or watch deer in PA (p < 0.001). 3. Does not Indicate that he/she or any of his/her family members hunt (p < 0.01). 3. Does not indicate having taken a trip more than a mile from home for the primary purpose of viewing or watching deer in the past 12 months (p < 0.01). 3. Does not indicate having used a spotlight to view deer at night on a trip to watch deer in the past 12 months (p < 0.01). 3. Does not indicate having a valid 2011 PA general hunting license (p < 0.01). 3. Does not indicate considering himself/herself to be a hunter (p < 0.01). 3. Does not indicate having fed deer intentionally or having put out attractants in the past 12 months (p < 0.05). 4. Does not consider the deer population in his/her area to be too high (p < 0.001). 4. Strongly or moderately agrees that deer populations should be managed for healthy and sustainable forest habitat (p < 0.01). 4. Does not strongly or moderately support trapping and killing as a method of controlling deer populations in PA (p < 0.01). 4. Does not strongly or moderately support legal, regulated hunting as a method of controlling deer populations in PA (p < 0.01). 5. Does not indicate having experienced any problems with deer at his/her primary place of residence in the past 12 months (p < 0.001). 5. Does not indicate that he/she or another person living in the immediate household has been in a vehicle collision with or an accident involving a deer on PA's roads or highways in the past 12 months (p < 0.001). 5. Does not strongly or moderately agree that it is OK for private citizens to feed or attract deer in PA (p < 0.01). 7. Uses social media, such as Facebook, Twitter, or YouTube (p < 0.05). 7. Uses Facebook (p < 0.05). 8. Considers place of residence to be an urban or suburban area (p < 0.05). See page 9 through 11 for explanation of how to interpret z-score tables.
WMU 3B

804 Responsive Management Results for WMU 3B
PARTICIPATION IN VIEWING DEER About a third of residents of WMU 3B (34%) spent time viewing deer
around their home in the past 12 months, and 23% took a trip of at
least a mile to view deer.
• About a fifth of those who took a deer-viewing trip (22%) used a spotlight to view the
deer at night.
A majority of residents of WMU 3B (60%) are satisfied with opportunities to view deer in
Pennsylvania. Because a relatively large percentage answer neutrally, only 13% indicate
being dissatisfied.
WMU 3B
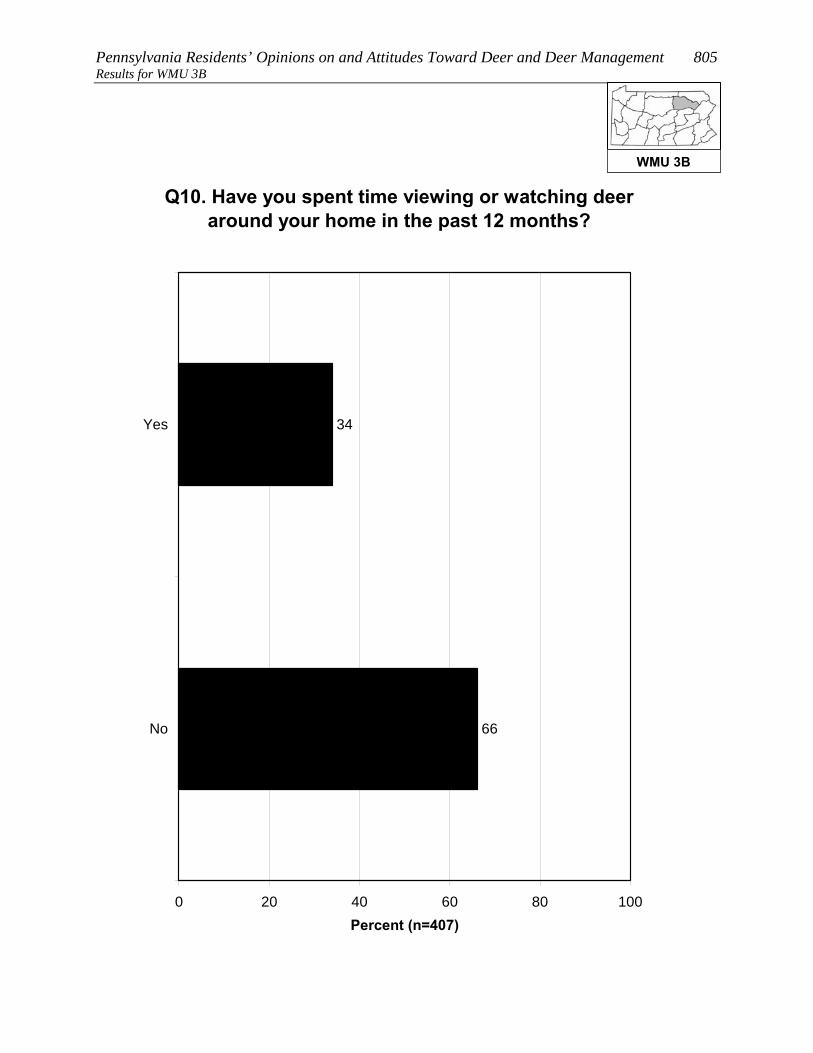
Pennsylvania Residents’ Opinions on and Attitudes Toward Deer and Deer Management 805 Results for WMU 3B
Q10. Have you spent time viewing or watching deer around your home in the past 12 months?
34
66
0 20 40 60 80 100
Yes
No
Percent (n=407)
WMU 3B

806 Responsive Management Results for WMU 3B
Q11. Have you taken a trip at least 1 mile from your home for the primary purpose of viewing or
watching deer in the past 12 months?
23
77
0 20 40 60 80 100
Yes
No
Percent (n=407)
WMU 3B
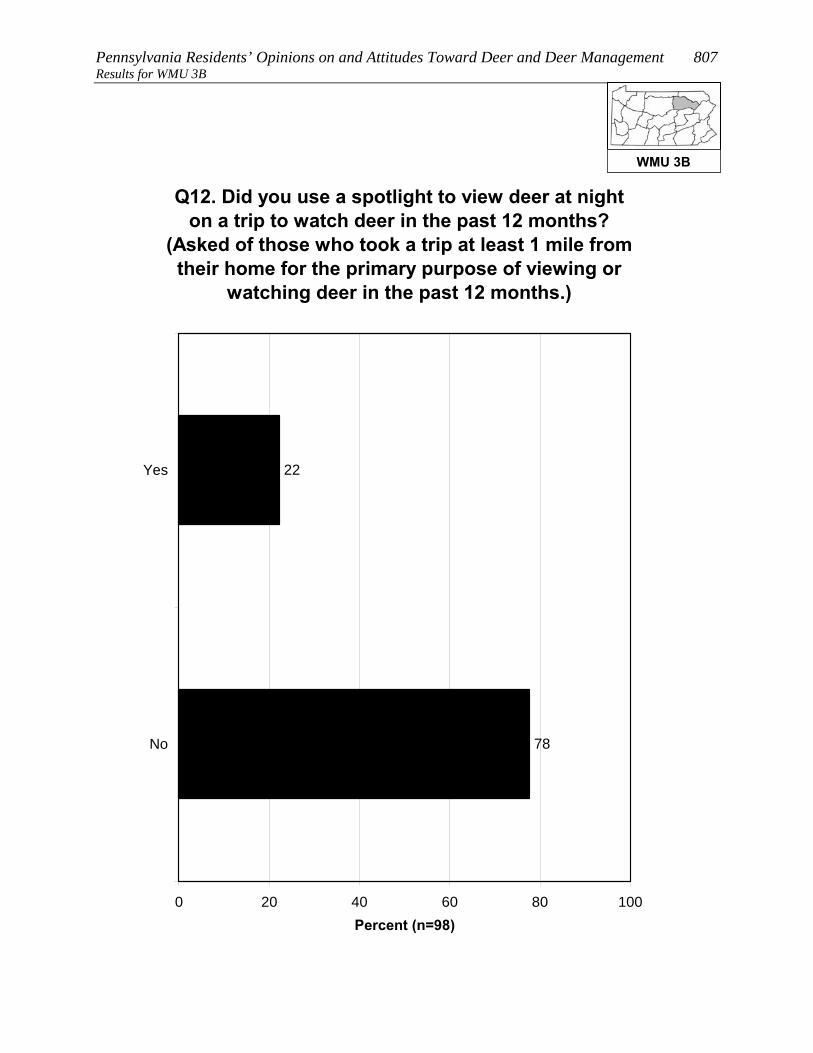
Pennsylvania Residents’ Opinions on and Attitudes Toward Deer and Deer Management 807 Results for WMU 3B
Q12. Did you use a spotlight to view deer at night on a trip to watch deer in the past 12 months?
(Asked of those who took a trip at least 1 mile from their home for the primary purpose of viewing or
watching deer in the past 12 months.)
22
78
0 20 40 60 80 100
Yes
No
Percent (n=98)
WMU 3B

808 Responsive Management Results for WMU 3B
Q13. How satisfied are you with opportunities to view or watch deer in Pennsylvania?
41
19
22
9
4
6
0 20 40 60 80 100
Very satisfied
Somewhatsatisfied
Neither satisfiednor dissatisfied
Somewhatdissatisfied
Very dissatisfied
Don't know
Percent (n=407)
WMU 3B

Pennsylvania Residents’ Opinions on and Attitudes Toward Deer and Deer Management 809 Results for WMU 3B OPINIONS ON DEER IN GENERAL AND THE SIZE AND HEALTH OF THE DEER HERD
Opinion on deer is mostly favorable: 60% of residents of WMU 3B
say with no caveats that they like having deer around, another 19%
like having deer around but worry about the problems they may cause,
and only 3% generally regard them as a nuisance. The remainder have
no particular feeling about deer.
Another question asked residents of WMU 3B how deer-related issues compared to other
issues in their life, on a scale of 0 to 10, with the most importance being 10: the median
rating is 4. The most common ratings are “0” (22%) and the midpoint of “5” (17%). In
general, ratings are well spread across the scale.
Two other ratings questions asked respondents to rate their concern about deer-related issues.
The median level of concern is “6” for the quality of deer habitat in Pennsylvania and “7” for
the health of the deer population in Pennsylvania. The ratings of the latter are mostly
concentrated in the upper end of the scale.
The survey asked about the perceived size of the deer herd in the respondent’s area. The
majority of residents of WMU 3B say that the herd size is just right (59%); otherwise, more
say that it is too low (24%) than too high (7%).
• Those who own their home are more likely, compared to those who do not own their
home, to say that the deer population in their area is just right; they are less likely to
say that the deer population is either too high or too low.
• Those who consider themselves to be a hunter are more likely to say that the deer
population in their area is too low, compared to those who are not hunters.
WMU 3B
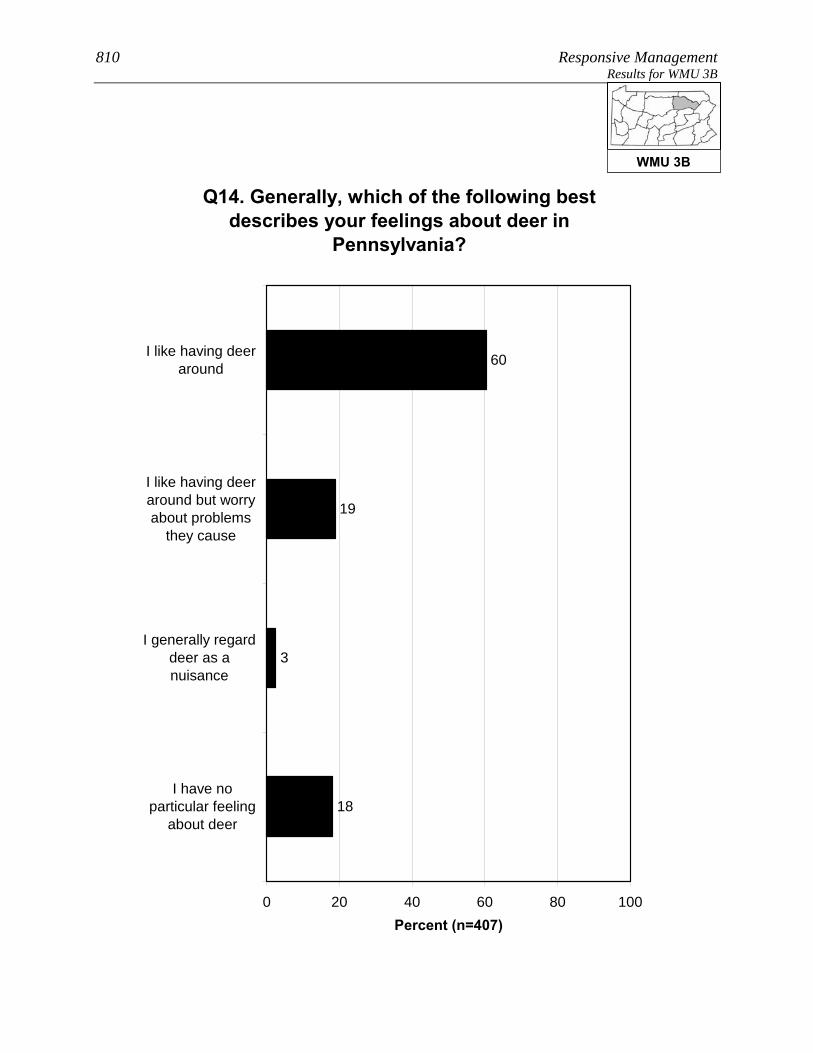
810 Responsive Management Results for WMU 3B
Q14. Generally, which of the following best describes your feelings about deer in
Pennsylvania?
60
19
3
18
0 20 40 60 80 100
I like having deeraround
I like having deeraround but worryabout problems
they cause
I generally regarddeer as anuisance
I have noparticular feeling
about deer
Percent (n=407)
WMU 3B

Pennsylvania Residents’ Opinions on and Attitudes Toward Deer and Deer Management 811 Results for WMU 3B
Q15. Compared to other issues in your life, how important to you, personally, are deer-related
issues on a scale of 0 to 10 where 0 is not at all important and 10 is extremely important?
5
12
6
8
2
11
3
7
17
6
22
1
0 20 40 60 80 100
10
9
8
7
6
5
4
3
2
1
0
Don't know
Percent (n=407)
Mean = 4.09Median = 4
WMU 3B
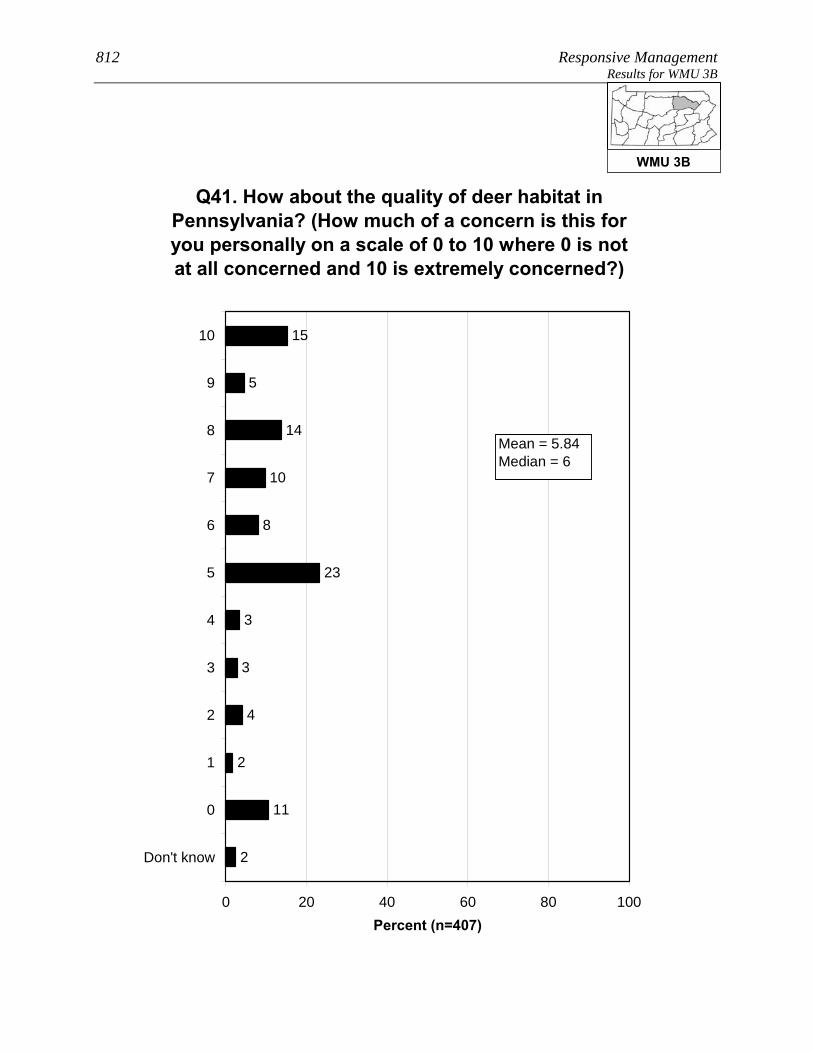
812 Responsive Management Results for WMU 3B
Q41. How about the quality of deer habitat in Pennsylvania? (How much of a concern is this for you personally on a scale of 0 to 10 where 0 is not at all concerned and 10 is extremely concerned?)
4
3
3
15
5
14
10
8
23
2
11
2
0 20 40 60 80 100
10
9
8
7
6
5
4
3
2
1
0
Don't know
Percent (n=407)
Mean = 5.84Median = 6
WMU 3B
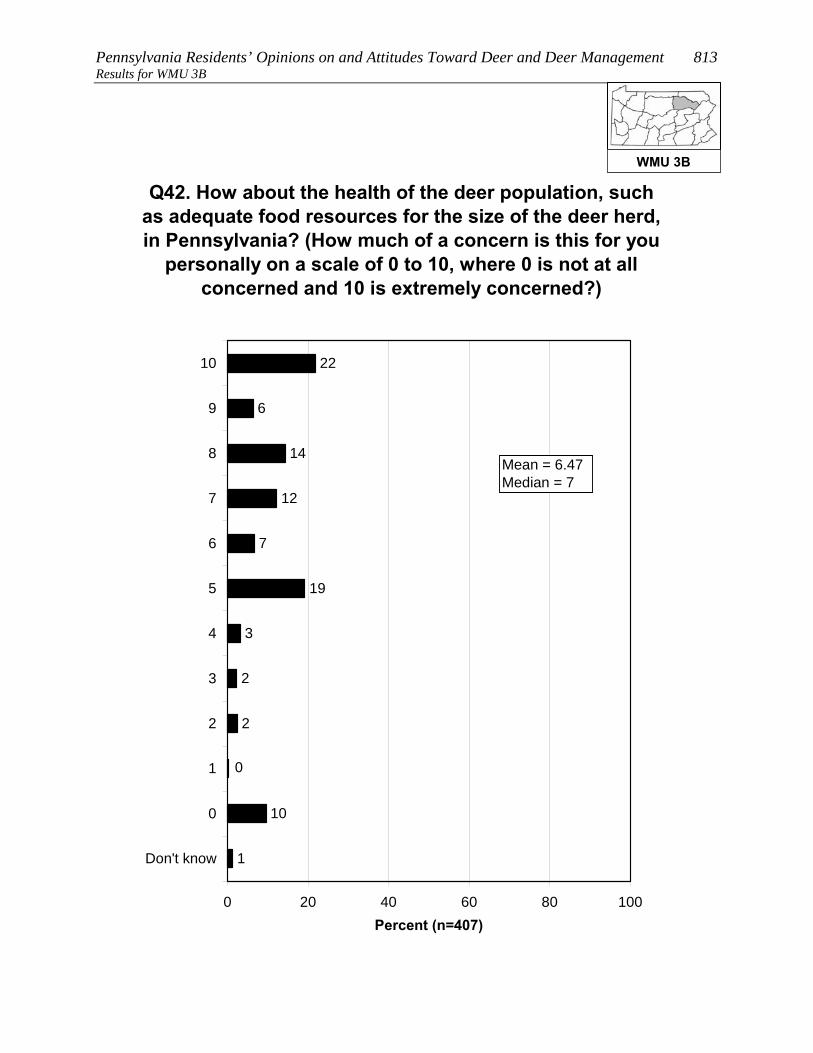
Pennsylvania Residents’ Opinions on and Attitudes Toward Deer and Deer Management 813 Results for WMU 3B
2
2
3
22
6
14
12
7
19
0
10
1
0 20 40 60 80 100
10
9
8
7
6
5
4
3
2
1
0
Don't know
Percent (n=407)
Mean = 6.47Median = 7
Q42. How about the health of the deer population, such as adequate food resources for the size of the deer herd, in Pennsylvania? (How much of a concern is this for you
personally on a scale of 0 to 10, where 0 is not at all concerned and 10 is extremely concerned?)
WMU 3B
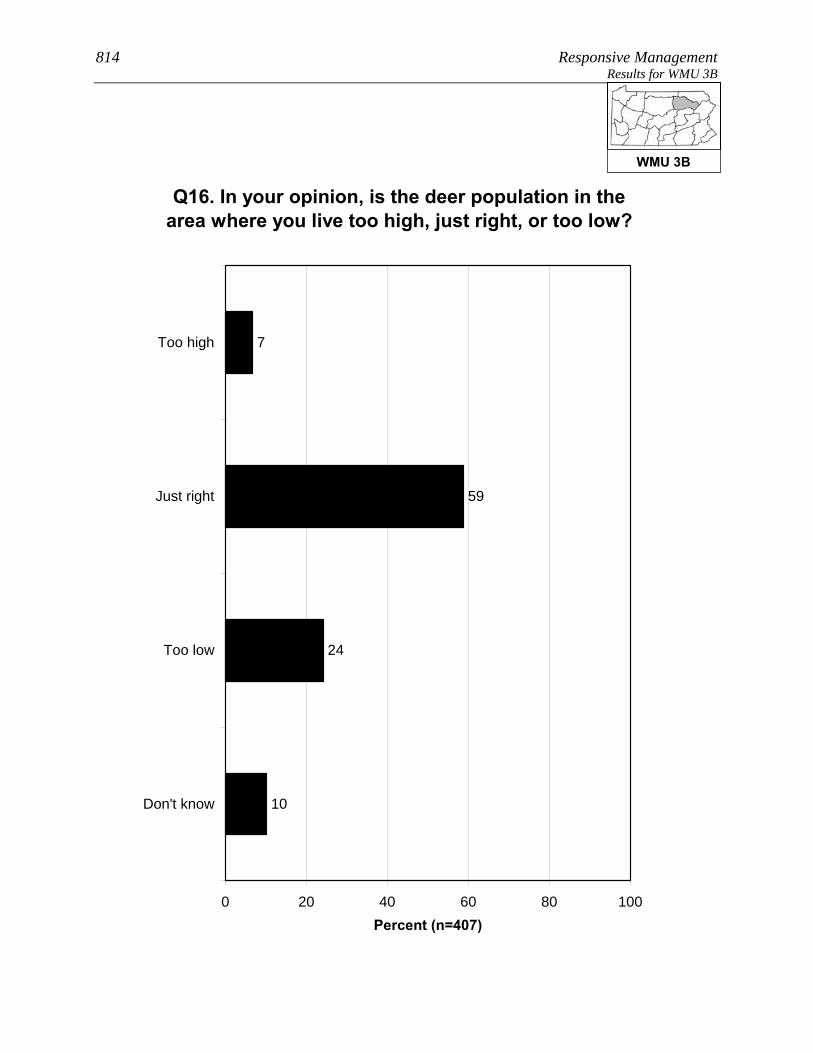
814 Responsive Management Results for WMU 3B
Q16. In your opinion, is the deer population in the area where you live too high, just right, or too low?
7
59
24
10
0 20 40 60 80 100
Too high
Just right
Too low
Don't know
Percent (n=407)
WMU 3B
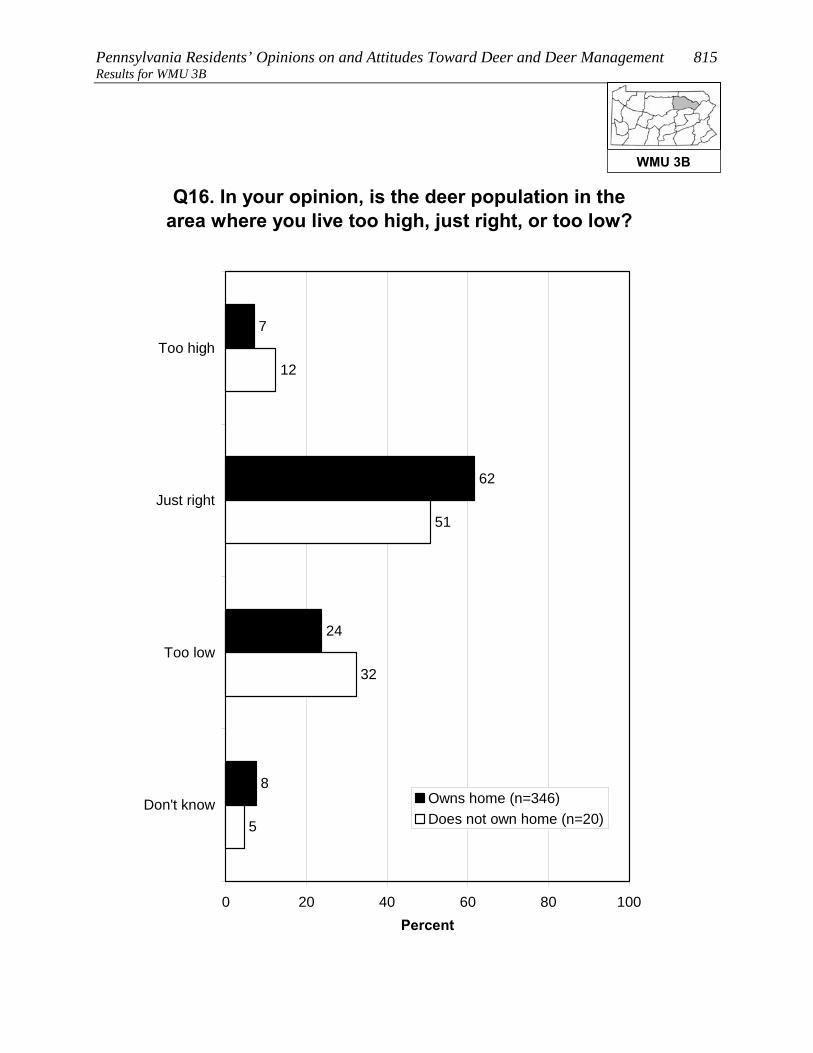
Pennsylvania Residents’ Opinions on and Attitudes Toward Deer and Deer Management 815 Results for WMU 3B
Q16. In your opinion, is the deer population in the area where you live too high, just right, or too low?
7
62
24
8
32
51
12
5
0 20 40 60 80 100
Too high
Just right
Too low
Don't know
Percent
Owns home (n=346)Does not own home (n=20)
WMU 3B
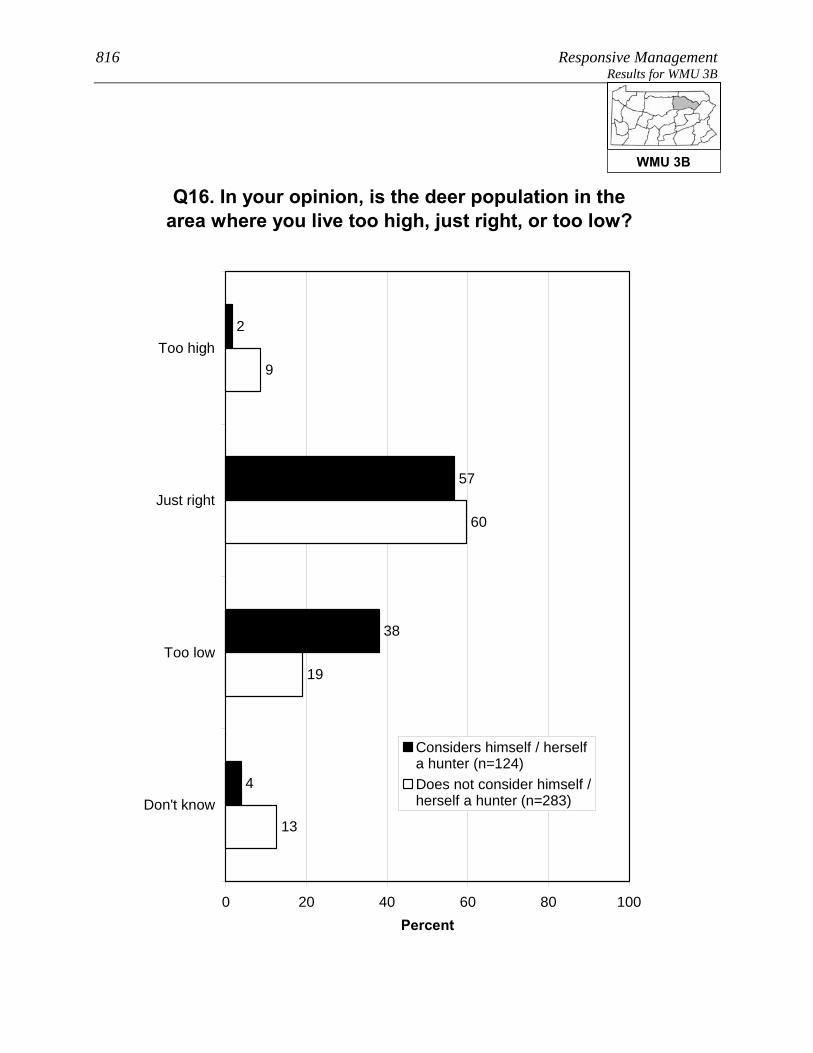
816 Responsive Management Results for WMU 3B
Q16. In your opinion, is the deer population in the area where you live too high, just right, or too low?
2
57
38
4
19
60
9
13
0 20 40 60 80 100
Too high
Just right
Too low
Don't know
Percent
Considers himself / herselfa hunter (n=124)Does not consider himself /herself a hunter (n=283)
WMU 3B

Pennsylvania Residents’ Opinions on and Attitudes Toward Deer and Deer Management 817 Results for WMU 3B OPINIONS ON MANAGEMENT EFFORTS AND MANAGEMENT GOALS
The survey asked about three deer population management goals. For
all three, a large majority agree with the management goal, but the
most support is for goals that address ecological concerns rather than
human concerns: 93% agree with managing the deer for a healthy and
sustainable forest habitat, 93% agree with managing for healthy and
sustainable deer populations, and 80% agree with managing for safe,
acceptable levels of deer-human conflicts.
Residents of WMU 3B who said that the deer population in their area is too high or too low
were asked to indicate the reasonable number of years it should take to achieve an acceptable
deer population. The mean amount is 3.80 years. While 28% said that they do not know,
nearly all the rest gave a number of years of 10 or less. Note that this is only among those
who said the deer population was too high or too low.
• Because management plans typically look at a time frame of about 10 years to effect
change, the survey specifically asked if these respondents would be willing to wait
more than 10 years to achieve an acceptable deer population: less than a majority
(43%) indicated that they would be willing to wait that long.
WMU 3B
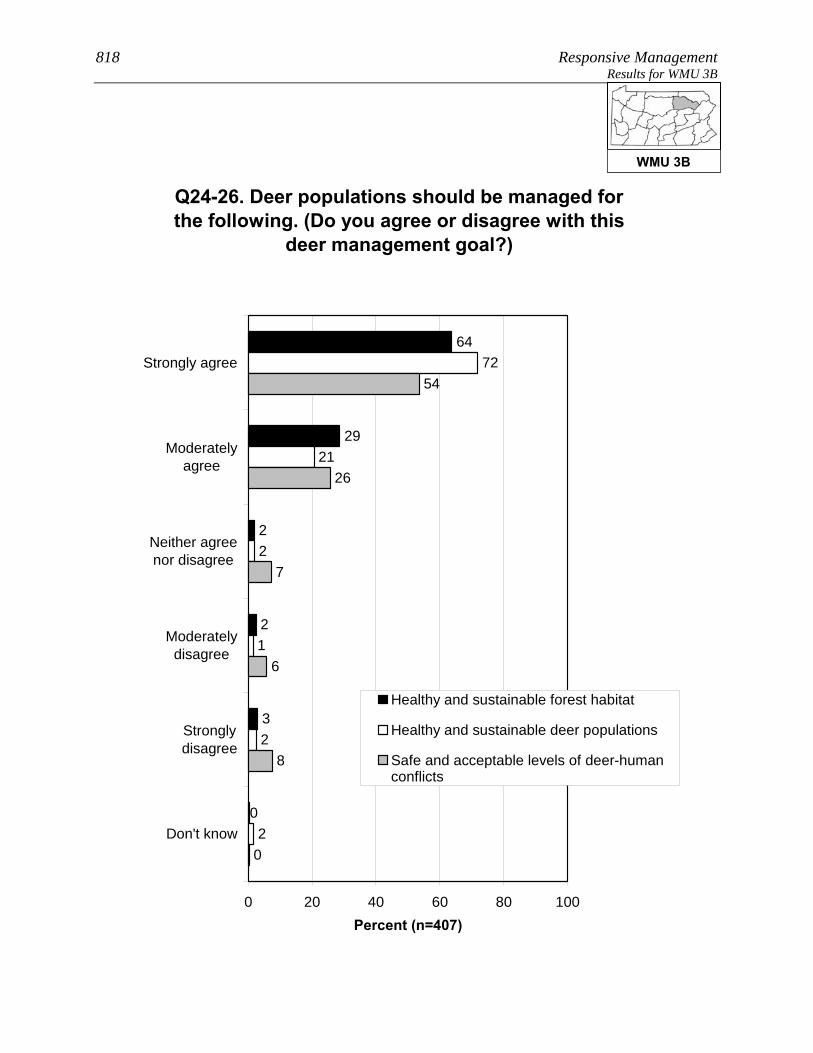
818 Responsive Management Results for WMU 3B
Q24-26. Deer populations should be managed for the following. (Do you agree or disagree with this
deer management goal?)
64
29
2
2
3
0
2
21
72
1
2
2
6
54
26
7
8
0
0 20 40 60 80 100
Strongly agree
Moderatelyagree
Neither agreenor disagree
Moderatelydisagree
Stronglydisagree
Don't know
Percent (n=407)
Healthy and sustainable forest habitat
Healthy and sustainable deer populations
Safe and acceptable levels of deer-humanconflicts
WMU 3B

Pennsylvania Residents’ Opinions on and Attitudes Toward Deer and Deer Management 819 Results for WMU 3B
28
4
9
1
6
23
1
17
12
0 20 40 60 80 100
More than 10years
6-10 years
5 years
4 years
3 years
2 years
1 year
Less than a year
Don't know
Percent (n=120)
Q18. You said the deer population in the area where you live is [too high / too low]. In years, what is a
reasonable amount of time to achieve an acceptable deer population in the area where you live? (Asked of those who think the deer population in the area where
they live is too high or too low.)
Mean = 3.80Median = 3
WMU 3B
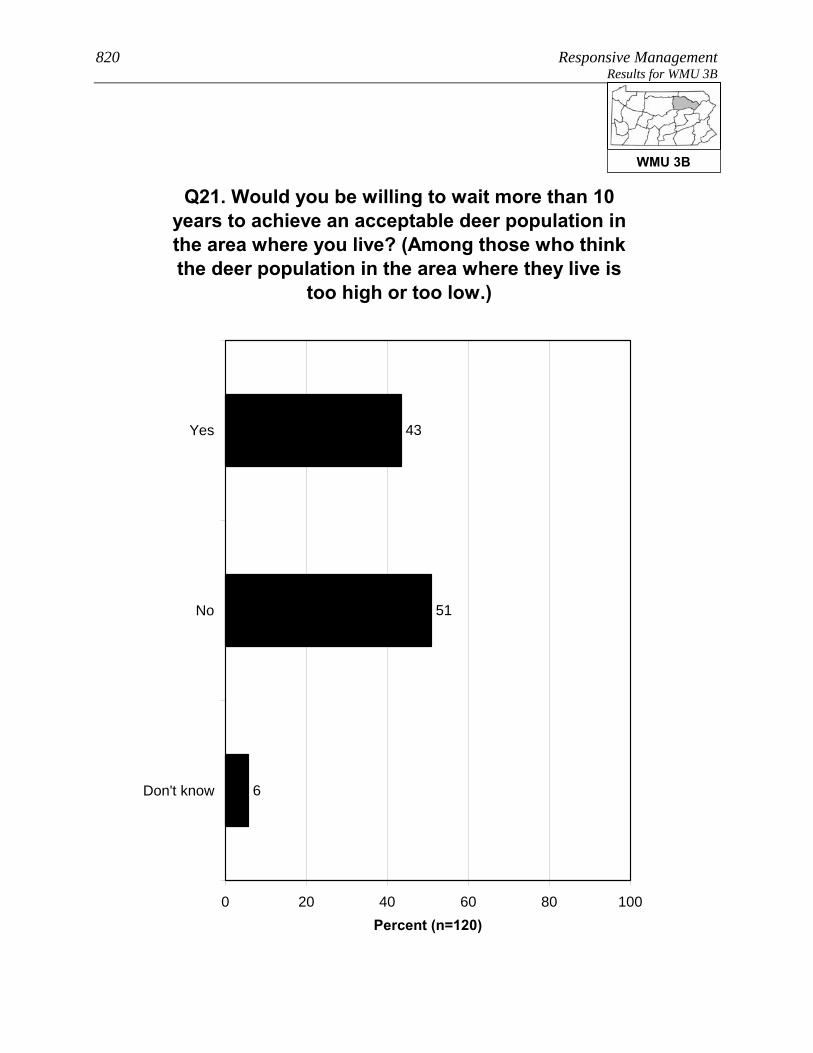
820 Responsive Management Results for WMU 3B
Q21. Would you be willing to wait more than 10 years to achieve an acceptable deer population in the area where you live? (Among those who think the deer population in the area where they live is
too high or too low.)
43
51
6
0 20 40 60 80 100
Yes
No
Don't know
Percent (n=120)
WMU 3B

Pennsylvania Residents’ Opinions on and Attitudes Toward Deer and Deer Management 821 Results for WMU 3B OPINIONS ON METHODS FOR MANAGING DEER, INCLUDING HUNTING
Two-thirds of residents of WMU 3B (67%) support lethal methods to
manage deer populations in Pennsylvania; nonetheless, 28% oppose,
mostly strong opposition.
• Those residents of WMU 3B who live in a single-family home and own their home are
much more likely to strongly support lethal methods, compared to those who live in a
single-family home but do not own their home.
• The survey asked about four methods of controlling deer populations (three of them
lethal). The most support is for legal, regulated hunting (86% of respondents support
this method), distantly followed by fertility/birth control (37%), professionals or
sharpshooters (29%), and trapping and killing (18%).
Two questions asked respondents about hunting on their land (among those who live in a
single-family home), the first question about hunting by the respondents themselves (6% do
so) and the second regarding allowing others to hunt on their land (9% do so). In combining
the results, 10% of residents of WMU 3B who live in a single-family home either hunt on
their own land or allow others to do so (it is not simply a sum of the two questions because
some hunt on their property and allow others to do so as well).
• There was interest in seeing how a particular subgroup responded on this question, the
subgroup being those who live in a single-family home; who live on 1 acre or less; and
who live in an urban, suburban area, or a small city/town. Among this subgroup, 4%
either hunt on their own property or allow others to hunt on the property.
• Those respondents who do not allow hunting on their property were asked to indicate
why they prohibit it. The most common reasons are that they live in an urban or
suburban area in which hunting is not possible or feasible and/or that their property is
too small. Other minor reasons are a general opposition to hunting, concerns about
safety, and liability concerns.
• Those same respondents who do not allow hunting on their property were asked about
their likelihood of ever allowing others to hunt deer on their property; they
overwhelmingly say this is very unlikely (97%). They were then asked if there is
WMU 3B
822 Responsive Management Results for WMU 3B
anything that would make them more likely to allow deer hunting;
they are almost unanimous (99.6%) in saying that there is nothing
that would make them more likely to allow deer hunting.
• The question about allowing others to hunt on their property was examined among the
subgroup previously discussed (those who live in a single-family home; who live on 1
acre or less; and who live in an urban, suburban area, or a small city/town). Among
this group who got the question, nearly all say that they would never allow hunting.
o Additional follow-up questions to be asked of those who indicated that something
might prompt them to allow hunting on their property did not have enough
respondents for statistical validity; therefore, they are not shown.
WMU 3B

Pennsylvania Residents’ Opinions on and Attitudes Toward Deer and Deer Management 823 Results for WMU 3B
Q27. In general, do you support or oppose lethal methods to manage deer populations in
Pennsylvania?
42
25
6
5
23
0 20 40 60 80 100
Strongly support
Moderatelysupport
Neither supportnor oppose
Moderatelyoppose
Strongly oppose
Percent (n=407)
WMU 3B
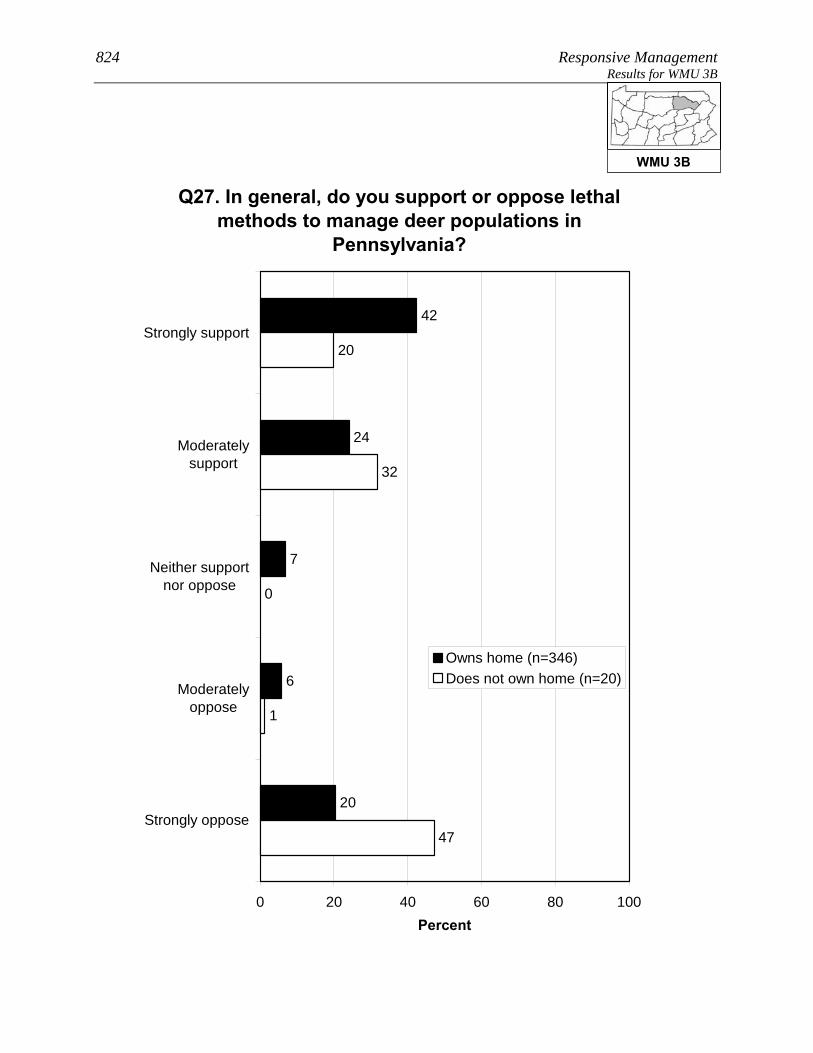
824 Responsive Management Results for WMU 3B
Q27. In general, do you support or oppose lethal methods to manage deer populations in
Pennsylvania?
42
24
7
6
20
0
32
20
1
47
0 20 40 60 80 100
Strongly support
Moderatelysupport
Neither supportnor oppose
Moderatelyoppose
Strongly oppose
Percent
Owns home (n=346)Does not own home (n=20)
WMU 3B
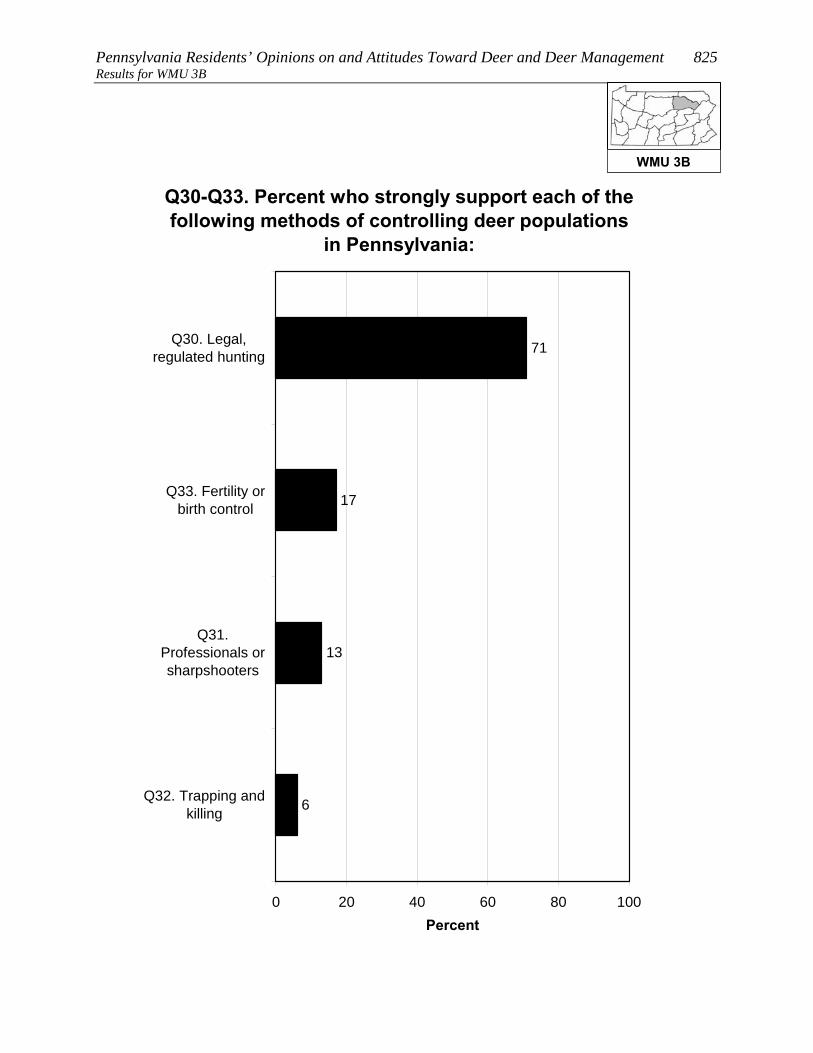
Pennsylvania Residents’ Opinions on and Attitudes Toward Deer and Deer Management 825 Results for WMU 3B
Q30-Q33. Percent who strongly support each of the following methods of controlling deer populations
in Pennsylvania:
6
13
17
71
0 20 40 60 80 100
Q30. Legal,regulated hunting
Q33. Fertility orbirth control
Q31.Professionals orsharpshooters
Q32. Trapping andkilling
Percent
WMU 3B

826 Responsive Management Results for WMU 3B
Q30-Q33. Percent who strongly or moderately support each of the following methods of
controlling deer populations in Pennsylvania:
18
29
37
86
0 20 40 60 80 100
Q30. Legal,regulated hunting
Q33. Fertility orbirth control
Q31.Professionals orsharpshooters
Q32. Trapping andkilling
Percent
WMU 3B
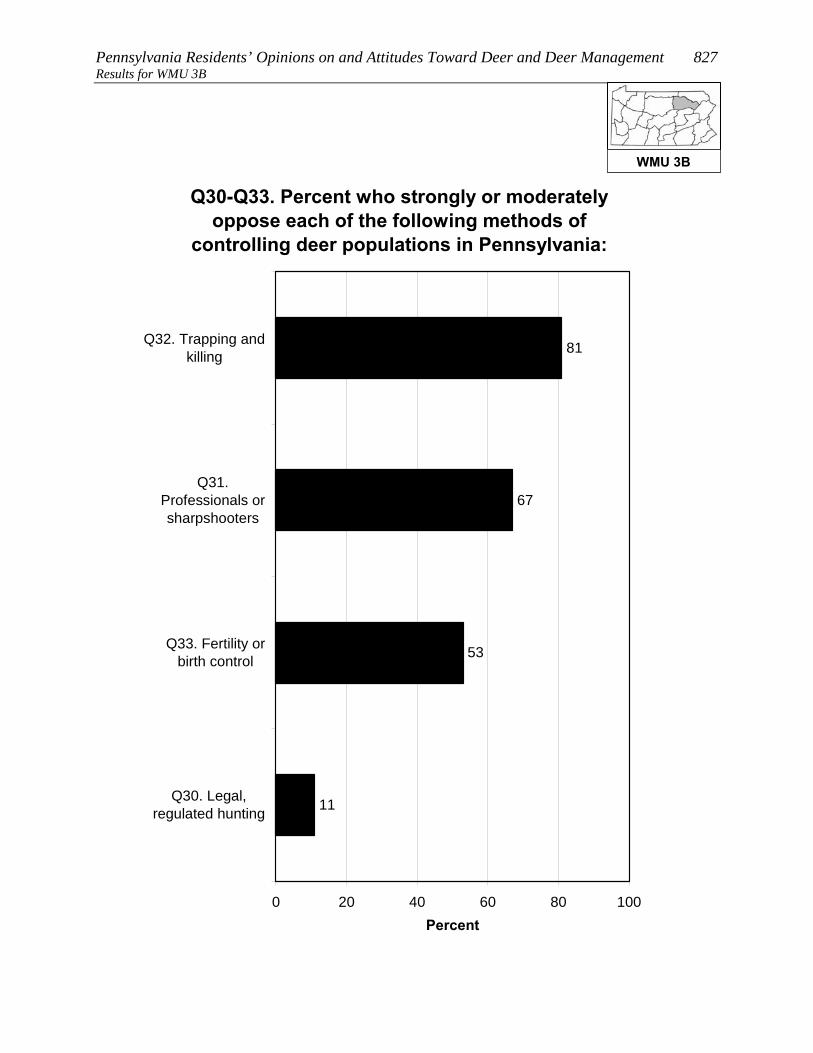
Pennsylvania Residents’ Opinions on and Attitudes Toward Deer and Deer Management 827 Results for WMU 3B
Q30-Q33. Percent who strongly or moderately oppose each of the following methods of
controlling deer populations in Pennsylvania:
11
53
67
81
0 20 40 60 80 100
Q32. Trapping andkilling
Q31.Professionals orsharpshooters
Q33. Fertility orbirth control
Q30. Legal,regulated hunting
Percent
WMU 3B

828 Responsive Management Results for WMU 3B
Q30-Q33. Percent who strongly oppose each of the following methods of controlling deer populations
in Pennsylvania:
8
44
54
67
0 20 40 60 80 100
Q32. Trapping andkilling
Q31.Professionals orsharpshooters
Q33. Fertility orbirth control
Q30. Legal,regulated hunting
Percent
WMU 3B

Pennsylvania Residents’ Opinions on and Attitudes Toward Deer and Deer Management 829 Results for WMU 3B
Q59/60. Deer hunts and/or allows others to deer hunt on property. (Among respondents living in a
single-family home.)
10
90
0 20 40 60 80 100
Yes
No
Percent (n=366)
WMU 3B

830 Responsive Management Results for WMU 3B
Q59/60. Deer hunts and/or allows others to deer hunt on property. (Among respondents living in a
single-family home.)
4
96
0 20 40 60 80 100
Yes
No
Percent
Lives in a single family home on 1 acre or less in anurban area, a suburban area, or a small city/town(n=259)
WMU 3B

Pennsylvania Residents’ Opinions on and Attitudes Toward Deer and Deer Management 831 Results for WMU 3B
Q63. What are the main reasons you do not allow others to hunt deer on your property? (Asked of
those whose primary place of residence is a single-family home and who do not allow others to
hunt deer on their property.)
2
65
47
8
5
2
1
0 20 40 60 80 100
Live in residential neighborhood /suburban or urban area
Property is too small / neighbors too close
Oppose hunting in general
Concerned about safety
Liability
Not interested in allowing hunting onproperty, but did not indicate opposition to
hunting in general
Other
Mul
tiple
Res
pons
es A
llow
ed
Percent (n=326)
WMU 3B

832 Responsive Management Results for WMU 3B
Q65. How likely are you to ever allow others to deer hunt on your property? (Asked of those whose
primary place of residence is a single-family home and who do not allow others to hunt deer on their
property.)
1
1
1
97
1
0 20 40 60 80 100
Somewhat likely
Neither likely norunlikely
Somewhat unlikely
Very unlikely
Don't know
Percent (n=326)
WMU 3B
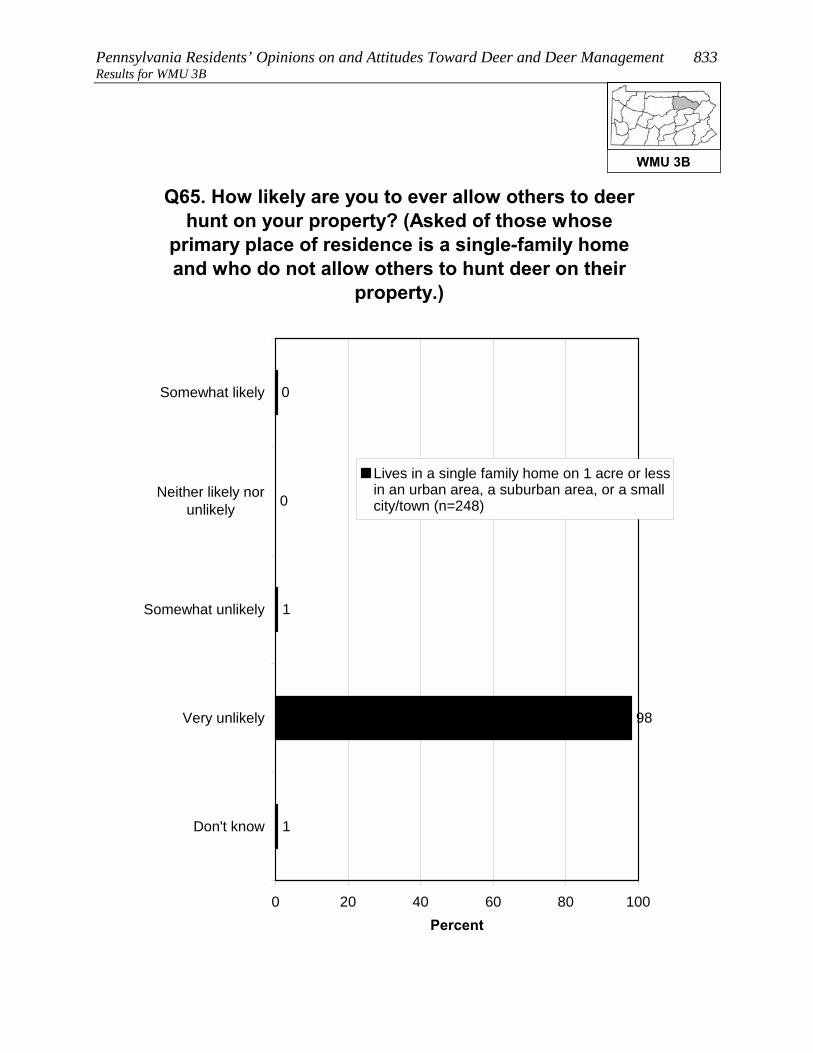
Pennsylvania Residents’ Opinions on and Attitudes Toward Deer and Deer Management 833 Results for WMU 3B
Q65. How likely are you to ever allow others to deer hunt on your property? (Asked of those whose
primary place of residence is a single-family home and who do not allow others to hunt deer on their
property.)
0
0
1
98
1
0 20 40 60 80 100
Somewhat likely
Neither likely norunlikely
Somewhat unlikely
Very unlikely
Don't know
Percent
Lives in a single family home on 1 acre or lessin an urban area, a suburban area, or a smallcity/town (n=248)
WMU 3B

834 Responsive Management Results for WMU 3B
Q66. Is there anything that would make you more likely to allow deer hunting on your property?
(Asked of those whose primary place of residence is a single-family home and who do not allow
others to hunt deer on their property.)
0.2
99.6
0.2
0 20 40 60 80 100
Yes
No
Don't know
Percent (n=326)
WMU 3B

Pennsylvania Residents’ Opinions on and Attitudes Toward Deer and Deer Management 835 Results for WMU 3B CONCERNS ABOUT DEER AND DEER NUISANCE PROBLEMS
Seven questions asked about respondents’ level of concern about
issues associated with deer. For each issue, respondents rated their
level of concern about it using a 10-point scale, with 10 being the most
concerned.
• The most concern was for tick-borne diseases (mean rating of 7.4), followed by three
whose means are fairly close to one another: the health of the deer population (6.5),
deer-vehicle accidents (6.3), and the quality of deer habitat (5.8).
• At the bottom are concern about deer impacts on habitat and other wildlife (even
though this can be considerable) (3.6) and the two impacts to residents’ landscaping:
deer damage to plants and landscaping (1.6) and deer droppings in the yard (1.0).
o Another graph shows the percentage who gave a high rating (a “9” or “10”),
providing an idea of the percentage who feel strongly about the issues.
Among residents of WMU 3B, 43% indicated that they saw deer on their property in the past
12 months.
• Respondents who fed birds were more likely to indicate seeing deer, as were
respondents who fed deer or put out attractants or were aware of neighbors who fed
deer or put out attractants.
The survey asked about specific nuisance problems with deer that residents of WMU 3B may
have experienced: 4% indicated that they experienced problems with deer at their primary
place of residence in the past 12 months; 9% indicated that they or another household
member had been in a vehicle collision with a deer (fortunately, a very low portion of
drivers/passengers were injured); and 3% indicated that they or a household member had
been diagnosed with a tick-borne disease.
• Crosstabulations show that those who fed birds were slightly more likely to have
experienced deer problems. Likewise, those who were aware of neighbors feeding deer
or putting out attractants were much more likely to experience deer problems.
WMU 3B

836 Responsive Management Results for WMU 3B
Q36-42. Mean rating of respondents' concern about each of the following on a 10-point scale:
1.0
7.4
6.5
6.3
5.8
3.6
1.6
0 2 4 6 8 10
Q36. Tick-borne diseases, such as Lymedisease, in Pennsylvania
Q42. The health of the deer population,such as adequate food resources for the
size of the deer herd, in Pennsylvania
Q40. Deer-vehicle accidents inPennsylvania
Q41. The quality of deer habitat inPennsylvania
Q39. Deer impacts on the habitat andother wildlife in Pennsylvania
Q38. Deer damage to plants andlandscaping in his/her yard
Q37. Deer droppings in his/her yard
Mean
WMU 3B

Pennsylvania Residents’ Opinions on and Attitudes Toward Deer and Deer Management 837 Results for WMU 3B
Q36-Q42. Percent who rated their concern about each of the following as a 9 or 10 on a 10-point
scale:
6
5
20
28
28
45
3
0 20 40 60 80 100
Q36. Tick-borne diseases, such asLyme disease, in Pennsylvania
Q40. Deer-vehicle accidents inPennsylvania
Q42. The health of the deerpopulation, such as adequate foodresources for the size of the deer
herd, in Pennsylvania
Q41. The quality of deer habitat inPennsylvania
Q38. Deer damage to plants andlandscaping in his/her yard
Q39. Deer impacts on the habitat andother wildlife in Pennsylvania
Q37. Deer droppings in his/her yard
Percent
WMU 3B
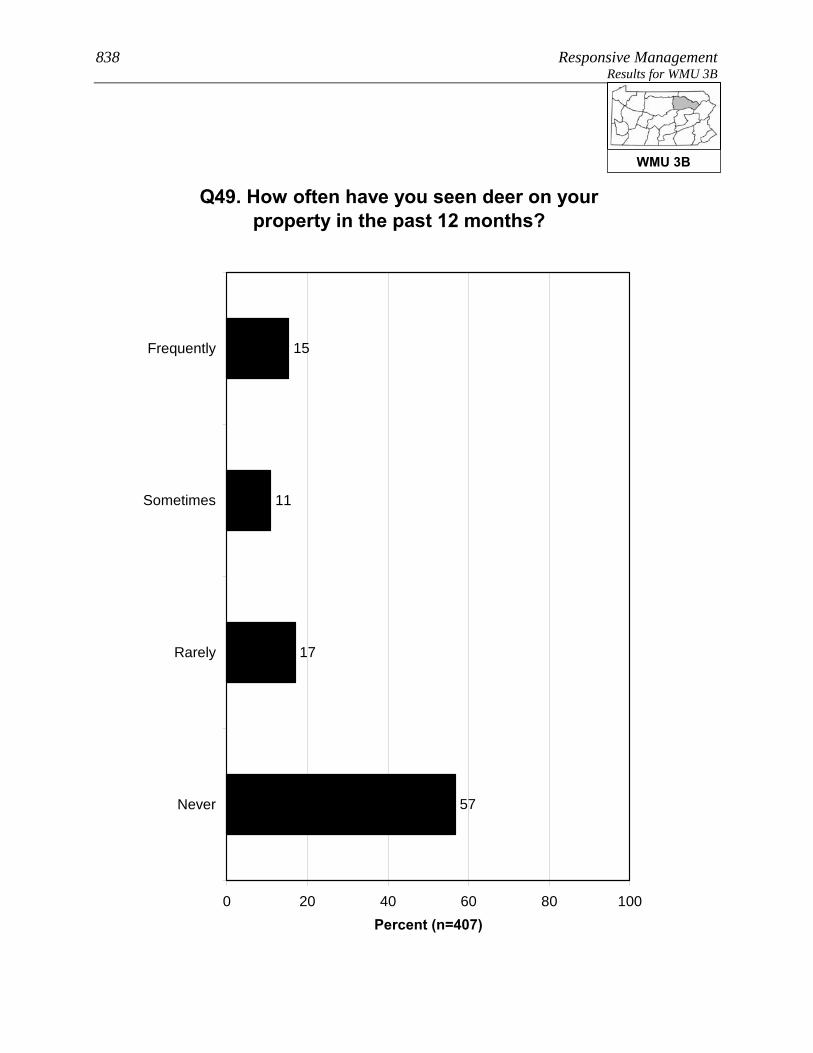
838 Responsive Management Results for WMU 3B
Q49. How often have you seen deer on your property in the past 12 months?
15
11
17
57
0 20 40 60 80 100
Frequently
Sometimes
Rarely
Never
Percent (n=407)
WMU 3B
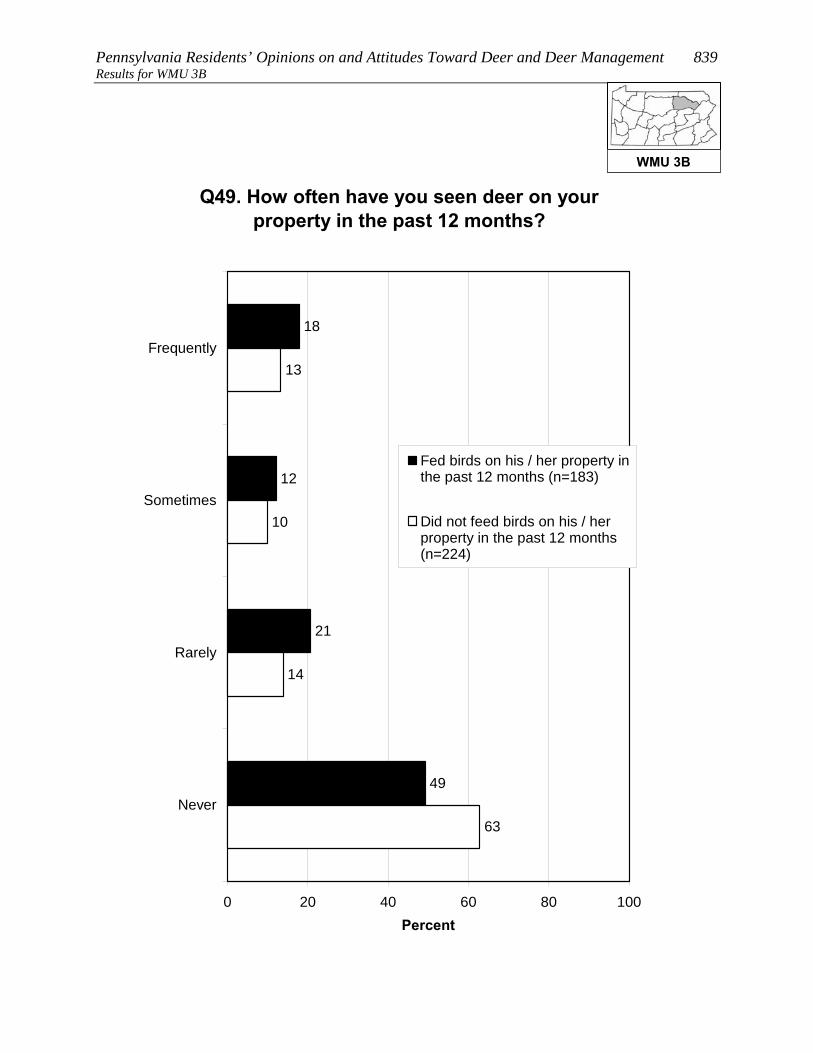
Pennsylvania Residents’ Opinions on and Attitudes Toward Deer and Deer Management 839 Results for WMU 3B
Q49. How often have you seen deer on your property in the past 12 months?
18
12
21
49
14
10
13
63
0 20 40 60 80 100
Frequently
Sometimes
Rarely
Never
Percent
Fed birds on his / her property inthe past 12 months (n=183)
Did not feed birds on his / herproperty in the past 12 months(n=224)
WMU 3B
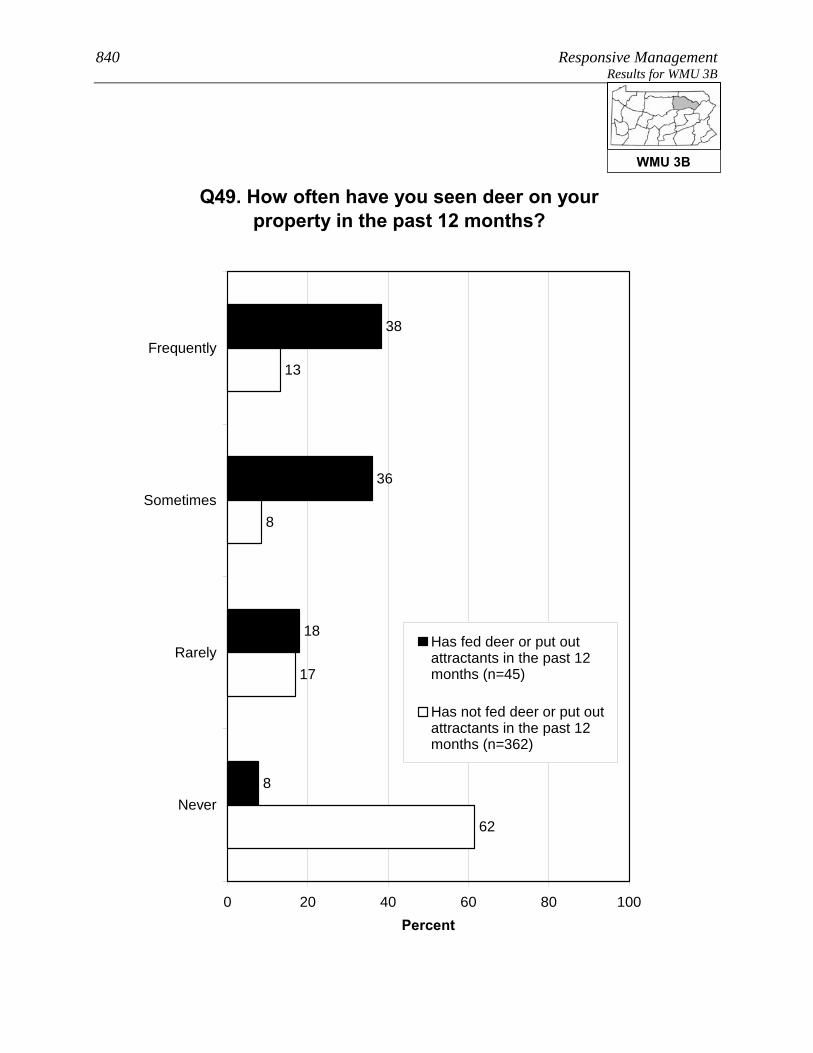
840 Responsive Management Results for WMU 3B
Q49. How often have you seen deer on your property in the past 12 months?
38
36
18
8
17
8
13
62
0 20 40 60 80 100
Frequently
Sometimes
Rarely
Never
Percent
Has fed deer or put outattractants in the past 12months (n=45)
Has not fed deer or put outattractants in the past 12months (n=362)
WMU 3B

Pennsylvania Residents’ Opinions on and Attitudes Toward Deer and Deer Management 841 Results for WMU 3B
Q49. How often have you seen deer on your property in the past 12 months?
58
8
25
9
17
11
13
60
0 20 40 60 80 100
Frequently
Sometimes
Rarely
Never
Percent
Is aware of neighbors feedingdeer or putting out attractantsin the past 12 months (n=23)
Is not aware of neighborsfeeding deer or putting outattractants in the past 12months (n=383)
WMU 3B
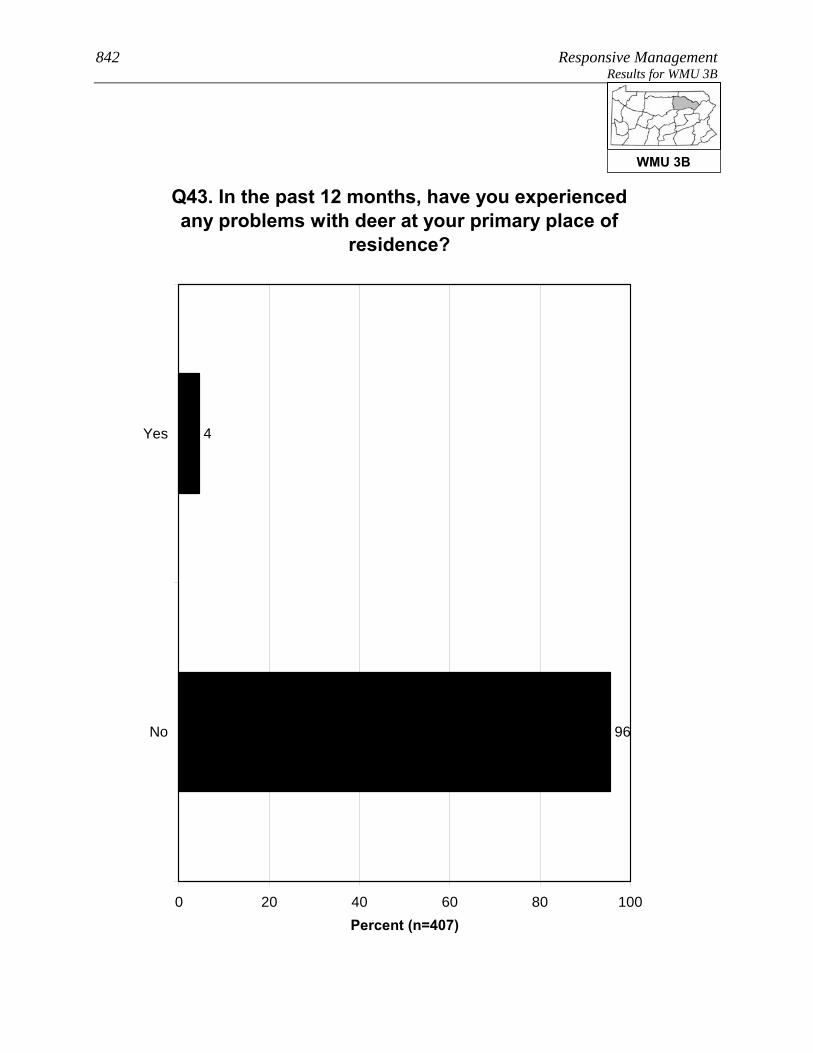
842 Responsive Management Results for WMU 3B
Q43. In the past 12 months, have you experienced any problems with deer at your primary place of
residence?
4
96
0 20 40 60 80 100
Yes
No
Percent (n=407)
WMU 3B

Pennsylvania Residents’ Opinions on and Attitudes Toward Deer and Deer Management 843 Results for WMU 3B
Q43. In the past 12 months, have you experienced any problems with deer at your primary place of
residence?
6
94
97
3
0 20 40 60 80 100
Yes
No
Percent
Fed birds on his / herproperty in the past 12months (n=183)
Did not feed birds on his /her property in the past 12months (n=224)
WMU 3B

844 Responsive Management Results for WMU 3B
Q43. In the past 12 months, have you experienced any problems with deer at your primary place of
residence?
25
75
97
3
0 20 40 60 80 100
Yes
No
Percent
Is aware of neighborsfeeding deer or putting outattractants in the past 12months (n=23)Is not aware of neighborsfeeding deer or putting outattractants in the past 12months (n=383)
WMU 3B
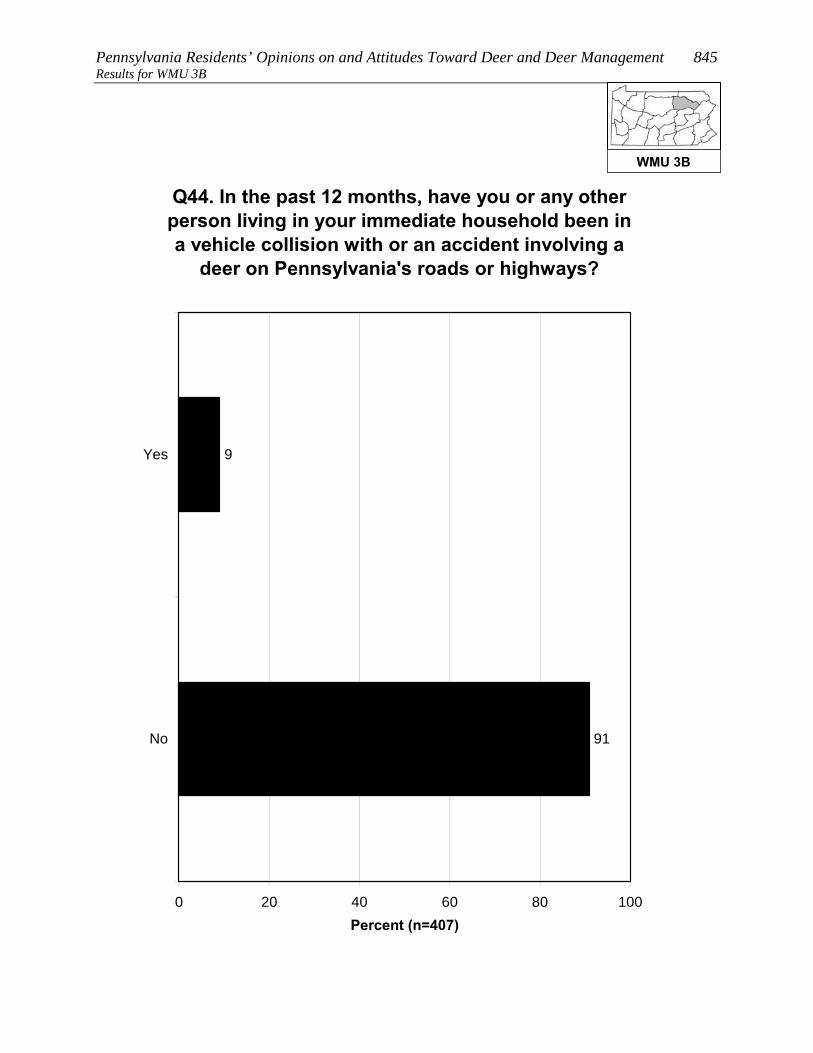
Pennsylvania Residents’ Opinions on and Attitudes Toward Deer and Deer Management 845 Results for WMU 3B
Q44. In the past 12 months, have you or any other person living in your immediate household been in a vehicle collision with or an accident involving a
deer on Pennsylvania's roads or highways?
9
91
0 20 40 60 80 100
Yes
No
Percent (n=407)
WMU 3B

846 Responsive Management Results for WMU 3B
Q45. Were you or anyone else injured? (Asked of those who had a household member who was in or
who have personally been in a vehicle collision with or an accident involving a deer on
Pennsylvania's roads or highways in the past 12 months.)
4
96
0 20 40 60 80 100
Yes
No
Percent (n=36)
WMU 3B
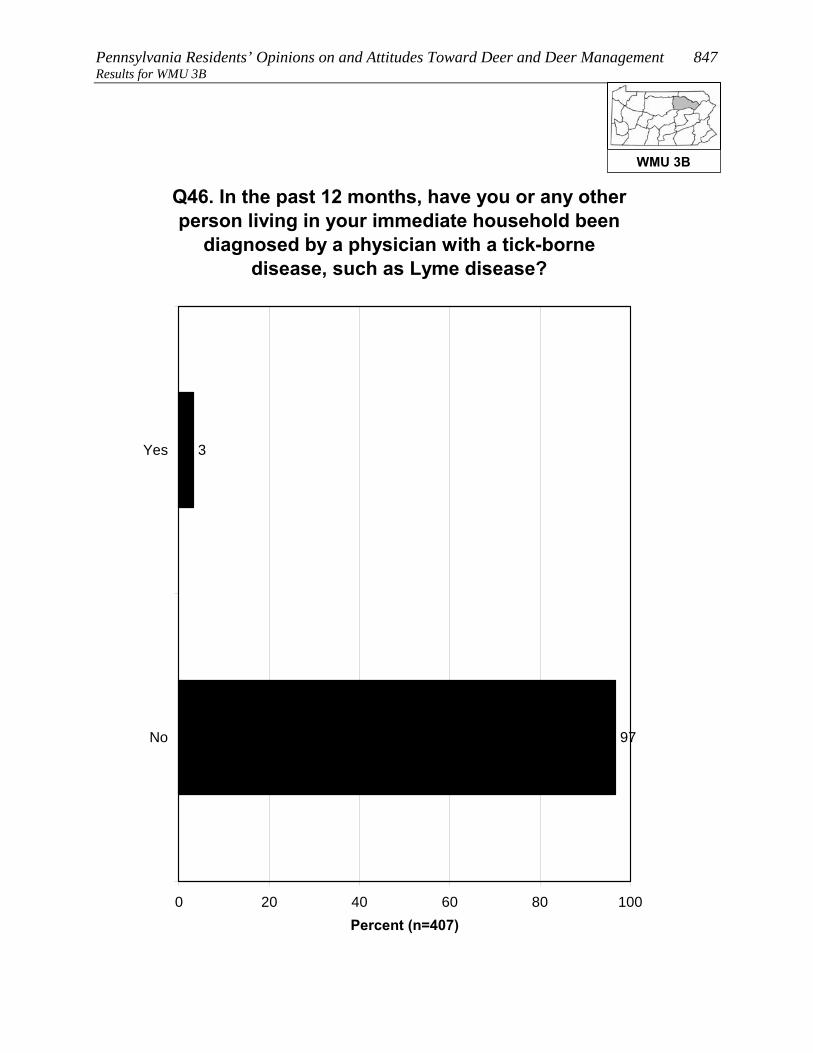
Pennsylvania Residents’ Opinions on and Attitudes Toward Deer and Deer Management 847 Results for WMU 3B
Q46. In the past 12 months, have you or any other person living in your immediate household been
diagnosed by a physician with a tick-borne disease, such as Lyme disease?
3
97
0 20 40 60 80 100
Yes
No
Percent (n=407)
WMU 3B

848 Responsive Management Results for WMU 3B
FEEDING WILDLIFE AND HUNTING DEER Several questions asked about feeding wildlife.
• Feeding deer or putting out deer attractants: 9% of residents of
WMU 3B did this, and 5% are aware of neighbors who did this.
o The most typical feeds or attractants put out by respondents are salt/mineral blocks,
corn, and apples.
• Feeding birds: 45% of residents of WMU 3B did this.
There is no consensus on whether it is okay for private citizens to feed or attract deer in
Pennsylvania: 42% agree that this is okay, but 49% disagree (the rest are neutral).
More than a quarter of residents of WMU 3B (27%) consider themselves to be a hunter,
about two-thirds of whom have a Pennsylvania hunting license.
• Among residents of WMU 3B who live in a single-family home, 6% personally hunt
deer on their property.
• A large majority of residents of WMU 3B (75%) say that they, family members, and/or
friends hunt.
WMU 3B
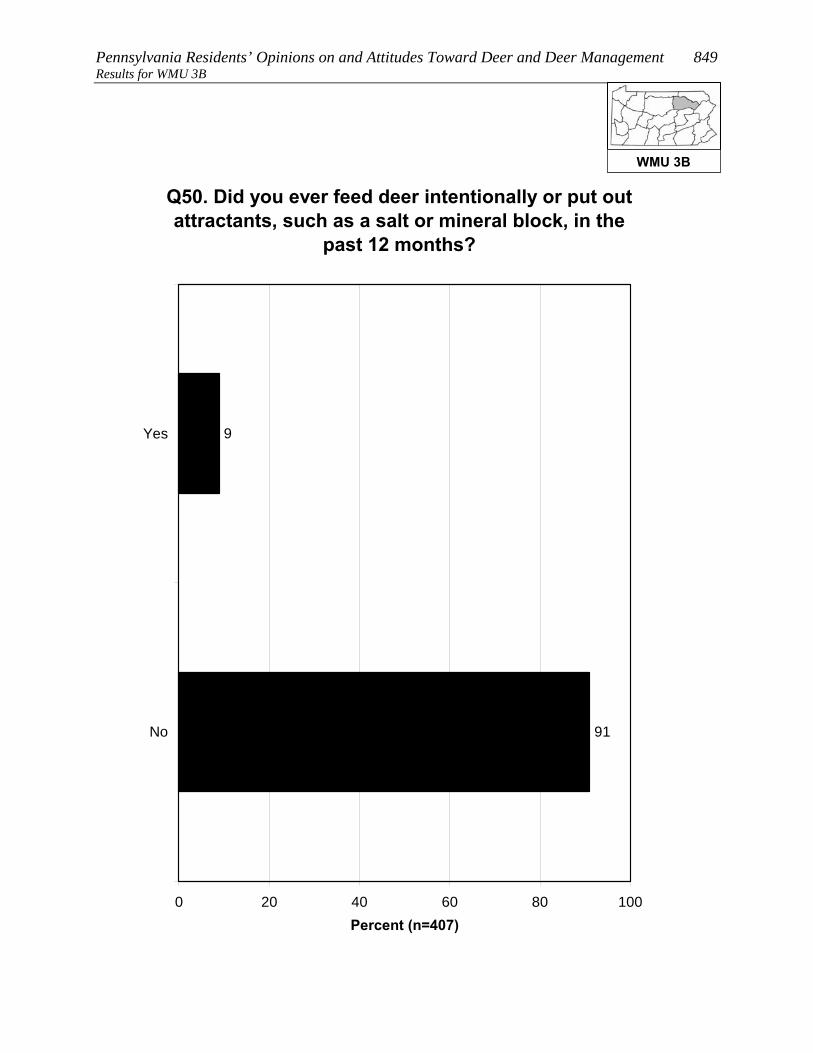
Pennsylvania Residents’ Opinions on and Attitudes Toward Deer and Deer Management 849 Results for WMU 3B
Q50. Did you ever feed deer intentionally or put out attractants, such as a salt or mineral block, in the
past 12 months?
9
91
0 20 40 60 80 100
Yes
No
Percent (n=407)
WMU 3B

850 Responsive Management Results for WMU 3B
Q55. Are you aware of any of your neighbors feeding deer intentionally or trying to attract deer
on their property in the past 12 months?
5
94
Less than 1%
0 20 40 60 80 100
Yes
No
Don't know
Percent (n=407)
WMU 3B
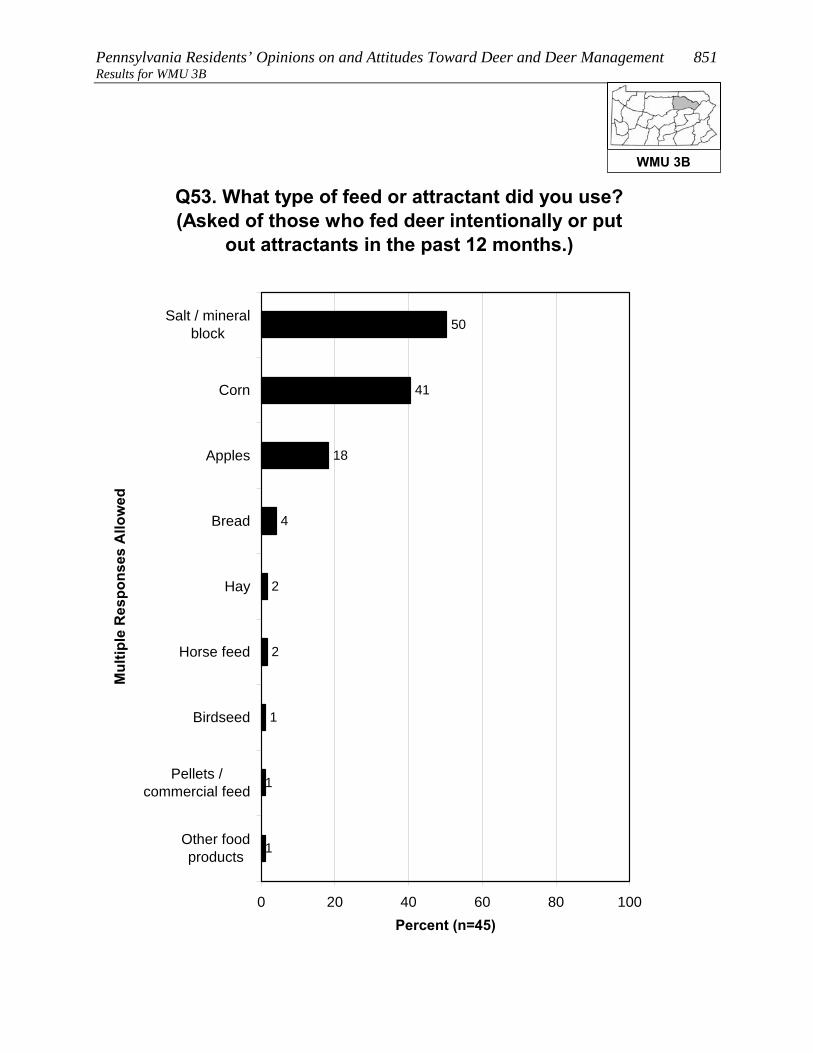
Pennsylvania Residents’ Opinions on and Attitudes Toward Deer and Deer Management 851 Results for WMU 3B
Q53. What type of feed or attractant did you use? (Asked of those who fed deer intentionally or put
out attractants in the past 12 months.)
1
1
1
50
41
18
4
2
2
0 20 40 60 80 100
Salt / mineralblock
Corn
Apples
Bread
Hay
Horse feed
Birdseed
Pellets /commercial feed
Other foodproducts
Mul
tiple
Res
pons
es A
llow
ed
Percent (n=45)
WMU 3B

852 Responsive Management Results for WMU 3B
Q48. Did you feed birds or make birdfeed available on your property in the past 12 months?
45
55
0 20 40 60 80 100
Yes
No
Percent (n=407)
WMU 3B
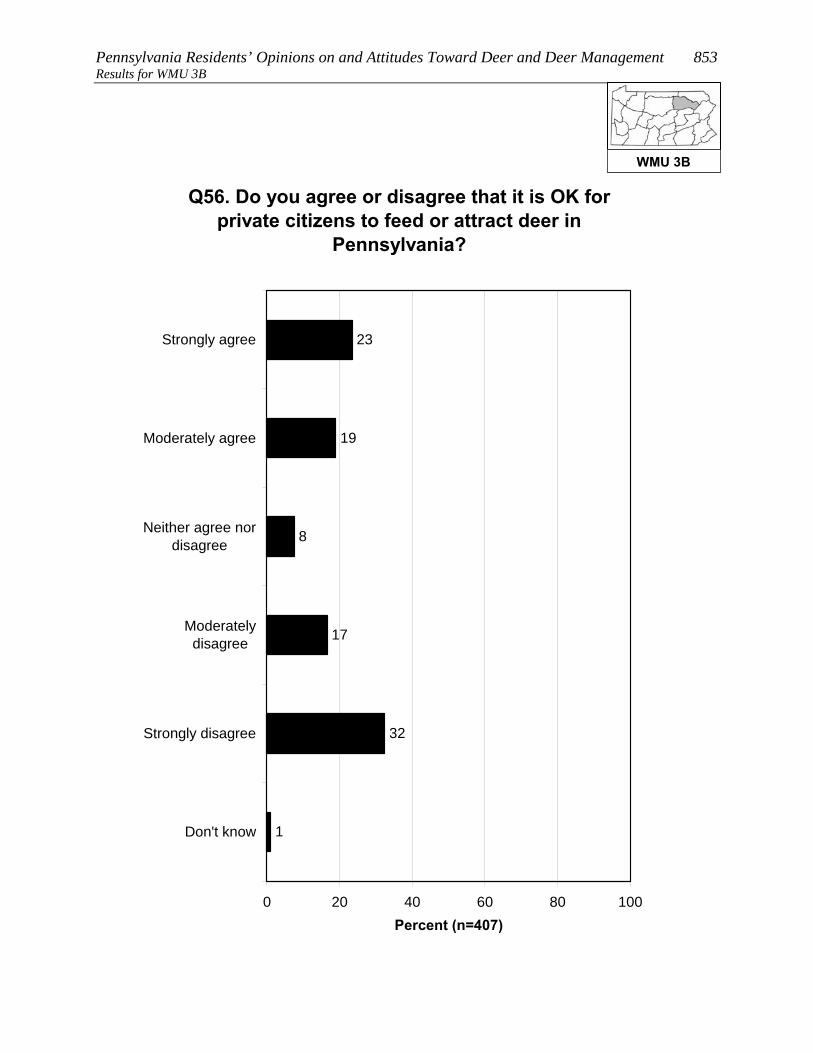
Pennsylvania Residents’ Opinions on and Attitudes Toward Deer and Deer Management 853 Results for WMU 3B
Q56. Do you agree or disagree that it is OK for private citizens to feed or attract deer in
Pennsylvania?
23
19
8
17
32
1
0 20 40 60 80 100
Strongly agree
Moderately agree
Neither agree nordisagree
Moderatelydisagree
Strongly disagree
Don't know
Percent (n=407)
WMU 3B

854 Responsive Management Results for WMU 3B
Q59. Do you personally hunt deer on your property? (Asked of those whose primary place of
residence is a single-family home.)
6
94
0 20 40 60 80 100
Yes
No
Percent (n=366)
WMU 3B

Pennsylvania Residents’ Opinions on and Attitudes Toward Deer and Deer Management 855 Results for WMU 3B
Q79. Do you, any of your family members, or any friends hunt any wildlife species?
75
25
0 20 40 60 80 100
Yes
No
Percent (n=407)
WMU 3B

856 Responsive Management Results for WMU 3B
SOURCES OF INFORMATION Most commonly, residents of WMU 3B say that the best way to
provide them with information about deer in Pennsylvania is through
direct mail (39% gave this response), followed by newspaper (18%),
email (15%), the Internet (15% saying an Internet site other than the
PGC and 5% saying the agency website; note that some said both).
Just about half of residents of WMU 3B (48%) use social media, the most common primary
site being Facebook.
WMU 3B
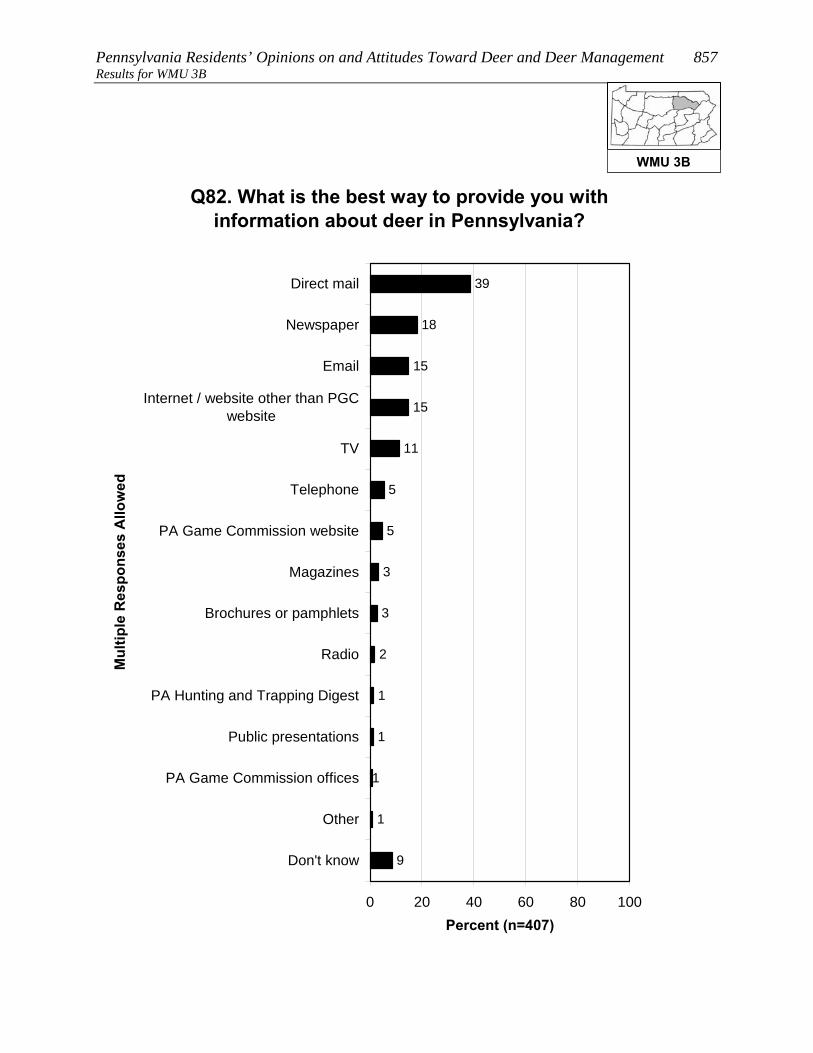
Pennsylvania Residents’ Opinions on and Attitudes Toward Deer and Deer Management 857 Results for WMU 3B
Q82. What is the best way to provide you with information about deer in Pennsylvania?
3
3
5
39
18
15
15
11
5
2
1
1
1
1
9
0 20 40 60 80 100
Direct mail
Newspaper
Internet / website other than PGCwebsite
TV
Telephone
PA Game Commission website
Magazines
Brochures or pamphlets
Radio
PA Hunting and Trapping Digest
Public presentations
PA Game Commission offices
Other
Don't know
Mul
tiple
Res
pons
es A
llow
ed
Percent (n=407)
WMU 3B

858 Responsive Management Results for WMU 3B
Q84. Do you use social media, such as Facebook, Twitter, or YouTube?
48
51
1
0 20 40 60 80 100
Yes
No
Don't know
Percent (n=407)
WMU 3B

Pennsylvania Residents’ Opinions on and Attitudes Toward Deer and Deer Management 859 Results for WMU 3B
Q85. Which social media site do you use most often? (Asked of those who use social media.)
89
6
3
1
1
0 20 40 60 80 100
YouTube
Other
Don't know
Percent (n=192)
WMU 3B

860 Responsive Management Results for WMU 3C
RESULTS FOR WMU 3C Location: From the New York/PA state line, PA Rt. 652 west to US Rt. 6 at Indian Orchard; US Rt. 6 west to Tunkhannock; the boundary between WMUs 3C and 3B between Tunkhannock and Towanda is the Susquehanna River; US Rt. 6 west to PA Rt. 14 near Troy; PA Rt. 14 north to the New York/PA state line.
8. Lives in WMU 3C 1. Does not consider deer-related issues as a 9 or 10 in importance as compared to other issues in his/her life (p < 0.01). 2. Does not indicate having seen deer frequently on his/her property in the past 12 months (p < 0.05). 3. Does not indicate having taken a trip more than a mile from home for the primary purpose of viewing or watching deer in the past 12 months (p < 0.001). 3. Does not indicate having fed deer intentionally or having put out attractants in the past 12 months (p < 0.001). 3. Does not indicate considering himself/herself to be a hunter (p < 0.001). 3. Does not indicate having used a spotlight to view deer at night on a trip to watch deer in the past 12 months (p < 0.01). 3. Does not indicate having a valid 2011 PA general hunting license (p < 0.05). 3. Does not indicate having spent time viewing or watching deer around home in the past 12 months (p < 0.05). 4. Does not strongly or moderately support trapping and killing as a method of controlling deer populations in PA (p < 0.01). 4. Does not strongly or moderately support fertility or birth control as a method of controlling deer populations in PA (p < 0.05). 4. Does not strongly or moderately support professionals or sharpshooters as a method of controlling deer populations in PA (p < 0.05). 5. Does not strongly or moderately agree that it is OK for private citizens to feed or attract deer in PA (p < 0.001). 5. Rates concern about deer damage to plants and landscaping in their yard as a 9 or 10 (p < 0.001). See page 9 through 11 for explanation of how to interpret z-score tables.

Pennsylvania Residents’ Opinions on and Attitudes Toward Deer and Deer Management 861 Results for WMU 3C PARTICIPATION IN VIEWING DEER
A majority of residents of WMU 3C (57%) spent time viewing deer
around their home in the past 12 months, and 20% took a trip of at
least a mile to view deer.
• About a quarter of those who took a deer-viewing trip (24%) used a spotlight to view
the deer at night.
A majority of residents of WMU 3C (71%) are satisfied with opportunities to view deer in
Pennsylvania. Because a relatively large percentage answer neutrally, only 7% indicate
being dissatisfied.
WMU 3C

862 Responsive Management Results for WMU 3C
Q10. Have you spent time viewing or watching deer around your home in the past 12 months?
57
43
0 20 40 60 80 100
Yes
No
Percent (n=434)
WMU 3C
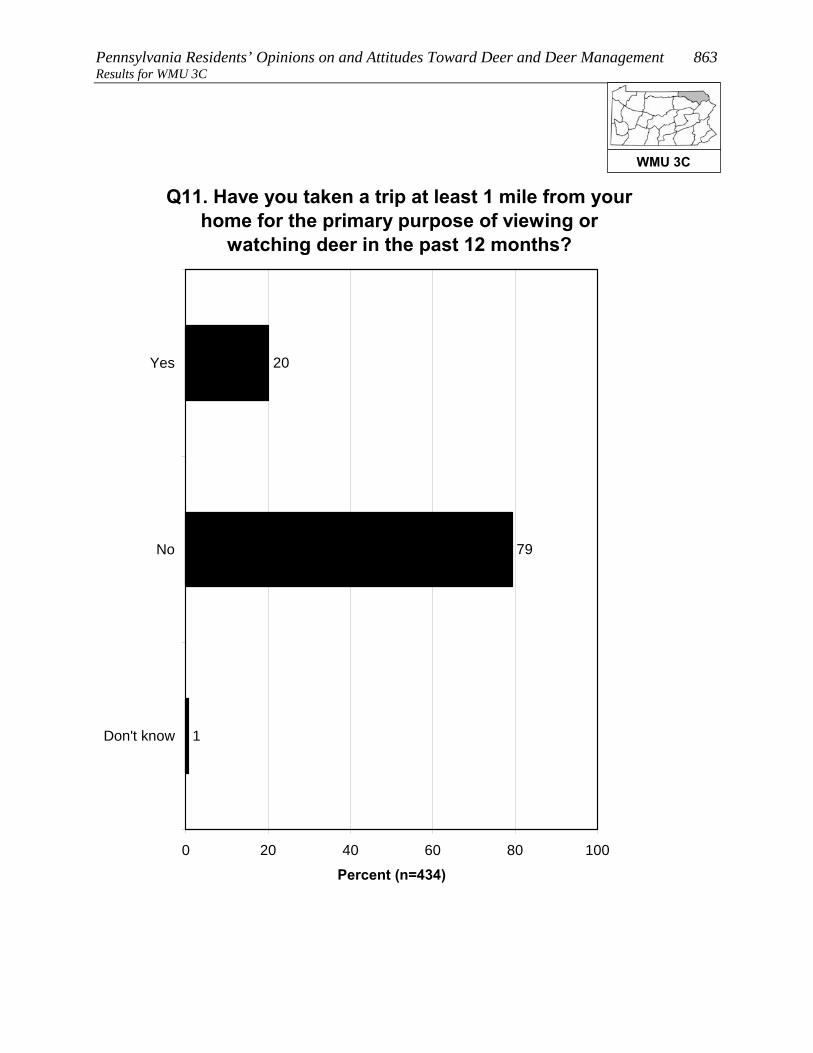
Pennsylvania Residents’ Opinions on and Attitudes Toward Deer and Deer Management 863 Results for WMU 3C
Q11. Have you taken a trip at least 1 mile from your home for the primary purpose of viewing or
watching deer in the past 12 months?
20
79
1
0 20 40 60 80 100
Yes
No
Don't know
Percent (n=434)
WMU 3C

864 Responsive Management Results for WMU 3C
Q12. Did you use a spotlight to view deer at night on a trip to watch deer in the past 12 months?
(Asked of those who took a trip at least 1 mile from their home for the primary purpose of viewing or
watching deer in the past 12 months.)
24
76
0 20 40 60 80 100
Yes
No
Percent (n=92)
WMU 3C
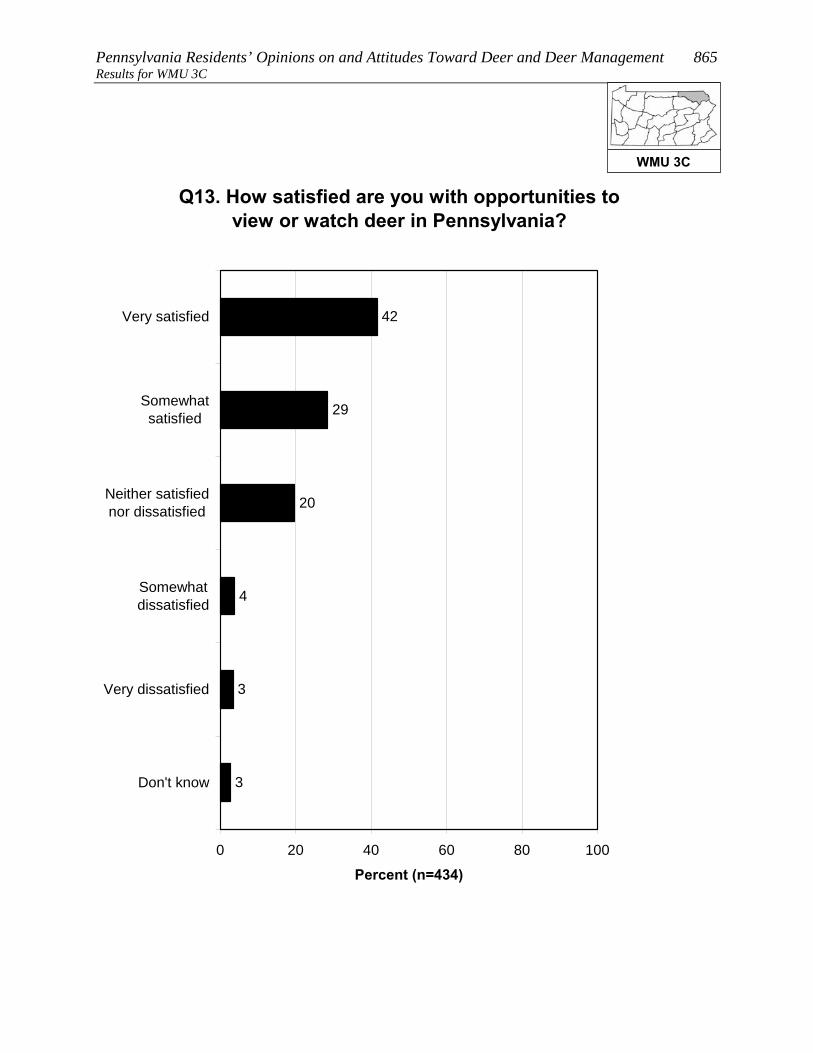
Pennsylvania Residents’ Opinions on and Attitudes Toward Deer and Deer Management 865 Results for WMU 3C
Q13. How satisfied are you with opportunities to view or watch deer in Pennsylvania?
42
29
20
4
3
3
0 20 40 60 80 100
Very satisfied
Somewhatsatisfied
Neither satisfiednor dissatisfied
Somewhatdissatisfied
Very dissatisfied
Don't know
Percent (n=434)
WMU 3C
866 Responsive Management Results for WMU 3C
OPINIONS ON DEER IN GENERAL AND THE SIZE AND HEALTH OF THE DEER HERD
Opinion on deer is mostly favorable: 54% of residents of WMU 3C
say with no caveats that they like having deer around, another 20%
like having deer around but worry about the problems they may cause,
and only 6% generally regard them as a nuisance. The remainder have
no particular feeling about deer.
Another question asked residents of WMU 3C how deer-related issues compared to other
issues in their life, on a scale of 0 to 10, with the most importance being 10: the median
rating is “4.” The most common ratings are the midpoint of “5” (23%) and “0” (20%). In
general, ratings are well spread across the scale.
Two other ratings questions asked respondents to rate their concern about deer-related issues.
The median level of concern is “6” for the quality of deer habitat in Pennsylvania and “7” for
the health of the deer population in Pennsylvania.
The survey asked about the perceived size of the deer herd in the respondent’s area. The
majority of residents of WMU 3C say that the herd size is just right (61%); otherwise, more
say that it is too low (20%) than too high (10%).
• Those who own their home are less likely, compared to those who do not own their
home, to say that the deer population in their area is just right; they are more likely to
say that the deer population is either too high or too low.
• Those who consider themselves to be a hunter are more likely to say that the deer
population in their area is too low, compared to those who are not hunters.
WMU 3C
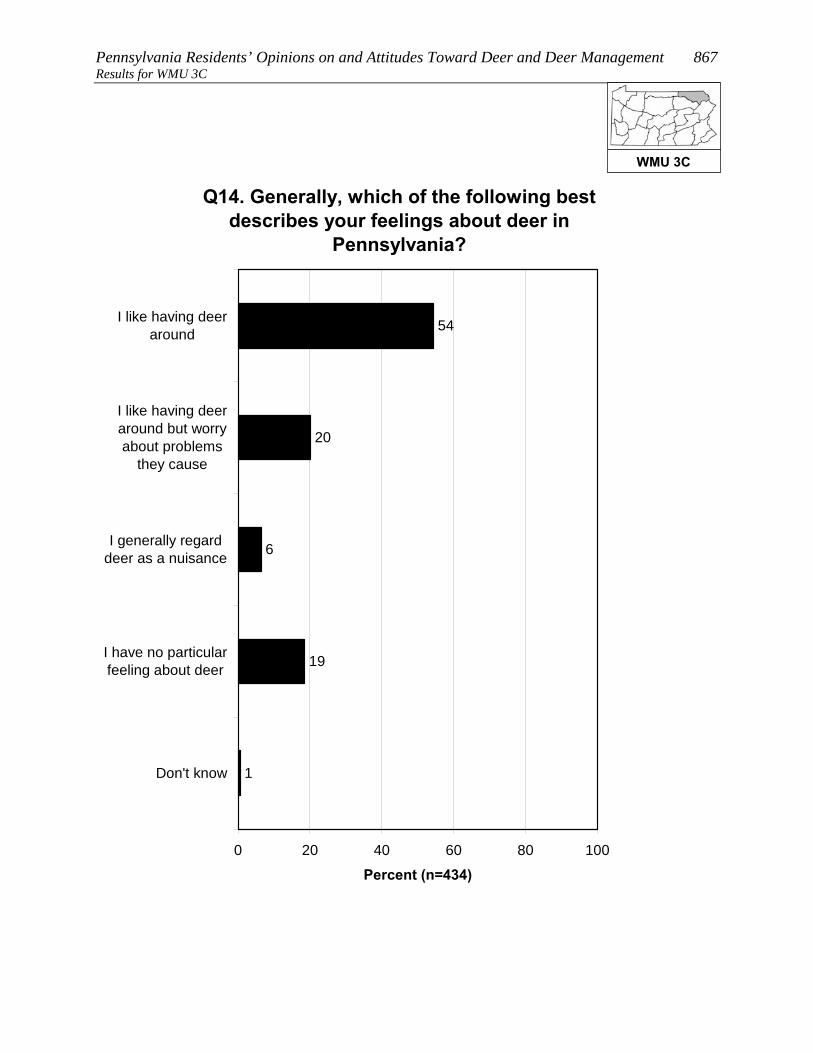
Pennsylvania Residents’ Opinions on and Attitudes Toward Deer and Deer Management 867 Results for WMU 3C
Q14. Generally, which of the following best describes your feelings about deer in
Pennsylvania?
54
20
6
19
1
0 20 40 60 80 100
I like having deeraround
I like having deeraround but worryabout problems
they cause
I generally regarddeer as a nuisance
I have no particularfeeling about deer
Don't know
Percent (n=434)
WMU 3C
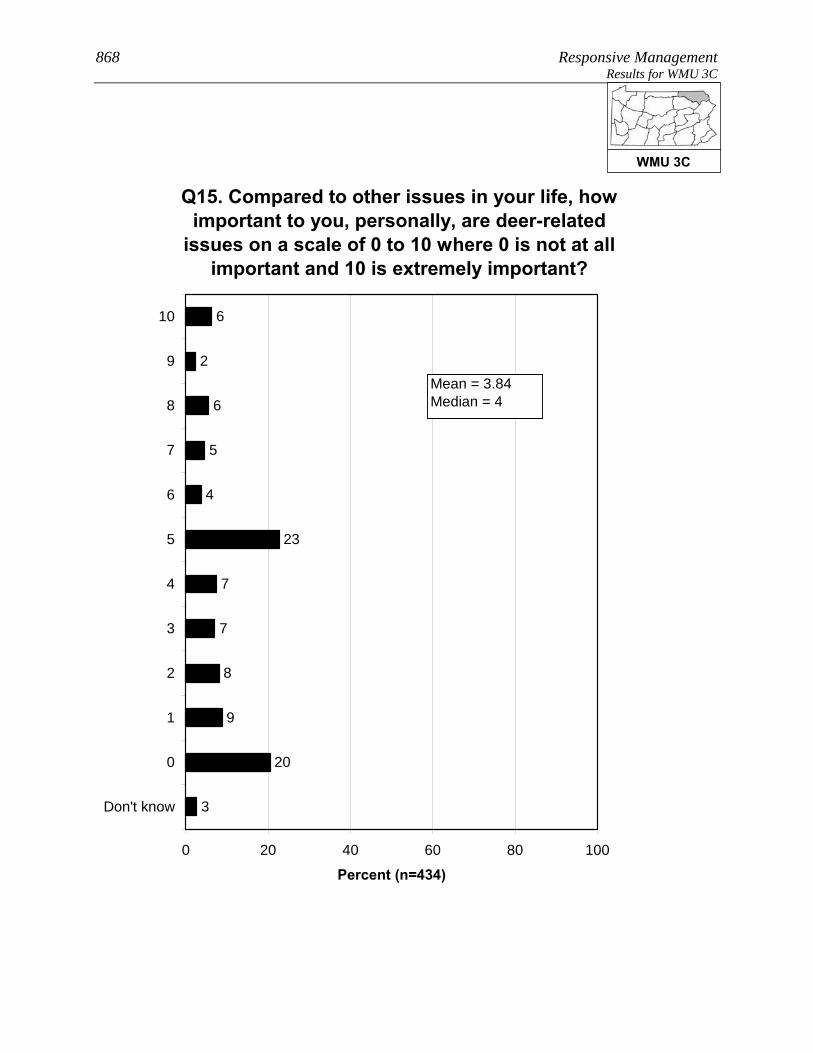
868 Responsive Management Results for WMU 3C
Q15. Compared to other issues in your life, how important to you, personally, are deer-related
issues on a scale of 0 to 10 where 0 is not at all important and 10 is extremely important?
8
7
7
6
2
6
5
4
23
9
20
3
0 20 40 60 80 100
10
9
8
7
6
5
4
3
2
1
0
Don't know
Percent (n=434)
Mean = 3.84Median = 4
WMU 3C

Pennsylvania Residents’ Opinions on and Attitudes Toward Deer and Deer Management 869 Results for WMU 3C
Q41. How about the quality of deer habitat in Pennsylvania? (How much of a concern is this for you personally on a scale of 0 to 10 where 0 is not at all concerned and 10 is extremely concerned?)
2
2
2
14
2
14
10
6
26
2
12
7
0 20 40 60 80 100
10
9
8
7
6
5
4
3
2
1
0
Don't know
Percent (n=434)
Mean = 5.79Median = 6
WMU 3C
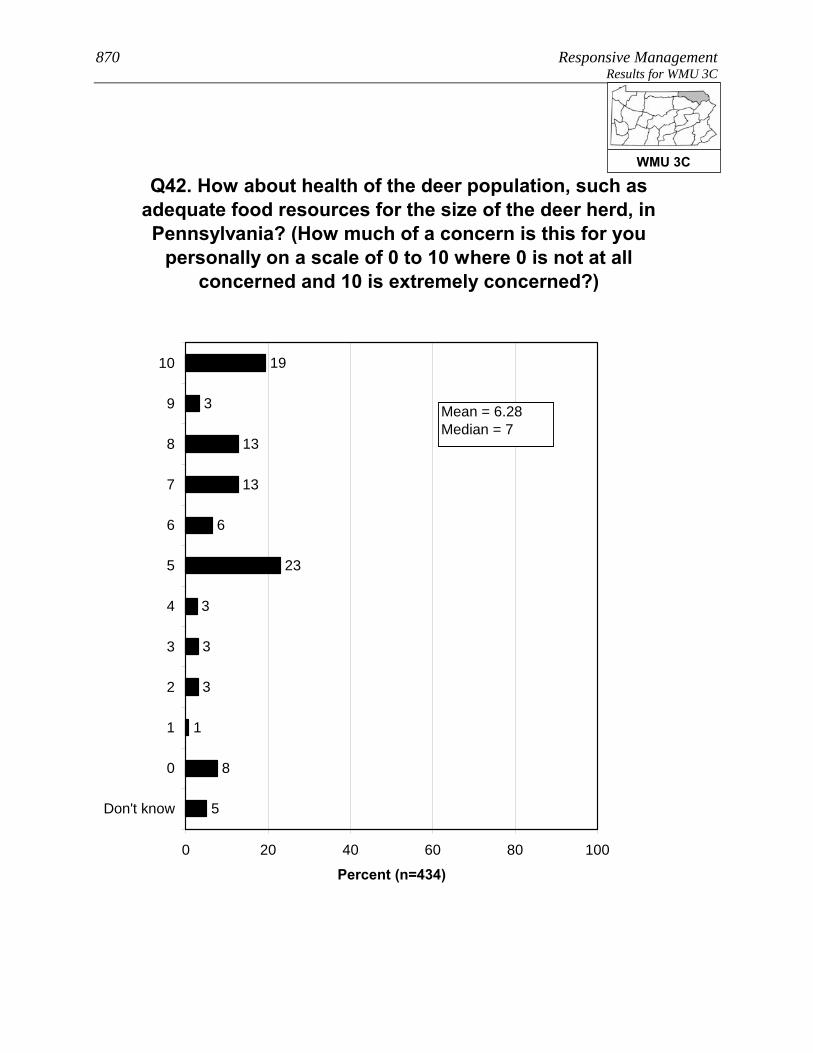
870 Responsive Management Results for WMU 3C
3
3
3
19
3
13
13
6
23
1
8
5
0 20 40 60 80 100
10
9
8
7
6
5
4
3
2
1
0
Don't know
Percent (n=434)
Q42. How about health of the deer population, such as adequate food resources for the size of the deer herd, in Pennsylvania? (How much of a concern is this for you
personally on a scale of 0 to 10 where 0 is not at all concerned and 10 is extremely concerned?)
Mean = 6.28Median = 7
WMU 3C

Pennsylvania Residents’ Opinions on and Attitudes Toward Deer and Deer Management 871 Results for WMU 3C
Q16. In your opinion, is the deer population in the area where you live too high, just right, or too low?
10
61
20
9
0 20 40 60 80 100
Too high
Just right
Too low
Don't know
Percent (n=434)
WMU 3C
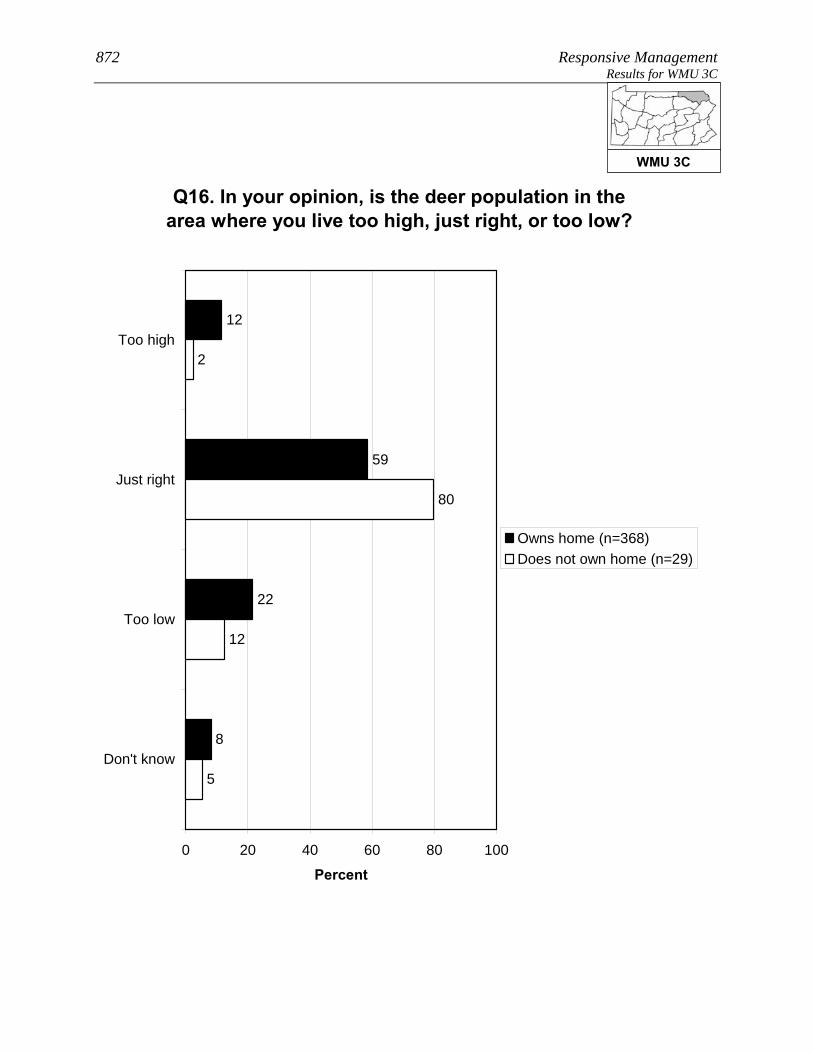
872 Responsive Management Results for WMU 3C
Q16. In your opinion, is the deer population in the area where you live too high, just right, or too low?
12
59
22
8
12
80
2
5
0 20 40 60 80 100
Too high
Just right
Too low
Don't know
Percent
Owns home (n=368)Does not own home (n=29)
WMU 3C

Pennsylvania Residents’ Opinions on and Attitudes Toward Deer and Deer Management 873 Results for WMU 3C
Q16. In your opinion, is the deer population in the area where you live too high, just right, or too low?
4
53
40
4
14
64
12
10
0 20 40 60 80 100
Too high
Just right
Too low
Don't know
Percent
Consider themselves ahunter (n=116)Do not consider themselvesa hunter (n=317)
WMU 3C
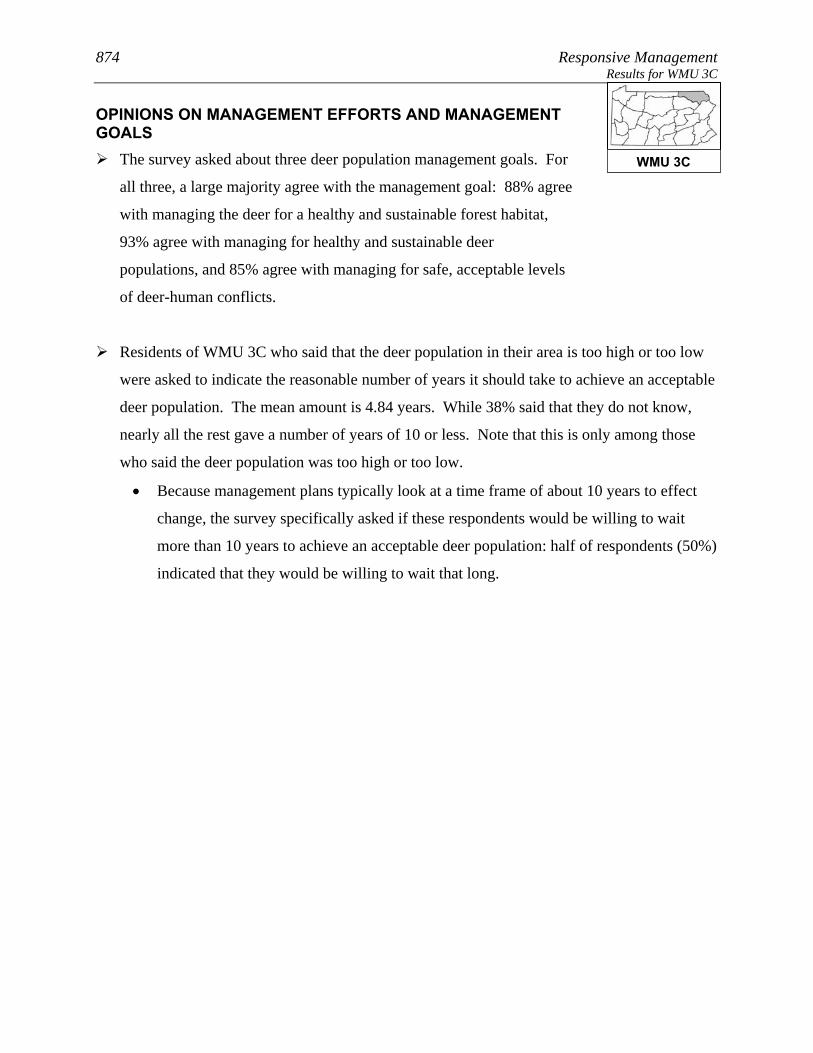
874 Responsive Management Results for WMU 3C
OPINIONS ON MANAGEMENT EFFORTS AND MANAGEMENT GOALS
The survey asked about three deer population management goals. For
all three, a large majority agree with the management goal: 88% agree
with managing the deer for a healthy and sustainable forest habitat,
93% agree with managing for healthy and sustainable deer
populations, and 85% agree with managing for safe, acceptable levels
of deer-human conflicts.
Residents of WMU 3C who said that the deer population in their area is too high or too low
were asked to indicate the reasonable number of years it should take to achieve an acceptable
deer population. The mean amount is 4.84 years. While 38% said that they do not know,
nearly all the rest gave a number of years of 10 or less. Note that this is only among those
who said the deer population was too high or too low.
• Because management plans typically look at a time frame of about 10 years to effect
change, the survey specifically asked if these respondents would be willing to wait
more than 10 years to achieve an acceptable deer population: half of respondents (50%)
indicated that they would be willing to wait that long.
WMU 3C
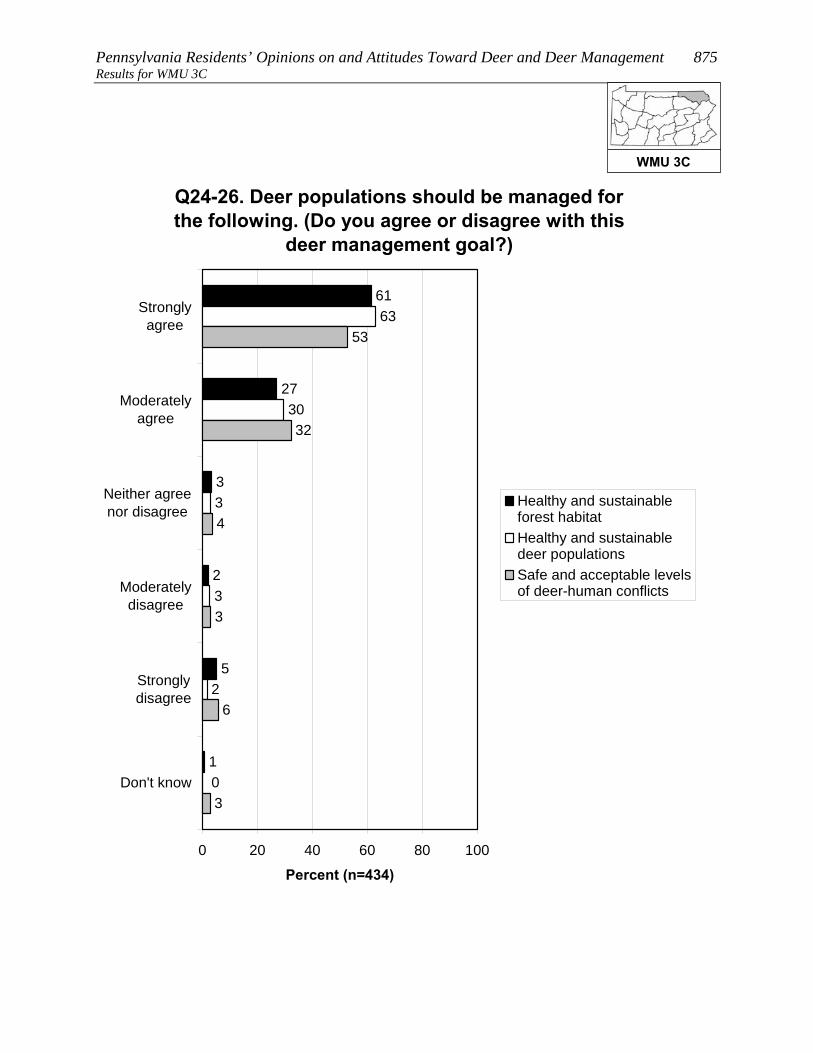
Pennsylvania Residents’ Opinions on and Attitudes Toward Deer and Deer Management 875 Results for WMU 3C
Q24-26. Deer populations should be managed for the following. (Do you agree or disagree with this
deer management goal?)
61
27
3
2
5
1
3
30
63
3
2
0
3
53
32
4
6
3
0 20 40 60 80 100
Stronglyagree
Moderatelyagree
Neither agreenor disagree
Moderatelydisagree
Stronglydisagree
Don't know
Percent (n=434)
Healthy and sustainableforest habitatHealthy and sustainabledeer populationsSafe and acceptable levelsof deer-human conflicts
WMU 3C

876 Responsive Management Results for WMU 3C
38
3
1
1
11
22
6
10
8
0 20 40 60 80 100
More than 10years
6-10 years
5 years
4 years
3 years
2 years
1 year
Less than a year
Don't know
Percent (n=127)
Q18. You said the deer population in the area where you live is [too high / too low]. In years, what is a
reasonable amount of time to achieve an acceptable deer population in the area where you live? (Asked of those who think the deer population in the area where
they live is too high or too low.)
Mean = 4.84Median = 5
WMU 3C
Pennsylvania Residents’ Opinions on and Attitudes Toward Deer and Deer Management 877 Results for WMU 3C
Q21. Would you be willing to wait more than 10 years to achieve an acceptable deer population in the area where you live? (Among those who think the deer population in the area where they live is
too high or too low.)
50
46
5
0 20 40 60 80 100
Yes
No
Don't know
Percent (n=127)
WMU 3C
878 Responsive Management Results for WMU 3C
OPINIONS ON METHODS FOR MANAGING DEER, INCLUDING HUNTING
A majority of residents of WMU 3C (63%) support lethal methods to
manage deer populations in Pennsylvania; nonetheless, 30% oppose,
mostly strong opposition.
• Those residents of WMU 3C who live in a single-family home and own their home are
much more likely to support lethal methods, compared to those who live in a single-
family home but do not own their home.
• The survey asked about four methods of controlling deer populations (three of them
lethal). The most support is for legal, regulated hunting (89% of respondents support
this method), distantly followed by fertility/birth control (30%), professionals or
sharpshooters (26%), and trapping and killing (19%).
Two questions asked respondents about hunting on their land (among those who live in a
single-family home), the first question about hunting by the respondents themselves (10% do
so) and the second regarding allowing others to hunt on their land (18% do so). In
combining the results, 21% of residents of WMU 3C who live in a single-family home either
hunt on their own land or allow others to do so (it is not simply a sum of the two questions
because some hunt on their property and allow others to do so as well).
• There was interest in seeing how a particular subgroup responded on this question, the
subgroup being those who live in a single-family home; who live on 1 acre or less; and
who live in an urban, suburban area, or a small city/town. Among this subgroup, 3%
either hunt on their own property or allow others to hunt on the property.
• Those respondents who do not allow hunting on their property were asked to indicate
why they prohibit it. The most common reasons are that they live in an urban or
suburban area in which hunting is not possible or feasible and/or that their property is
too small. Other minor reasons are a general opposition to hunting, concerns about
safety, and liability concerns.
• Those same respondents who do not allow hunting on their property were asked about
their likelihood of ever allowing others to hunt deer on their property; they
overwhelmingly say this is very unlikely (95%). They were then asked if there is
WMU 3C

Pennsylvania Residents’ Opinions on and Attitudes Toward Deer and Deer Management 879 Results for WMU 3C
anything that would make them more likely to allow deer hunting;
they are almost unanimous (99%) in saying that there is nothing
that would make them more likely to allow deer hunting.
• The question about allowing others to hunt on their property was examined among the
subgroup previously discussed (those who live in a single-family home; who live on 1
acre or less; and who live in an urban, suburban area, or a small city/town). Among
this group who got the question, nearly all say that they would never allow hunting.
o Additional follow-up questions to be asked of those who indicated that something
might prompt them to allow hunting on their property did not have enough
respondents for statistical validity; therefore, they are not shown.
WMU 3C
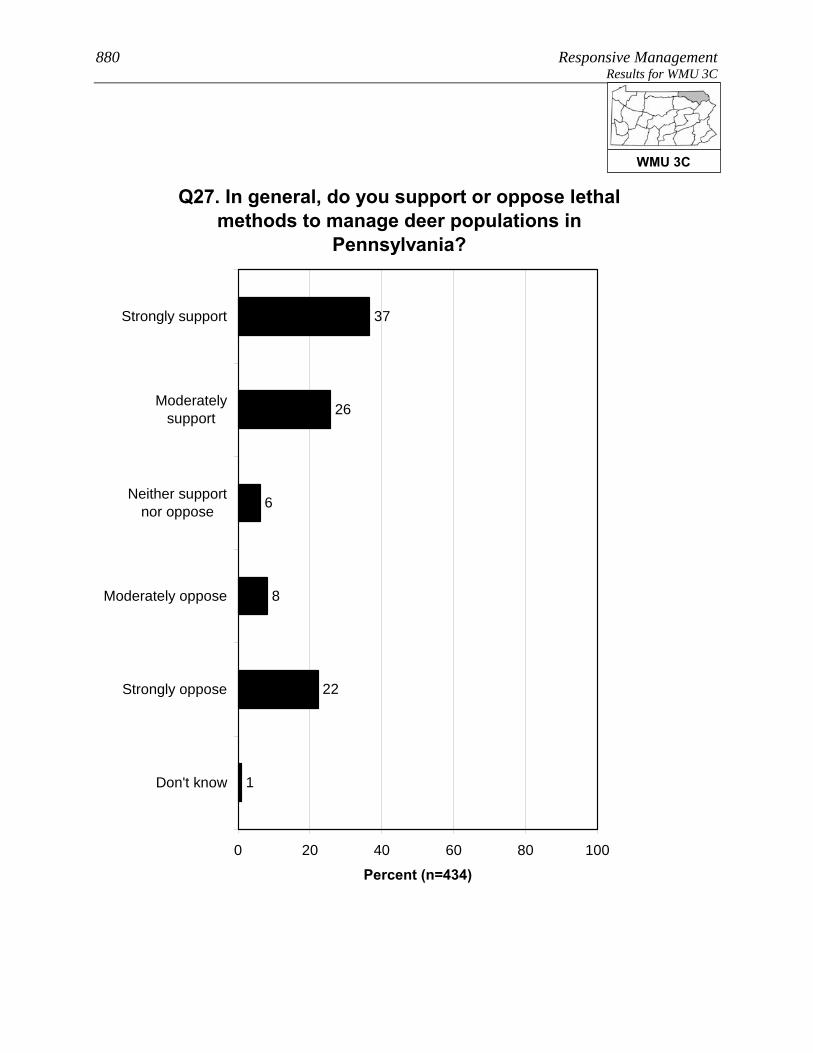
880 Responsive Management Results for WMU 3C
Q27. In general, do you support or oppose lethal methods to manage deer populations in
Pennsylvania?
37
26
6
8
22
1
0 20 40 60 80 100
Strongly support
Moderatelysupport
Neither supportnor oppose
Moderately oppose
Strongly oppose
Don't know
Percent (n=434)
WMU 3C

Pennsylvania Residents’ Opinions on and Attitudes Toward Deer and Deer Management 881 Results for WMU 3C
Q27. In general, do you support or oppose lethal methods to manage deer populations in
Pennsylvania?
38
26
5
8
22
1
17
16
32
18
17
0
0 20 40 60 80 100
Stronglysupport
Moderatelysupport
Neithersupport nor
oppose
Moderatelyoppose
Stronglyoppose
Don't know
Percent
Owns home (n=368)Does not own home (n=29)
WMU 3C
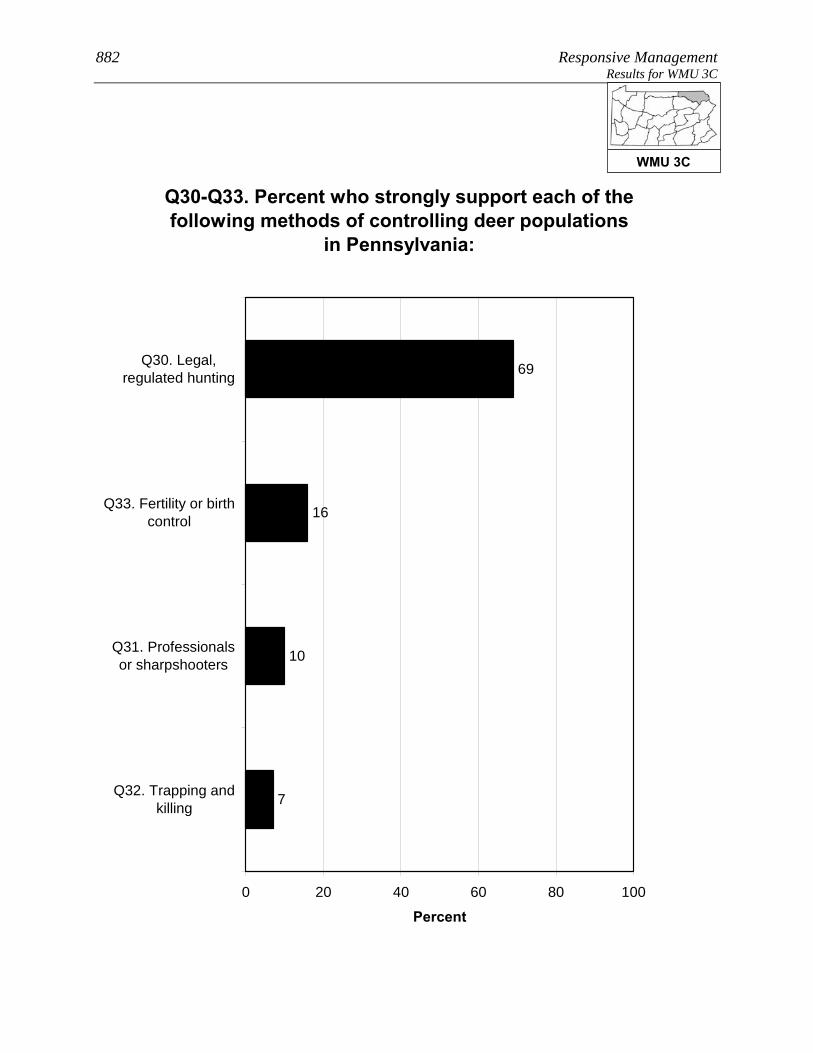
882 Responsive Management Results for WMU 3C
Q30-Q33. Percent who strongly support each of the following methods of controlling deer populations
in Pennsylvania:
7
10
16
69
0 20 40 60 80 100
Q30. Legal,regulated hunting
Q33. Fertility or birthcontrol
Q31. Professionalsor sharpshooters
Q32. Trapping andkilling
Percent
WMU 3C

Pennsylvania Residents’ Opinions on and Attitudes Toward Deer and Deer Management 883 Results for WMU 3C
Q30-Q33. Percent who strongly or moderately support each of the following methods of
controlling deer populations in Pennsylvania:
19
26
30
89
0 20 40 60 80 100
Q30. Legal,regulated hunting
Q33. Fertility or birthcontrol
Q31. Professionalsor sharpshooters
Q32. Trapping andkilling
Percent
WMU 3C

884 Responsive Management Results for WMU 3C
Q30-Q33. Percent who strongly or moderately oppose each of the following methods of
controlling deer populations in Pennsylvania:
7
57
67
78
0 20 40 60 80 100
Q32. Trapping andkilling
Q31. Professionalsor sharpshooters
Q33. Fertility or birthcontrol
Q30. Legal,regulated hunting
Percent
WMU 3C
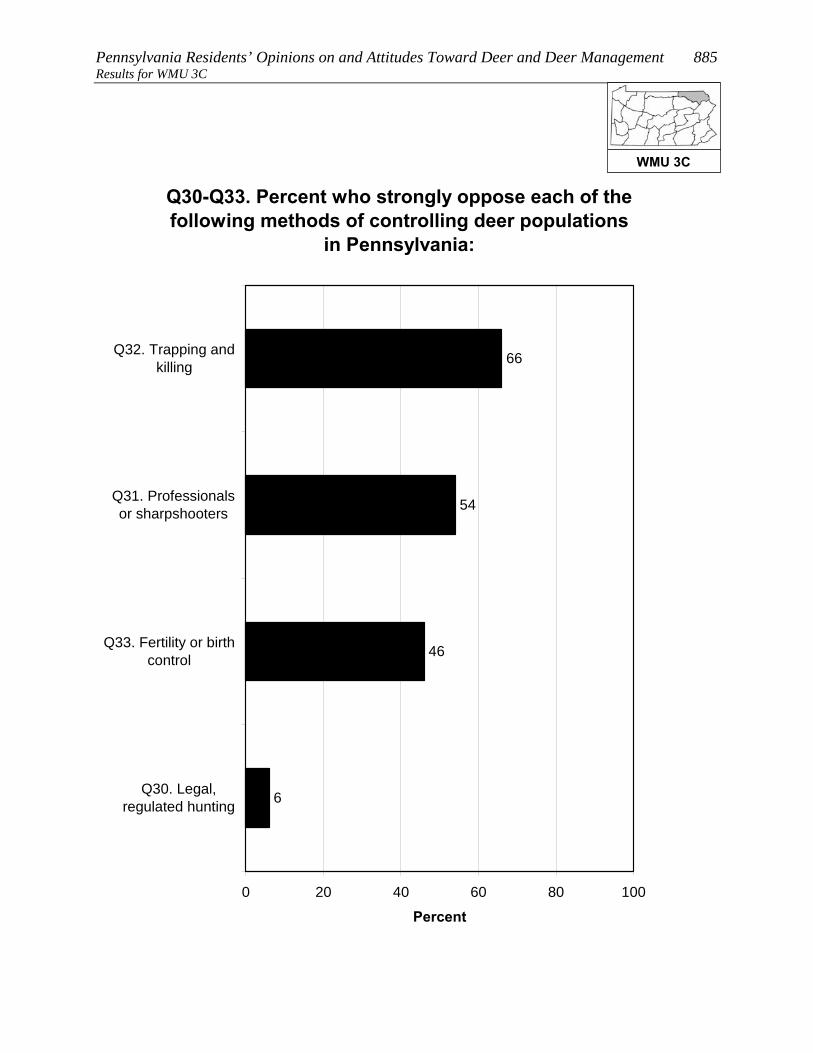
Pennsylvania Residents’ Opinions on and Attitudes Toward Deer and Deer Management 885 Results for WMU 3C
Q30-Q33. Percent who strongly oppose each of the following methods of controlling deer populations
in Pennsylvania:
6
46
54
66
0 20 40 60 80 100
Q32. Trapping andkilling
Q31. Professionalsor sharpshooters
Q33. Fertility or birthcontrol
Q30. Legal,regulated hunting
Percent
WMU 3C

886 Responsive Management Results for WMU 3C
Q59/60. Deer hunts and/or allows others to deer hunt on property. (Among respondents living in a
single-family home.)
21
79
0 20 40 60 80 100
Yes
No
Percent (n=397)
WMU 3C

Pennsylvania Residents’ Opinions on and Attitudes Toward Deer and Deer Management 887 Results for WMU 3C
Q59/60. Deer hunts and/or allows others to deer hunt on property. (Among respondents living in a
single-family home.)
3
97
0 20 40 60 80 100
Yes
No
Percent
Lives in a single familyhome on 1 acre or less inan urban area, a suburbanarea, or a small city/town(n=210)
WMU 3C
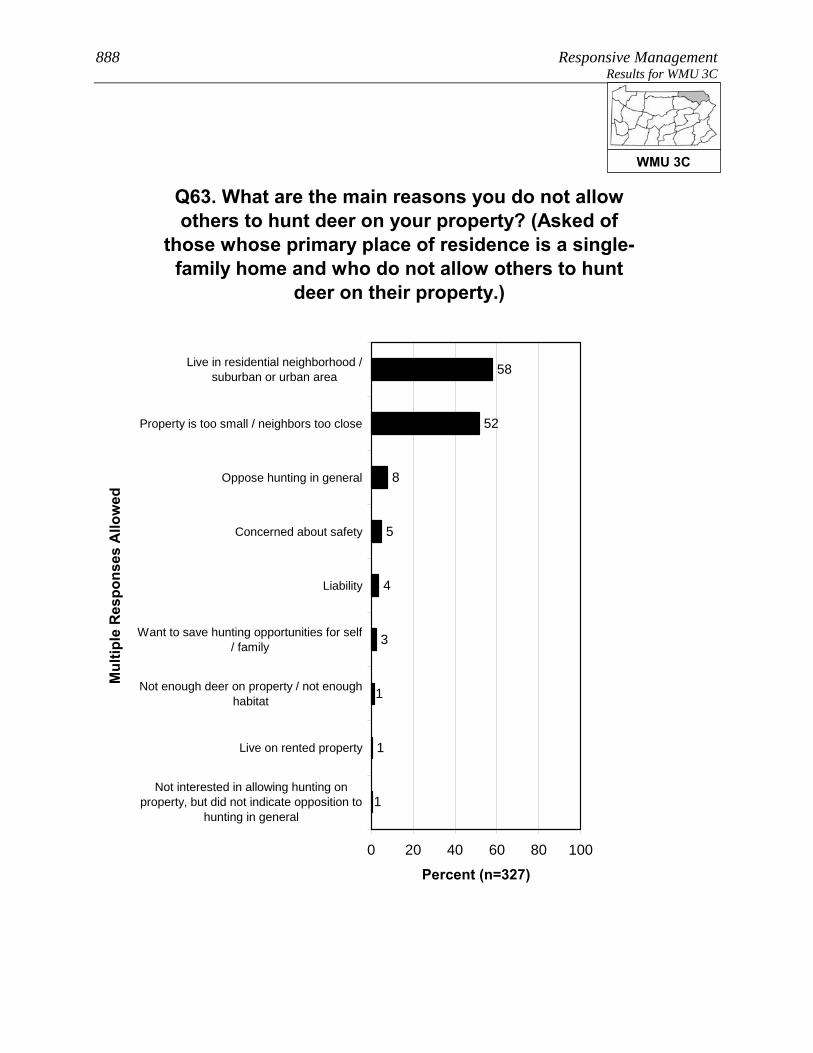
888 Responsive Management Results for WMU 3C
Q63. What are the main reasons you do not allow others to hunt deer on your property? (Asked of
those whose primary place of residence is a single-family home and who do not allow others to hunt
deer on their property.)
1
1
1
58
52
8
5
4
3
0 20 40 60 80 100
Live in residential neighborhood /suburban or urban area
Property is too small / neighbors too close
Oppose hunting in general
Concerned about safety
Liability
Want to save hunting opportunities for self/ family
Not enough deer on property / not enoughhabitat
Live on rented property
Not interested in allowing hunting onproperty, but did not indicate opposition to
hunting in general
Mul
tiple
Res
pons
es A
llow
ed
Percent (n=327)
WMU 3C
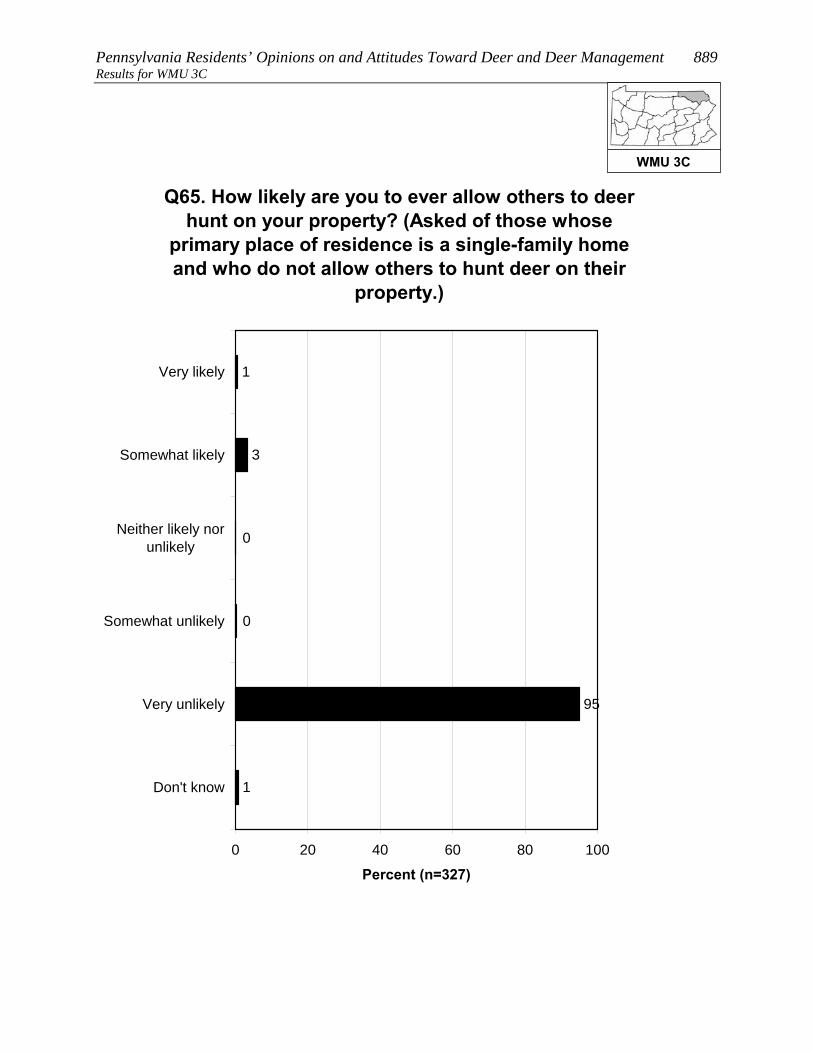
Pennsylvania Residents’ Opinions on and Attitudes Toward Deer and Deer Management 889 Results for WMU 3C
Q65. How likely are you to ever allow others to deer hunt on your property? (Asked of those whose
primary place of residence is a single-family home and who do not allow others to hunt deer on their
property.)
1
3
0
0
95
1
0 20 40 60 80 100
Very likely
Somewhat likely
Neither likely norunlikely
Somewhat unlikely
Very unlikely
Don't know
Percent (n=327)
WMU 3C

890 Responsive Management Results for WMU 3C
Q66. Is there anything that would make you more likely to allow deer hunting on your property?
(Asked of those whose primary place of residence is a single-family home and who do not allow
others to hunt deer on their property.)
Less than 1%
99
1
0 20 40 60 80 100
Yes
No
Don't know
Percent (n=327)
WMU 3C
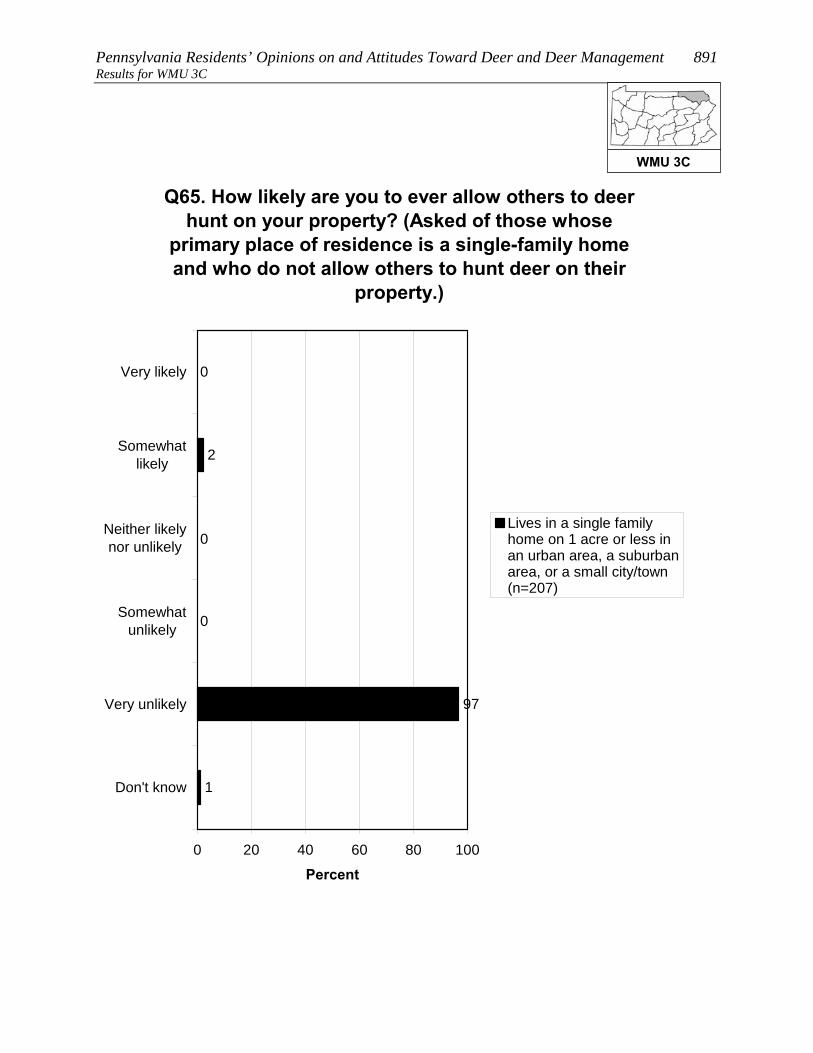
Pennsylvania Residents’ Opinions on and Attitudes Toward Deer and Deer Management 891 Results for WMU 3C
Q65. How likely are you to ever allow others to deer hunt on your property? (Asked of those whose
primary place of residence is a single-family home and who do not allow others to hunt deer on their
property.)
0
2
0
0
97
1
0 20 40 60 80 100
Very likely
Somewhatlikely
Neither likelynor unlikely
Somewhatunlikely
Very unlikely
Don't know
Percent
Lives in a single familyhome on 1 acre or less inan urban area, a suburbanarea, or a small city/town(n=207)
WMU 3C

892 Responsive Management Results for WMU 3C
CONCERNS ABOUT DEER AND DEER NUISANCE PROBLEMS Seven questions asked about respondents’ level of concern about
issues associated with deer. For each issue, respondents rated their
level of concern about it using a 10-point scale, with 10 being the most
concerned.
• The most concern was for tick-borne diseases (mean rating of 7.5), followed by three
whose means are above the midpoint: deer-vehicle accidents (6.8), the health of the
deer population (6.3), and the quality of deer habitat (5.8).
• At the bottom are concern about deer impacts on habitat and other wildlife (even
though this can be considerable) (3.7) and the two impacts to residents’ landscaping:
deer damage to plants and landscaping (2.5) and deer droppings in the yard (1.6).
o Another graph shows the percentage who gave a high rating (a “9” or “10”),
providing an idea of the percentage who feel strongly about the issues.
Among residents of WMU 3C, 64% indicated that they saw deer on their property in the past
12 months.
• Respondents who fed birds were more likely to indicate seeing deer, as were
respondents who fed deer or put out attractants or were aware of neighbors who fed
deer or put out attractants.
The survey asked about specific nuisance problems with deer that residents of WMU 3C may
have experienced: 10% indicated that they experienced problems with deer at their primary
place of residence in the past 12 months; 16% indicated that they or another household
member had been in a vehicle collision with a deer (fortunately, a very low portion of
drivers/passengers were injured); and 4% indicated that they or a household member had
been diagnosed with a tick-borne disease.
• Crosstabulations show that those who fed birds were slightly more likely to have
experienced deer problems and those who were aware of neighbors feeding deer or
putting out attractants were much more likely to experience deer problems, compared
to their counterparts.
WMU 3C

Pennsylvania Residents’ Opinions on and Attitudes Toward Deer and Deer Management 893 Results for WMU 3C
Q36-Q42. Mean rating of respondents' concern about each of the following on a 10-point scale:
2.5
3.7
5.8
6.3
6.8
7.5
1.6
0 2 4 6 8 10
Q36. Tick-borne diseases, such as Lymedisease, in Pennsylvania
Q40. Deer-vehicle accidents inPennsylvania
Q42. The health of the deer population,such as adequate food resources for the
size of the deer herd, in Pennsylvania
Q41. The quality of deer habitat inPennsylvania
Q39. Deer impacts on the habitat andother wildlife in Pennsylvania
Q38. Deer damage to plants andlandscaping in his/her yard
Q37. Deer droppings in his/her yard
Mean
WMU 3C
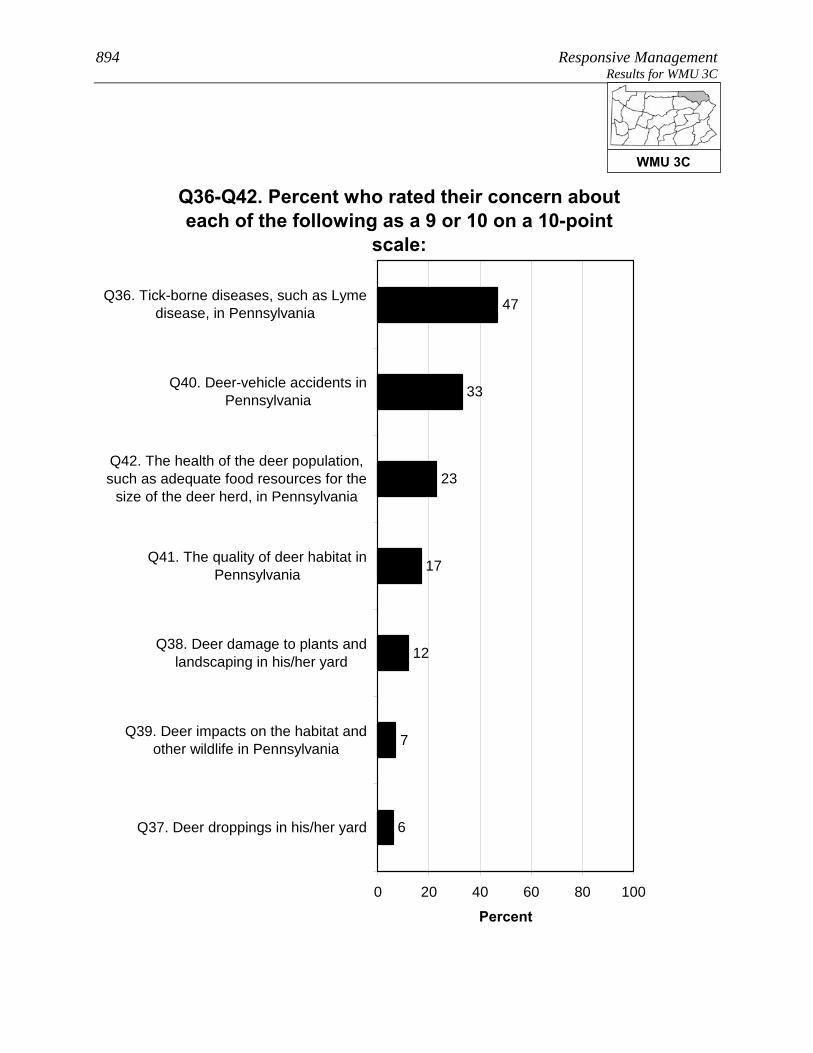
894 Responsive Management Results for WMU 3C
Q36-Q42. Percent who rated their concern about each of the following as a 9 or 10 on a 10-point
scale:
7
12
17
23
33
47
6
0 20 40 60 80 100
Q36. Tick-borne diseases, such as Lymedisease, in Pennsylvania
Q40. Deer-vehicle accidents inPennsylvania
Q42. The health of the deer population,such as adequate food resources for the
size of the deer herd, in Pennsylvania
Q41. The quality of deer habitat inPennsylvania
Q38. Deer damage to plants andlandscaping in his/her yard
Q39. Deer impacts on the habitat andother wildlife in Pennsylvania
Q37. Deer droppings in his/her yard
Percent
WMU 3C

Pennsylvania Residents’ Opinions on and Attitudes Toward Deer and Deer Management 895 Results for WMU 3C
Q49. How often have you seen deer on your property in the past 12 months?
26
18
20
36
0 20 40 60 80 100
Frequently
Sometimes
Rarely
Never
Percent (n=434)
WMU 3C

896 Responsive Management Results for WMU 3C
Q49. How often have you seen deer on your property in the past 12 months?
31
25
21
24
19
11
23
47
0 20 40 60 80 100
Frequently
Sometimes
Rarely
Never
Percent
Fed birds on his / herproperty in the past 12months (n=193)Did not feed birds on his /her property in the past 12months (n=241)
WMU 3C
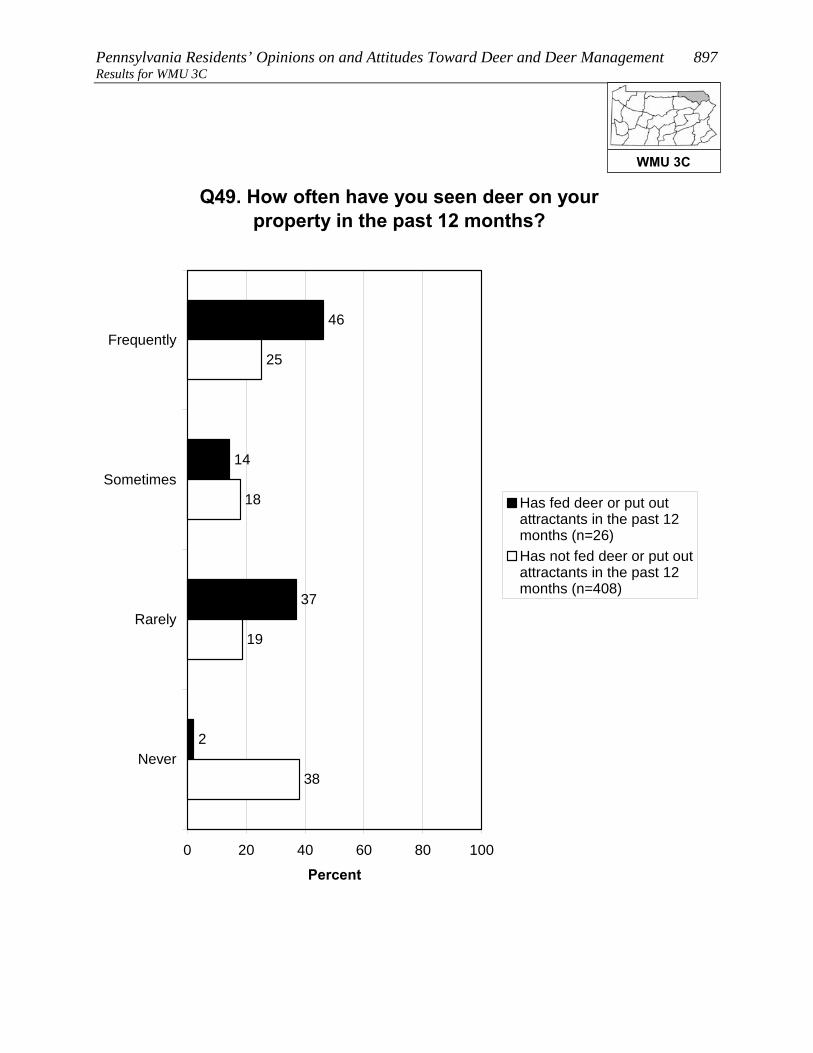
Pennsylvania Residents’ Opinions on and Attitudes Toward Deer and Deer Management 897 Results for WMU 3C
Q49. How often have you seen deer on your property in the past 12 months?
46
14
37
2
19
18
25
38
0 20 40 60 80 100
Frequently
Sometimes
Rarely
Never
Percent
Has fed deer or put outattractants in the past 12months (n=26)Has not fed deer or put outattractants in the past 12months (n=408)
WMU 3C

898 Responsive Management Results for WMU 3C
Q49. How often have you seen deer on your property in the past 12 months?
50
36
10
4
21
16
25
39
0 20 40 60 80 100
Frequently
Sometimes
Rarely
Never
Percent
Is aware of neighborsfeeding deer or putting outattractants (n=35)Is not aware of neighborsfeeding deer or putting outattractants (n=397)
WMU 3C

Pennsylvania Residents’ Opinions on and Attitudes Toward Deer and Deer Management 899 Results for WMU 3C
Q43. In the past 12 months, have you experienced any problems with deer at your primary place of
residence?
10
90
0 20 40 60 80 100
Yes
No
Percent (n=434)
WMU 3C

900 Responsive Management Results for WMU 3C
Q43. In the past 12 months, have you experienced any problems with deer at your primary place of
residence?
14
86
93
7
0 20 40 60 80 100
Yes
No
Percent
Fed birds on his / herproperty in the past 12months (n=193)Did not feed birds on his /her property in the past 12months (n=241)
WMU 3C
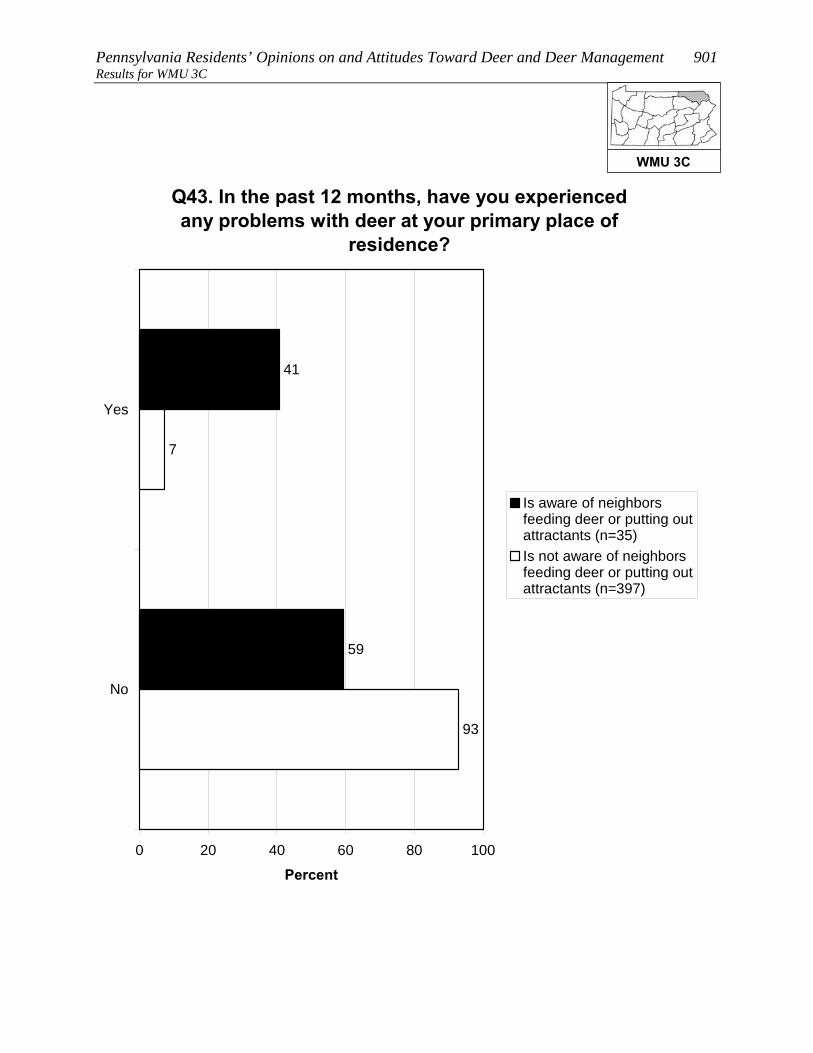
Pennsylvania Residents’ Opinions on and Attitudes Toward Deer and Deer Management 901 Results for WMU 3C
Q43. In the past 12 months, have you experienced any problems with deer at your primary place of
residence?
41
59
93
7
0 20 40 60 80 100
Yes
No
Percent
Is aware of neighborsfeeding deer or putting outattractants (n=35)Is not aware of neighborsfeeding deer or putting outattractants (n=397)
WMU 3C

902 Responsive Management Results for WMU 3C
Q44. In the past 12 months, have you or any other person living in your immediate household been in a vehicle collision with or an accident involving a
deer on Pennsylvania's roads or highways?
16
84
0 20 40 60 80 100
Yes
No
Percent (n=434)
WMU 3C

Pennsylvania Residents’ Opinions on and Attitudes Toward Deer and Deer Management 903 Results for WMU 3C
Q45. Were you or anyone else injured? (Asked of those who had a household member who was in or
who have personally been in a vehicle collision with or an accident involving a deer on
Pennsylvania's roads or highways in the past 12 months.)
5
95
0 20 40 60 80 100
Yes
No
Percent (n=74)
WMU 3C

904 Responsive Management Results for WMU 3C
Q46. In the past 12 months, have you or any other person living in your immediate household been
diagnosed by a physician with a tick-borne disease, such as Lyme disease?
4
95
Less than 1%
0 20 40 60 80 100
Yes
No
Don't know
Percent (n=434)
WMU 3C

Pennsylvania Residents’ Opinions on and Attitudes Toward Deer and Deer Management 905 Results for WMU 3C FEEDING WILDLIFE AND HUNTING DEER
Several questions asked about feeding wildlife.
• Feeding deer or putting out deer attractants: 6% of residents of
WMU 3C did this, and 8% are aware of neighbors who did this.
o The most typical feeds or attractants put out by respondents were corn, apples, and
salt/mineral blocks.
• Feeding birds: 47% of residents of WMU 3C did this.
There is no consensus on whether it is okay for private citizens to feed or attract deer in
Pennsylvania: 33% agree that this is okay, but 59% disagree (the rest are neutral).
A quarter of residents of WMU 3C (25%) consider themselves to be a hunter, most of whom
have a Pennsylvania hunting license.
• Among residents of WMU 3C who live in a single-family home, 10% personally hunt
deer on their property.
• A large majority of residents of WMU 3C (78%) say that they, family members, and/or
friends hunt.
WMU 3C

906 Responsive Management Results for WMU 3C
Q50. Did you ever feed deer intentionally or put out attractants, such as a salt or mineral block, in the
past 12 months?
6
94
0 20 40 60 80 100
Yes
No
Percent (n=434)
WMU 3C

Pennsylvania Residents’ Opinions on and Attitudes Toward Deer and Deer Management 907 Results for WMU 3C
Q55. Are you aware of any of your neighbors feeding deer intentionally or trying to attract deer
on their property in the past 12 months?
8
92
0 20 40 60 80 100
Yes
No
Percent (n=434)
WMU 3C
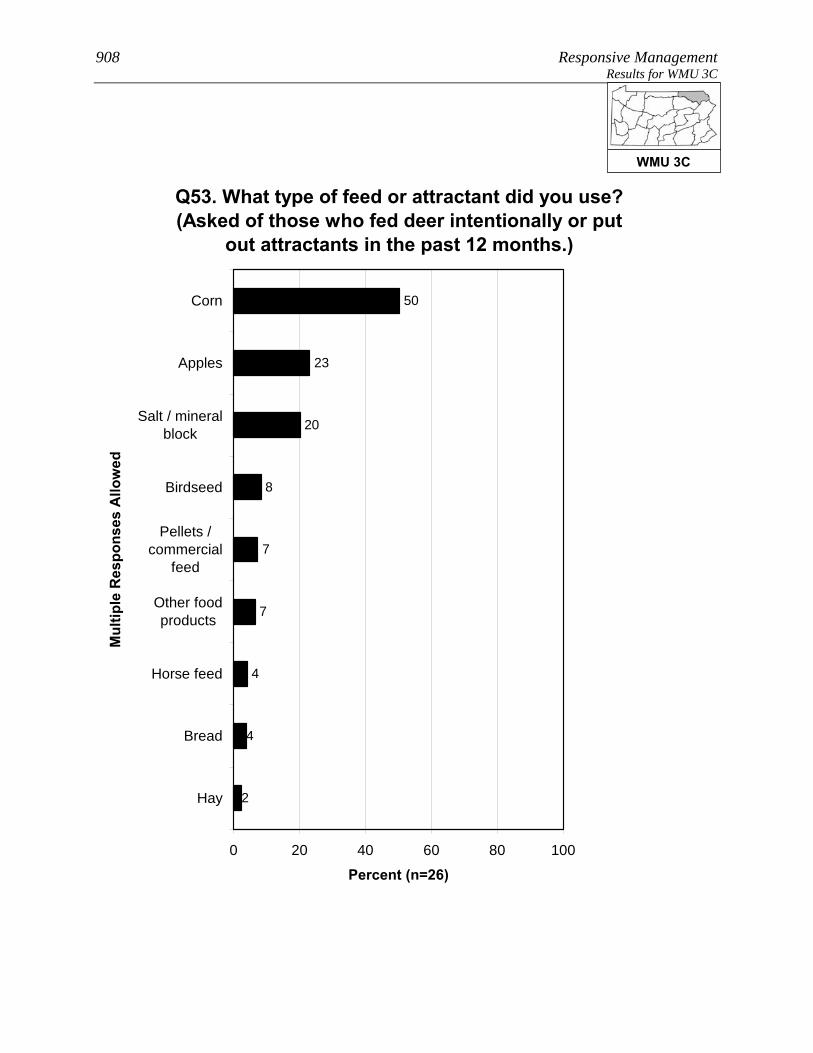
908 Responsive Management Results for WMU 3C
Q53. What type of feed or attractant did you use? (Asked of those who fed deer intentionally or put
out attractants in the past 12 months.)
2
4
4
50
23
20
8
7
7
0 20 40 60 80 100
Corn
Apples
Salt / mineralblock
Birdseed
Pellets /commercial
feed
Other foodproducts
Horse feed
Bread
Hay
Mul
tiple
Res
pons
es A
llow
ed
Percent (n=26)
WMU 3C

Pennsylvania Residents’ Opinions on and Attitudes Toward Deer and Deer Management 909 Results for WMU 3C
Q48. Did you feed birds or make birdfeed available on your property in the past 12 months?
47
53
0 20 40 60 80 100
Yes
No
Percent (n=434)
WMU 3C

910 Responsive Management Results for WMU 3C
Q56. Do you agree or disagree that it is OK for private citizens to feed or attract deer in
Pennsylvania?
13
20
8
16
43
1
0 20 40 60 80 100
Strongly agree
Moderately agree
Neither agree nordisagree
Moderatelydisagree
Strongly disagree
Don't know
Percent (n=434)
WMU 3C

Pennsylvania Residents’ Opinions on and Attitudes Toward Deer and Deer Management 911 Results for WMU 3C
Q59. Do you personally hunt deer on your property? (Asked of those whose primary place of
residence is a single-family home.)
10
90
0 20 40 60 80 100
Yes
No
Percent (n=397)
WMU 3C
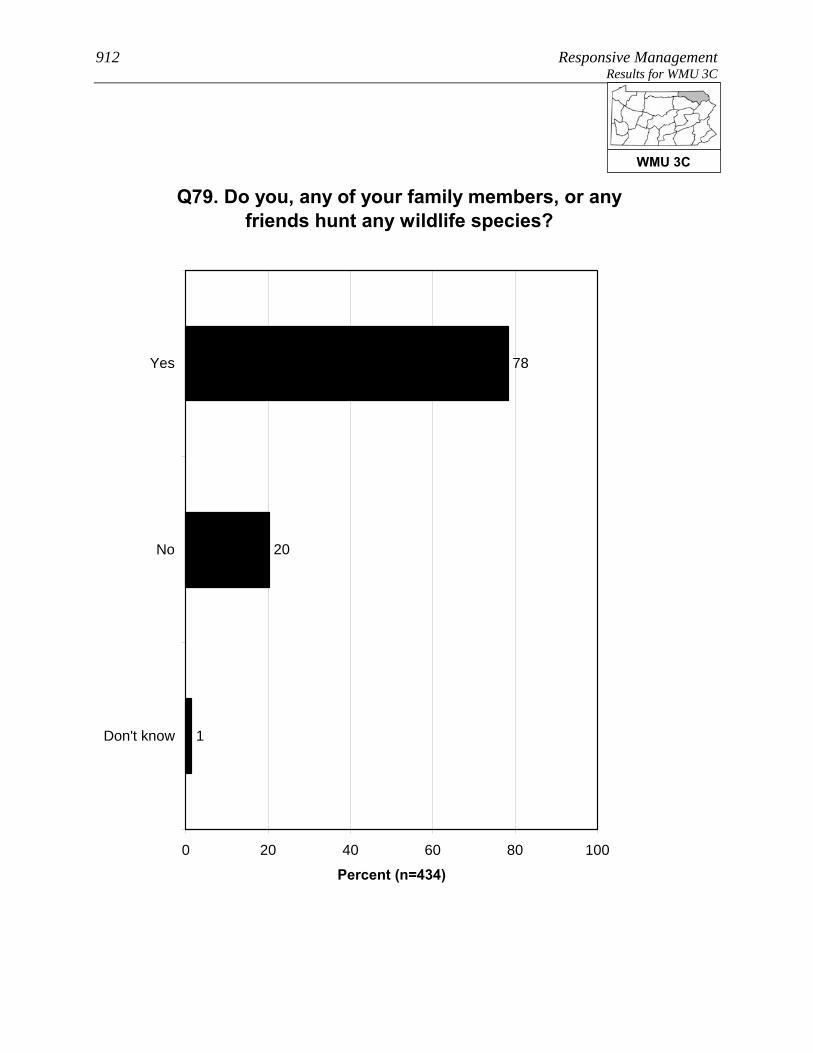
912 Responsive Management Results for WMU 3C
Q79. Do you, any of your family members, or any friends hunt any wildlife species?
78
20
1
0 20 40 60 80 100
Yes
No
Don't know
Percent (n=434)
WMU 3C

Pennsylvania Residents’ Opinions on and Attitudes Toward Deer and Deer Management 913 Results for WMU 3C SOURCES OF INFORMATION
Most commonly, residents of WMU 3C say that the best way to
provide them with information about deer in Pennsylvania is through
direct mail (37% gave this response), followed by email (20%),
newspapers (14%), the Internet (12% saying an Internet site other than
the PGC and 2% saying the agency website; note that some said both),
and TV (12%).
Just more than two-fifths of residents of WMU 3C (43%) use social media, the most common
primary site being Facebook.
WMU 3C
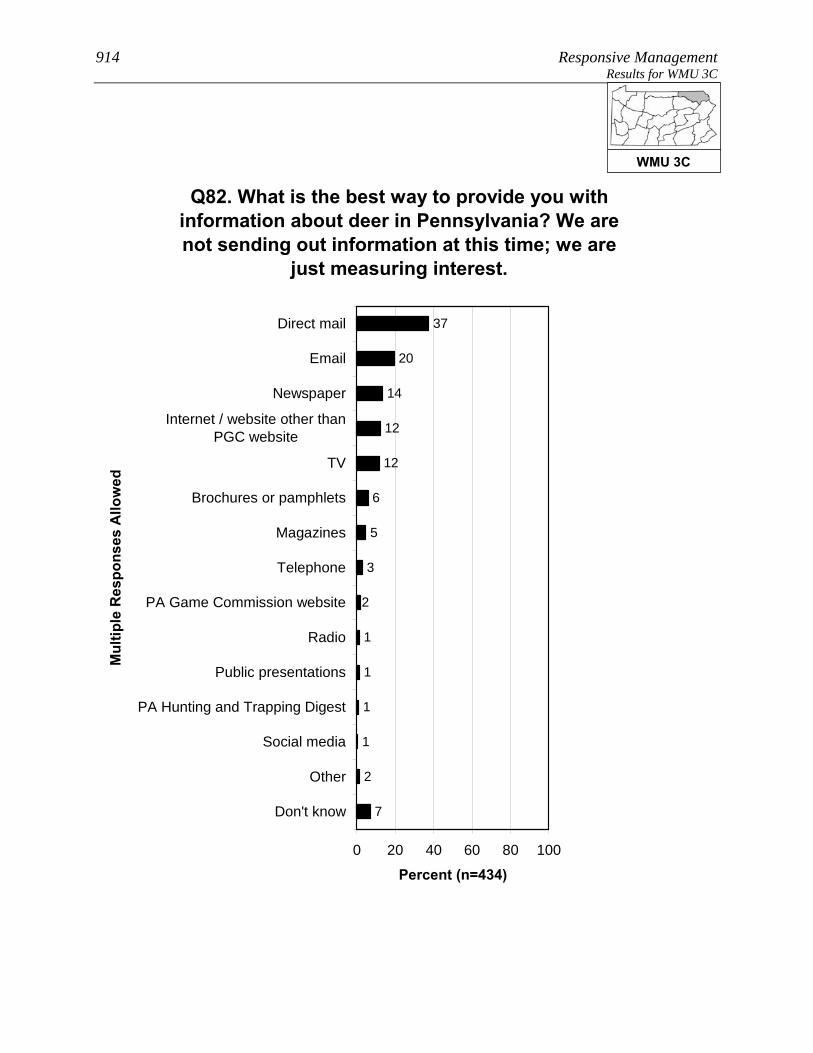
914 Responsive Management Results for WMU 3C
Q82. What is the best way to provide you with information about deer in Pennsylvania? We are not sending out information at this time; we are
just measuring interest.
2
3
5
37
20
14
12
12
6
1
1
1
1
2
7
0 20 40 60 80 100
Direct mail
Newspaper
Internet / website other thanPGC website
TV
Brochures or pamphlets
Magazines
Telephone
PA Game Commission website
Radio
Public presentations
PA Hunting and Trapping Digest
Social media
Other
Don't know
Mul
tiple
Res
pons
es A
llow
ed
Percent (n=434)
WMU 3C
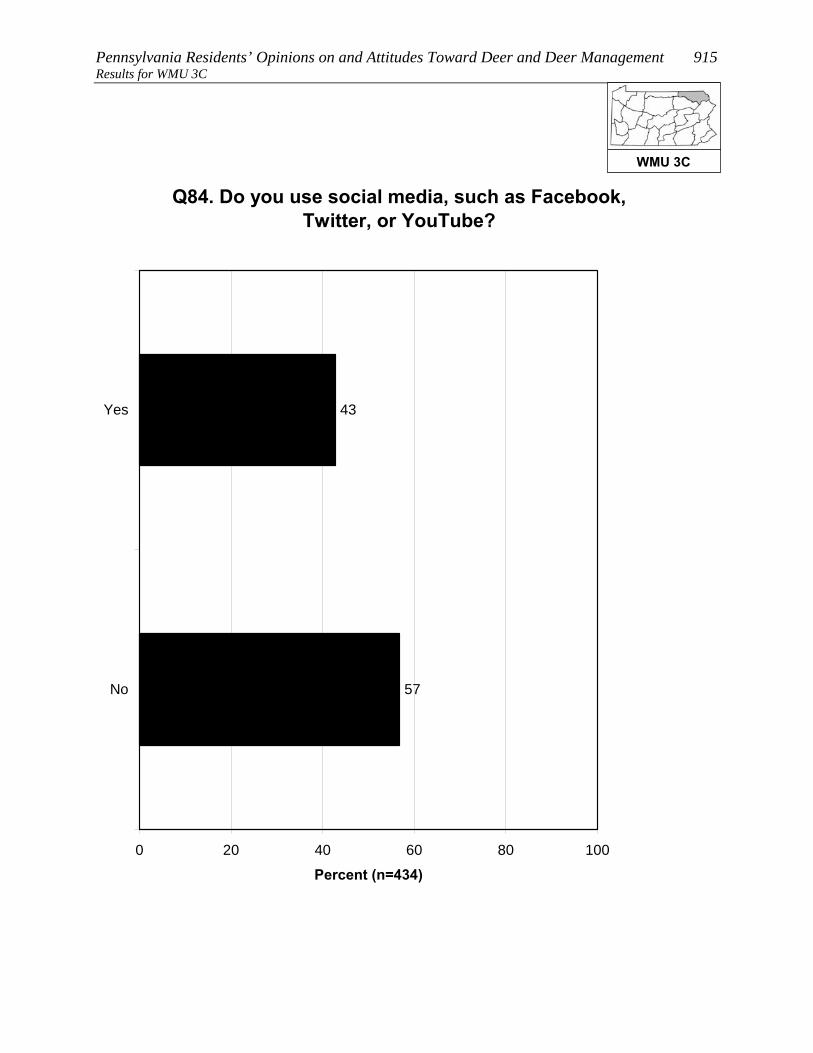
Pennsylvania Residents’ Opinions on and Attitudes Toward Deer and Deer Management 915 Results for WMU 3C
Q84. Do you use social media, such as Facebook, Twitter, or YouTube?
43
57
0 20 40 60 80 100
Yes
No
Percent (n=434)
WMU 3C
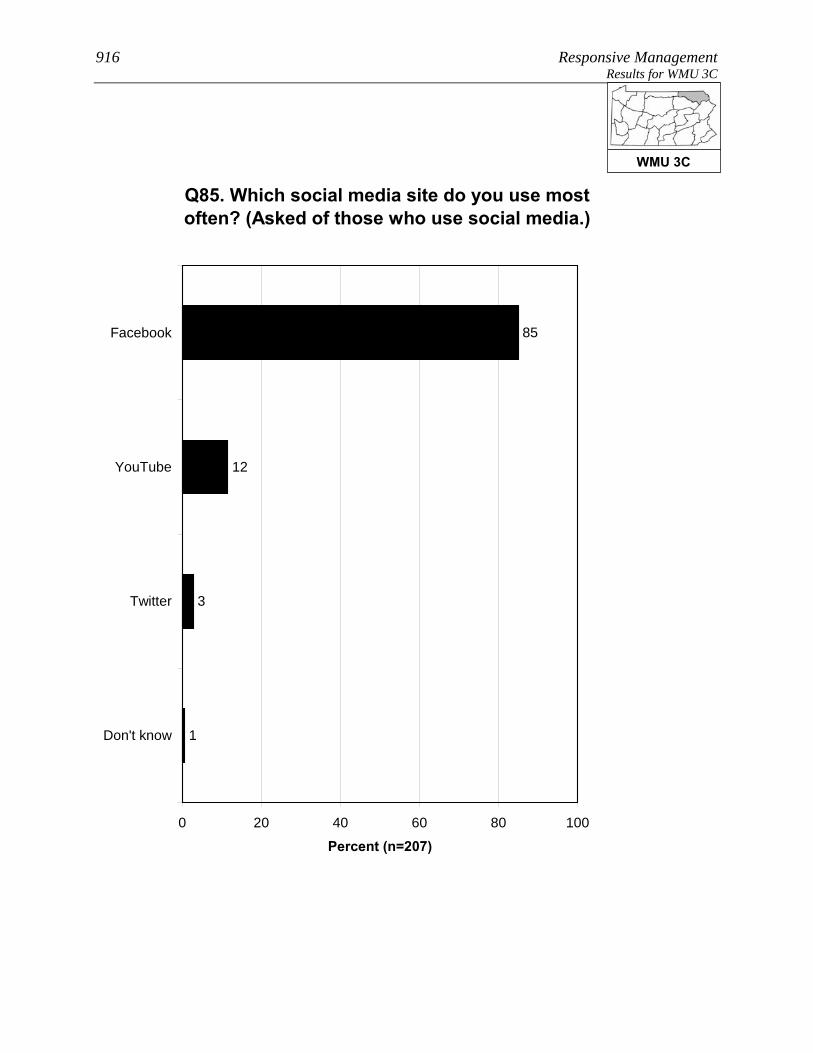
916 Responsive Management Results for WMU 3C
Q85. Which social media site do you use most often? (Asked of those who use social media.)
85
12
3
1
0 20 40 60 80 100
YouTube
Don't know
Percent (n=207)
WMU 3C
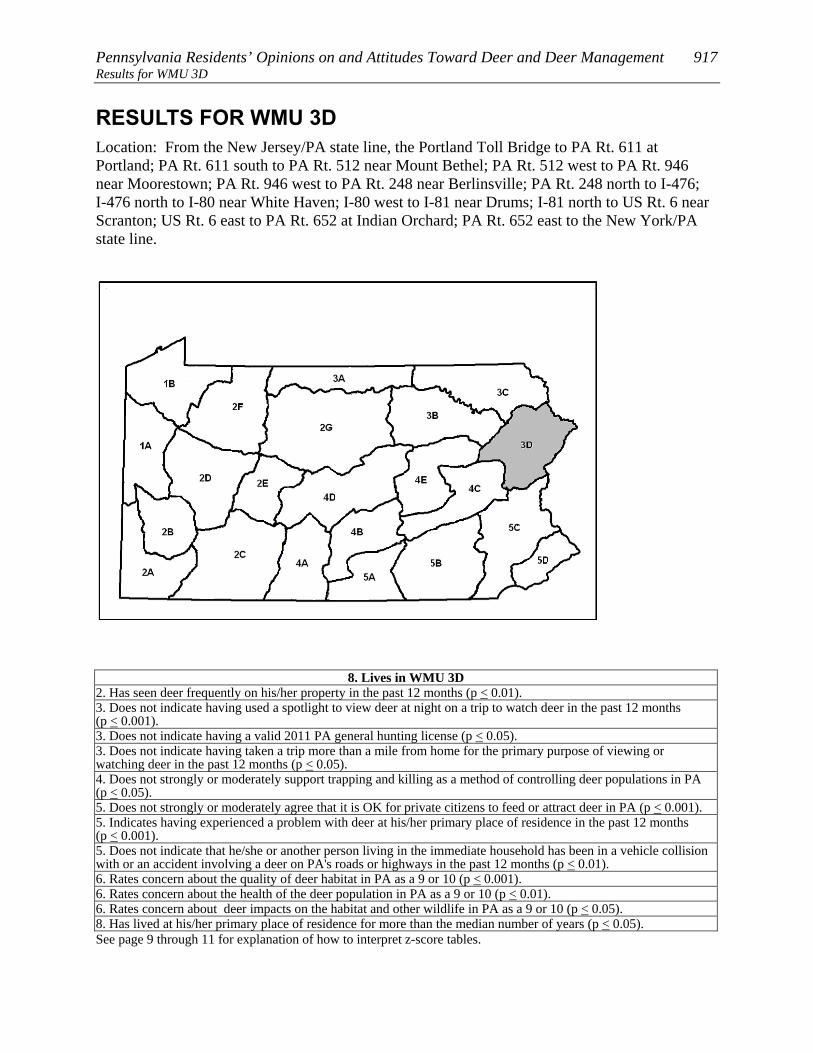
Pennsylvania Residents’ Opinions on and Attitudes Toward Deer and Deer Management 917 Results for WMU 3D
RESULTS FOR WMU 3D Location: From the New Jersey/PA state line, the Portland Toll Bridge to PA Rt. 611 at Portland; PA Rt. 611 south to PA Rt. 512 near Mount Bethel; PA Rt. 512 west to PA Rt. 946 near Moorestown; PA Rt. 946 west to PA Rt. 248 near Berlinsville; PA Rt. 248 north to I-476; I-476 north to I-80 near White Haven; I-80 west to I-81 near Drums; I-81 north to US Rt. 6 near Scranton; US Rt. 6 east to PA Rt. 652 at Indian Orchard; PA Rt. 652 east to the New York/PA state line.
8. Lives in WMU 3D 2. Has seen deer frequently on his/her property in the past 12 months (p < 0.01). 3. Does not indicate having used a spotlight to view deer at night on a trip to watch deer in the past 12 months (p < 0.001). 3. Does not indicate having a valid 2011 PA general hunting license (p < 0.05). 3. Does not indicate having taken a trip more than a mile from home for the primary purpose of viewing or watching deer in the past 12 months (p < 0.05). 4. Does not strongly or moderately support trapping and killing as a method of controlling deer populations in PA (p < 0.05). 5. Does not strongly or moderately agree that it is OK for private citizens to feed or attract deer in PA (p < 0.001). 5. Indicates having experienced a problem with deer at his/her primary place of residence in the past 12 months (p < 0.001). 5. Does not indicate that he/she or another person living in the immediate household has been in a vehicle collision with or an accident involving a deer on PA's roads or highways in the past 12 months (p < 0.01). 6. Rates concern about the quality of deer habitat in PA as a 9 or 10 (p < 0.001). 6. Rates concern about the health of the deer population in PA as a 9 or 10 (p < 0.01). 6. Rates concern about deer impacts on the habitat and other wildlife in PA as a 9 or 10 (p < 0.05). 8. Has lived at his/her primary place of residence for more than the median number of years (p < 0.05). See page 9 through 11 for explanation of how to interpret z-score tables.

918 Responsive Management Results for WMU 3D
PARTICIPATION IN VIEWING DEER A large majority of residents of WMU 3D (64%) spent time viewing
deer around their home in the past 12 months, and 25% took a trip of
at least a mile to view deer.
• One-fifth of those who took a deer-viewing trip (20%) used a spotlight to view the deer
at night.
A majority of residents of WMU 3D (71%) are satisfied with opportunities to view deer in
Pennsylvania. Because a relatively large percentage answer neutrally, only 15% indicate
being dissatisfied.
WMU 3D
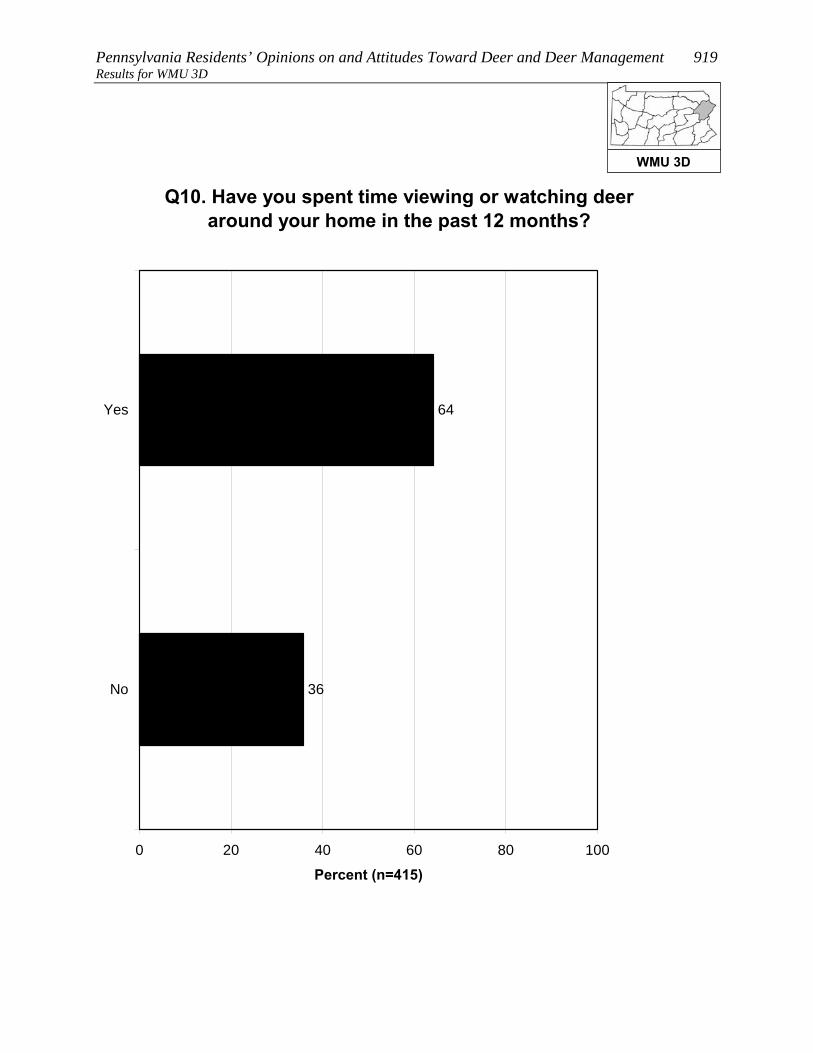
Pennsylvania Residents’ Opinions on and Attitudes Toward Deer and Deer Management 919 Results for WMU 3D
Q10. Have you spent time viewing or watching deer around your home in the past 12 months?
64
36
0 20 40 60 80 100
Yes
No
Percent (n=415)
WMU 3D

920 Responsive Management Results for WMU 3D
Q11. Have you taken a trip at least 1 mile from your home for the primary purpose of viewing or
watching deer in the past 12 months?
25
75
0 20 40 60 80 100
Yes
No
Percent (n=415)
WMU 3D
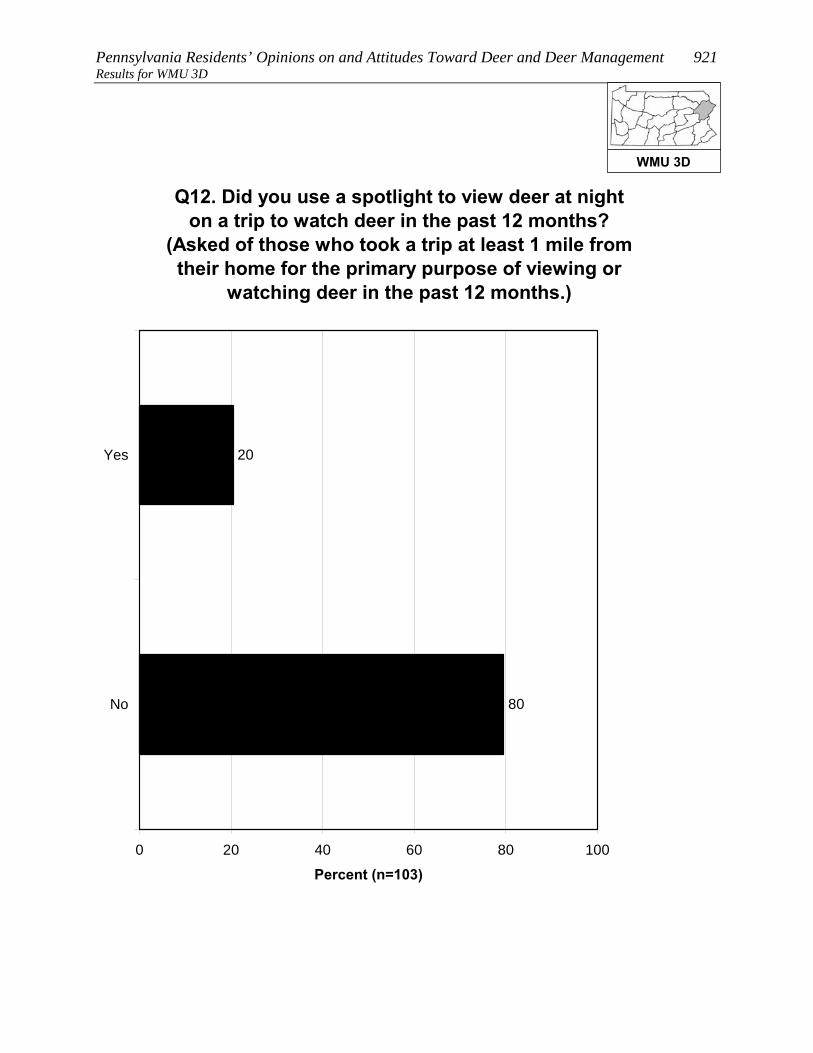
Pennsylvania Residents’ Opinions on and Attitudes Toward Deer and Deer Management 921 Results for WMU 3D
Q12. Did you use a spotlight to view deer at night on a trip to watch deer in the past 12 months?
(Asked of those who took a trip at least 1 mile from their home for the primary purpose of viewing or
watching deer in the past 12 months.)
20
80
0 20 40 60 80 100
Yes
No
Percent (n=103)
WMU 3D
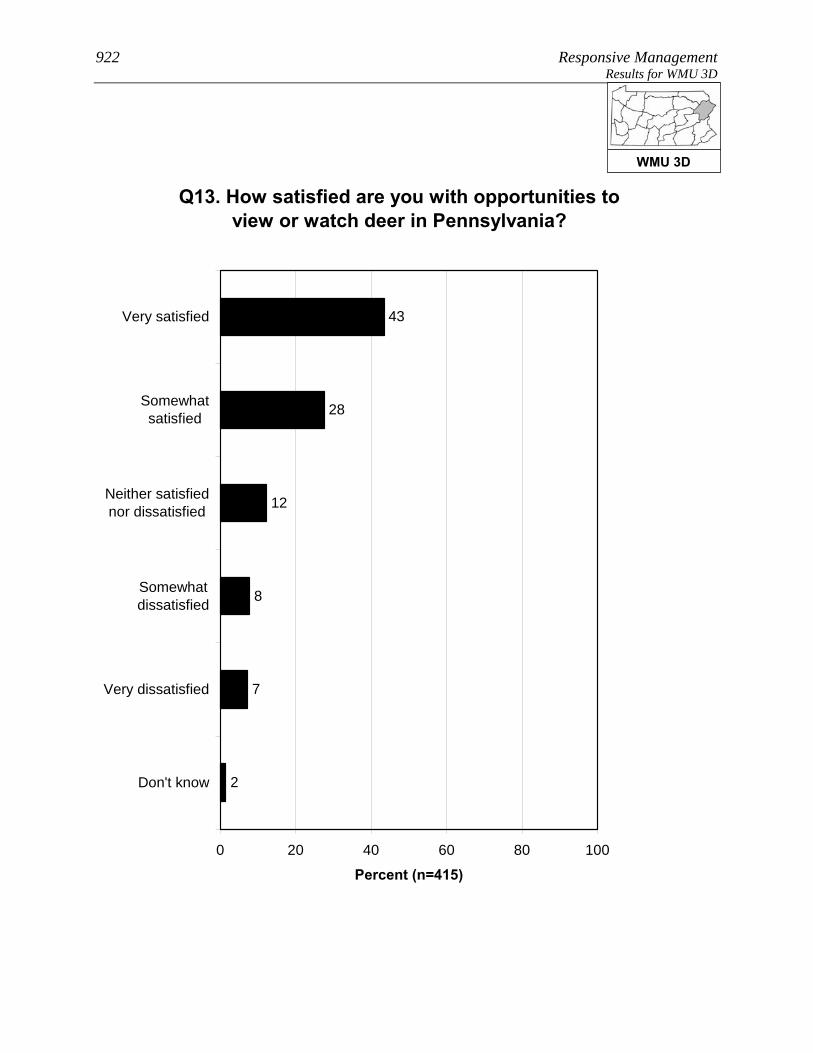
922 Responsive Management Results for WMU 3D
Q13. How satisfied are you with opportunities to view or watch deer in Pennsylvania?
43
28
12
8
7
2
0 20 40 60 80 100
Very satisfied
Somewhatsatisfied
Neither satisfiednor dissatisfied
Somewhatdissatisfied
Very dissatisfied
Don't know
Percent (n=415)
WMU 3D
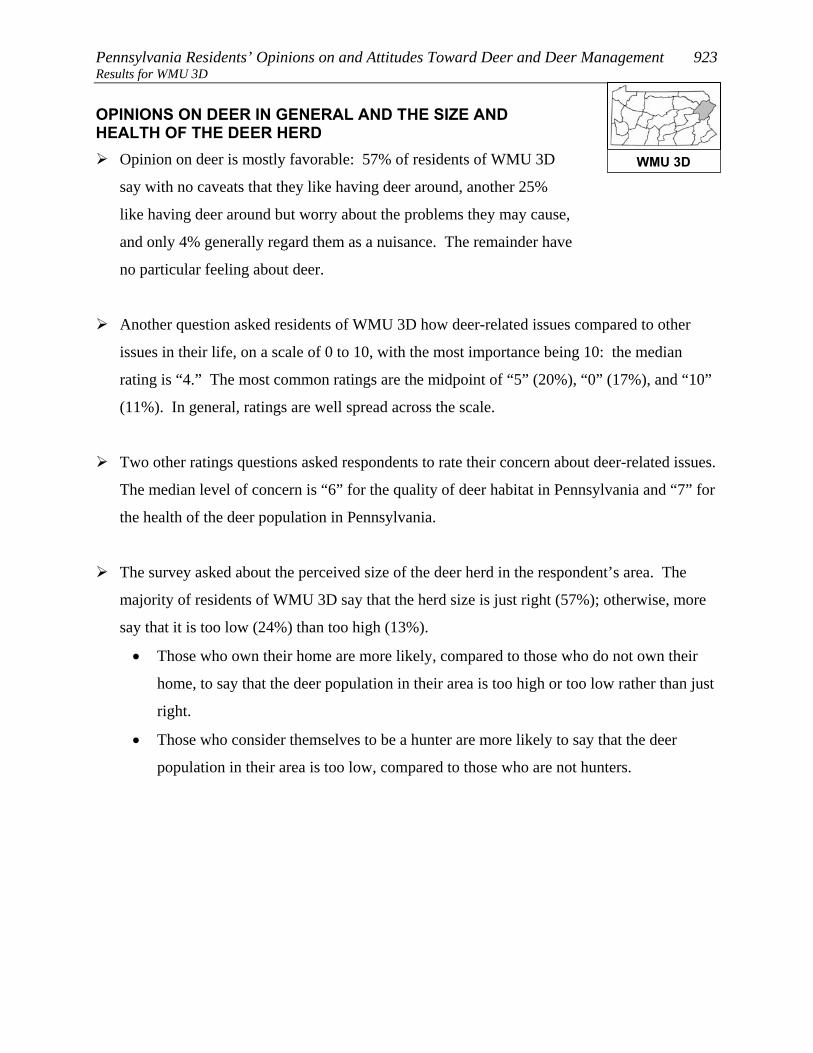
Pennsylvania Residents’ Opinions on and Attitudes Toward Deer and Deer Management 923 Results for WMU 3D OPINIONS ON DEER IN GENERAL AND THE SIZE AND HEALTH OF THE DEER HERD
Opinion on deer is mostly favorable: 57% of residents of WMU 3D
say with no caveats that they like having deer around, another 25%
like having deer around but worry about the problems they may cause,
and only 4% generally regard them as a nuisance. The remainder have
no particular feeling about deer.
Another question asked residents of WMU 3D how deer-related issues compared to other
issues in their life, on a scale of 0 to 10, with the most importance being 10: the median
rating is “4.” The most common ratings are the midpoint of “5” (20%), “0” (17%), and “10”
(11%). In general, ratings are well spread across the scale.
Two other ratings questions asked respondents to rate their concern about deer-related issues.
The median level of concern is “6” for the quality of deer habitat in Pennsylvania and “7” for
the health of the deer population in Pennsylvania.
The survey asked about the perceived size of the deer herd in the respondent’s area. The
majority of residents of WMU 3D say that the herd size is just right (57%); otherwise, more
say that it is too low (24%) than too high (13%).
• Those who own their home are more likely, compared to those who do not own their
home, to say that the deer population in their area is too high or too low rather than just
right.
• Those who consider themselves to be a hunter are more likely to say that the deer
population in their area is too low, compared to those who are not hunters.
WMU 3D
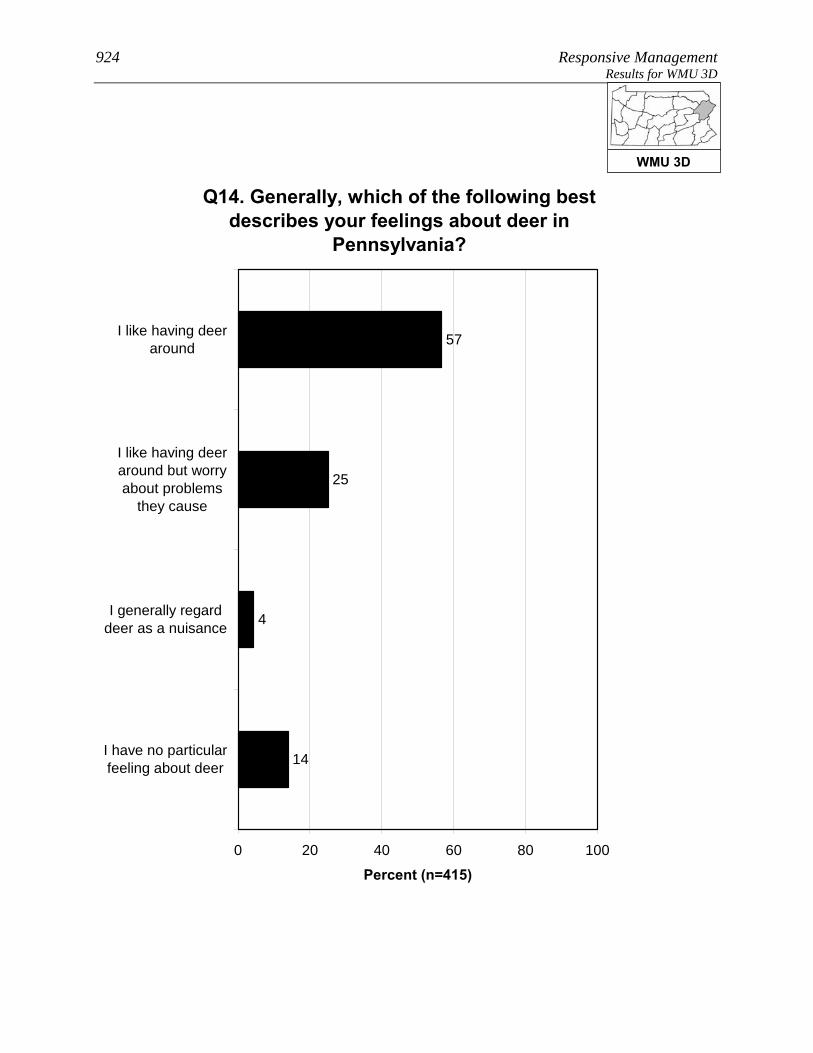
924 Responsive Management Results for WMU 3D
Q14. Generally, which of the following best describes your feelings about deer in
Pennsylvania?
57
25
4
14
0 20 40 60 80 100
I like having deeraround
I like having deeraround but worryabout problems
they cause
I generally regarddeer as a nuisance
I have no particularfeeling about deer
Percent (n=415)
WMU 3D

Pennsylvania Residents’ Opinions on and Attitudes Toward Deer and Deer Management 925 Results for WMU 3D
Q15. Compared to other issues in your life, how important to you, personally, are deer-related
issues on a scale of 0 to 10 where 0 is not at all important and 10 is extremely important?
9
8
7
11
2
6
5
5
20
8
17
1
0 20 40 60 80 100
10
9
8
7
6
5
4
3
2
1
0
Don't know
Percent (n=415)
Mean = 4.28Median = 4
WMU 3D

926 Responsive Management Results for WMU 3D
Q41. How about the quality of deer habitat in Pennsylvania? (How much of a concern is this for you personally on a scale of 0 to 10 where 0 is not at all concerned and 10 is extremely concerned?)
3
4
4
21
4
12
10
8
21
2
8
2
0 20 40 60 80 100
10
9
8
7
6
5
4
3
2
1
0
Don't know
Percent (n=415)
Mean = 6.20Median = 6
WMU 3D

Pennsylvania Residents’ Opinions on and Attitudes Toward Deer and Deer Management 927 Results for WMU 3D
2
3
5
25
6
12
9
9
20
1
7
1
0 20 40 60 80 100
10
9
8
7
6
5
4
3
2
1
0
Don't know
Percent (n=415)
Q42. How about health of the deer population, such as adequate food resources for the size of the deer herd, in Pennsylvania? (How much of a concern is this for you
personally on a scale of 0 to 10 where 0 is not at all concerned and 10 is extremely concerned?)
Mean = 6.59Median = 7
WMU 3D

928 Responsive Management Results for WMU 3D
Q16. In your opinion, is the deer population in the area where you live too high, just right, or too low?
13
57
24
6
0 20 40 60 80 100
Too high
Just right
Too low
Don't know
Percent (n=415)
WMU 3D
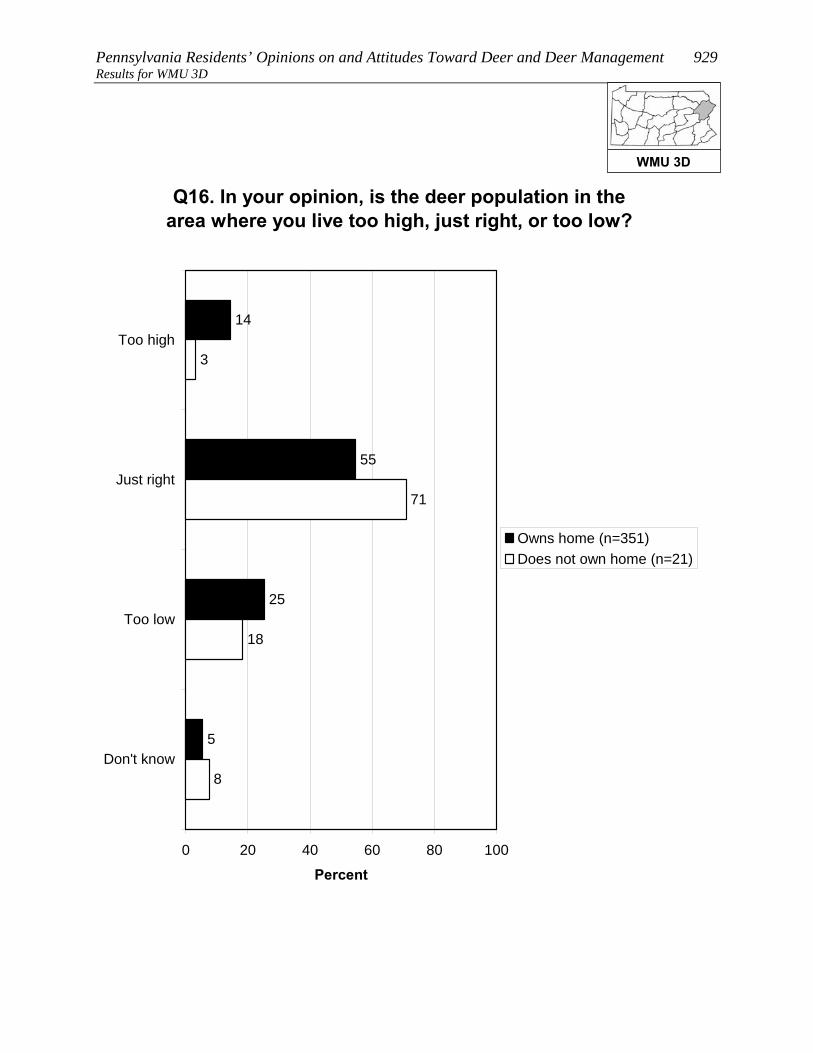
Pennsylvania Residents’ Opinions on and Attitudes Toward Deer and Deer Management 929 Results for WMU 3D
Q16. In your opinion, is the deer population in the area where you live too high, just right, or too low?
14
55
25
5
18
71
3
8
0 20 40 60 80 100
Too high
Just right
Too low
Don't know
Percent
Owns home (n=351)Does not own home (n=21)
WMU 3D
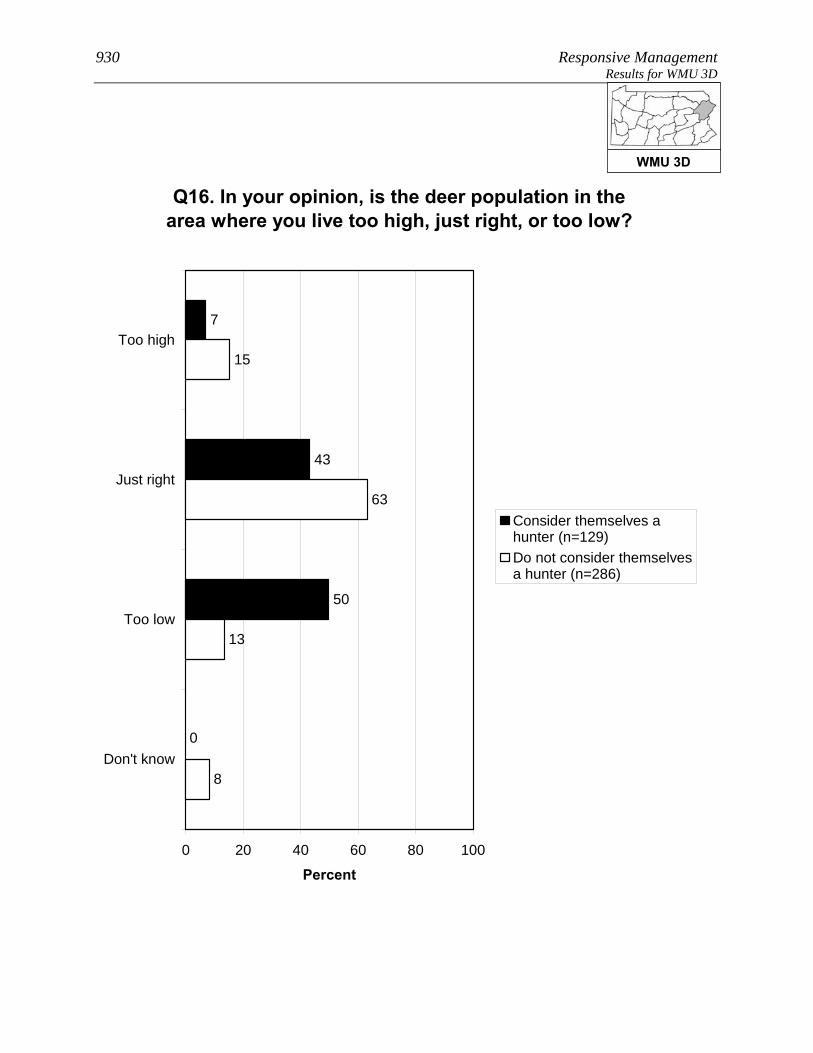
930 Responsive Management Results for WMU 3D
Q16. In your opinion, is the deer population in the area where you live too high, just right, or too low?
7
43
50
0
13
63
15
8
0 20 40 60 80 100
Too high
Just right
Too low
Don't know
Percent
Consider themselves ahunter (n=129)Do not consider themselvesa hunter (n=286)
WMU 3D

Pennsylvania Residents’ Opinions on and Attitudes Toward Deer and Deer Management 931 Results for WMU 3D OPINIONS ON MANAGEMENT EFFORTS AND MANAGEMENT GOALS
The survey asked about three deer population management goals. For
all three, a large majority agree with the management goal, but the
most support is for goals that address ecological concerns rather than
human concerns: 93% agree with managing for healthy and
sustainable deer populations, 89% agree with managing the deer for a
healthy and sustainable forest habitat, and 79% agree with managing
for safe, acceptable levels of deer-human conflicts.
Residents of WMU 3D who said that the deer population in their area is too high or too low
were asked to indicate the reasonable number of years it should take to achieve an acceptable
deer population. The mean amount is 4.86 years. While 28% said that they do not know,
nearly all the rest gave a number of years of 10 or less. Note that this is only among those
who said the deer population was too high or too low.
• Because management plans typically look at a time frame of about 10 years to effect
change, the survey specifically asked if these respondents would be willing to wait
more than 10 years to achieve an acceptable deer population: just under half (49%)
indicated that they would be willing to wait that long.
WMU 3D

932 Responsive Management Results for WMU 3D
Q24-26. Deer populations should be managed for the following. (Do you agree or disagree with this
deer management goal?)
54
35
2
3
4
1
1
31
62
1
4
1
6
40
39
5
7
3
0 20 40 60 80 100
Stronglyagree
Moderatelyagree
Neither agreenor disagree
Moderatelydisagree
Stronglydisagree
Don't know
Percent (n=415)
Healthy and sustainableforest habitatHealthy and sustainabledeer populationsSafe and acceptable levelsof deer-human conflicts
WMU 3D

Pennsylvania Residents’ Opinions on and Attitudes Toward Deer and Deer Management 933 Results for WMU 3D
28
4
3
2
11
20
5
15
12
0 20 40 60 80 100
More than 10years
6-10 years
5 years
4 years
3 years
2 years
1 year
Less than a year
Don't know
Percent (n=162)
Q18. You said the deer population in the area where you live is [too high / too low]. In years, what is a reasonable
amount of time to achieve an acceptable deer population in the area where you live? (Asked of those who think the deer population in the area where they
live is too high or too low.)
Mean = 4.86Median = 4
WMU 3D
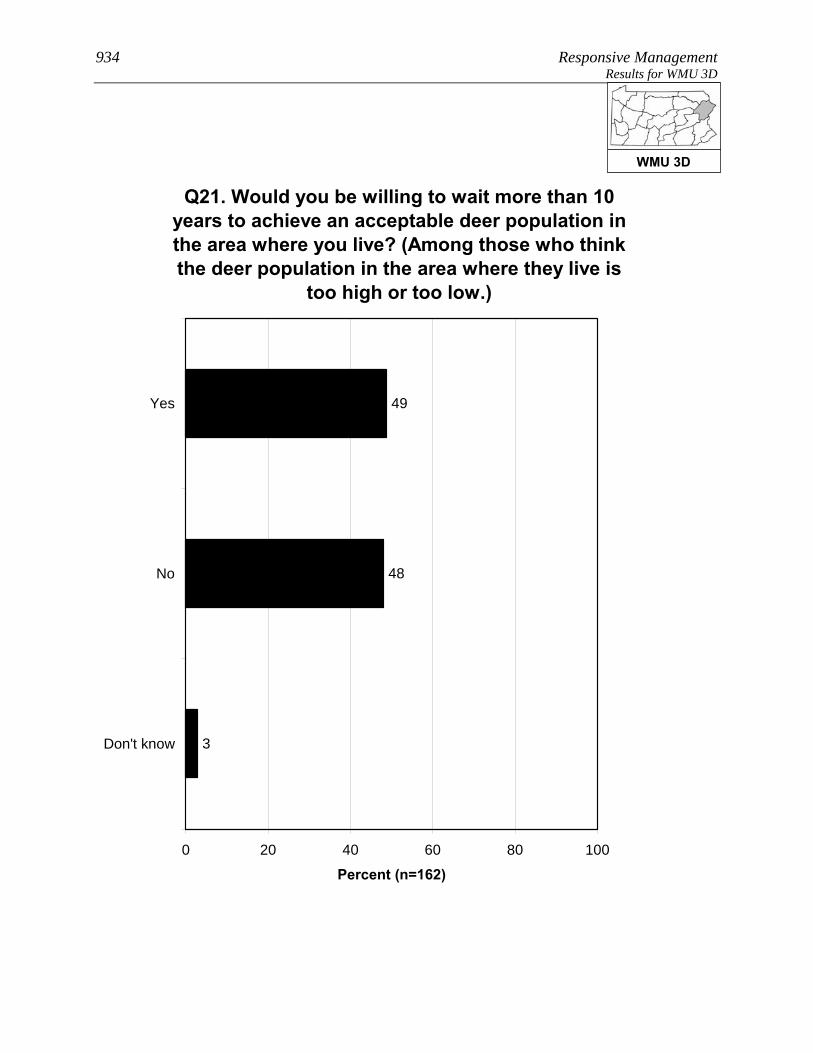
934 Responsive Management Results for WMU 3D
Q21. Would you be willing to wait more than 10 years to achieve an acceptable deer population in the area where you live? (Among those who think the deer population in the area where they live is
too high or too low.)
49
48
3
0 20 40 60 80 100
Yes
No
Don't know
Percent (n=162)
WMU 3D

Pennsylvania Residents’ Opinions on and Attitudes Toward Deer and Deer Management 935 Results for WMU 3D OPINIONS ON METHODS FOR MANAGING DEER, INCLUDING HUNTING
A large majority of residents of WMU 3D (65%) support lethal
methods to manage deer populations in Pennsylvania; nonetheless,
28% oppose, mostly strong opposition.
• Those residents of WMU 3D who live in a single-family home and own their home,
compared to those who live in a single-family home but do not own their home, are
much more likely to strongly support lethal methods, but less likely to moderately
support them. Overall support is 65% among home owners and 70% among non-
owners.
• The survey asked about four methods of controlling deer populations (three of them
lethal). The most support is for legal, regulated hunting (89% of respondents support
this method), distantly followed by fertility/birth control (38%), professionals or
sharpshooters (32%), and trapping and killing (20%).
Two questions asked respondents about hunting on their land (among those who live in a
single-family home), the first question about hunting by the respondents themselves (8% do
so) and the second regarding allowing others to hunt on their land (11% do so). In
combining the results, 13% of residents of WMU 3D who live in a single-family home either
hunt on their own land or allow others to do so (it is not simply a sum of the two questions
because some hunt on their property and allow others to do so as well).
• There was interest in seeing how a particular subgroup responded on this question, the
subgroup being those who live in a single-family home; who live on 1 acre or less; and
who live in an urban, suburban area, or a small city/town. Among this subgroup, 2%
either hunt on their own property or allow others to hunt on the property.
• Those respondents who do not allow hunting on their property were asked to indicate
why they prohibit it. The most common reasons are that they live in an urban or
suburban area in which hunting is not possible or feasible and/or that their property is
too small. Other minor reasons are concerns about safety, a general opposition to
hunting, and liability concerns.
WMU 3D
936 Responsive Management Results for WMU 3D
• Those same respondents who do not allow hunting on their property
were asked about their likelihood of ever allowing others to hunt
deer on their property; they overwhelmingly say this is very
unlikely (94%). They were then asked if there is anything that would make them more
likely to allow deer hunting; they are almost unanimous (97%) in saying that there is
nothing that would make them more likely to allow deer hunting.
• The question about allowing others to hunt on their property was examined among the
subgroup previously discussed (those who live in a single-family home; who live on 1
acre or less; and who live in an urban, suburban area, or a small city/town). Among
this group who got the question, nearly all say that they would never allow hunting.
o Additional follow-up questions to be asked of those who indicated that something
might prompt them to allow hunting on their property did not have enough
respondents for statistical validity; therefore, they are not shown.
WMU 3D

Pennsylvania Residents’ Opinions on and Attitudes Toward Deer and Deer Management 937 Results for WMU 3D
Q27. In general, do you support or oppose lethal methods to manage deer populations in
Pennsylvania?
38
27
6
7
21
1
0 20 40 60 80 100
Strongly support
Moderatelysupport
Neither supportnor oppose
Moderately oppose
Strongly oppose
Don't know
Percent (n=415)
WMU 3D

938 Responsive Management Results for WMU 3D
Q27. In general, do you support or oppose lethal methods to manage deer populations in
Pennsylvania?
39
26
5
7
22
1
4
49
21
11
16
0
0 20 40 60 80 100
Stronglysupport
Moderatelysupport
Neithersupport nor
oppose
Moderatelyoppose
Stronglyoppose
Don't know
Percent
Owns home (n=351)Does not own home (n=21)
WMU 3D
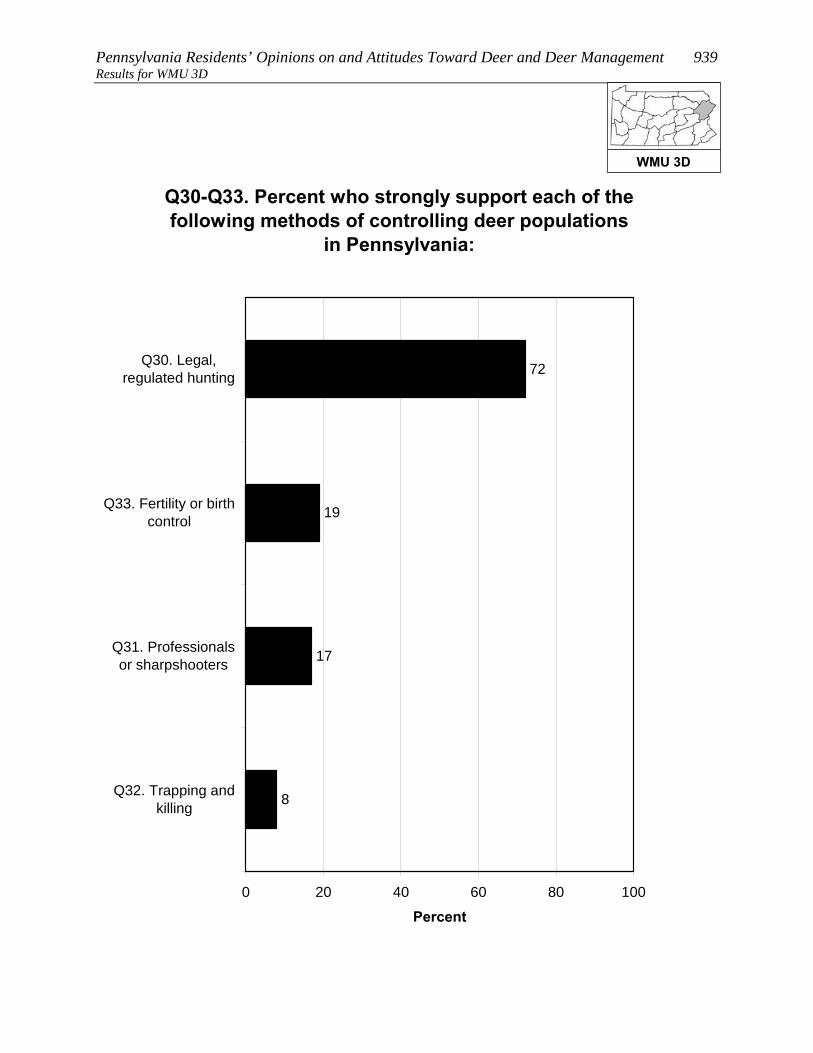
Pennsylvania Residents’ Opinions on and Attitudes Toward Deer and Deer Management 939 Results for WMU 3D
Q30-Q33. Percent who strongly support each of the following methods of controlling deer populations
in Pennsylvania:
8
17
19
72
0 20 40 60 80 100
Q30. Legal,regulated hunting
Q33. Fertility or birthcontrol
Q31. Professionalsor sharpshooters
Q32. Trapping andkilling
Percent
WMU 3D

940 Responsive Management Results for WMU 3D
Q30-Q33. Percent who strongly or moderately support each of the following methods of
controlling deer populations in Pennsylvania:
20
32
38
89
0 20 40 60 80 100
Q30. Legal,regulated hunting
Q33. Fertility or birthcontrol
Q31. Professionalsor sharpshooters
Q32. Trapping andkilling
Percent
WMU 3D
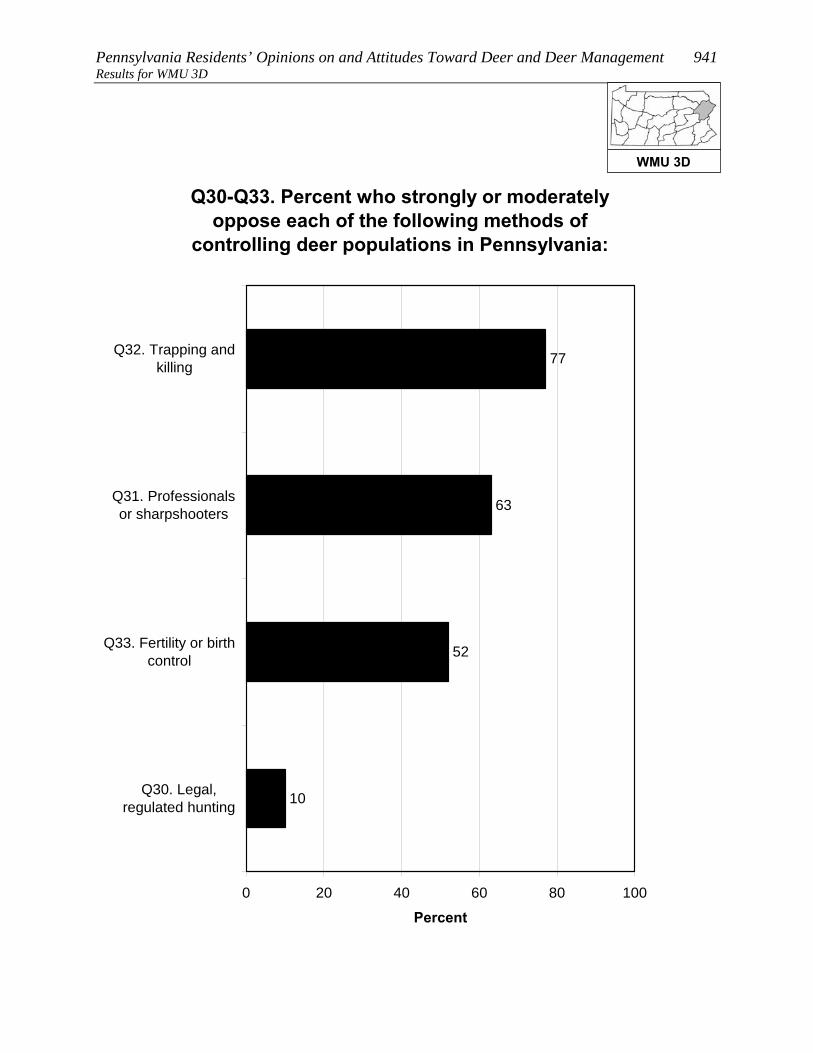
Pennsylvania Residents’ Opinions on and Attitudes Toward Deer and Deer Management 941 Results for WMU 3D
Q30-Q33. Percent who strongly or moderately oppose each of the following methods of
controlling deer populations in Pennsylvania:
10
52
63
77
0 20 40 60 80 100
Q32. Trapping andkilling
Q31. Professionalsor sharpshooters
Q33. Fertility or birthcontrol
Q30. Legal,regulated hunting
Percent
WMU 3D

942 Responsive Management Results for WMU 3D
Q30-Q33. Percent who strongly oppose each of the following methods of controlling deer populations
in Pennsylvania:
6
39
50
63
0 20 40 60 80 100
Q32. Trapping andkilling
Q31. Professionalsor sharpshooters
Q33. Fertility or birthcontrol
Q30. Legal,regulated hunting
Percent
WMU 3D

Pennsylvania Residents’ Opinions on and Attitudes Toward Deer and Deer Management 943 Results for WMU 3D
Q59/60. Deer hunts and/or allows others to deer hunt on property. (Among respondents living in a
single-family home.)
13
87
0 20 40 60 80 100
Yes
No
Percent (n=372)
WMU 3D

944 Responsive Management Results for WMU 3D
Q59/60. Deer hunts and/or allows others to deer hunt on property. (Among respondents living in a
single-family home.)
2
98
0 20 40 60 80 100
Yes
No
Percent
Lives in a single familyhome on 1 acre or less inan urban area, a suburbanarea, or a small city/town(n=156)
WMU 3D

Pennsylvania Residents’ Opinions on and Attitudes Toward Deer and Deer Management 945 Results for WMU 3D
Q63. What are the main reasons you do not allow others to hunt deer on your property? (Asked of
those whose primary place of residence is a single-family home and who do not allow others to hunt
deer on their property.)
1
1
51
45
9
7
2
1
0 20 40 60 80 100
Live in residential neighborhood / suburbanor urban area
Property is too small / neighbors too close
Concerned about safety
Oppose hunting in general
Liability
Want to save hunting opportunities for self /family
No one has asked for hunting access
Not enough deer on property / not enoughhabitat
Mul
tiple
Res
pons
es A
llow
ed
Percent (n=336)
WMU 3D

946 Responsive Management Results for WMU 3D
Q65. How likely are you to ever allow others to deer hunt on your property? (Asked of those whose
primary place of residence is a single-family home and who do not allow others to hunt deer on their
property.)
1
2
0
3
94
0 20 40 60 80 100
Very likely
Somewhat likely
Neither likely norunlikely
Somewhat unlikely
Very unlikely
Percent (n=336)
WMU 3D
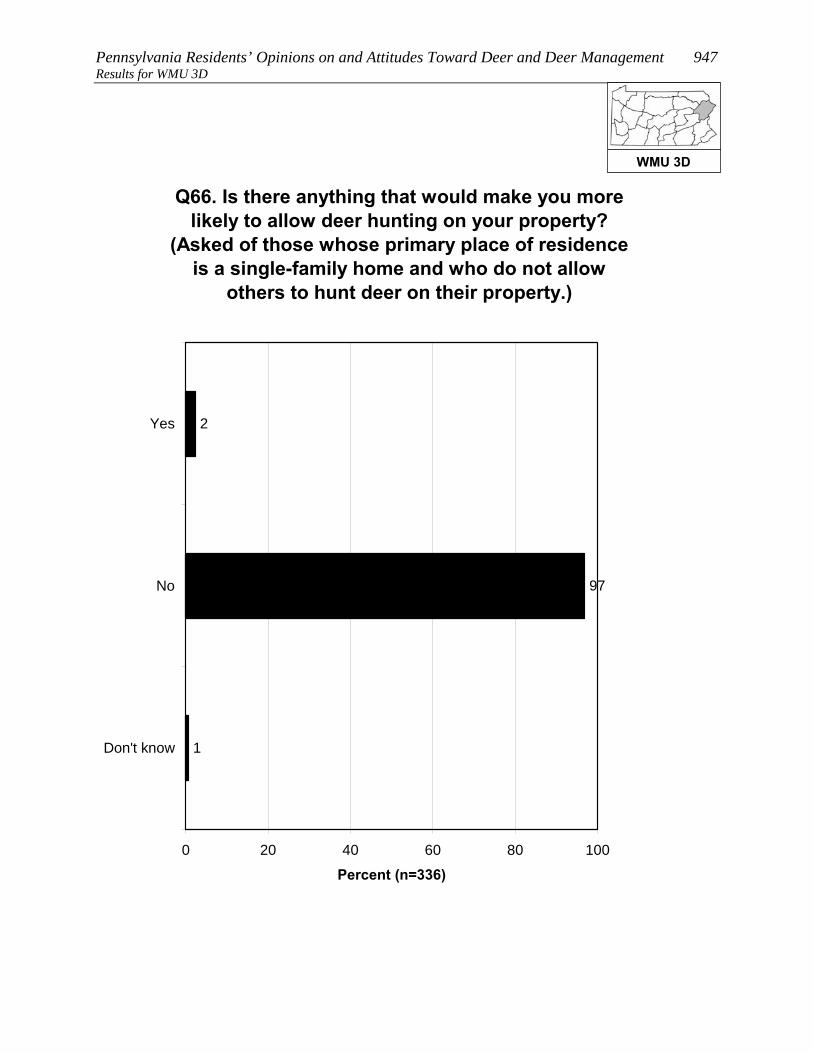
Pennsylvania Residents’ Opinions on and Attitudes Toward Deer and Deer Management 947 Results for WMU 3D
Q66. Is there anything that would make you more likely to allow deer hunting on your property?
(Asked of those whose primary place of residence is a single-family home and who do not allow
others to hunt deer on their property.)
2
97
1
0 20 40 60 80 100
Yes
No
Don't know
Percent (n=336)
WMU 3D
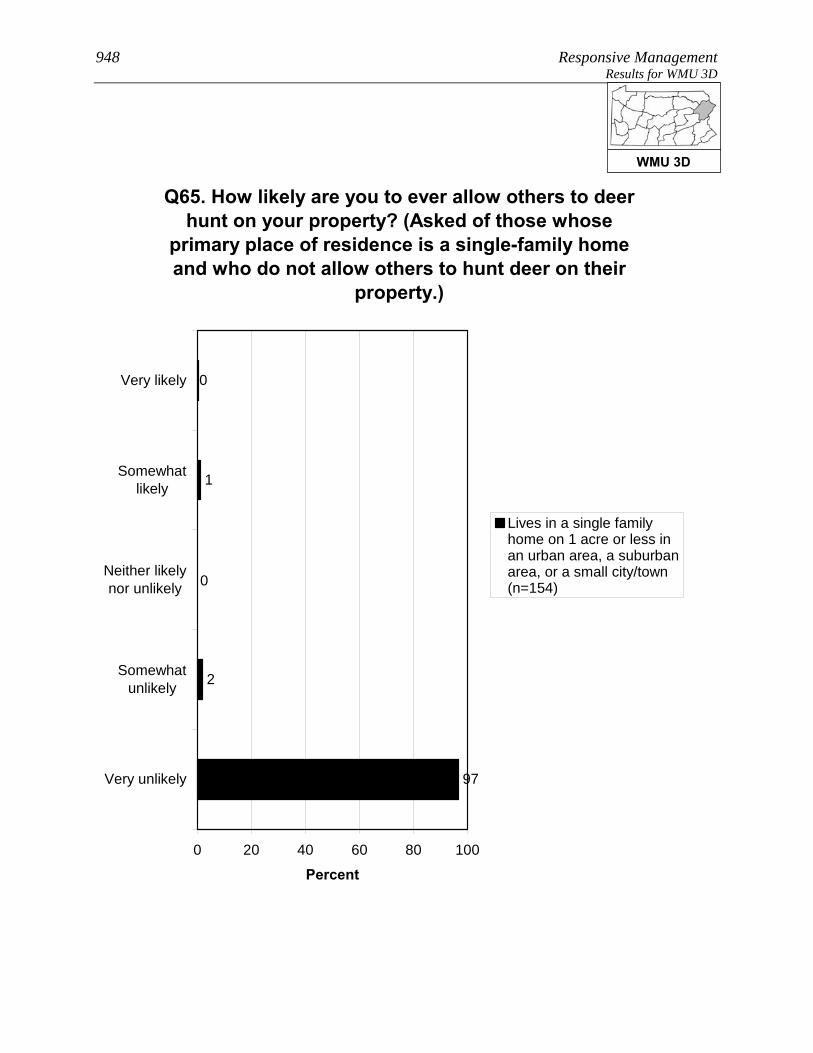
948 Responsive Management Results for WMU 3D
Q65. How likely are you to ever allow others to deer hunt on your property? (Asked of those whose
primary place of residence is a single-family home and who do not allow others to hunt deer on their
property.)
0
1
0
2
97
0 20 40 60 80 100
Very likely
Somewhatlikely
Neither likelynor unlikely
Somewhatunlikely
Very unlikely
Percent
Lives in a single familyhome on 1 acre or less inan urban area, a suburbanarea, or a small city/town(n=154)
WMU 3D
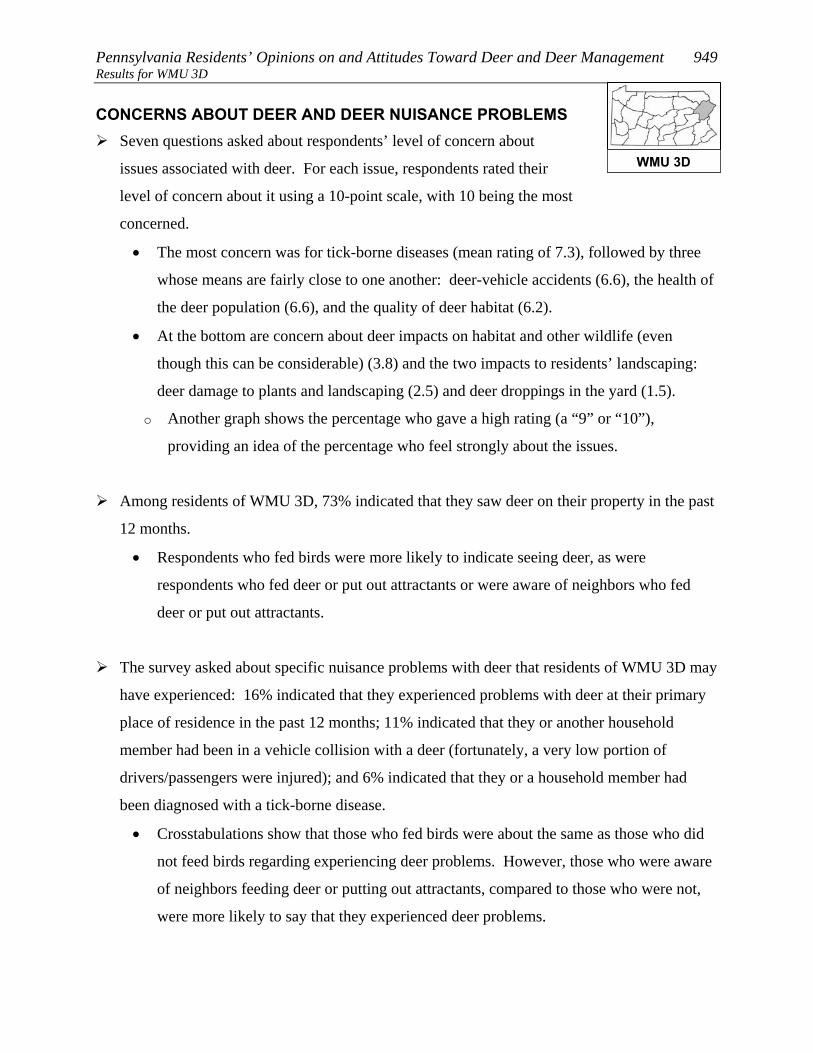
Pennsylvania Residents’ Opinions on and Attitudes Toward Deer and Deer Management 949 Results for WMU 3D CONCERNS ABOUT DEER AND DEER NUISANCE PROBLEMS
Seven questions asked about respondents’ level of concern about
issues associated with deer. For each issue, respondents rated their
level of concern about it using a 10-point scale, with 10 being the most
concerned.
• The most concern was for tick-borne diseases (mean rating of 7.3), followed by three
whose means are fairly close to one another: deer-vehicle accidents (6.6), the health of
the deer population (6.6), and the quality of deer habitat (6.2).
• At the bottom are concern about deer impacts on habitat and other wildlife (even
though this can be considerable) (3.8) and the two impacts to residents’ landscaping:
deer damage to plants and landscaping (2.5) and deer droppings in the yard (1.5).
o Another graph shows the percentage who gave a high rating (a “9” or “10”),
providing an idea of the percentage who feel strongly about the issues.
Among residents of WMU 3D, 73% indicated that they saw deer on their property in the past
12 months.
• Respondents who fed birds were more likely to indicate seeing deer, as were
respondents who fed deer or put out attractants or were aware of neighbors who fed
deer or put out attractants.
The survey asked about specific nuisance problems with deer that residents of WMU 3D may
have experienced: 16% indicated that they experienced problems with deer at their primary
place of residence in the past 12 months; 11% indicated that they or another household
member had been in a vehicle collision with a deer (fortunately, a very low portion of
drivers/passengers were injured); and 6% indicated that they or a household member had
been diagnosed with a tick-borne disease.
• Crosstabulations show that those who fed birds were about the same as those who did
not feed birds regarding experiencing deer problems. However, those who were aware
of neighbors feeding deer or putting out attractants, compared to those who were not,
were more likely to say that they experienced deer problems.
WMU 3D

950 Responsive Management Results for WMU 3D
Q36-Q42. Mean rating of respondents' concern about each of the following on a 10-point scale:
2.5
3.8
6.2
6.6
6.6
7.3
1.5
0 2 4 6 8 10
Q36. Tick-borne diseases, such as Lymedisease, in Pennsylvania
Q40. Deer-vehicle accidents inPennsylvania
Q42. The health of the deer population,such as adequate food resources for the
size of the deer herd, in Pennsylvania
Q41. The quality of deer habitat inPennsylvania
Q39. Deer impacts on the habitat andother wildlife in Pennsylvania
Q38. Deer damage to plants andlandscaping in his/her yard
Q37. Deer droppings in his/her yard
Mean
WMU 3D

Pennsylvania Residents’ Opinions on and Attitudes Toward Deer and Deer Management 951 Results for WMU 3D
Q36-Q42. Percent who rated their concern about each of the following as a 9 or 10 on a 10-point
scale:
9
9
25
31
33
45
6
0 20 40 60 80 100
Q36. Tick-borne diseases, such as Lymedisease, in Pennsylvania
Q40. Deer-vehicle accidents inPennsylvania
Q42. The health of the deer population,such as adequate food resources for the
size of the deer herd, in Pennsylvania
Q41. The quality of deer habitat inPennsylvania
Q38. Deer damage to plants andlandscaping in his/her yard
Q39. Deer impacts on the habitat andother wildlife in Pennsylvania
Q37. Deer droppings in his/her yard
Percent
WMU 3D

952 Responsive Management Results for WMU 3D
Q49. How often have you seen deer on your property in the past 12 months?
37
18
17
27
0 20 40 60 80 100
Frequently
Sometimes
Rarely
Never
Percent (n=415)
WMU 3D
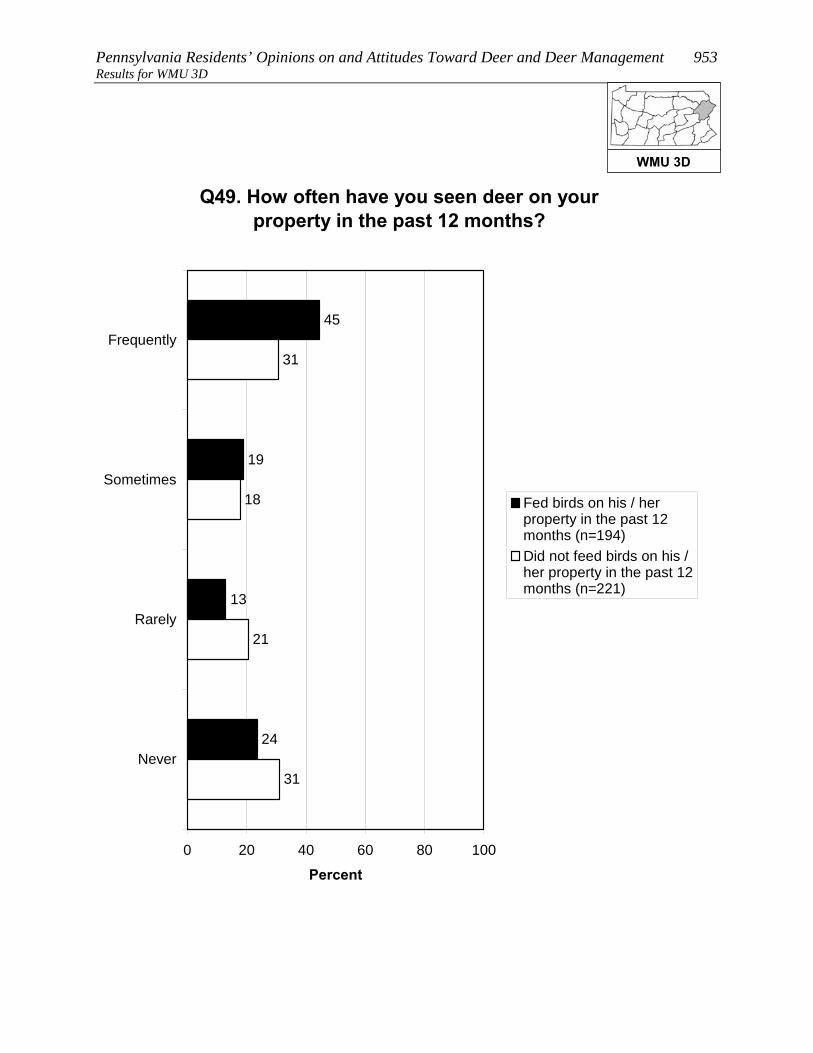
Pennsylvania Residents’ Opinions on and Attitudes Toward Deer and Deer Management 953 Results for WMU 3D
Q49. How often have you seen deer on your property in the past 12 months?
45
19
13
24
21
18
31
31
0 20 40 60 80 100
Frequently
Sometimes
Rarely
Never
Percent
Fed birds on his / herproperty in the past 12months (n=194)Did not feed birds on his /her property in the past 12months (n=221)
WMU 3D
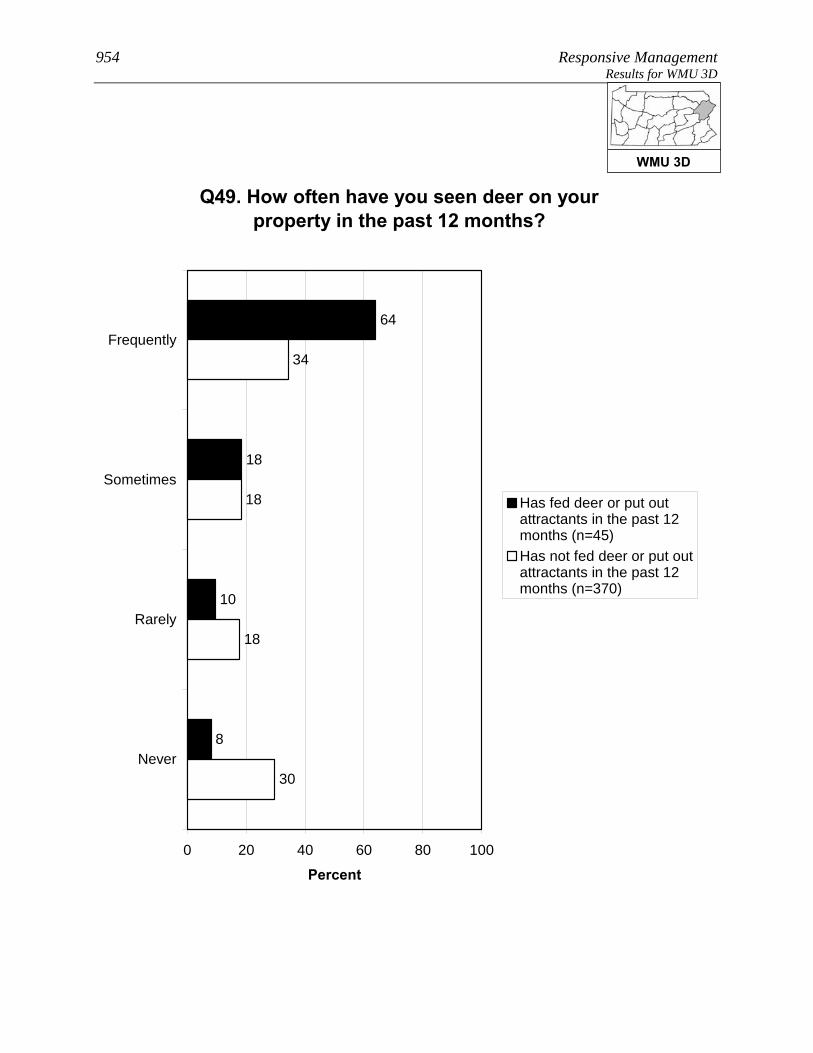
954 Responsive Management Results for WMU 3D
Q49. How often have you seen deer on your property in the past 12 months?
64
18
10
8
18
18
34
30
0 20 40 60 80 100
Frequently
Sometimes
Rarely
Never
Percent
Has fed deer or put outattractants in the past 12months (n=45)Has not fed deer or put outattractants in the past 12months (n=370)
WMU 3D

Pennsylvania Residents’ Opinions on and Attitudes Toward Deer and Deer Management 955 Results for WMU 3D
Q49. How often have you seen deer on your property in the past 12 months?
66
13
9
12
19
19
33
30
0 20 40 60 80 100
Frequently
Sometimes
Rarely
Never
Percent
Is aware of neighborsfeeding deer or putting outattractants (n=50)Is not aware of neighborsfeeding deer or putting outattractants (n=351)
WMU 3D

956 Responsive Management Results for WMU 3D
Q43. In the past 12 months, have you experienced any problems with deer at your primary place of
residence?
16
84
0 20 40 60 80 100
Yes
No
Percent (n=415)
WMU 3D

Pennsylvania Residents’ Opinions on and Attitudes Toward Deer and Deer Management 957 Results for WMU 3D
Q43. In the past 12 months, have you experienced any problems with deer at your primary place of
residence?
14
86
82
18
0 20 40 60 80 100
Yes
No
Percent
Fed birds on his / herproperty in the past 12months (n=194)Did not feed birds on his /her property in the past 12months (n=221)
WMU 3D

958 Responsive Management Results for WMU 3D
Q43. In the past 12 months, have you experienced any problems with deer at your primary place of
residence?
29
71
85
15
0 20 40 60 80 100
Yes
No
Percent
Is aware of neighborsfeeding deer or putting outattractants (n=50)Is not aware of neighborsfeeding deer or putting outattractants (n=351)
WMU 3D
Pennsylvania Residents’ Opinions on and Attitudes Toward Deer and Deer Management 959 Results for WMU 3D
Q44. In the past 12 months, have you or any other person living in your immediate household been in a vehicle collision with or an accident involving a
deer on Pennsylvania's roads or highways?
11
89
0 20 40 60 80 100
Yes
No
Percent (n=415)
WMU 3D
960 Responsive Management Results for WMU 3D
Q45. Were you or anyone else injured? (Asked of those who had a household member who was in or
who have personally been in a vehicle collision with or an accident involving a deer on
Pennsylvania's roads or highways in the past 12 months.)
1
99
0 20 40 60 80 100
Yes
No
Percent (n=50)
WMU 3D

Pennsylvania Residents’ Opinions on and Attitudes Toward Deer and Deer Management 961 Results for WMU 3D
Q46. In the past 12 months, have you or any other person living in your immediate household been
diagnosed by a physician with a tick-borne disease, such as Lyme disease?
6
94
0 20 40 60 80 100
Yes
No
Percent (n=415)
WMU 3D

962 Responsive Management Results for WMU 3D
FEEDING WILDLIFE AND HUNTING DEER Several questions asked about feeding wildlife.
• Feeding deer or putting out deer attractants: 11% of residents of
WMU 3D did this, and 10% are aware of neighbors who did this.
o The most typical feeds or attractants put out by respondents are salt/mineral blocks,
corn, and apples.
• Feeding birds: 49% of residents of WMU 3D did this.
There is no consensus on whether it is okay for private citizens to feed or attract deer in
Pennsylvania: 37% agree that this is okay, but 56% disagree (the rest are neutral).
More than a quarter of residents of WMU 3D (29%) consider themselves to be a hunter,
about two-thirds of whom have a Pennsylvania hunting license.
• Among residents of WMU 3D who live in a single-family home, 8% personally hunt
deer on their property.
• A large majority of residents of WMU 3D (78%) say that they, family members, and/or
friends hunt.
WMU 3D

Pennsylvania Residents’ Opinions on and Attitudes Toward Deer and Deer Management 963 Results for WMU 3D
Q50. Did you ever feed deer intentionally or put out attractants, such as a salt or mineral block, in the
past 12 months?
11
89
0 20 40 60 80 100
Yes
No
Percent (n=415)
WMU 3D

964 Responsive Management Results for WMU 3D
Q55. Are you aware of any of your neighbors feeding deer intentionally or trying to attract deer
on their property in the past 12 months?
10
86
4
0 20 40 60 80 100
Yes
No
Don't know
Percent (n=415)
WMU 3D

Pennsylvania Residents’ Opinions on and Attitudes Toward Deer and Deer Management 965 Results for WMU 3D
Q53. What type of feed or attractant did you use? (Asked of those who fed deer intentionally or put
out attractants in the past 12 months.)
3
4
48
44
16
11
10
4
0 20 40 60 80 100
Salt / mineralblock
Corn
Apples
Bread
Horse feed
Hay
Pellets /commercial
feed
Other foodproducts
Mul
tiple
Res
pons
es A
llow
ed
Percent (n=45)
WMU 3D

966 Responsive Management Results for WMU 3D
Q48. Did you feed birds or make birdfeed available on your property in the past 12 months?
49
51
0 20 40 60 80 100
Yes
No
Percent (n=415)
WMU 3D

Pennsylvania Residents’ Opinions on and Attitudes Toward Deer and Deer Management 967 Results for WMU 3D
Q56. Do you agree or disagree that it is OK for private citizens to feed or attract deer in
Pennsylvania?
15
22
6
19
37
2
0 20 40 60 80 100
Strongly agree
Moderately agree
Neither agree nordisagree
Moderatelydisagree
Strongly disagree
Don't know
Percent (n=415)
WMU 3D

968 Responsive Management Results for WMU 3D
Q59. Do you personally hunt deer on your property? (Asked of those whose primary place of
residence is a single-family home.)
8
92
0 20 40 60 80 100
Yes
No
Percent (n=372)
WMU 3D

Pennsylvania Residents’ Opinions on and Attitudes Toward Deer and Deer Management 969 Results for WMU 3D
Q79. Do you, any of your family members, or any friends hunt any wildlife species?
78
21
Less than 1%
0 20 40 60 80 100
Yes
No
Don't know
Percent (n=415)
WMU 3D

970 Responsive Management Results for WMU 3D
SOURCES OF INFORMATION Most commonly, residents of WMU 3D say that the best way to
provide them with information about deer in Pennsylvania is through
direct mail (44% gave this response), followed by newspaper (18%),
email (15%), and the Internet (11% saying an Internet site other than
the PGC and 6% saying the agency website; note that some said both).
More than two-fifths of residents of WMU 3D (43%) use social media, the most common
primary site being Facebook.
WMU 3D
Pennsylvania Residents’ Opinions on and Attitudes Toward Deer and Deer Management 971 Results for WMU 3D
Q82. What is the best way to provide you with information about deer in Pennsylvania? We are not sending out information at this time; we are
just measuring interest.
2
3
5
44
18
15
11
10
6
1
1
1
1
5
0 20 40 60 80 100
Direct mail
Newspaper
Internet / website other thanPGC website
TV
PA Game Commission website
Brochures or pamphlets
Magazines
Telephone
PA Hunting and Trapping Digest
Social media
Radio
PA Game Commission offices
Don't know
Mul
tiple
Res
pons
es A
llow
ed
Percent (n=415)
WMU 3D
972 Responsive Management Results for WMU 3D
Q84. Do you use social media, such as Facebook, Twitter, or YouTube?
43
57
0 20 40 60 80 100
Yes
No
Percent (n=415)
WMU 3D
Pennsylvania Residents’ Opinions on and Attitudes Toward Deer and Deer Management 973 Results for WMU 3D
Q85. Which social media site do you use most often? (Asked of those who use social media.)
92
5
3
0 20 40 60 80 100
YouTube
Percent (n=191)
WMU 3D
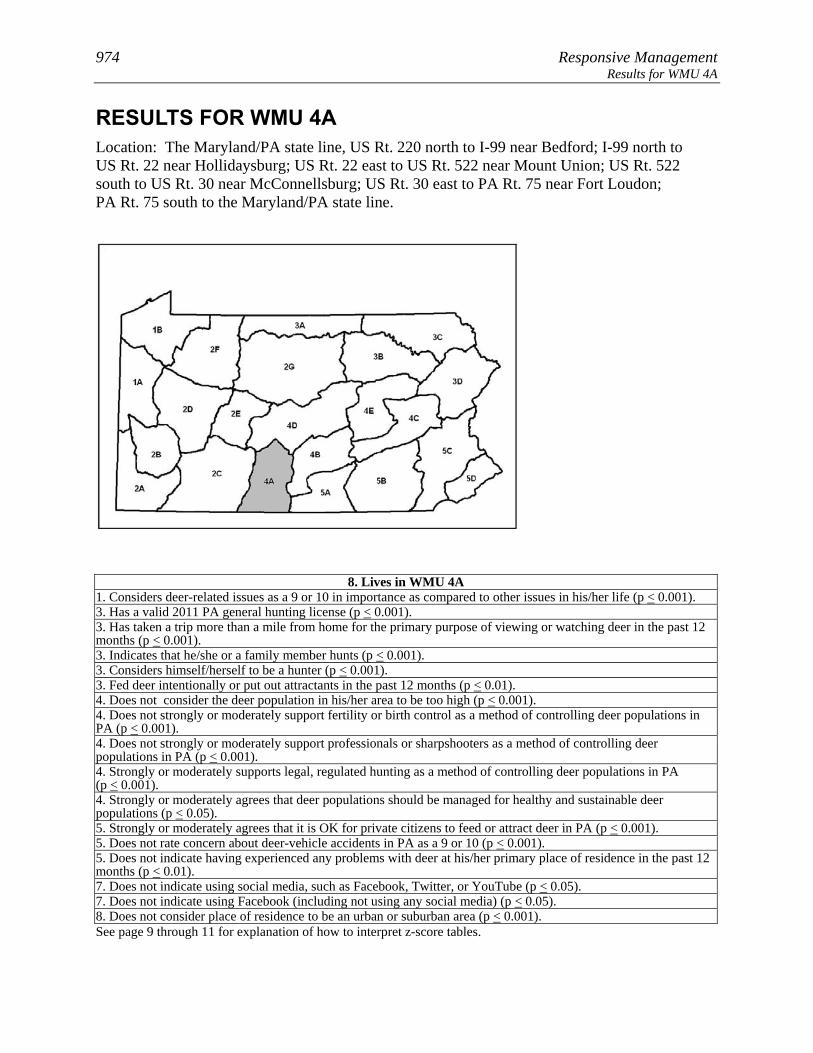
974 Responsive Management Results for WMU 4A
RESULTS FOR WMU 4A Location: The Maryland/PA state line, US Rt. 220 north to I-99 near Bedford; I-99 north to US Rt. 22 near Hollidaysburg; US Rt. 22 east to US Rt. 522 near Mount Union; US Rt. 522 south to US Rt. 30 near McConnellsburg; US Rt. 30 east to PA Rt. 75 near Fort Loudon; PA Rt. 75 south to the Maryland/PA state line.
8. Lives in WMU 4A 1. Considers deer-related issues as a 9 or 10 in importance as compared to other issues in his/her life (p < 0.001). 3. Has a valid 2011 PA general hunting license (p < 0.001). 3. Has taken a trip more than a mile from home for the primary purpose of viewing or watching deer in the past 12 months (p < 0.001). 3. Indicates that he/she or a family member hunts (p < 0.001). 3. Considers himself/herself to be a hunter (p < 0.001). 3. Fed deer intentionally or put out attractants in the past 12 months (p < 0.01). 4. Does not consider the deer population in his/her area to be too high (p < 0.001). 4. Does not strongly or moderately support fertility or birth control as a method of controlling deer populations in PA (p < 0.001). 4. Does not strongly or moderately support professionals or sharpshooters as a method of controlling deer populations in PA (p < 0.001). 4. Strongly or moderately supports legal, regulated hunting as a method of controlling deer populations in PA (p < 0.001). 4. Strongly or moderately agrees that deer populations should be managed for healthy and sustainable deer populations (p < 0.05). 5. Strongly or moderately agrees that it is OK for private citizens to feed or attract deer in PA (p < 0.001). 5. Does not rate concern about deer-vehicle accidents in PA as a 9 or 10 (p < 0.001). 5. Does not indicate having experienced any problems with deer at his/her primary place of residence in the past 12 months (p < 0.01). 7. Does not indicate using social media, such as Facebook, Twitter, or YouTube (p < 0.05). 7. Does not indicate using Facebook (including not using any social media) (p < 0.05). 8. Does not consider place of residence to be an urban or suburban area (p < 0.001). See page 9 through 11 for explanation of how to interpret z-score tables.

Pennsylvania Residents’ Opinions on and Attitudes Toward Deer and Deer Management 975 Results for WMU 4A PARTICIPATION IN VIEWING DEER
A majority of residents of WMU 4A (65%) spent time viewing deer
around their home in the past 12 months, and 39% took a trip of at
least a mile to view deer.
• A little more than a third of those who took a deer-viewing trip (36%) used a spotlight
to view the deer at night.
A majority of residents of WMU 4A (68%) are satisfied with opportunities to view deer in
Pennsylvania. Because a relatively large percentage answer neutrally, only 20% indicate
being dissatisfied.
WMU 4A

976 Responsive Management Results for WMU 4A
Q10. Have you spent time viewing or watching deer around your home in the past 12 months?
65
35
0 20 40 60 80 100
Yes
No
Percent (n=424)
WMU 4A

Pennsylvania Residents’ Opinions on and Attitudes Toward Deer and Deer Management 977 Results for WMU 4A
Q11. Have you taken a trip at least 1 mile from your home for the primary purpose of viewing or
watching deer in the past 12 months?
39
61
0 20 40 60 80 100
Yes
No
Percent (n=424)
WMU 4A
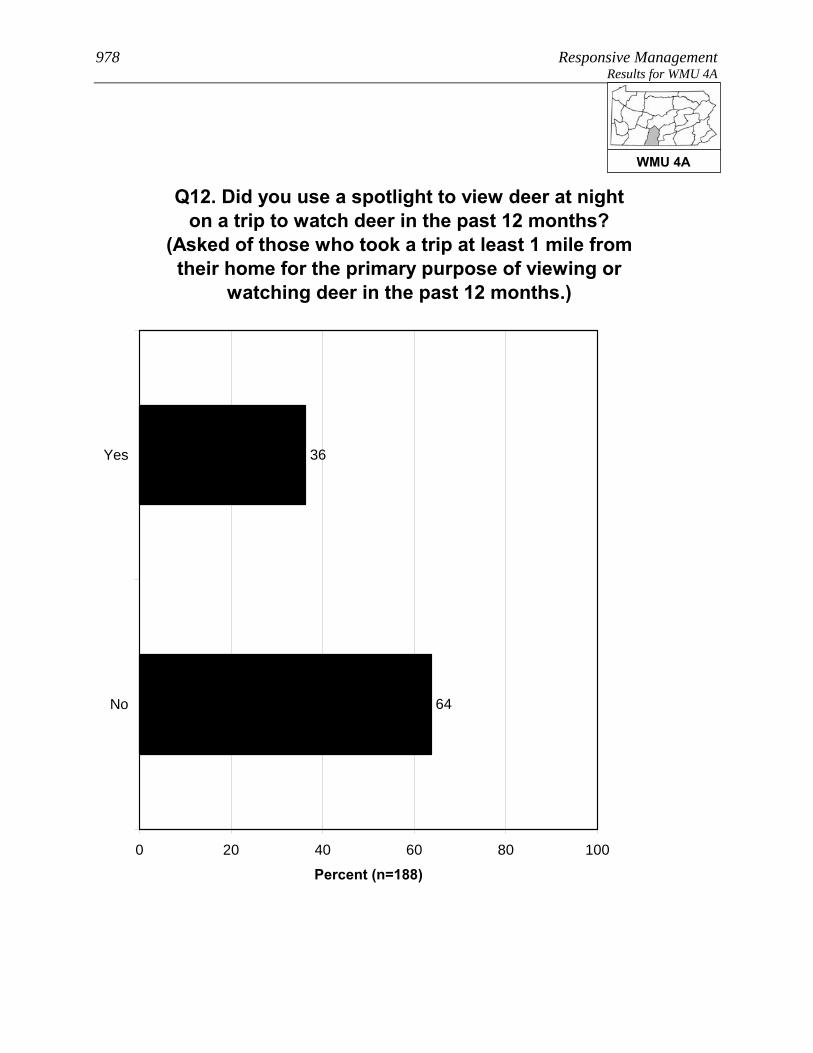
978 Responsive Management Results for WMU 4A
Q12. Did you use a spotlight to view deer at night on a trip to watch deer in the past 12 months?
(Asked of those who took a trip at least 1 mile from their home for the primary purpose of viewing or
watching deer in the past 12 months.)
36
64
0 20 40 60 80 100
Yes
No
Percent (n=188)
WMU 4A
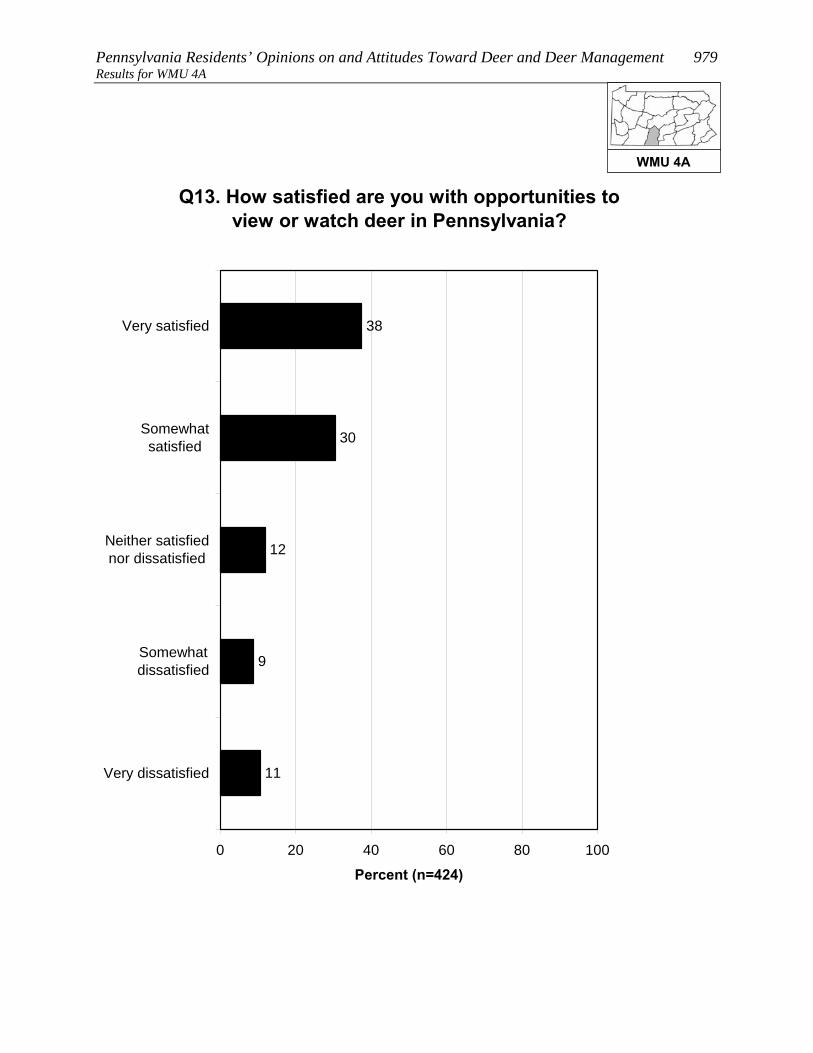
Pennsylvania Residents’ Opinions on and Attitudes Toward Deer and Deer Management 979 Results for WMU 4A
Q13. How satisfied are you with opportunities to view or watch deer in Pennsylvania?
38
30
12
9
11
0 20 40 60 80 100
Very satisfied
Somewhatsatisfied
Neither satisfiednor dissatisfied
Somewhatdissatisfied
Very dissatisfied
Percent (n=424)
WMU 4A
980 Responsive Management Results for WMU 4A
OPINIONS ON DEER IN GENERAL AND THE SIZE AND HEALTH OF THE DEER HERD
Opinion on deer is mostly favorable: 66% of residents of WMU 4A
say with no caveats that they like having deer around, another 16%
like having deer around but worry about the problems they may cause,
and only 3% generally regard them as a nuisance. The remainder have
no particular feeling about deer.
Another question asked residents of WMU 4A how deer-related issues compared to other
issues in their life, on a scale of 0 to 10, with the most importance being 10: the median
rating is “5.” The most common ratings are “0” (16%), the midpoint of “5” (15%), and
“10” (14%). In general, ratings are well spread across the scale.
Two other ratings questions asked respondents to rate their concern about deer-related issues.
The median level of concern is “6” for the quality of deer habitat in Pennsylvania and “7” for
the health of the deer population in Pennsylvania.
The survey asked about the perceived size of the deer herd in the respondent’s area. The
most common response among residents of WMU 4A is that the herd size is just right (45%),
closely followed by that it is too low (42%); only 4% say it is too high.
• Those who own their home are about the same, compared to those who do not own
their home, regarding their feelings about the size of the deer population in their area.
• Those who consider themselves to be a hunter are more likely to say that the deer
population in their area is too low, compared to those who are not hunters.
WMU 4A
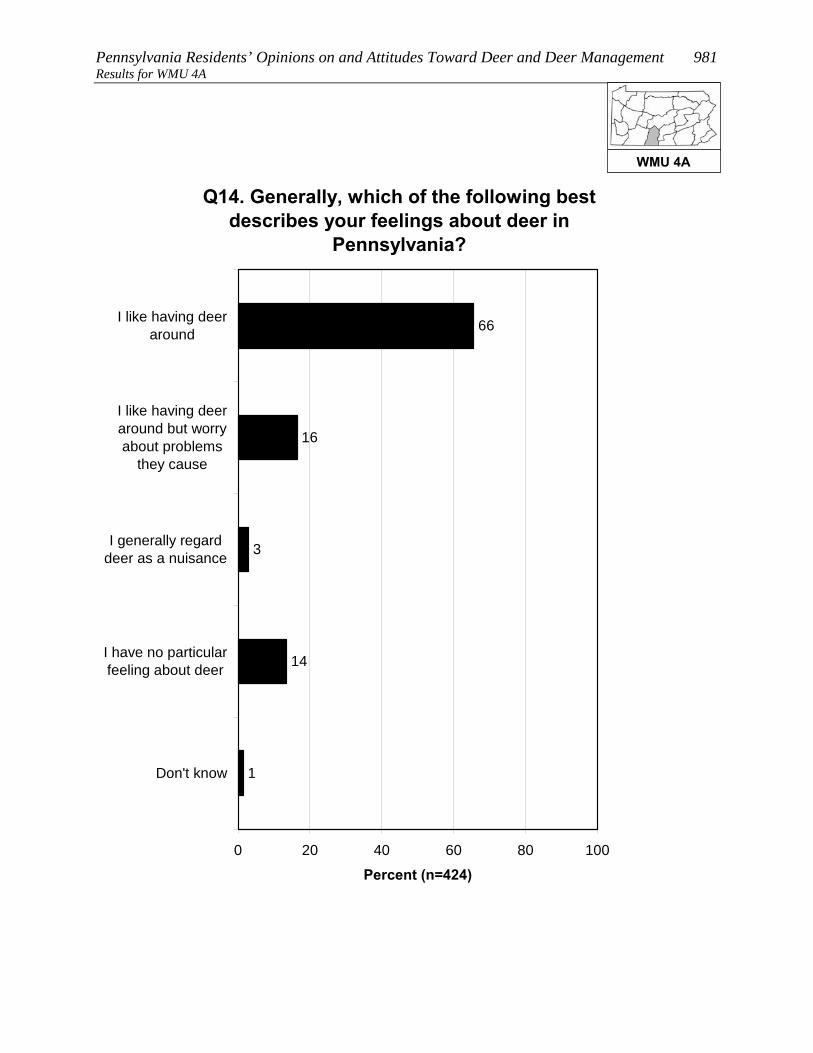
Pennsylvania Residents’ Opinions on and Attitudes Toward Deer and Deer Management 981 Results for WMU 4A
Q14. Generally, which of the following best describes your feelings about deer in
Pennsylvania?
66
16
3
14
1
0 20 40 60 80 100
I like having deeraround
I like having deeraround but worryabout problems
they cause
I generally regarddeer as a nuisance
I have no particularfeeling about deer
Don't know
Percent (n=424)
WMU 4A
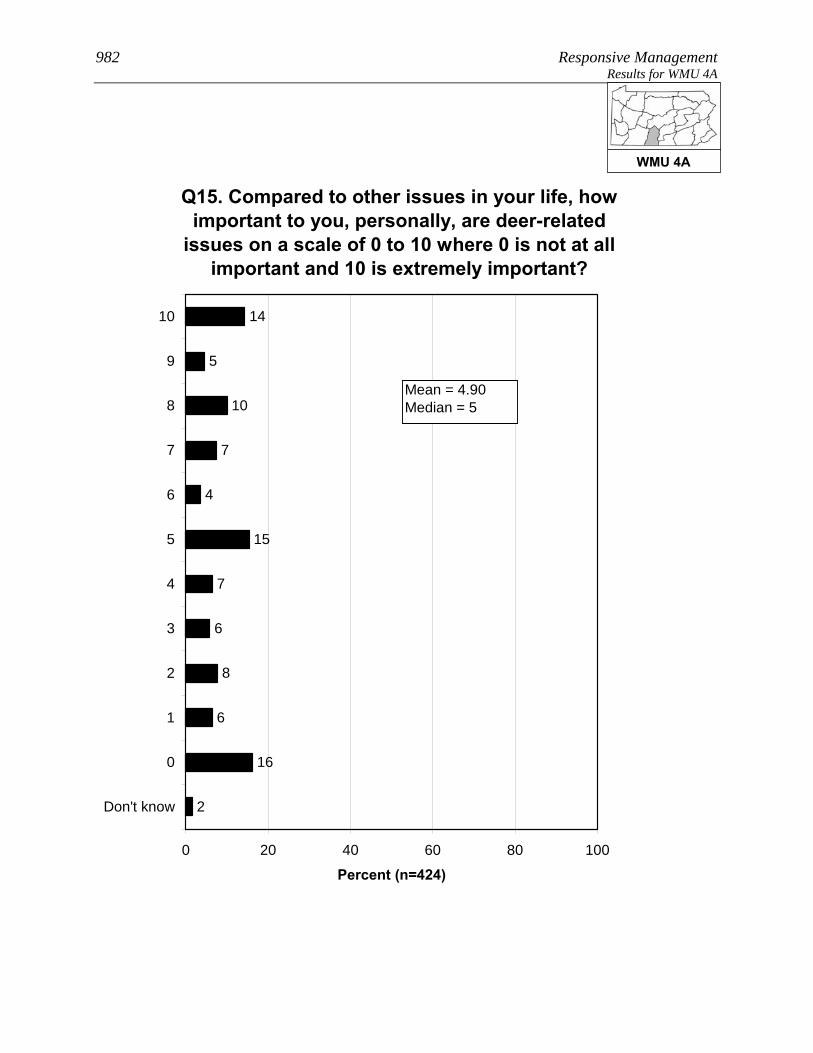
982 Responsive Management Results for WMU 4A
Q15. Compared to other issues in your life, how important to you, personally, are deer-related
issues on a scale of 0 to 10 where 0 is not at all important and 10 is extremely important?
8
6
7
14
5
10
7
4
15
6
16
2
0 20 40 60 80 100
10
9
8
7
6
5
4
3
2
1
0
Don't know
Percent (n=424)
Mean = 4.90Median = 5
WMU 4A

Pennsylvania Residents’ Opinions on and Attitudes Toward Deer and Deer Management 983 Results for WMU 4A
Q41. How about the quality of deer habitat in Pennsylvania? (How much of a concern is this for you personally on a scale of 0 to 10 where 0 is not at all concerned and 10 is extremely concerned?)
3
5
5
16
3
19
8
5
21
2
12
1
0 20 40 60 80 100
10
9
8
7
6
5
4
3
2
1
0
Don't know
Percent (n=424)
Mean = 5.83Median = 6
WMU 4A
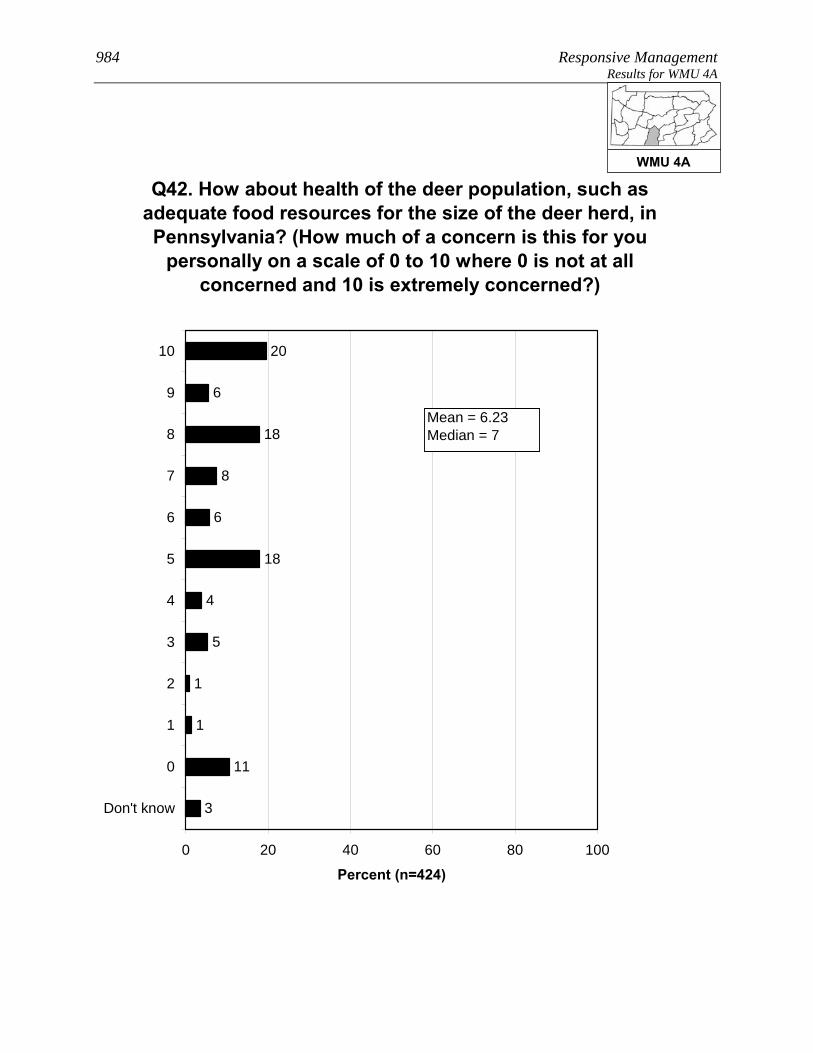
984 Responsive Management Results for WMU 4A
1
5
4
20
6
18
8
6
18
1
11
3
0 20 40 60 80 100
10
9
8
7
6
5
4
3
2
1
0
Don't know
Percent (n=424)
Q42. How about health of the deer population, such as adequate food resources for the size of the deer herd, in Pennsylvania? (How much of a concern is this for you
personally on a scale of 0 to 10 where 0 is not at all concerned and 10 is extremely concerned?)
Mean = 6.23Median = 7
WMU 4A
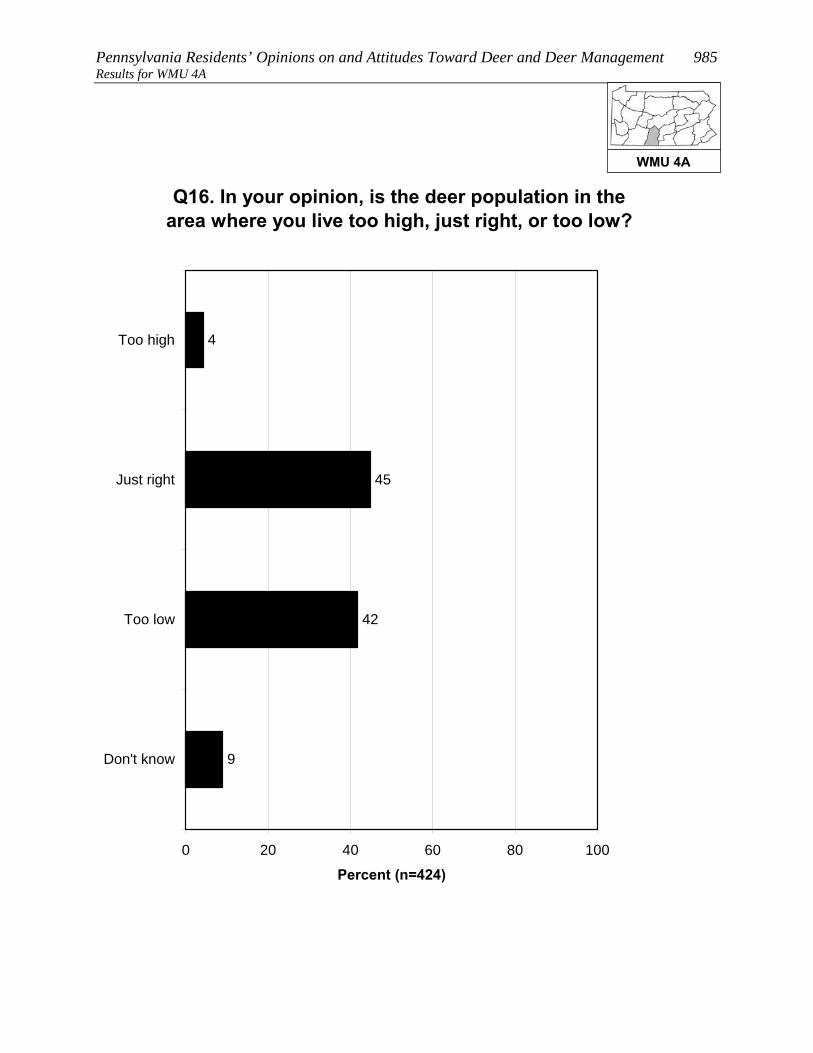
Pennsylvania Residents’ Opinions on and Attitudes Toward Deer and Deer Management 985 Results for WMU 4A
Q16. In your opinion, is the deer population in the area where you live too high, just right, or too low?
4
45
42
9
0 20 40 60 80 100
Too high
Just right
Too low
Don't know
Percent (n=424)
WMU 4A
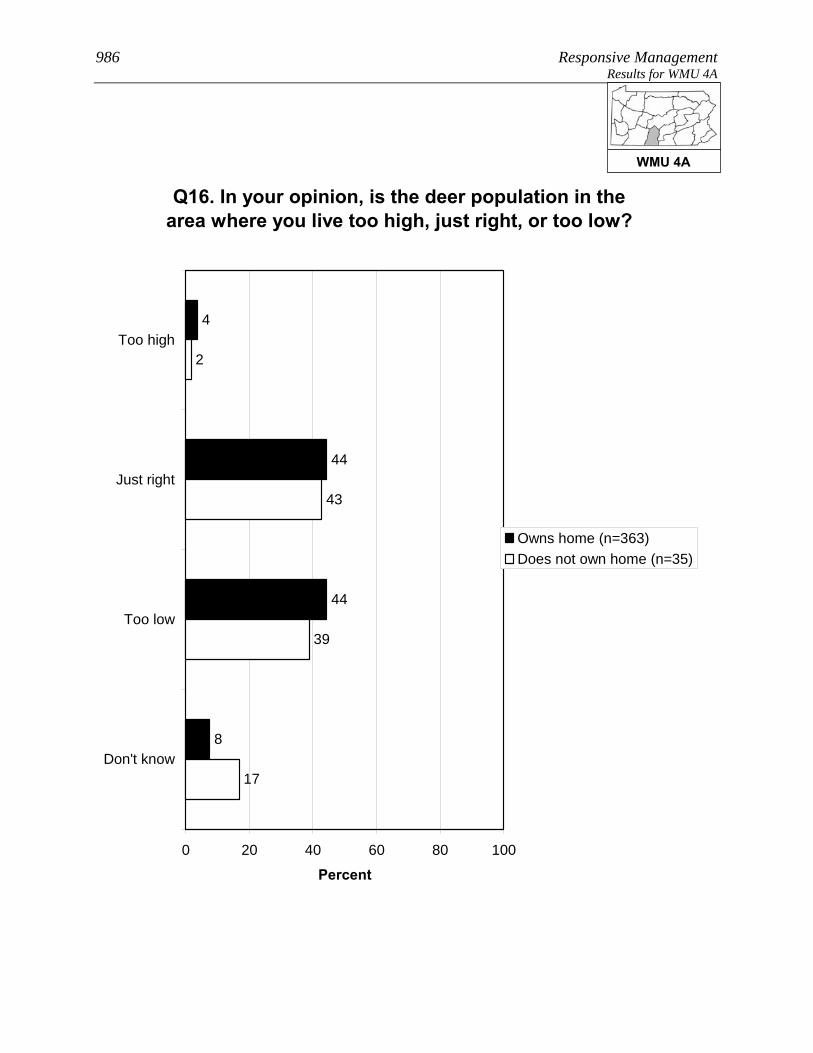
986 Responsive Management Results for WMU 4A
Q16. In your opinion, is the deer population in the area where you live too high, just right, or too low?
4
44
44
8
39
43
2
17
0 20 40 60 80 100
Too high
Just right
Too low
Don't know
Percent
Owns home (n=363)Does not own home (n=35)
WMU 4A
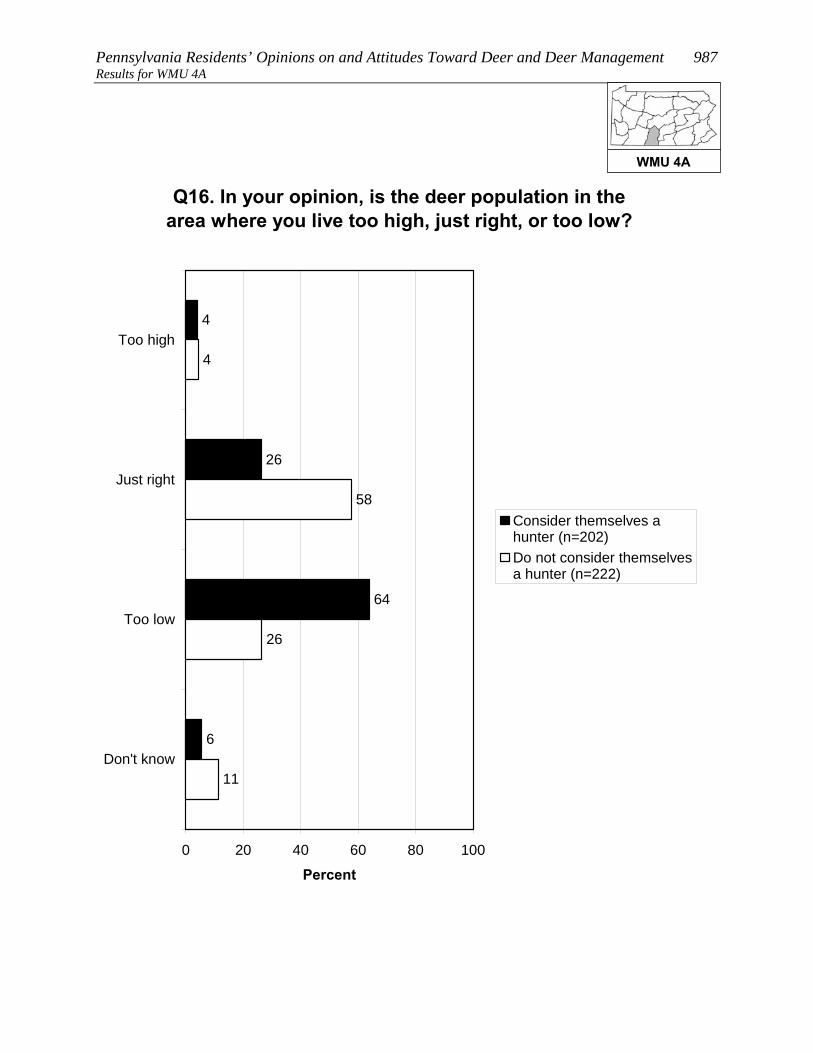
Pennsylvania Residents’ Opinions on and Attitudes Toward Deer and Deer Management 987 Results for WMU 4A
Q16. In your opinion, is the deer population in the area where you live too high, just right, or too low?
4
26
64
6
26
58
4
11
0 20 40 60 80 100
Too high
Just right
Too low
Don't know
Percent
Consider themselves ahunter (n=202)Do not consider themselvesa hunter (n=222)
WMU 4A
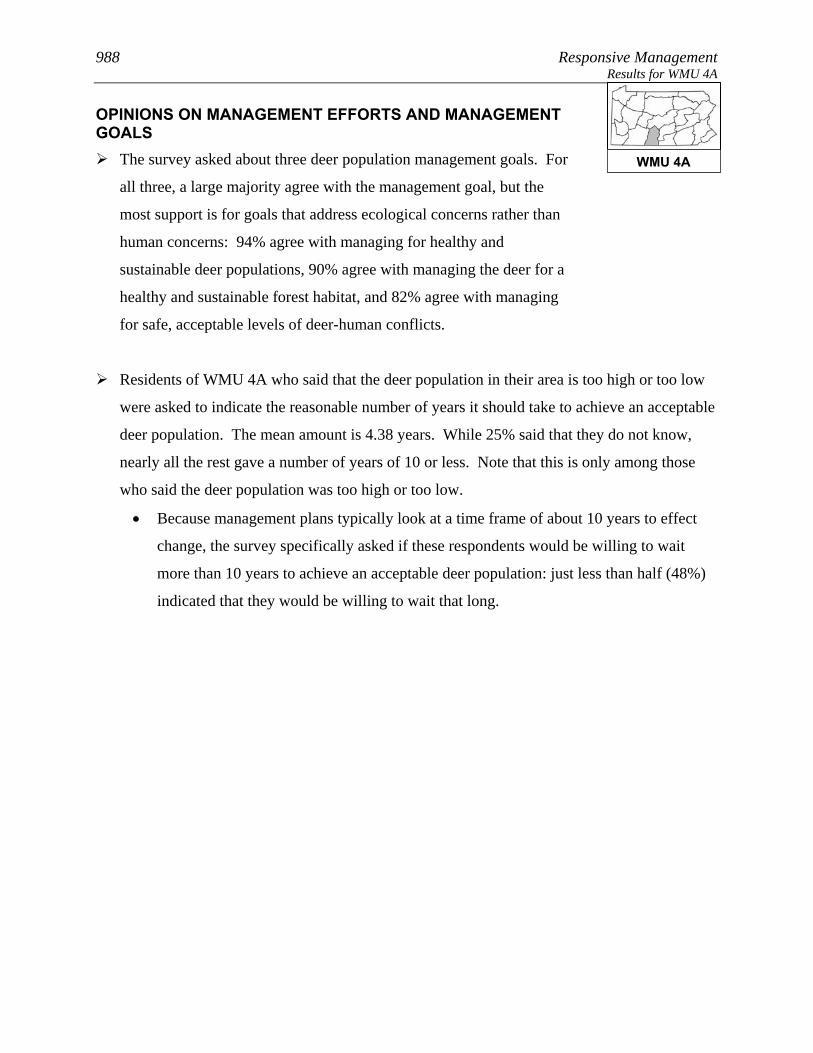
988 Responsive Management Results for WMU 4A
OPINIONS ON MANAGEMENT EFFORTS AND MANAGEMENT GOALS
The survey asked about three deer population management goals. For
all three, a large majority agree with the management goal, but the
most support is for goals that address ecological concerns rather than
human concerns: 94% agree with managing for healthy and
sustainable deer populations, 90% agree with managing the deer for a
healthy and sustainable forest habitat, and 82% agree with managing
for safe, acceptable levels of deer-human conflicts.
Residents of WMU 4A who said that the deer population in their area is too high or too low
were asked to indicate the reasonable number of years it should take to achieve an acceptable
deer population. The mean amount is 4.38 years. While 25% said that they do not know,
nearly all the rest gave a number of years of 10 or less. Note that this is only among those
who said the deer population was too high or too low.
• Because management plans typically look at a time frame of about 10 years to effect
change, the survey specifically asked if these respondents would be willing to wait
more than 10 years to achieve an acceptable deer population: just less than half (48%)
indicated that they would be willing to wait that long.
WMU 4A

Pennsylvania Residents’ Opinions on and Attitudes Toward Deer and Deer Management 989 Results for WMU 4A
Q24-26. Deer populations should be managed for the following. (Do you agree or disagree with this
deer management goal?)
57
33
1
4
4
1
2
31
63
1
1
1
9
43
39
5
4
1
0 20 40 60 80 100
Stronglyagree
Moderatelyagree
Neither agreenor disagree
Moderatelydisagree
Stronglydisagree
Don't know
Percent (n=424)
Healthy and sustainableforest habitatHealthy and sustainabledeer populationsSafe and acceptable levelsof deer-human conflicts
WMU 4A

990 Responsive Management Results for WMU 4A
25
0
2
1
6
26
9
17
14
0 20 40 60 80 100
More than 10years
6-10 years
5 years
4 years
3 years
2 years
1 year
Less than a year
Don't know
Percent (n=216)
Q18. You said the deer population in the area where you live is [too high / too low]. In years, what is a reasonable amount of time to achieve an acceptable deer population in the area
where you live? (Asked of those who think the deer population in the area where they live is
too high or too low.)
Mean = 4.38Median = 4
WMU 4A

Pennsylvania Residents’ Opinions on and Attitudes Toward Deer and Deer Management 991 Results for WMU 4A
Q21. Would you be willing to wait more than 10 years to achieve an acceptable deer population in the area where you live? (Among those who think the deer population in the area where they live is
too high or too low.)
48
50
2
0 20 40 60 80 100
Yes
No
Don't know
Percent (n=216)
WMU 4A
992 Responsive Management Results for WMU 4A
OPINIONS ON METHODS FOR MANAGING DEER, INCLUDING HUNTING
A large majority of residents of WMU 4A (67%) support lethal
methods to manage deer populations in Pennsylvania; nonetheless,
25% oppose, mostly strong opposition.
• Those residents of WMU 4A who live in a single-family home and own their home are
slightly less likely to strongly support lethal methods, compared to those who live in a
single-family home but do not own their home.
• The survey asked about four methods of controlling deer populations (three of them
lethal). The most support is for legal, regulated hunting (96% of respondents support
this method), distantly followed by fertility/birth control (23%), trapping and killing
(23%), and professionals or sharpshooters (21%).
Two questions asked respondents about hunting on their land (among those who live in a
single-family home), the first question about hunting by the respondents themselves (16% do
so) and the second regarding allowing others to hunt on their land (22% do so). In
combining the results, 23% of residents of WMU 4A who live in a single-family home either
hunt on their own land or allow others to do so (it is not simply a sum of the two questions
because some hunt on their property and allow others to do so as well).
• There was interest in seeing how a particular subgroup responded on this question, the
subgroup being those who live in a single-family home; who live on 1 acre or less; and
who live in an urban, suburban area, or a small city/town. Among this subgroup, 5%
either hunt on their own property or allow others to hunt on the property.
• Those respondents who do not allow hunting on their property were asked to indicate
why they prohibit it. The most common reasons are that they live in an urban or
suburban area in which hunting is not possible or feasible and/or that their property is
too small. Other minor reasons are concerns about safety and/or a general opposition
to hunting.
• Those same respondents who do not allow hunting on their property were asked about
their likelihood of ever allowing others to hunt deer on their property; they
overwhelmingly say this is very unlikely (96%). They were then asked if there is
WMU 4A

Pennsylvania Residents’ Opinions on and Attitudes Toward Deer and Deer Management 993 Results for WMU 4A
anything that would make them more likely to allow deer hunting;
they are almost unanimous (99%) in saying that there is nothing
that would make them more likely to allow deer hunting.
• The question about allowing others to hunt on their property was examined among the
subgroup previously discussed (those who live in a single-family home; who live on 1
acre or less; and who live in an urban, suburban area, or a small city/town). Among
this group who got the question, nearly all say that they would never allow hunting.
o Additional follow-up questions to be asked of those who indicated that something
might prompt them to allow hunting on their property did not have enough
respondents for statistical validity; therefore, they are not shown.
WMU 4A

994 Responsive Management Results for WMU 4A
Q27. In general, do you support or oppose lethal methods to manage deer populations in
Pennsylvania?
35
32
7
8
17
1
0 20 40 60 80 100
Strongly support
Moderatelysupport
Neither supportnor oppose
Moderately oppose
Strongly oppose
Don't know
Percent (n=424)
WMU 4A
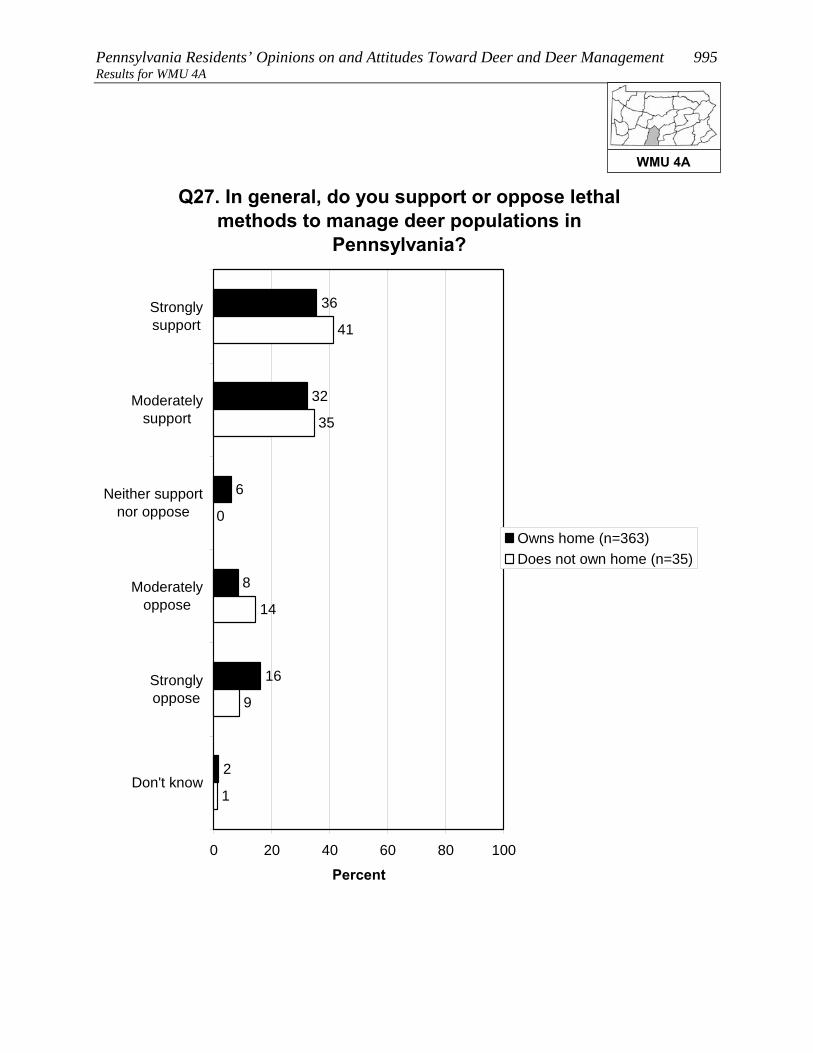
Pennsylvania Residents’ Opinions on and Attitudes Toward Deer and Deer Management 995 Results for WMU 4A
Q27. In general, do you support or oppose lethal methods to manage deer populations in
Pennsylvania?
36
32
6
8
16
2
0
35
41
14
9
1
0 20 40 60 80 100
Stronglysupport
Moderatelysupport
Neither supportnor oppose
Moderatelyoppose
Stronglyoppose
Don't know
Percent
Owns home (n=363)Does not own home (n=35)
WMU 4A

996 Responsive Management Results for WMU 4A
Q30-Q33. Percent who strongly support each of the following methods of controlling deer populations
in Pennsylvania:
8
10
12
81
0 20 40 60 80 100
Q30. Legal,regulated hunting
Q33. Fertility or birthcontrol
Q32. Trapping andkilling
Q31. Professionalsor sharpshooters
Percent
WMU 4A
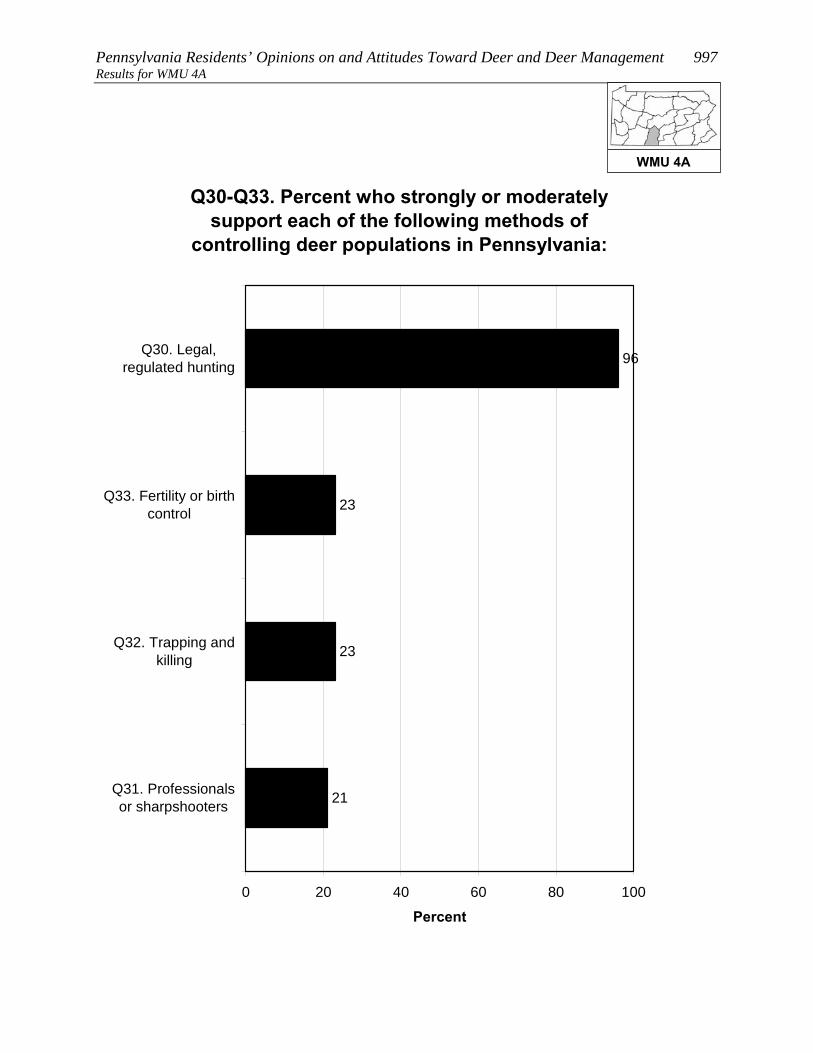
Pennsylvania Residents’ Opinions on and Attitudes Toward Deer and Deer Management 997 Results for WMU 4A
Q30-Q33. Percent who strongly or moderately support each of the following methods of
controlling deer populations in Pennsylvania:
21
23
23
96
0 20 40 60 80 100
Q30. Legal,regulated hunting
Q33. Fertility or birthcontrol
Q32. Trapping andkilling
Q31. Professionalsor sharpshooters
Percent
WMU 4A

998 Responsive Management Results for WMU 4A
Q30-Q33. Percent who strongly or moderately oppose each of the following methods of
controlling deer populations in Pennsylvania:
3
68
71
72
0 20 40 60 80 100
Q32. Trapping andkilling
Q31. Professionalsor sharpshooters
Q33. Fertility or birthcontrol
Q30. Legal,regulated hunting
Percent
WMU 4A

Pennsylvania Residents’ Opinions on and Attitudes Toward Deer and Deer Management 999 Results for WMU 4A
Q30-Q33. Percent who strongly oppose each of the following methods of controlling deer populations
in Pennsylvania:
2
48
52
60
0 20 40 60 80 100
Q32. Trapping andkilling
Q31. Professionalsor sharpshooters
Q33. Fertility or birthcontrol
Q30. Legal,regulated hunting
Percent
WMU 4A
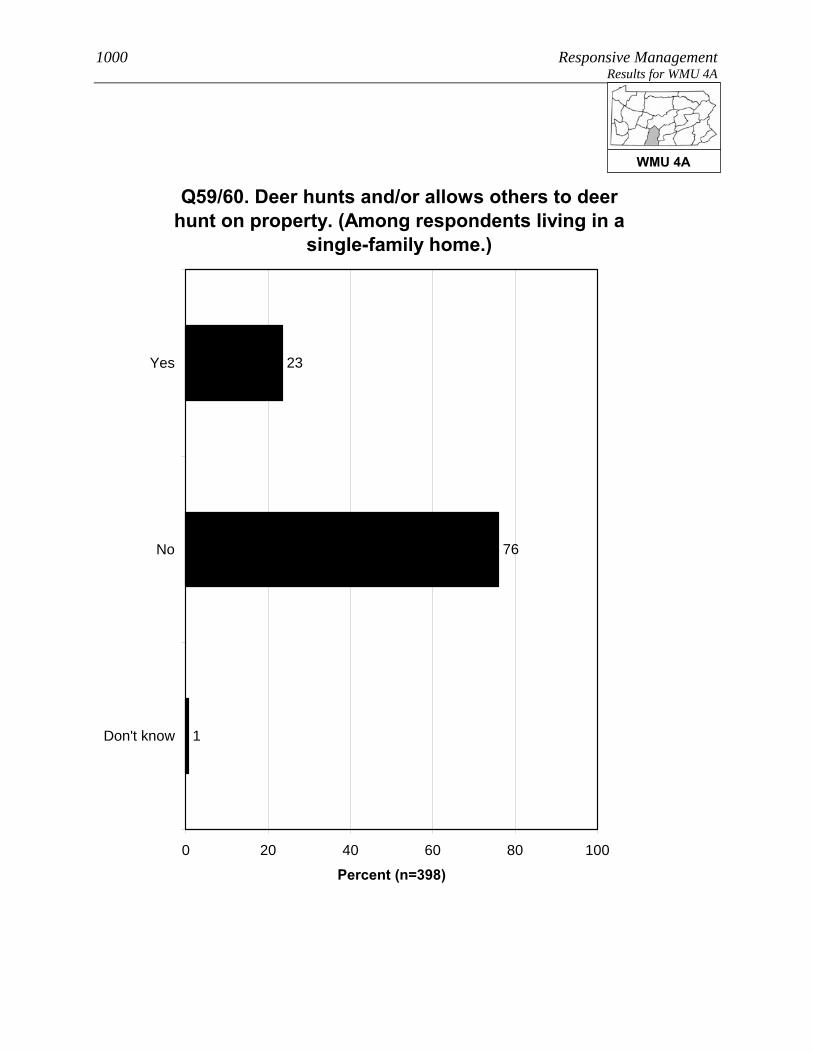
1000 Responsive Management Results for WMU 4A
Q59/60. Deer hunts and/or allows others to deer hunt on property. (Among respondents living in a
single-family home.)
23
76
1
0 20 40 60 80 100
Yes
No
Don't know
Percent (n=398)
WMU 4A
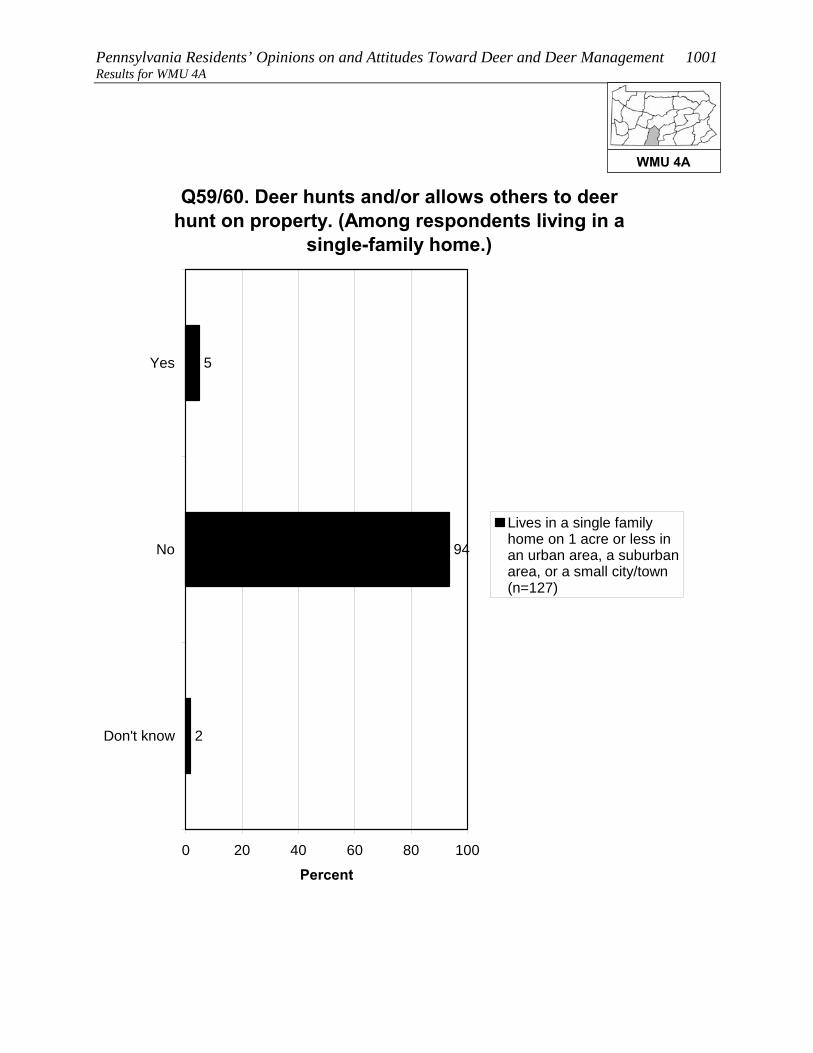
Pennsylvania Residents’ Opinions on and Attitudes Toward Deer and Deer Management 1001 Results for WMU 4A
Q59/60. Deer hunts and/or allows others to deer hunt on property. (Among respondents living in a
single-family home.)
5
94
2
0 20 40 60 80 100
Yes
No
Don't know
Percent
Lives in a single familyhome on 1 acre or less inan urban area, a suburbanarea, or a small city/town(n=127)
WMU 4A

1002 Responsive Management Results for WMU 4A
Q63. What are the main reasons you do not allow others to hunt deer on your property? (Asked of
those whose primary place of residence is a single-family home and who do not allow others to hunt
deer on their property.)
1
1
58
51
6
3
1
1
0 20 40 60 80 100
Live in residential neighborhood / suburbanor urban area
Property is too small / neighbors too close
Concerned about safety
Oppose hunting in general
Live on rented property
Want to save hunting opportunities for self/ family
Liability
Not enough deer on property / not enoughhabitat
Mul
tiple
Res
pons
es A
llow
ed
Percent (n=297)
WMU 4A
Pennsylvania Residents’ Opinions on and Attitudes Toward Deer and Deer Management 1003 Results for WMU 4A
Q65. How likely are you to ever allow others to deer hunt on your property? (Asked of those whose
primary place of residence is a single-family home and who do not allow others to hunt deer on their
property.)
1
2
1
96
0 20 40 60 80 100
Very likely
Somewhat likely
Somewhat unlikely
Very unlikely
Percent (n=297)
WMU 4A
1004 Responsive Management Results for WMU 4A
Q66. Is there anything that would make you more likely to allow deer hunting on your property?
(Asked of those whose primary place of residence is a single-family home and who do not allow
others to hunt deer on their property.)
Less than 1%
99
1
0 20 40 60 80 100
Yes
No
Don't know
Percent (n=297)
WMU 4A

Pennsylvania Residents’ Opinions on and Attitudes Toward Deer and Deer Management 1005 Results for WMU 4A
Q65. How likely are you to ever allow others to deer hunt on your property? (Asked of those whose
primary place of residence is a single-family home and who do not allow others to hunt deer on their
property.)
1
1
1
98
0 20 40 60 80 100
Very likely
Somewhatlikely
Somewhatunlikely
Very unlikely
Percent
Lives in a single familyhome on 1 acre or less inan urban area, a suburbanarea, or a small city/town(n=119)
WMU 4A
1006 Responsive Management Results for WMU 4A
CONCERNS ABOUT DEER AND DEER NUISANCE PROBLEMS Seven questions asked about respondents’ level of concern about
issues associated with deer. For each issue, respondents rated their
level of concern about it using a 10-point scale, with 10 being the most
concerned.
• The most concern was for tick-borne diseases (mean rating of 7.6), followed by three
whose means are fairly close to one another: the health of the deer population (6.2), the
quality of deer habitat (5.8), and deer-vehicle accidents (5.6).
• At the bottom are concern about deer impacts on habitat and other wildlife (even
though this can be considerable) (3.3) and the two impacts to residents’ landscaping:
deer damage to plants and landscaping (1.6) and deer droppings in the yard (1.1).
o Another graph shows the percentage who gave a high rating (a “9” or “10”),
providing an idea of the percentage who feel strongly about the issues.
Among residents of WMU 4A, 62% indicated that they saw deer on their property in the past
12 months.
• Respondents who fed birds were more likely to indicate that they frequently saw deer.
Those respondents who fed deer or put out attractants or were aware of neighbors who
fed deer or put out attractants were more likely than their counterparts to have
frequently seen deer or to have ever seen deer.
The survey asked about specific nuisance problems with deer that residents of WMU 4A may
have experienced: 6% indicated that they experienced problems with deer at their primary
place of residence in the past 12 months; 16% indicated that they or another household
member had been in a vehicle collision with a deer (fortunately, a very low portion of
drivers/passengers were injured); and 6% indicated that they or a household member had
been diagnosed with a tick-borne disease.
• Crosstabulations show that those who fed birds were about the same as those who had
not fed birds regarding experiencing deer problems. However, those who were aware
of neighbors feeding deer or putting out attractants were much more likely to say that
they experienced deer problems.
WMU 4A
Pennsylvania Residents’ Opinions on and Attitudes Toward Deer and Deer Management 1007 Results for WMU 4A
Q36-Q42. Mean rating of respondents' concern about each of the following on a 10-point scale:
1.6
3.3
5.6
5.8
6.2
7.6
1.1
0 2 4 6 8 10
Q36. Tick-borne diseases, such as Lymedisease, in Pennsylvania
Q42. The health of the deer population,such as adequate food resources for the
size of the deer herd, in Pennsylvania
Q41. The quality of deer habitat inPennsylvania
Q40. Deer-vehicle accidents inPennsylvania
Q39. Deer impacts on the habitat andother wildlife in Pennsylvania
Q38. Deer damage to plants andlandscaping in his/her yard
Q37. Deer droppings in his/her yard
Mean
WMU 4A

1008 Responsive Management Results for WMU 4A
Q36-Q42. Percent who rated their concern about each of the following as a 9 or 10 on a 10-point
scale:
4
5
19
21
25
46
3
0 20 40 60 80 100
Q36. Tick-borne diseases, such as Lymedisease, in Pennsylvania
Q42. The health of the deer population,such as adequate food resources for the
size of the deer herd, in Pennsylvania
Q40. Deer-vehicle accidents inPennsylvania
Q41. The quality of deer habitat inPennsylvania
Q38. Deer damage to plants andlandscaping in his/her yard
Q39. Deer impacts on the habitat andother wildlife in Pennsylvania
Q37. Deer droppings in his/her yard
Percent
WMU 4A
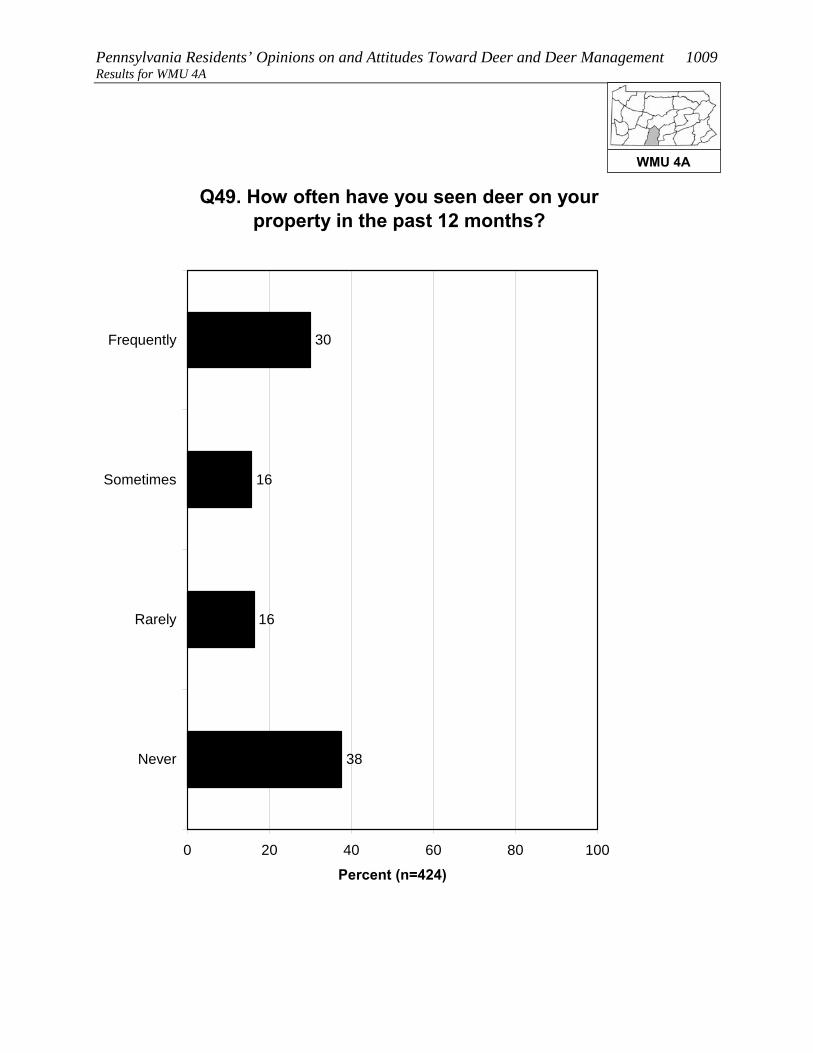
Pennsylvania Residents’ Opinions on and Attitudes Toward Deer and Deer Management 1009 Results for WMU 4A
Q49. How often have you seen deer on your property in the past 12 months?
30
16
16
38
0 20 40 60 80 100
Frequently
Sometimes
Rarely
Never
Percent (n=424)
WMU 4A

1010 Responsive Management Results for WMU 4A
Q49. How often have you seen deer on your property in the past 12 months?
34
15
11
39
1
22
16
26
37
0
0 20 40 60 80 100
Frequently
Sometimes
Rarely
Never
Don't know
Percent
Fed birds on his / herproperty in the past 12months (n=204)Did not feed birds on his /her property in the past 12months (n=220)
WMU 4A
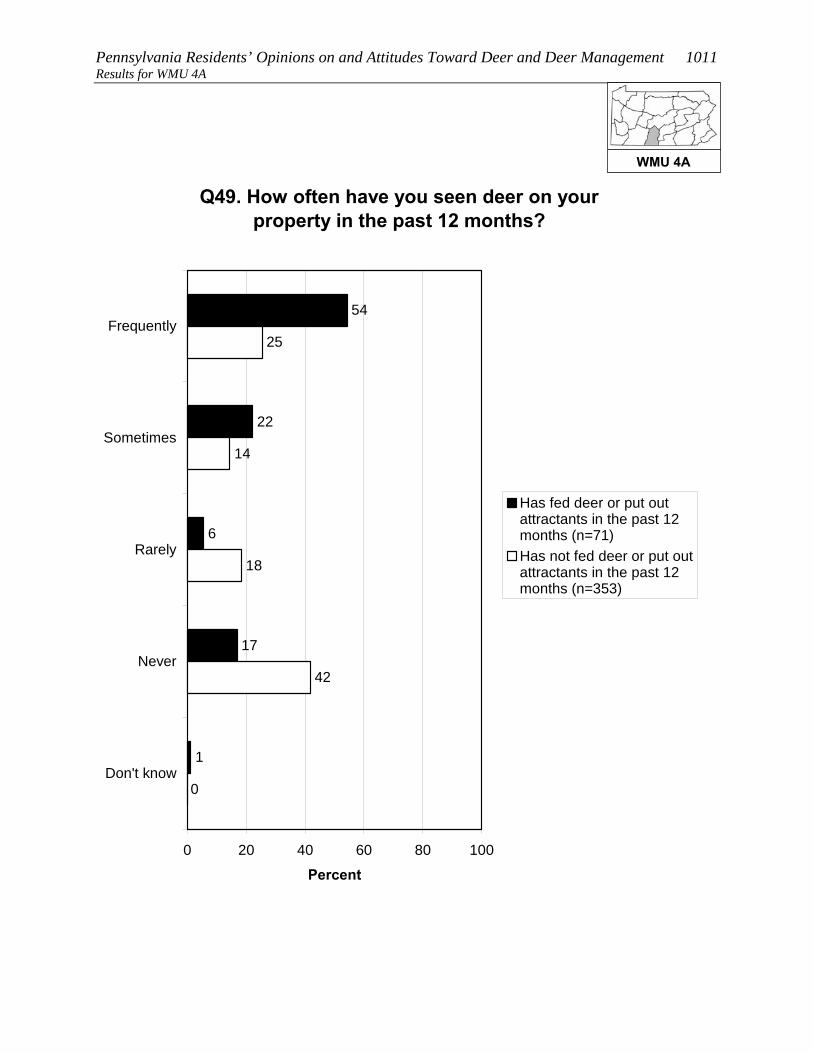
Pennsylvania Residents’ Opinions on and Attitudes Toward Deer and Deer Management 1011 Results for WMU 4A
Q49. How often have you seen deer on your property in the past 12 months?
54
22
6
17
1
18
14
25
42
0
0 20 40 60 80 100
Frequently
Sometimes
Rarely
Never
Don't know
Percent
Has fed deer or put outattractants in the past 12months (n=71)Has not fed deer or put outattractants in the past 12months (n=353)
WMU 4A

1012 Responsive Management Results for WMU 4A
Q49. How often have you seen deer on your property in the past 12 months?
56
19
11
13
1
17
14
26
42
0
0 20 40 60 80 100
Frequently
Sometimes
Rarely
Never
Don't know
Percent
Is aware of neighborsfeeding deer or putting outattractants (n=67)Is not aware of neighborsfeeding deer or putting outattractants (n=344)
WMU 4A

Pennsylvania Residents’ Opinions on and Attitudes Toward Deer and Deer Management 1013 Results for WMU 4A
Q43. In the past 12 months, have you experienced any problems with deer at your primary place of
residence?
6
94
0 20 40 60 80 100
Yes
No
Percent (n=424)
WMU 4A

1014 Responsive Management Results for WMU 4A
Q43. In the past 12 months, have you experienced any problems with deer at your primary place of
residence?
7
93
94
6
0 20 40 60 80 100
Yes
No
Percent
Fed birds on his / herproperty in the past 12months (n=204)Did not feed birds on his /her property in the past 12months (n=220)
WMU 4A

Pennsylvania Residents’ Opinions on and Attitudes Toward Deer and Deer Management 1015 Results for WMU 4A
Q43. In the past 12 months, have you experienced any problems with deer at your primary place of
residence?
15
85
95
5
0 20 40 60 80 100
Yes
No
Percent
Is aware of neighborsfeeding deer or putting outattractants (n=67)Is not aware of neighborsfeeding deer or putting outattractants (n=344)
WMU 4A
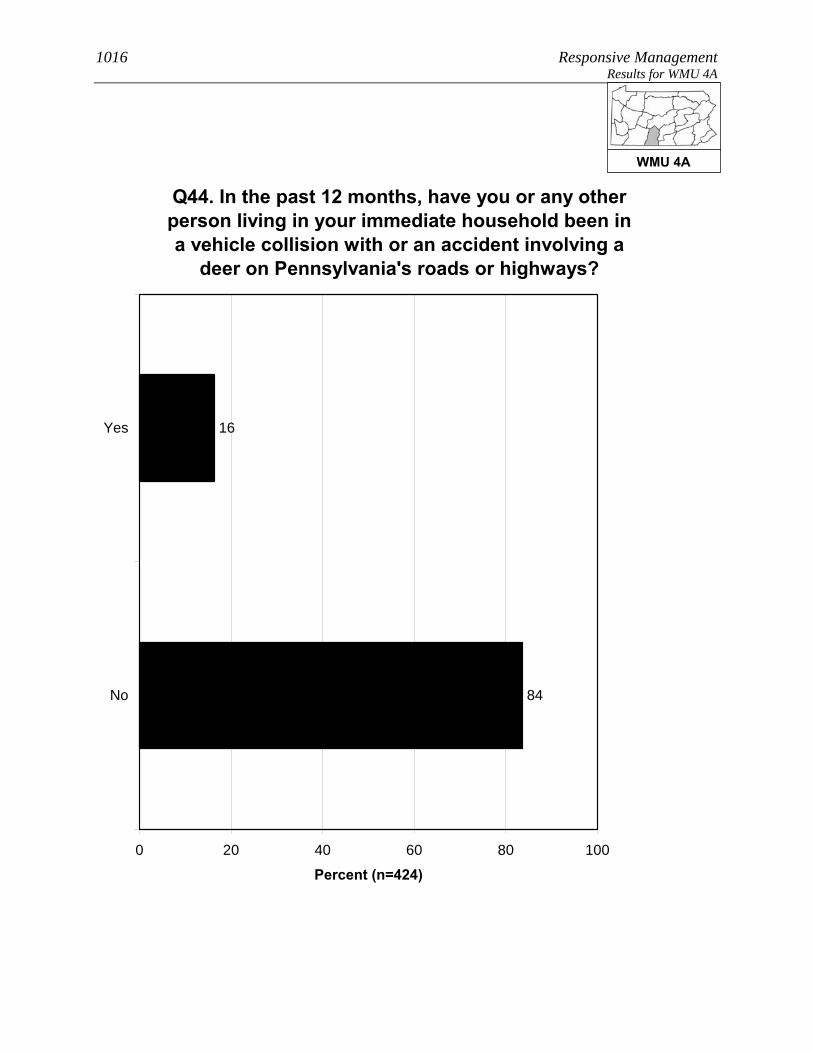
1016 Responsive Management Results for WMU 4A
Q44. In the past 12 months, have you or any other person living in your immediate household been in a vehicle collision with or an accident involving a
deer on Pennsylvania's roads or highways?
16
84
0 20 40 60 80 100
Yes
No
Percent (n=424)
WMU 4A

Pennsylvania Residents’ Opinions on and Attitudes Toward Deer and Deer Management 1017 Results for WMU 4A
Q45. Were you or anyone else injured? (Asked of those who had a household member who was in or
who have personally been in a vehicle collision with or an accident involving a deer on
Pennsylvania's roads or highways in the past 12 months.)
4
96
0 20 40 60 80 100
Yes
No
Percent (n=74)
WMU 4A

1018 Responsive Management Results for WMU 4A
Q46. In the past 12 months, have you or any other person living in your immediate household been
diagnosed by a physician with a tick-borne disease, such as Lyme disease?
6
94
0 20 40 60 80 100
Yes
No
Percent (n=424)
WMU 4A

Pennsylvania Residents’ Opinions on and Attitudes Toward Deer and Deer Management 1019 Results for WMU 4A FEEDING WILDLIFE AND HUNTING DEER
Several questions asked about feeding wildlife.
• Feeding deer or putting out deer attractants: 16% of residents of
WMU 4A did this, and 13% are aware of neighbors who did this.
o The most typical feeds or attractants put out by respondents were corn, salt/mineral
blocks, and apples.
• Feeding birds: 50% of residents of WMU 4A did this.
There is no consensus on whether it is okay for private citizens to feed or attract deer in
Pennsylvania: 61% agree that this is okay, but 30% disagree (the rest are neutral).
Well more than a third of residents of WMU 4A (41%) consider themselves to be a hunter,
most of whom have a Pennsylvania hunting license.
• Among residents of WMU 4A who live in a single-family home, 16% personally hunt
deer on their property.
• A large majority of residents of WMU 4A (88%) say that they, family members, and/or
friends hunt.
WMU 4A

1020 Responsive Management Results for WMU 4A
Q50. Did you ever feed deer intentionally or put out attractants, such as a salt or mineral block, in the
past 12 months?
16
84
0 20 40 60 80 100
Yes
No
Percent (n=424)
WMU 4A
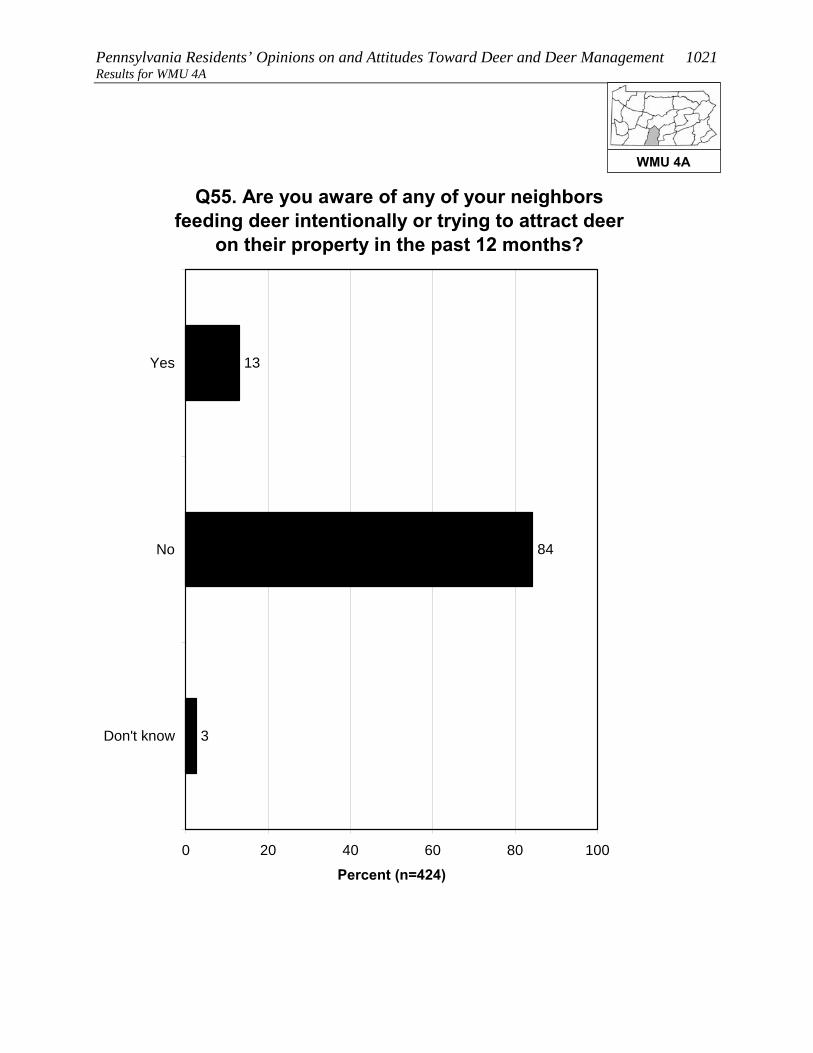
Pennsylvania Residents’ Opinions on and Attitudes Toward Deer and Deer Management 1021 Results for WMU 4A
Q55. Are you aware of any of your neighbors feeding deer intentionally or trying to attract deer
on their property in the past 12 months?
13
84
3
0 20 40 60 80 100
Yes
No
Don't know
Percent (n=424)
WMU 4A

1022 Responsive Management Results for WMU 4A
Q53. What type of feed or attractant did you use? (Asked of those who fed deer intentionally or put
out attractants in the past 12 months.)
1
2
54
41
21
6
5
1
0 20 40 60 80 100
Corn
Salt / mineralblock
Apples
Pellets /commercial
feed
Other foodproducts
Food plot
Other
Don't know
Mul
tiple
Res
pons
es A
llow
ed
Percent (n=71)
WMU 4A
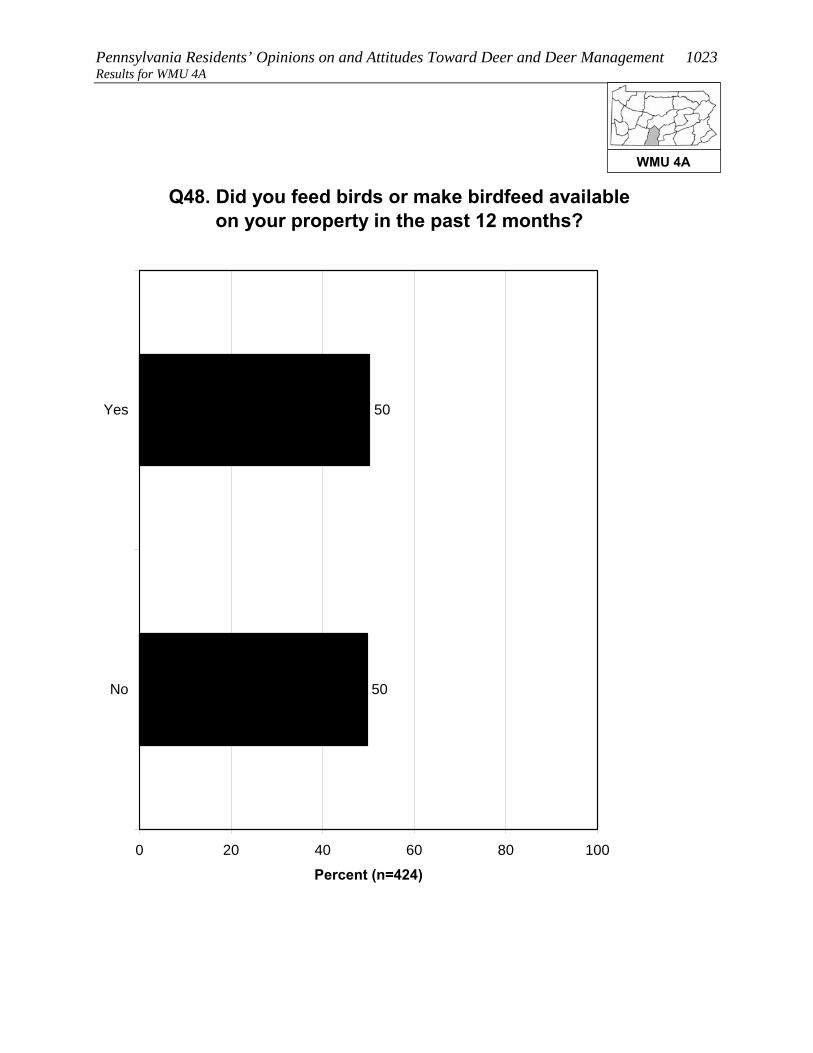
Pennsylvania Residents’ Opinions on and Attitudes Toward Deer and Deer Management 1023 Results for WMU 4A
Q48. Did you feed birds or make birdfeed available on your property in the past 12 months?
50
50
0 20 40 60 80 100
Yes
No
Percent (n=424)
WMU 4A

1024 Responsive Management Results for WMU 4A
Q56. Do you agree or disagree that it is OK for private citizens to feed or attract deer in
Pennsylvania?
35
26
8
11
19
1
0 20 40 60 80 100
Strongly agree
Moderately agree
Neither agree nordisagree
Moderatelydisagree
Strongly disagree
Don't know
Percent (n=424)
WMU 4A

Pennsylvania Residents’ Opinions on and Attitudes Toward Deer and Deer Management 1025 Results for WMU 4A
Q59. Do you personally hunt deer on your property? (Asked of those whose primary place of
residence is a single-family home.)
16
84
0 20 40 60 80 100
Yes
No
Percent (n=398)
WMU 4A

1026 Responsive Management Results for WMU 4A
Q79. Do you, any of your family members, or any friends hunt any wildlife species?
88
12
0 20 40 60 80 100
Yes
No
Percent (n=424)
WMU 4A
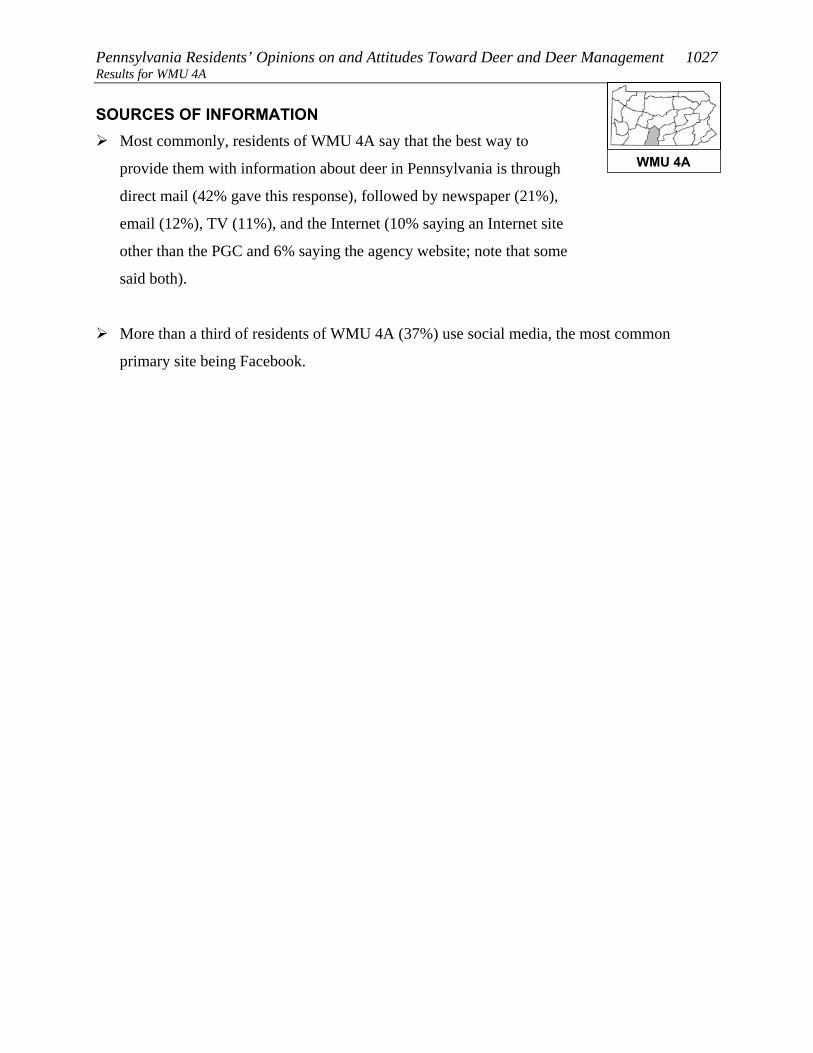
Pennsylvania Residents’ Opinions on and Attitudes Toward Deer and Deer Management 1027 Results for WMU 4A SOURCES OF INFORMATION
Most commonly, residents of WMU 4A say that the best way to
provide them with information about deer in Pennsylvania is through
direct mail (42% gave this response), followed by newspaper (21%),
email (12%), TV (11%), and the Internet (10% saying an Internet site
other than the PGC and 6% saying the agency website; note that some
said both).
More than a third of residents of WMU 4A (37%) use social media, the most common
primary site being Facebook.
WMU 4A
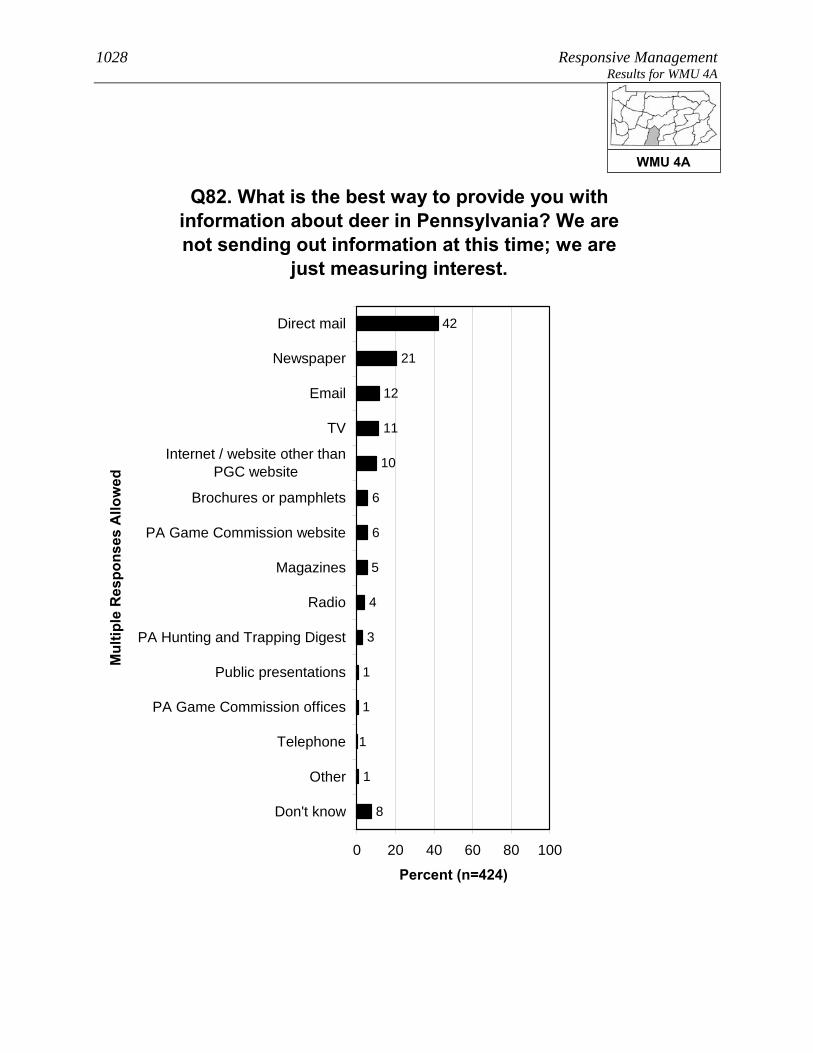
1028 Responsive Management Results for WMU 4A
Q82. What is the best way to provide you with information about deer in Pennsylvania? We are not sending out information at this time; we are
just measuring interest.
4
5
6
42
21
12
11
10
6
3
1
1
1
1
8
0 20 40 60 80 100
Direct mail
Newspaper
TV
Internet / website other thanPGC website
Brochures or pamphlets
PA Game Commission website
Magazines
Radio
PA Hunting and Trapping Digest
Public presentations
PA Game Commission offices
Telephone
Other
Don't know
Mul
tiple
Res
pons
es A
llow
ed
Percent (n=424)
WMU 4A
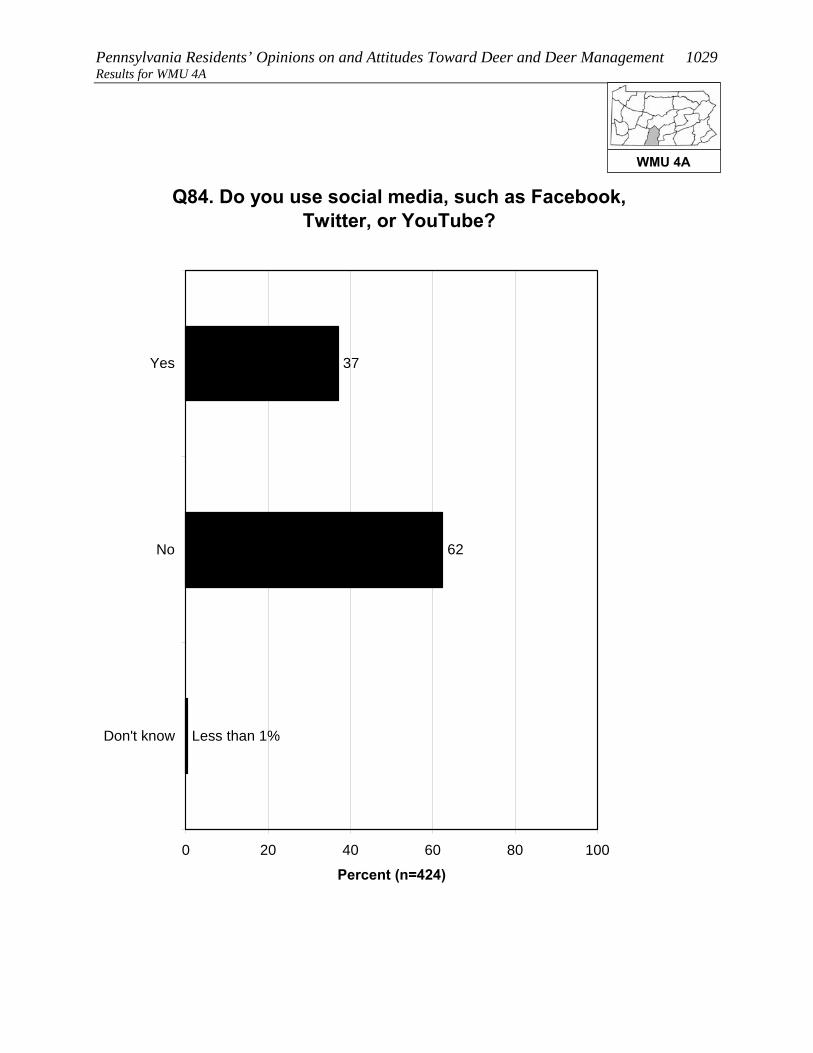
Pennsylvania Residents’ Opinions on and Attitudes Toward Deer and Deer Management 1029 Results for WMU 4A
Q84. Do you use social media, such as Facebook, Twitter, or YouTube?
37
62
Less than 1%
0 20 40 60 80 100
Yes
No
Don't know
Percent (n=424)
WMU 4A
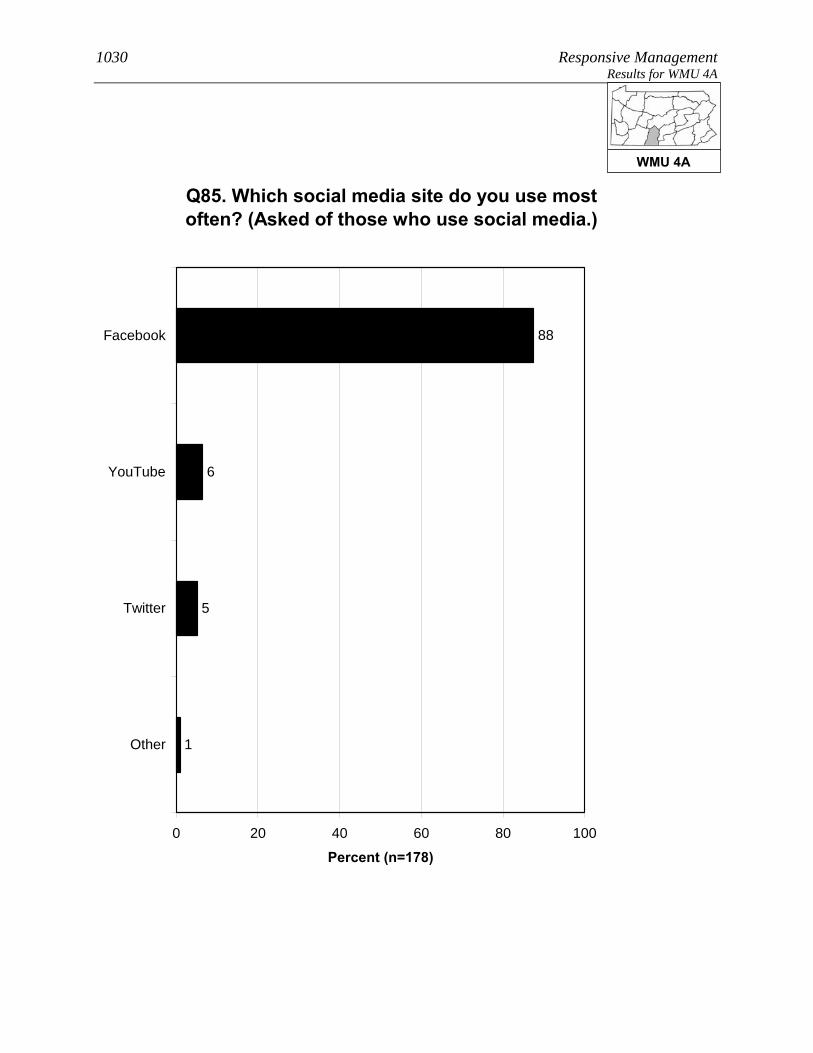
1030 Responsive Management Results for WMU 4A
Q85. Which social media site do you use most often? (Asked of those who use social media.)
88
6
5
1
0 20 40 60 80 100
YouTube
Other
Percent (n=178)
WMU 4A
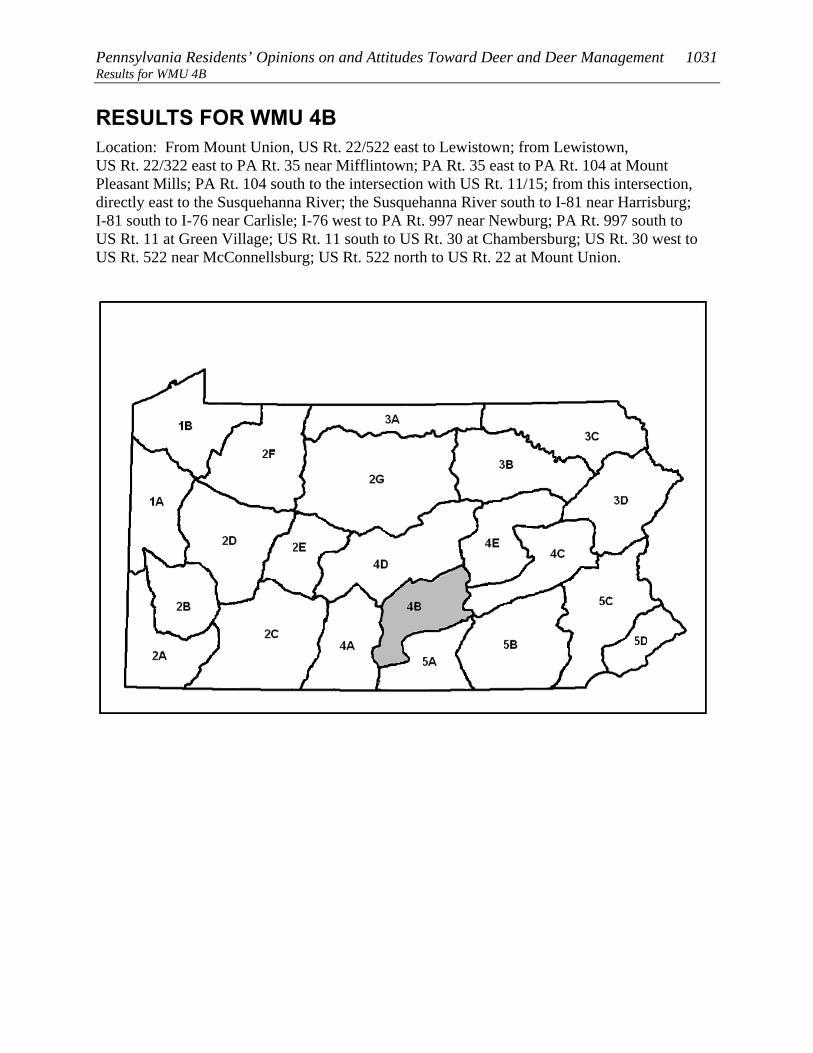
Pennsylvania Residents’ Opinions on and Attitudes Toward Deer and Deer Management 1031 Results for WMU 4B
RESULTS FOR WMU 4B Location: From Mount Union, US Rt. 22/522 east to Lewistown; from Lewistown, US Rt. 22/322 east to PA Rt. 35 near Mifflintown; PA Rt. 35 east to PA Rt. 104 at Mount Pleasant Mills; PA Rt. 104 south to the intersection with US Rt. 11/15; from this intersection, directly east to the Susquehanna River; the Susquehanna River south to I-81 near Harrisburg; I-81 south to I-76 near Carlisle; I-76 west to PA Rt. 997 near Newburg; PA Rt. 997 south to US Rt. 11 at Green Village; US Rt. 11 south to US Rt. 30 at Chambersburg; US Rt. 30 west to US Rt. 522 near McConnellsburg; US Rt. 522 north to US Rt. 22 at Mount Union.

1032 Responsive Management Results for WMU 4B
8. Lives in WMU 4B 3. Has a valid 2011 PA general hunting license (p < 0.001). 3. Has taken a trip more than a mile from home for the primary purpose of viewing or watching deer in the past 12 months (p < 0.001). 3. Fed birds or make birdfeed available on his/her property in the past 12 months (p < 0.001). 3. Fed deer intentionally or put out attractants in the past 12 months (p < 0.001). 3. Considers himself/herself to be a hunter (p < 0.001). 3. Indicates that he/she or a family member hunts (p < 0.01). 4. Does not consider the deer population in his/her area to be too high (p < 0.001). 4. Does not strongly or moderately support professionals or sharpshooters as a method of controlling deer populations in PA (p < 0.05). 4. Does not strongly or moderately support fertility or birth control as a method of controlling deer populations in PA (p < 0.05). 4. Does not strongly or moderately agree that deer populations should be managed for safe and acceptable levels of deer-human conflicts (p < 0.05). 4. Strongly or moderately supports legal, regulated hunting as a method of controlling deer populations in PA (p < 0.05). 5. Does not rate concern about deer-vehicle accidents in PA as a 9 or 10 (p < 0.001). 5. Does not indicate having experienced any problems with deer at his/her primary place of residence in the past 12 months (p < 0.001). 5. Does not indicate that he/she or another person living in the immediate household has been in a vehicle collision with or an accident involving a deer on PA's roads or highways in the past 12 months (p < 0.001). 5. Strongly or moderately agrees that it is OK for private citizens to feed or attract deer in PA (p < 0.01). 5. Does not rate concern about deer damage to plants and landscaping in their yard as a 9 or 10 (p < 0.05). 8. Has the median number or fewer people living in his/her household (p < 0.001). 8. Does not consider place of residence to be an urban or suburban area (p < 0.01). 8. Primary place of residence is a single-family home (p < 0.01). See page 9 through 11 for explanation of how to interpret z-score tables.
WMU 4B
Pennsylvania Residents’ Opinions on and Attitudes Toward Deer and Deer Management 1033 Results for WMU 4B PARTICIPATION IN VIEWING DEER
About two-thirds of residents of WMU 4B (66%) spent time viewing
deer around their home in the past 12 months, and 39% took a trip of
at least a mile to view deer.
• About two-fifths of those who took a deer-viewing trip (39%) used a spotlight to view
the deer at night.
A majority of residents of WMU 4B (71%) are satisfied with opportunities to view deer in
Pennsylvania. Because a relatively large percentage answer neutrally, only 14% indicate
being dissatisfied.
WMU 4B
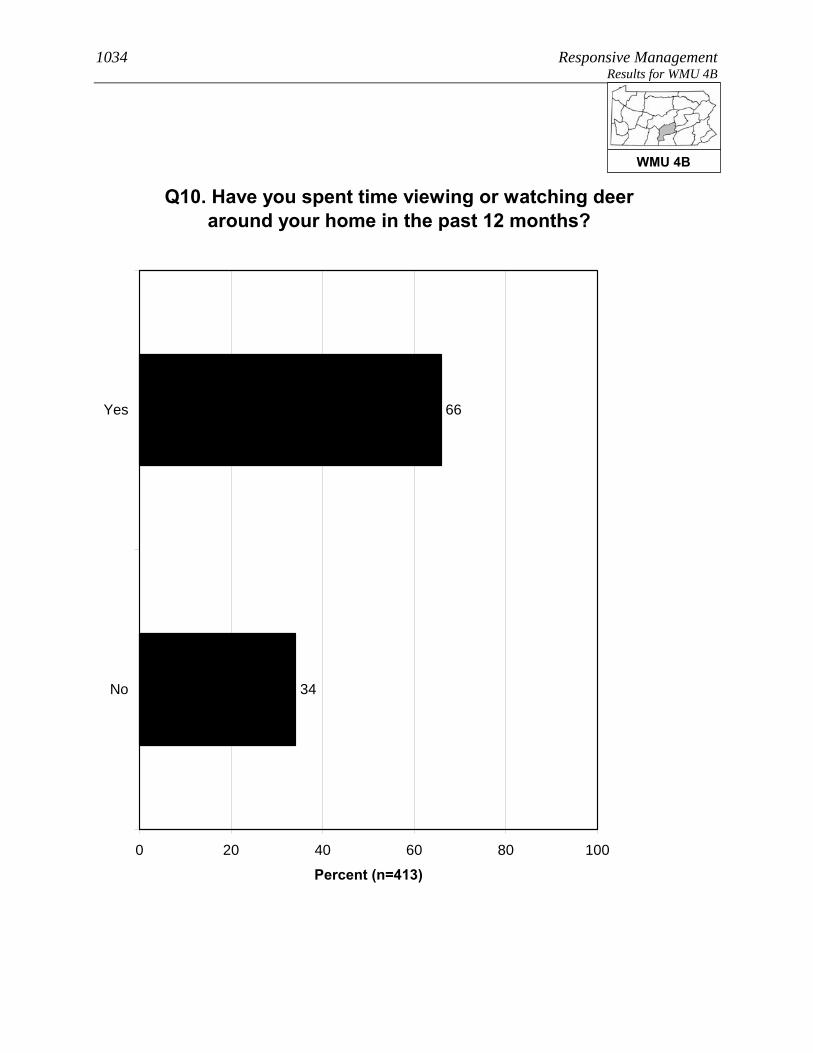
1034 Responsive Management Results for WMU 4B
Q10. Have you spent time viewing or watching deer around your home in the past 12 months?
66
34
0 20 40 60 80 100
Yes
No
Percent (n=413)
WMU 4B

Pennsylvania Residents’ Opinions on and Attitudes Toward Deer and Deer Management 1035 Results for WMU 4B
Q11. Have you taken a trip at least 1 mile from your home for the primary purpose of viewing or
watching deer in the past 12 months?
39
60
Less than 1%
0 20 40 60 80 100
Yes
No
Don't know
Percent (n=413)
WMU 4B
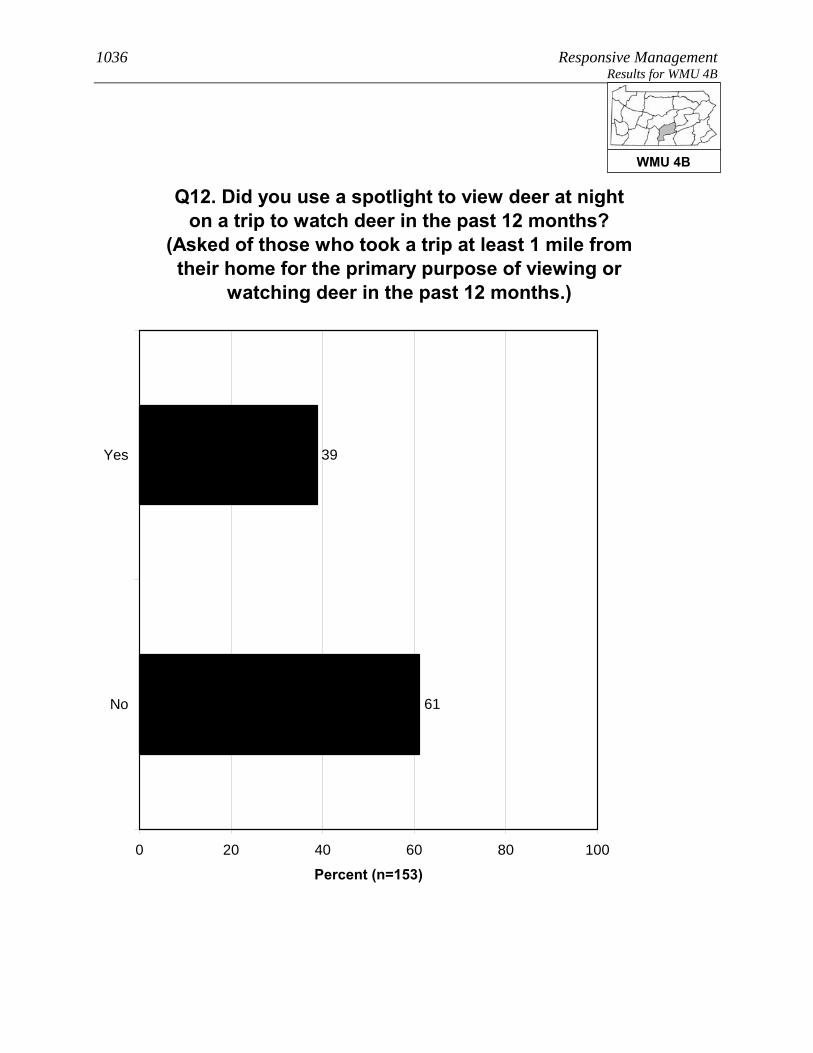
1036 Responsive Management Results for WMU 4B
Q12. Did you use a spotlight to view deer at night on a trip to watch deer in the past 12 months?
(Asked of those who took a trip at least 1 mile from their home for the primary purpose of viewing or
watching deer in the past 12 months.)
39
61
0 20 40 60 80 100
Yes
No
Percent (n=153)
WMU 4B
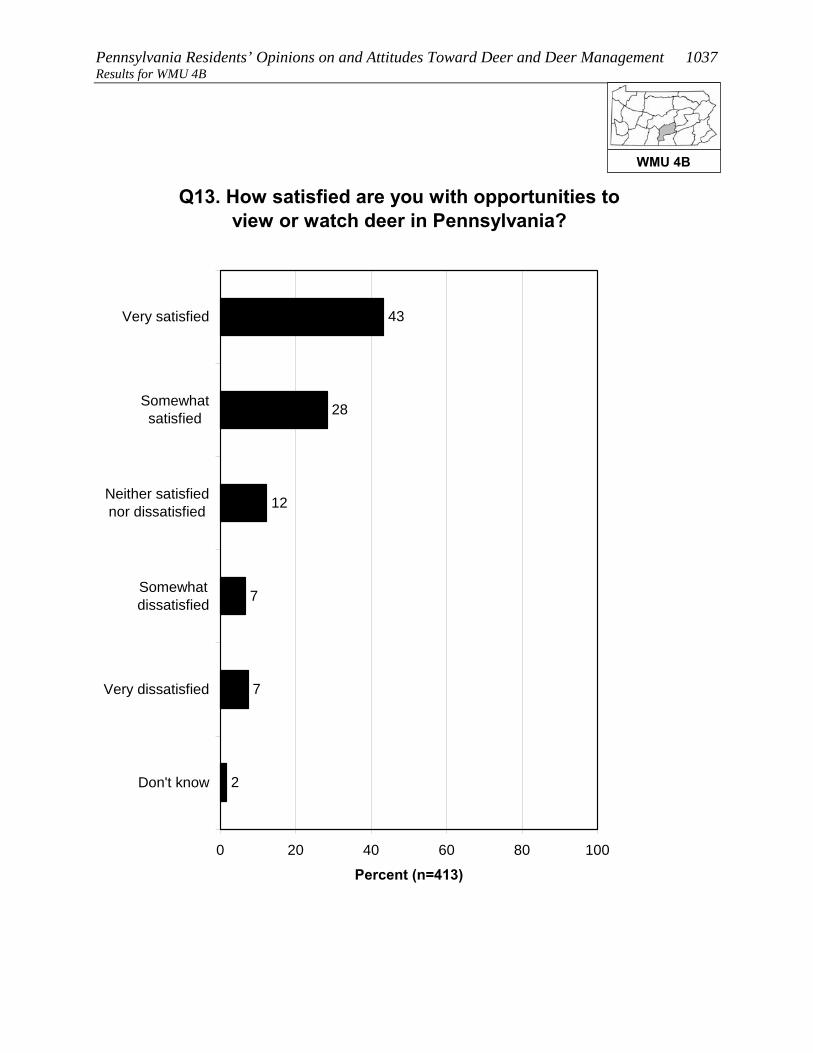
Pennsylvania Residents’ Opinions on and Attitudes Toward Deer and Deer Management 1037 Results for WMU 4B
Q13. How satisfied are you with opportunities to view or watch deer in Pennsylvania?
43
28
12
7
7
2
0 20 40 60 80 100
Very satisfied
Somewhatsatisfied
Neither satisfiednor dissatisfied
Somewhatdissatisfied
Very dissatisfied
Don't know
Percent (n=413)
WMU 4B

1038 Responsive Management Results for WMU 4B
OPINIONS ON DEER IN GENERAL AND THE SIZE AND HEALTH OF THE DEER HERD
Opinion on deer is mostly favorable: 70% of residents of WMU 4B
say with no caveats that they like having deer around, another 16%
like having deer around but worry about the problems they may cause,
and only 2% generally regard them as a nuisance. The remainder have
no particular feeling about deer.
Another question asked residents of WMU 4B how deer-related issues compared to other
issues in their life, on a scale of 0 to 10, with the most importance being 10: the median
rating is “5.” The most common ratings are the midpoint of “5” (21%) and “0” (18%). In
general, ratings are well spread across the scale.
Two other ratings questions asked respondents to rate their concern about deer-related issues.
The median level of concern is “6” for the quality of deer habitat in Pennsylvania and “7” for
the health of the deer population in Pennsylvania.
The survey asked about the perceived size of the deer herd in the respondent’s area. The
majority of residents of WMU 4B say that the herd size is just right (53%); otherwise, more
say that it is too low (33%) than too high (6%).
• Those who own their home are more likely, compared to those who do not own their
home, to say that the deer population in their area is just right; they are less likely to
say that the deer population is either too high or too low.
• Those who consider themselves to be a hunter are more likely to say that the deer
population in their area is too low, compared to those who are not hunters.
WMU 4B
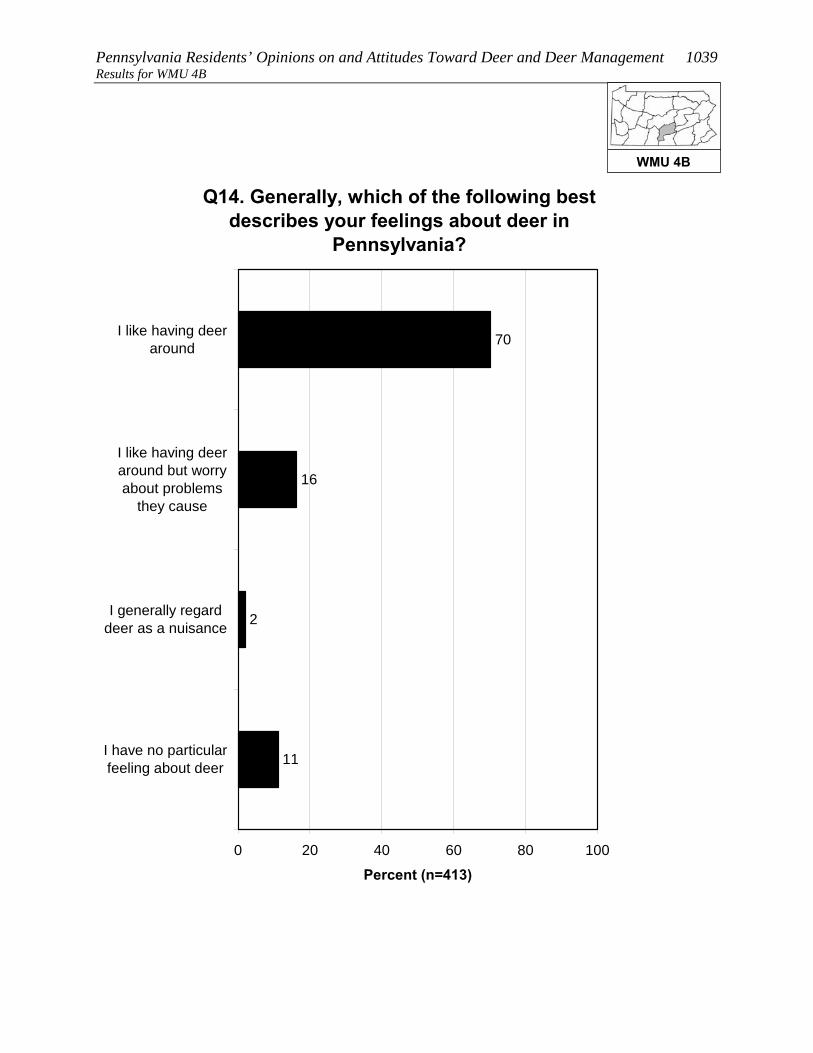
Pennsylvania Residents’ Opinions on and Attitudes Toward Deer and Deer Management 1039 Results for WMU 4B
Q14. Generally, which of the following best describes your feelings about deer in
Pennsylvania?
70
16
2
11
0 20 40 60 80 100
I like having deeraround
I like having deeraround but worryabout problems
they cause
I generally regarddeer as a nuisance
I have no particularfeeling about deer
Percent (n=413)
WMU 4B

1040 Responsive Management Results for WMU 4B
Q15. Compared to other issues in your life, how important to you, personally, are deer-related
issues on a scale of 0 to 10 where 0 is not at all important and 10 is extremely important?
7
8
6
10
3
11
6
4
21
5
18
2
0 20 40 60 80 100
10
9
8
7
6
5
4
3
2
1
0
Don't know
Percent (n=413)
Mean = 4.61Median = 5
WMU 4B
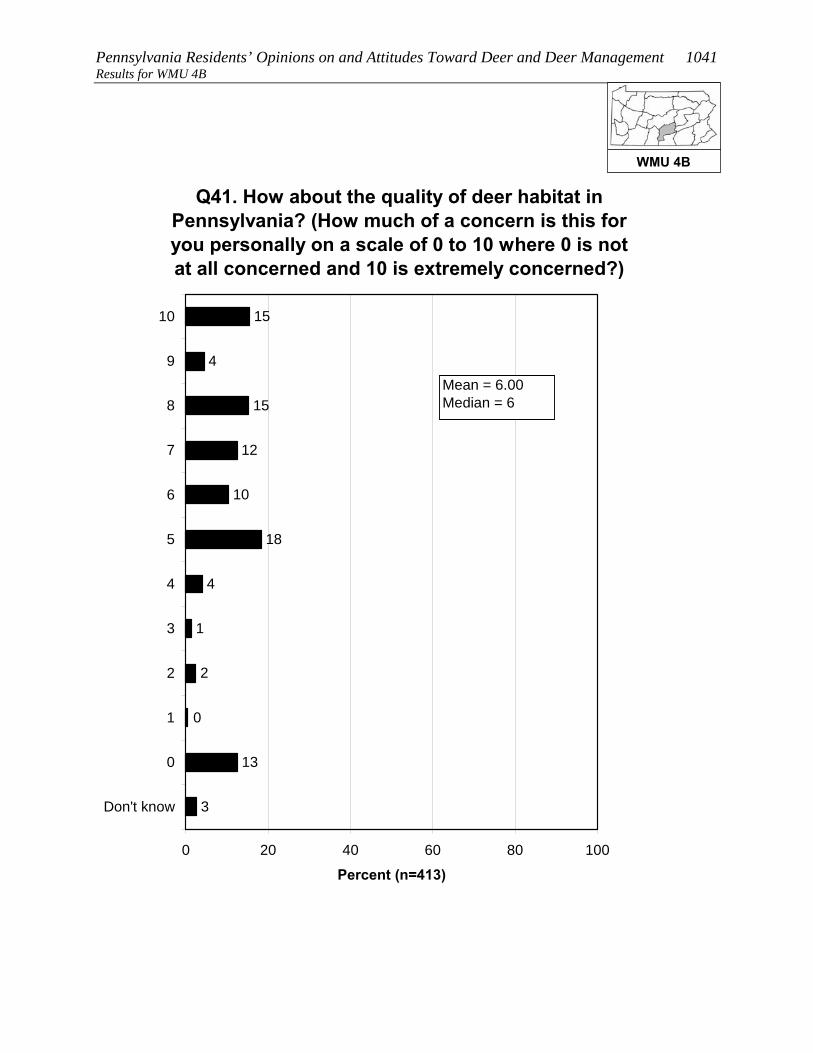
Pennsylvania Residents’ Opinions on and Attitudes Toward Deer and Deer Management 1041 Results for WMU 4B
Q41. How about the quality of deer habitat in Pennsylvania? (How much of a concern is this for you personally on a scale of 0 to 10 where 0 is not at all concerned and 10 is extremely concerned?)
2
1
4
15
4
15
12
10
18
0
13
3
0 20 40 60 80 100
10
9
8
7
6
5
4
3
2
1
0
Don't know
Percent (n=413)
Mean = 6.00Median = 6
WMU 4B

1042 Responsive Management Results for WMU 4B
3
1
3
21
6
16
11
8
18
1
11
1
0 20 40 60 80 100
10
9
8
7
6
5
4
3
2
1
0
Don't know
Percent (n=413)
Q42. How about health of the deer population, such as adequate food resources for the size of the deer herd, in Pennsylvania? (How much of a concern is this for you
personally on a scale of 0 to 10 where 0 is not at all concerned and 10 is extremely concerned?)
Mean = 6.39Median = 7
WMU 4B
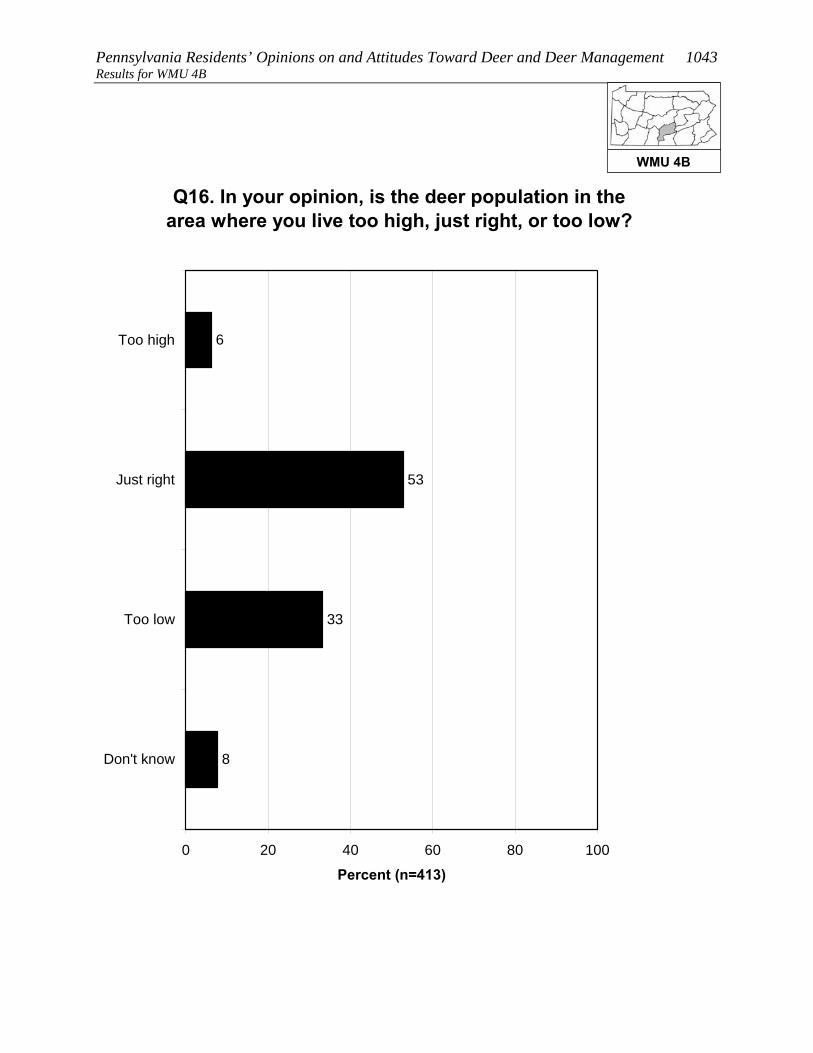
Pennsylvania Residents’ Opinions on and Attitudes Toward Deer and Deer Management 1043 Results for WMU 4B
Q16. In your opinion, is the deer population in the area where you live too high, just right, or too low?
6
53
33
8
0 20 40 60 80 100
Too high
Just right
Too low
Don't know
Percent (n=413)
WMU 4B

1044 Responsive Management Results for WMU 4B
Q16. In your opinion, is the deer population in the area where you live too high, just right, or too low?
5
54
36
5
42
36
16
5
0 20 40 60 80 100
Too high
Just right
Too low
Don't know
Percent
Owns home (n=330)Does not own home (n=24)
WMU 4B
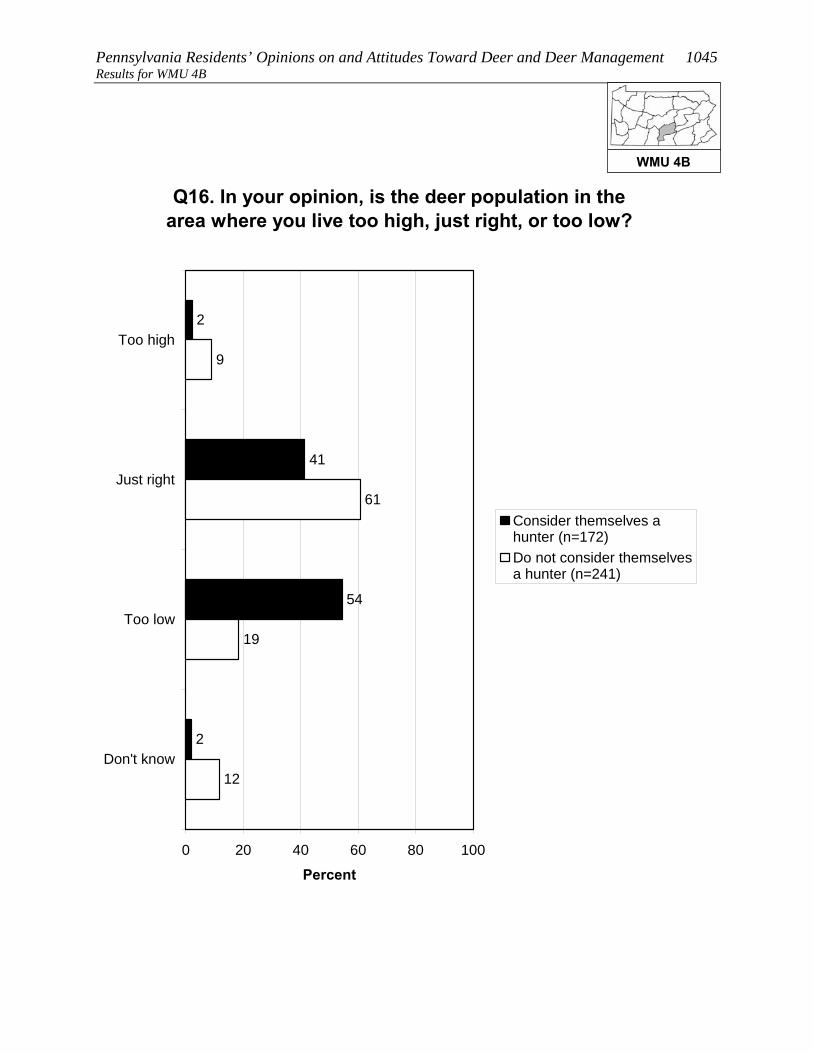
Pennsylvania Residents’ Opinions on and Attitudes Toward Deer and Deer Management 1045 Results for WMU 4B
Q16. In your opinion, is the deer population in the area where you live too high, just right, or too low?
2
41
54
2
19
61
9
12
0 20 40 60 80 100
Too high
Just right
Too low
Don't know
Percent
Consider themselves ahunter (n=172)Do not consider themselvesa hunter (n=241)
WMU 4B

1046 Responsive Management Results for WMU 4B
OPINIONS ON MANAGEMENT EFFORTS AND MANAGEMENT GOALS
The survey asked about three deer population management goals. For
all three, a large majority agree with the management goal, but the
most support is for goals that address ecological concerns rather than
human concerns: 93% agree with managing for healthy and
sustainable deer populations, 88% agree with managing the deer for a
healthy and sustainable forest habitat, and 78% agree with managing
for safe, acceptable levels of deer-human conflicts.
Residents of WMU 4B who said that the deer population in their area is too high or too low
were asked to indicate the reasonable number of years it should take to achieve an acceptable
deer population. The mean amount is 4.58 years. While 35% said that they do not know,
nearly all the rest gave a number of years of 10 or less. Note that this is only among those
who said the deer population was too high or too low.
• Because management plans typically look at a time frame of about 10 years to effect
change, the survey specifically asked if these respondents would be willing to wait
more than 10 years to achieve an acceptable deer population: just less than a majority
(49%) indicated that they would be willing to wait that long.
WMU 4B
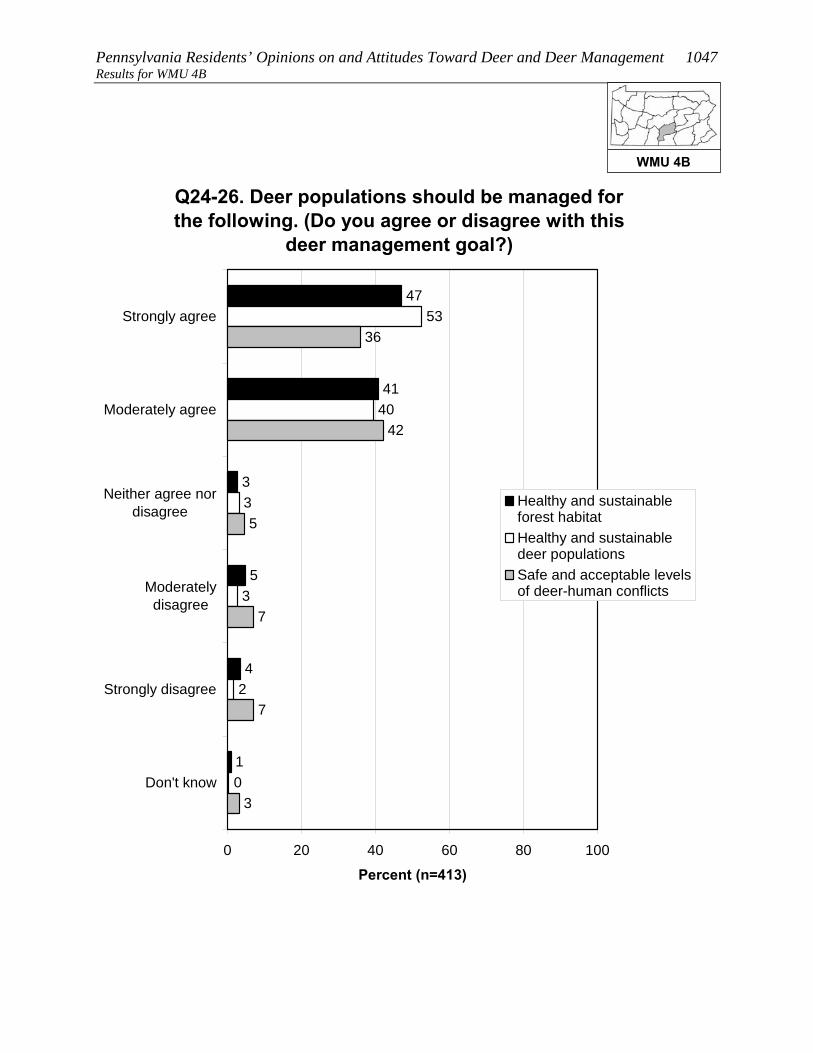
Pennsylvania Residents’ Opinions on and Attitudes Toward Deer and Deer Management 1047 Results for WMU 4B
Q24-26. Deer populations should be managed for the following. (Do you agree or disagree with this
deer management goal?)
47
41
3
5
4
1
3
40
53
3
2
0
7
36
42
5
7
3
0 20 40 60 80 100
Strongly agree
Moderately agree
Neither agree nordisagree
Moderatelydisagree
Strongly disagree
Don't know
Percent (n=413)
Healthy and sustainableforest habitatHealthy and sustainabledeer populationsSafe and acceptable levelsof deer-human conflicts
WMU 4B

1048 Responsive Management Results for WMU 4B
35
1
2
2
7
22
4
17
11
0 20 40 60 80 100
More than 10years
6-10 years
5 years
4 years
3 years
2 years
1 year
Less than a year
Don't know
Percent (n=172)
Q18. You said the deer population in the area where you live is [too high / too low]. In years, what is a
reasonable amount of time to achieve an acceptable deer population in the area where you live? (Asked of
those who think the deer population in the area where they live is too high or too low.)
Mean = 4.58Median = 4
WMU 4B
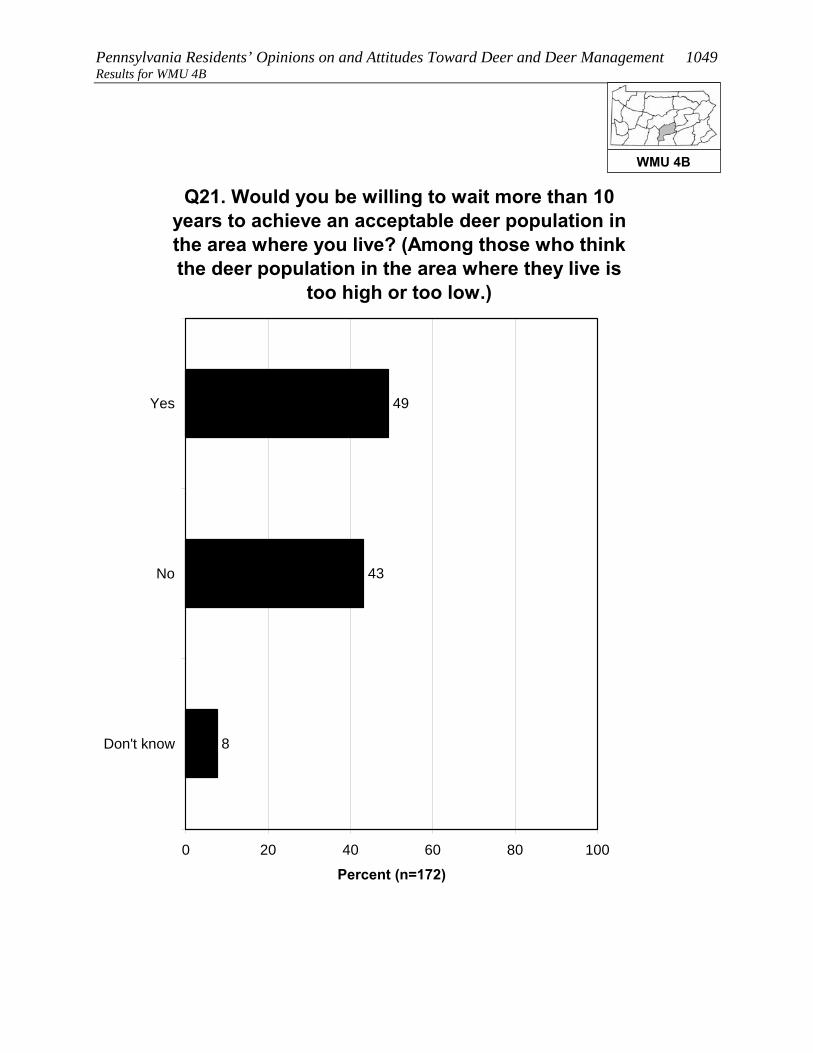
Pennsylvania Residents’ Opinions on and Attitudes Toward Deer and Deer Management 1049 Results for WMU 4B
Q21. Would you be willing to wait more than 10 years to achieve an acceptable deer population in the area where you live? (Among those who think the deer population in the area where they live is
too high or too low.)
49
43
8
0 20 40 60 80 100
Yes
No
Don't know
Percent (n=172)
WMU 4B

1050 Responsive Management Results for WMU 4B
OPINIONS ON METHODS FOR MANAGING DEER, INCLUDING HUNTING
A large majority of residents of WMU 4B (63%) support lethal
methods to manage deer populations in Pennsylvania; nonetheless,
28% oppose, mostly strong opposition.
• Those residents of WMU 4B who live in a single-family home and own their home are
much more likely to strongly support but less likely to moderately support lethal
methods, compared to those who live in a single-family home but do not own their
home. Overall, total support is 65% among homeowners and 61% among non-owners.
• The survey asked about four methods of controlling deer populations (three of them
lethal). The most support is for legal, regulated hunting (93% of respondents support
this method), distantly followed by fertility/birth control (31%), trapping and killing
(27%), and professionals or sharpshooters (26%).
Two questions asked respondents about hunting on their land (among those who live in a
single-family home), the first question about hunting by the respondents themselves (20% do
so) and the second regarding allowing others to hunt on their land (24% do so). In
combining the results, 30% of residents of WMU 4B who live in a single-family home either
hunt on their own land or allow others to do so (it is not simply a sum of the two questions
because some hunt on their property and allow others to do so as well).
• There was interest in seeing how a particular subgroup responded on this question, the
subgroup being those who live in a single-family home; who live on 1 acre or less; and
who live in an urban, suburban area, or a small city/town. Among this subgroup, 4%
either hunt on their own property or allow others to hunt on the property.
• Those respondents who do not allow hunting on their property were asked to indicate
why they prohibit it. The most common reasons are that their property is too small
and/or that they live in an urban or suburban area in which hunting is not possible or
feasible. Other minor reasons are concerns about safety, wanting to save the hunting
opportunities for self/family, a general opposition to hunting, and liability concerns.
• Those same respondents who do not allow hunting on their property were asked about
their likelihood of ever allowing others to hunt deer on their property; they say this is
WMU 4B

Pennsylvania Residents’ Opinions on and Attitudes Toward Deer and Deer Management 1051 Results for WMU 4B
very unlikely (93%). They were then asked if there is anything
that would make them more likely to allow deer hunting; they
are almost unanimous (98%) in saying that there is nothing
that would make them more likely to allow deer hunting.
• The question about allowing others to hunt on their property was examined among the
subgroup previously discussed (those who live in a single-family home; who live on 1
acre or less; and who live in an urban, suburban area, or a small city/town). Among
this group who got the question, all of them say that they would never allow hunting.
o Additional follow-up questions to be asked of those who indicated that something
might prompt them to allow hunting on their property did not have enough
respondents for statistical validity; therefore, they are not shown.
WMU 4B
1052 Responsive Management Results for WMU 4B
Q27. In general, do you support or oppose lethal methods to manage deer populations in
Pennsylvania?
32
31
7
10
18
2
0 20 40 60 80 100
Strongly support
Moderatelysupport
Neither supportnor oppose
Moderately oppose
Strongly oppose
Don't know
Percent (n=413)
WMU 4B
Pennsylvania Residents’ Opinions on and Attitudes Toward Deer and Deer Management 1053 Results for WMU 4B
Q27. In general, do you support or oppose lethal methods to manage deer populations in
Pennsylvania?
36
29
7
9
18
1
4
42
19
18
12
4
0 20 40 60 80 100
Stronglysupport
Moderatelysupport
Neither supportnor oppose
Moderatelyoppose
Stronglyoppose
Don't know
Percent
Owns home (n=330)Does not own home (n=24)
WMU 4B
1054 Responsive Management Results for WMU 4B
Q30-Q33. Percent who strongly support each of the following methods of controlling deer populations
in Pennsylvania:
9
10
13
72
0 20 40 60 80 100
Q30. Legal,regulated hunting
Q33. Fertility or birthcontrol
Q32. Trapping andkilling
Q31. Professionalsor sharpshooters
Percent
WMU 4B

Pennsylvania Residents’ Opinions on and Attitudes Toward Deer and Deer Management 1055 Results for WMU 4B
Q30-Q33. Percent who strongly or moderately support each of the following methods of
controlling deer populations in Pennsylvania:
26
27
31
93
0 20 40 60 80 100
Q30. Legal,regulated hunting
Q33. Fertility or birthcontrol
Q32. Trapping andkilling
Q31. Professionalsor sharpshooters
Percent
WMU 4B

1056 Responsive Management Results for WMU 4B
Q30-Q33. Percent who strongly or moderately oppose each of the following methods of
controlling deer populations in Pennsylvania:
5
57
69
69
0 20 40 60 80 100
Q32. Trapping andkilling
Q31. Professionalsor sharpshooters
Q33. Fertility or birthcontrol
Q30. Legal,regulated hunting
Percent
WMU 4B
Pennsylvania Residents’ Opinions on and Attitudes Toward Deer and Deer Management 1057 Results for WMU 4B
Q30-Q33. Percent who strongly oppose each of the following methods of controlling deer populations
in Pennsylvania:
3
45
53
56
0 20 40 60 80 100
Q32. Trapping andkilling
Q31. Professionalsor sharpshooters
Q33. Fertility or birthcontrol
Q30. Legal,regulated hunting
Percent
WMU 4B
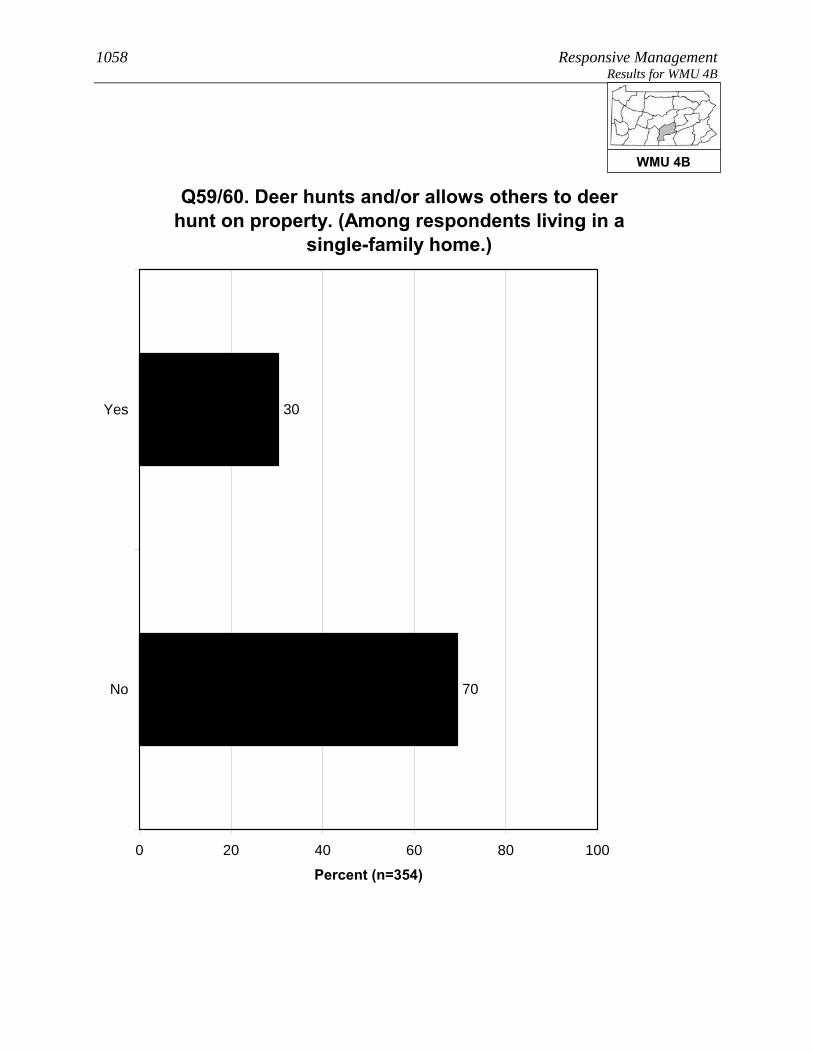
1058 Responsive Management Results for WMU 4B
Q59/60. Deer hunts and/or allows others to deer hunt on property. (Among respondents living in a
single-family home.)
30
70
0 20 40 60 80 100
Yes
No
Percent (n=354)
WMU 4B

Pennsylvania Residents’ Opinions on and Attitudes Toward Deer and Deer Management 1059 Results for WMU 4B
Q59/60. Deer hunts and/or allows others to deer hunt on property. (Among respondents living in a
single-family home.)
4
96
0 20 40 60 80 100
Yes
No
Percent
Lives in a single familyhome on 1 acre or less inan urban area, a suburbanarea, or a small city/town(n=96)
WMU 4B
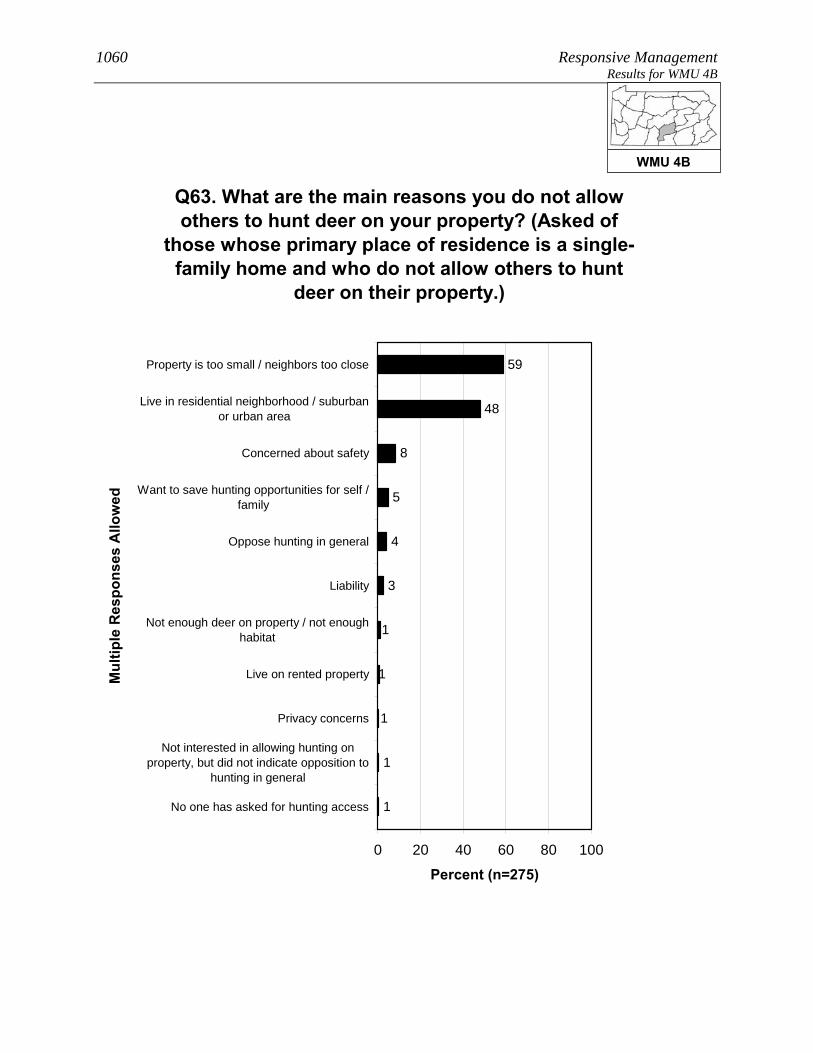
1060 Responsive Management Results for WMU 4B
Q63. What are the main reasons you do not allow others to hunt deer on your property? (Asked of
those whose primary place of residence is a single-family home and who do not allow others to hunt
deer on their property.)
1
1
1
59
48
8
5
4
3
1
1
0 20 40 60 80 100
Property is too small / neighbors too close
Live in residential neighborhood / suburbanor urban area
Concerned about safety
Want to save hunting opportunities for self /family
Oppose hunting in general
Liability
Not enough deer on property / not enoughhabitat
Live on rented property
Privacy concerns
Not interested in allowing hunting onproperty, but did not indicate opposition to
hunting in general
No one has asked for hunting access
Mul
tiple
Res
pons
es A
llow
ed
Percent (n=275)
WMU 4B

Pennsylvania Residents’ Opinions on and Attitudes Toward Deer and Deer Management 1061 Results for WMU 4B
Q65. How likely are you to ever allow others to deer hunt on your property? (Asked of those whose
primary place of residence is a single-family home and who do not allow others to hunt deer on their
property.)
1
2
3
93
0 20 40 60 80 100
Very likely
Somewhat likely
Somewhat unlikely
Very unlikely
Percent (n=275)
WMU 4B

1062 Responsive Management Results for WMU 4B
Q66. Is there anything that would make you more likely to allow deer hunting on your property?
(Asked of those whose primary place of residence is a single-family home and who do not allow
others to hunt deer on their property.)
2
98
0 20 40 60 80 100
Yes
No
Percent (n=275)
WMU 4B

Pennsylvania Residents’ Opinions on and Attitudes Toward Deer and Deer Management 1063 Results for WMU 4B
Q65. How likely are you to ever allow others to deer hunt on your property? (Asked of those whose
primary place of residence is a single-family home and who do not allow others to hunt deer on their
property.)
0
0
2
98
0 20 40 60 80 100
Very likely
Somewhatlikely
Somewhatunlikely
Very unlikely
Percent
Lives in a single familyhome on 1 acre or less inan urban area, a suburbanarea, or a small city/town(n=95)
WMU 4B

1064 Responsive Management Results for WMU 4B
CONCERNS ABOUT DEER AND DEER NUISANCE PROBLEMS Seven questions asked about respondents’ level of concern about
issues associated with deer. For each issue, respondents rated their
level of concern about it using a 10-point scale, with 10 being the most
concerned.
• The most concern was for tick-borne diseases (mean rating of 7.4), followed by three
whose means are fairly close to one another: the health of the deer population (6.4), the
quality of deer habitat (6.0), and deer-vehicle accidents (5.9).
• At the bottom are concern about deer impacts on habitat and other wildlife (even
though this can be considerable) (3.4) and the two impacts to residents’ landscaping:
deer damage to plants and landscaping (1.6) and deer droppings in the yard (1.1).
o Another graph shows the percentage who gave a high rating (a “9” or “10”),
providing an idea of the percentage who feel strongly about the issues.
Among residents of WMU 4B, 70% indicated that they saw deer on their property in the past
12 months.
• Respondents who fed birds were more likely to indicate seeing deer, as were
respondents who fed deer or put out attractants or were aware of neighbors who fed
deer or put out attractants, compared to their counterparts who did not do these
activities.
The survey asked about specific nuisance problems with deer that residents of WMU 4B may
have experienced: 5% indicated that they experienced problems with deer at their primary
place of residence in the past 12 months; 9% indicated that they or another household
member had been in a vehicle collision with a deer (fortunately, a very low portion of
drivers/passengers were injured); and 5% indicated that they or a household member had
been diagnosed with a tick-borne disease.
• Crosstabulations show that those who fed birds were about the same as those who had
not fed birds regarding experiencing deer problems. However, those who were aware
of neighbors feeding deer or putting out attractants were much more likely to say that
they experienced deer problems.
WMU 4B

Pennsylvania Residents’ Opinions on and Attitudes Toward Deer and Deer Management 1065 Results for WMU 4B
Q36-Q42. Mean rating of respondents' concern about each of the following on a 10-point scale:
1.6
3.4
5.9
6.0
6.4
7.4
1.1
0 2 4 6 8 10
Q36. Tick-borne diseases, such as Lymedisease, in Pennsylvania
Q42. The health of the deer population,such as adequate food resources for the
size of the deer herd, in Pennsylvania
Q41. The quality of deer habitat inPennsylvania
Q40. Deer-vehicle accidents inPennsylvania
Q39. Deer impacts on the habitat andother wildlife in Pennsylvania
Q38. Deer damage to plants andlandscaping in his/her yard
Q37. Deer droppings in his/her yard
Mean
WMU 4B
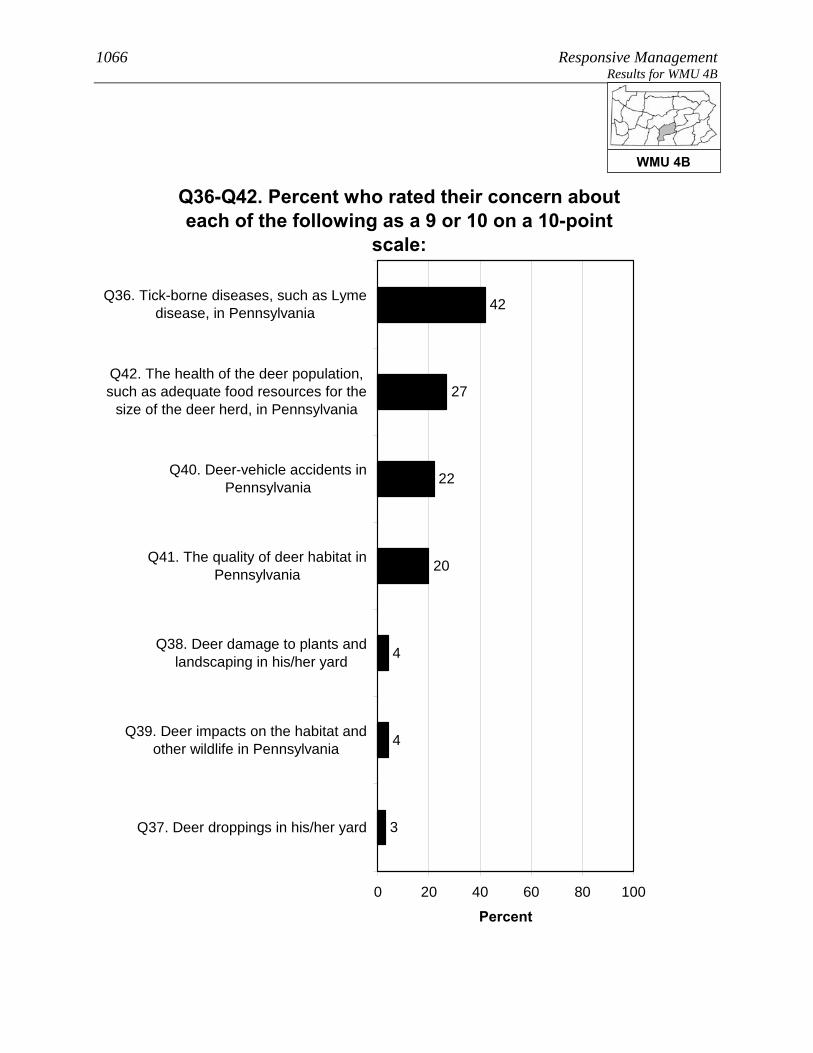
1066 Responsive Management Results for WMU 4B
Q36-Q42. Percent who rated their concern about each of the following as a 9 or 10 on a 10-point
scale:
4
4
20
22
27
42
3
0 20 40 60 80 100
Q36. Tick-borne diseases, such as Lymedisease, in Pennsylvania
Q42. The health of the deer population,such as adequate food resources for the
size of the deer herd, in Pennsylvania
Q40. Deer-vehicle accidents inPennsylvania
Q41. The quality of deer habitat inPennsylvania
Q38. Deer damage to plants andlandscaping in his/her yard
Q39. Deer impacts on the habitat andother wildlife in Pennsylvania
Q37. Deer droppings in his/her yard
Percent
WMU 4B

Pennsylvania Residents’ Opinions on and Attitudes Toward Deer and Deer Management 1067 Results for WMU 4B
Q49. How often have you seen deer on your property in the past 12 months?
28
22
20
30
0 20 40 60 80 100
Frequently
Sometimes
Rarely
Never
Percent (n=413)
WMU 4B
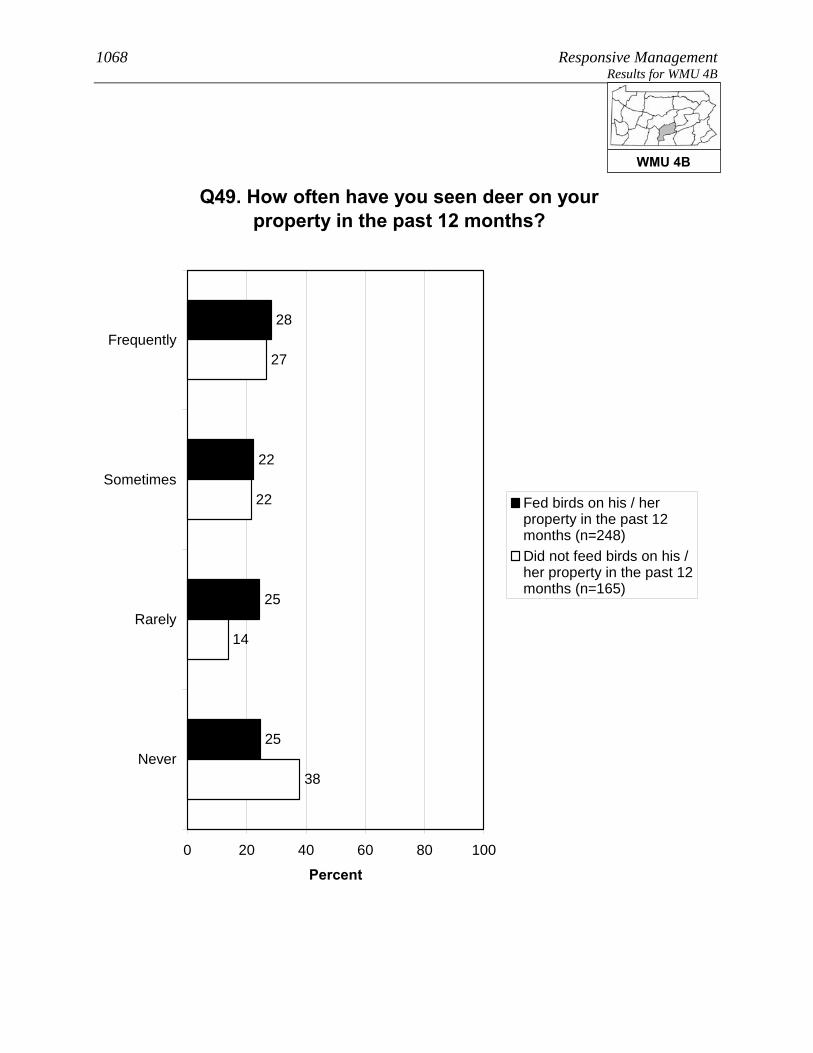
1068 Responsive Management Results for WMU 4B
Q49. How often have you seen deer on your property in the past 12 months?
25
25
22
28
38
27
22
14
0 20 40 60 80 100
Frequently
Sometimes
Rarely
Never
Percent
Fed birds on his / herproperty in the past 12months (n=248)Did not feed birds on his /her property in the past 12months (n=165)
WMU 4B

Pennsylvania Residents’ Opinions on and Attitudes Toward Deer and Deer Management 1069 Results for WMU 4B
Q49. How often have you seen deer on your property in the past 12 months?
49
28
17
6
21
21
23
35
0 20 40 60 80 100
Frequently
Sometimes
Rarely
Never
Percent
Has fed deer or put outattractants in the past 12months (n=72)Has not fed deer or put outattractants in the past 12months (n=341)
WMU 4B

1070 Responsive Management Results for WMU 4B
Q49. How often have you seen deer on your property in the past 12 months?
57
19
18
6
21
23
23
34
0 20 40 60 80 100
Frequently
Sometimes
Rarely
Never
Percent
Is aware of neighborsfeeding deer or putting outattractants (n=68)Is not aware of neighborsfeeding deer or putting outattractants (n=337)
WMU 4B

Pennsylvania Residents’ Opinions on and Attitudes Toward Deer and Deer Management 1071 Results for WMU 4B
Q43. In the past 12 months, have you experienced any problems with deer at your primary place of
residence?
5
95
0 20 40 60 80 100
Yes
No
Percent (n=413)
WMU 4B

1072 Responsive Management Results for WMU 4B
Q43. In the past 12 months, have you experienced any problems with deer at your primary place of
residence?
5
95
96
4
0 20 40 60 80 100
Yes
No
Percent
Fed birds on his / herproperty in the past 12months (n=248)Did not feed birds on his /her property in the past 12months (n=165)
WMU 4B
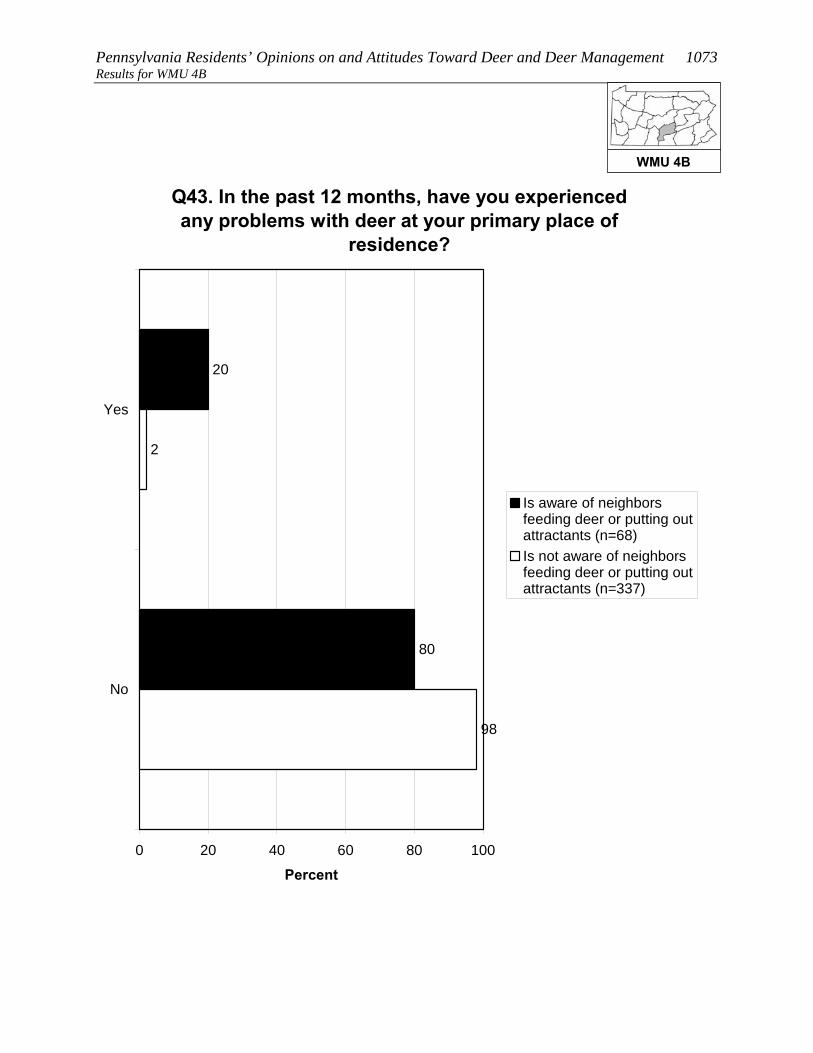
Pennsylvania Residents’ Opinions on and Attitudes Toward Deer and Deer Management 1073 Results for WMU 4B
Q43. In the past 12 months, have you experienced any problems with deer at your primary place of
residence?
20
80
98
2
0 20 40 60 80 100
Yes
No
Percent
Is aware of neighborsfeeding deer or putting outattractants (n=68)Is not aware of neighborsfeeding deer or putting outattractants (n=337)
WMU 4B
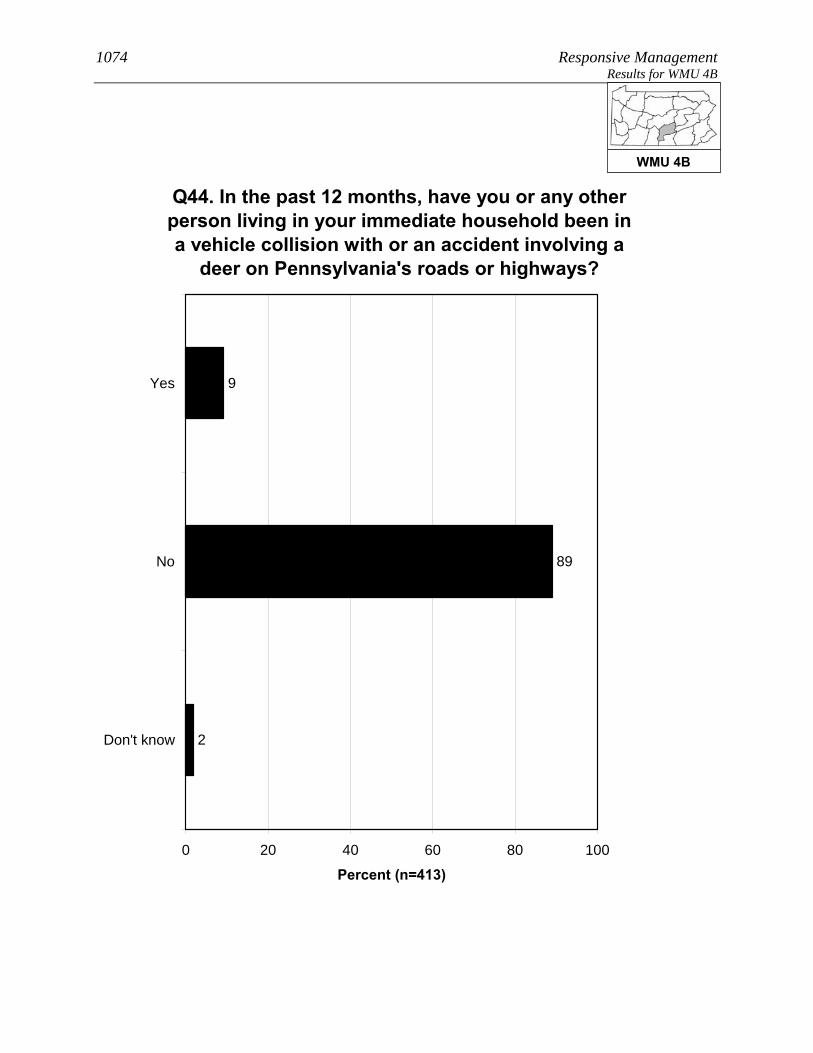
1074 Responsive Management Results for WMU 4B
Q44. In the past 12 months, have you or any other person living in your immediate household been in a vehicle collision with or an accident involving a
deer on Pennsylvania's roads or highways?
9
89
2
0 20 40 60 80 100
Yes
No
Don't know
Percent (n=413)
WMU 4B

Pennsylvania Residents’ Opinions on and Attitudes Toward Deer and Deer Management 1075 Results for WMU 4B
Q45. Were you or anyone else injured? (Asked of those who had a household member who was in or
who have personally been in a vehicle collision with or an accident involving a deer on
Pennsylvania's roads or highways in the past 12 months.)
4
96
0 20 40 60 80 100
Yes
No
Percent (n=39)
WMU 4B
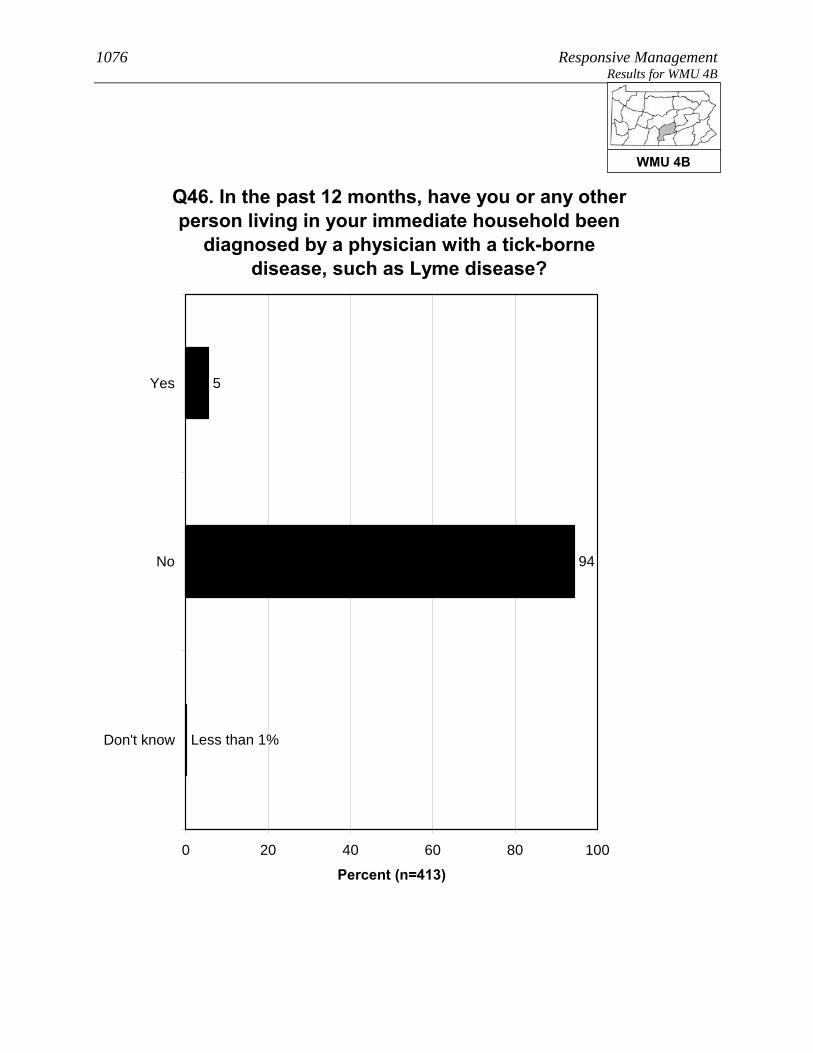
1076 Responsive Management Results for WMU 4B
Q46. In the past 12 months, have you or any other person living in your immediate household been
diagnosed by a physician with a tick-borne disease, such as Lyme disease?
5
94
Less than 1%
0 20 40 60 80 100
Yes
No
Don't know
Percent (n=413)
WMU 4B

Pennsylvania Residents’ Opinions on and Attitudes Toward Deer and Deer Management 1077 Results for WMU 4B FEEDING WILDLIFE AND HUNTING DEER
Several questions asked about feeding wildlife.
• Feeding deer or putting out deer attractants: 18% of residents of
WMU 4B did this, and 16% are aware of neighbors who did this.
o The most typical feeds or attractants put out by respondents are salt/mineral blocks,
corn, and apples.
• Feeding birds: 60% of residents of WMU 4B did this.
There is no consensus on whether it is okay for private citizens to feed or attract deer in
Pennsylvania: 57% agree that this is okay, but 35% disagree (the rest are neutral).
About two-fifths of residents of WMU 4B (41%) consider themselves to be a hunter, most of
whom have a Pennsylvania hunting license.
• Among residents of WMU 4B who live in a single-family home, 20% personally hunt
deer on their property.
• A large majority of residents of WMU 4B (87%) say that they, family members, and/or
friends hunt.
WMU 4B

1078 Responsive Management Results for WMU 4B
Q50. Did you ever feed deer intentionally or put out attractants, such as a salt or mineral block, in the
past 12 months?
18
82
0 20 40 60 80 100
Yes
No
Percent (n=413)
WMU 4B

Pennsylvania Residents’ Opinions on and Attitudes Toward Deer and Deer Management 1079 Results for WMU 4B
Q55. Are you aware of any of your neighbors feeding deer intentionally or trying to attract deer
on their property in the past 12 months?
16
83
2
0 20 40 60 80 100
Yes
No
Don't know
Percent (n=413)
WMU 4B

1080 Responsive Management Results for WMU 4B
Q53. What type of feed or attractant did you use? (Asked of those who fed deer intentionally or put
out attractants in the past 12 months.)
3
1
1
53
50
13
3
2
2
2
0 20 40 60 80 100
Salt / mineralblock
Corn
Apples
Food plot
Birdseed
Pellets /commercial feed
Other foodproducts
Hay
Other
Don't know
Mul
tiple
Res
pons
es A
llow
ed
Percent (n=72)
WMU 4B
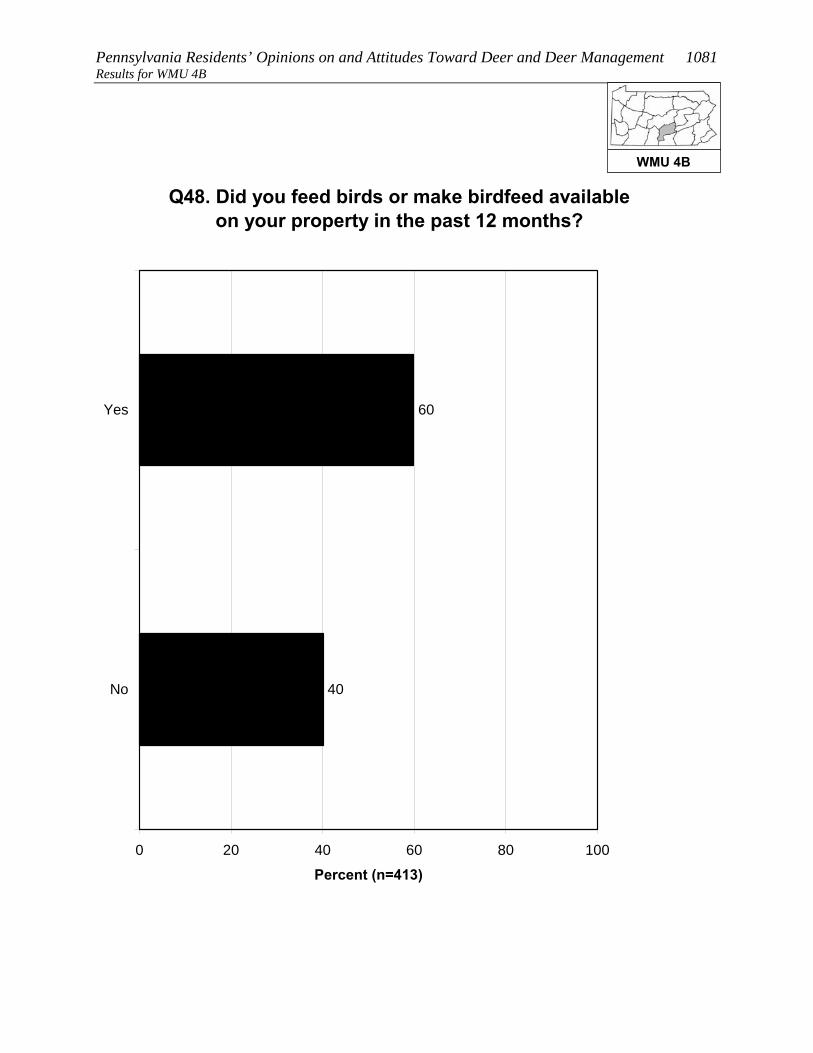
Pennsylvania Residents’ Opinions on and Attitudes Toward Deer and Deer Management 1081 Results for WMU 4B
Q48. Did you feed birds or make birdfeed available on your property in the past 12 months?
60
40
0 20 40 60 80 100
Yes
No
Percent (n=413)
WMU 4B

1082 Responsive Management Results for WMU 4B
Q56. Do you agree or disagree that it is OK for private citizens to feed or attract deer in
Pennsylvania?
29
28
7
13
22
1
0 20 40 60 80 100
Strongly agree
Moderately agree
Neither agree nordisagree
Moderatelydisagree
Strongly disagree
Don't know
Percent (n=413)
WMU 4B

Pennsylvania Residents’ Opinions on and Attitudes Toward Deer and Deer Management 1083 Results for WMU 4B
Q59. Do you personally hunt deer on your property? (Asked of those whose primary place of
residence is a single-family home.)
20
80
0 20 40 60 80 100
Yes
No
Percent (n=354)
WMU 4B

1084 Responsive Management Results for WMU 4B
Q79. Do you, any of your family members, or any friends hunt any wildlife species?
87
13
0 20 40 60 80 100
Yes
No
Percent (n=413)
WMU 4B
Pennsylvania Residents’ Opinions on and Attitudes Toward Deer and Deer Management 1085 Results for WMU 4B SOURCES OF INFORMATION
Most commonly, residents of WMU 4B say that the best way to
provide them with information about deer in Pennsylvania is through
direct mail (37% gave this response), followed by newspaper (18%),
email (17%), and the Internet (10% saying an Internet site other than
the PGC and 4% saying the agency website; note that some said both).
Just about half of residents of WMU 4B (41%) use social media, the most common primary
site being Facebook.
WMU 4B
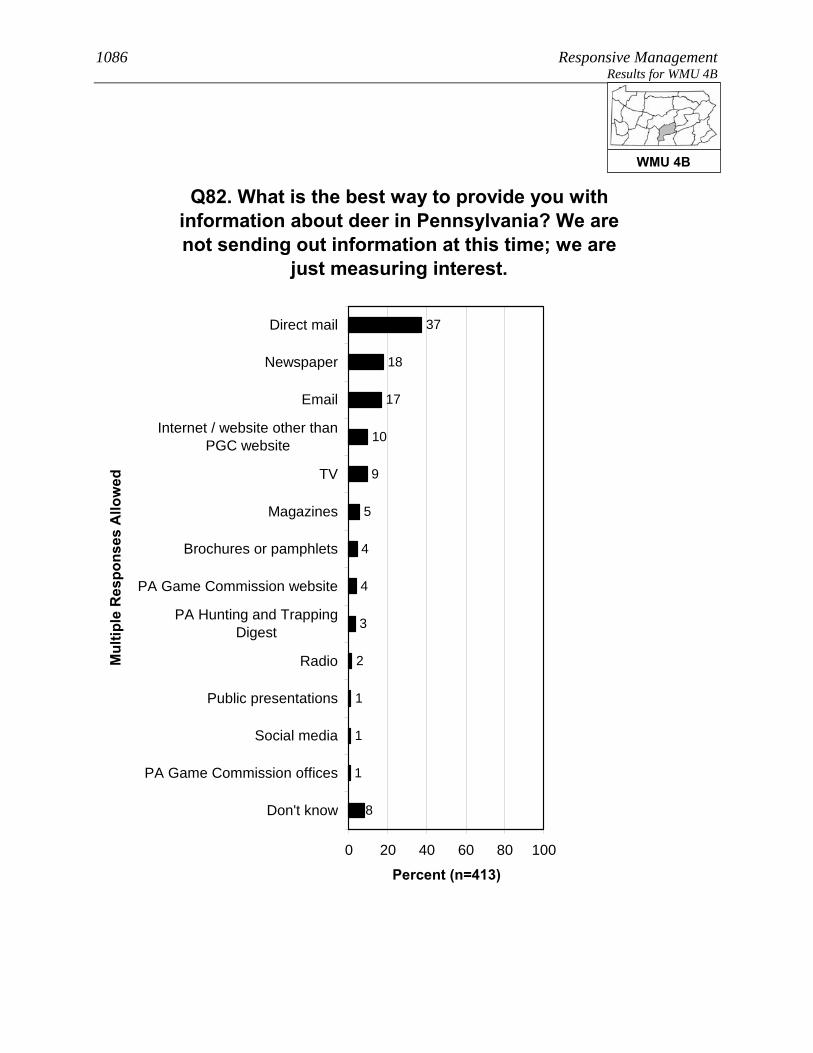
1086 Responsive Management Results for WMU 4B
Q82. What is the best way to provide you with information about deer in Pennsylvania? We are not sending out information at this time; we are
just measuring interest.
3
4
4
37
18
17
10
9
5
2
1
1
1
8
0 20 40 60 80 100
Direct mail
Newspaper
Internet / website other thanPGC website
TV
Magazines
Brochures or pamphlets
PA Game Commission website
PA Hunting and TrappingDigest
Radio
Public presentations
Social media
PA Game Commission offices
Don't know
Mul
tiple
Res
pons
es A
llow
ed
Percent (n=413)
WMU 4B

Pennsylvania Residents’ Opinions on and Attitudes Toward Deer and Deer Management 1087 Results for WMU 4B
Q84. Do you use social media, such as Facebook, Twitter, or YouTube?
41
59
0 20 40 60 80 100
Yes
No
Percent (n=413)
WMU 4B

1088 Responsive Management Results for WMU 4B
Q85. Which social media site do you use most often? (Asked of those who use social media.)
89
6
4
1
0 20 40 60 80 100
YouTube
Other
Percent (n=148)
WMU 4B
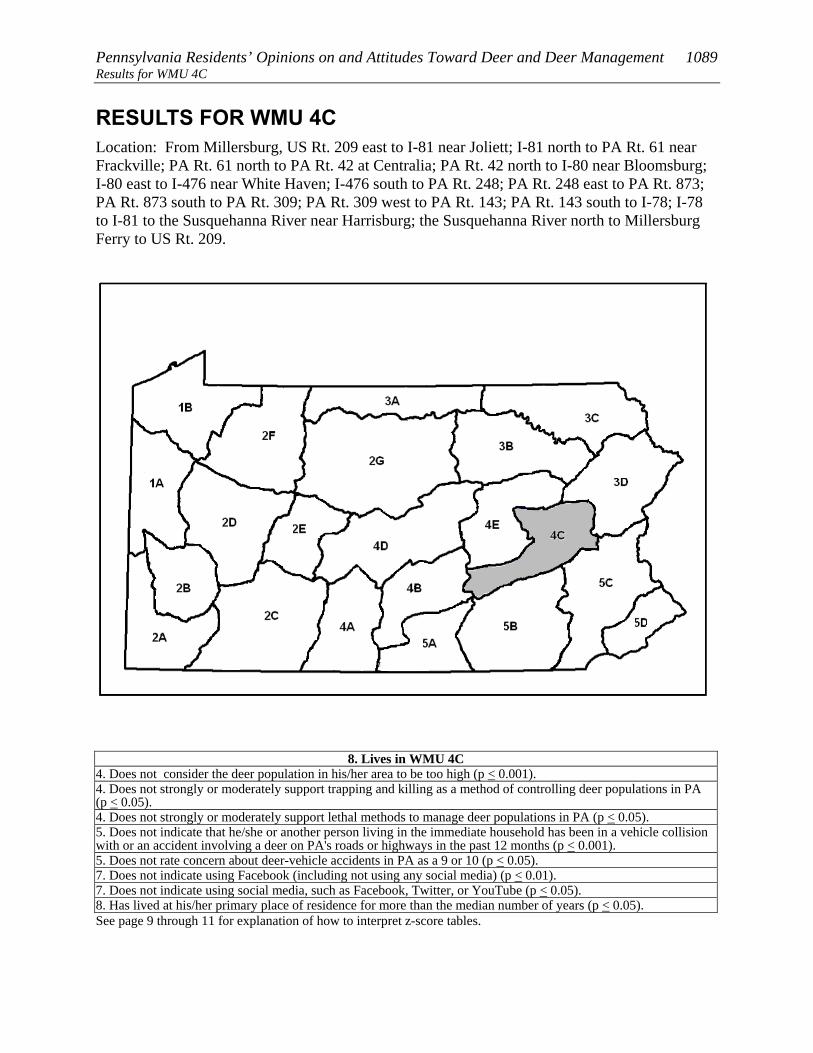
Pennsylvania Residents’ Opinions on and Attitudes Toward Deer and Deer Management 1089 Results for WMU 4C
RESULTS FOR WMU 4C Location: From Millersburg, US Rt. 209 east to I-81 near Joliett; I-81 north to PA Rt. 61 near Frackville; PA Rt. 61 north to PA Rt. 42 at Centralia; PA Rt. 42 north to I-80 near Bloomsburg; I-80 east to I-476 near White Haven; I-476 south to PA Rt. 248; PA Rt. 248 east to PA Rt. 873; PA Rt. 873 south to PA Rt. 309; PA Rt. 309 west to PA Rt. 143; PA Rt. 143 south to I-78; I-78 to I-81 to the Susquehanna River near Harrisburg; the Susquehanna River north to Millersburg Ferry to US Rt. 209.
8. Lives in WMU 4C 4. Does not consider the deer population in his/her area to be too high (p < 0.001). 4. Does not strongly or moderately support trapping and killing as a method of controlling deer populations in PA (p < 0.05). 4. Does not strongly or moderately support lethal methods to manage deer populations in PA (p < 0.05). 5. Does not indicate that he/she or another person living in the immediate household has been in a vehicle collision with or an accident involving a deer on PA's roads or highways in the past 12 months (p < 0.001). 5. Does not rate concern about deer-vehicle accidents in PA as a 9 or 10 (p < 0.05). 7. Does not indicate using Facebook (including not using any social media) (p < 0.01). 7. Does not indicate using social media, such as Facebook, Twitter, or YouTube (p < 0.05). 8. Has lived at his/her primary place of residence for more than the median number of years (p < 0.05). See page 9 through 11 for explanation of how to interpret z-score tables.

1090 Responsive Management Results for WMU 4C
PARTICIPATION IN VIEWING DEER A majority of residents of WMU 4C (59%) spent time viewing deer
around their home in the past 12 months, and 26% took a trip of at
least a mile to view deer.
• Two-fifths of those who took a deer-viewing trip (40%) used a spotlight to view the
deer at night.
A majority of residents of WMU 4C (69%) are satisfied with opportunities to view deer in
Pennsylvania. Because a relatively large percentage answer neutrally, only 13% indicate
being dissatisfied.
WMU 4C
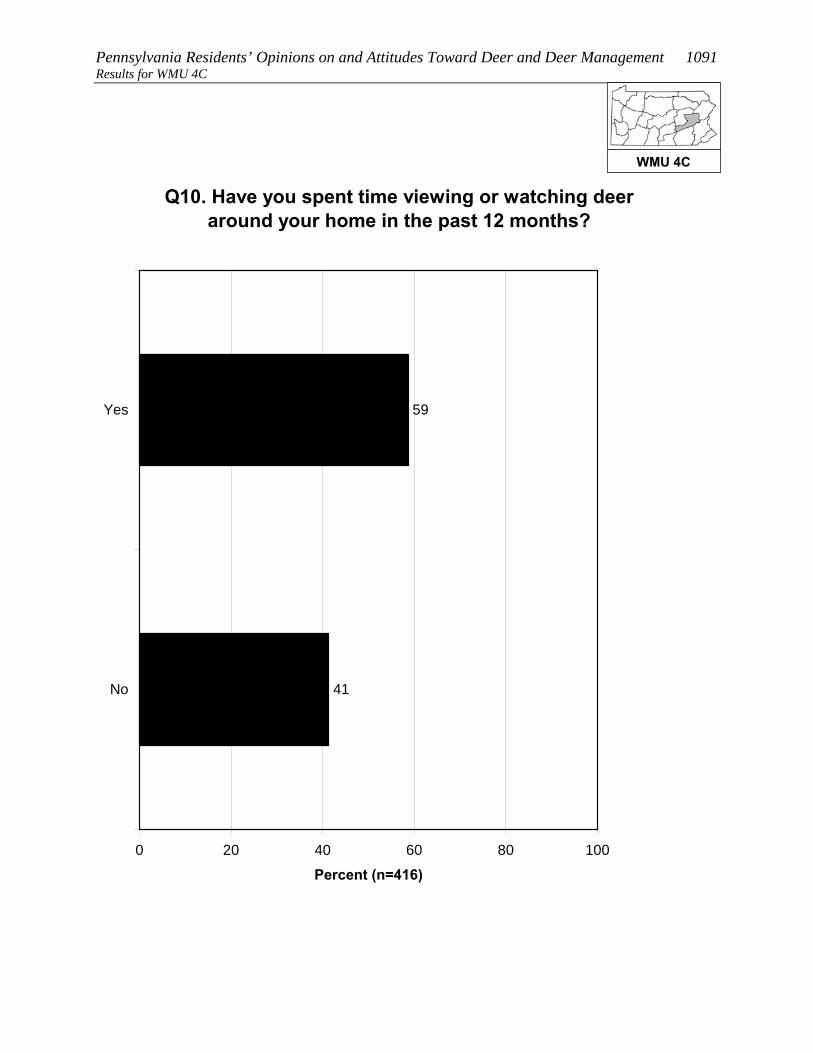
Pennsylvania Residents’ Opinions on and Attitudes Toward Deer and Deer Management 1091 Results for WMU 4C
Q10. Have you spent time viewing or watching deer around your home in the past 12 months?
59
41
0 20 40 60 80 100
Yes
No
Percent (n=416)
WMU 4C

1092 Responsive Management Results for WMU 4C
Q11. Have you taken a trip at least 1 mile from your home for the primary purpose of viewing or
watching deer in the past 12 months?
26
74
0 20 40 60 80 100
Yes
No
Percent (n=416)
WMU 4C
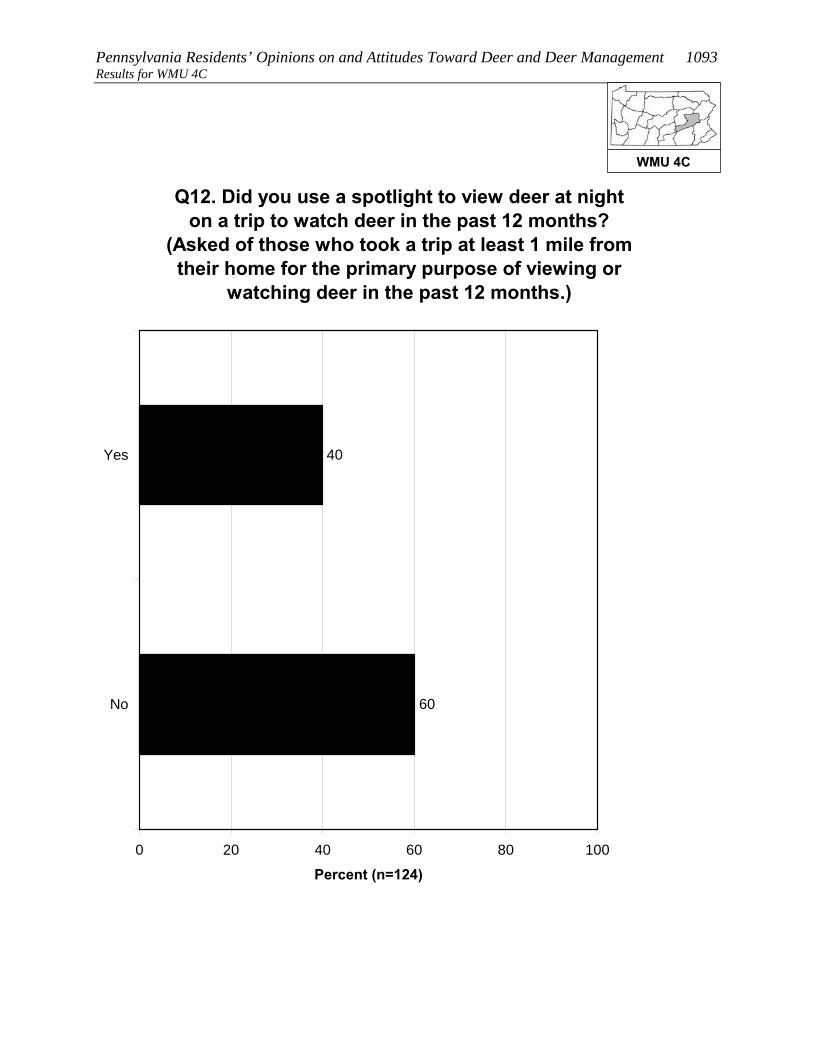
Pennsylvania Residents’ Opinions on and Attitudes Toward Deer and Deer Management 1093 Results for WMU 4C
Q12. Did you use a spotlight to view deer at night on a trip to watch deer in the past 12 months?
(Asked of those who took a trip at least 1 mile from their home for the primary purpose of viewing or
watching deer in the past 12 months.)
40
60
0 20 40 60 80 100
Yes
No
Percent (n=124)
WMU 4C

1094 Responsive Management Results for WMU 4C
Q13. How satisfied are you with opportunities to view or watch deer in Pennsylvania?
39
30
17
6
7
2
0 20 40 60 80 100
Very satisfied
Somewhatsatisfied
Neither satisfiednor dissatisfied
Somewhatdissatisfied
Very dissatisfied
Don't know
Percent (n=416)
WMU 4C
Pennsylvania Residents’ Opinions on and Attitudes Toward Deer and Deer Management 1095 Results for WMU 4C OPINIONS ON DEER IN GENERAL AND THE SIZE AND HEALTH OF THE DEER HERD
Opinion on deer is mostly favorable: 61% of residents of WMU 4C
say with no caveats that they like having deer around, another 24%
like having deer around but worry about the problems they may cause,
and only 2% generally regard them as a nuisance. The remainder have
no particular feeling about deer.
Another question asked residents of WMU 4C how deer-related issues compared to other
issues in their life, on a scale of 0 to 10, with the most importance being 10: the median
rating is “5.” The most common ratings are “0” (18%) and the midpoint of “5” (17%). In
general, ratings are well spread across the scale.
Two other ratings questions asked respondents to rate their concern about deer-related issues.
The median level of concern is “6” for the quality of deer habitat in Pennsylvania and “7” for
the health of the deer population in Pennsylvania.
The survey asked about the perceived size of the deer herd in the respondent’s area. The
majority of residents of WMU 4C say that the herd size is just right (56%); otherwise, more
say that it is too low (26%) than too high (7%).
• Those who own their home are more about the same as those who do not own their
home regarding opinion on the deer population in their area.
• Those who consider themselves to be a hunter are more likely to say that the deer
population in their area is too low, compared to those who are not hunters.
WMU 4C
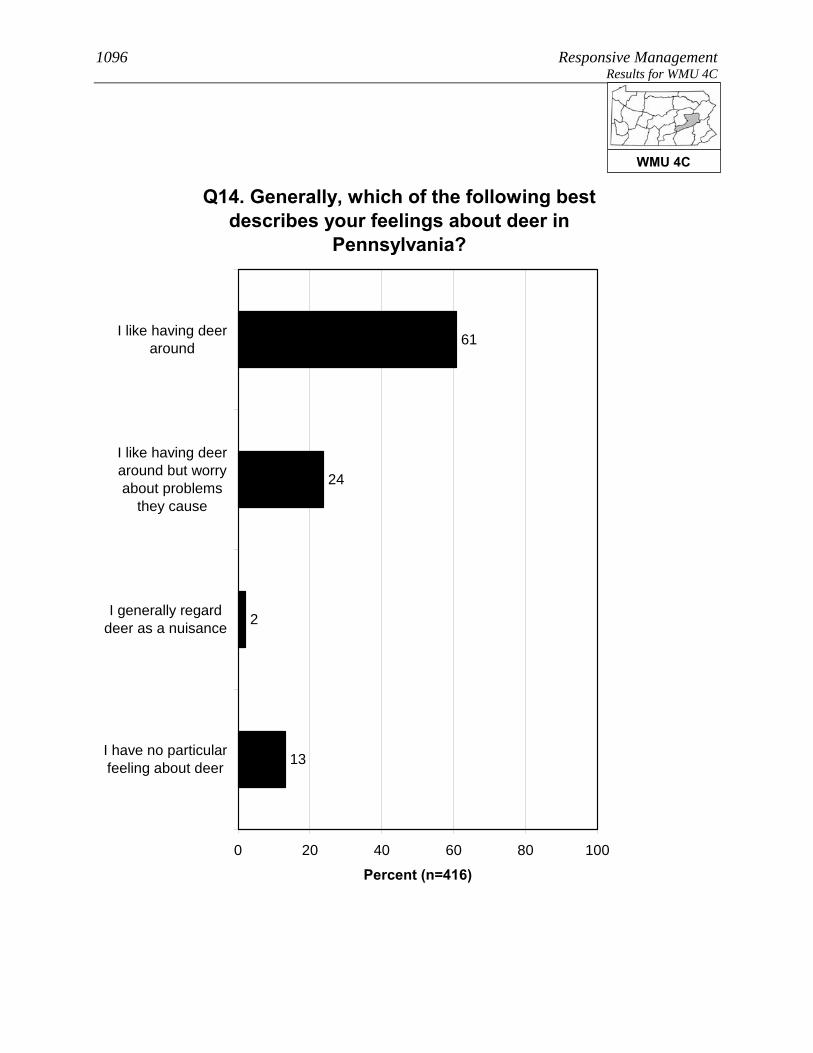
1096 Responsive Management Results for WMU 4C
Q14. Generally, which of the following best describes your feelings about deer in
Pennsylvania?
61
24
2
13
0 20 40 60 80 100
I like having deeraround
I like having deeraround but worryabout problems
they cause
I generally regarddeer as a nuisance
I have no particularfeeling about deer
Percent (n=416)
WMU 4C

Pennsylvania Residents’ Opinions on and Attitudes Toward Deer and Deer Management 1097 Results for WMU 4C
Q15. Compared to other issues in your life, how important to you, personally, are deer-related
issues on a scale of 0 to 10 where 0 is not at all important and 10 is extremely important?
10
7
5
10
4
5
6
8
17
7
18
3
0 20 40 60 80 100
10
9
8
7
6
5
4
3
2
1
0
Don't know
Percent (n=416)
Mean = 4.32Median = 5
WMU 4C

1098 Responsive Management Results for WMU 4C
Q41. How about the quality of deer habitat in Pennsylvania? (How much of a concern is this for you personally on a scale of 0 to 10 where 0 is not at all concerned and 10 is extremely concerned?)
4
3
4
16
5
16
8
12
20
1
9
3
0 20 40 60 80 100
10
9
8
7
6
5
4
3
2
1
0
Don't know
Percent (n=416)
Mean = 6.12Median = 6
WMU 4C

Pennsylvania Residents’ Opinions on and Attitudes Toward Deer and Deer Management 1099 Results for WMU 4C
4
4
3
23
5
18
9
9
15
2
8
1
0 20 40 60 80 100
10
9
8
7
6
5
4
3
2
1
0
Don't know
Percent (n=416)
Q42. How about health of the deer population, such as adequate food resources for the size of the deer herd, in Pennsylvania? (How much of a concern is this for you
personally on a scale of 0 to 10 where 0 is not at all concerned and 10 is extremely concerned?)
Mean = 6.48Median = 7
WMU 4C

1100 Responsive Management Results for WMU 4C
Q16. In your opinion, is the deer population in the area where you live too high, just right, or too low?
7
56
26
11
0 20 40 60 80 100
Too high
Just right
Too low
Don't know
Percent (n=416)
WMU 4C

Pennsylvania Residents’ Opinions on and Attitudes Toward Deer and Deer Management 1101 Results for WMU 4C
Q16. In your opinion, is the deer population in the area where you live too high, just right, or too low?
7
56
26
11
20
57
9
14
0 20 40 60 80 100
Too high
Just right
Too low
Don't know
Percent
Owns home (n=337)Does not own home (n=32)
WMU 4C

1102 Responsive Management Results for WMU 4C
Q16. In your opinion, is the deer population in the area where you live too high, just right, or too low?
3
48
44
5
18
59
9
14
0 20 40 60 80 100
Too high
Just right
Too low
Don't know
Percent
Consider themselves ahunter (n=139)Do not consider themselvesa hunter (n=275)
WMU 4C
Pennsylvania Residents’ Opinions on and Attitudes Toward Deer and Deer Management 1103 Results for WMU 4C OPINIONS ON MANAGEMENT EFFORTS AND MANAGEMENT GOALS
The survey asked about three deer population management goals. For
all three, a large majority agree with the management goal: 87% agree
with managing the deer for a healthy and sustainable forest habitat,
91% agree with managing for healthy and sustainable deer
populations, and 83% agree with managing for safe, acceptable levels
of deer-human conflicts.
Residents of WMU 4C who said that the deer population in their area is too high or too low
were asked to indicate the reasonable number of years it should take to achieve an acceptable
deer population. The mean amount is 5.16 years. While 35% said that they do not know,
nearly all the rest gave a number of years of 10 or less. Note that this is only among those
who said the deer population was too high or too low.
• Because management plans typically look at a time frame of about 10 years to effect
change, the survey specifically asked if these respondents would be willing to wait
more than 10 years to achieve an acceptable deer population: just less than a majority
(47%) indicated that they would be willing to wait that long.
WMU 4C
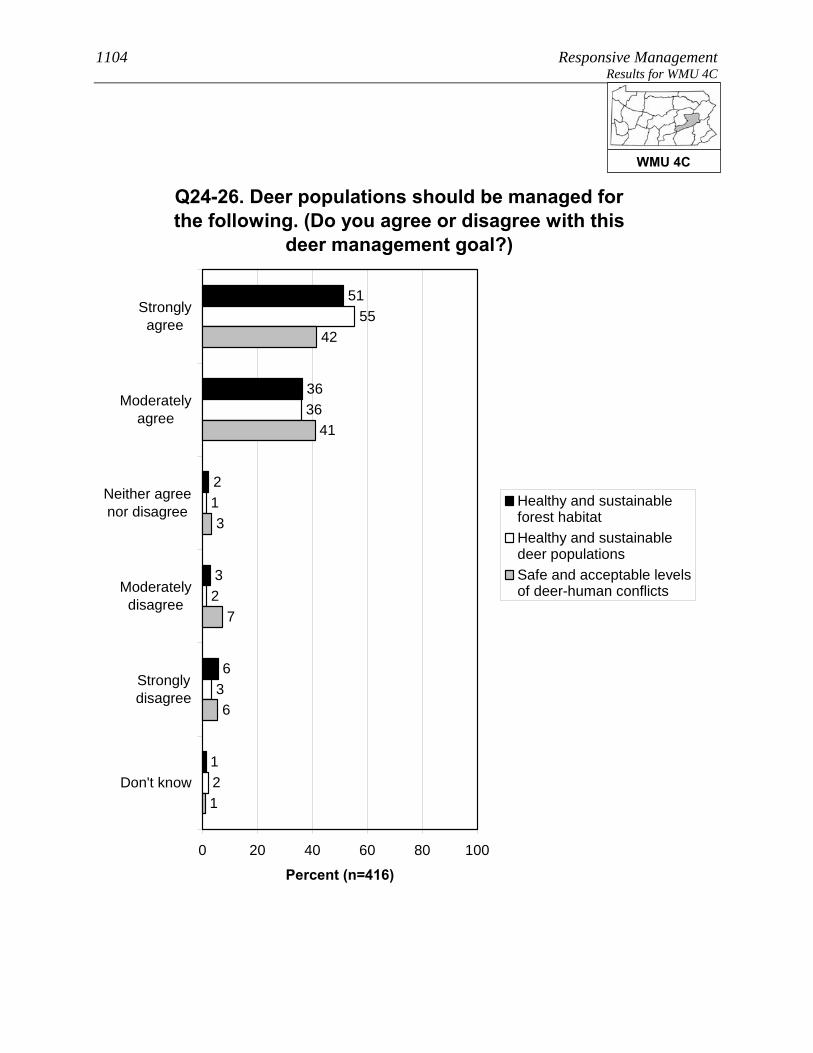
1104 Responsive Management Results for WMU 4C
Q24-26. Deer populations should be managed for the following. (Do you agree or disagree with this
deer management goal?)
51
36
2
3
6
1
1
36
55
2
3
2
7
42
41
3
6
1
0 20 40 60 80 100
Stronglyagree
Moderatelyagree
Neither agreenor disagree
Moderatelydisagree
Stronglydisagree
Don't know
Percent (n=416)
Healthy and sustainableforest habitatHealthy and sustainabledeer populationsSafe and acceptable levelsof deer-human conflicts
WMU 4C
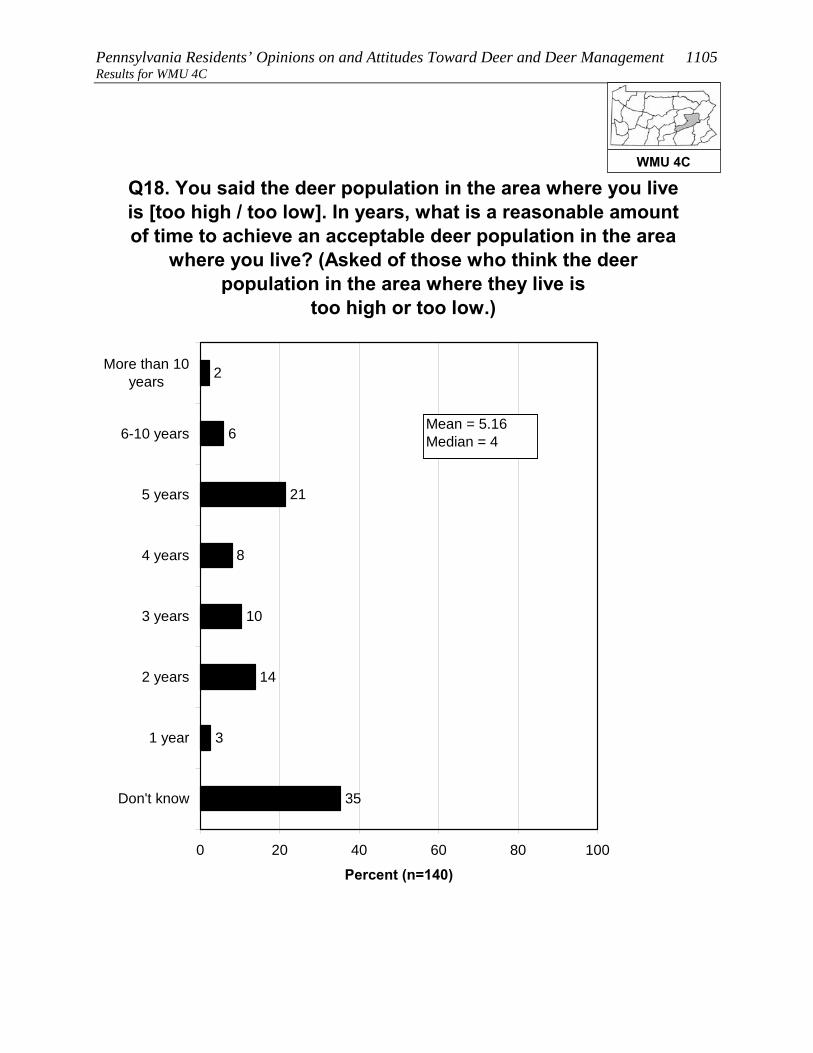
Pennsylvania Residents’ Opinions on and Attitudes Toward Deer and Deer Management 1105 Results for WMU 4C
35
3
2
6
21
8
10
14
0 20 40 60 80 100
More than 10years
6-10 years
5 years
4 years
3 years
2 years
1 year
Don't know
Percent (n=140)
Q18. You said the deer population in the area where you live is [too high / too low]. In years, what is a reasonable amount of time to achieve an acceptable deer population in the area
where you live? (Asked of those who think the deer population in the area where they live is
too high or too low.)
Mean = 5.16Median = 4
WMU 4C
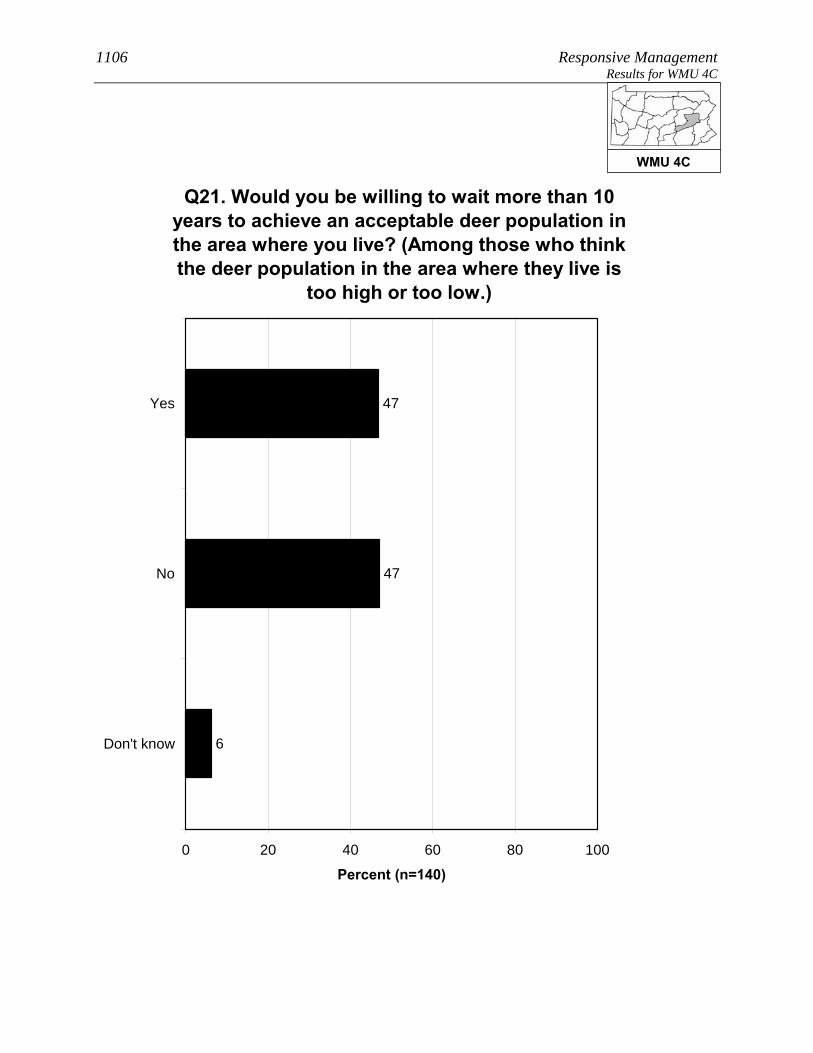
1106 Responsive Management Results for WMU 4C
Q21. Would you be willing to wait more than 10 years to achieve an acceptable deer population in the area where you live? (Among those who think the deer population in the area where they live is
too high or too low.)
47
47
6
0 20 40 60 80 100
Yes
No
Don't know
Percent (n=140)
WMU 4C

Pennsylvania Residents’ Opinions on and Attitudes Toward Deer and Deer Management 1107 Results for WMU 4C OPINIONS ON METHODS FOR MANAGING DEER, INCLUDING HUNTING
A majority of residents of WMU 4C (59%) support lethal methods to
manage deer populations in Pennsylvania; nonetheless, 32% oppose,
mostly strong opposition.
• Those residents of WMU 4C who live in a single-family home and own their home are
more likely to oppose lethal methods, compared to those who live in a single-family
home but do not own their home.
• The survey asked about four methods of controlling deer populations (three of them
lethal). The most support is for legal, regulated hunting (88% of respondents support
this method), distantly followed by fertility/birth control (37%), professionals or
sharpshooters (28%), and trapping and killing (20%).
Two questions asked respondents about hunting on their land (among those who live in a
single-family home), the first question about hunting by the respondents themselves (9% do
so) and the second regarding allowing others to hunt on their land (14% do so). In
combining the results, 15% of residents of WMU 4C who live in a single-family home either
hunt on their own land or allow others to do so (it is not simply a sum of the two questions
because some hunt on their property and allow others to do so as well).
• There was interest in seeing how a particular subgroup responded on this question, the
subgroup being those who live in a single-family home; who live on 1 acre or less; and
who live in an urban, suburban area, or a small city/town. Among this subgroup, 2%
either hunt on their own property or allow others to hunt on the property.
• Those respondents who do not allow hunting on their property were asked to indicate
why they prohibit it. The most common reasons are that they live in an urban or
suburban area in which hunting is not possible or feasible and/or that their property is
too small. Other minor reasons are a general opposition to hunting and concerns about
safety.
• Those same respondents who do not allow hunting on their property were asked about
their likelihood of ever allowing others to hunt deer on their property; they
overwhelmingly say this is very unlikely (96%). They were then asked if there is
WMU 4C

1108 Responsive Management Results for WMU 4C
anything that would make them more likely to allow deer hunting;
they are almost unanimous (98%) in saying that there is nothing
that would make them more likely to allow deer hunting.
• The question about allowing others to hunt on their property was examined among the
subgroup previously discussed (those who live in a single-family home; who live on 1
acre or less; and who live in an urban, suburban area, or a small city/town). Among
this group who got the question, nearly all say that they would never allow hunting.
o Additional follow-up questions to be asked of those who indicated that something
might prompt them to allow hunting on their property did not have enough
respondents for statistical validity; therefore, they are not shown.
WMU 4C
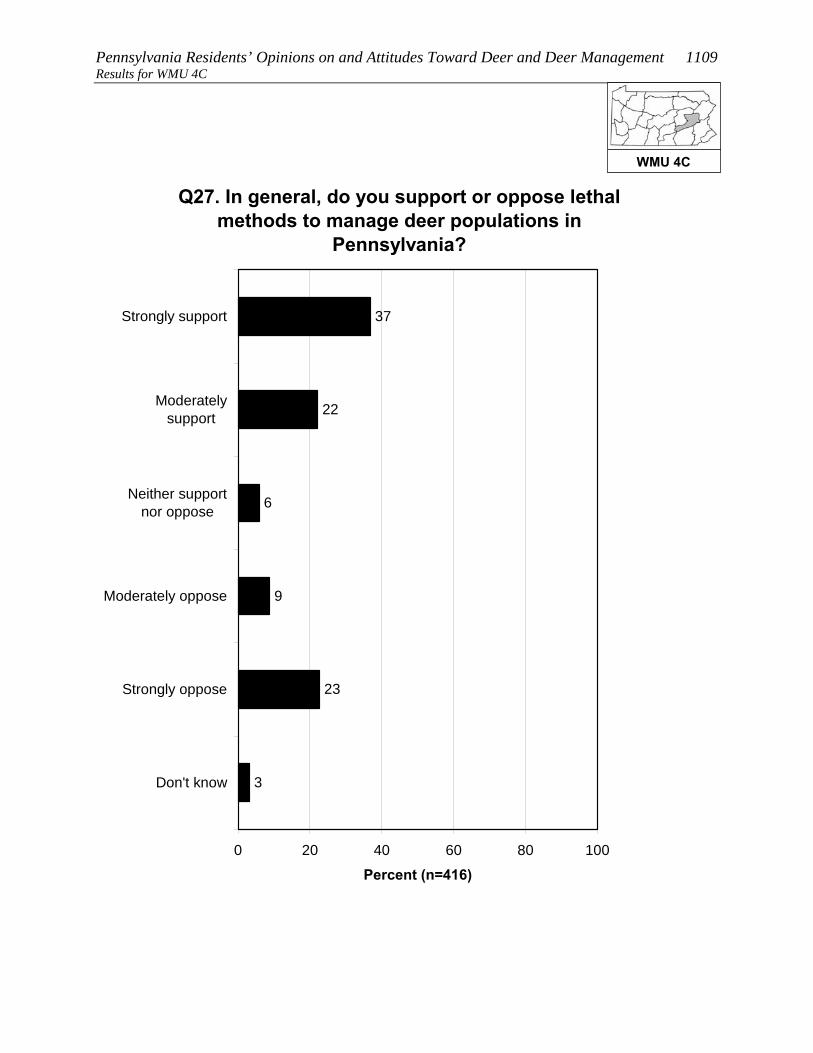
Pennsylvania Residents’ Opinions on and Attitudes Toward Deer and Deer Management 1109 Results for WMU 4C
Q27. In general, do you support or oppose lethal methods to manage deer populations in
Pennsylvania?
37
22
6
9
23
3
0 20 40 60 80 100
Strongly support
Moderatelysupport
Neither supportnor oppose
Moderately oppose
Strongly oppose
Don't know
Percent (n=416)
WMU 4C

1110 Responsive Management Results for WMU 4C
Q27. In general, do you support or oppose lethal methods to manage deer populations in
Pennsylvania?
36
22
5
10
22
4
14
27
37
3
18
0
0 20 40 60 80 100
Stronglysupport
Moderatelysupport
Neithersupport nor
oppose
Moderatelyoppose
Stronglyoppose
Don't know
Percent
Owns home (n=337)Does not own home (n=32)
WMU 4C
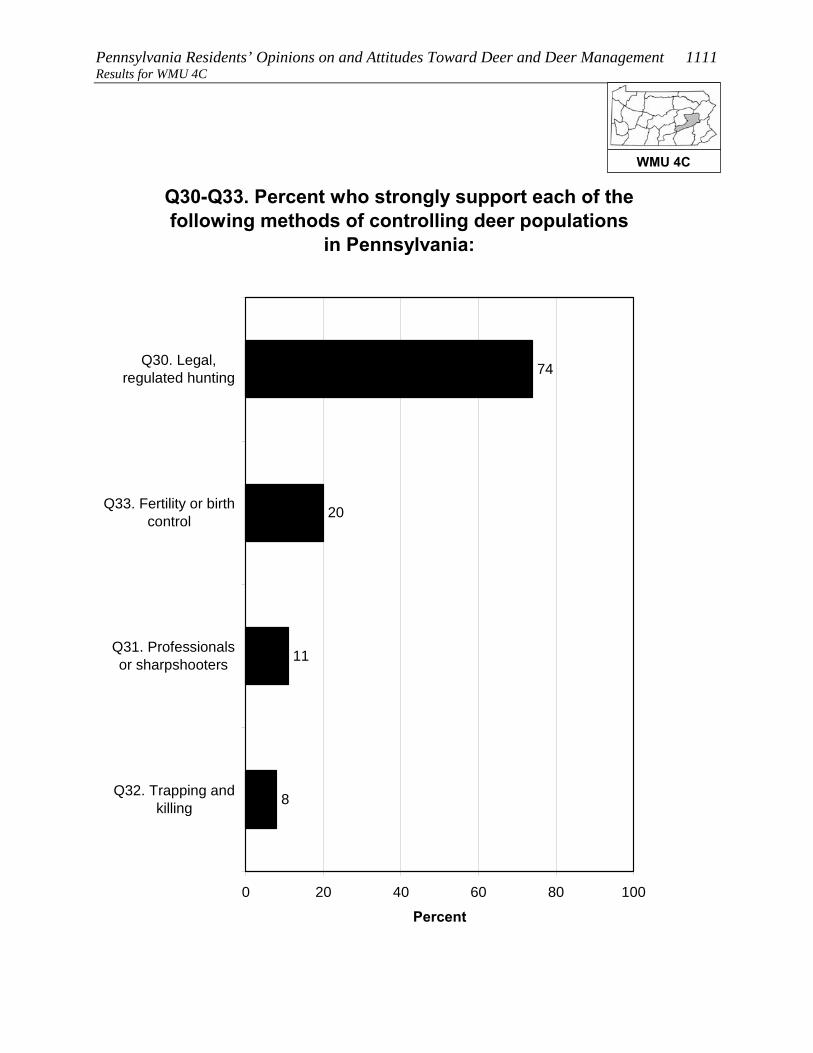
Pennsylvania Residents’ Opinions on and Attitudes Toward Deer and Deer Management 1111 Results for WMU 4C
Q30-Q33. Percent who strongly support each of the following methods of controlling deer populations
in Pennsylvania:
8
11
20
74
0 20 40 60 80 100
Q30. Legal,regulated hunting
Q33. Fertility or birthcontrol
Q31. Professionalsor sharpshooters
Q32. Trapping andkilling
Percent
WMU 4C
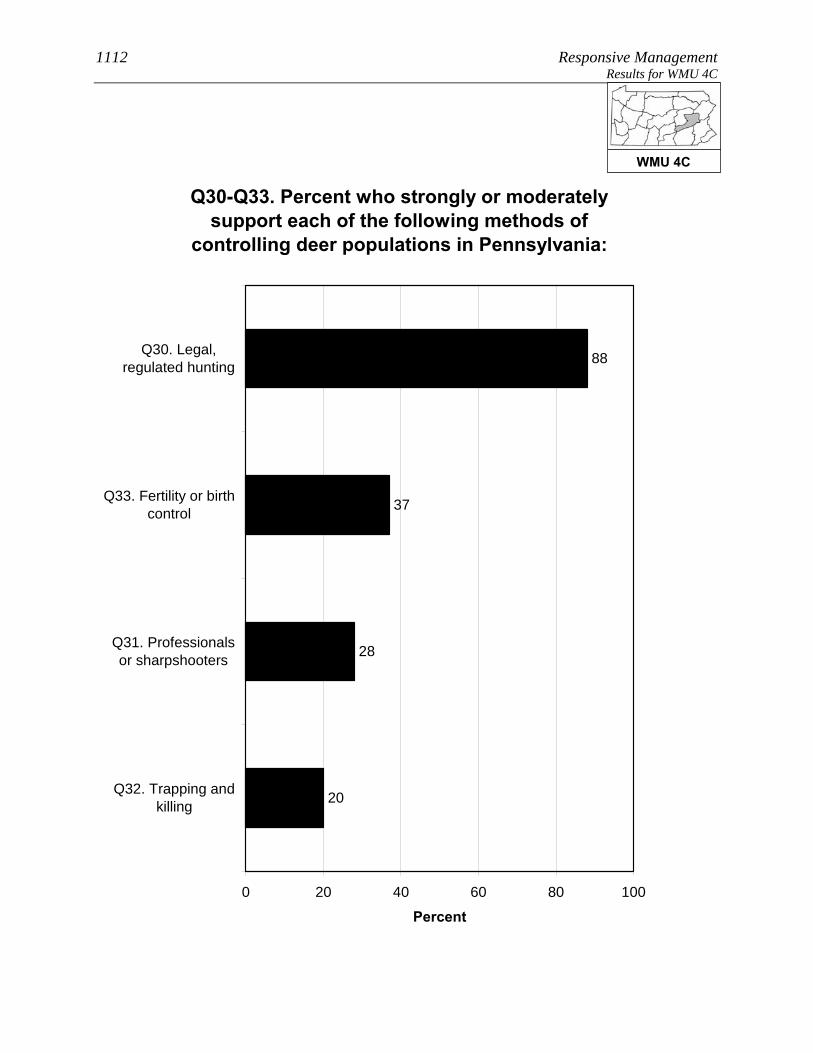
1112 Responsive Management Results for WMU 4C
Q30-Q33. Percent who strongly or moderately support each of the following methods of
controlling deer populations in Pennsylvania:
20
28
37
88
0 20 40 60 80 100
Q30. Legal,regulated hunting
Q33. Fertility or birthcontrol
Q31. Professionalsor sharpshooters
Q32. Trapping andkilling
Percent
WMU 4C
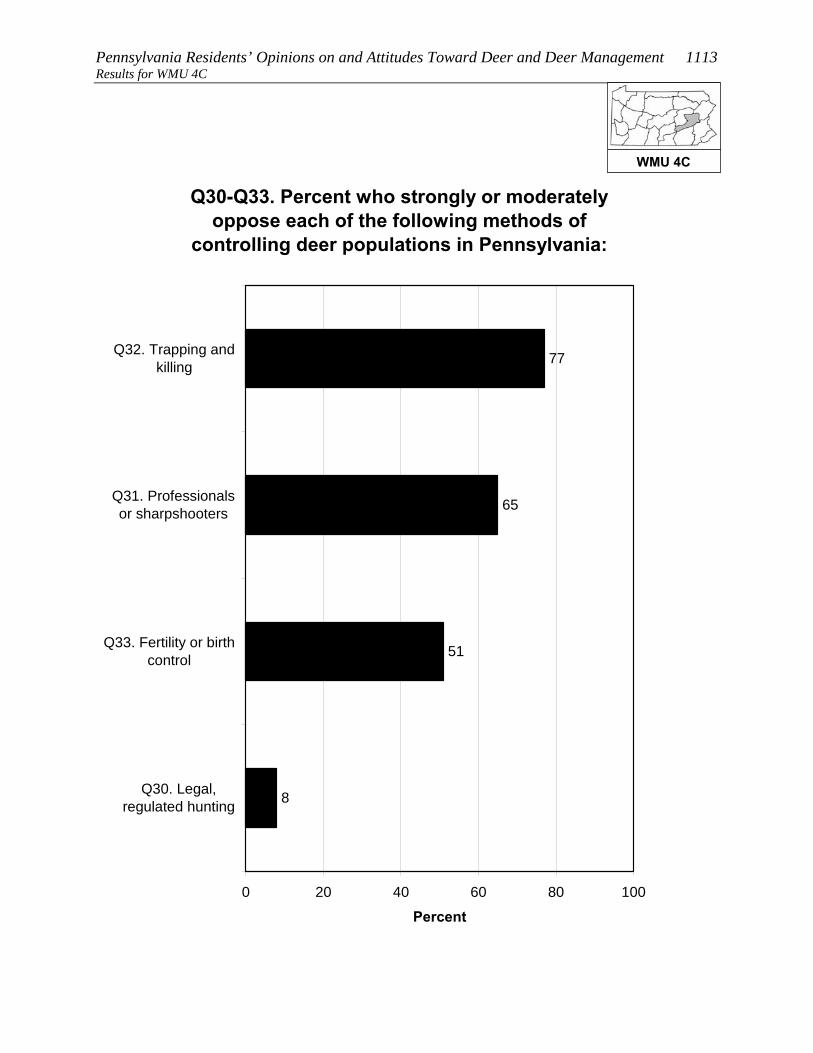
Pennsylvania Residents’ Opinions on and Attitudes Toward Deer and Deer Management 1113 Results for WMU 4C
Q30-Q33. Percent who strongly or moderately oppose each of the following methods of
controlling deer populations in Pennsylvania:
8
51
65
77
0 20 40 60 80 100
Q32. Trapping andkilling
Q31. Professionalsor sharpshooters
Q33. Fertility or birthcontrol
Q30. Legal,regulated hunting
Percent
WMU 4C

1114 Responsive Management Results for WMU 4C
Q30-Q33. Percent who strongly oppose each of the following methods of controlling deer populations
in Pennsylvania:
5
40
53
61
0 20 40 60 80 100
Q32. Trapping andkilling
Q31. Professionalsor sharpshooters
Q33. Fertility or birthcontrol
Q30. Legal,regulated hunting
Percent
WMU 4C

Pennsylvania Residents’ Opinions on and Attitudes Toward Deer and Deer Management 1115 Results for WMU 4C
Q59/60. Deer hunts and/or allows others to deer hunt on property. (Among respondents living in a
single-family home.)
15
85
0 20 40 60 80 100
Yes
No
Percent (n=369)
WMU 4C

1116 Responsive Management Results for WMU 4C
Q59/60. Deer hunts and/or allows others to deer hunt on property. (Among respondents living in a
single-family home.)
2
98
0 20 40 60 80 100
Yes
No
Percent
Lives in a single familyhome on 1 acre or less inan urban area, a suburbanarea, or a small city/town(n=159)
WMU 4C

Pennsylvania Residents’ Opinions on and Attitudes Toward Deer and Deer Management 1117 Results for WMU 4C
Q63. What are the main reasons you do not allow others to hunt deer on your property? (Asked of
those whose primary place of residence is a single-family home and who do not allow others to hunt
deer on their property.)
1
1
54
50
8
6
2
2
0 20 40 60 80 100
Live in residential neighborhood /suburban or urban area
Property is too small / neighbors too close
Oppose hunting in general
Concerned about safety
Liability
Not enough deer on property / not enoughhabitat
Not interested in allowing hunting onproperty, but did not indicate opposition to
hunting in general
Want to save hunting opportunities forself / family
Mul
tiple
Res
pons
es A
llow
ed
Percent (n=321)
WMU 4C

1118 Responsive Management Results for WMU 4C
Q65. How likely are you to ever allow others to deer hunt on your property? (Asked of those whose
primary place of residence is a single-family home and who do not allow others to hunt deer on their
property.)
2
2
0
96
0 20 40 60 80 100
Very likely
Somewhat likely
Somewhat unlikely
Very unlikely
Percent (n=321)
WMU 4C
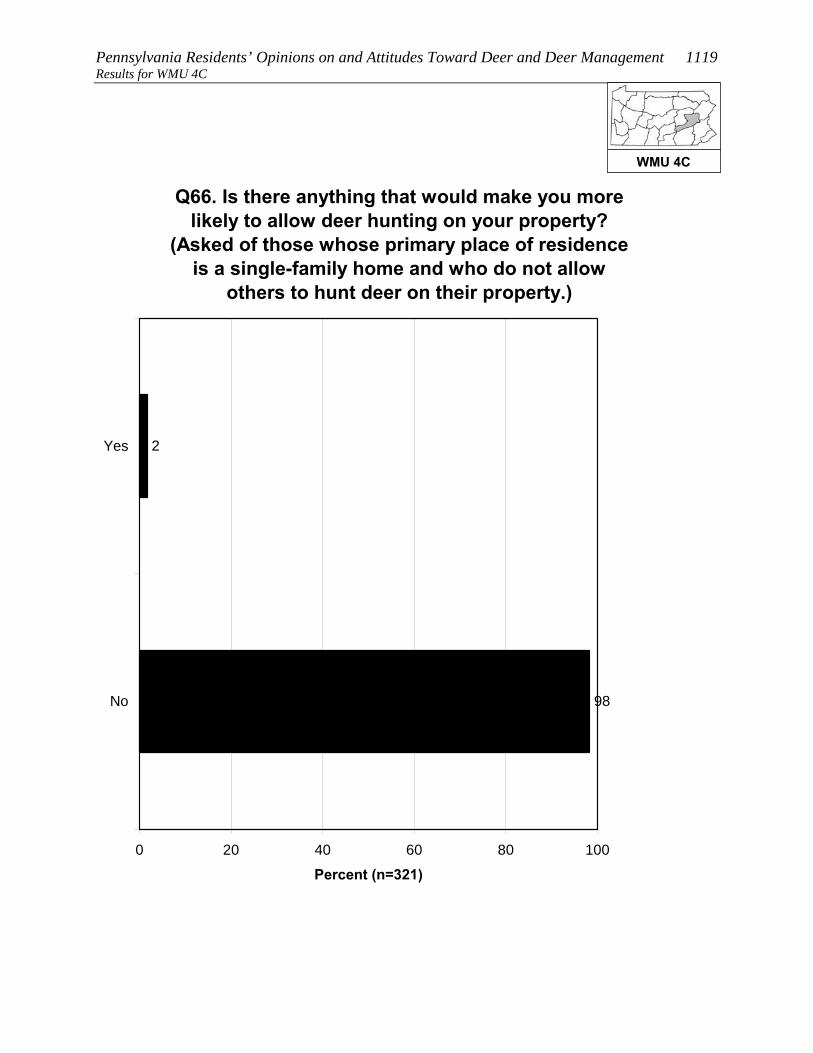
Pennsylvania Residents’ Opinions on and Attitudes Toward Deer and Deer Management 1119 Results for WMU 4C
Q66. Is there anything that would make you more likely to allow deer hunting on your property?
(Asked of those whose primary place of residence is a single-family home and who do not allow
others to hunt deer on their property.)
2
98
0 20 40 60 80 100
Yes
No
Percent (n=321)
WMU 4C

1120 Responsive Management Results for WMU 4C
Q65. How likely are you to ever allow others to deer hunt on your property? (Asked of those whose
primary place of residence is a single-family home and who do not allow others to hunt deer on their
property.)
2
0
0
98
0 20 40 60 80 100
Very likely
Somewhatlikely
Somewhatunlikely
Very unlikely
Percent
Lives in a single familyhome on 1 acre or less inan urban area, a suburbanarea, or a small city/town(n=156)
WMU 4C
Pennsylvania Residents’ Opinions on and Attitudes Toward Deer and Deer Management 1121 Results for WMU 4C CONCERNS ABOUT DEER AND DEER NUISANCE PROBLEMS
Seven questions asked about respondents’ level of concern about
issues associated with deer. For each issue, respondents rated their
level of concern about it using a 10-point scale, with 10 being the most
concerned.
• The most concern was for tick-borne diseases (mean rating of 7.3), followed by three
whose means are fairly close to one another: the health of the deer population (6.5),
deer-vehicle accidents (6.2), and the quality of deer habitat (6.1).
• At the bottom are concern about deer impacts on habitat and other wildlife (even
though this can be considerable) (3.7) and the two impacts to residents’ landscaping:
deer damage to plants and landscaping (1.9) and deer droppings in the yard (1.2).
o Another graph shows the percentage who gave a high rating (a “9” or “10”),
providing an idea of the percentage who feel strongly about the issues.
Among residents of WMU 4C, 67% indicated that they saw deer on their property in the past
12 months.
• Respondents who fed birds were more likely to indicate seeing deer, as were
respondents who fed deer or put out attractants or were aware of neighbors who fed
deer or put out attractants.
The survey asked about specific nuisance problems with deer that residents of WMU 4C may
have experienced: 10% indicated that they experienced problems with deer at their primary
place of residence in the past 12 months; 8% indicated that they or another household
member had been in a vehicle collision with a deer (fortunately, a very low portion of
drivers/passengers were injured); and 5% indicated that they or a household member had
been diagnosed with a tick-borne disease.
• Crosstabulations show that those who fed birds were about the same as those who had
not fed birds regarding experiencing deer problems. However, those who were aware
of neighbors feeding deer or putting out attractants were much more likely to say that
they experienced deer problems.
WMU 4C
1122 Responsive Management Results for WMU 4C
Q36-Q42. Mean rating of respondents' concern about each of the following on a 10-point scale:
1.9
3.7
6.1
6.2
6.5
7.3
1.2
0 2 4 6 8 10
Q36. Tick-borne diseases, such as Lymedisease, in Pennsylvania
Q42. The health of the deer population,such as adequate food resources for the
size of the deer herd, in Pennsylvania
Q40. Deer-vehicle accidents inPennsylvania
Q41. The quality of deer habitat inPennsylvania
Q39. Deer impacts on the habitat andother wildlife in Pennsylvania
Q38. Deer damage to plants andlandscaping in his/her yard
Q37. Deer droppings in his/her yard
Mean
WMU 4C

Pennsylvania Residents’ Opinions on and Attitudes Toward Deer and Deer Management 1123 Results for WMU 4C
Q36-Q42. Percent who rated their concern about each of the following as a 9 or 10 on a 10-point
scale:
5
6
21
26
28
45
3
0 20 40 60 80 100
Q36. Tick-borne diseases, such as Lymedisease, in Pennsylvania
Q42. The health of the deer population,such as adequate food resources for the
size of the deer herd, in Pennsylvania
Q40. Deer-vehicle accidents inPennsylvania
Q41. The quality of deer habitat inPennsylvania
Q39. Deer impacts on the habitat andother wildlife in Pennsylvania
Q38. Deer damage to plants andlandscaping in his/her yard
Q37. Deer droppings in his/her yard
Percent
WMU 4C

1124 Responsive Management Results for WMU 4C
Q49. How often have you seen deer on your property in the past 12 months?
28
20
19
33
0 20 40 60 80 100
Frequently
Sometimes
Rarely
Never
Percent (n=416)
WMU 4C
Pennsylvania Residents’ Opinions on and Attitudes Toward Deer and Deer Management 1125 Results for WMU 4C
Q49. How often have you seen deer on your property in the past 12 months?
31
21
18
30
20
18
25
37
0 20 40 60 80 100
Frequently
Sometimes
Rarely
Never
Percent
Fed birds on his / herproperty in the past 12months (n=196)Did not feed birds on his /her property in the past 12months (n=220)
WMU 4C
1126 Responsive Management Results for WMU 4C
Q49. How often have you seen deer on your property in the past 12 months?
59
14
16
11
19
20
24
36
0 20 40 60 80 100
Frequently
Sometimes
Rarely
Never
Percent
Has fed deer or put outattractants in the past 12months (n=52)Has not fed deer or put outattractants in the past 12months (n=364)
WMU 4C
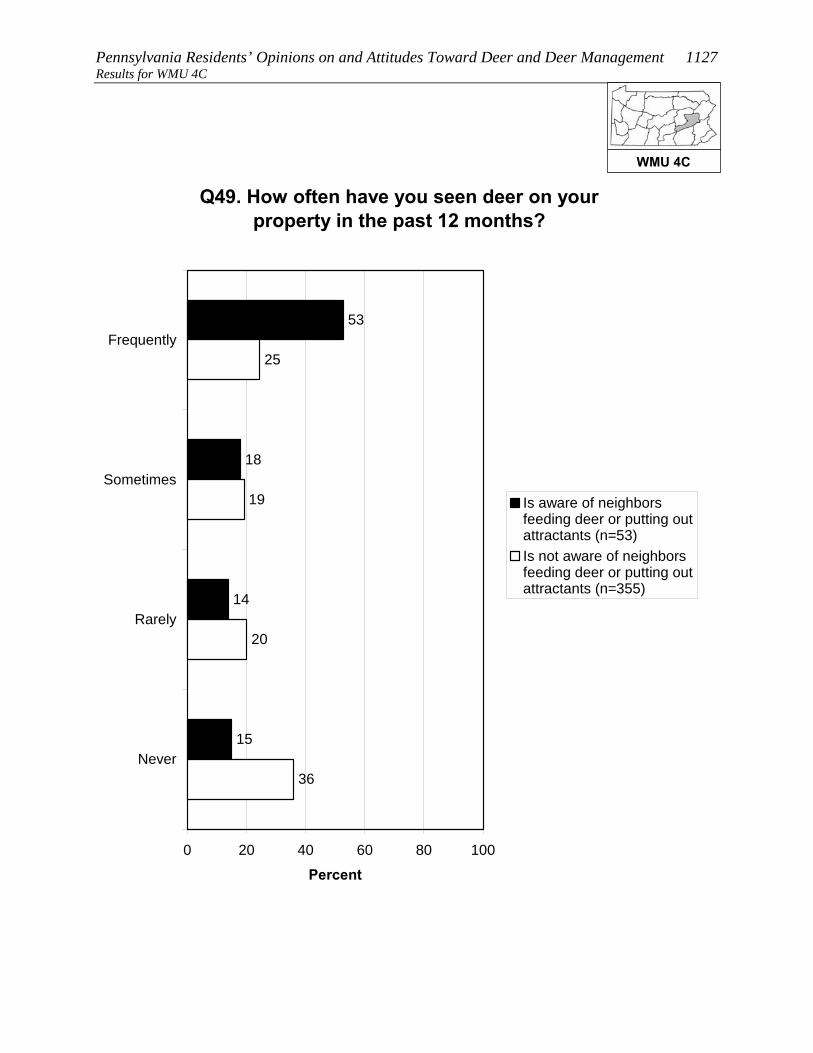
Pennsylvania Residents’ Opinions on and Attitudes Toward Deer and Deer Management 1127 Results for WMU 4C
Q49. How often have you seen deer on your property in the past 12 months?
53
18
14
15
20
19
25
36
0 20 40 60 80 100
Frequently
Sometimes
Rarely
Never
Percent
Is aware of neighborsfeeding deer or putting outattractants (n=53)Is not aware of neighborsfeeding deer or putting outattractants (n=355)
WMU 4C

1128 Responsive Management Results for WMU 4C
Q43. In the past 12 months, have you experienced any problems with deer at your primary place of
residence?
10
90
0 20 40 60 80 100
Yes
No
Percent (n=416)
WMU 4C

Pennsylvania Residents’ Opinions on and Attitudes Toward Deer and Deer Management 1129 Results for WMU 4C
Q43. In the past 12 months, have you experienced any problems with deer at your primary place of
residence?
10
90
90
10
0 20 40 60 80 100
Yes
No
Percent
Fed birds on his / herproperty in the past 12months (n=196)Did not feed birds on his /her property in the past 12months (n=220)
WMU 4C

1130 Responsive Management Results for WMU 4C
Q43. In the past 12 months, have you experienced any problems with deer at your primary place of
residence?
22
78
92
8
0 20 40 60 80 100
Yes
No
Percent
Is aware of neighborsfeeding deer or putting outattractants (n=53)Is not aware of neighborsfeeding deer or putting outattractants (n=355)
WMU 4C

Pennsylvania Residents’ Opinions on and Attitudes Toward Deer and Deer Management 1131 Results for WMU 4C
Q44. In the past 12 months, have you or any other person living in your immediate household been in a vehicle collision with or an accident involving a
deer on Pennsylvania's roads or highways?
8
92
0 20 40 60 80 100
Yes
No
Percent (n=416)
WMU 4C

1132 Responsive Management Results for WMU 4C
Q45. Were you or anyone else injured? (Asked of those who had a household member who was in or
who have personally been in a vehicle collision with or an accident involving a deer on
Pennsylvania's roads or highways in the past 12 months.)
6
94
0 20 40 60 80 100
Yes
No
Percent (n=34)
WMU 4C

Pennsylvania Residents’ Opinions on and Attitudes Toward Deer and Deer Management 1133 Results for WMU 4C
Q46. In the past 12 months, have you or any other person living in your immediate household been
diagnosed by a physician with a tick-borne disease, such as Lyme disease?
5
94
1
0 20 40 60 80 100
Yes
No
Don't know
Percent (n=416)
WMU 4C

1134 Responsive Management Results for WMU 4C
FEEDING WILDLIFE AND HUNTING DEER Several questions asked about feeding wildlife.
• Feeding deer or putting out deer attractants: 12% of residents of
WMU 4C did this, and 13% are aware of neighbors who did this.
o The most typical feeds or attractants put out by respondents are salt/mineral blocks,
corn, and apples.
• Feeding birds: 49% of residents of WMU 4C did this.
There is no consensus on whether it is okay for private citizens to feed or attract deer in
Pennsylvania: 44% agree that this is okay, but 44% disagree (the rest are neutral).
Just under a third of residents of WMU 4C (31%) consider themselves to be a hunter, about
two-thirds of whom have a Pennsylvania hunting license.
• Among residents of WMU 4C who live in a single-family home, 9% personally hunt
deer on their property.
• A large majority of residents of WMU 4C (79%) say that they, family members, and/or
friends hunt.
WMU 4C

Pennsylvania Residents’ Opinions on and Attitudes Toward Deer and Deer Management 1135 Results for WMU 4C
Q50. Did you ever feed deer intentionally or put out attractants, such as a salt or mineral block, in the
past 12 months?
12
88
0 20 40 60 80 100
Yes
No
Percent (n=416)
WMU 4C

1136 Responsive Management Results for WMU 4C
Q55. Are you aware of any of your neighbors feeding deer intentionally or trying to attract deer
on their property in the past 12 months?
13
86
1
0 20 40 60 80 100
Yes
No
Don't know
Percent (n=416)
WMU 4C

Pennsylvania Residents’ Opinions on and Attitudes Toward Deer and Deer Management 1137 Results for WMU 4C
Q53. What type of feed or attractant did you use? (Asked of those who fed deer intentionally or put
out attractants in the past 12 months.)
1
2
3
48
38
14
7
4
3
6
0 20 40 60 80 100
Salt / mineral block
Corn
Apples
Other food products
Pellets / commercial feed
Bread
Other
Food plot
Horse feed
Don't know
Mul
tiple
Res
pons
es A
llow
ed
Percent (n=52)
WMU 4C

1138 Responsive Management Results for WMU 4C
Q48. Did you feed birds or make birdfeed available on your property in the past 12 months?
49
51
0 20 40 60 80 100
Yes
No
Percent (n=416)
WMU 4C

Pennsylvania Residents’ Opinions on and Attitudes Toward Deer and Deer Management 1139 Results for WMU 4C
Q56. Do you agree or disagree that it is OK for private citizens to feed or attract deer in
Pennsylvania?
21
23
10
16
28
2
0 20 40 60 80 100
Strongly agree
Moderately agree
Neither agree nordisagree
Moderatelydisagree
Strongly disagree
Don't know
Percent (n=416)
WMU 4C

1140 Responsive Management Results for WMU 4C
Q59. Do you personally hunt deer on your property? (Asked of those whose primary place of
residence is a single-family home.)
9
91
0 20 40 60 80 100
Yes
No
Percent (n=369)
WMU 4C
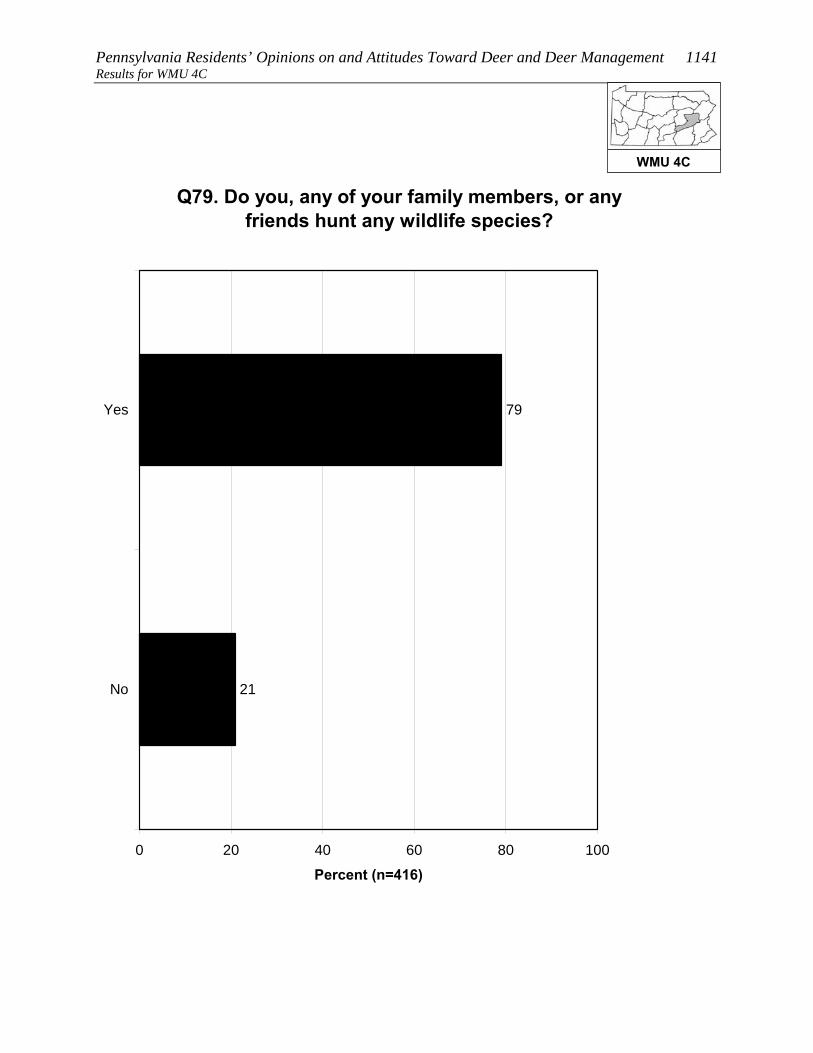
Pennsylvania Residents’ Opinions on and Attitudes Toward Deer and Deer Management 1141 Results for WMU 4C
Q79. Do you, any of your family members, or any friends hunt any wildlife species?
79
21
0 20 40 60 80 100
Yes
No
Percent (n=416)
WMU 4C
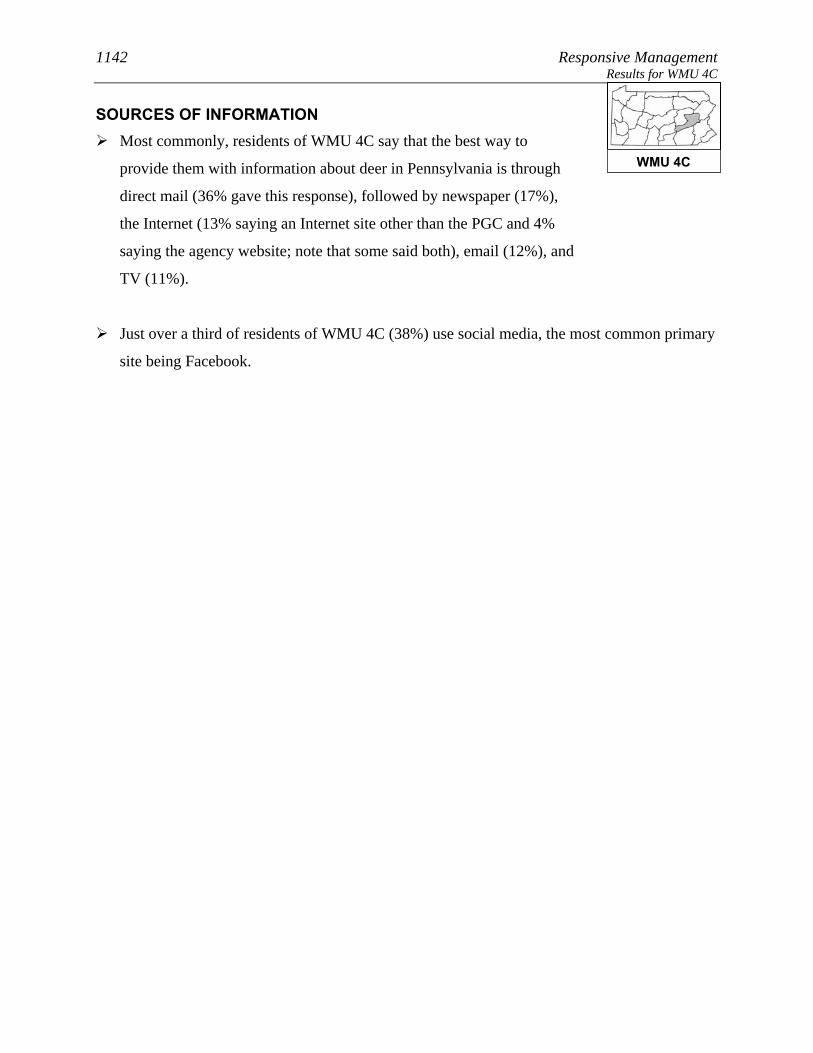
1142 Responsive Management Results for WMU 4C
SOURCES OF INFORMATION Most commonly, residents of WMU 4C say that the best way to
provide them with information about deer in Pennsylvania is through
direct mail (36% gave this response), followed by newspaper (17%),
the Internet (13% saying an Internet site other than the PGC and 4%
saying the agency website; note that some said both), email (12%), and
TV (11%).
Just over a third of residents of WMU 4C (38%) use social media, the most common primary
site being Facebook.
WMU 4C

Pennsylvania Residents’ Opinions on and Attitudes Toward Deer and Deer Management 1143 Results for WMU 4C
Q82. What is the best way to provide you with information about deer in Pennsylvania? We are not sending out information at this time; we are
just measuring interest.
2
3
4
36
17
13
12
11
4
2
2
1
10
0 20 40 60 80 100
Direct mail
Newspaper
Internet / website other thanPGC website
TV
Brochures or pamphlets
PA Game Commission website
Magazines
Radio
PA Hunting and Trapping Digest
Public presentations
Telephone
Don't know
Mul
tiple
Res
pons
es A
llow
ed
Percent (n=416)
WMU 4C
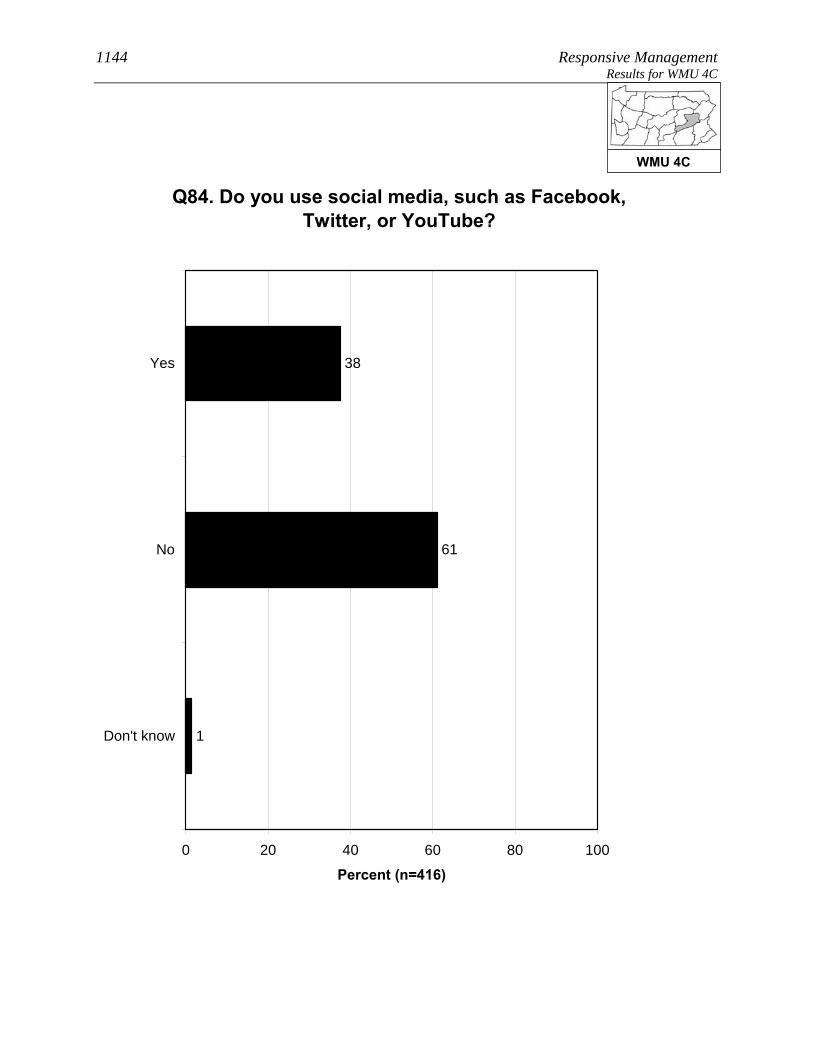
1144 Responsive Management Results for WMU 4C
Q84. Do you use social media, such as Facebook, Twitter, or YouTube?
38
61
1
0 20 40 60 80 100
Yes
No
Don't know
Percent (n=416)
WMU 4C
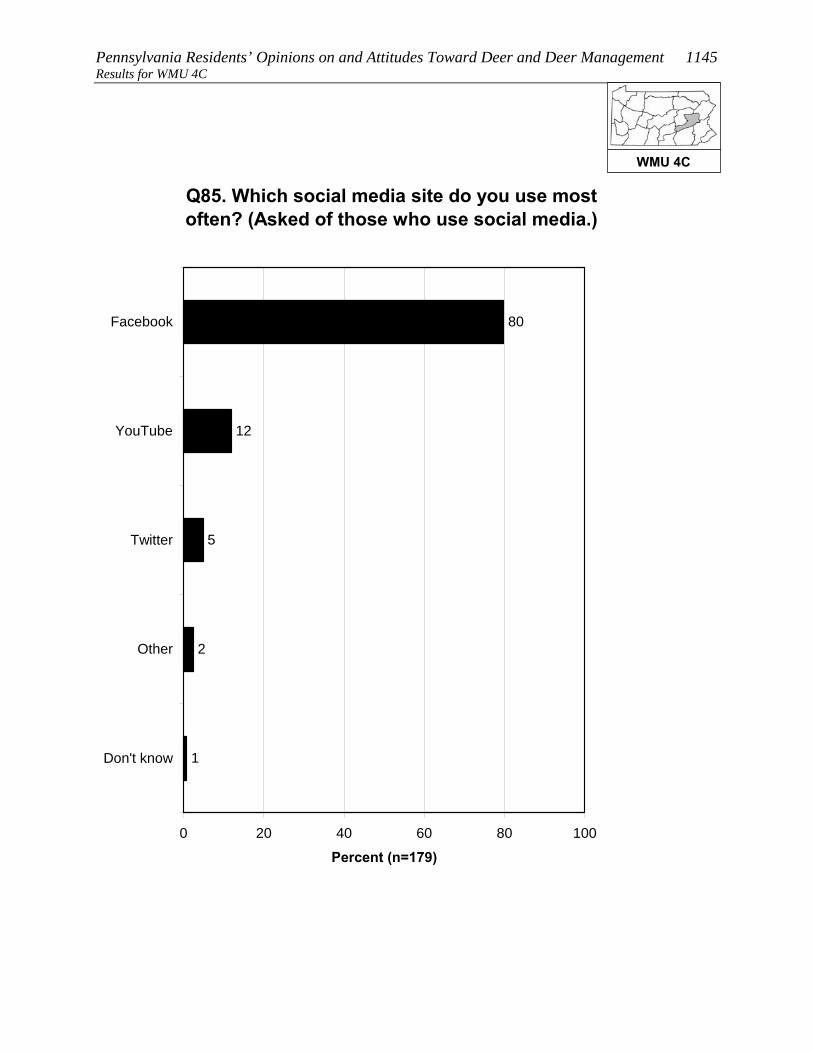
Pennsylvania Residents’ Opinions on and Attitudes Toward Deer and Deer Management 1145 Results for WMU 4C
Q85. Which social media site do you use most often? (Asked of those who use social media.)
80
12
5
2
1
0 20 40 60 80 100
YouTube
Other
Don't know
Percent (n=179)
WMU 4C
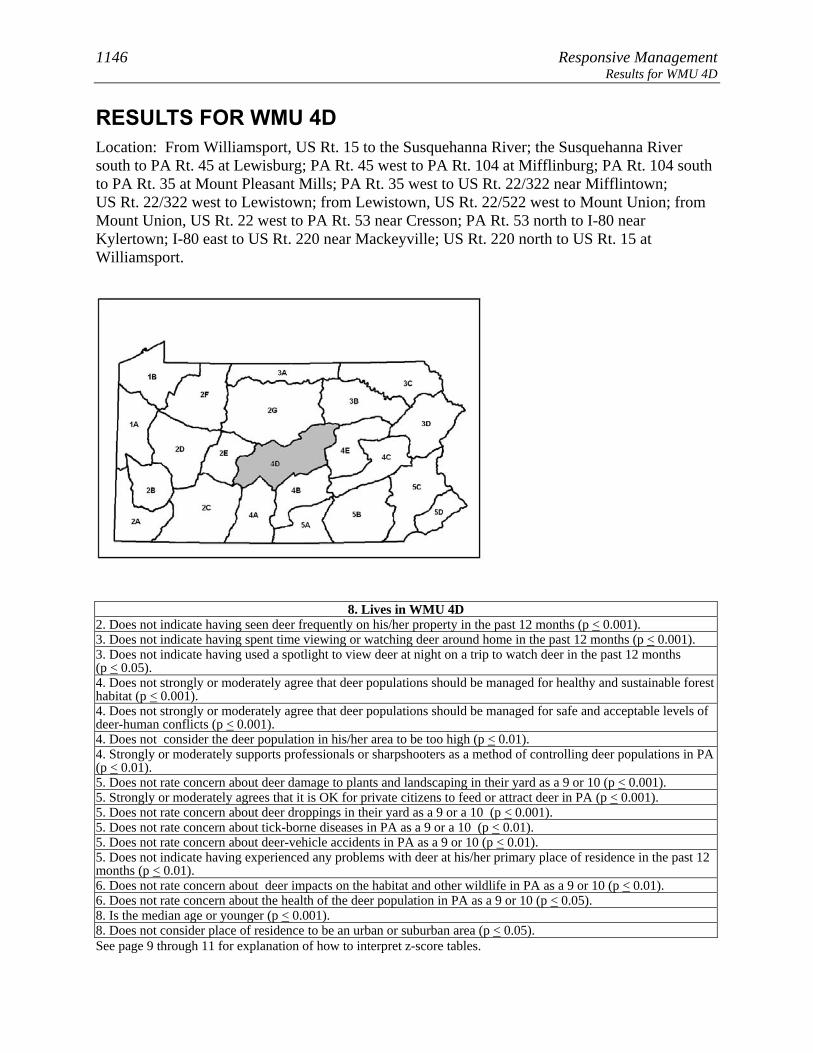
1146 Responsive Management Results for WMU 4D
RESULTS FOR WMU 4D Location: From Williamsport, US Rt. 15 to the Susquehanna River; the Susquehanna River south to PA Rt. 45 at Lewisburg; PA Rt. 45 west to PA Rt. 104 at Mifflinburg; PA Rt. 104 south to PA Rt. 35 at Mount Pleasant Mills; PA Rt. 35 west to US Rt. 22/322 near Mifflintown; US Rt. 22/322 west to Lewistown; from Lewistown, US Rt. 22/522 west to Mount Union; from Mount Union, US Rt. 22 west to PA Rt. 53 near Cresson; PA Rt. 53 north to I-80 near Kylertown; I-80 east to US Rt. 220 near Mackeyville; US Rt. 220 north to US Rt. 15 at Williamsport.
8. Lives in WMU 4D 2. Does not indicate having seen deer frequently on his/her property in the past 12 months (p < 0.001). 3. Does not indicate having spent time viewing or watching deer around home in the past 12 months (p < 0.001). 3. Does not indicate having used a spotlight to view deer at night on a trip to watch deer in the past 12 months (p < 0.05). 4. Does not strongly or moderately agree that deer populations should be managed for healthy and sustainable forest habitat (p < 0.001). 4. Does not strongly or moderately agree that deer populations should be managed for safe and acceptable levels of deer-human conflicts (p < 0.001). 4. Does not consider the deer population in his/her area to be too high (p < 0.01). 4. Strongly or moderately supports professionals or sharpshooters as a method of controlling deer populations in PA (p < 0.01). 5. Does not rate concern about deer damage to plants and landscaping in their yard as a 9 or 10 (p < 0.001). 5. Strongly or moderately agrees that it is OK for private citizens to feed or attract deer in PA (p < 0.001). 5. Does not rate concern about deer droppings in their yard as a 9 or a 10 (p < 0.001). 5. Does not rate concern about tick-borne diseases in PA as a 9 or a 10 (p < 0.01). 5. Does not rate concern about deer-vehicle accidents in PA as a 9 or 10 (p < 0.01). 5. Does not indicate having experienced any problems with deer at his/her primary place of residence in the past 12 months (p < 0.01). 6. Does not rate concern about deer impacts on the habitat and other wildlife in PA as a 9 or 10 (p < 0.01). 6. Does not rate concern about the health of the deer population in PA as a 9 or 10 (p < 0.05). 8. Is the median age or younger (p < 0.001). 8. Does not consider place of residence to be an urban or suburban area (p < 0.05). See page 9 through 11 for explanation of how to interpret z-score tables.
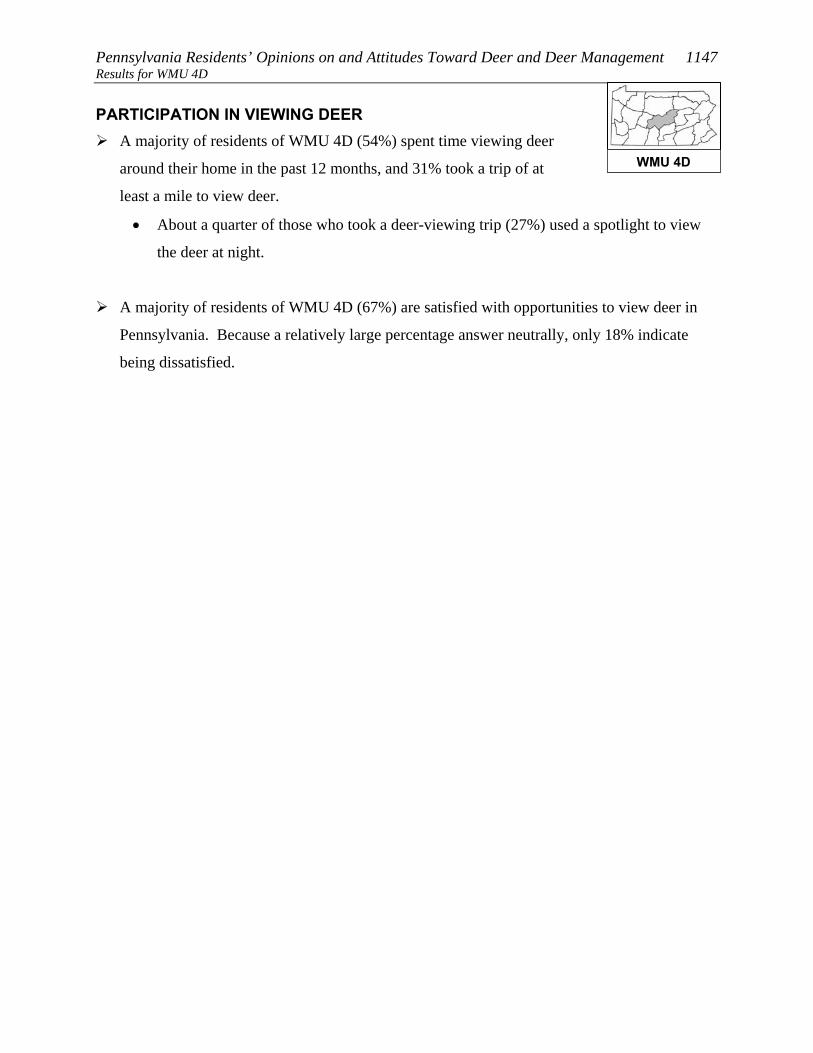
Pennsylvania Residents’ Opinions on and Attitudes Toward Deer and Deer Management 1147 Results for WMU 4D PARTICIPATION IN VIEWING DEER
A majority of residents of WMU 4D (54%) spent time viewing deer
around their home in the past 12 months, and 31% took a trip of at
least a mile to view deer.
• About a quarter of those who took a deer-viewing trip (27%) used a spotlight to view
the deer at night.
A majority of residents of WMU 4D (67%) are satisfied with opportunities to view deer in
Pennsylvania. Because a relatively large percentage answer neutrally, only 18% indicate
being dissatisfied.
WMU 4D

1148 Responsive Management Results for WMU 4D
Q10. Have you spent time viewing or watching deer around your home in the past 12 months?
54
46
0 20 40 60 80 100
Yes
No
Percent (n=414)
WMU 4D

Pennsylvania Residents’ Opinions on and Attitudes Toward Deer and Deer Management 1149 Results for WMU 4D
Q11. Have you taken a trip at least 1 mile from your home for the primary purpose of viewing or
watching deer in the past 12 months?
31
69
0 20 40 60 80 100
Yes
No
Percent (n=414)
WMU 4D

1150 Responsive Management Results for WMU 4D
Q12. Did you use a spotlight to view deer at night on a trip to watch deer in the past 12 months?
(Asked of those who took a trip at least 1 mile from their home for the primary purpose of viewing or
watching deer in the past 12 months.)
27
73
0 20 40 60 80 100
Yes
No
Percent (n=140)
WMU 4D

Pennsylvania Residents’ Opinions on and Attitudes Toward Deer and Deer Management 1151 Results for WMU 4D
Q13. How satisfied are you with opportunities to view or watch deer in Pennsylvania?
35
32
11
9
9
4
0 20 40 60 80 100
Very satisfied
Somewhatsatisfied
Neither satisfiednor dissatisfied
Somewhatdissatisfied
Very dissatisfied
Don't know
Percent (n=414)
WMU 4D
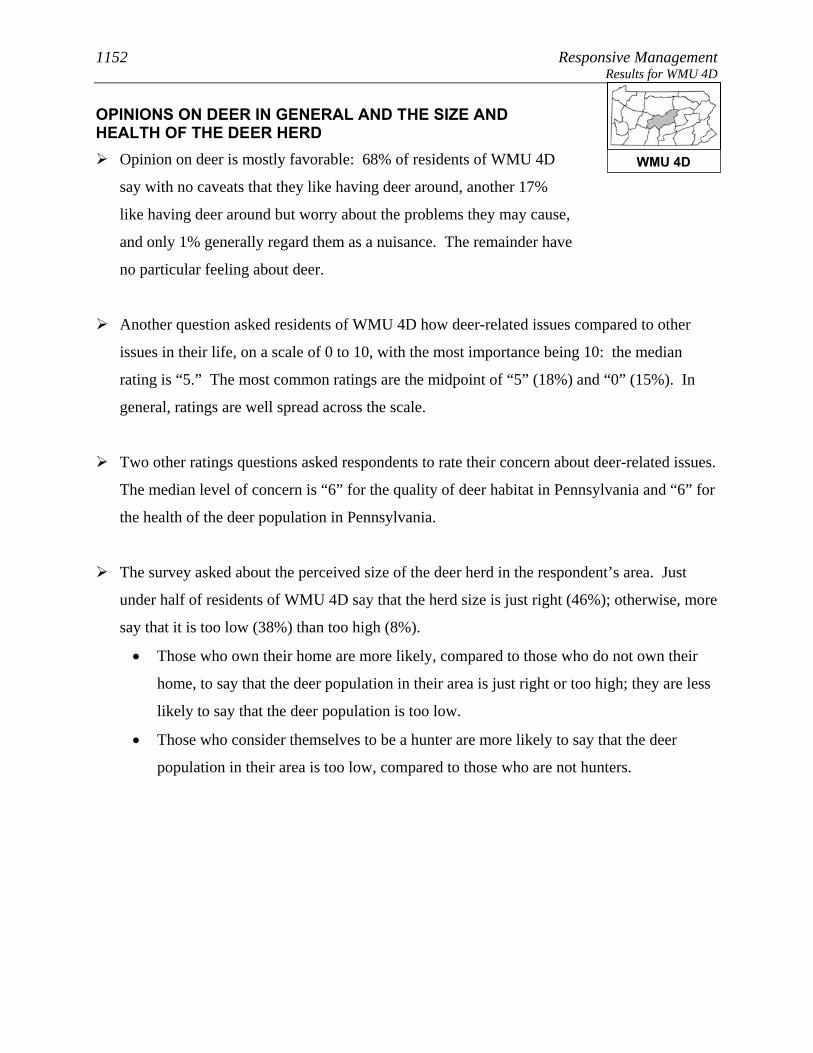
1152 Responsive Management Results for WMU 4D
OPINIONS ON DEER IN GENERAL AND THE SIZE AND HEALTH OF THE DEER HERD
Opinion on deer is mostly favorable: 68% of residents of WMU 4D
say with no caveats that they like having deer around, another 17%
like having deer around but worry about the problems they may cause,
and only 1% generally regard them as a nuisance. The remainder have
no particular feeling about deer.
Another question asked residents of WMU 4D how deer-related issues compared to other
issues in their life, on a scale of 0 to 10, with the most importance being 10: the median
rating is “5.” The most common ratings are the midpoint of “5” (18%) and “0” (15%). In
general, ratings are well spread across the scale.
Two other ratings questions asked respondents to rate their concern about deer-related issues.
The median level of concern is “6” for the quality of deer habitat in Pennsylvania and “6” for
the health of the deer population in Pennsylvania.
The survey asked about the perceived size of the deer herd in the respondent’s area. Just
under half of residents of WMU 4D say that the herd size is just right (46%); otherwise, more
say that it is too low (38%) than too high (8%).
• Those who own their home are more likely, compared to those who do not own their
home, to say that the deer population in their area is just right or too high; they are less
likely to say that the deer population is too low.
• Those who consider themselves to be a hunter are more likely to say that the deer
population in their area is too low, compared to those who are not hunters.
WMU 4D

Pennsylvania Residents’ Opinions on and Attitudes Toward Deer and Deer Management 1153 Results for WMU 4D
Q14. Generally, which of the following best describes your feelings about deer in
Pennsylvania?
68
17
1
12
2
0 20 40 60 80 100
I like having deeraround
I like having deeraround but worryabout problems
they cause
I generally regarddeer as a nuisance
I have no particularfeeling about deer
Don't know
Percent (n=414)
WMU 4D
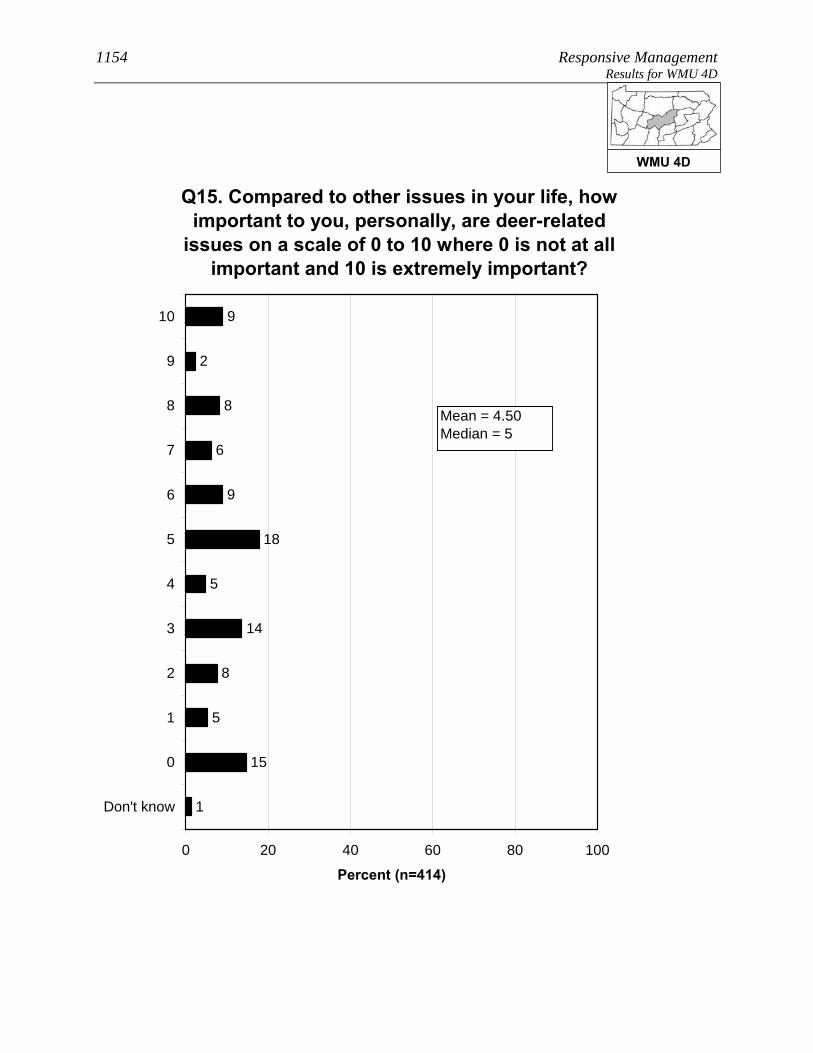
1154 Responsive Management Results for WMU 4D
Q15. Compared to other issues in your life, how important to you, personally, are deer-related
issues on a scale of 0 to 10 where 0 is not at all important and 10 is extremely important?
8
14
5
9
2
8
6
9
18
5
15
1
0 20 40 60 80 100
10
9
8
7
6
5
4
3
2
1
0
Don't know
Percent (n=414)
Mean = 4.50Median = 5
WMU 4D
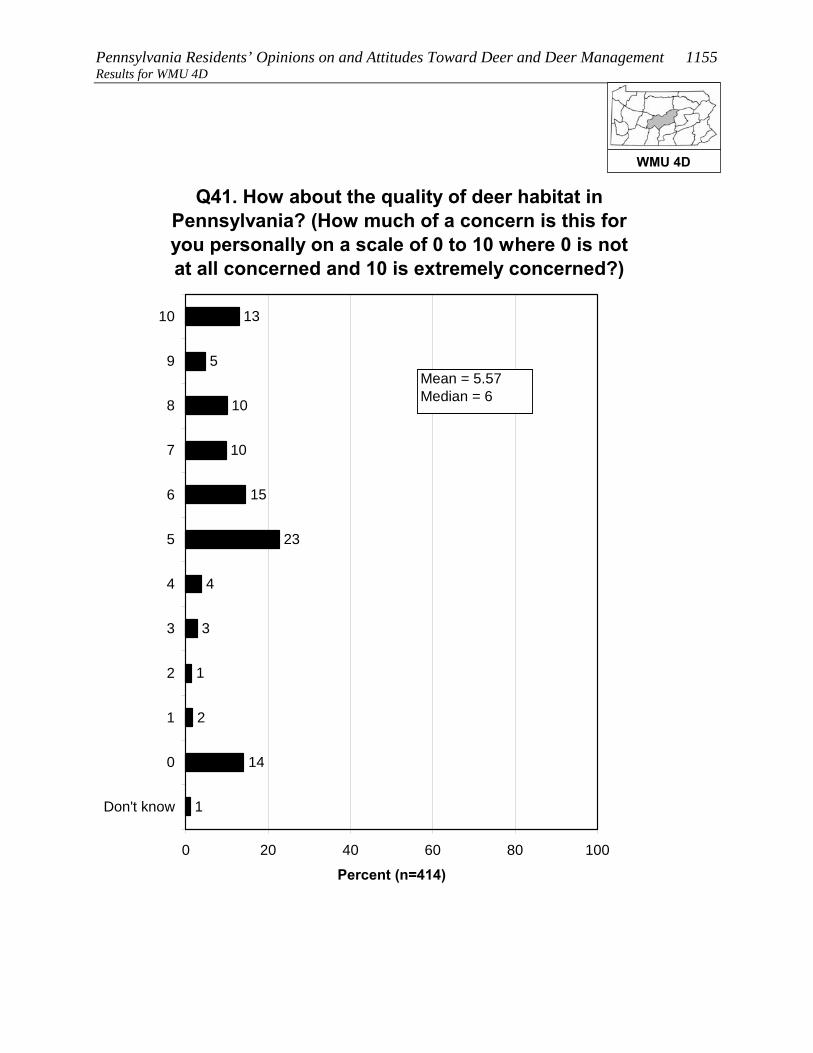
Pennsylvania Residents’ Opinions on and Attitudes Toward Deer and Deer Management 1155 Results for WMU 4D
Q41. How about the quality of deer habitat in Pennsylvania? (How much of a concern is this for you personally on a scale of 0 to 10 where 0 is not at all concerned and 10 is extremely concerned?)
1
3
4
13
5
10
10
15
23
2
14
1
0 20 40 60 80 100
10
9
8
7
6
5
4
3
2
1
0
Don't know
Percent (n=414)
Mean = 5.57Median = 6
WMU 4D
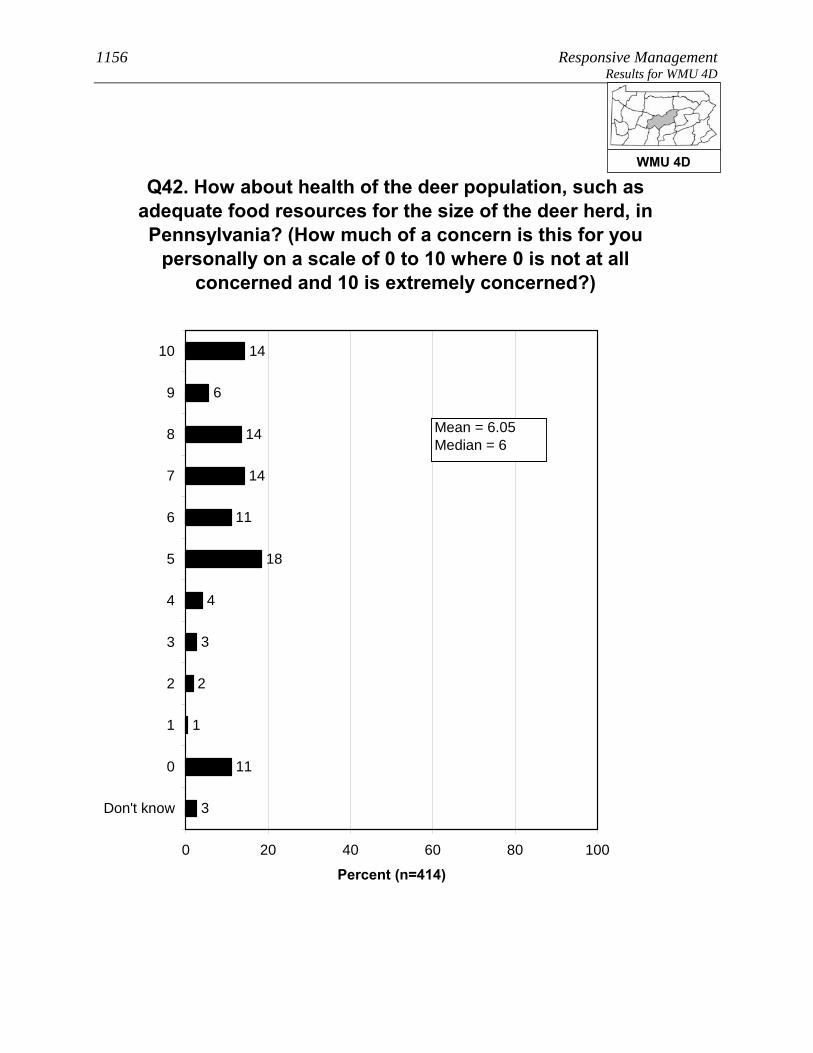
1156 Responsive Management Results for WMU 4D
2
3
4
14
6
14
14
11
18
1
11
3
0 20 40 60 80 100
10
9
8
7
6
5
4
3
2
1
0
Don't know
Percent (n=414)
Q42. How about health of the deer population, such as adequate food resources for the size of the deer herd, in Pennsylvania? (How much of a concern is this for you
personally on a scale of 0 to 10 where 0 is not at all concerned and 10 is extremely concerned?)
Mean = 6.05Median = 6
WMU 4D

Pennsylvania Residents’ Opinions on and Attitudes Toward Deer and Deer Management 1157 Results for WMU 4D
Q16. In your opinion, is the deer population in the area where you live too high, just right, or too low?
8
46
38
8
0 20 40 60 80 100
Too high
Just right
Too low
Don't know
Percent (n=414)
WMU 4D
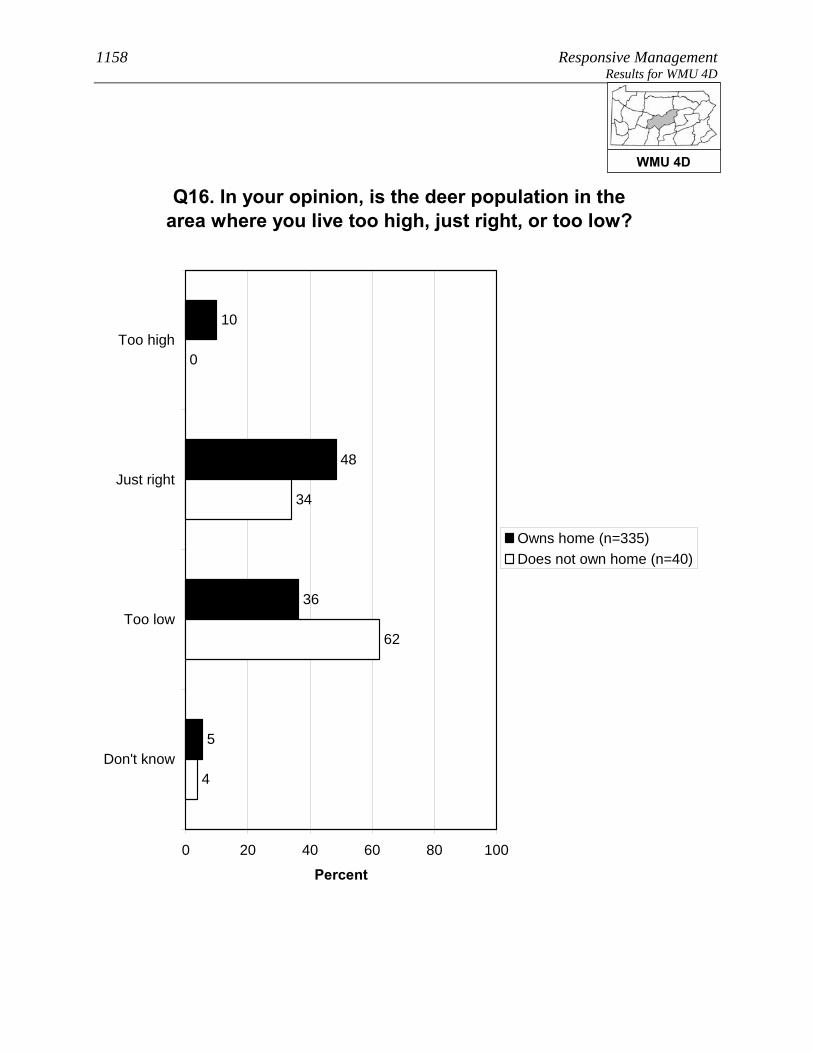
1158 Responsive Management Results for WMU 4D
Q16. In your opinion, is the deer population in the area where you live too high, just right, or too low?
10
48
36
5
62
34
0
4
0 20 40 60 80 100
Too high
Just right
Too low
Don't know
Percent
Owns home (n=335)Does not own home (n=40)
WMU 4D

Pennsylvania Residents’ Opinions on and Attitudes Toward Deer and Deer Management 1159 Results for WMU 4D
Q16. In your opinion, is the deer population in the area where you live too high, just right, or too low?
3
25
69
3
22
56
11
11
0 20 40 60 80 100
Too high
Just right
Too low
Don't know
Percent
Consider themselves ahunter (n=167)Do not consider themselvesa hunter (n=244)
WMU 4D
1160 Responsive Management Results for WMU 4D
OPINIONS ON MANAGEMENT EFFORTS AND MANAGEMENT GOALS
The survey asked about three deer population management goals. For
all three, a large majority agree with the management goal: 81% agree
with managing the deer for a healthy and sustainable forest habitat,
91% agree with managing for healthy and sustainable deer
populations, and 76% agree with managing for safe, acceptable levels
of deer-human conflicts.
Residents of WMU 4D who said that the deer population in their area is too high or too low
were asked to indicate the reasonable number of years it should take to achieve an acceptable
deer population. The median amount is 4 years. While 30% said that they do not know,
nearly all the rest gave a number of years of 10 or less. Note that this is only among those
who said the deer population was too high or too low.
• Because management plans typically look at a time frame of about 10 years to effect
change, the survey specifically asked if these respondents would be willing to wait
more than 10 years to achieve an acceptable deer population: just over half (51%)
indicated that they would be willing to wait that long.
WMU 4D

Pennsylvania Residents’ Opinions on and Attitudes Toward Deer and Deer Management 1161 Results for WMU 4D
Q24-26. Deer populations should be managed for the following. (Do you agree or disagree with this
deer management goal?)
46
35
4
10
3
2
2
35
56
2
2
2
10
36
40
5
6
3
0 20 40 60 80 100
Stronglyagree
Moderatelyagree
Neither agreenor disagree
Moderatelydisagree
Stronglydisagree
Don't know
Percent (n=414)
Healthy and sustainableforest habitatHealthy and sustainabledeer populationsSafe and acceptable levelsof deer-human conflicts
WMU 4D
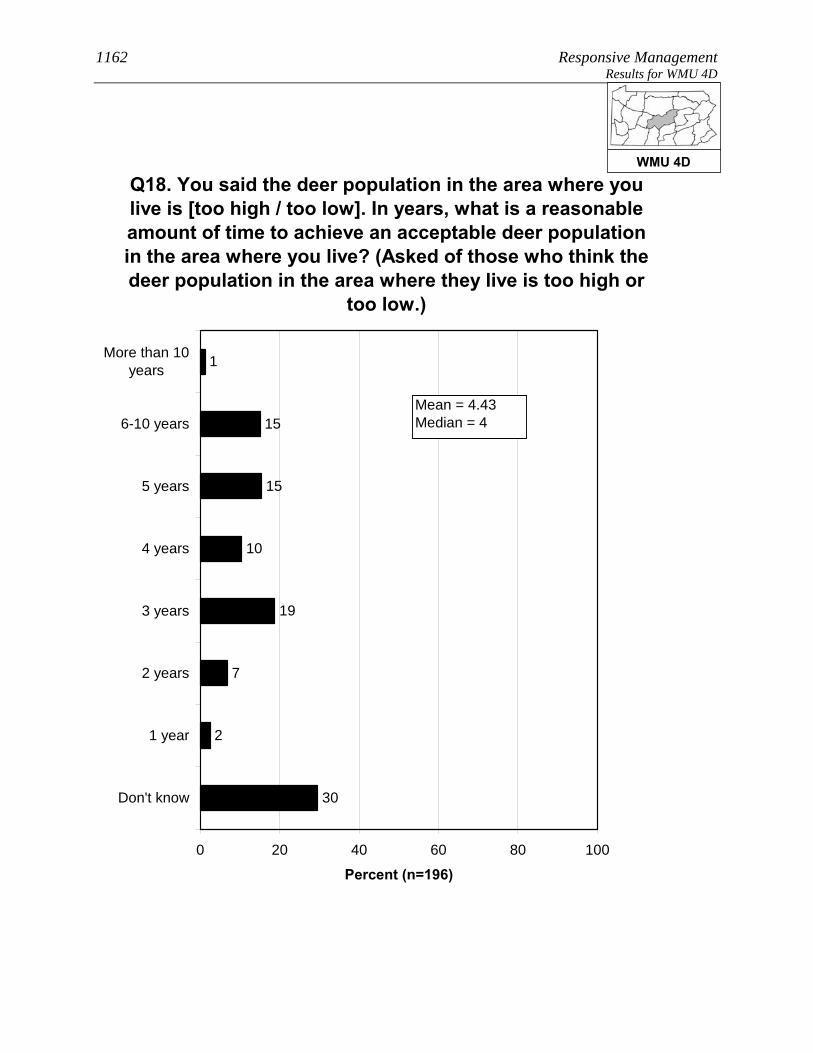
1162 Responsive Management Results for WMU 4D
30
2
1
15
15
10
19
7
0 20 40 60 80 100
More than 10years
6-10 years
5 years
4 years
3 years
2 years
1 year
Don't know
Percent (n=196)
Q18. You said the deer population in the area where you live is [too high / too low]. In years, what is a reasonable amount of time to achieve an acceptable deer population in the area where you live? (Asked of those who think thedeer population in the area where they live is too high or
too low.)
Mean = 4.43Median = 4
WMU 4D

Pennsylvania Residents’ Opinions on and Attitudes Toward Deer and Deer Management 1163 Results for WMU 4D
Q21. Would you be willing to wait more than 10 years to achieve an acceptable deer population in the area where you live? (Among those who think the deer population in the area where they live is
too high or too low.)
51
44
5
0 20 40 60 80 100
Yes
No
Don't know
Percent (n=196)
WMU 4D

1164 Responsive Management Results for WMU 4D
OPINIONS ON METHODS FOR MANAGING DEER, INCLUDING HUNTING
A large majority of residents of WMU 4D (65%) support lethal
methods to manage deer populations in Pennsylvania; nonetheless,
27% oppose.
• Those residents of WMU 4D who live in a single-family home and own their home are
less likely to support lethal methods, compared to those who live in a single-family
home but do not own their home.
• The survey asked about four methods of controlling deer populations (three of them
lethal). The most support is for legal, regulated hunting (91% of respondents support
this method), distantly followed by fertility/birth control (37%), professionals or
sharpshooters (37%), and trapping and killing (25%).
Two questions asked respondents about hunting on their land (among those who live in a
single-family home), the first question about hunting by the respondents themselves (13% do
so) and the second regarding allowing others to hunt on their land (20% do so). In
combining the results, 23% of residents of WMU 4D who live in a single-family home either
hunt on their own land or allow others to do so (it is not simply a sum of the two questions
because some hunt on their property and allow others to do so as well).
• There was interest in seeing how a particular subgroup responded on this question, the
subgroup being those who live in a single-family home; who live on 1 acre or less; and
who live in an urban, suburban area, or a small city/town. Among this subgroup, 8%
either hunt on their own property or allow others to hunt on the property.
• Those respondents who do not allow hunting on their property were asked to indicate
why they prohibit it. The most common reasons are that they live in an urban or
suburban area in which hunting is not possible or feasible and/or that their property is
too small. Other minor reasons are concerns about safety and/or a general opposition
to hunting.
• Those same respondents who do not allow hunting on their property were asked about
their likelihood of ever allowing others to hunt deer on their property; they
overwhelmingly say this is very unlikely (95%). They were then asked if there is
WMU 4D

Pennsylvania Residents’ Opinions on and Attitudes Toward Deer and Deer Management 1165 Results for WMU 4D
anything that would make them more likely to allow deer hunting;
they are almost unanimous (97%) in saying that there is nothing
that would make them more likely to allow deer hunting.
• The question about allowing others to hunt on their property was examined among the
subgroup previously discussed (those who live in a single-family home; who live on 1
acre or less; and who live in an urban, suburban area, or a small city/town). Among
this group who got the question, nearly all say that they would never allow hunting.
o Additional follow-up questions to be asked of those who indicated that something
might prompt them to allow hunting on their property did not have enough
respondents for statistical validity; therefore, they are not shown.
WMU 4D
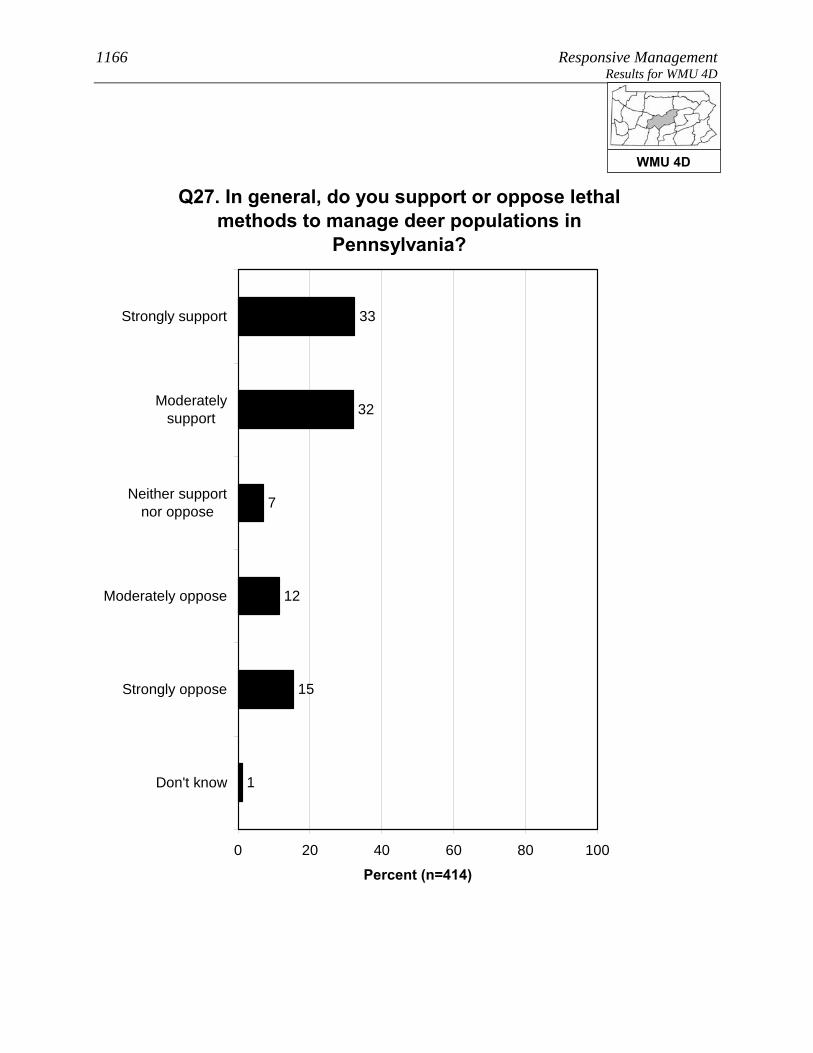
1166 Responsive Management Results for WMU 4D
Q27. In general, do you support or oppose lethal methods to manage deer populations in
Pennsylvania?
33
32
7
12
15
1
0 20 40 60 80 100
Strongly support
Moderatelysupport
Neither supportnor oppose
Moderately oppose
Strongly oppose
Don't know
Percent (n=414)
WMU 4D

Pennsylvania Residents’ Opinions on and Attitudes Toward Deer and Deer Management 1167 Results for WMU 4D
Q27. In general, do you support or oppose lethal methods to manage deer populations in
Pennsylvania?
36
29
7
14
13
1
11
43
34
3
7
1
0 20 40 60 80 100
Stronglysupport
Moderatelysupport
Neithersupport nor
oppose
Moderatelyoppose
Stronglyoppose
Don't know
Percent
Owns home (n=335)Does not own home (n=40)
WMU 4D
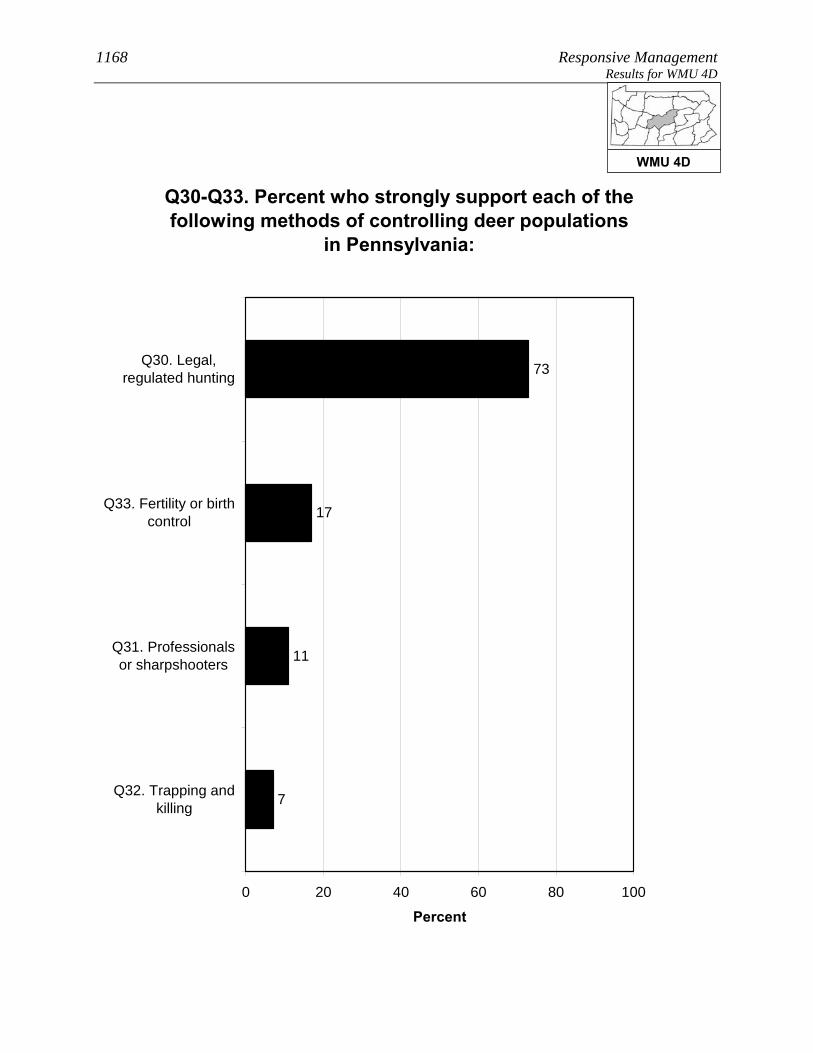
1168 Responsive Management Results for WMU 4D
Q30-Q33. Percent who strongly support each of the following methods of controlling deer populations
in Pennsylvania:
7
11
17
73
0 20 40 60 80 100
Q30. Legal,regulated hunting
Q33. Fertility or birthcontrol
Q31. Professionalsor sharpshooters
Q32. Trapping andkilling
Percent
WMU 4D
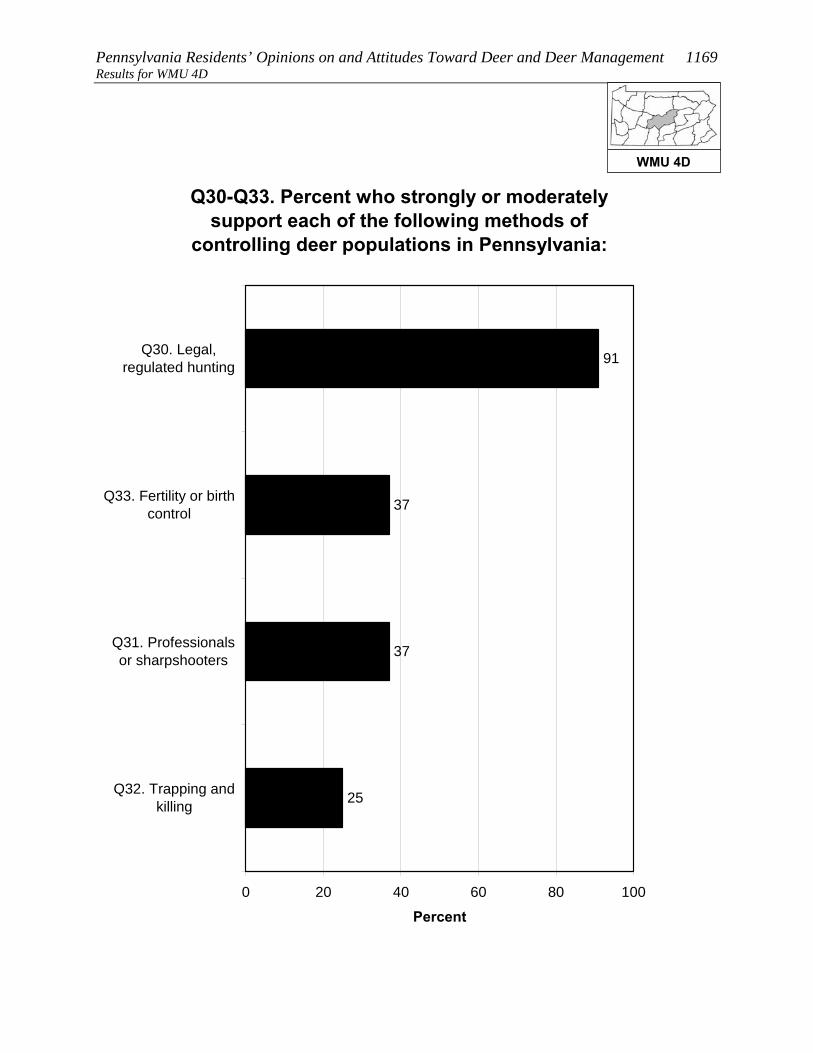
Pennsylvania Residents’ Opinions on and Attitudes Toward Deer and Deer Management 1169 Results for WMU 4D
Q30-Q33. Percent who strongly or moderately support each of the following methods of
controlling deer populations in Pennsylvania:
25
37
37
91
0 20 40 60 80 100
Q30. Legal,regulated hunting
Q33. Fertility or birthcontrol
Q31. Professionalsor sharpshooters
Q32. Trapping andkilling
Percent
WMU 4D

1170 Responsive Management Results for WMU 4D
Q30-Q33. Percent who strongly or moderately oppose each of the following methods of
controlling deer populations in Pennsylvania:
7
54
57
72
0 20 40 60 80 100
Q32. Trapping andkilling
Q31. Professionalsor sharpshooters
Q33. Fertility or birthcontrol
Q30. Legal,regulated hunting
Percent
WMU 4D
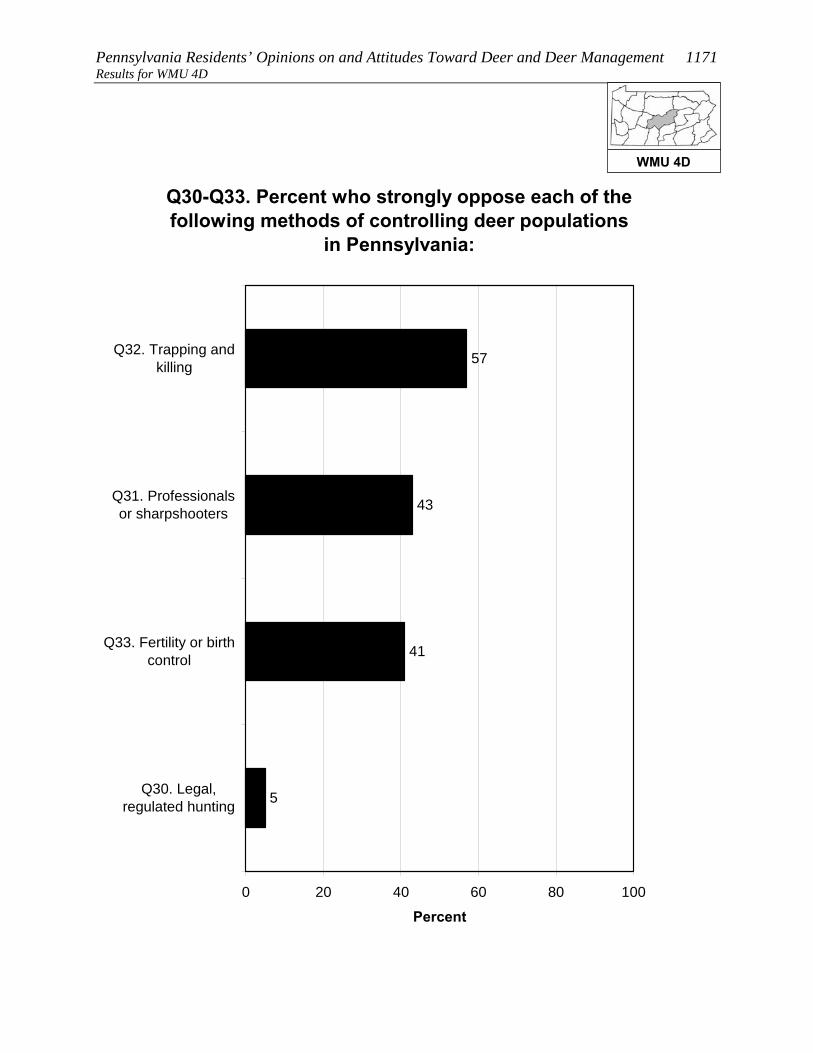
Pennsylvania Residents’ Opinions on and Attitudes Toward Deer and Deer Management 1171 Results for WMU 4D
Q30-Q33. Percent who strongly oppose each of the following methods of controlling deer populations
in Pennsylvania:
5
41
43
57
0 20 40 60 80 100
Q32. Trapping andkilling
Q31. Professionalsor sharpshooters
Q33. Fertility or birthcontrol
Q30. Legal,regulated hunting
Percent
WMU 4D

1172 Responsive Management Results for WMU 4D
Q59/60. Deer hunts and/or allows others to deer hunt on property. (Among respondents living in a
single-family home.)
23
77
0 20 40 60 80 100
Yes
No
Percent (n=375)
WMU 4D

Pennsylvania Residents’ Opinions on and Attitudes Toward Deer and Deer Management 1173 Results for WMU 4D
Q59/60. Deer hunts and/or allows others to deer hunt on property. (Among respondents living in a
single-family home.)
8
92
0 20 40 60 80 100
Yes
No
Percent
Lives in a single familyhome on 1 acre or less inan urban area, a suburbanarea, or a small city/town(n=150)
WMU 4D
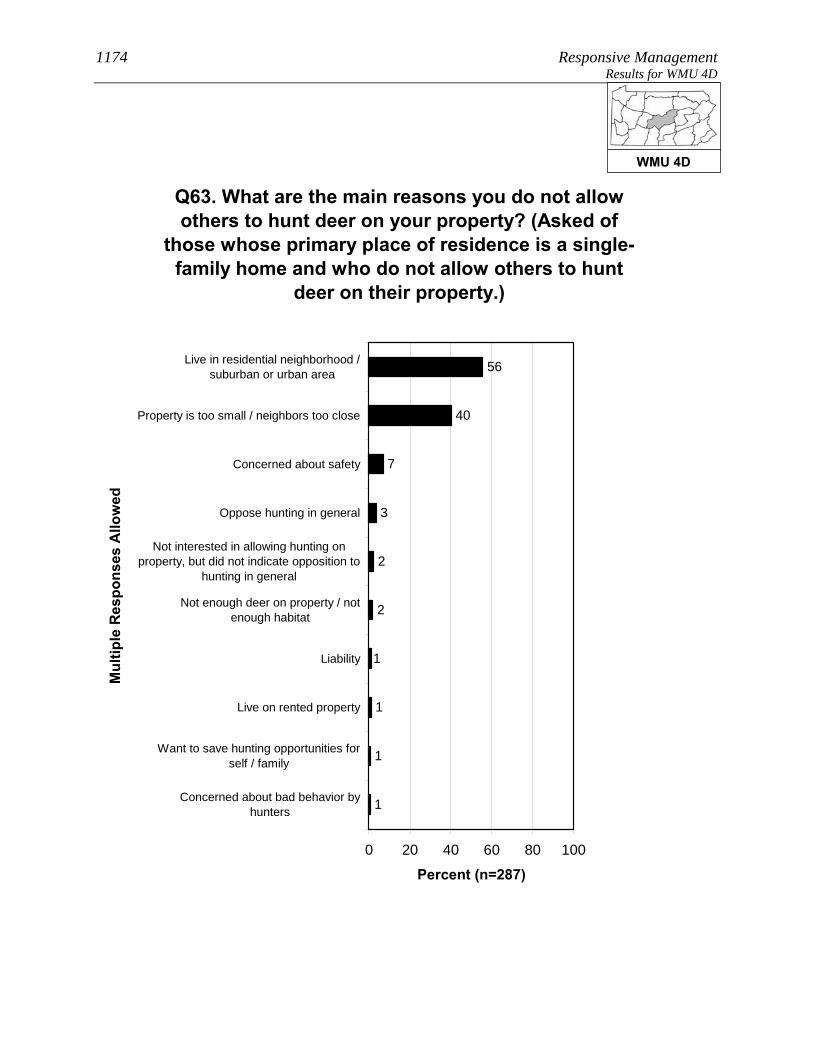
1174 Responsive Management Results for WMU 4D
Q63. What are the main reasons you do not allow others to hunt deer on your property? (Asked of
those whose primary place of residence is a single-family home and who do not allow others to hunt
deer on their property.)
1
1
1
56
40
7
3
2
2
1
0 20 40 60 80 100
Live in residential neighborhood /suburban or urban area
Property is too small / neighbors too close
Concerned about safety
Oppose hunting in general
Not interested in allowing hunting onproperty, but did not indicate opposition to
hunting in general
Not enough deer on property / notenough habitat
Liability
Live on rented property
Want to save hunting opportunities forself / family
Concerned about bad behavior byhunters
Mul
tiple
Res
pons
es A
llow
ed
Percent (n=287)
WMU 4D

Pennsylvania Residents’ Opinions on and Attitudes Toward Deer and Deer Management 1175 Results for WMU 4D
Q65. How likely are you to ever allow others to deer hunt on your property? (Asked of those whose
primary place of residence is a single-family home and who do not allow others to hunt deer on their
property.)
2
1
2
95
1
0 20 40 60 80 100
Very likely
Somewhat likely
Somewhat unlikely
Very unlikely
Don't know
Percent (n=287)
WMU 4D

1176 Responsive Management Results for WMU 4D
Q66. Is there anything that would make you more likely to allow deer hunting on your property?
(Asked of those whose primary place of residence is a single-family home and who do not allow
others to hunt deer on their property.)
2
97
1
0 20 40 60 80 100
Yes
No
Don't know
Percent (n=287)
WMU 4D
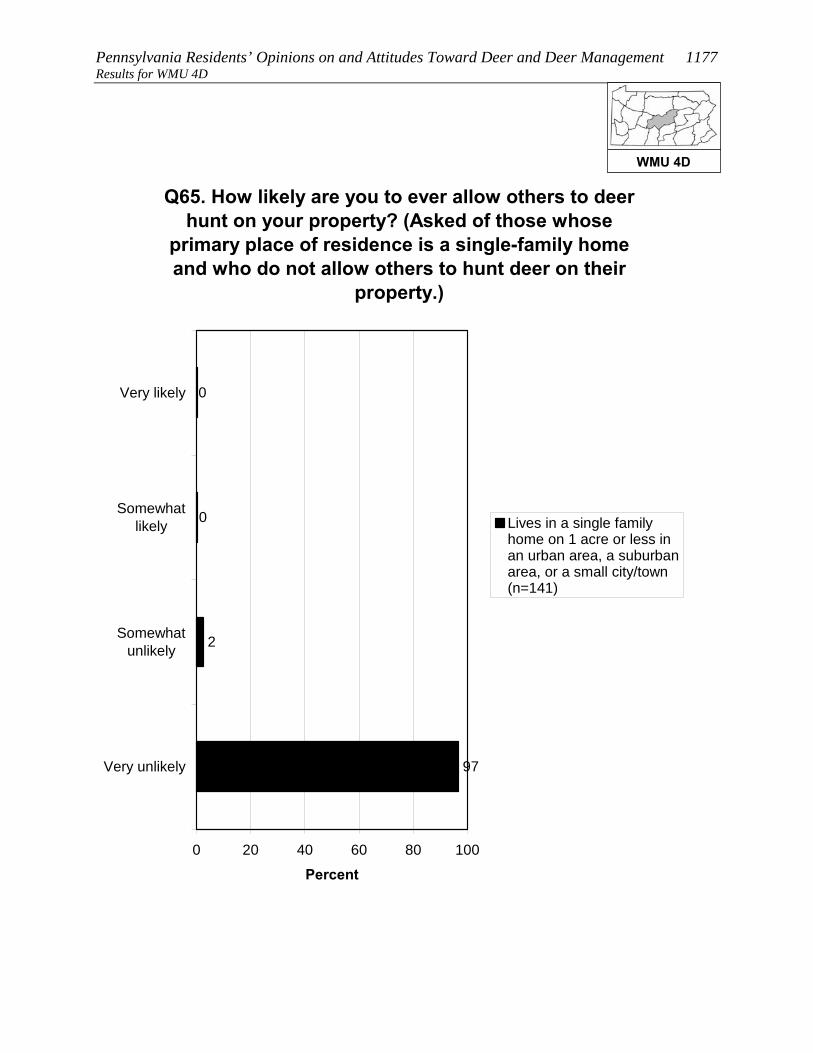
Pennsylvania Residents’ Opinions on and Attitudes Toward Deer and Deer Management 1177 Results for WMU 4D
Q65. How likely are you to ever allow others to deer hunt on your property? (Asked of those whose
primary place of residence is a single-family home and who do not allow others to hunt deer on their
property.)
0
0
2
97
0 20 40 60 80 100
Very likely
Somewhatlikely
Somewhatunlikely
Very unlikely
Percent
Lives in a single familyhome on 1 acre or less inan urban area, a suburbanarea, or a small city/town(n=141)
WMU 4D

1178 Responsive Management Results for WMU 4D
CONCERNS ABOUT DEER AND DEER NUISANCE PROBLEMS Seven questions asked about respondents’ level of concern about
issues associated with deer. For each issue, respondents rated their
level of concern about it using a 10-point scale, with 10 being the most
concerned.
• The most concern was for tick-borne diseases (mean rating of 7.2), followed by three
whose means are fairly close to one another: deer-vehicle accidents (6.1), the health of
the deer population (6.0), and the quality of deer habitat (5.6).
• At the bottom are concern about deer impacts on habitat and other wildlife (even
though this can be considerable) (3.3) and the two impacts to residents’ landscaping:
deer damage to plants and landscaping (1.5) and deer droppings in the yard (0.8).
o Another graph shows the percentage who gave a high rating (a “9” or “10”),
providing an idea of the percentage who feel strongly about the issues.
Among residents of WMU 4D, 52% indicated that they saw deer on their property in the past
12 months.
• Respondents who fed birds were more likely to indicate seeing deer, as were
respondents who fed deer or put out attractants or were aware of neighbors who fed
deer or put out attractants.
The survey asked about specific nuisance problems with deer that residents of WMU 4D may
have experienced: 6% indicated that they experienced problems with deer at their primary
place of residence in the past 12 months; 17% indicated that they or another household
member had been in a vehicle collision with a deer (fortunately, a very low portion of
drivers/passengers were injured); and 4% indicated that they or a household member had
been diagnosed with a tick-borne disease.
• Crosstabulations show that those who fed birds were about the same as those who had
not fed birds regarding experiencing deer problems, as were those who were aware of
neighbors feeding deer or putting out attractants versus those who did not indicate
being aware that neighbors fed deer.
WMU 4D
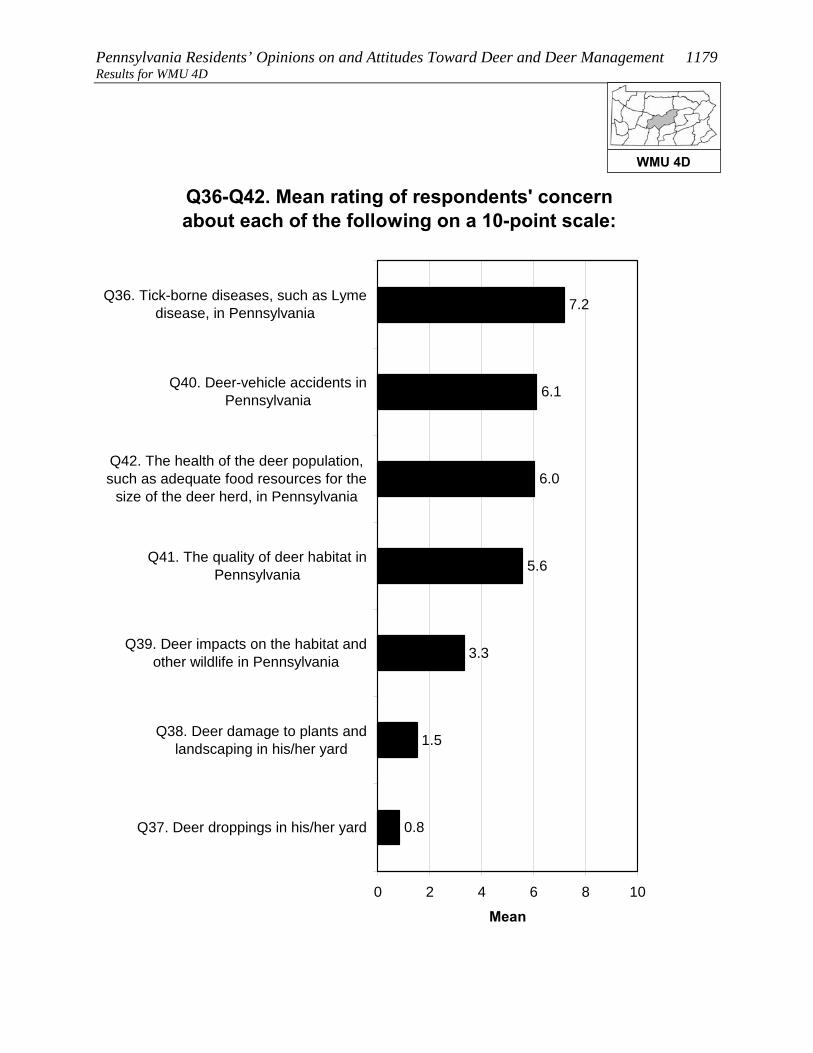
Pennsylvania Residents’ Opinions on and Attitudes Toward Deer and Deer Management 1179 Results for WMU 4D
Q36-Q42. Mean rating of respondents' concern about each of the following on a 10-point scale:
1.5
3.3
5.6
6.0
6.1
7.2
0.8
0 2 4 6 8 10
Q36. Tick-borne diseases, such as Lymedisease, in Pennsylvania
Q40. Deer-vehicle accidents inPennsylvania
Q42. The health of the deer population,such as adequate food resources for the
size of the deer herd, in Pennsylvania
Q41. The quality of deer habitat inPennsylvania
Q39. Deer impacts on the habitat andother wildlife in Pennsylvania
Q38. Deer damage to plants andlandscaping in his/her yard
Q37. Deer droppings in his/her yard
Mean
WMU 4D
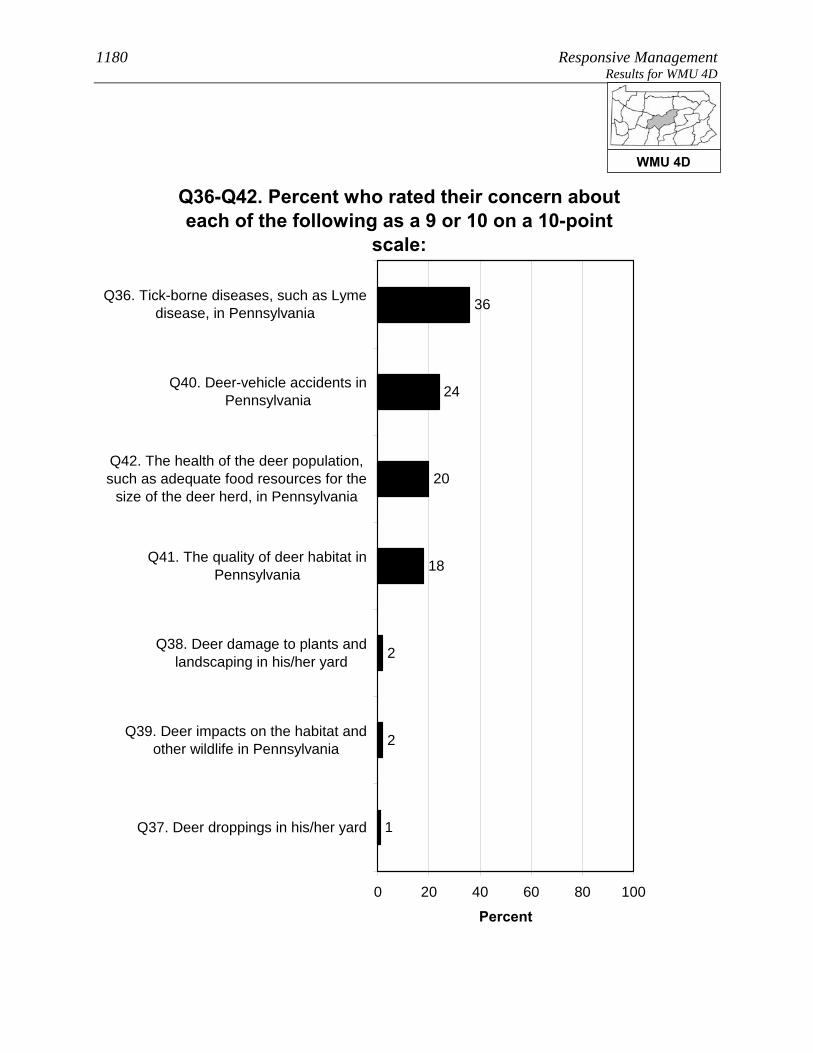
1180 Responsive Management Results for WMU 4D
Q36-Q42. Percent who rated their concern about each of the following as a 9 or 10 on a 10-point
scale:
2
2
18
20
24
36
1
0 20 40 60 80 100
Q36. Tick-borne diseases, such as Lymedisease, in Pennsylvania
Q40. Deer-vehicle accidents inPennsylvania
Q42. The health of the deer population,such as adequate food resources for the
size of the deer herd, in Pennsylvania
Q41. The quality of deer habitat inPennsylvania
Q38. Deer damage to plants andlandscaping in his/her yard
Q39. Deer impacts on the habitat andother wildlife in Pennsylvania
Q37. Deer droppings in his/her yard
Percent
WMU 4D

Pennsylvania Residents’ Opinions on and Attitudes Toward Deer and Deer Management 1181 Results for WMU 4D
Q49. How often have you seen deer on your property in the past 12 months?
21
14
16
48
0 20 40 60 80 100
Frequently
Sometimes
Rarely
Never
Percent (n=414)
WMU 4D

1182 Responsive Management Results for WMU 4D
Q49. How often have you seen deer on your property in the past 12 months?
23
14
22
41
11
14
19
56
0 20 40 60 80 100
Frequently
Sometimes
Rarely
Never
Percent
Fed birds on his / herproperty in the past 12months (n=220)Did not feed birds on his /her property in the past 12months (n=194)
WMU 4D

Pennsylvania Residents’ Opinions on and Attitudes Toward Deer and Deer Management 1183 Results for WMU 4D
Q49. How often have you seen deer on your property in the past 12 months?
51
18
22
10
16
14
17
54
0 20 40 60 80 100
Frequently
Sometimes
Rarely
Never
Percent
Has fed deer or put outattractants in the past 12months (n=46)Has not fed deer or put outattractants in the past 12months (n=366)
WMU 4D

1184 Responsive Management Results for WMU 4D
Q49. How often have you seen deer on your property in the past 12 months?
62
9
13
16
17
13
17
53
0 20 40 60 80 100
Frequently
Sometimes
Rarely
Never
Percent
Is aware of neighborsfeeding deer or putting outattractants (n=44)Is not aware of neighborsfeeding deer or putting outattractants (n=365)
WMU 4D

Pennsylvania Residents’ Opinions on and Attitudes Toward Deer and Deer Management 1185 Results for WMU 4D
Q43. In the past 12 months, have you experienced any problems with deer at your primary place of
residence?
6
94
0 20 40 60 80 100
Yes
No
Percent (n=414)
WMU 4D
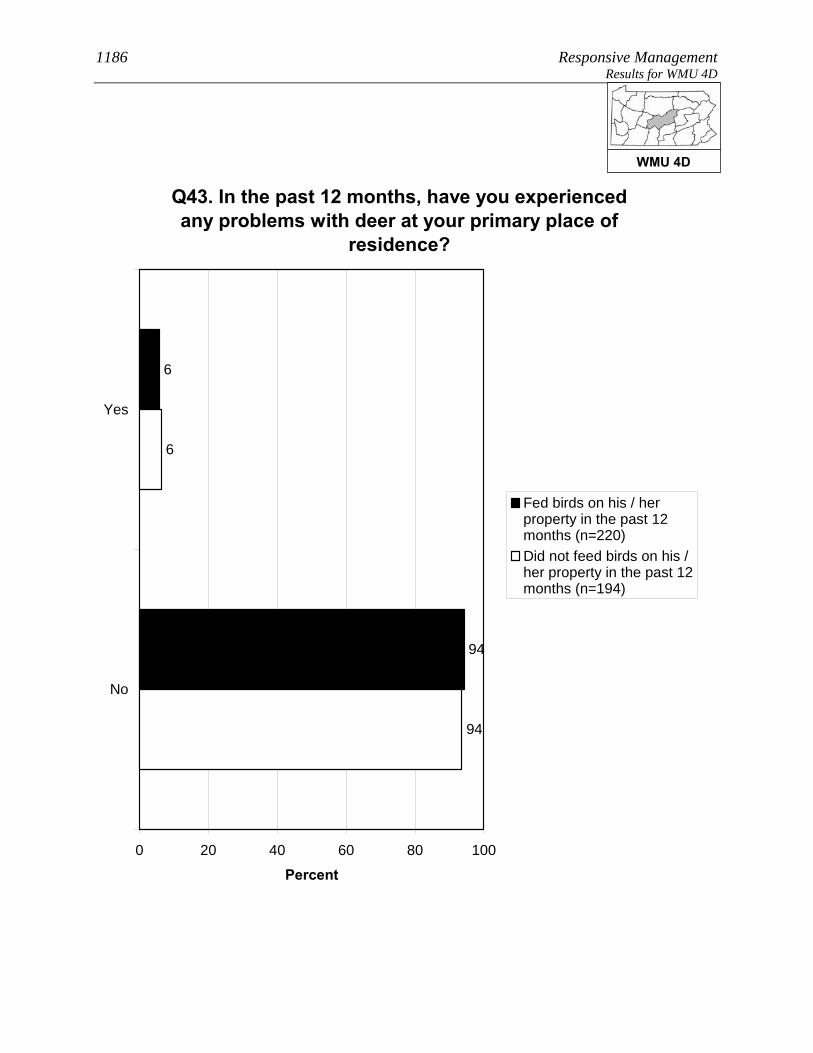
1186 Responsive Management Results for WMU 4D
Q43. In the past 12 months, have you experienced any problems with deer at your primary place of
residence?
6
94
94
6
0 20 40 60 80 100
Yes
No
Percent
Fed birds on his / herproperty in the past 12months (n=220)Did not feed birds on his /her property in the past 12months (n=194)
WMU 4D

Pennsylvania Residents’ Opinions on and Attitudes Toward Deer and Deer Management 1187 Results for WMU 4D
Q43. In the past 12 months, have you experienced any problems with deer at your primary place of
residence?
8
92
94
6
0 20 40 60 80 100
Yes
No
Percent
Is aware of neighborsfeeding deer or putting outattractants (n=44)Is not aware of neighborsfeeding deer or putting outattractants (n=365)
WMU 4D

1188 Responsive Management Results for WMU 4D
Q44. In the past 12 months, have you or any other person living in your immediate household been in a vehicle collision with or an accident involving a
deer on Pennsylvania's roads or highways?
17
82
Less than 1%
0 20 40 60 80 100
Yes
No
Don't know
Percent (n=414)
WMU 4D

Pennsylvania Residents’ Opinions on and Attitudes Toward Deer and Deer Management 1189 Results for WMU 4D
Q45. Were you or anyone else injured? (Asked of those who had a household member who was in or
who have personally been in a vehicle collision with or an accident involving a deer on
Pennsylvania's roads or highways in the past 12 months.)
4
96
0 20 40 60 80 100
Yes
No
Percent (n=70)
WMU 4D

1190 Responsive Management Results for WMU 4D
Q46. In the past 12 months, have you or any other person living in your immediate household been
diagnosed by a physician with a tick-borne disease, such as Lyme disease?
4
95
Less than 1%
0 20 40 60 80 100
Yes
No
Don't know
Percent (n=414)
WMU 4D
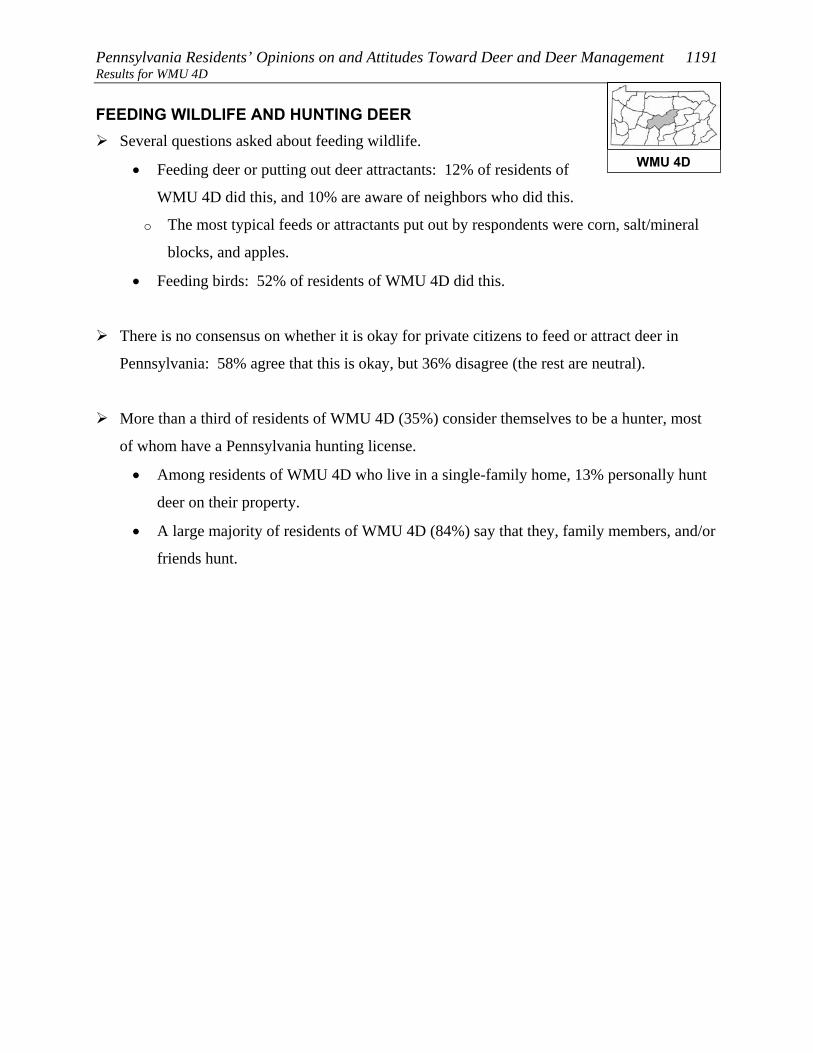
Pennsylvania Residents’ Opinions on and Attitudes Toward Deer and Deer Management 1191 Results for WMU 4D FEEDING WILDLIFE AND HUNTING DEER
Several questions asked about feeding wildlife.
• Feeding deer or putting out deer attractants: 12% of residents of
WMU 4D did this, and 10% are aware of neighbors who did this.
o The most typical feeds or attractants put out by respondents were corn, salt/mineral
blocks, and apples.
• Feeding birds: 52% of residents of WMU 4D did this.
There is no consensus on whether it is okay for private citizens to feed or attract deer in
Pennsylvania: 58% agree that this is okay, but 36% disagree (the rest are neutral).
More than a third of residents of WMU 4D (35%) consider themselves to be a hunter, most
of whom have a Pennsylvania hunting license.
• Among residents of WMU 4D who live in a single-family home, 13% personally hunt
deer on their property.
• A large majority of residents of WMU 4D (84%) say that they, family members, and/or
friends hunt.
WMU 4D

1192 Responsive Management Results for WMU 4D
Q50. Did you ever feed deer intentionally or put out attractants, such as a salt or mineral block, in the
past 12 months?
12
88
0 20 40 60 80 100
Yes
No
Percent (n=414)
WMU 4D

Pennsylvania Residents’ Opinions on and Attitudes Toward Deer and Deer Management 1193 Results for WMU 4D
Q55. Are you aware of any of your neighbors feeding deer intentionally or trying to attract deer
on their property in the past 12 months?
10
88
2
0 20 40 60 80 100
Yes
No
Don't know
Percent (n=414)
WMU 4D
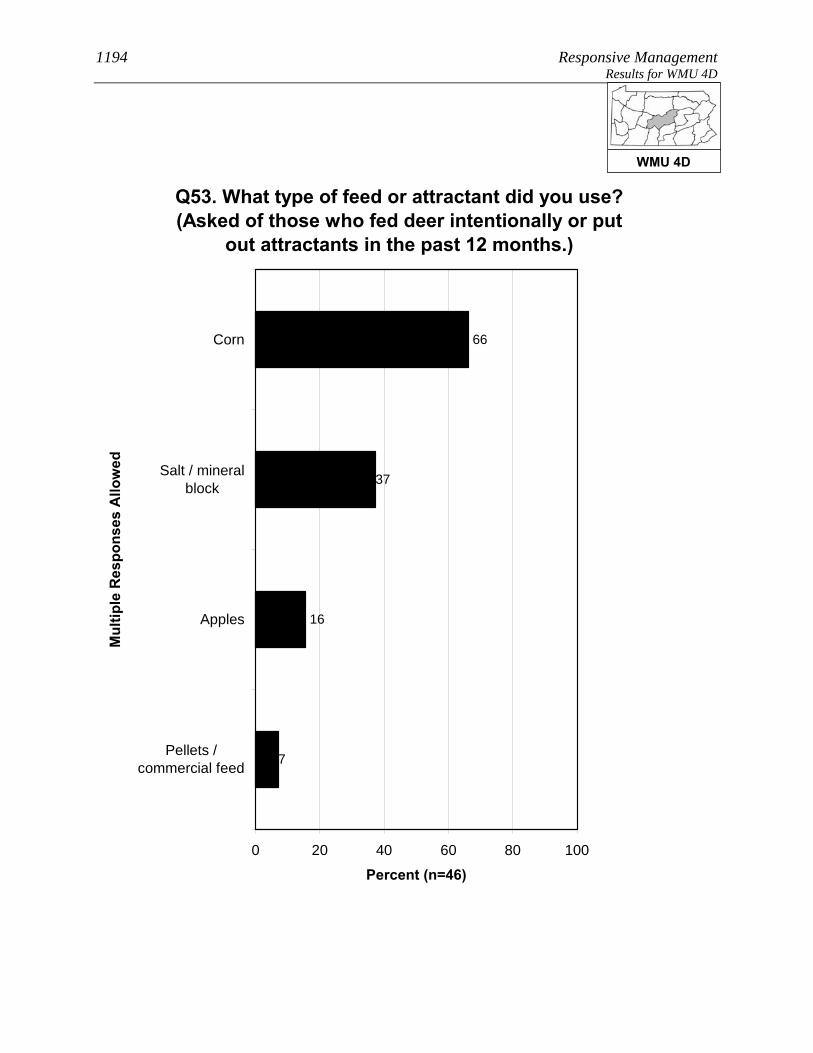
1194 Responsive Management Results for WMU 4D
Q53. What type of feed or attractant did you use? (Asked of those who fed deer intentionally or put
out attractants in the past 12 months.)
66
37
16
7
0 20 40 60 80 100
Corn
Salt / mineralblock
Apples
Pellets /commercial feed
Mul
tiple
Res
pons
es A
llow
ed
Percent (n=46)
WMU 4D

Pennsylvania Residents’ Opinions on and Attitudes Toward Deer and Deer Management 1195 Results for WMU 4D
Q48. Did you feed birds or make birdfeed available on your property in the past 12 months?
52
48
0 20 40 60 80 100
Yes
No
Percent (n=414)
WMU 4D

1196 Responsive Management Results for WMU 4D
Q56. Do you agree or disagree that it is OK for private citizens to feed or attract deer in
Pennsylvania?
22
36
5
18
18
1
0 20 40 60 80 100
Strongly agree
Moderately agree
Neither agree nordisagree
Moderatelydisagree
Strongly disagree
Don't know
Percent (n=414)
WMU 4D

Pennsylvania Residents’ Opinions on and Attitudes Toward Deer and Deer Management 1197 Results for WMU 4D
Q59. Do you personally hunt deer on your property? (Asked of those whose primary place of
residence is a single-family home.)
13
86
Less than 1%
0 20 40 60 80 100
Yes
No
Don't know
Percent (n=375)
WMU 4D
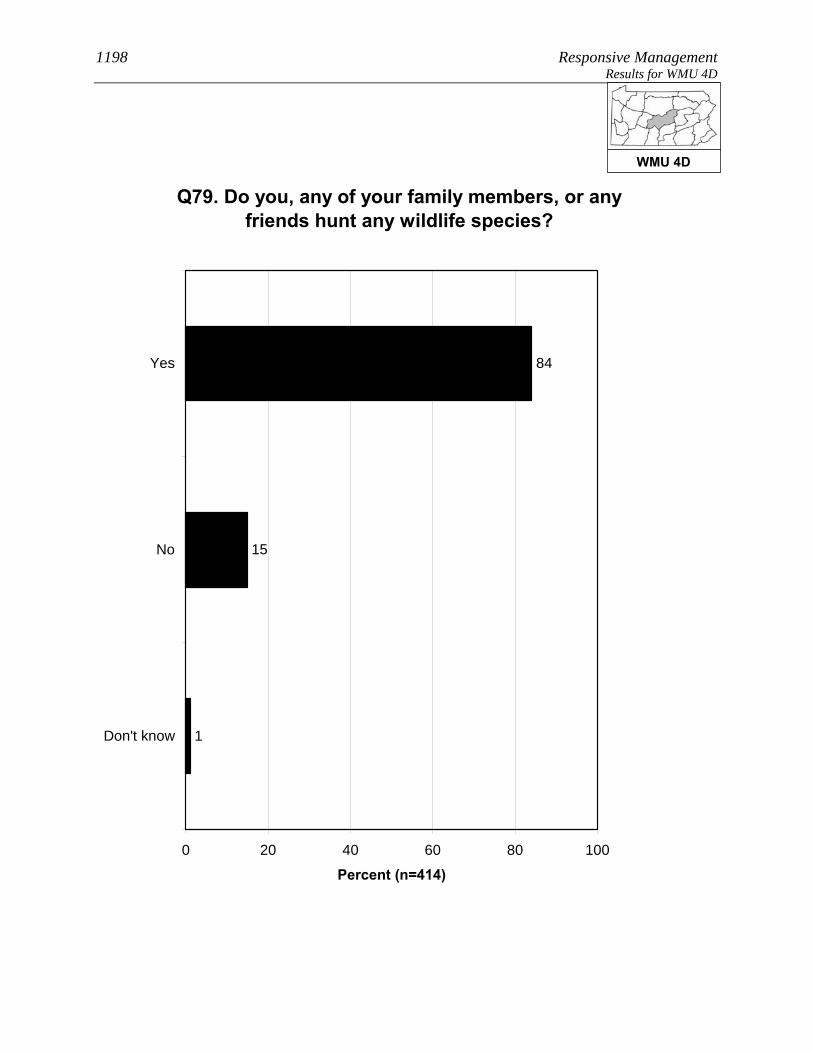
1198 Responsive Management Results for WMU 4D
Q79. Do you, any of your family members, or any friends hunt any wildlife species?
84
15
1
0 20 40 60 80 100
Yes
No
Don't know
Percent (n=414)
WMU 4D

Pennsylvania Residents’ Opinions on and Attitudes Toward Deer and Deer Management 1199 Results for WMU 4D SOURCES OF INFORMATION
Most commonly, residents of WMU 4D say that the best way to
provide them with information about deer in Pennsylvania is through
direct mail (36% gave this response), followed by email (17%),
newspaper (17%), and the Internet (15% saying an Internet site other
than the PGC and 4% saying the agency website; note that some said
both).
Somewhat under half of residents of WMU 4D (43%) use social media, the most common
primary site being Facebook.
WMU 4D

1200 Responsive Management Results for WMU 4D
Q82. What is the best way to provide you with information about deer in Pennsylvania? We are not sending out information at this time; we are
just measuring interest.
2
2
4
36
17
17
15
11
6
2
1
3
9
0 20 40 60 80 100
Direct mail
Newspaper
Internet / website other thanPGC website
TV
Brochures or pamphlets
PA Game Commissionwebsite
Magazines
Radio
PA Hunting and TrappingDigest
PA Game Commission offices
Other
Don't know
Mul
tiple
Res
pons
es A
llow
ed
Percent (n=414)
WMU 4D

Pennsylvania Residents’ Opinions on and Attitudes Toward Deer and Deer Management 1201 Results for WMU 4D
Q84. Do you use social media, such as Facebook, Twitter, or YouTube?
43
56
1
0 20 40 60 80 100
Yes
No
Don't know
Percent (n=414)
WMU 4D

1202 Responsive Management Results for WMU 4D
Q85. Which social media site do you use most often? (Asked of those who use social media.)
78
11
8
3
0 20 40 60 80 100
YouTube
Don't know
Percent (n=175)
WMU 4D
Pennsylvania Residents’ Opinions on and Attitudes Toward Deer and Deer Management 1203 Results for WMU 4E
RESULTS FOR WMU 4E Location: From Muncy, PA Rt. 405 east to PA Rt. 118 at Hughesville; PA Rt. 118 east to PA Rt. 29 near Pikes Creek; PA Rt. 29 south to I-81 near Nanticoke; I-81 south to I-80; I-80 west to PA Rt. 42 near Bloomsburg; PA Rt. 42 south to PA Rt. 61 at Centralia; PA Rt. 61 south to I-81 near Frackville; I-81 south to US Rt. 209 near Joliett; US Rt. 209 west to Millersburg Ferry; from Millersburg Ferry on the Susquehanna River north to a point directly east of the intersection of US Rts. 11 & 15 and PA Rt. 104; from this point, directly west to PA Rt. 104; PA Rt. 104 north to PA Rt. 45 at Mifflinburg; PA Rt. 45 east to the Susquehanna River; the Susquehanna River north to PA Rt. 405 at Muncy.
8. Lives in WMU 4E 3. Is very or somewhat satisfied with opportunities to view or watch deer in PA (p < 0.001). 3. Has taken a trip more than a mile from home for the primary purpose of viewing or watching deer in the past 12 months (p < 0.01). 3. Indicates that he/she or a family member hunts (p < 0.05). 4. Does not consider the deer population in his/her area to be too high (p < 0.01). 4. Strongly or moderately agrees that deer populations should be managed for healthy and sustainable deer populations (p < 0.01). 4. Strongly or moderately supports lethal methods to manage deer populations in PA (p < 0.05). 4. Does not strongly or moderately support fertility or birth control as a method of controlling deer populations in PA (p < 0.05). 4. Strongly or moderately agrees that deer populations should be managed for safe and acceptable levels of deer-human conflicts (p < 0.05). 5. Does not rate concern about deer-vehicle accidents in PA as a 9 or 10 (p < 0.001). 5. Does not strongly or moderately agree that it is OK for private citizens to feed or attract deer in PA (p < 0.05). 5. Rates concern about tick-borne diseases in PA as a 9 or a 10 (p < 0.05). 8. Does not consider place of residence to be an urban or suburban area (p < 0.001). See page 9 through 11 for explanation of how to interpret z-score tables.

1204 Responsive Management Results for WMU 4E
PARTICIPATION IN VIEWING DEER A majority of residents of WMU 4E (62%) spent time viewing deer
around their home in the past 12 months, and 36% took a trip of at
least a mile to view deer.
• About two-fifths of those who took a deer-viewing trip (38%) used a spotlight to view
the deer at night.
A majority of residents of WMU 4E (77%) are satisfied with opportunities to view deer in
Pennsylvania. Because a relatively large percentage answer neutrally, only 8% indicate
being dissatisfied.
WMU 4E

Pennsylvania Residents’ Opinions on and Attitudes Toward Deer and Deer Management 1205 Results for WMU 4E
Q10. Have you spent time viewing or watching deer around your home in the past 12 months?
62
38
0 20 40 60 80 100
Yes
No
Percent (n=422)
WMU 4E

1206 Responsive Management Results for WMU 4E
Q11. Have you taken a trip at least 1 mile from your home for the primary purpose of viewing or
watching deer in the past 12 months?
36
64
0 20 40 60 80 100
Yes
No
Percent (n=422)
WMU 4E
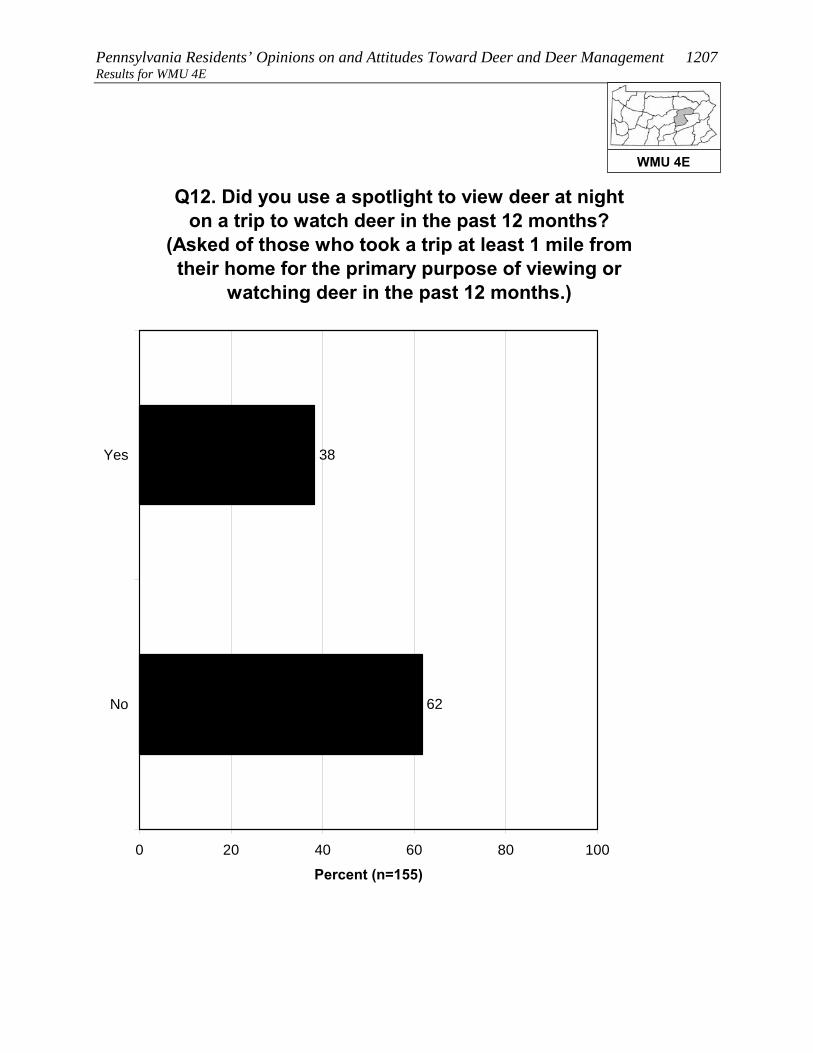
Pennsylvania Residents’ Opinions on and Attitudes Toward Deer and Deer Management 1207 Results for WMU 4E
Q12. Did you use a spotlight to view deer at night on a trip to watch deer in the past 12 months?
(Asked of those who took a trip at least 1 mile from their home for the primary purpose of viewing or
watching deer in the past 12 months.)
38
62
0 20 40 60 80 100
Yes
No
Percent (n=155)
WMU 4E

1208 Responsive Management Results for WMU 4E
Q13. How satisfied are you with opportunities to view or watch deer in Pennsylvania?
50
27
13
4
4
3
0 20 40 60 80 100
Very satisfied
Somewhatsatisfied
Neither satisfiednor dissatisfied
Somewhatdissatisfied
Very dissatisfied
Don't know
Percent (n=422)
WMU 4E

Pennsylvania Residents’ Opinions on and Attitudes Toward Deer and Deer Management 1209 Results for WMU 4E OPINIONS ON DEER IN GENERAL AND THE SIZE AND HEALTH OF THE DEER HERD
Opinion on deer is mostly favorable: 61% of residents of WMU 4E
say with no caveats that they like having deer around, another 26%
like having deer around but worry about the problems they may cause,
and only 3% generally regard them as a nuisance. The remainder have
no particular feeling about deer.
Another question asked residents of WMU 4E how deer-related issues compared to other
issues in their life, on a scale of 0 to 10, with the most importance being 10: the median
rating is “5.” The most common ratings are “0” (18%) and the midpoint of “5” (18%). In
general, ratings are well spread across the scale.
Two other ratings questions asked respondents to rate their concern about deer-related issues.
The median level of concern is “6” for the quality of deer habitat in Pennsylvania and “7” for
the health of the deer population in Pennsylvania.
The survey asked about the perceived size of the deer herd in the respondent’s area. The
majority of residents of WMU 4E say that the herd size is just right (58%); otherwise, more
say that it is too low (28%) than too high (8%).
• Those who own their home are less likely, compared to those who do not own their
home, to say that the deer population in their area is just right; they are more likely to
say that the deer population is either too high or too low.
• Those who consider themselves to be a hunter are more likely to say that the deer
population in their area is too low, compared to those who are not hunters.
WMU 4E
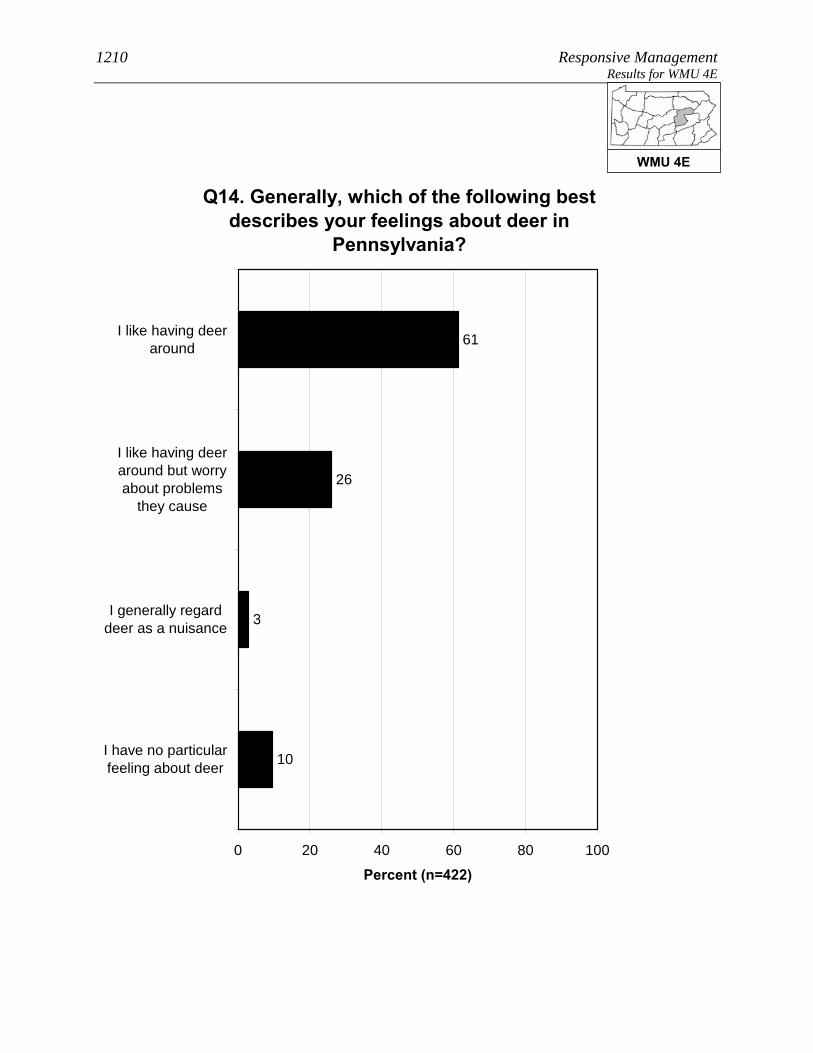
1210 Responsive Management Results for WMU 4E
Q14. Generally, which of the following best describes your feelings about deer in
Pennsylvania?
61
26
3
10
0 20 40 60 80 100
I like having deeraround
I like having deeraround but worryabout problems
they cause
I generally regarddeer as a nuisance
I have no particularfeeling about deer
Percent (n=422)
WMU 4E
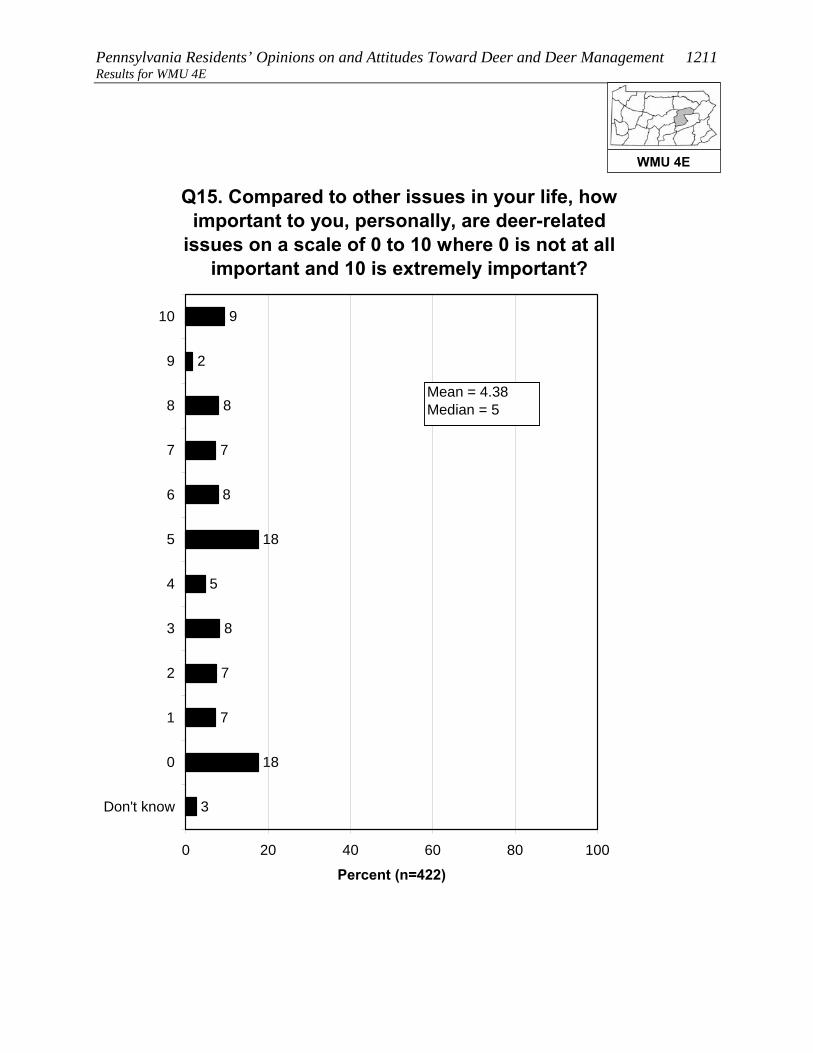
Pennsylvania Residents’ Opinions on and Attitudes Toward Deer and Deer Management 1211 Results for WMU 4E
Q15. Compared to other issues in your life, how important to you, personally, are deer-related
issues on a scale of 0 to 10 where 0 is not at all important and 10 is extremely important?
7
8
5
9
2
8
7
8
18
7
18
3
0 20 40 60 80 100
10
9
8
7
6
5
4
3
2
1
0
Don't know
Percent (n=422)
Mean = 4.38Median = 5
WMU 4E
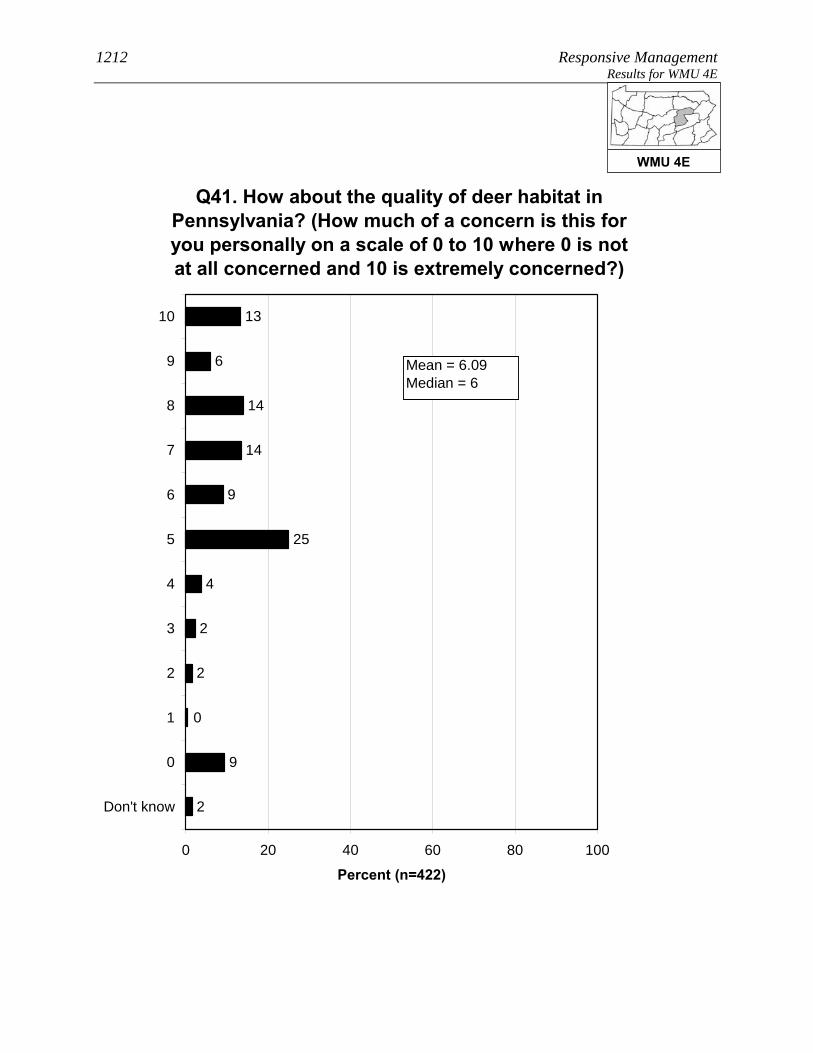
1212 Responsive Management Results for WMU 4E
Q41. How about the quality of deer habitat in Pennsylvania? (How much of a concern is this for you personally on a scale of 0 to 10 where 0 is not at all concerned and 10 is extremely concerned?)
2
2
4
13
6
14
14
9
25
0
9
2
0 20 40 60 80 100
10
9
8
7
6
5
4
3
2
1
0
Don't know
Percent (n=422)
Mean = 6.09Median = 6
WMU 4E

Pennsylvania Residents’ Opinions on and Attitudes Toward Deer and Deer Management 1213 Results for WMU 4E
3
1
3
18
2
21
10
7
19
2
10
4
0 20 40 60 80 100
10
9
8
7
6
5
4
3
2
1
0
Don't know
Percent (n=422)
Q42. How about health of the deer population, such as adequate food resources for the size of the deer herd, in Pennsylvania? (How much of a concern is this for you
personally on a scale of 0 to 10 where 0 is not at all concerned and 10 is extremely concerned?)
Mean = 6.20Median = 7
WMU 4E
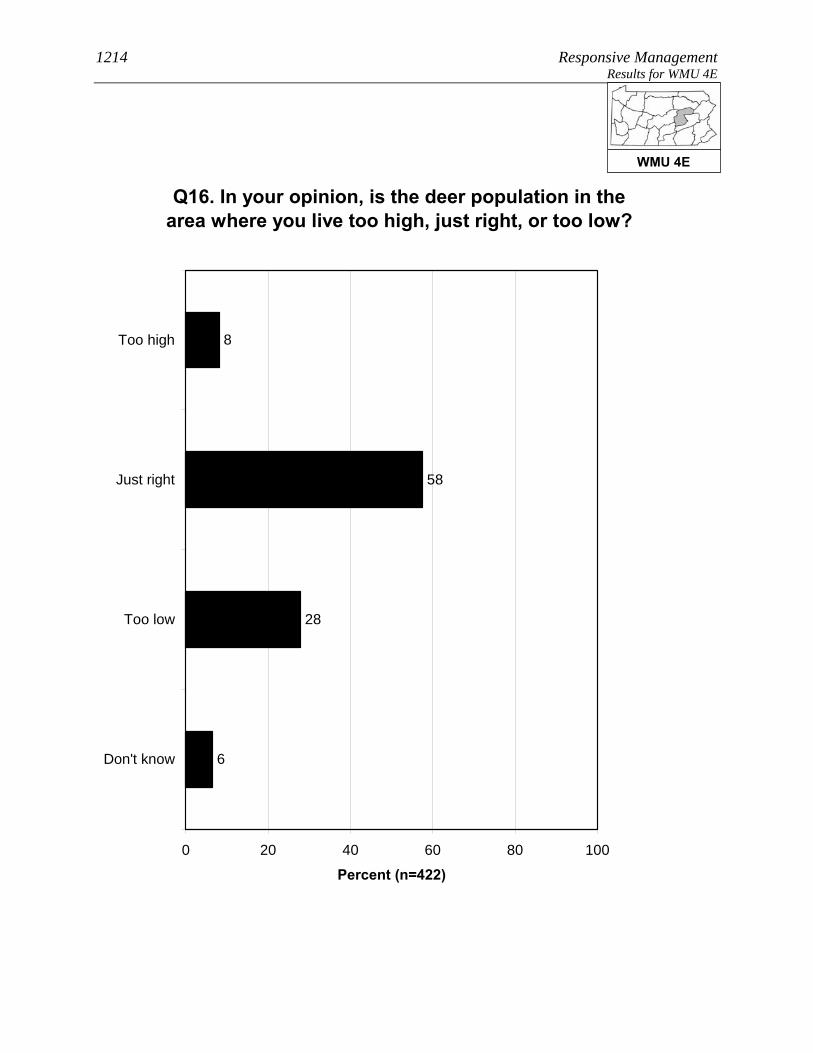
1214 Responsive Management Results for WMU 4E
Q16. In your opinion, is the deer population in the area where you live too high, just right, or too low?
8
58
28
6
0 20 40 60 80 100
Too high
Just right
Too low
Don't know
Percent (n=422)
WMU 4E

Pennsylvania Residents’ Opinions on and Attitudes Toward Deer and Deer Management 1215 Results for WMU 4E
Q16. In your opinion, is the deer population in the area where you live too high, just right, or too low?
8
57
30
5
25
67
4
3
0 20 40 60 80 100
Too high
Just right
Too low
Don't know
Percent
Owns home (n=357)Does not own home (n=25)
WMU 4E
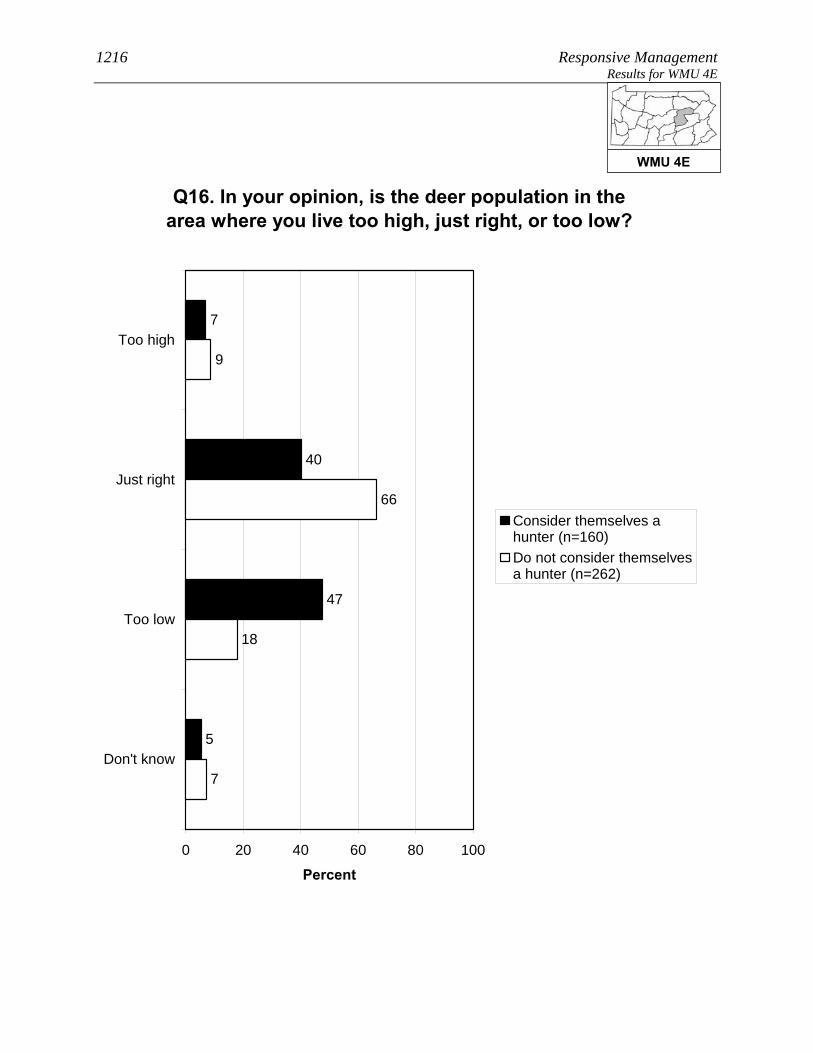
1216 Responsive Management Results for WMU 4E
Q16. In your opinion, is the deer population in the area where you live too high, just right, or too low?
7
40
47
5
18
66
9
7
0 20 40 60 80 100
Too high
Just right
Too low
Don't know
Percent
Consider themselves ahunter (n=160)Do not consider themselvesa hunter (n=262)
WMU 4E

Pennsylvania Residents’ Opinions on and Attitudes Toward Deer and Deer Management 1217 Results for WMU 4E OPINIONS ON MANAGEMENT EFFORTS AND MANAGEMENT GOALS
The survey asked about three deer population management goals. For
all three, a large majority agree with the management goal: 87% agree
with managing the deer for a healthy and sustainable forest habitat,
95% agree with managing for healthy and sustainable deer
populations, and 86% agree with managing for safe, acceptable levels
of deer-human conflicts.
Residents of WMU 4E who said that the deer population in their area is too high or too low
were asked to indicate the reasonable number of years it should take to achieve an acceptable
deer population. The mean amount is 4.69 years. While 40% said that they do not know,
nearly all the rest gave a number of years of 10 or less. Note that this is only among those
who said the deer population was too high or too low.
• Because management plans typically look at a time frame of about 10 years to effect
change, the survey specifically asked if these respondents would be willing to wait
more than 10 years to achieve an acceptable deer population: just less than a majority
(47%) indicated that they would be willing to wait that long.
WMU 4E

1218 Responsive Management Results for WMU 4E
Q24-26. Deer populations should be managed for the following. (Do you agree or disagree with this
deer management goal?)
58
29
2
5
4
2
0
28
67
1
1
2
7
51
35
1
4
2
0 20 40 60 80 100
Stronglyagree
Moderatelyagree
Neither agreenor disagree
Moderatelydisagree
Stronglydisagree
Don't know
Percent (n=422)
Healthy and sustainableforest habitatHealthy and sustainabledeer populationsSafe and acceptable levelsof deer-human conflicts
WMU 4E

Pennsylvania Residents’ Opinions on and Attitudes Toward Deer and Deer Management 1219 Results for WMU 4E
40
0
3
1
11
20
6
11
9
0 20 40 60 80 100
More than 10years
6-10 years
5 years
4 years
3 years
2 years
1 year
Less than a year
Don't know
Percent (n=160)
Q18. You said the deer population in the area where you live is [too high / too low]. In years, what is a reasonable
amount of time to achieve an acceptable deer population in the area where you live? (Asked of those who think the deer population in the area where they
live is too high or too low.)
Mean = 4.69Median = 5
WMU 4E

1220 Responsive Management Results for WMU 4E
Q21. Would you be willing to wait more than 10 years to achieve an acceptable deer population in the area where you live? (Among those who think the deer population in the area where they live is
too high or too low.)
47
47
6
0 20 40 60 80 100
Yes
No
Don't know
Percent (n=160)
WMU 4E

Pennsylvania Residents’ Opinions on and Attitudes Toward Deer and Deer Management 1221 Results for WMU 4E OPINIONS ON METHODS FOR MANAGING DEER, INCLUDING HUNTING
A large majority of residents of WMU 4E (70%) support lethal
methods to manage deer populations in Pennsylvania; nonetheless,
25% oppose, mostly strong opposition.
• Those residents of WMU 4E who live in a single-family home and own their home are
much more likely to strongly support lethal methods, compared to those who live in a
single-family home but do not own their home.
• The survey asked about four methods of controlling deer populations (three of them
lethal). The most support is for legal, regulated hunting (92% of respondents support
this method), distantly followed by fertility/birth control (30%), professionals or
sharpshooters (29%), and trapping and killing (25%).
Two questions asked respondents about hunting on their land (among those who live in a
single-family home), the first question about hunting by the respondents themselves (18% do
so) and the second regarding allowing others to hunt on their land (24% do so). In
combining the results, 29% of residents of WMU 4E who live in a single-family home either
hunt on their own land or allow others to do so (it is not simply a sum of the two questions
because some hunt on their property and allow others to do so as well).
• There was interest in seeing how a particular subgroup responded on this question, the
subgroup being those who live in a single-family home; who live on 1 acre or less; and
who live in an urban, suburban area, or a small city/town. Among this subgroup, 4%
either hunt on their own property or allow others to hunt on the property.
• Those respondents who do not allow hunting on their property were asked to indicate
why they prohibit it. The most common reasons are that their property is too small
and/or that they live in an urban or suburban area in which hunting is not possible or
feasible. Other minor reasons are a general opposition to hunting, concerns about
safety, and wanting to save the hunting opportunities for self or family.
• Those same respondents who do not allow hunting on their property were asked about
their likelihood of ever allowing others to hunt deer on their property; they
overwhelmingly say this is very unlikely (94%). They were then asked if there is
WMU 4E

1222 Responsive Management Results for WMU 4E
anything that would make them more likely to allow deer hunting;
they are almost unanimous (98%) in saying that there is nothing
that would make them more likely to allow deer hunting.
• The question about allowing others to hunt on their property was examined among the
subgroup previously discussed (those who live in a single-family home; who live on 1
acre or less; and who live in an urban, suburban area, or a small city/town). Among
this group who got the question, nearly all say that they would never allow hunting.
o Additional follow-up questions to be asked of those who indicated that something
might prompt them to allow hunting on their property did not have enough
respondents for statistical validity; therefore, they are not shown.
WMU 4E

Pennsylvania Residents’ Opinions on and Attitudes Toward Deer and Deer Management 1223 Results for WMU 4E
Q27. In general, do you support or oppose lethal methods to manage deer populations in
Pennsylvania?
37
33
4
5
20
2
0 20 40 60 80 100
Strongly support
Moderatelysupport
Neither supportnor oppose
Moderately oppose
Strongly oppose
Don't know
Percent (n=422)
WMU 4E

1224 Responsive Management Results for WMU 4E
Q27. In general, do you support or oppose lethal methods to manage deer populations in
Pennsylvania?
41
32
2
6
17
2
7
48
14
0
31
0
0 20 40 60 80 100
Stronglysupport
Moderatelysupport
Neithersupport nor
oppose
Moderatelyoppose
Stronglyoppose
Don't know
Percent
Owns home (n=357)Does not own home (n=25)
WMU 4E
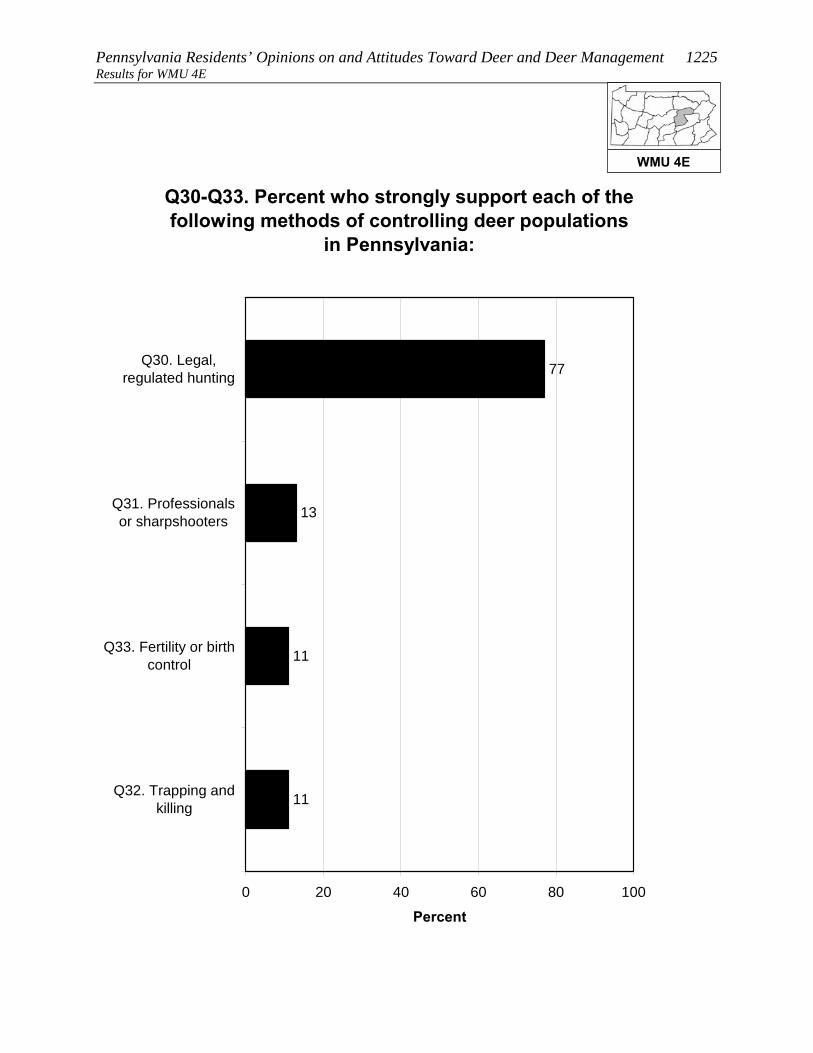
Pennsylvania Residents’ Opinions on and Attitudes Toward Deer and Deer Management 1225 Results for WMU 4E
Q30-Q33. Percent who strongly support each of the following methods of controlling deer populations
in Pennsylvania:
11
11
13
77
0 20 40 60 80 100
Q30. Legal,regulated hunting
Q31. Professionalsor sharpshooters
Q33. Fertility or birthcontrol
Q32. Trapping andkilling
Percent
WMU 4E
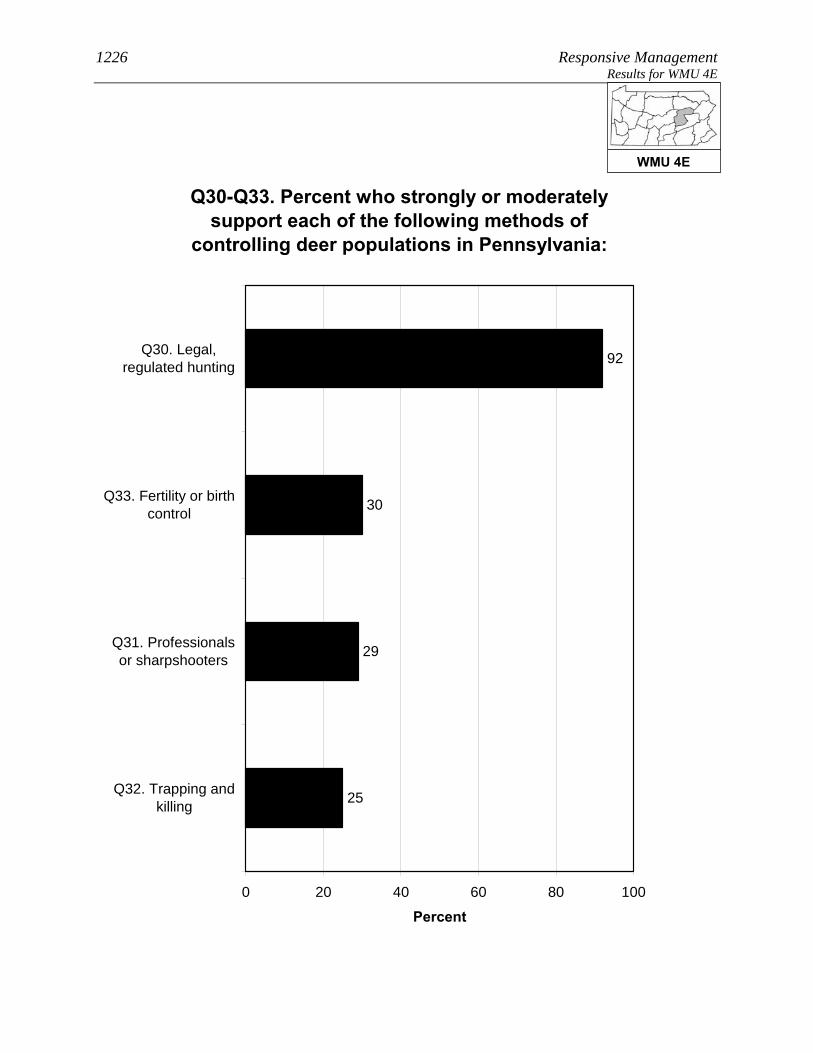
1226 Responsive Management Results for WMU 4E
Q30-Q33. Percent who strongly or moderately support each of the following methods of
controlling deer populations in Pennsylvania:
25
29
30
92
0 20 40 60 80 100
Q30. Legal,regulated hunting
Q33. Fertility or birthcontrol
Q31. Professionalsor sharpshooters
Q32. Trapping andkilling
Percent
WMU 4E
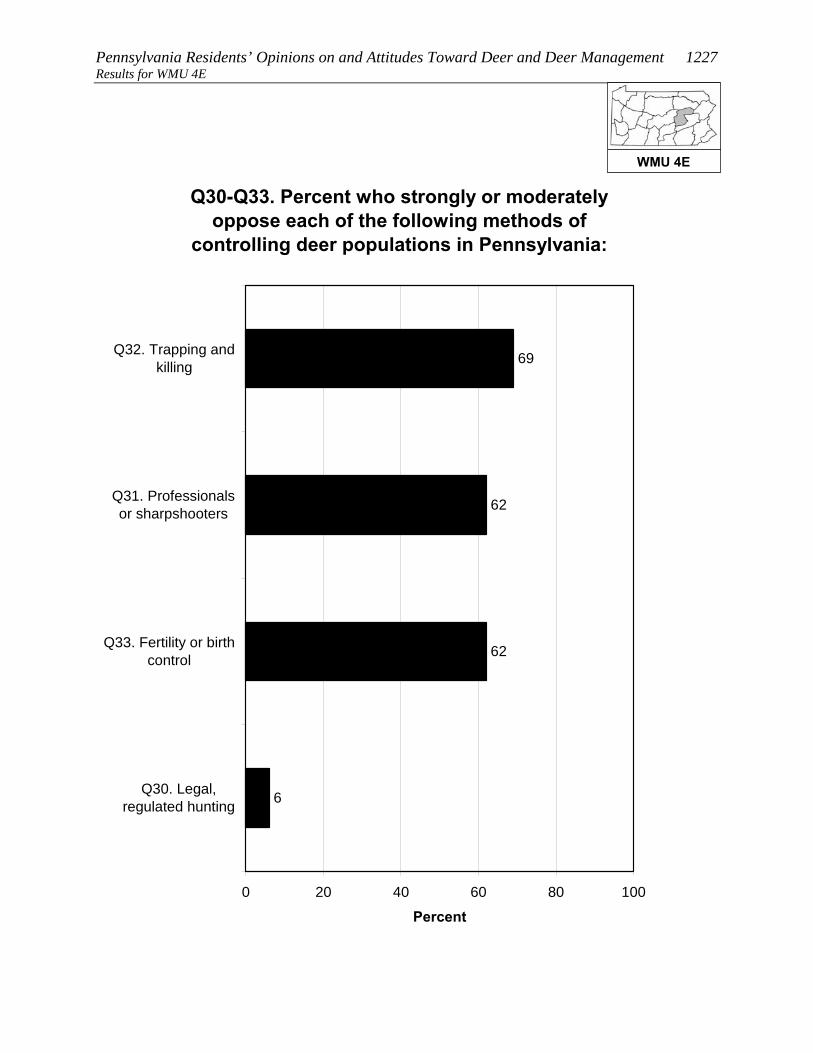
Pennsylvania Residents’ Opinions on and Attitudes Toward Deer and Deer Management 1227 Results for WMU 4E
Q30-Q33. Percent who strongly or moderately oppose each of the following methods of
controlling deer populations in Pennsylvania:
6
62
62
69
0 20 40 60 80 100
Q32. Trapping andkilling
Q31. Professionalsor sharpshooters
Q33. Fertility or birthcontrol
Q30. Legal,regulated hunting
Percent
WMU 4E
1228 Responsive Management Results for WMU 4E
Q30-Q33. Percent who strongly oppose each of the following methods of controlling deer populations
in Pennsylvania:
5
45
51
58
0 20 40 60 80 100
Q32. Trapping andkilling
Q31. Professionalsor sharpshooters
Q33. Fertility or birthcontrol
Q30. Legal,regulated hunting
Percent
WMU 4E

Pennsylvania Residents’ Opinions on and Attitudes Toward Deer and Deer Management 1229 Results for WMU 4E
Q59/60. Deer hunts and/or allows others to deer hunt on property. (Among respondents living in a
single-family home.)
29
71
0 20 40 60 80 100
Yes
No
Percent (n=382)
WMU 4E
1230 Responsive Management Results for WMU 4E
Q59/60. Deer hunts and/or allows others to deer hunt on property. (Among respondents living in a
single-family home.)
4
96
0 20 40 60 80 100
Yes
No
Percent
Lives in a single familyhome on 1 acre or less inan urban area, a suburbanarea, or a small city/town(n=130)
WMU 4E
Pennsylvania Residents’ Opinions on and Attitudes Toward Deer and Deer Management 1231 Results for WMU 4E
Q63. What are the main reasons you do not allow others to hunt deer on your property? (Asked of
those whose primary place of residence is a single-family home and who do not allow others to hunt
deer on their property.)
1
1
1
49
45
8
7
5
2
0 20 40 60 80 100
Property is too small / neighbors too close
Live in residential neighborhood /suburban or urban area
Oppose hunting in general
Concerned about safety
Want to save hunting opportunities for self/ family
Concerned about bad behavior by hunters
Not interested in allowing hunting onproperty, but did not indicate opposition to
hunting in general
Not enough deer on property / not enoughhabitat
Liability
Mul
tiple
Res
pons
es A
llow
ed
Percent (n=283)
WMU 4E
1232 Responsive Management Results for WMU 4E
Q65. How likely are you to ever allow others to deer hunt on your property? (Asked of those whose
primary place of residence is a single-family home and who do not allow others to hunt deer on their
property.)
1
2
1
1
94
0 20 40 60 80 100
Very likely
Somewhat likely
Neither likely norunlikely
Somewhat unlikely
Very unlikely
Percent (n=283)
WMU 4E

Pennsylvania Residents’ Opinions on and Attitudes Toward Deer and Deer Management 1233 Results for WMU 4E
Q66. Is there anything that would make you more likely to allow deer hunting on your property?
(Asked of those whose primary place of residence is a single-family home and who do not allow
others to hunt deer on their property.)
2
98
0 20 40 60 80 100
Yes
No
Percent (n=283)
WMU 4E

1234 Responsive Management Results for WMU 4E
Q65. How likely are you to ever allow others to deer hunt on your property? (Asked of those whose
primary place of residence is a single-family home and who do not allow others to hunt deer on their
property.)
0
1
0
1
98
0 20 40 60 80 100
Very likely
Somewhatlikely
Neither likelynor unlikely
Somewhatunlikely
Very unlikely
Percent
Lives in a single familyhome on 1 acre or less inan urban area, a suburbanarea, or a small city/town(n=126)
WMU 4E

Pennsylvania Residents’ Opinions on and Attitudes Toward Deer and Deer Management 1235 Results for WMU 4E CONCERNS ABOUT DEER AND DEER NUISANCE PROBLEMS
Seven questions asked about respondents’ level of concern about
issues associated with deer. For each issue, respondents rated their
level of concern about it using a 10-point scale, with 10 being the most
concerned.
• The most concern was for tick-borne diseases (mean rating of 7.7), followed by three
whose means are fairly close to one another: deer-vehicle accidents (6.2), the health of
the deer population (6.2), and the quality of deer habitat (6.1).
• At the bottom are concern about deer impacts on habitat and other wildlife (even
though this can be considerable) (3.4) and the two impacts to residents’ landscaping:
deer damage to plants and landscaping (2.0) and deer droppings in the yard (1.3).
o Another graph shows the percentage who gave a high rating (a “9” or “10”),
providing an idea of the percentage who feel strongly about the issues.
Among residents of WMU 4E, 73% indicated that they saw deer on their property in the past
12 months.
• Respondents who fed birds were more likely to indicate seeing deer, as were
respondents who fed deer or put out attractants or were aware of neighbors who fed
deer or put out attractants.
The survey asked about specific nuisance problems with deer that residents of WMU 4E may
have experienced: 12% indicated that they experienced problems with deer at their primary
place of residence in the past 12 months; 17% indicated that they or another household
member had been in a vehicle collision with a deer (fortunately, a very low portion of
drivers/passengers were injured); and 5% indicated that they or a household member had
been diagnosed with a tick-borne disease.
• Crosstabulations show that those who fed birds were about the same as those who had
not fed birds regarding experiencing deer problems. However, those who were aware
of neighbors feeding deer or putting out attractants were much more likely to say that
they experienced deer problems.
WMU 4E
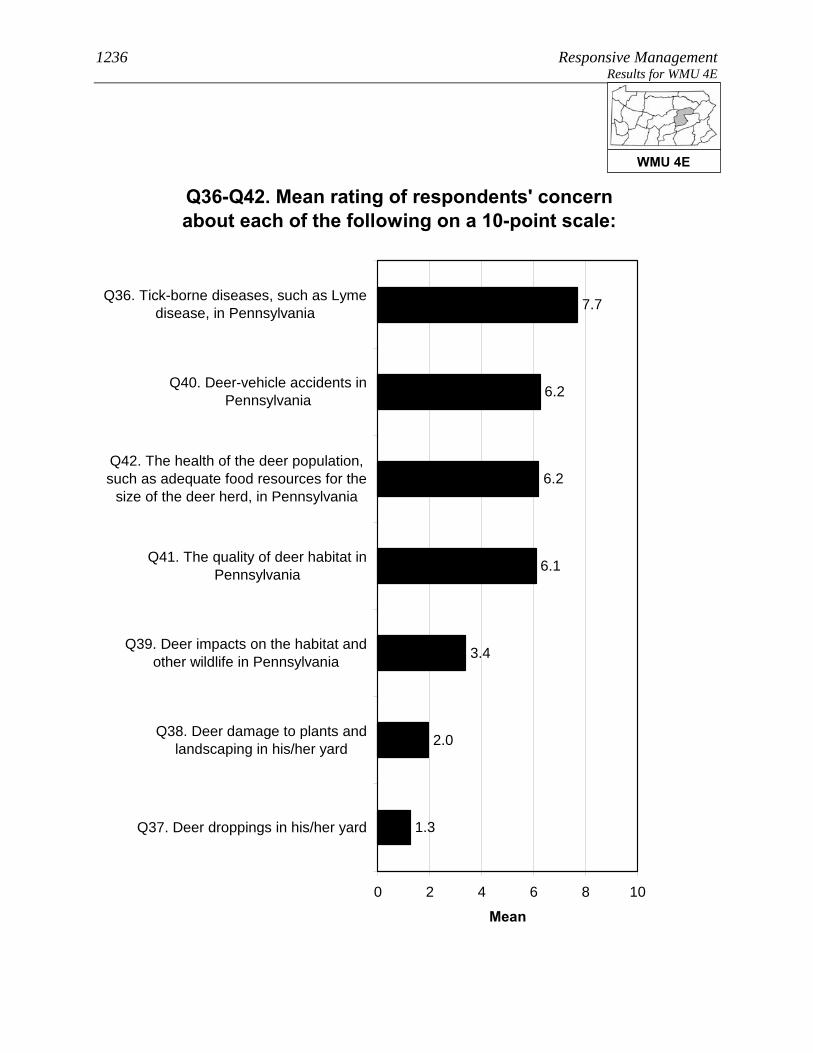
1236 Responsive Management Results for WMU 4E
Q36-Q42. Mean rating of respondents' concern about each of the following on a 10-point scale:
2.0
3.4
6.1
6.2
6.2
7.7
1.3
0 2 4 6 8 10
Q36. Tick-borne diseases, such as Lymedisease, in Pennsylvania
Q40. Deer-vehicle accidents inPennsylvania
Q42. The health of the deer population,such as adequate food resources for the
size of the deer herd, in Pennsylvania
Q41. The quality of deer habitat inPennsylvania
Q39. Deer impacts on the habitat andother wildlife in Pennsylvania
Q38. Deer damage to plants andlandscaping in his/her yard
Q37. Deer droppings in his/her yard
Mean
WMU 4E

Pennsylvania Residents’ Opinions on and Attitudes Toward Deer and Deer Management 1237 Results for WMU 4E
Q36-Q42. Percent who rated their concern about each of the following as a 9 or 10 on a 10-point
scale:
4
6
19
20
23
48
3
0 20 40 60 80 100
Q36. Tick-borne diseases, such as Lymedisease, in Pennsylvania
Q40. Deer-vehicle accidents inPennsylvania
Q42. The health of the deer population,such as adequate food resources for the
size of the deer herd, in Pennsylvania
Q41. The quality of deer habitat inPennsylvania
Q38. Deer damage to plants andlandscaping in his/her yard
Q39. Deer impacts on the habitat andother wildlife in Pennsylvania
Q37. Deer droppings in his/her yard
Percent
WMU 4E

1238 Responsive Management Results for WMU 4E
Q49. How often have you seen deer on your property in the past 12 months?
30
22
21
27
0 20 40 60 80 100
Frequently
Sometimes
Rarely
Never
Percent (n=422)
WMU 4E

Pennsylvania Residents’ Opinions on and Attitudes Toward Deer and Deer Management 1239 Results for WMU 4E
Q49. How often have you seen deer on your property in the past 12 months?
29
27
22
21
1
21
16
30
33
0
0 20 40 60 80 100
Frequently
Sometimes
Rarely
Never
Don't know
Percent
Fed birds on his / herproperty in the past 12months (n=196)Did not feed birds on his /her property in the past 12months (n=225)
WMU 4E

1240 Responsive Management Results for WMU 4E
Q49. How often have you seen deer on your property in the past 12 months?
52
26
21
1
22
21
26
31
0 20 40 60 80 100
Frequently
Sometimes
Rarely
Never
Percent
Has fed deer or put outattractants in the past 12months (n=54)Has not fed deer or put outattractants in the past 12months (n=368)
WMU 4E
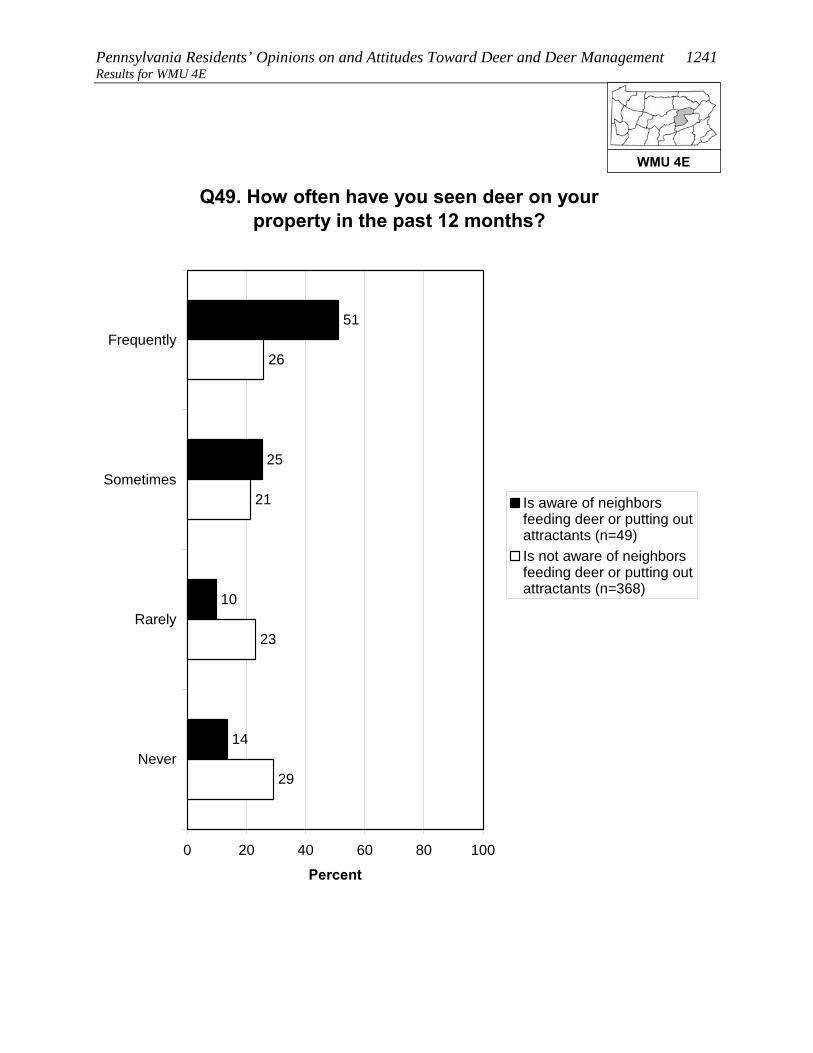
Pennsylvania Residents’ Opinions on and Attitudes Toward Deer and Deer Management 1241 Results for WMU 4E
Q49. How often have you seen deer on your property in the past 12 months?
51
25
10
14
23
21
26
29
0 20 40 60 80 100
Frequently
Sometimes
Rarely
Never
Percent
Is aware of neighborsfeeding deer or putting outattractants (n=49)Is not aware of neighborsfeeding deer or putting outattractants (n=368)
WMU 4E

1242 Responsive Management Results for WMU 4E
Q43. In the past 12 months, have you experienced any problems with deer at your primary place of
residence?
12
88
0 20 40 60 80 100
Yes
No
Percent (n=422)
WMU 4E
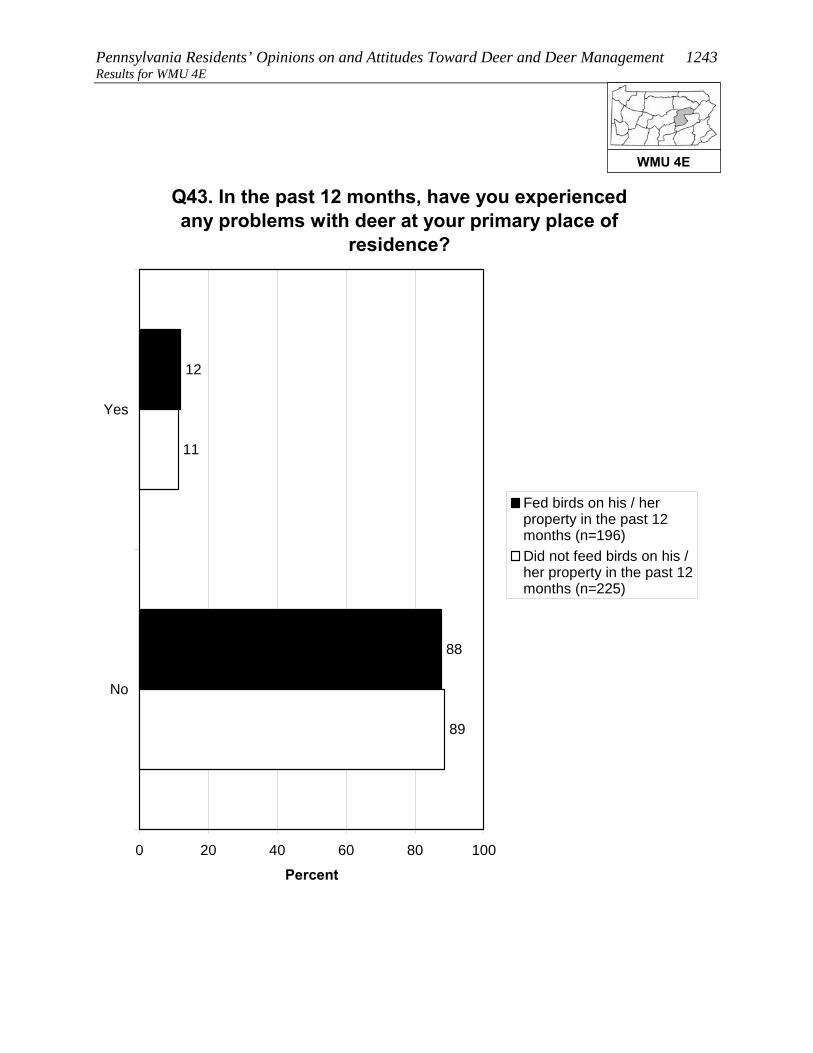
Pennsylvania Residents’ Opinions on and Attitudes Toward Deer and Deer Management 1243 Results for WMU 4E
Q43. In the past 12 months, have you experienced any problems with deer at your primary place of
residence?
12
88
89
11
0 20 40 60 80 100
Yes
No
Percent
Fed birds on his / herproperty in the past 12months (n=196)Did not feed birds on his /her property in the past 12months (n=225)
WMU 4E

1244 Responsive Management Results for WMU 4E
Q43. In the past 12 months, have you experienced any problems with deer at your primary place of
residence?
28
72
90
10
0 20 40 60 80 100
Yes
No
Percent
Is aware of neighborsfeeding deer or putting outattractants (n=49)Is not aware of neighborsfeeding deer or putting outattractants (n=368)
WMU 4E

Pennsylvania Residents’ Opinions on and Attitudes Toward Deer and Deer Management 1245 Results for WMU 4E
Q44. In the past 12 months, have you or any other person living in your immediate household been in a vehicle collision with or an accident involving a
deer on Pennsylvania's roads or highways?
17
83
0 20 40 60 80 100
Yes
No
Percent (n=422)
WMU 4E

1246 Responsive Management Results for WMU 4E
Q45. Were you or anyone else injured? (Asked of those who had a household member who was in or
who have personally been in a vehicle collision with or an accident involving a deer on
Pennsylvania's roads or highways in the past 12 months.)
5
95
0 20 40 60 80 100
Yes
No
Percent (n=76)
WMU 4E
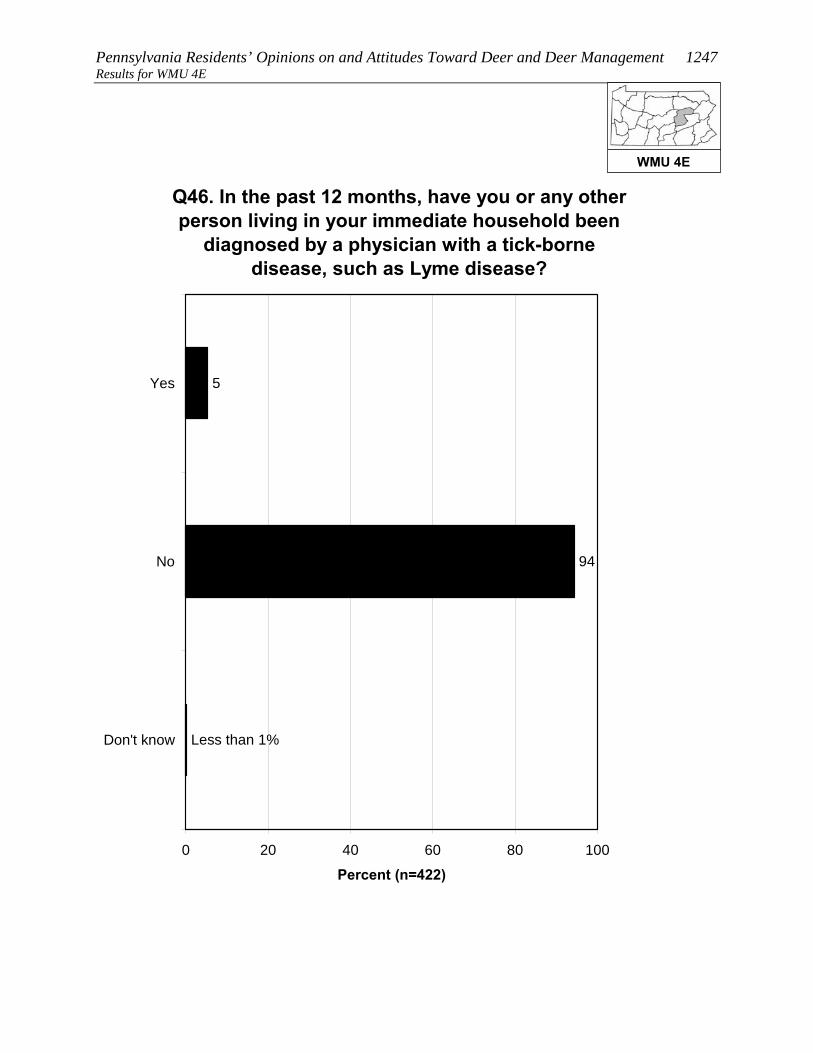
Pennsylvania Residents’ Opinions on and Attitudes Toward Deer and Deer Management 1247 Results for WMU 4E
Q46. In the past 12 months, have you or any other person living in your immediate household been
diagnosed by a physician with a tick-borne disease, such as Lyme disease?
5
94
Less than 1%
0 20 40 60 80 100
Yes
No
Don't know
Percent (n=422)
WMU 4E
1248 Responsive Management Results for WMU 4E
FEEDING WILDLIFE AND HUNTING DEER Several questions asked about feeding wildlife.
• Feeding deer or putting out deer attractants: 14% of residents of
WMU 4E did this, and 11% are aware of neighbors who did this.
o The most typical feeds or attractants put out by respondents are salt/mineral blocks,
corn, and apples.
• Feeding birds: 51% of residents of WMU 4E did this.
There is no consensus on whether it is okay for private citizens to feed or attract deer in
Pennsylvania: 44% agree that this is okay, but 47% disagree (the rest are neutral).
More than a third of residents of WMU 4E (34%) consider themselves to be a hunter, about
two-thirds of whom have a Pennsylvania hunting license.
• Among residents of WMU 4E who live in a single-family home, 18% personally hunt
deer on their property.
• A large majority of residents of WMU 4E (86%) say that they, family members, and/or
friends hunt.
WMU 4E

Pennsylvania Residents’ Opinions on and Attitudes Toward Deer and Deer Management 1249 Results for WMU 4E
Q50. Did you ever feed deer intentionally or put out attractants, such as a salt or mineral block, in the
past 12 months?
14
86
0 20 40 60 80 100
Yes
No
Percent (n=422)
WMU 4E
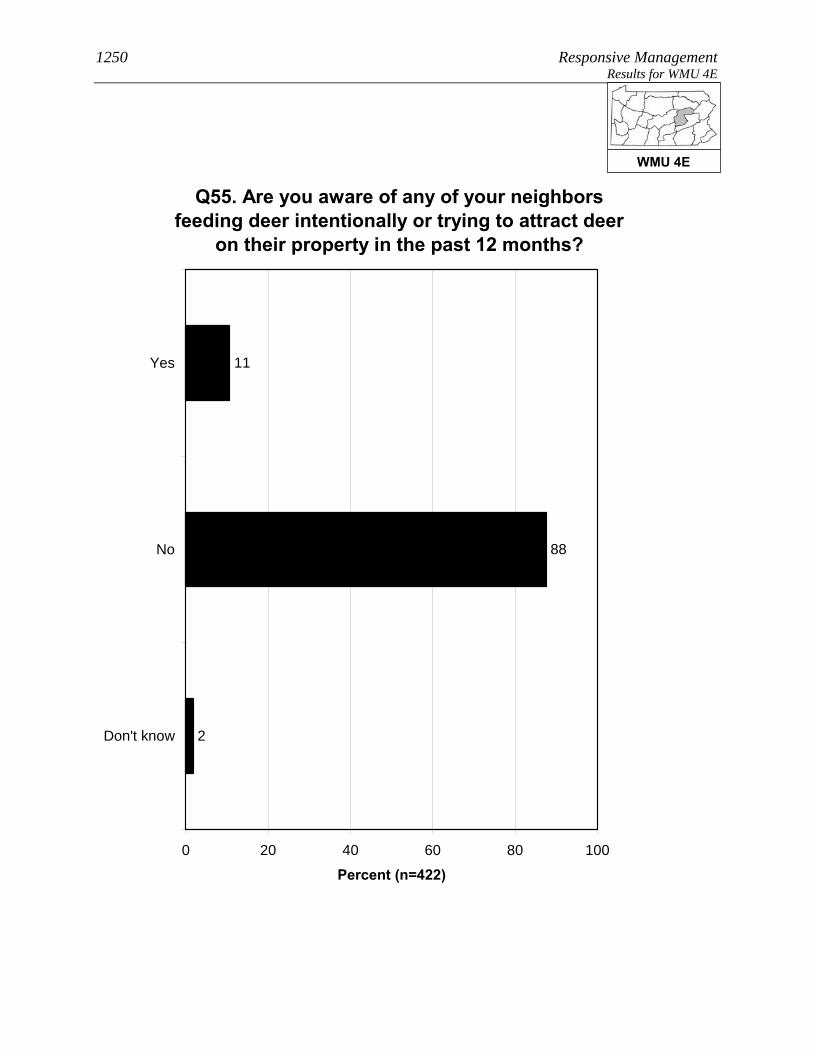
1250 Responsive Management Results for WMU 4E
Q55. Are you aware of any of your neighbors feeding deer intentionally or trying to attract deer
on their property in the past 12 months?
11
88
2
0 20 40 60 80 100
Yes
No
Don't know
Percent (n=422)
WMU 4E
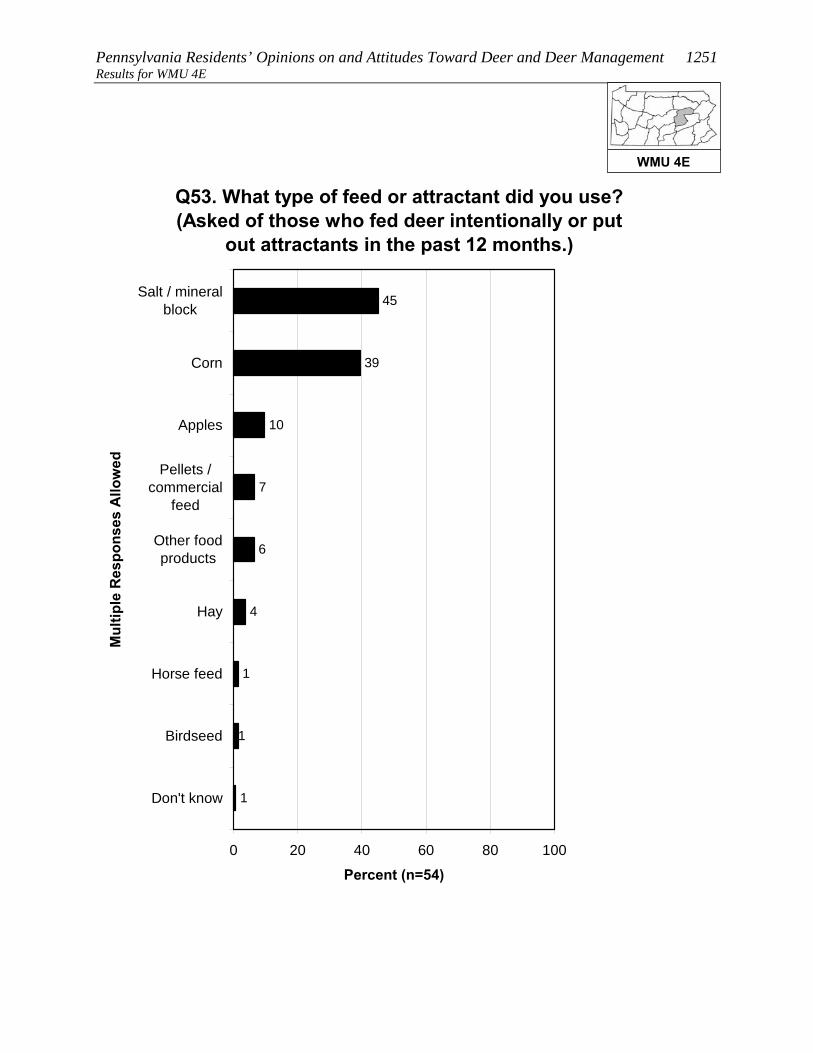
Pennsylvania Residents’ Opinions on and Attitudes Toward Deer and Deer Management 1251 Results for WMU 4E
Q53. What type of feed or attractant did you use? (Asked of those who fed deer intentionally or put
out attractants in the past 12 months.)
1
1
1
45
39
10
7
6
4
0 20 40 60 80 100
Salt / mineralblock
Corn
Apples
Pellets /commercial
feed
Other foodproducts
Hay
Horse feed
Birdseed
Don't know
Mul
tiple
Res
pons
es A
llow
ed
Percent (n=54)
WMU 4E
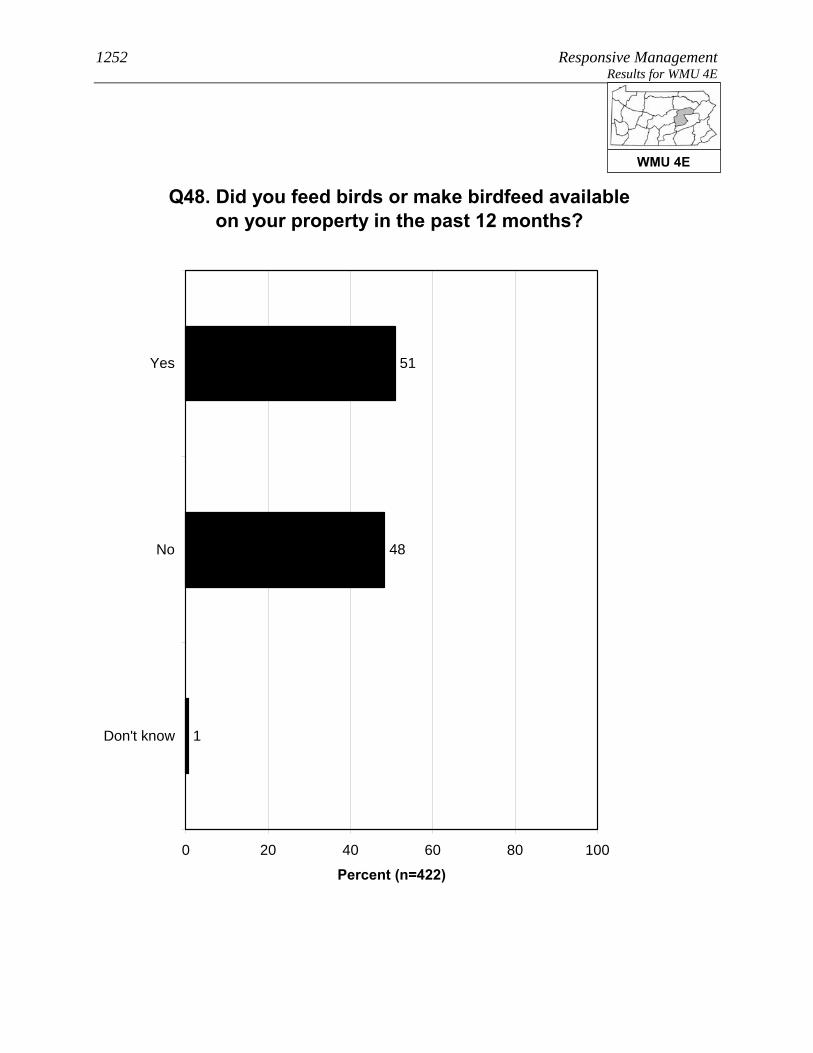
1252 Responsive Management Results for WMU 4E
Q48. Did you feed birds or make birdfeed available on your property in the past 12 months?
51
48
1
0 20 40 60 80 100
Yes
No
Don't know
Percent (n=422)
WMU 4E
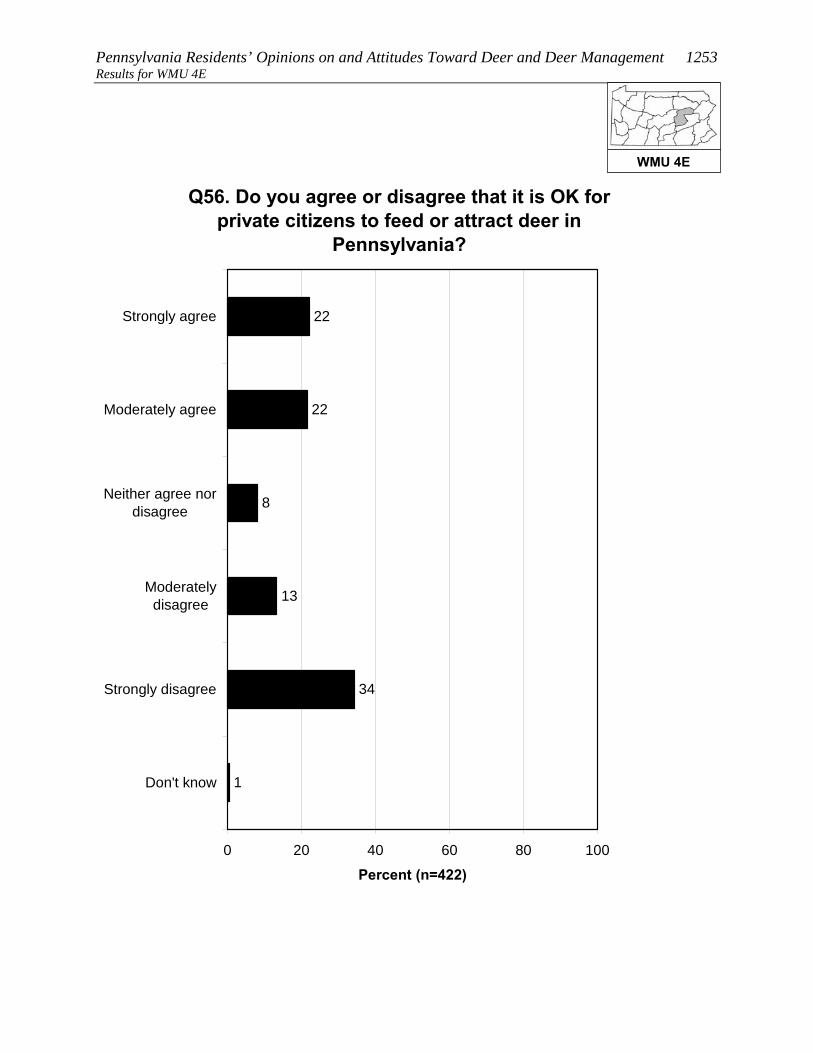
Pennsylvania Residents’ Opinions on and Attitudes Toward Deer and Deer Management 1253 Results for WMU 4E
Q56. Do you agree or disagree that it is OK for private citizens to feed or attract deer in
Pennsylvania?
22
22
8
13
34
1
0 20 40 60 80 100
Strongly agree
Moderately agree
Neither agree nordisagree
Moderatelydisagree
Strongly disagree
Don't know
Percent (n=422)
WMU 4E

1254 Responsive Management Results for WMU 4E
Q59. Do you personally hunt deer on your property? (Asked of those whose primary place of
residence is a single-family home.)
18
82
0 20 40 60 80 100
Yes
No
Percent (n=382)
WMU 4E

Pennsylvania Residents’ Opinions on and Attitudes Toward Deer and Deer Management 1255 Results for WMU 4E
Q79. Do you, any of your family members, or any friends hunt any wildlife species?
86
14
Less than 1%
0 20 40 60 80 100
Yes
No
Don't know
Percent (n=422)
WMU 4E

1256 Responsive Management Results for WMU 4E
SOURCES OF INFORMATION Most commonly, residents of WMU 4E say that the best way to
provide them with information about deer in Pennsylvania is through
direct mail (36% gave this response), followed by newspaper (20%),
email (15%), TV (14%), and the Internet (12% saying an Internet site
other than the PGC and 4% saying the agency website; note that some
said both).
Just more than two-fifths of residents of WMU 4E (42%) use social media, the most common
primary site being Facebook.
WMU 4E
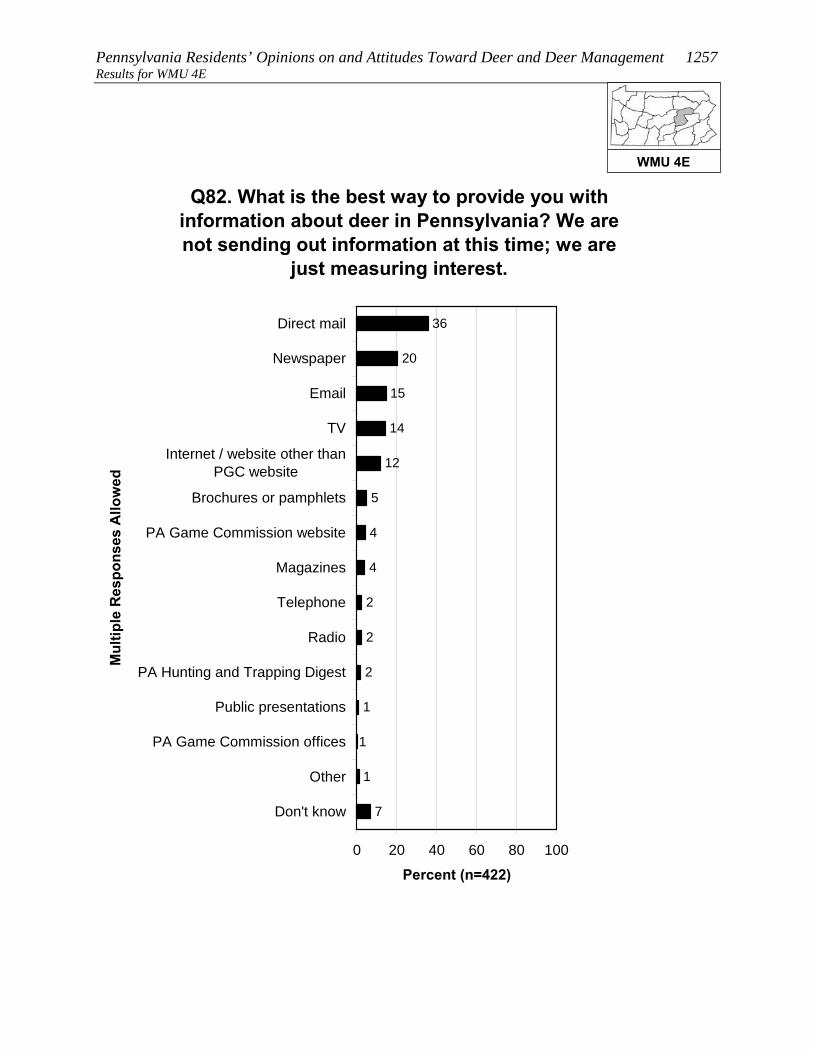
Pennsylvania Residents’ Opinions on and Attitudes Toward Deer and Deer Management 1257 Results for WMU 4E
Q82. What is the best way to provide you with information about deer in Pennsylvania? We are not sending out information at this time; we are
just measuring interest.
2
4
4
36
20
15
14
12
5
2
2
1
1
1
7
0 20 40 60 80 100
Direct mail
Newspaper
TV
Internet / website other thanPGC website
Brochures or pamphlets
PA Game Commission website
Magazines
Telephone
Radio
PA Hunting and Trapping Digest
Public presentations
PA Game Commission offices
Other
Don't know
Mul
tiple
Res
pons
es A
llow
ed
Percent (n=422)
WMU 4E

1258 Responsive Management Results for WMU 4E
Q84. Do you use social media, such as Facebook, Twitter, or YouTube?
42
58
0 20 40 60 80 100
Yes
No
Percent (n=422)
WMU 4E

Pennsylvania Residents’ Opinions on and Attitudes Toward Deer and Deer Management 1259 Results for WMU 4E
Q85. Which social media site do you use most often? (Asked of those who use social media.)
92
4
3
1
0 20 40 60 80 100
YouTube
Don't know
Percent (n=186)
WMU 4E

1260 Responsive Management Results for WMU 5A
RESULTS FOR WMU 5A Location: From the Maryland/PA state line, PA Rt. 75 north to US Rt. 30 at Fort Loudon; US Rt. 30 east to US Rt. 11 at Chambersburg; US Rt. 11 north to PA Rt. 997 at Green Village; PA Rt. 997 north to I-76 near Newburg; I-76 east to I-81 at Carlisle; I-81 east to US Rt. 15 near Harrisburg; US Rt. 15 south to PA Rt. 94 near York Springs; PA Rt. 94 south to the Maryland/PA state line.
8. Lives in WMU 5A 2. Does not indicate having seen deer frequently on his/her property in the past 12 months (p < 0.001). 3. Does not indicate having spent time viewing or watching deer around home in the past 12 months (p < 0.001). 3. Does not indicate having used a spotlight to view deer at night on a trip to watch deer in the past 12 months (p < 0.001). 3. Does not indicate having taken a trip more than a mile from home for the primary purpose of viewing or watching deer in the past 12 months (p < 0.01). 3. Does not indicate having a valid 2011 PA general hunting license (p < 0.01). 4. Does not consider the deer population in his/her area to be too high (p < 0.001). 4. Strongly or moderately agrees that deer populations should be managed for safe and acceptable levels of deer-human conflicts (p < 0.01). 4. Strongly or moderately supports legal, regulated hunting as a method of controlling deer populations in PA (p < 0.05). 4. Does not strongly or moderately support trapping and killing as a method of controlling deer populations in PA (p < 0.05). 5. Does not indicate having experienced any problems with deer at his/her primary place of residence in the past 12 months (p < 0.001). 5. Does not indicate that he/she or another person living in the immediate household has been in a vehicle collision with or an accident involving a deer on PA's roads or highways in the past 12 months (p < 0.001). 5. Does not rate concern about deer damage to plants and landscaping in their yard as a 9 or 10 (p < 0.01). 5. Does not rate concern about deer-vehicle accidents in PA as a 9 or 10 (p < 0.01). 5. Indicates that he/she or another person living in the immediate household has been diagnosed by a physician with a tick-borne disease in the past 12 months (p < 0.01). 8. Has lived at his/her primary place of residence for the median number of years or less (p < 0.001). See page 9 through 11 for explanation of how to interpret z-score tables.
Pennsylvania Residents’ Opinions on and Attitudes Toward Deer and Deer Management 1261 Results for WMU 5A PARTICIPATION IN VIEWING DEER
Half of residents of WMU 5A (50%) spent time viewing deer around
their home in the past 12 months, and 23% took a trip of at least a mile
to view deer.
• About one-fifth of those who took a deer-viewing trip (21%) used a spotlight to view
the deer at night.
A majority of residents of WMU 5A (69%) are satisfied with opportunities to view deer in
Pennsylvania. Because a relatively large percentage answer neutrally, only 13% indicate
being dissatisfied.
WMU 5A

1262 Responsive Management Results for WMU 5A
Q10. Have you spent time viewing or watching deer around your home in the past 12 months?
50
50
0 20 40 60 80 100
Yes
No
Percent (n=407)
WMU 5A

Pennsylvania Residents’ Opinions on and Attitudes Toward Deer and Deer Management 1263 Results for WMU 5A
Q11. Have you taken a trip at least 1 mile from your home for the primary purpose of viewing or
watching deer in the past 12 months?
23
77
0 20 40 60 80 100
Yes
No
Percent (n=407)
WMU 5A
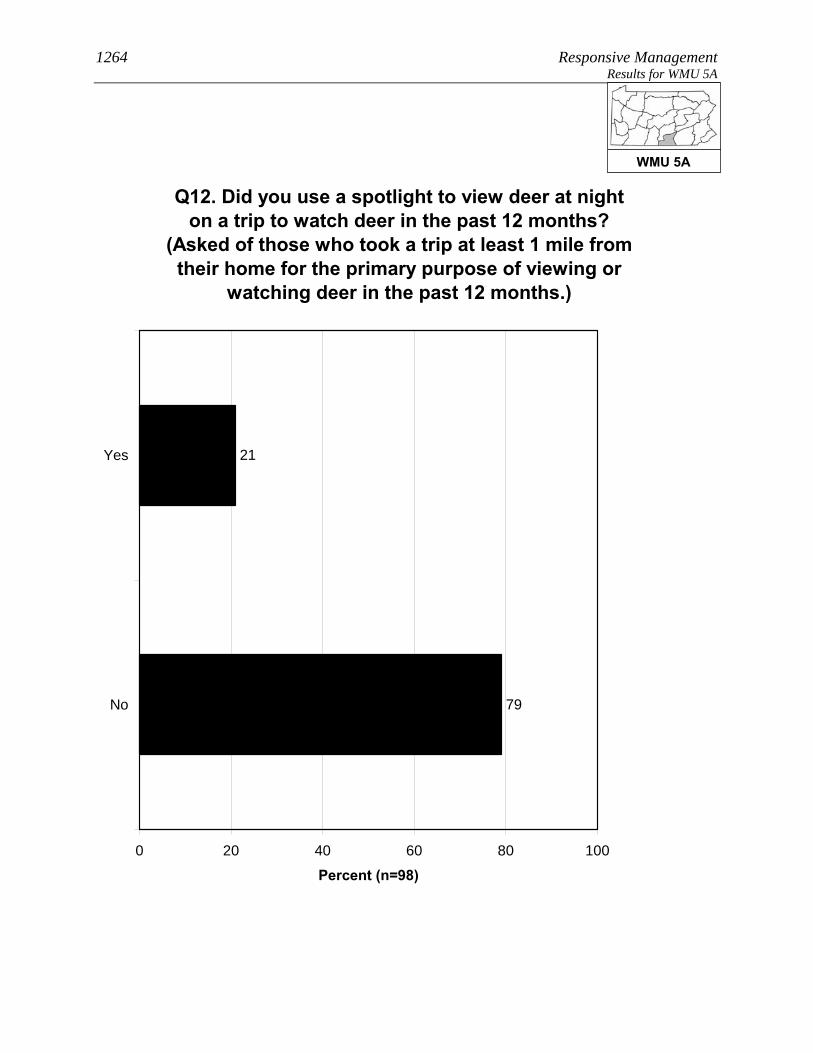
1264 Responsive Management Results for WMU 5A
Q12. Did you use a spotlight to view deer at night on a trip to watch deer in the past 12 months?
(Asked of those who took a trip at least 1 mile from their home for the primary purpose of viewing or
watching deer in the past 12 months.)
21
79
0 20 40 60 80 100
Yes
No
Percent (n=98)
WMU 5A
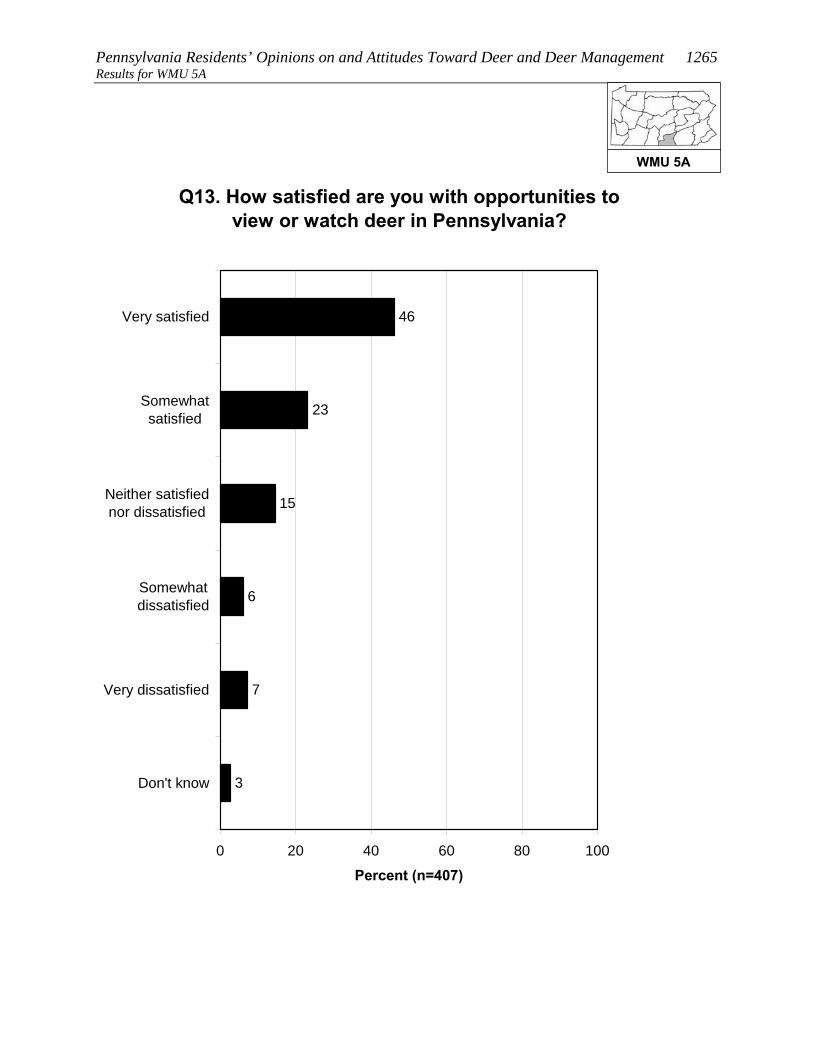
Pennsylvania Residents’ Opinions on and Attitudes Toward Deer and Deer Management 1265 Results for WMU 5A
Q13. How satisfied are you with opportunities to view or watch deer in Pennsylvania?
46
23
15
6
7
3
0 20 40 60 80 100
Very satisfied
Somewhatsatisfied
Neither satisfiednor dissatisfied
Somewhatdissatisfied
Very dissatisfied
Don't know
Percent (n=407)
WMU 5A

1266 Responsive Management Results for WMU 5A
OPINIONS ON DEER IN GENERAL AND THE SIZE AND HEALTH OF THE DEER HERD
Opinion on deer is mostly favorable: 63% of residents of WMU 5A
say with no caveats that they like having deer around, another 17%
like having deer around but worry about the problems they may cause,
and only 1% generally regard them as a nuisance. The remainder have
no particular feeling about deer.
Another question asked residents of WMU 5A how deer-related issues compared to other
issues in their life, on a scale of 0 to 10, with the most importance being 10: the median
rating is “5.” The most common ratings are “0” (24%), the midpoint of “5” (16%), and “10”
(13%). In general, ratings are well spread across the scale.
Two other ratings questions asked respondents to rate their concern about deer-related issues.
The median level of concern is “6” for the quality of deer habitat in Pennsylvania and “7” for
the health of the deer population in Pennsylvania.
The survey asked about the perceived size of the deer herd in the respondent’s area. The
majority of residents of WMU 5A say that the herd size is just right (58%); otherwise, more
say that it is too low (25%) than too high (5%).
• Those who own their home are about the same as those who do not own their home
regarding their feelings about the size of the deer population in their area.
• Those who consider themselves to be a hunter are more likely to say that the deer
population in their area is too low, compared to those who are not hunters.
WMU 5A

Pennsylvania Residents’ Opinions on and Attitudes Toward Deer and Deer Management 1267 Results for WMU 5A
Q14. Generally, which of the following best describes your feelings about deer in
Pennsylvania?
18
1
17
63
0 20 40 60 80 100
I like having deeraround
I like having deeraround but worryabout problems
they cause
I generally regarddeer as a nuisance
I have no particularfeeling about deer
Percent (n=407)
WMU 5A
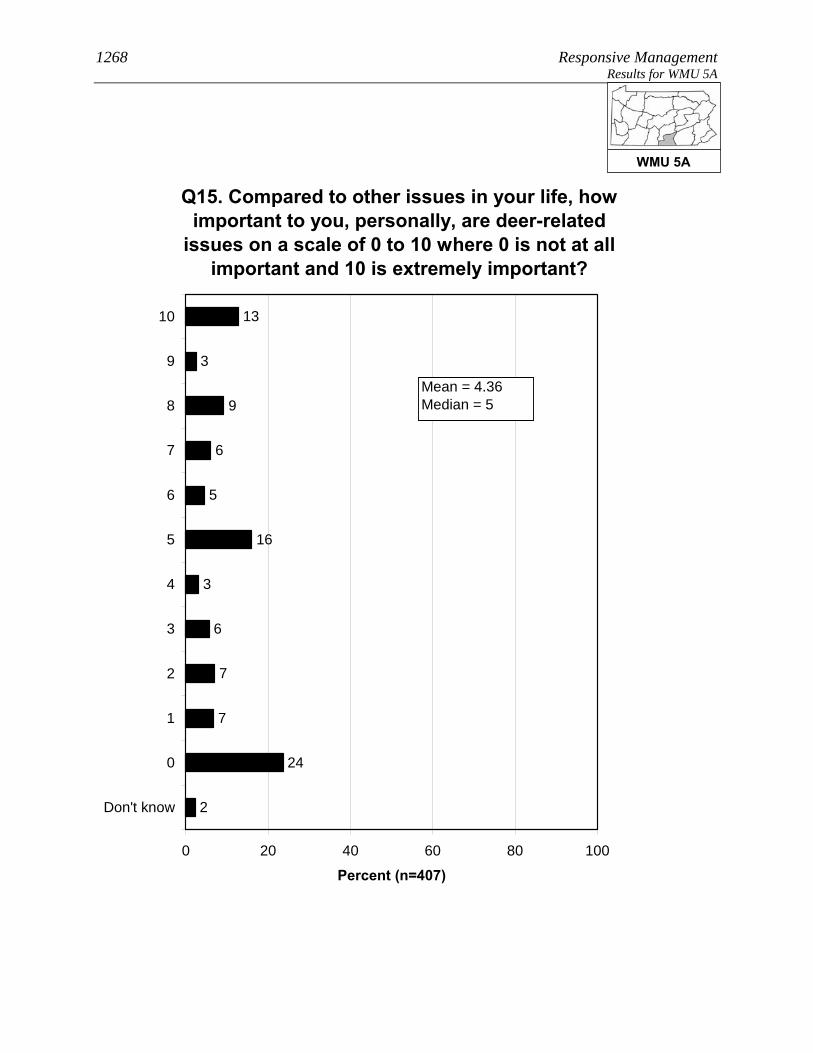
1268 Responsive Management Results for WMU 5A
Q15. Compared to other issues in your life, how important to you, personally, are deer-related
issues on a scale of 0 to 10 where 0 is not at all important and 10 is extremely important?
7
6
3
13
3
9
6
5
16
7
24
2
0 20 40 60 80 100
10
9
8
7
6
5
4
3
2
1
0
Don't know
Percent (n=407)
Mean = 4.36Median = 5
WMU 5A
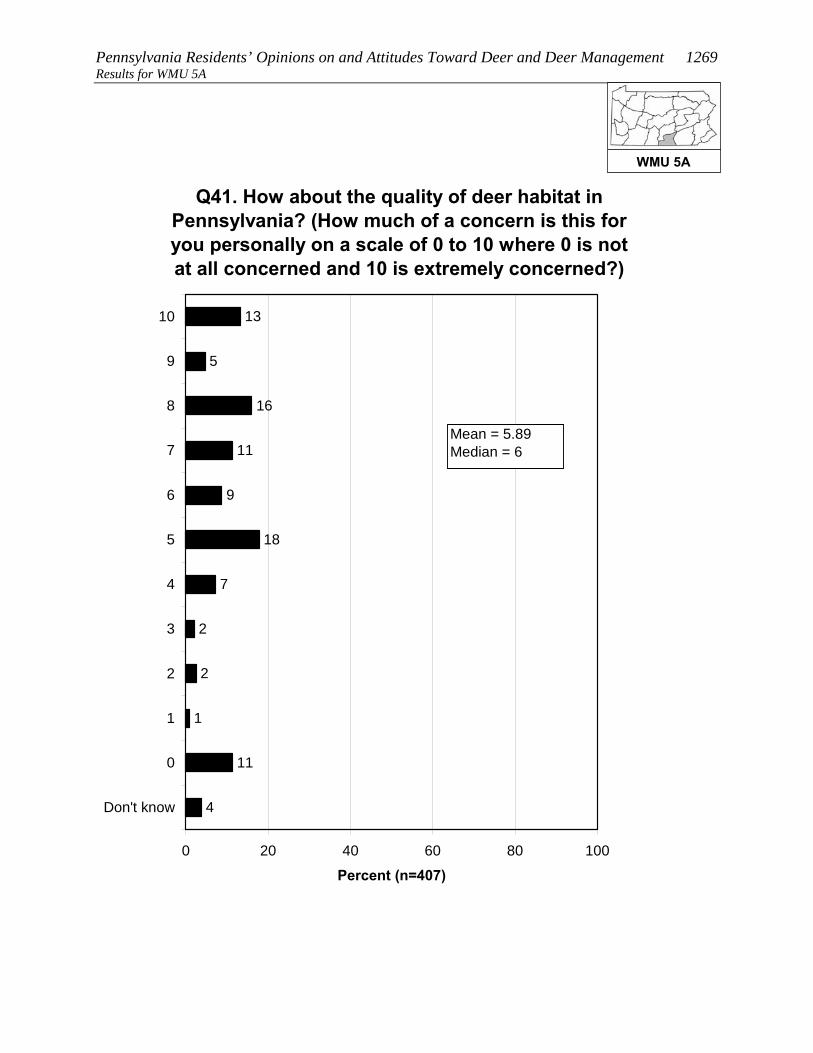
Pennsylvania Residents’ Opinions on and Attitudes Toward Deer and Deer Management 1269 Results for WMU 5A
Q41. How about the quality of deer habitat in Pennsylvania? (How much of a concern is this for you personally on a scale of 0 to 10 where 0 is not at all concerned and 10 is extremely concerned?)
2
2
7
13
5
16
11
9
18
1
11
4
0 20 40 60 80 100
10
9
8
7
6
5
4
3
2
1
0
Don't know
Percent (n=407)
Mean = 5.89Median = 6
WMU 5A
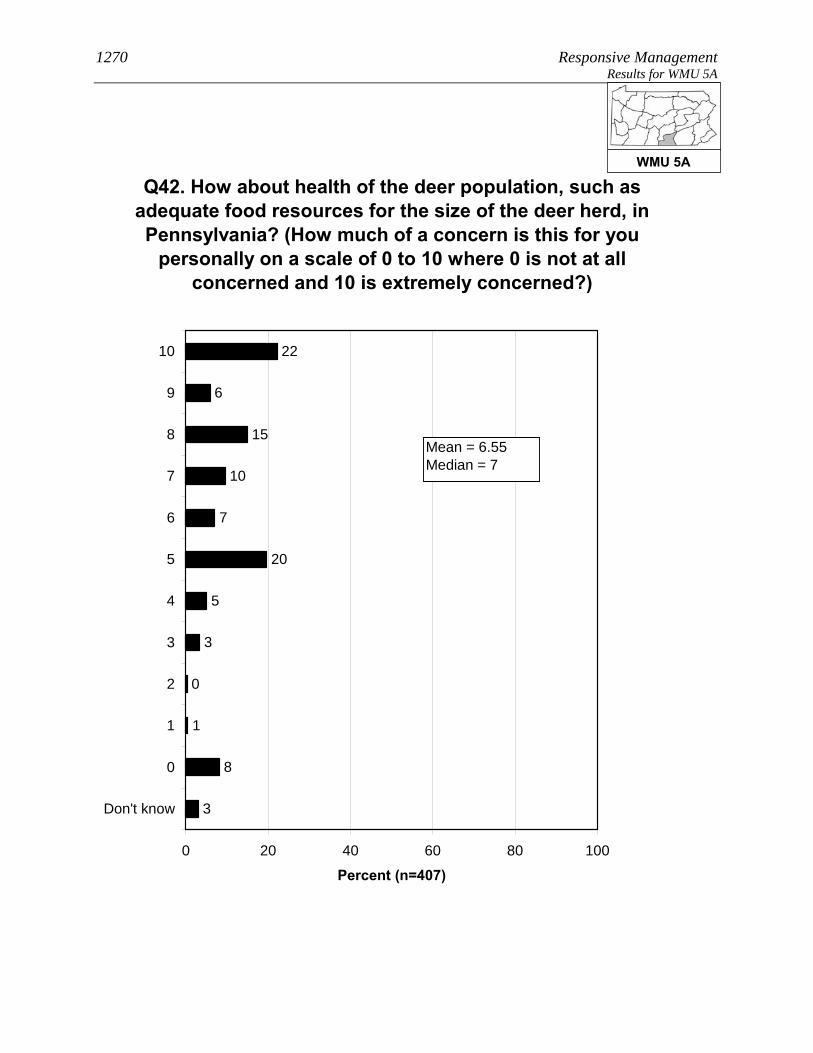
1270 Responsive Management Results for WMU 5A
0
3
5
22
6
15
10
7
20
1
8
3
0 20 40 60 80 100
10
9
8
7
6
5
4
3
2
1
0
Don't know
Percent (n=407)
Q42. How about health of the deer population, such as adequate food resources for the size of the deer herd, in Pennsylvania? (How much of a concern is this for you
personally on a scale of 0 to 10 where 0 is not at all concerned and 10 is extremely concerned?)
Mean = 6.55Median = 7
WMU 5A

Pennsylvania Residents’ Opinions on and Attitudes Toward Deer and Deer Management 1271 Results for WMU 5A
Q16. In your opinion, is the deer population in the area where you live too high, just right, or too low?
5
58
25
12
0 20 40 60 80 100
Too high
Just right
Too low
Don't know
Percent (n=407)
WMU 5A

1272 Responsive Management Results for WMU 5A
Q16. In your opinion, is the deer population in the area where you live too high, just right, or too low?
5
60
25
10
23
59
6
13
0 20 40 60 80 100
Too high
Just right
Too low
Don't know
Percent
Owns home (n=320)Does not own home (n=24)
WMU 5A

Pennsylvania Residents’ Opinions on and Attitudes Toward Deer and Deer Management 1273 Results for WMU 5A
Q16. In your opinion, is the deer population in the area where you live too high, just right, or too low?
6
50
41
3
19
61
5
16
0 20 40 60 80 100
Too high
Just right
Too low
Don't know
Percent
Consider themselves ahunter (n=119)Do not consider themselvesa hunter (n=286)
WMU 5A

1274 Responsive Management Results for WMU 5A
OPINIONS ON MANAGEMENT EFFORTS AND MANAGEMENT GOALS
The survey asked about three deer population management goals. For
all three, a large majority agree with the management goal: 89% agree
with managing the deer for a healthy and sustainable forest habitat,
92% agree with managing for healthy and sustainable deer
populations, and 87% agree with managing for safe, acceptable levels
of deer-human conflicts.
Residents of WMU 5A who said that the deer population in their area is too high or too low
were asked to indicate the reasonable number of years it should take to achieve an acceptable
deer population. The mean amount is 4.45 years. While 32% said that they do not know,
nearly all the rest gave a number of years of 10 or less. Note that this is only among those
who said the deer population was too high or too low.
• Because management plans typically look at a time frame of about 10 years to effect
change, the survey specifically asked if these respondents would be willing to wait
more than 10 years to achieve an acceptable deer population: just less than a majority
(48%) indicated that they would be willing to wait that long.
WMU 5A

Pennsylvania Residents’ Opinions on and Attitudes Toward Deer and Deer Management 1275 Results for WMU 5A
Q24-26. Deer populations should be managed for the following. (Do you agree or disagree with this
deer management goal?)
57
32
2
2
6
1
2
36
56
1
4
1
4
48
39
3
5
1
0 20 40 60 80 100
Stronglyagree
Moderatelyagree
Neither agreenor disagree
Moderatelydisagree
Stronglydisagree
Don't know
Percent (n=407)
Healthy and sustainableforest habitatHealthy and sustainabledeer populationsSafe and acceptable levelsof deer-human conflicts
WMU 5A
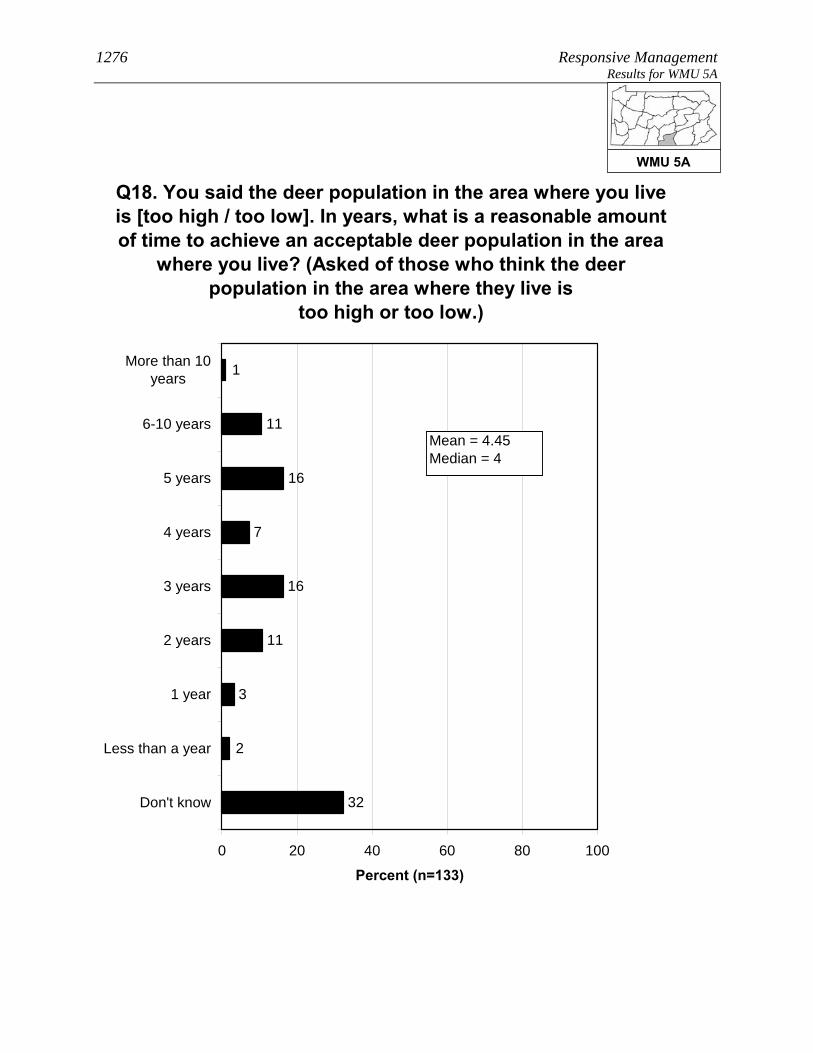
1276 Responsive Management Results for WMU 5A
32
2
3
1
11
16
7
16
11
0 20 40 60 80 100
More than 10years
6-10 years
5 years
4 years
3 years
2 years
1 year
Less than a year
Don't know
Percent (n=133)
Q18. You said the deer population in the area where you live is [too high / too low]. In years, what is a reasonable amount of time to achieve an acceptable deer population in the area
where you live? (Asked of those who think the deer population in the area where they live is
too high or too low.)
Mean = 4.45Median = 4
WMU 5A
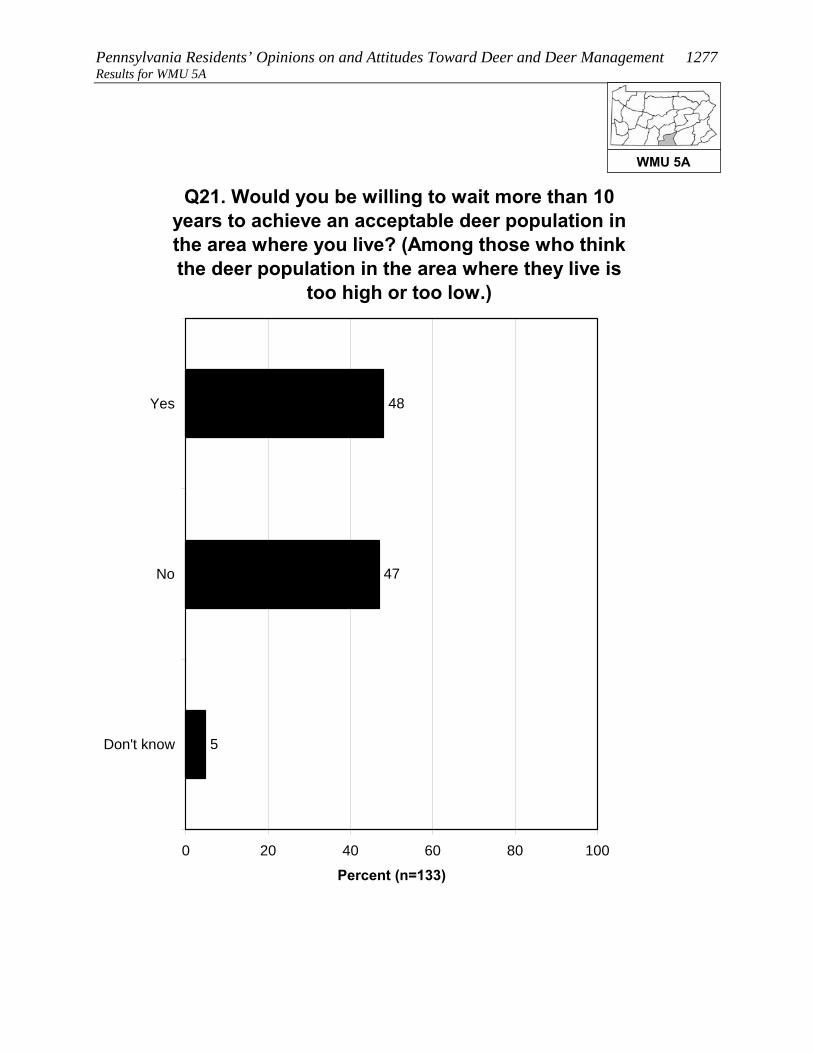
Pennsylvania Residents’ Opinions on and Attitudes Toward Deer and Deer Management 1277 Results for WMU 5A
Q21. Would you be willing to wait more than 10 years to achieve an acceptable deer population in the area where you live? (Among those who think the deer population in the area where they live is
too high or too low.)
48
47
5
0 20 40 60 80 100
Yes
No
Don't know
Percent (n=133)
WMU 5A
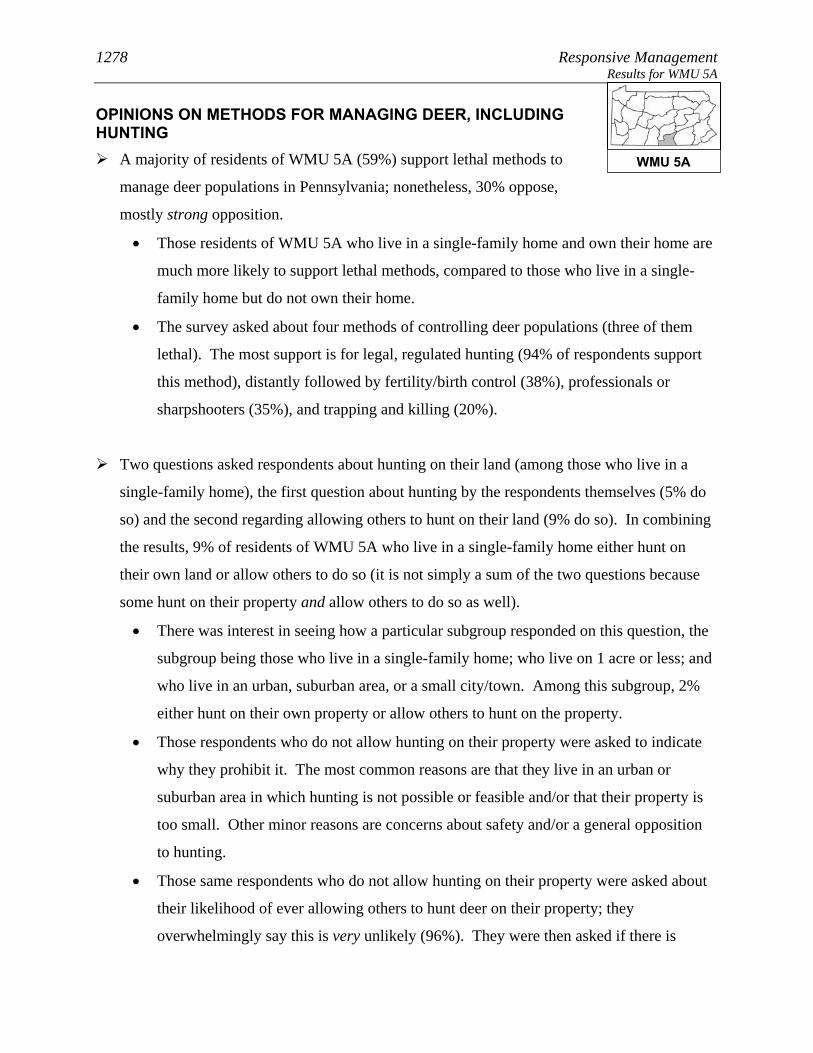
1278 Responsive Management Results for WMU 5A
OPINIONS ON METHODS FOR MANAGING DEER, INCLUDING HUNTING
A majority of residents of WMU 5A (59%) support lethal methods to
manage deer populations in Pennsylvania; nonetheless, 30% oppose,
mostly strong opposition.
• Those residents of WMU 5A who live in a single-family home and own their home are
much more likely to support lethal methods, compared to those who live in a single-
family home but do not own their home.
• The survey asked about four methods of controlling deer populations (three of them
lethal). The most support is for legal, regulated hunting (94% of respondents support
this method), distantly followed by fertility/birth control (38%), professionals or
sharpshooters (35%), and trapping and killing (20%).
Two questions asked respondents about hunting on their land (among those who live in a
single-family home), the first question about hunting by the respondents themselves (5% do
so) and the second regarding allowing others to hunt on their land (9% do so). In combining
the results, 9% of residents of WMU 5A who live in a single-family home either hunt on
their own land or allow others to do so (it is not simply a sum of the two questions because
some hunt on their property and allow others to do so as well).
• There was interest in seeing how a particular subgroup responded on this question, the
subgroup being those who live in a single-family home; who live on 1 acre or less; and
who live in an urban, suburban area, or a small city/town. Among this subgroup, 2%
either hunt on their own property or allow others to hunt on the property.
• Those respondents who do not allow hunting on their property were asked to indicate
why they prohibit it. The most common reasons are that they live in an urban or
suburban area in which hunting is not possible or feasible and/or that their property is
too small. Other minor reasons are concerns about safety and/or a general opposition
to hunting.
• Those same respondents who do not allow hunting on their property were asked about
their likelihood of ever allowing others to hunt deer on their property; they
overwhelmingly say this is very unlikely (96%). They were then asked if there is
WMU 5A

Pennsylvania Residents’ Opinions on and Attitudes Toward Deer and Deer Management 1279 Results for WMU 5A
anything that would make them more likely to allow deer hunting;
they overwhelmingly (96%) say that there is nothing that
would make them more likely to allow deer hunting.
• The question about allowing others to hunt on their property was examined among the
subgroup previously discussed (those who live in a single-family home; who live on 1
acre or less; and who live in an urban, suburban area, or a small city/town). Among
this group who got the question, nearly all say that they would never allow hunting.
o Additional follow-up questions to be asked of those who indicated that something
might prompt them to allow hunting on their property did not have enough
respondents for statistical validity; therefore, they are not shown.
WMU 5A

1280 Responsive Management Results for WMU 5A
Q27. In general, do you support or oppose lethal methods to manage deer populations in
Pennsylvania?
30
29
9
6
24
1
0 20 40 60 80 100
Strongly support
Moderatelysupport
Neither supportnor oppose
Moderately oppose
Strongly oppose
Don't know
Percent (n=407)
WMU 5A

Pennsylvania Residents’ Opinions on and Attitudes Toward Deer and Deer Management 1281 Results for WMU 5A
Q27. In general, do you support or oppose lethal methods to manage deer populations in
Pennsylvania?
34
30
7
6
23
1
29
11
25
0
31
3
0 20 40 60 80 100
Stronglysupport
Moderatelysupport
Neithersupport nor
oppose
Moderatelyoppose
Stronglyoppose
Don't know
Percent
Owns home (n=320)Does not own home (n=24)
WMU 5A
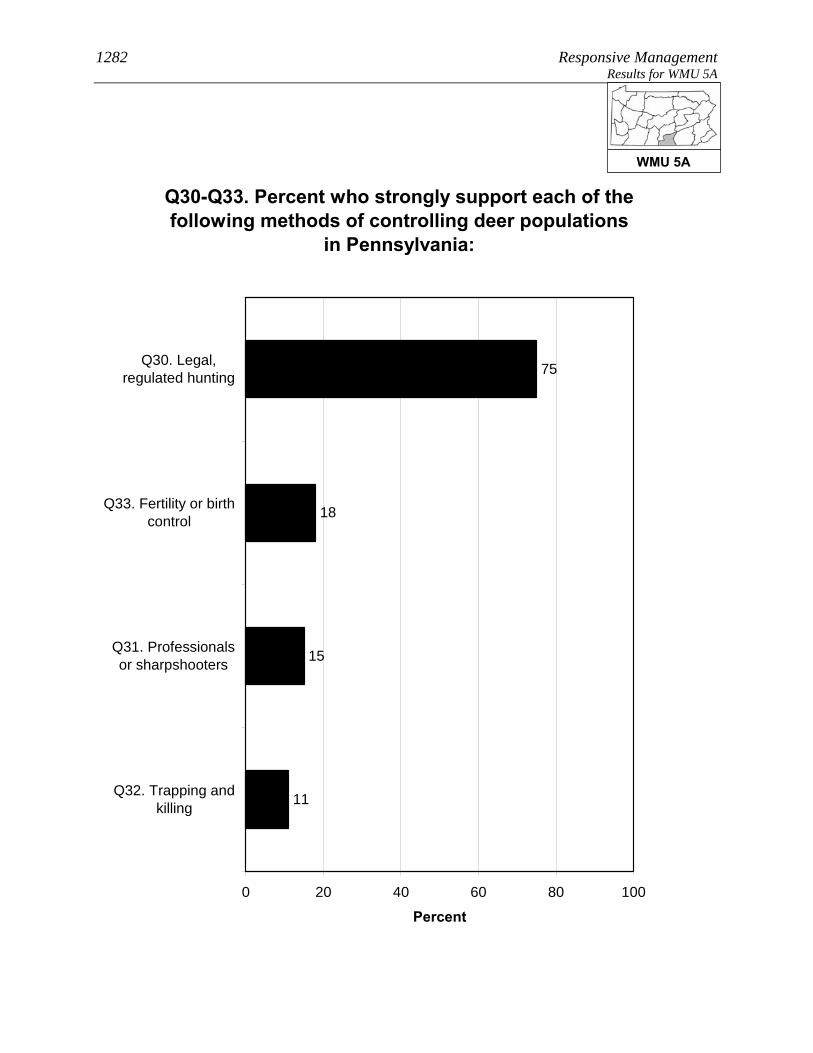
1282 Responsive Management Results for WMU 5A
Q30-Q33. Percent who strongly support each of the following methods of controlling deer populations
in Pennsylvania:
11
15
18
75
0 20 40 60 80 100
Q30. Legal,regulated hunting
Q33. Fertility or birthcontrol
Q31. Professionalsor sharpshooters
Q32. Trapping andkilling
Percent
WMU 5A
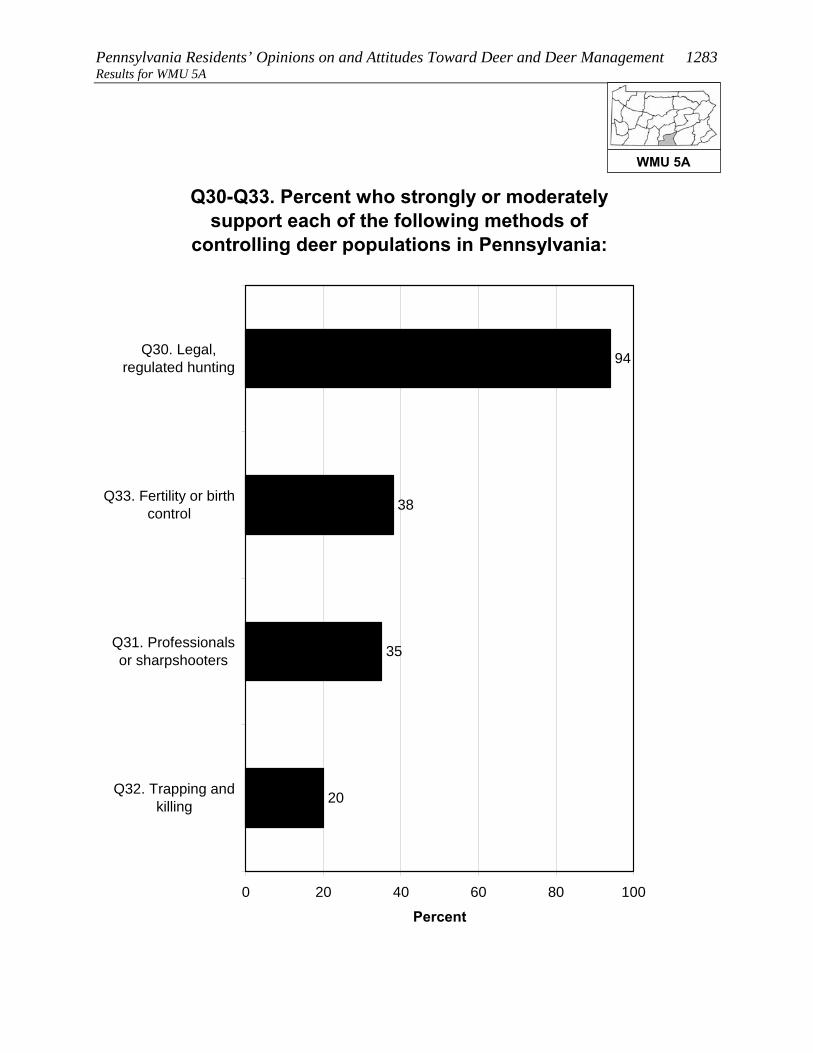
Pennsylvania Residents’ Opinions on and Attitudes Toward Deer and Deer Management 1283 Results for WMU 5A
Q30-Q33. Percent who strongly or moderately support each of the following methods of
controlling deer populations in Pennsylvania:
20
35
38
94
0 20 40 60 80 100
Q30. Legal,regulated hunting
Q33. Fertility or birthcontrol
Q31. Professionalsor sharpshooters
Q32. Trapping andkilling
Percent
WMU 5A

1284 Responsive Management Results for WMU 5A
Q30-Q33. Percent who strongly or moderately oppose each of the following methods of
controlling deer populations in Pennsylvania:
5
50
57
76
0 20 40 60 80 100
Q32. Trapping andkilling
Q31. Professionalsor sharpshooters
Q33. Fertility or birthcontrol
Q30. Legal,regulated hunting
Percent
WMU 5A

Pennsylvania Residents’ Opinions on and Attitudes Toward Deer and Deer Management 1285 Results for WMU 5A
Q30-Q33. Percent who strongly oppose each of the following methods of controlling deer populations
in Pennsylvania:
4
39
44
63
0 20 40 60 80 100
Q32. Trapping andkilling
Q31. Professionalsor sharpshooters
Q33. Fertility or birthcontrol
Q30. Legal,regulated hunting
Percent
WMU 5A

1286 Responsive Management Results for WMU 5A
Q59/60. Deer hunts and/or allows others to deer hunt on property. (Among respondents living in a
single-family home.)
9
90
0 20 40 60 80 100
Yes
No
Percent (n=344)
WMU 5A

Pennsylvania Residents’ Opinions on and Attitudes Toward Deer and Deer Management 1287 Results for WMU 5A
Q59/60. Deer hunts and/or allows others to deer hunt on property. (Among respondents living in a
single-family home.)
2
98
0 20 40 60 80 100
Yes
No
Percent
Lives in a single familyhome on 1 acre or less inan urban area, a suburbanarea, or a small city/town(n=153)
WMU 5A

1288 Responsive Management Results for WMU 5A
Q63. What are the main reasons you do not allow others to hunt deer on your property? (Asked of
those whose primary place of residence is a single-family home and who do not allow others to hunt
deer on their property.)
1
1
2
51
49
7
6
2
2
1
0 20 40 60 80 100
Live in residential neighborhood / suburban orurban area
Property is too small / neighbors too close
Concerned about safety
Oppose hunting in general
Liability
Not enough deer on property / not enoughhabitat
Live on rented property
Not interested in allowing hunting on property,but did not indicate opposition to hunting in
general
Want to save hunting opportunities for self /family
Concerned about bad behavior by hunters
Mul
tiple
Res
pons
es A
llow
ed
Percent (n=308)
WMU 5A
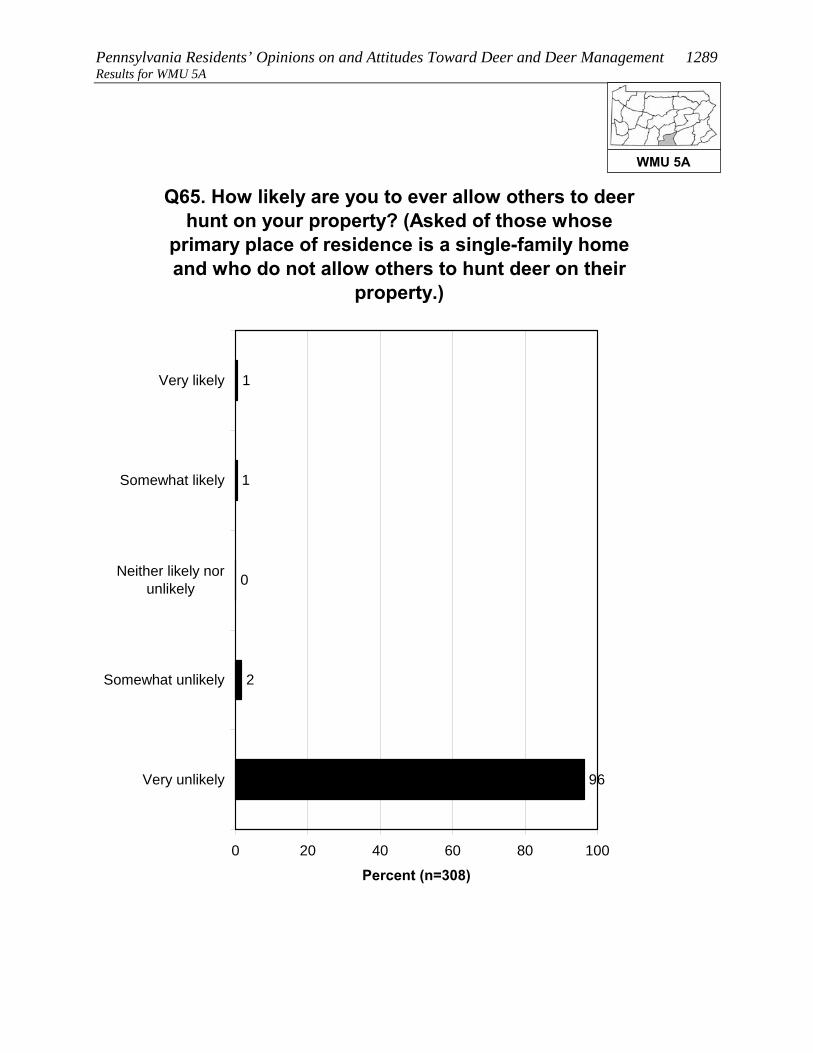
Pennsylvania Residents’ Opinions on and Attitudes Toward Deer and Deer Management 1289 Results for WMU 5A
Q65. How likely are you to ever allow others to deer hunt on your property? (Asked of those whose
primary place of residence is a single-family home and who do not allow others to hunt deer on their
property.)
1
1
0
2
96
0 20 40 60 80 100
Very likely
Somewhat likely
Neither likely norunlikely
Somewhat unlikely
Very unlikely
Percent (n=308)
WMU 5A

1290 Responsive Management Results for WMU 5A
Q66. Is there anything that would make you more likely to allow deer hunting on your property?
(Asked of those whose primary place of residence is a single-family home and who do not allow
others to hunt deer on their property.)
4
96
1
0 20 40 60 80 100
Yes
No
Don't know
Percent (n=308)
WMU 5A
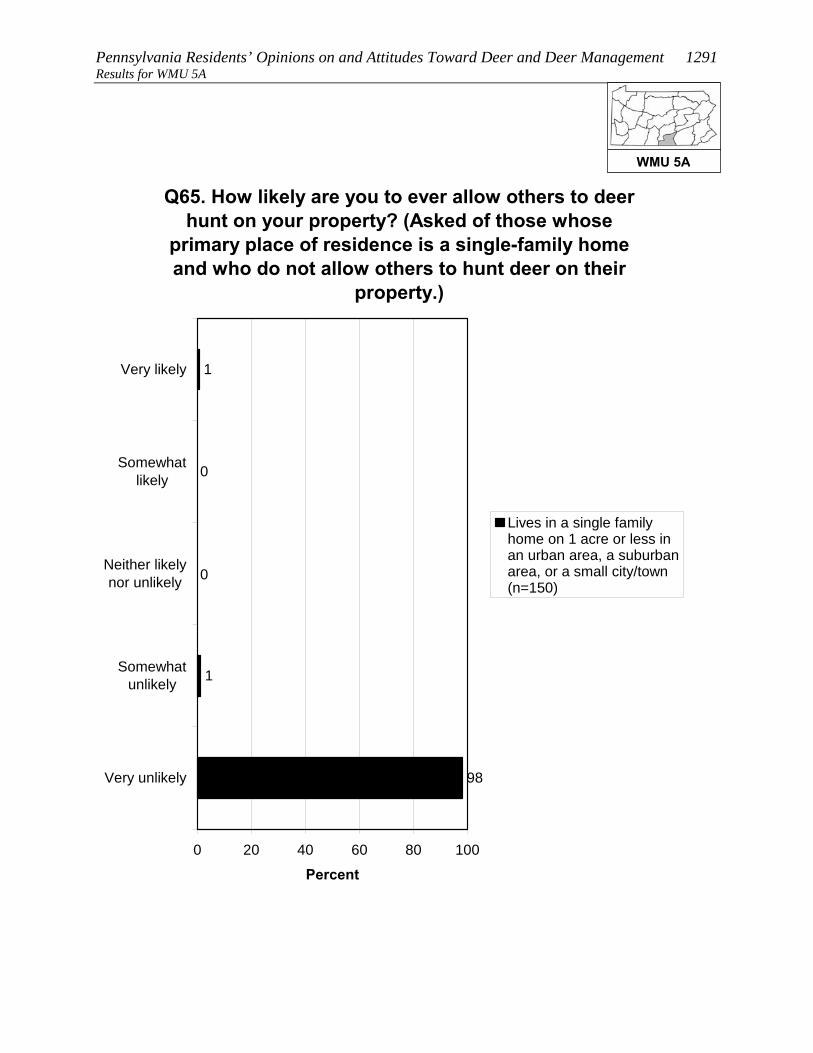
Pennsylvania Residents’ Opinions on and Attitudes Toward Deer and Deer Management 1291 Results for WMU 5A
Q65. How likely are you to ever allow others to deer hunt on your property? (Asked of those whose
primary place of residence is a single-family home and who do not allow others to hunt deer on their
property.)
1
0
0
1
98
0 20 40 60 80 100
Very likely
Somewhatlikely
Neither likelynor unlikely
Somewhatunlikely
Very unlikely
Percent
Lives in a single familyhome on 1 acre or less inan urban area, a suburbanarea, or a small city/town(n=150)
WMU 5A
1292 Responsive Management Results for WMU 5A
CONCERNS ABOUT DEER AND DEER NUISANCE PROBLEMS Seven questions asked about respondents’ level of concern about
issues associated with deer. For each issue, respondents rated their
level of concern about it using a 10-point scale, with 10 being the most
concerned.
• The most concern was for tick-borne diseases (mean rating of 7.2), followed by three
whose means are fairly close to one another: the health of the deer population (6.6),
deer-vehicle accidents (6.4), and the quality of deer habitat (5.9).
• At the bottom are concern about deer impacts on habitat and other wildlife (even
though this can be considerable) (3.9) and the two impacts to residents’ landscaping:
deer damage to plants and landscaping (1.5) and deer droppings in the yard (1.2).
o Another graph shows the percentage who gave a high rating (a “9” or “10”),
providing an idea of the percentage who feel strongly about the issues.
Half of residents of WMU 5A (50%) indicated that they saw deer on their property in the
past 12 months.
• Respondents who fed birds were more likely to indicate seeing deer, as were
respondents who fed deer or put out attractants or were aware of neighbors who fed
deer or put out attractants.
The survey asked about specific nuisance problems with deer that residents of WMU 5A may
have experienced: 4% indicated that they experienced problems with deer at their primary
place of residence in the past 12 months; 9% indicated that they or another household
member had been in a vehicle collision with a deer (fortunately, a very low portion of
drivers/passengers were injured); and 7% indicated that they or a household member had
been diagnosed with a tick-borne disease.
• Crosstabulations show that those who fed birds were slightly more likely to have
experienced deer problems. Likewise, those who were aware of neighbors feeding deer
or putting out attractants were much more likely to experience deer problems.
WMU 5A

Pennsylvania Residents’ Opinions on and Attitudes Toward Deer and Deer Management 1293 Results for WMU 5A
Q36-Q42. Mean rating of respondents' concern about each of the following on a 10-point scale:
1.5
3.9
5.9
6.4
6.6
7.2
1.2
0 2 4 6 8 10
Q36. Tick-borne diseases, such as Lymedisease, in Pennsylvania
Q42. The health of the deer population,such as adequate food resources for the
size of the deer herd, in Pennsylvania
Q40. Deer-vehicle accidents inPennsylvania
Q41. The quality of deer habitat inPennsylvania
Q39. Deer impacts on the habitat andother wildlife in Pennsylvania
Q38. Deer damage to plants andlandscaping in his/her yard
Q37. Deer droppings in his/her yard
Mean
WMU 5A

1294 Responsive Management Results for WMU 5A
Q36-Q42. Percent who rated their concern about each of the following as a 9 or 10 on a 10-point
scale:
4
7
18
24
28
43
3
0 20 40 60 80 100
Q36. Tick-borne diseases, such as Lymedisease, in Pennsylvania
Q42. The health of the deer population,such as adequate food resources for the
size of the deer herd, in Pennsylvania
Q40. Deer-vehicle accidents inPennsylvania
Q41. The quality of deer habitat inPennsylvania
Q39. Deer impacts on the habitat andother wildlife in Pennsylvania
Q37. Deer droppings in his/her yard
Q38. Deer damage to plants andlandscaping in his/her yard
Percent
WMU 5A
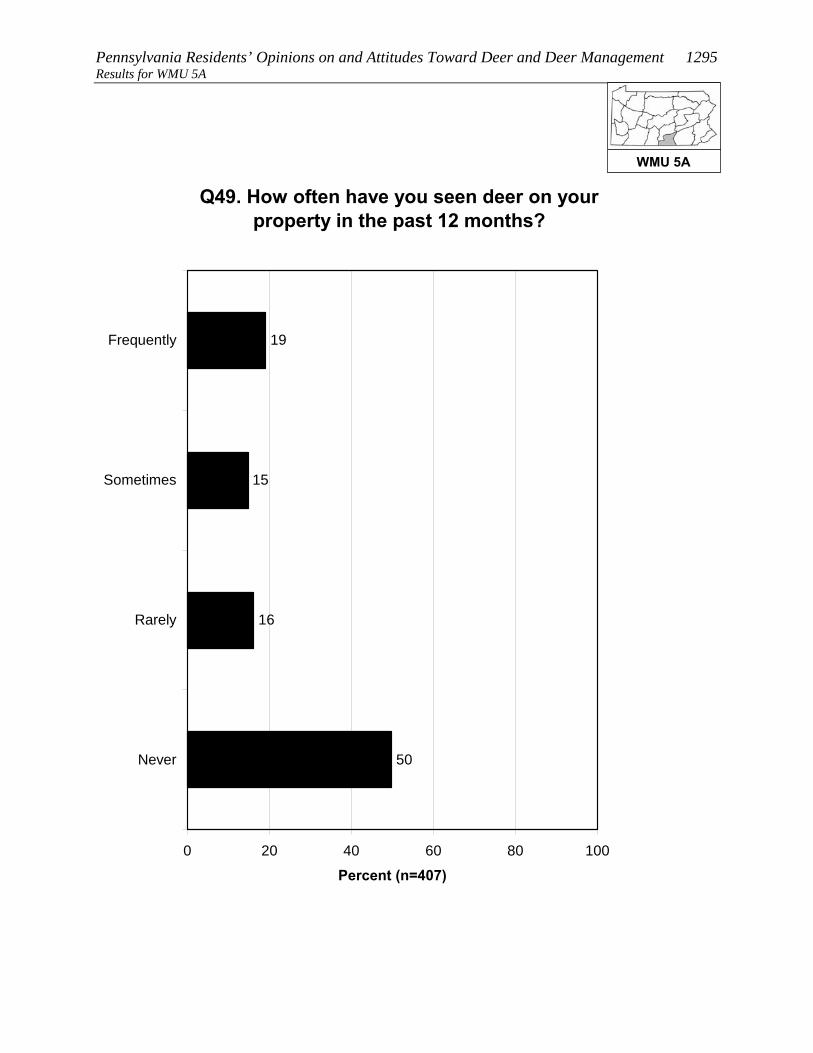
Pennsylvania Residents’ Opinions on and Attitudes Toward Deer and Deer Management 1295 Results for WMU 5A
Q49. How often have you seen deer on your property in the past 12 months?
19
15
16
50
0 20 40 60 80 100
Frequently
Sometimes
Rarely
Never
Percent (n=407)
WMU 5A
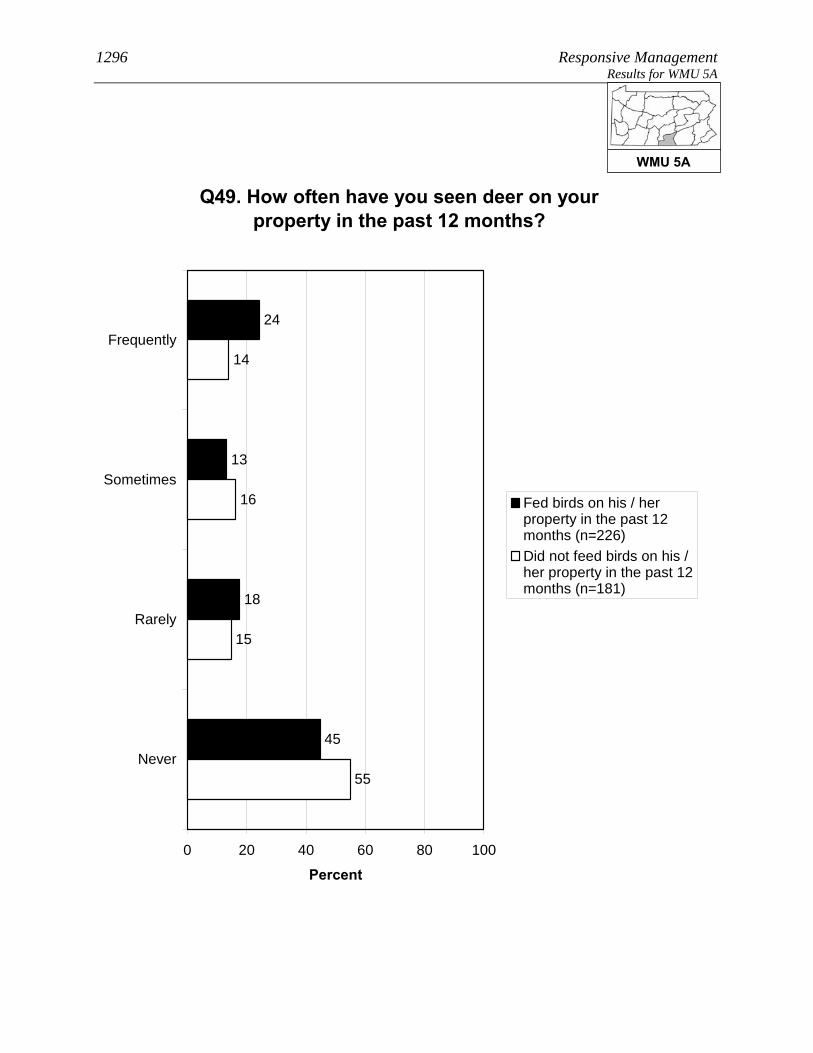
1296 Responsive Management Results for WMU 5A
Q49. How often have you seen deer on your property in the past 12 months?
24
13
18
45
15
16
14
55
0 20 40 60 80 100
Frequently
Sometimes
Rarely
Never
Percent
Fed birds on his / herproperty in the past 12months (n=226)Did not feed birds on his /her property in the past 12months (n=181)
WMU 5A

Pennsylvania Residents’ Opinions on and Attitudes Toward Deer and Deer Management 1297 Results for WMU 5A
Q49. How often have you seen deer on your property in the past 12 months?
55
19
16
10
16
14
14
55
0 20 40 60 80 100
Frequently
Sometimes
Rarely
Never
Percent
Has fed deer or put outattractants in the past 12months (n=43)Has not fed deer or put outattractants in the past 12months (n=364)
WMU 5A

1298 Responsive Management Results for WMU 5A
Q49. How often have you seen deer on your property in the past 12 months?
47
20
8
25
17
14
16
53
0 20 40 60 80 100
Frequently
Sometimes
Rarely
Never
Percent
Is aware of neighborsfeeding deer or putting outattractants (n=45)Is not aware of neighborsfeeding deer or putting outattractants (n=358)
WMU 5A

Pennsylvania Residents’ Opinions on and Attitudes Toward Deer and Deer Management 1299 Results for WMU 5A
Q43. In the past 12 months, have you experienced any problems with deer at your primary place of
residence?
4
96
0 20 40 60 80 100
Yes
No
Percent (n=407)
WMU 5A

1300 Responsive Management Results for WMU 5A
Q43. In the past 12 months, have you experienced any problems with deer at your primary place of
residence?
6
94
98
2
0 20 40 60 80 100
Yes
No
Percent
Fed birds on his / herproperty in the past 12months (n=226)Did not feed birds on his /her property in the past 12months (n=181)
WMU 5A
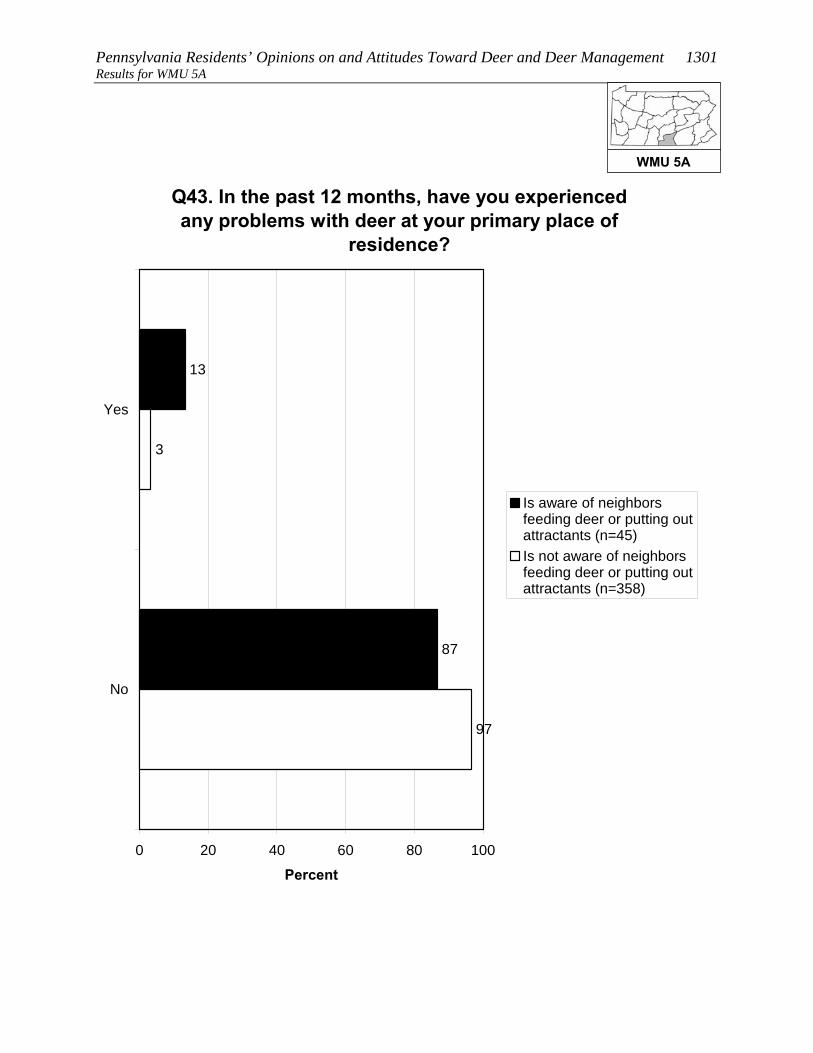
Pennsylvania Residents’ Opinions on and Attitudes Toward Deer and Deer Management 1301 Results for WMU 5A
Q43. In the past 12 months, have you experienced any problems with deer at your primary place of
residence?
13
87
97
3
0 20 40 60 80 100
Yes
No
Percent
Is aware of neighborsfeeding deer or putting outattractants (n=45)Is not aware of neighborsfeeding deer or putting outattractants (n=358)
WMU 5A
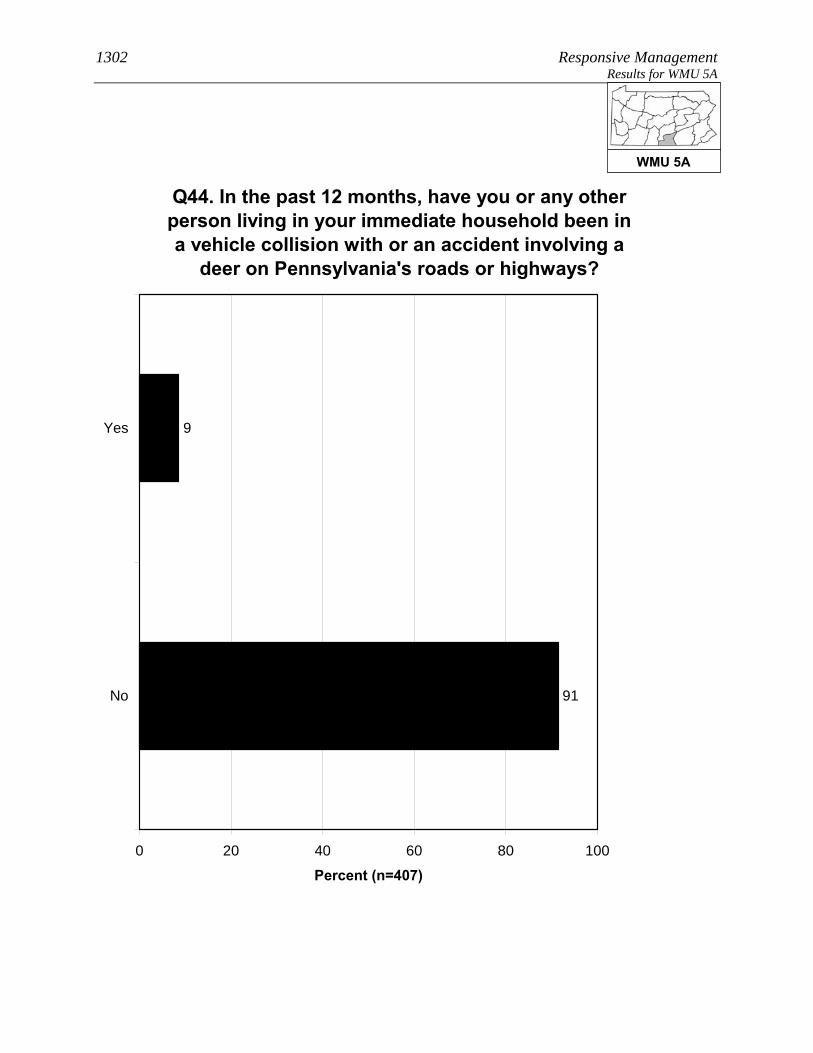
1302 Responsive Management Results for WMU 5A
Q44. In the past 12 months, have you or any other person living in your immediate household been in a vehicle collision with or an accident involving a
deer on Pennsylvania's roads or highways?
9
91
0 20 40 60 80 100
Yes
No
Percent (n=407)
WMU 5A
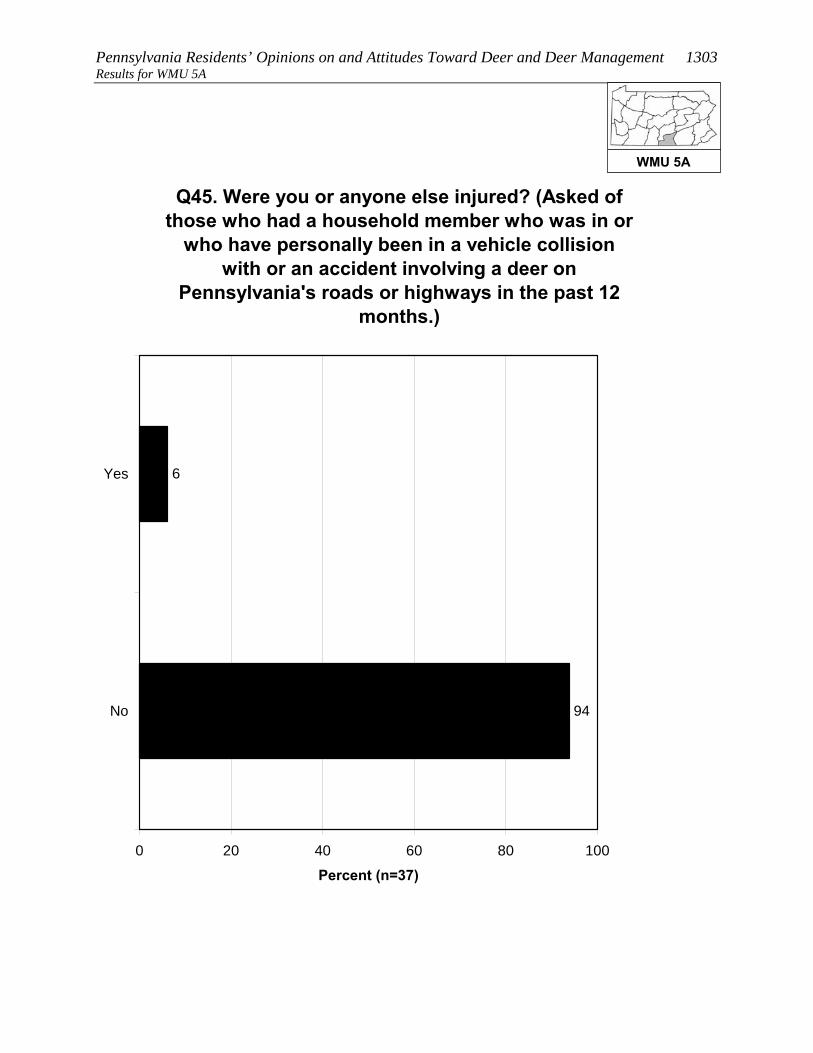
Pennsylvania Residents’ Opinions on and Attitudes Toward Deer and Deer Management 1303 Results for WMU 5A
Q45. Were you or anyone else injured? (Asked of those who had a household member who was in or
who have personally been in a vehicle collision with or an accident involving a deer on
Pennsylvania's roads or highways in the past 12 months.)
6
94
0 20 40 60 80 100
Yes
No
Percent (n=37)
WMU 5A

1304 Responsive Management Results for WMU 5A
Q46. In the past 12 months, have you or any other person living in your immediate household been
diagnosed by a physician with a tick-borne disease, such as Lyme disease?
7
93
0 20 40 60 80 100
Yes
No
Percent (n=407)
WMU 5A
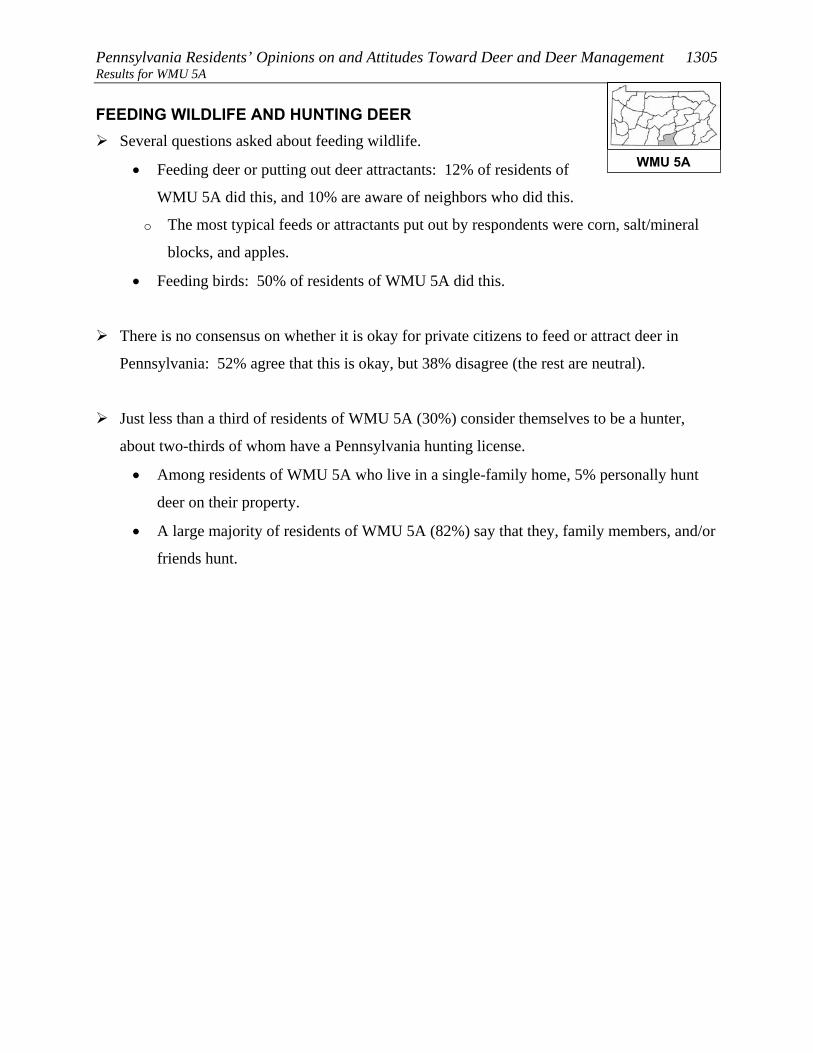
Pennsylvania Residents’ Opinions on and Attitudes Toward Deer and Deer Management 1305 Results for WMU 5A FEEDING WILDLIFE AND HUNTING DEER
Several questions asked about feeding wildlife.
• Feeding deer or putting out deer attractants: 12% of residents of
WMU 5A did this, and 10% are aware of neighbors who did this.
o The most typical feeds or attractants put out by respondents were corn, salt/mineral
blocks, and apples.
• Feeding birds: 50% of residents of WMU 5A did this.
There is no consensus on whether it is okay for private citizens to feed or attract deer in
Pennsylvania: 52% agree that this is okay, but 38% disagree (the rest are neutral).
Just less than a third of residents of WMU 5A (30%) consider themselves to be a hunter,
about two-thirds of whom have a Pennsylvania hunting license.
• Among residents of WMU 5A who live in a single-family home, 5% personally hunt
deer on their property.
• A large majority of residents of WMU 5A (82%) say that they, family members, and/or
friends hunt.
WMU 5A

1306 Responsive Management Results for WMU 5A
Q50. Did you ever feed deer intentionally or put out attractants, such as a salt or mineral block, in the
past 12 months?
12
88
0 20 40 60 80 100
Yes
No
Percent (n=407)
WMU 5A
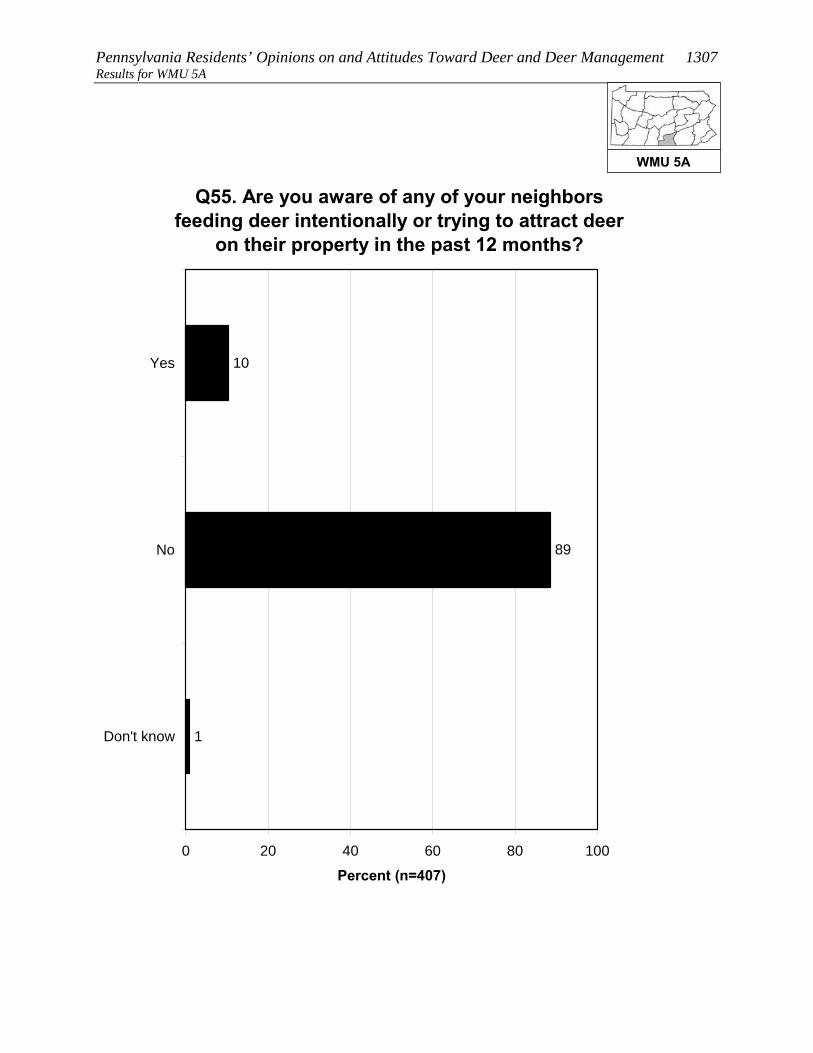
Pennsylvania Residents’ Opinions on and Attitudes Toward Deer and Deer Management 1307 Results for WMU 5A
Q55. Are you aware of any of your neighbors feeding deer intentionally or trying to attract deer
on their property in the past 12 months?
10
89
1
0 20 40 60 80 100
Yes
No
Don't know
Percent (n=407)
WMU 5A

1308 Responsive Management Results for WMU 5A
Q53. What type of feed or attractant did you use? (Asked of those who fed deer intentionally or put
out attractants in the past 12 months.)
1
1
53
37
28
12
3
1
0 20 40 60 80 100
Corn
Salt / mineralblock
Apples
Pellets /commercial
feed
Birdseed
Bread
Other foodproducts
Food plot
Mul
tiple
Res
pons
es A
llow
ed
Percent (n=43)
WMU 5A
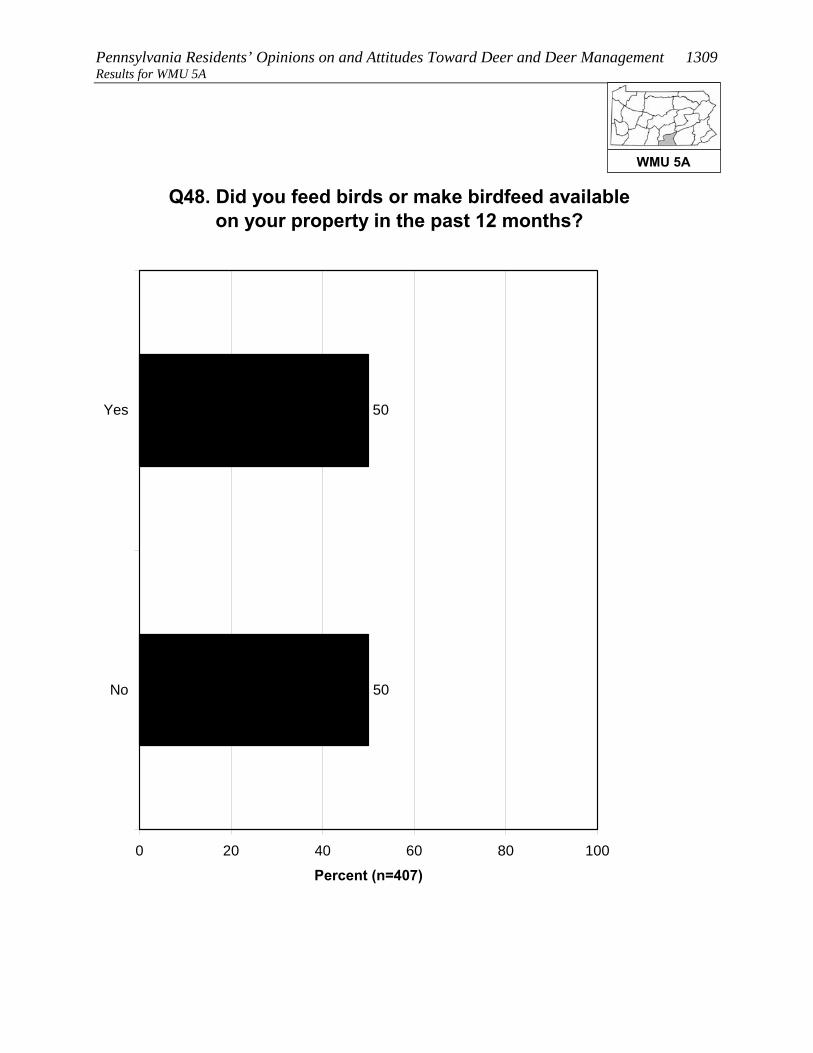
Pennsylvania Residents’ Opinions on and Attitudes Toward Deer and Deer Management 1309 Results for WMU 5A
Q48. Did you feed birds or make birdfeed available on your property in the past 12 months?
50
50
0 20 40 60 80 100
Yes
No
Percent (n=407)
WMU 5A

1310 Responsive Management Results for WMU 5A
Q56. Do you agree or disagree that it is OK for private citizens to feed or attract deer in
Pennsylvania?
24
28
8
12
26
0 20 40 60 80 100
Strongly agree
Moderately agree
Neither agree nordisagree
Moderatelydisagree
Strongly disagree
Percent (n=407)
WMU 5A

Pennsylvania Residents’ Opinions on and Attitudes Toward Deer and Deer Management 1311 Results for WMU 5A
Q59. Do you personally hunt deer on your property? (Asked of those whose primary place of
residence is a single-family home.)
5
95
0 20 40 60 80 100
Yes
No
Percent (n=344)
WMU 5A
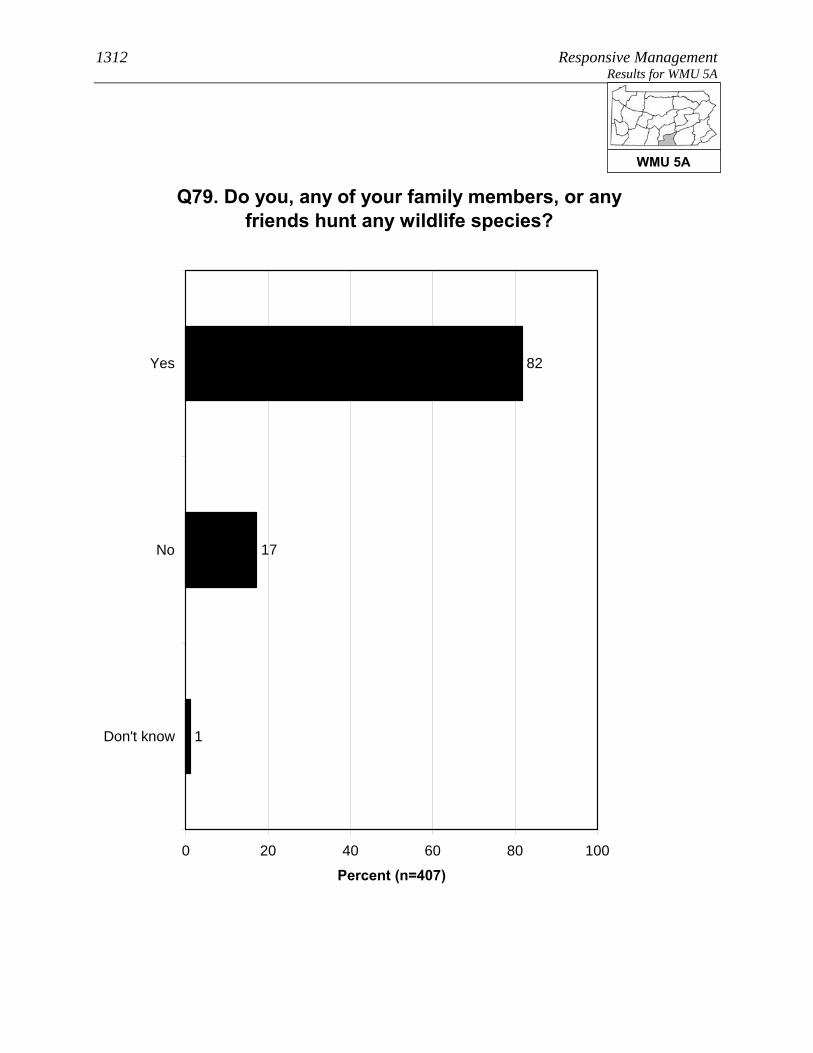
1312 Responsive Management Results for WMU 5A
Q79. Do you, any of your family members, or any friends hunt any wildlife species?
82
17
1
0 20 40 60 80 100
Yes
No
Don't know
Percent (n=407)
WMU 5A

Pennsylvania Residents’ Opinions on and Attitudes Toward Deer and Deer Management 1313 Results for WMU 5A SOURCES OF INFORMATION
Most commonly, residents of WMU 5A say that the best way to
provide them with information about deer in Pennsylvania is through
direct mail (41% gave this response), followed by newspaper (15%),
email (12%), TV (12%), and the Internet (10% saying an Internet site
other than the PGC and 5% saying the agency website; note that some
said both).
A little more than two-fifths of residents of WMU 5A (42%) use social media, the most
common primary site being Facebook.
WMU 5A

1314 Responsive Management Results for WMU 5A
Q82. What is the best way to provide you with information about deer in Pennsylvania? We are not sending out information at this time; we are
just measuring interest.
2
3
3
41
15
12
12
10
5
2
2
2
11
0 20 40 60 80 100
Direct mail
Newspaper
TV
Internet / website other thanPGC website
PA Game Commission website
Radio
PA Game Commission offices
Brochures or pamphlets
PA Hunting and Trapping Digest
Magazines
Telephone
Don't know
Mul
tiple
Res
pons
es A
llow
ed
Percent (n=407)
WMU 5A

Pennsylvania Residents’ Opinions on and Attitudes Toward Deer and Deer Management 1315 Results for WMU 5A
Q84. Do you use social media, such as Facebook, Twitter, or YouTube?
42
57
1
0 20 40 60 80 100
Yes
No
Don't know
Percent (n=407)
WMU 5A

1316 Responsive Management Results for WMU 5A
Q85. Which social media site do you use most often? (Asked of those who use social media.)
92
6
1
0 20 40 60 80 100
YouTube
Percent (n=126)
WMU 5A

Pennsylvania Residents’ Opinions on and Attitudes Toward Deer and Deer Management 1317 Results for WMU 5B
RESULTS FOR WMU 5B Location: From the Maryland/PA state line, PA Rt. 94 north to US Rt. 15 near York Springs; US Rt. 15 north to I-81 near Harrisburg; I-81 east to I-78 to PA Rt. 61 near Hamburg; Rt. 61 south to US Rt. 222 near Reading; Rt. 222 south to I-76; I-76 east to PA Rt. 10 near Morgantown; PA Rt. 10 south to PA Rt. 372 near Parkesburg; PA Rt. 372 west to Octoraro Creek near Christiana and then south to the Maryland state line.
8. Lives in WMU 5B 1. Does not consider deer-related issues as a 9 or 10 in importance as compared to other issues in his/her life (p < 0.01). 2. Does not indicate having seen deer frequently on his/her property in the past 12 months (p < 0.001). 3. Does not indicate having fed deer intentionally or having put out attractants in the past 12 months (p < 0.001). 3. Does not indicate having spent time viewing or watching deer around home in the past 12 months (p < 0.001). 3. Does not indicate considering himself/herself to be a hunter (p < 0.05). 3. Does not indicate having a valid 2011 PA general hunting license (p < 0.05). 4. Strongly or moderately supports fertility or birth control as a method of controlling deer populations in PA (p < 0.01). 5. Does not indicate that he/she or another person living in the immediate household has been in a vehicle collision with or an accident involving a deer on PA's roads or highways in the past 12 months (p < 0.01). 5. Does not indicate having experienced any problems with deer at his/her primary place of residence in the past 12 months (p < 0.05). 5. Does not rate concern about deer-vehicle accidents in PA as a 9 or 10 (p < 0.05). 5. Does not rate concern about tick-borne diseases in PA as a 9 or a 10 (p < 0.05). 8. Considers place of residence to be an urban or suburban area (p < 0.001). 8. Has more than median number of people living in his/her household (p < 0.01). 8. Has lived at his/her primary place of residence for the median number of years or less (p < 0.01). See page 9 through 11 for explanation of how to interpret z-score tables.
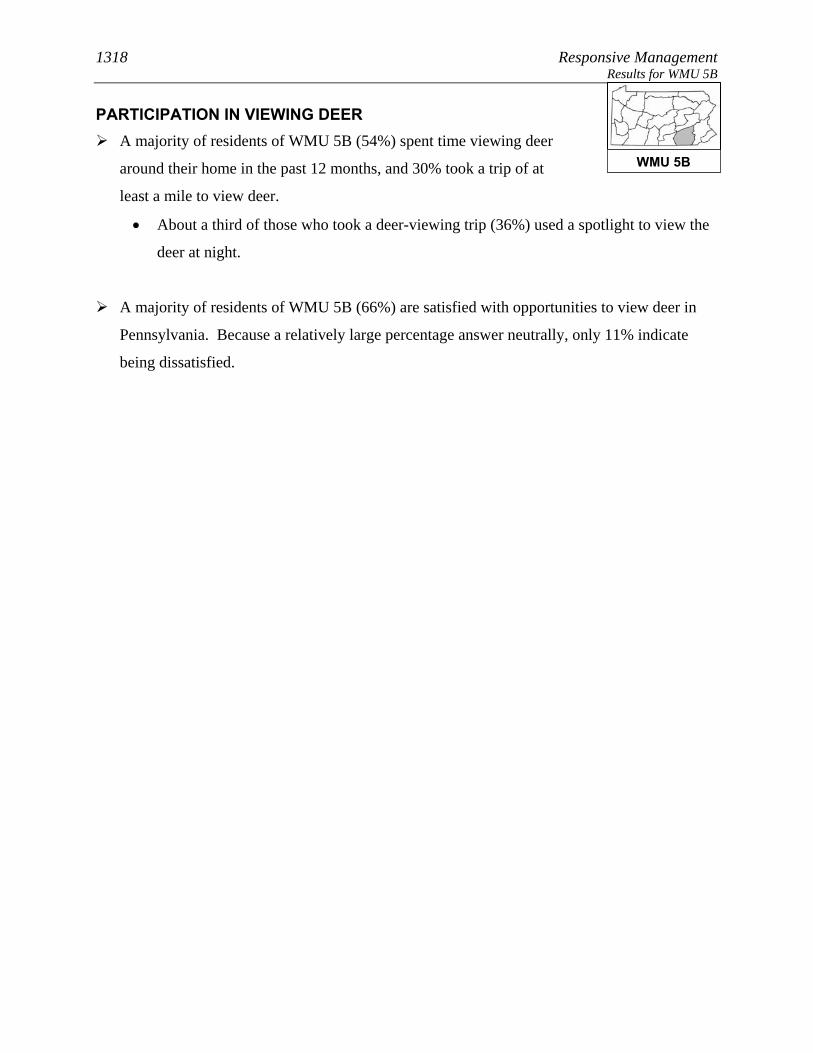
1318 Responsive Management Results for WMU 5B
PARTICIPATION IN VIEWING DEER A majority of residents of WMU 5B (54%) spent time viewing deer
around their home in the past 12 months, and 30% took a trip of at
least a mile to view deer.
• About a third of those who took a deer-viewing trip (36%) used a spotlight to view the
deer at night.
A majority of residents of WMU 5B (66%) are satisfied with opportunities to view deer in
Pennsylvania. Because a relatively large percentage answer neutrally, only 11% indicate
being dissatisfied.
WMU 5B

Pennsylvania Residents’ Opinions on and Attitudes Toward Deer and Deer Management 1319 Results for WMU 5B
Q10. Have you spent time viewing or watching deer around your home in the past 12 months?
54
46
0 20 40 60 80 100
Yes
No
Percent (n=429)
WMU 5B

1320 Responsive Management Results for WMU 5B
Q11. Have you taken a trip at least 1 mile from your home for the primary purpose of viewing or
watching deer in the past 12 months?
30
70
0 20 40 60 80 100
Yes
No
Percent (n=429)
WMU 5B

Pennsylvania Residents’ Opinions on and Attitudes Toward Deer and Deer Management 1321 Results for WMU 5B
Q12. Did you use a spotlight to view deer at night on a trip to watch deer in the past 12 months?
(Asked of those who took a trip at least 1 mile from their home for the primary purpose of viewing or
watching deer in the past 12 months.)
36
64
0 20 40 60 80 100
Yes
No
Percent (n=126)
WMU 5B
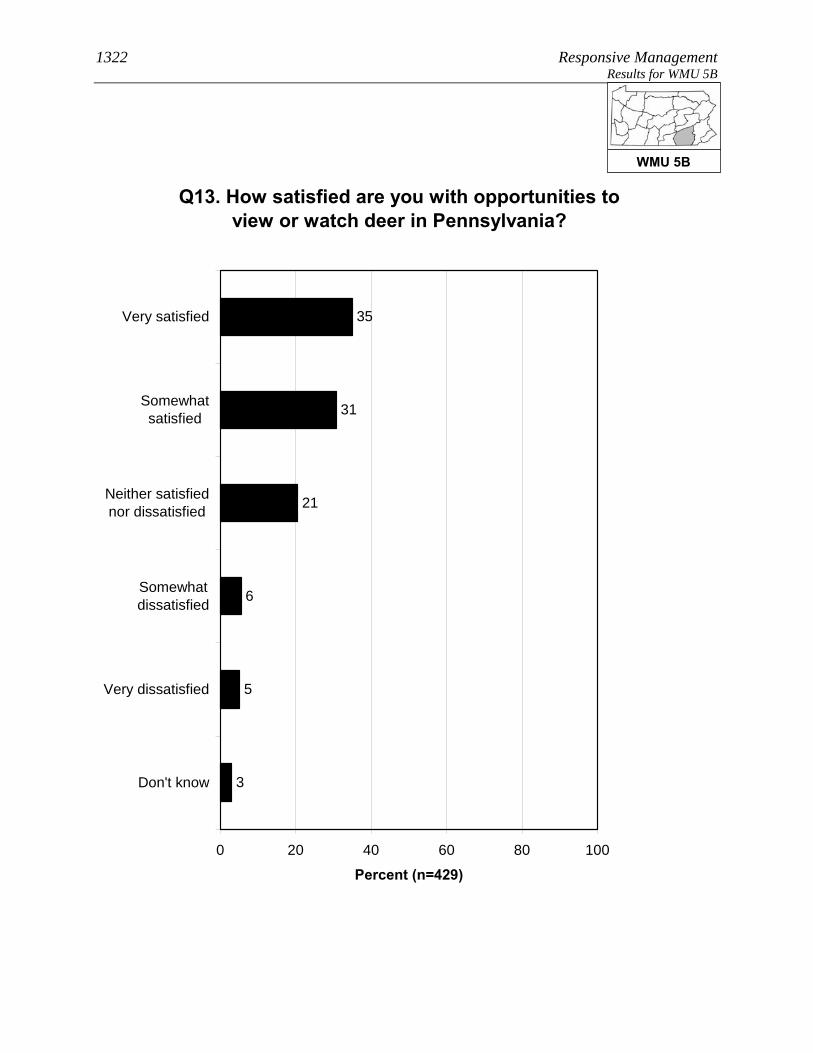
1322 Responsive Management Results for WMU 5B
Q13. How satisfied are you with opportunities to view or watch deer in Pennsylvania?
35
31
21
6
5
3
0 20 40 60 80 100
Very satisfied
Somewhatsatisfied
Neither satisfiednor dissatisfied
Somewhatdissatisfied
Very dissatisfied
Don't know
Percent (n=429)
WMU 5B
Pennsylvania Residents’ Opinions on and Attitudes Toward Deer and Deer Management 1323 Results for WMU 5B OPINIONS ON DEER IN GENERAL AND THE SIZE AND HEALTH OF THE DEER HERD
Opinion on deer is mostly favorable: 54% of residents of WMU 5B
say with no caveats that they like having deer around, another 26%
like having deer around but worry about the problems they may cause,
and only 4% generally regard them as a nuisance. The remainder have
no particular feeling about deer.
Another question asked residents of WMU 5B how deer-related issues compared to other
issues in their life, on a scale of 0 to 10, with the most importance being 10: the median
rating is “4.” The most common ratings are the midpoint of “5” (20%) and “0” (17%). In
general, ratings are well spread across the scale.
Two other ratings questions asked respondents to rate their concern about deer-related issues.
The median level of concern is “6” for the quality of deer habitat in Pennsylvania and “7” for
the health of the deer population in Pennsylvania.
The survey asked about the perceived size of the deer herd in the respondent’s area. The
majority of residents of WMU 5B say that the herd size is just right (58%); otherwise, more
say that it is too low (21%) than too high (13%).
• Those who own their home are less likely, compared to those who do not own their
home, to say that the deer population in their area is just right; they are more likely to
say that the deer population is either too high or too low.
• Those who consider themselves to be a hunter are more likely to say that the deer
population in their area is too low, compared to those who are not hunters.
WMU 5B
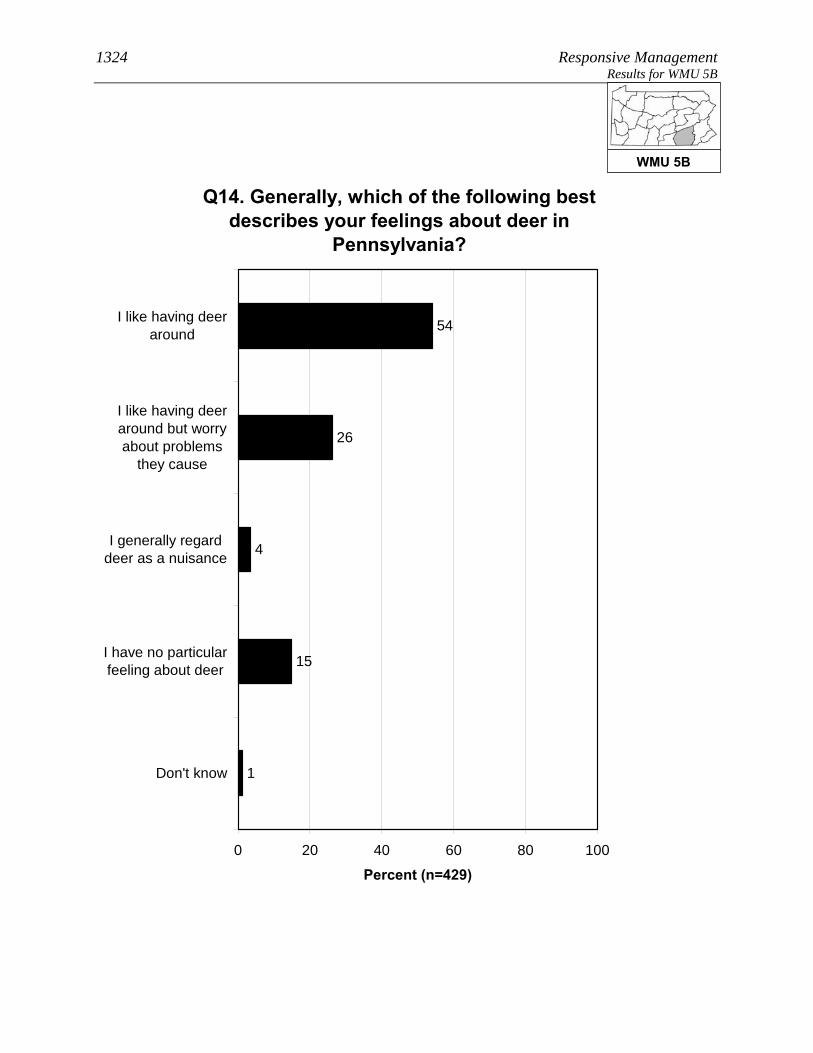
1324 Responsive Management Results for WMU 5B
Q14. Generally, which of the following best describes your feelings about deer in
Pennsylvania?
54
26
4
15
1
0 20 40 60 80 100
I like having deeraround
I like having deeraround but worryabout problems
they cause
I generally regarddeer as a nuisance
I have no particularfeeling about deer
Don't know
Percent (n=429)
WMU 5B
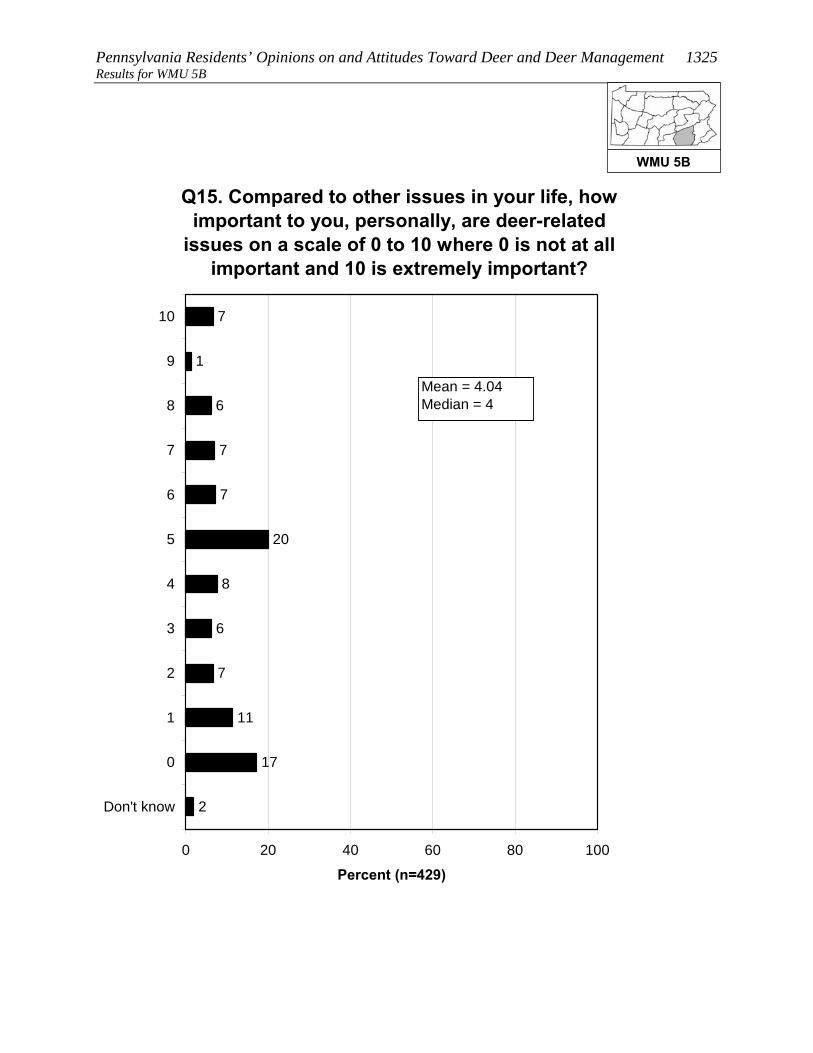
Pennsylvania Residents’ Opinions on and Attitudes Toward Deer and Deer Management 1325 Results for WMU 5B
Q15. Compared to other issues in your life, how important to you, personally, are deer-related
issues on a scale of 0 to 10 where 0 is not at all important and 10 is extremely important?
7
6
8
7
1
6
7
7
20
11
17
2
0 20 40 60 80 100
10
9
8
7
6
5
4
3
2
1
0
Don't know
Percent (n=429)
Mean = 4.04Median = 4
WMU 5B

1326 Responsive Management Results for WMU 5B
Q41. How about the quality of deer habitat in Pennsylvania? (How much of a concern is this for you personally on a scale of 0 to 10 where 0 is not at all concerned and 10 is extremely concerned?)
3
5
4
14
4
14
10
13
24
3
4
2
0 20 40 60 80 100
10
9
8
7
6
5
4
3
2
1
0
Don't know
Percent (n=429)
Mean = 6.07Median = 6
WMU 5B

Pennsylvania Residents’ Opinions on and Attitudes Toward Deer and Deer Management 1327 Results for WMU 5B
1
2
5
18
4
18
14
7
18
2
6
4
0 20 40 60 80 100
10
9
8
7
6
5
4
3
2
1
0
Don't know
Percent (n=429)
Q42. How about health of the deer population, such as adequate food resources for the size of the deer herd, in Pennsylvania? (How much of a concern is this for you
personally on a scale of 0 to 10 where 0 is not at all concerned and 10 is extremely concerned?)
Mean = 6.55Median = 7
WMU 5B
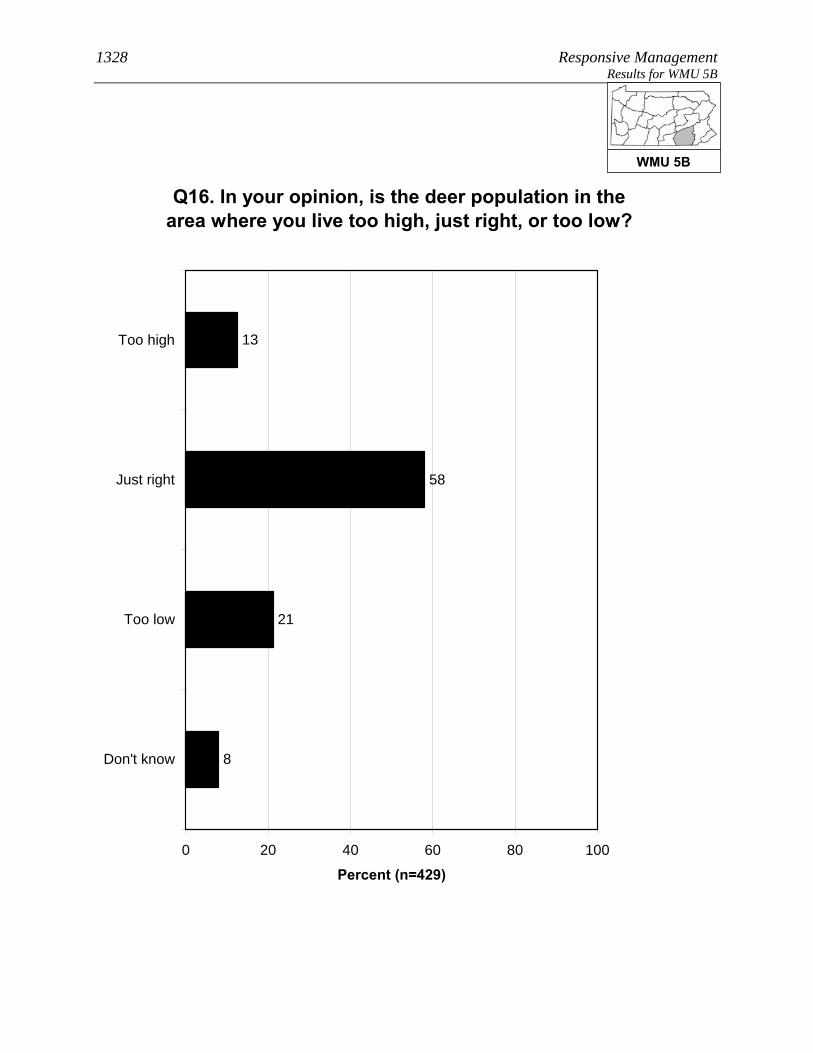
1328 Responsive Management Results for WMU 5B
Q16. In your opinion, is the deer population in the area where you live too high, just right, or too low?
13
58
21
8
0 20 40 60 80 100
Too high
Just right
Too low
Don't know
Percent (n=429)
WMU 5B

Pennsylvania Residents’ Opinions on and Attitudes Toward Deer and Deer Management 1329 Results for WMU 5B
Q16. In your opinion, is the deer population in the area where you live too high, just right, or too low?
14
57
21
7
13
74
10
3
0 20 40 60 80 100
Too high
Just right
Too low
Don't know
Percent
Owns home (n=340)Does not own home (n=27)
WMU 5B

1330 Responsive Management Results for WMU 5B
Q16. In your opinion, is the deer population in the area where you live too high, just right, or too low?
8
50
40
1
14
61
14
11
0 20 40 60 80 100
Too high
Just right
Too low
Don't know
Percent
Consider themselves ahunter (n=128)Do not consider themselvesa hunter (n=301)
WMU 5B

Pennsylvania Residents’ Opinions on and Attitudes Toward Deer and Deer Management 1331 Results for WMU 5B OPINIONS ON MANAGEMENT EFFORTS AND MANAGEMENT GOALS
The survey asked about three deer population management goals. For
all three, a large majority agree with the management goal, but the
most support is for goals that address ecological concerns rather than
human concerns: 91% agree with managing for healthy and
sustainable deer populations, 87% agree with managing the deer for a
healthy and sustainable forest habitat, and 81% agree with managing
for safe, acceptable levels of deer-human conflicts.
Residents of WMU 5B who said that the deer population in their area is too high or too low
were asked to indicate the reasonable number of years it should take to achieve an acceptable
deer population. The mean amount is 4.90 years. While 37% said that they do not know,
nearly all the rest gave a number of years of 10 or less. Note that this is only among those
who said the deer population was too high or too low.
• Because management plans typically look at a time frame of about 10 years to effect
change, the survey specifically asked if these respondents would be willing to wait
more than 10 years to achieve an acceptable deer population: a majority (59%)
indicated that they would be willing to wait that long.
WMU 5B
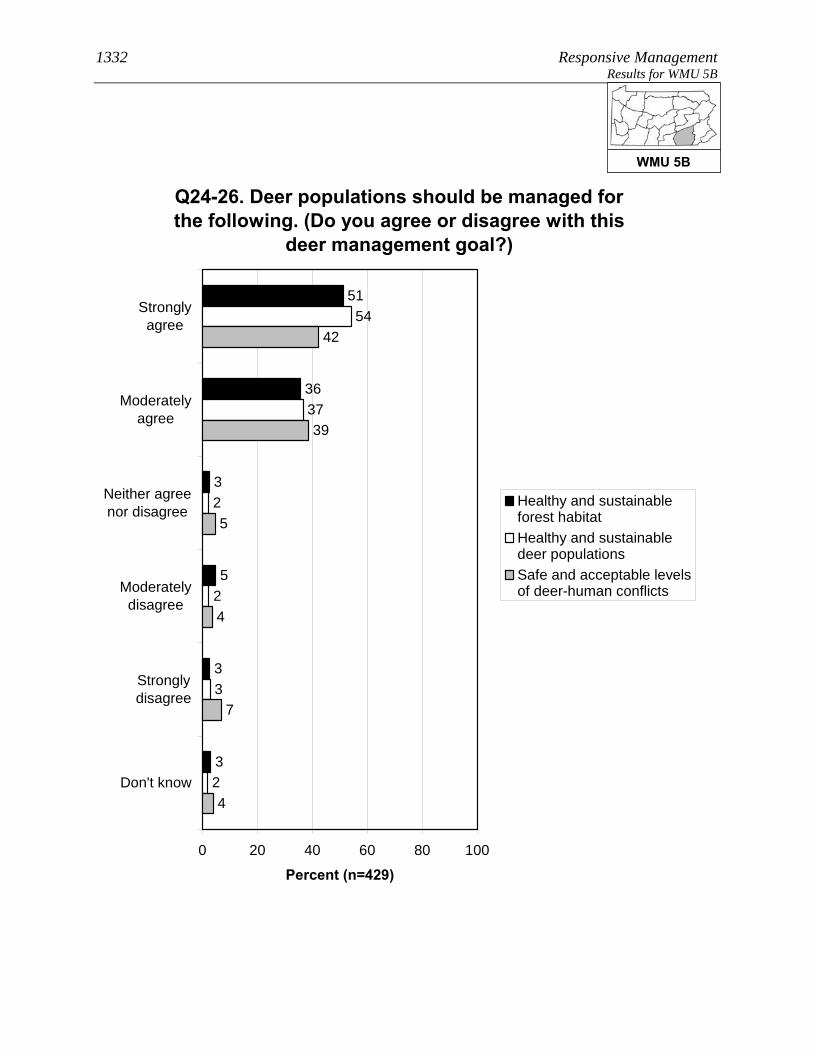
1332 Responsive Management Results for WMU 5B
Q24-26. Deer populations should be managed for the following. (Do you agree or disagree with this
deer management goal?)
51
36
3
5
3
3
2
37
54
2
3
2
4
42
39
5
7
4
0 20 40 60 80 100
Stronglyagree
Moderatelyagree
Neither agreenor disagree
Moderatelydisagree
Stronglydisagree
Don't know
Percent (n=429)
Healthy and sustainableforest habitatHealthy and sustainabledeer populationsSafe and acceptable levelsof deer-human conflicts
WMU 5B

Pennsylvania Residents’ Opinions on and Attitudes Toward Deer and Deer Management 1333 Results for WMU 5B
37
0
3
0
15
24
3
6
11
0 20 40 60 80 100
More than 10years
6-10 years
5 years
4 years
3 years
2 years
1 year
Less than a year
Don't know
Percent (n=141)
Q18. You said the deer population in the area where you live is [too high / too low]. In years, what is a reasonable amount of time to achieve an acceptable deer population in the area
where you live? (Asked of those who think the deer population in the area where they live is
too high or too low.)
Mean = 4.90Median = 5
WMU 5B
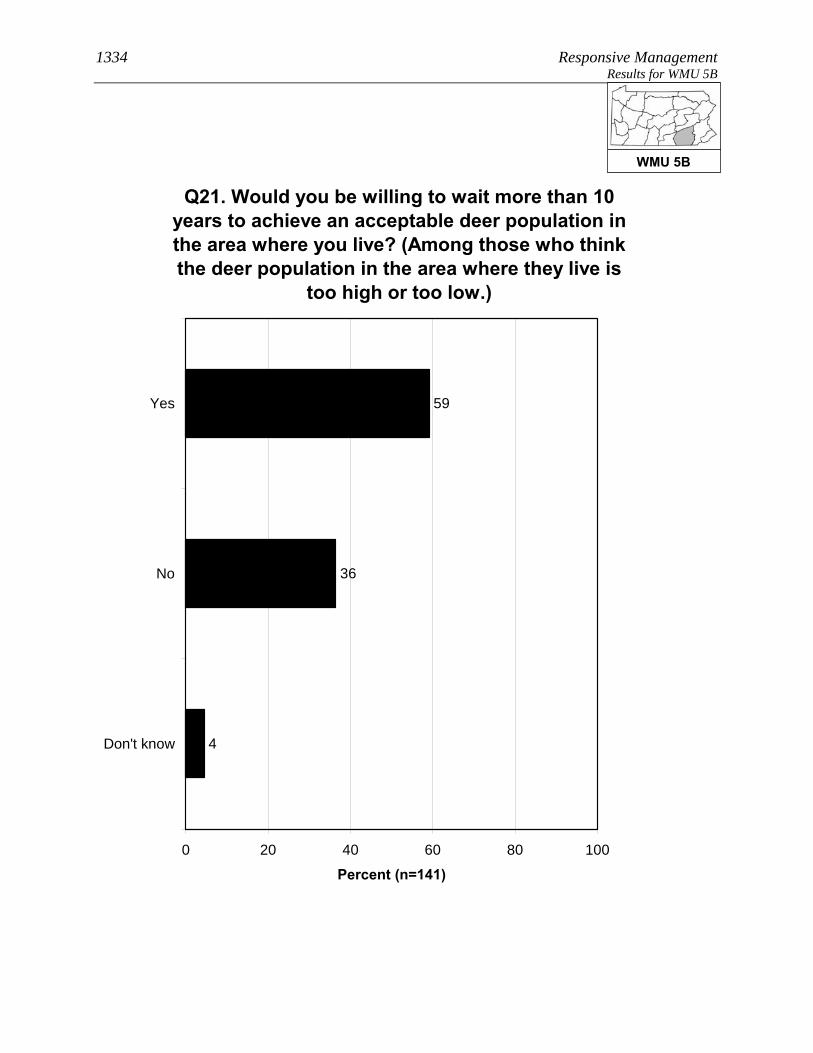
1334 Responsive Management Results for WMU 5B
Q21. Would you be willing to wait more than 10 years to achieve an acceptable deer population in the area where you live? (Among those who think the deer population in the area where they live is
too high or too low.)
59
36
4
0 20 40 60 80 100
Yes
No
Don't know
Percent (n=141)
WMU 5B

Pennsylvania Residents’ Opinions on and Attitudes Toward Deer and Deer Management 1335 Results for WMU 5B OPINIONS ON METHODS FOR MANAGING DEER, INCLUDING HUNTING
A majority of residents of WMU 5B (62%) support lethal methods to
manage deer populations in Pennsylvania; nonetheless, 27% oppose,
mostly strong opposition.
• Those residents of WMU 5B who live in a single-family home and own their home are
much more likely to support lethal methods, compared to those who live in a single-
family home but do not own their home.
• The survey asked about four methods of controlling deer populations (three of them
lethal). The most support is for legal, regulated hunting (88% of respondents support
this method), distantly followed by fertility/birth control (41%), professionals or
sharpshooters (30%), and trapping and killing (24%).
Two questions asked respondents about hunting on their land (among those who live in a
single-family home), the first question about hunting by the respondents themselves (10% do
so) and the second regarding allowing others to hunt on their land (14% do so). In
combining the results, 17% of residents of WMU 5B who live in a single-family home either
hunt on their own land or allow others to do so (it is not simply a sum of the two questions
because some hunt on their property and allow others to do so as well).
• There was interest in seeing how a particular subgroup responded on this question, the
subgroup being those who live in a single-family home; who live on 1 acre or less; and
who live in an urban, suburban area, or a small city/town. Among this subgroup, 3%
either hunt on their own property or allow others to hunt on the property.
• Those respondents who do not allow hunting on their property were asked to indicate
why they prohibit it. The most common reasons are that their property is too small
and/or that they live in an urban or suburban area in which hunting is not possible or
feasible. Other minor reasons are concerns about safety, a general opposition to
hunting, and the feeling that there are not enough deer around.
• Those same respondents who do not allow hunting on their property were asked about
their likelihood of ever allowing others to hunt deer on their property; they
overwhelmingly say this is very unlikely (94%). They were then asked if there is
WMU 5B
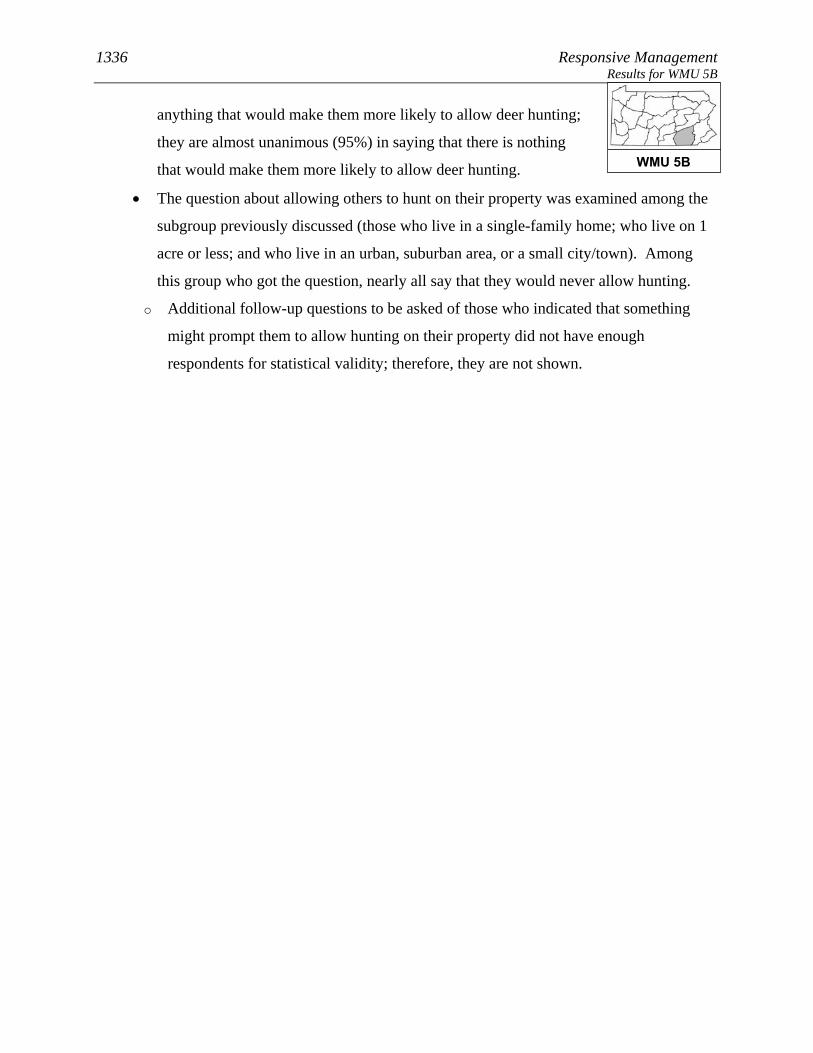
1336 Responsive Management Results for WMU 5B
anything that would make them more likely to allow deer hunting;
they are almost unanimous (95%) in saying that there is nothing
that would make them more likely to allow deer hunting.
• The question about allowing others to hunt on their property was examined among the
subgroup previously discussed (those who live in a single-family home; who live on 1
acre or less; and who live in an urban, suburban area, or a small city/town). Among
this group who got the question, nearly all say that they would never allow hunting.
o Additional follow-up questions to be asked of those who indicated that something
might prompt them to allow hunting on their property did not have enough
respondents for statistical validity; therefore, they are not shown.
WMU 5B

Pennsylvania Residents’ Opinions on and Attitudes Toward Deer and Deer Management 1337 Results for WMU 5B
Q27. In general, do you support or oppose lethal methods to manage deer populations in
Pennsylvania?
35
27
8
9
18
4
0 20 40 60 80 100
Strongly support
Moderatelysupport
Neither supportnor oppose
Moderately oppose
Strongly oppose
Don't know
Percent (n=429)
WMU 5B
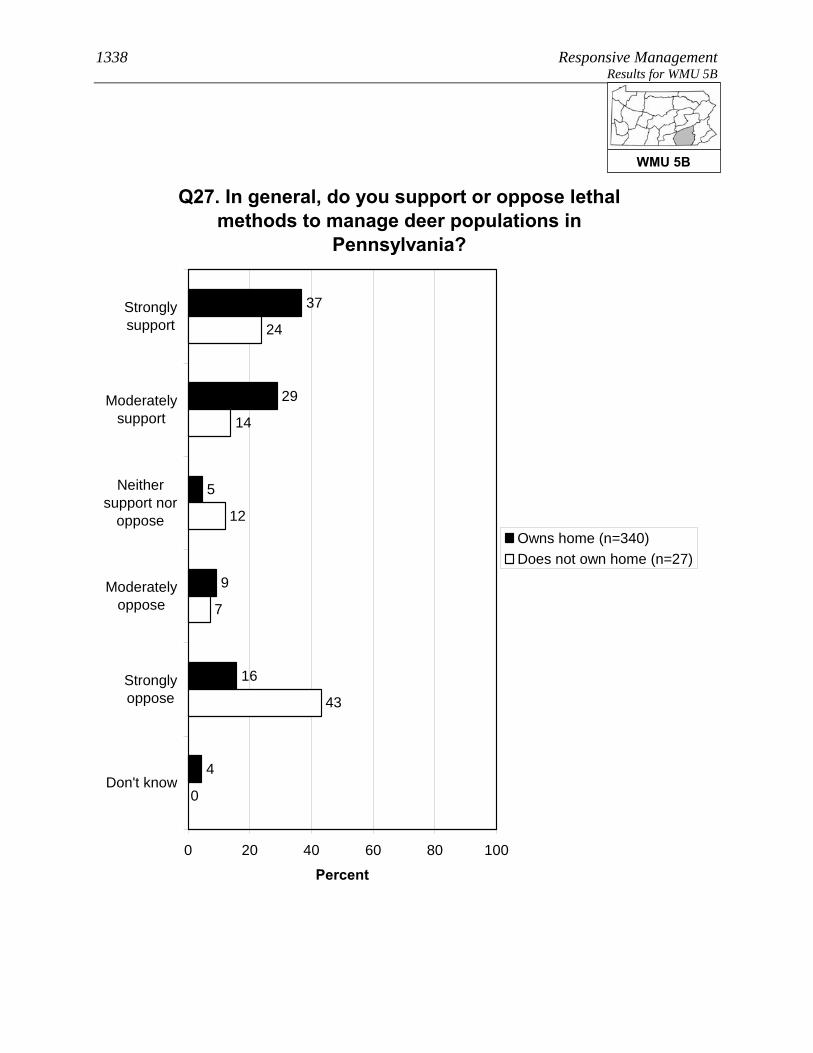
1338 Responsive Management Results for WMU 5B
Q27. In general, do you support or oppose lethal methods to manage deer populations in
Pennsylvania?
37
29
5
9
16
4
12
14
24
7
43
0
0 20 40 60 80 100
Stronglysupport
Moderatelysupport
Neithersupport nor
oppose
Moderatelyoppose
Stronglyoppose
Don't know
Percent
Owns home (n=340)Does not own home (n=27)
WMU 5B

Pennsylvania Residents’ Opinions on and Attitudes Toward Deer and Deer Management 1339 Results for WMU 5B
Q30-Q33. Percent who strongly support each of the following methods of controlling deer populations
in Pennsylvania:
11
11
22
67
0 20 40 60 80 100
Q30. Legal,regulated hunting
Q33. Fertility or birthcontrol
Q32. Trapping andkilling
Q31. Professionalsor sharpshooters
Percent
WMU 5B

1340 Responsive Management Results for WMU 5B
Q30-Q33. Percent who strongly or moderately support each of the following methods of
controlling deer populations in Pennsylvania:
24
30
41
88
0 20 40 60 80 100
Q30. Legal,regulated hunting
Q33. Fertility or birthcontrol
Q31. Professionalsor sharpshooters
Q32. Trapping andkilling
Percent
WMU 5B

Pennsylvania Residents’ Opinions on and Attitudes Toward Deer and Deer Management 1341 Results for WMU 5B
Q30-Q33. Percent who strongly or moderately oppose each of the following methods of
controlling deer populations in Pennsylvania:
8
49
62
72
0 20 40 60 80 100
Q32. Trapping andkilling
Q31. Professionalsor sharpshooters
Q33. Fertility or birthcontrol
Q30. Legal,regulated hunting
Percent
WMU 5B

1342 Responsive Management Results for WMU 5B
Q30-Q33. Percent who strongly oppose each of the following methods of controlling deer populations
in Pennsylvania:
6
37
43
51
0 20 40 60 80 100
Q32. Trapping andkilling
Q31. Professionalsor sharpshooters
Q33. Fertility or birthcontrol
Q30. Legal,regulated hunting
Percent
WMU 5B

Pennsylvania Residents’ Opinions on and Attitudes Toward Deer and Deer Management 1343 Results for WMU 5B
Q59/60. Deer hunts and/or allows others to deer hunt on property. (Among respondents living in a
single-family home.)
17
83
0 20 40 60 80 100
Yes
No
Percent (n=367)
WMU 5B
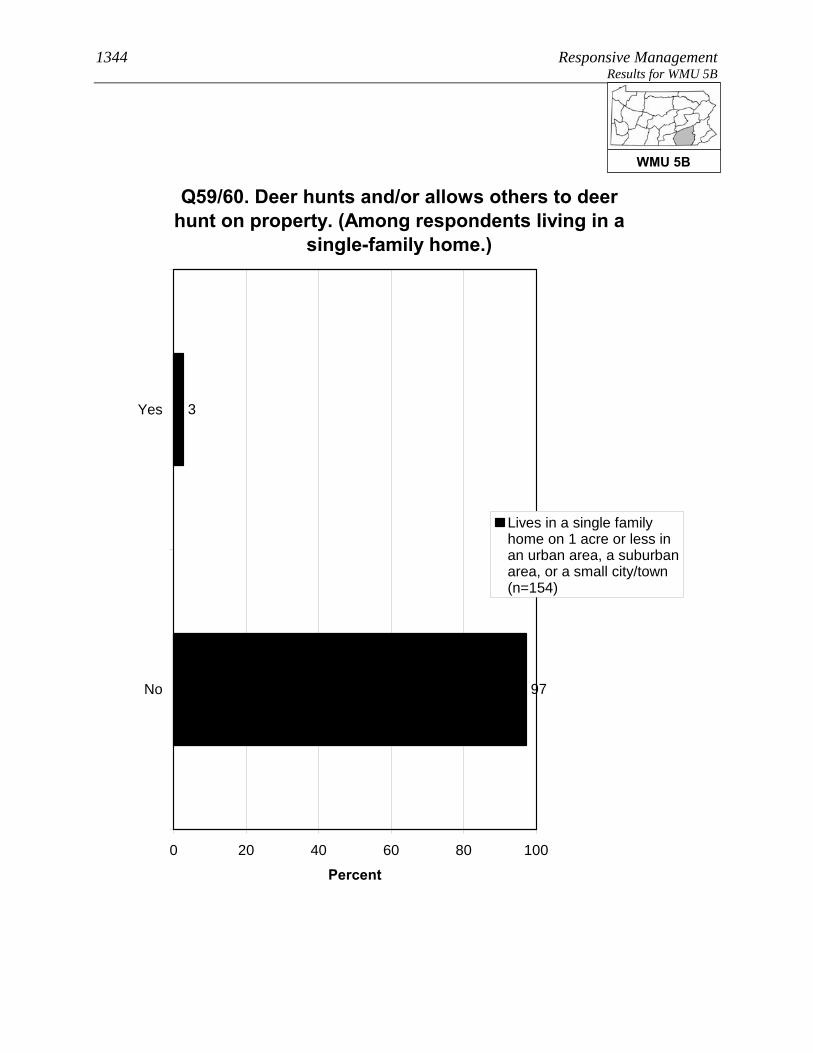
1344 Responsive Management Results for WMU 5B
Q59/60. Deer hunts and/or allows others to deer hunt on property. (Among respondents living in a
single-family home.)
3
97
0 20 40 60 80 100
Yes
No
Percent
Lives in a single familyhome on 1 acre or less inan urban area, a suburbanarea, or a small city/town(n=154)
WMU 5B
Pennsylvania Residents’ Opinions on and Attitudes Toward Deer and Deer Management 1345 Results for WMU 5B
Q63. What are the main reasons you do not allow others to hunt deer on your property? (Asked of
those whose primary place of residence is a single-family home and who do not allow others to hunt
deer on their property.)
1
1
1
46
45
12
9
4
1
1
1
0 20 40 60 80 100
Property is too small / neighbors too close
Live in residential neighborhood /suburban or urban area
Concerned about safety
Oppose hunting in general
Not enough deer on property / not enoughhabitat
No one has asked for hunting access
Not interested in allowing hunting onproperty, but did not indicate opposition to
hunting in general
Want to save hunting opportunities for self/ family
Privacy concerns
Liability
Concerned about bad behavior by hunters
Mul
tiple
Res
pons
es A
llow
ed
Percent (n=317)
WMU 5B

1346 Responsive Management Results for WMU 5B
Q65. How likely are you to ever allow others to deer hunt on your property? (Asked of those whose
primary place of residence is a single-family home and who do not allow others to hunt deer on their
property.)
1
2
2
94
1
0 20 40 60 80 100
Very likely
Somewhat likely
Somewhat unlikely
Very unlikely
Don't know
Percent (n=317)
WMU 5B
Pennsylvania Residents’ Opinions on and Attitudes Toward Deer and Deer Management 1347 Results for WMU 5B
Q66. Is there anything that would make you more likely to allow deer hunting on your property?
(Asked of those whose primary place of residence is a single-family home and who do not allow
others to hunt deer on their property.)
4
95
1
0 20 40 60 80 100
Yes
No
Don't know
Percent (n=317)
WMU 5B

1348 Responsive Management Results for WMU 5B
Q65. How likely are you to ever allow others to deer hunt on your property? (Asked of those whose
primary place of residence is a single-family home and who do not allow others to hunt deer on their
property.)
0
2
1
97
0 20 40 60 80 100
Very likely
Somewhat likely
Somewhatunlikely
Very unlikely
Percent
Lives in a single familyhome on 1 acre or less inan urban area, a suburbanarea, or a small city/town(n=152)
WMU 5B
Pennsylvania Residents’ Opinions on and Attitudes Toward Deer and Deer Management 1349 Results for WMU 5B CONCERNS ABOUT DEER AND DEER NUISANCE PROBLEMS
Seven questions asked about respondents’ level of concern about
issues associated with deer. For each issue, respondents rated their
level of concern about it using a 10-point scale, with 10 being the most
concerned.
• The most concern was for tick-borne diseases (mean rating of 7.5), followed by three
whose means are fairly close to one another: deer-vehicle accidents (6.6), the health of
the deer population (6.5), and the quality of deer habitat (6.1).
• At the bottom are concern about deer impacts on habitat and other wildlife (even
though this can be considerable) (3.9) and the two impacts to residents’ landscaping:
deer damage to plants and landscaping (2.1) and deer droppings in the yard (1.4).
o Another graph shows the percentage who gave a high rating (a “9” or “10”),
providing an idea of the percentage who feel strongly about the issues.
Among residents of WMU 5B, 55% indicated that they saw deer on their property in the past
12 months.
• Respondents who fed birds were more likely to indicate seeing deer, as were
respondents who fed deer or put out attractants or were aware of neighbors who fed
deer or put out attractants.
The survey asked about specific nuisance problems with deer that residents of WMU 5B may
have experienced: 7% indicated that they experienced problems with deer at their primary
place of residence in the past 12 months; 10% indicated that they or another household
member had been in a vehicle collision with a deer (fortunately, a very low portion of
drivers/passengers were injured); and 3% indicated that they or a household member had
been diagnosed with a tick-borne disease.
• Crosstabulations show that those who fed birds were about the same as those who had
not fed birds regarding experiencing deer problems. However, those who were aware
of neighbors feeding deer or putting out attractants were much more likely to say that
they experienced deer problems.
WMU 5B

1350 Responsive Management Results for WMU 5B
Q36-Q42. Mean rating of respondents' concern about each of the following on a 10-point scale:
2.1
3.9
6.1
6.5
6.6
7.5
1.4
0 2 4 6 8 10
Q36. Tick-borne diseases, such as Lymedisease, in Pennsylvania
Q40. Deer-vehicle accidents inPennsylvania
Q42. The health of the deer population,such as adequate food resources for the
size of the deer herd, in Pennsylvania
Q41. The quality of deer habitat inPennsylvania
Q39. Deer impacts on the habitat andother wildlife in Pennsylvania
Q38. Deer damage to plants andlandscaping in his/her yard
Q37. Deer droppings in his/her yard
Mean
WMU 5B

Pennsylvania Residents’ Opinions on and Attitudes Toward Deer and Deer Management 1351 Results for WMU 5B
Q36-Q42. Percent who rated their concern about each of the following as a 9 or 10 on a 10-point
scale:
5
5
18
23
26
39
4
0 20 40 60 80 100
Q36. Tick-borne diseases, such as Lymedisease, in Pennsylvania
Q40. Deer-vehicle accidents inPennsylvania
Q42. The health of the deer population,such as adequate food resources for the
size of the deer herd, in Pennsylvania
Q41. The quality of deer habitat inPennsylvania
Q38. Deer damage to plants andlandscaping in his/her yard
Q39. Deer impacts on the habitat andother wildlife in Pennsylvania
Q37. Deer droppings in his/her yard
Percent
WMU 5B

1352 Responsive Management Results for WMU 5B
Q49. How often have you seen deer on your property in the past 12 months?
17
17
22
45
0 20 40 60 80 100
Frequently
Sometimes
Rarely
Never
Percent (n=429)
WMU 5B

Pennsylvania Residents’ Opinions on and Attitudes Toward Deer and Deer Management 1353 Results for WMU 5B
Q49. How often have you seen deer on your property in the past 12 months?
16
21
22
41
21
13
17
49
0 20 40 60 80 100
Frequently
Sometimes
Rarely
Never
Percent
Fed birds on his / herproperty in the past 12months (n=216)Did not feed birds on his /her property in the past 12months (n=212)
WMU 5B
1354 Responsive Management Results for WMU 5B
Q49. How often have you seen deer on your property in the past 12 months?
29
33
15
23
22
16
16
46
0 20 40 60 80 100
Frequently
Sometimes
Rarely
Never
Percent
Has fed deer or put outattractants in the past 12months (n=20)Has not fed deer or put outattractants in the past 12months (n=409)
WMU 5B

Pennsylvania Residents’ Opinions on and Attitudes Toward Deer and Deer Management 1355 Results for WMU 5B
Q49. How often have you seen deer on your property in the past 12 months?
34
44
13
9
22
15
15
48
0 20 40 60 80 100
Frequently
Sometimes
Rarely
Never
Percent
Is aware of neighborsfeeding deer or putting outattractants (n=29)Is not aware of neighborsfeeding deer or putting outattractants (n=395)
WMU 5B

1356 Responsive Management Results for WMU 5B
Q43. In the past 12 months, have you experienced any problems with deer at your primary place of
residence?
7
93
0 20 40 60 80 100
Yes
No
Percent (n=429)
WMU 5B

Pennsylvania Residents’ Opinions on and Attitudes Toward Deer and Deer Management 1357 Results for WMU 5B
Q43. In the past 12 months, have you experienced any problems with deer at your primary place of
residence?
6
94
93
7
0 20 40 60 80 100
Yes
No
Percent
Fed birds on his / herproperty in the past 12months (n=216)Did not feed birds on his /her property in the past 12months (n=212)
WMU 5B

1358 Responsive Management Results for WMU 5B
Q43. In the past 12 months, have you experienced any problems with deer at your primary place of
residence?
13
87
94
6
0 20 40 60 80 100
Yes
No
Percent
Is aware of neighborsfeeding deer or putting outattractants (n=29)Is not aware of neighborsfeeding deer or putting outattractants (n=395)
WMU 5B

Pennsylvania Residents’ Opinions on and Attitudes Toward Deer and Deer Management 1359 Results for WMU 5B
Q44. In the past 12 months, have you or any other person living in your immediate household been in a vehicle collision with or an accident involving a
deer on Pennsylvania's roads or highways?
10
90
0 20 40 60 80 100
Yes
No
Percent (n=429)
WMU 5B

1360 Responsive Management Results for WMU 5B
Q45. Were you or anyone else injured? (Asked of those who had a household member who was in or
who have personally been in a vehicle collision with or an accident involving a deer on
Pennsylvania's roads or highways in the past 12 months.)
5
95
0 20 40 60 80 100
Yes
No
Percent (n=40)
WMU 5B

Pennsylvania Residents’ Opinions on and Attitudes Toward Deer and Deer Management 1361 Results for WMU 5B
Q46. In the past 12 months, have you or any other person living in your immediate household been
diagnosed by a physician with a tick-borne disease, such as Lyme disease?
3
97
0 20 40 60 80 100
Yes
No
Percent (n=429)
WMU 5B

1362 Responsive Management Results for WMU 5B
FEEDING WILDLIFE AND HUNTING DEER Several questions asked about feeding wildlife.
• Feeding deer or putting out deer attractants: 5% of residents of
WMU 5B did this, and 8% are aware of neighbors who did this.
o The most typical feeds or attractants put out by respondents are salt/mineral blocks,
corn, other food products (other than corn or apples), and apples.
• Feeding birds: 51% of residents of WMU 5B did this.
There is no consensus on whether it is okay for private citizens to feed or attract deer in
Pennsylvania: 49% agree that this is okay, but 42% disagree (the rest are neutral).
More than a quarter of residents of WMU 5B (27%) consider themselves to be a hunter,
about three-fourths of whom have a Pennsylvania hunting license.
• Among residents of WMU 5B who live in a single-family home, 10% personally hunt
deer on their property.
• A large majority of residents of WMU 5B (78%) say that they, family members, and/or
friends hunt.
WMU 5B
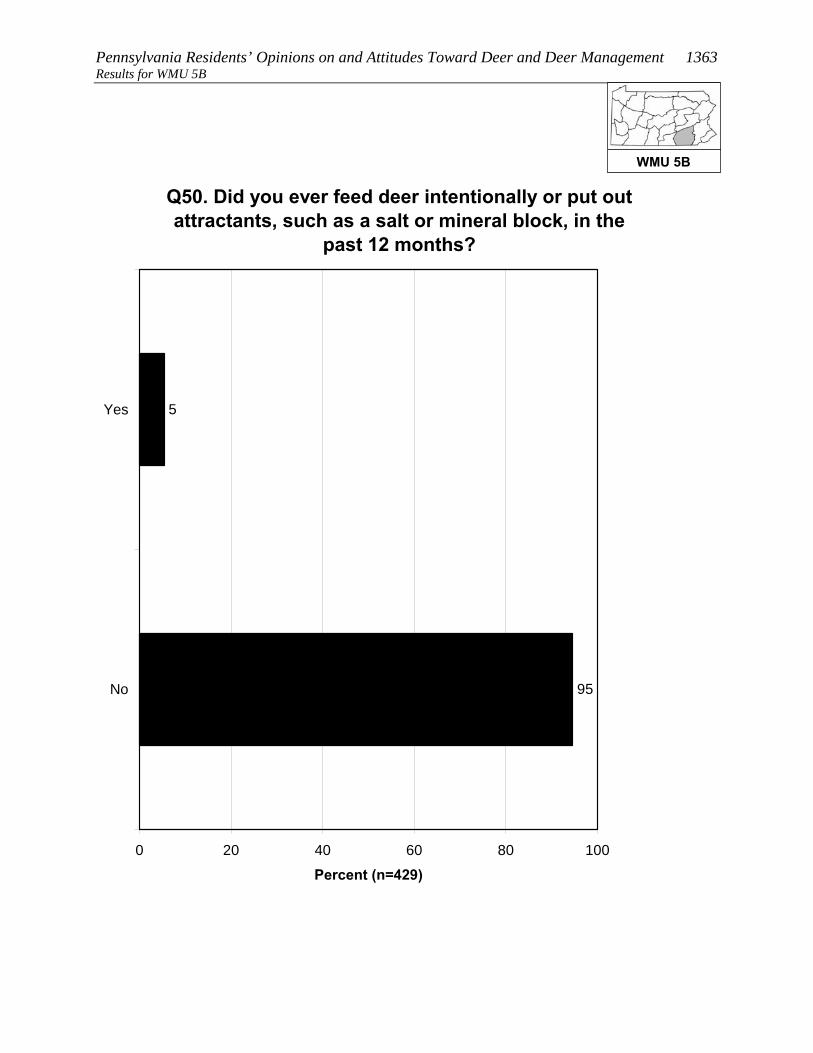
Pennsylvania Residents’ Opinions on and Attitudes Toward Deer and Deer Management 1363 Results for WMU 5B
Q50. Did you ever feed deer intentionally or put out attractants, such as a salt or mineral block, in the
past 12 months?
5
95
0 20 40 60 80 100
Yes
No
Percent (n=429)
WMU 5B

1364 Responsive Management Results for WMU 5B
Q55. Are you aware of any of your neighbors feeding deer intentionally or trying to attract deer
on their property in the past 12 months?
8
91
1
0 20 40 60 80 100
Yes
No
Don't know
Percent (n=429)
WMU 5B
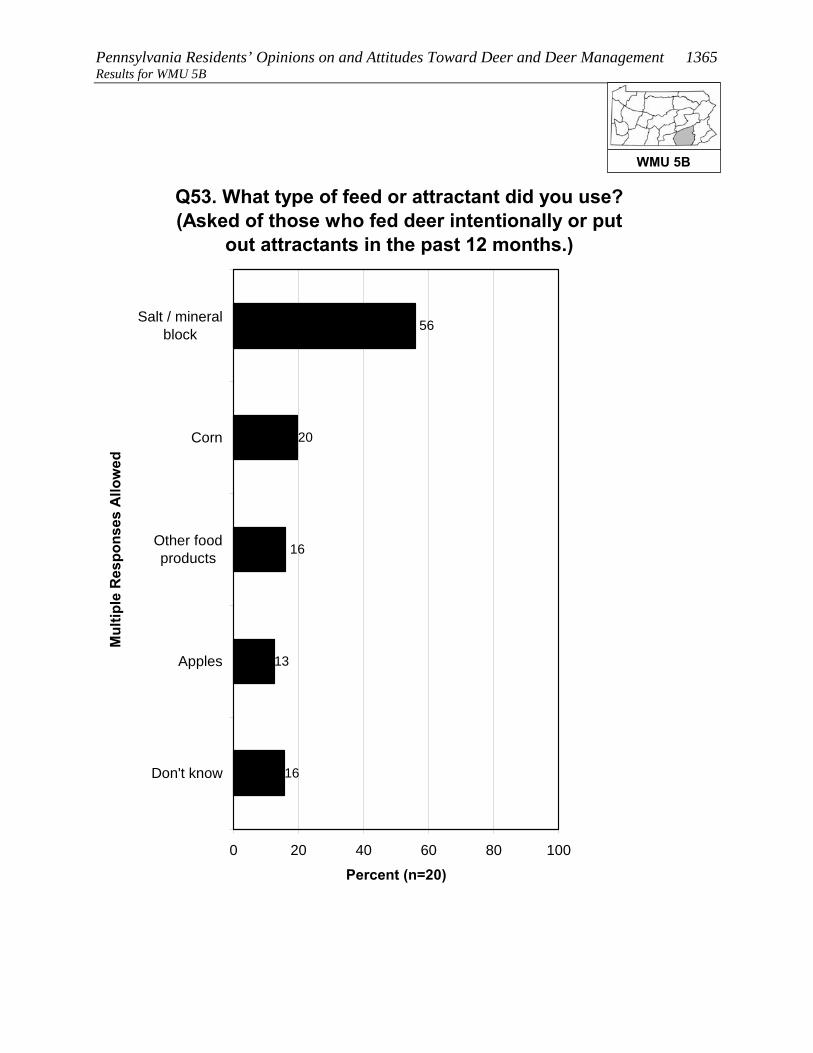
Pennsylvania Residents’ Opinions on and Attitudes Toward Deer and Deer Management 1365 Results for WMU 5B
Q53. What type of feed or attractant did you use? (Asked of those who fed deer intentionally or put
out attractants in the past 12 months.)
56
20
16
13
16
0 20 40 60 80 100
Salt / mineralblock
Corn
Other foodproducts
Apples
Don't know
Mul
tiple
Res
pons
es A
llow
ed
Percent (n=20)
WMU 5B
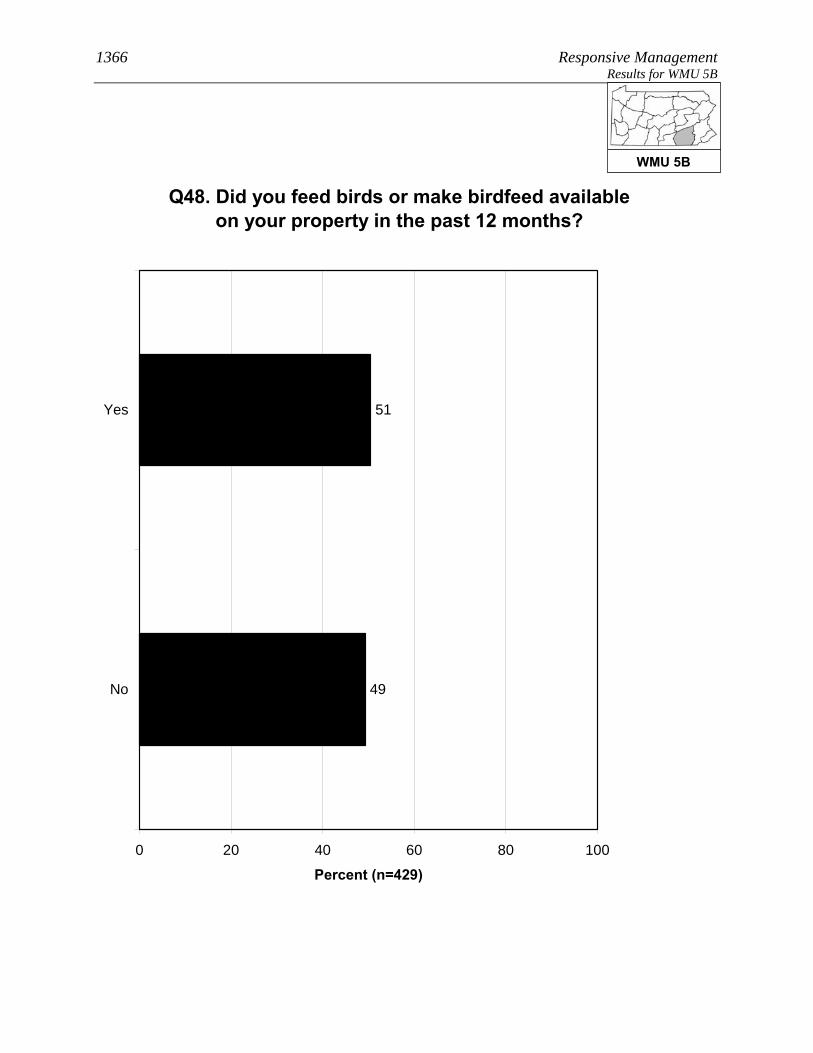
1366 Responsive Management Results for WMU 5B
Q48. Did you feed birds or make birdfeed available on your property in the past 12 months?
51
49
0 20 40 60 80 100
Yes
No
Percent (n=429)
WMU 5B

Pennsylvania Residents’ Opinions on and Attitudes Toward Deer and Deer Management 1367 Results for WMU 5B
Q56. Do you agree or disagree that it is OK for private citizens to feed or attract deer in
Pennsylvania?
20
29
9
18
24
0 20 40 60 80 100
Strongly agree
Moderately agree
Neither agree nordisagree
Moderatelydisagree
Strongly disagree
Percent (n=429)
WMU 5B
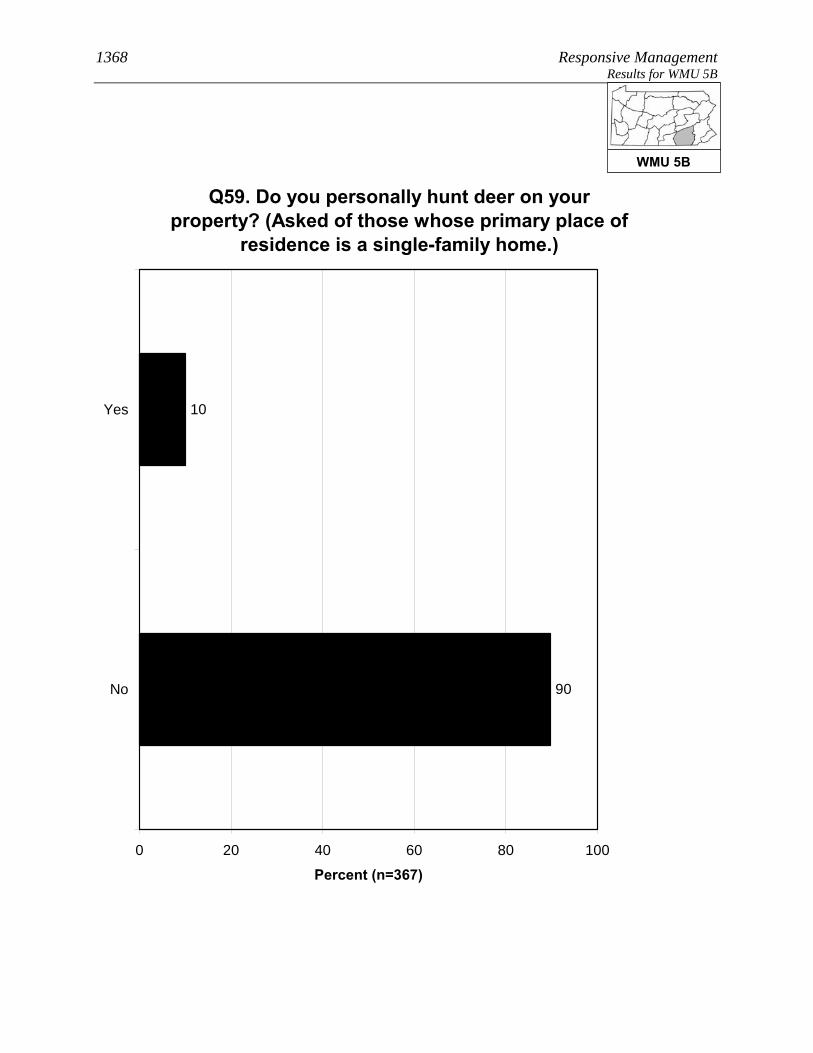
1368 Responsive Management Results for WMU 5B
Q59. Do you personally hunt deer on your property? (Asked of those whose primary place of
residence is a single-family home.)
10
90
0 20 40 60 80 100
Yes
No
Percent (n=367)
WMU 5B

Pennsylvania Residents’ Opinions on and Attitudes Toward Deer and Deer Management 1369 Results for WMU 5B
Q79. Do you, any of your family members, or any friends hunt any wildlife species?
78
22
0 20 40 60 80 100
Yes
No
Percent (n=429)
WMU 5B

1370 Responsive Management Results for WMU 5B
SOURCES OF INFORMATION Most commonly, residents of WMU 5B say that the best way to
provide them with information about deer in Pennsylvania is through
direct mail (42% gave this response), followed by email (17%),
newspaper (16%), and the Internet (10% saying an Internet site other
than the PGC and 5% saying the agency website; note that some said
both).
More than two-fifths of residents of WMU 5B (42%) use social media, the most common
primary site being Facebook.
WMU 5B

Pennsylvania Residents’ Opinions on and Attitudes Toward Deer and Deer Management 1371 Results for WMU 5B
Q82. What is the best way to provide you with information about deer in Pennsylvania? We are not sending out information at this time; we are
just measuring interest.
2
2
3
42
17
16
10
6
5
2
1
1
1
9
0 20 40 60 80 100
Direct mail
Newspaper
Internet / website other thanPGC website
TV
PA Game Commissionwebsite
Magazines
Radio
Brochures or pamphlets
PA Hunting and TrappingDigest
PA Game Commissionoffices
Public presentations
Other
Don't know
Mul
tiple
Res
pons
es A
llow
ed
Percent (n=429)
WMU 5B
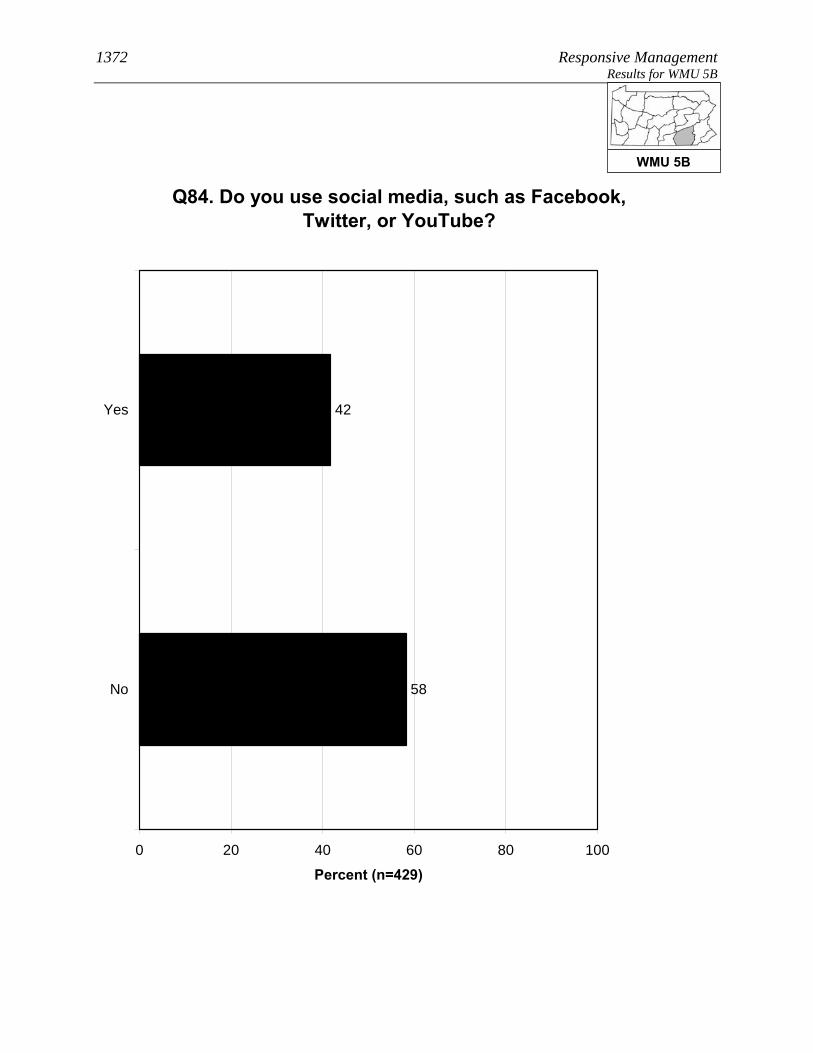
1372 Responsive Management Results for WMU 5B
Q84. Do you use social media, such as Facebook, Twitter, or YouTube?
42
58
0 20 40 60 80 100
Yes
No
Percent (n=429)
WMU 5B
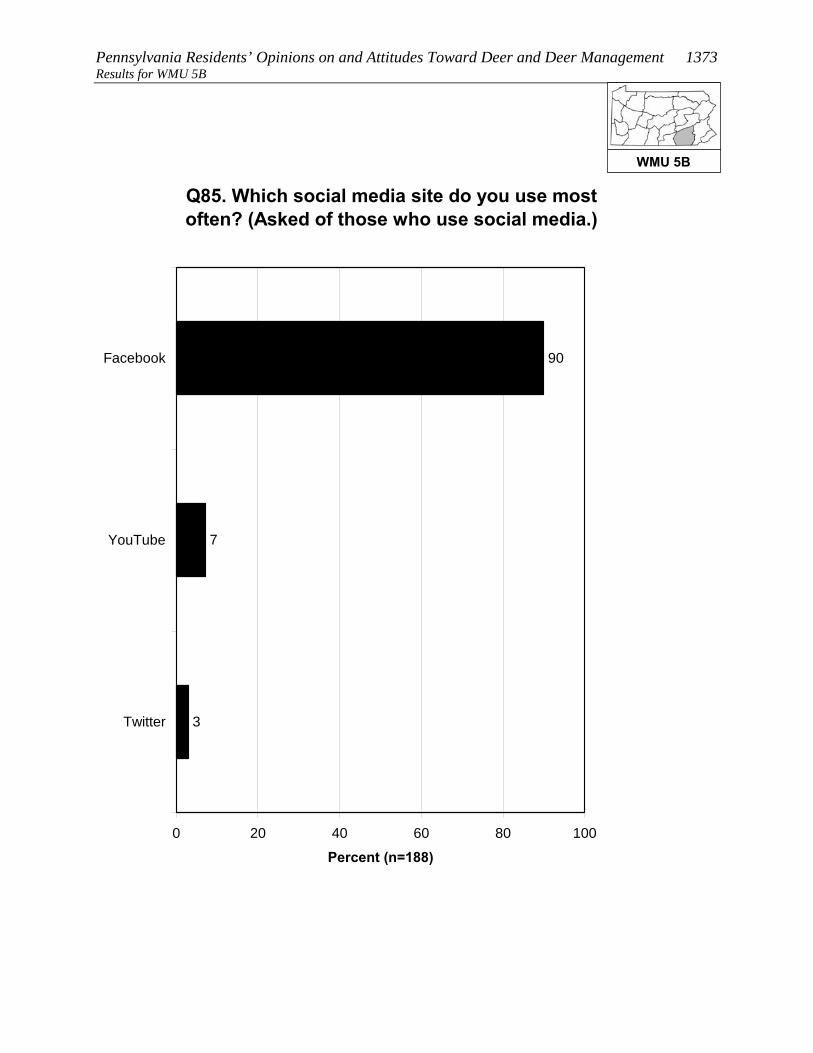
Pennsylvania Residents’ Opinions on and Attitudes Toward Deer and Deer Management 1373 Results for WMU 5B
Q85. Which social media site do you use most often? (Asked of those who use social media.)
90
7
3
0 20 40 60 80 100
YouTube
Percent (n=188)
WMU 5B

1374 Responsive Management Results for WMU 5C
RESULTS FOR WMU 5C Location: From the Maryland/PA state line, north along Octoraro Creek to PA Rt. 372; PA Rt. 372 east to PA Rt. 10 north to I-76; I-76 west to US Rt. 222; US Rt. 222 north to PA Rt. 61 west of Reading; PA Rt. 61 north to I-78 near Hamburg; I-78 east to PA Rt. 143; PA Rt. 143 north to PA Rt. 309; PA Rt. 309 south to PA Rt. 873 northwest of Allentown; PA Rt. 873 north to PA Rt. 248; PA Rt. 248 east to PA Rt. 946; PA Rt. 946 east to PA Rt. 512; PA Rt. 512 to PA Rt. 611 near Mount Bethel; PA Rt. 611 north to the Portland Toll Bridge at Portland; the Portland Toll Bridge east to the New Jersey/PA state line; the New Jersey/PA state line south to US Rt. 202 near New Hope; US Rt. 202 west to the Delaware/PA state line near Elam.
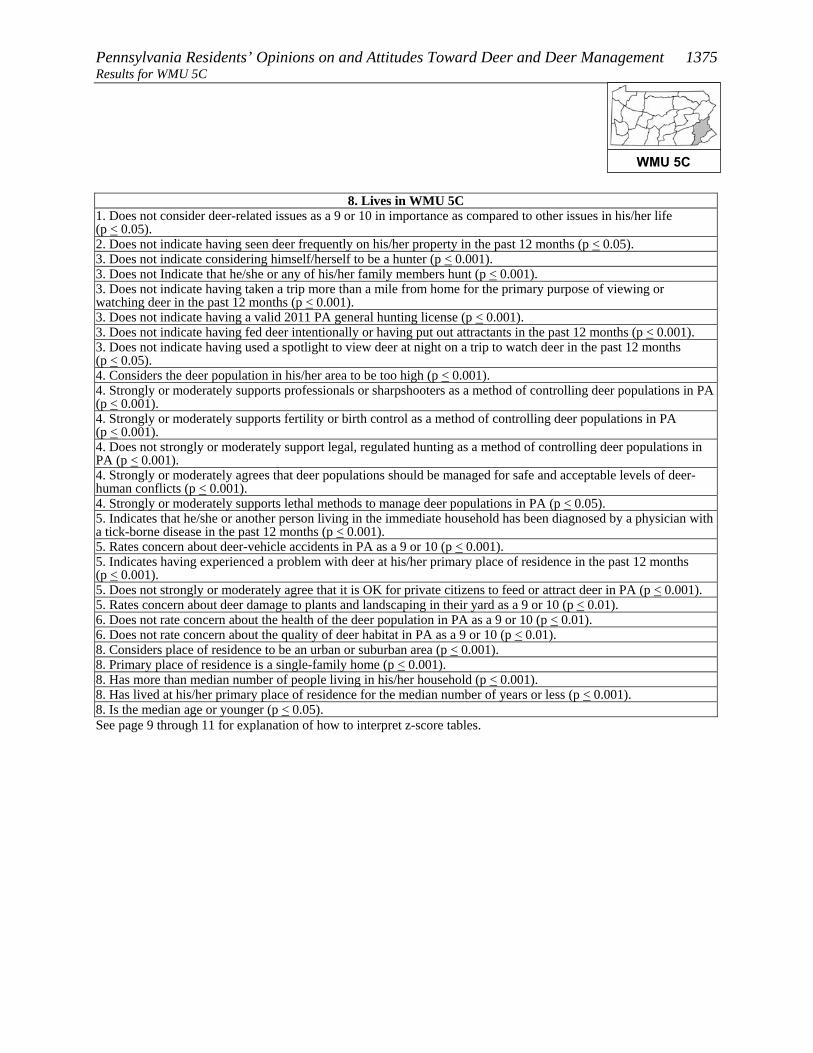
Pennsylvania Residents’ Opinions on and Attitudes Toward Deer and Deer Management 1375 Results for WMU 5C
8. Lives in WMU 5C 1. Does not consider deer-related issues as a 9 or 10 in importance as compared to other issues in his/her life (p < 0.05). 2. Does not indicate having seen deer frequently on his/her property in the past 12 months (p < 0.05). 3. Does not indicate considering himself/herself to be a hunter (p < 0.001). 3. Does not Indicate that he/she or any of his/her family members hunt (p < 0.001). 3. Does not indicate having taken a trip more than a mile from home for the primary purpose of viewing or watching deer in the past 12 months (p < 0.001). 3. Does not indicate having a valid 2011 PA general hunting license (p < 0.001). 3. Does not indicate having fed deer intentionally or having put out attractants in the past 12 months (p < 0.001). 3. Does not indicate having used a spotlight to view deer at night on a trip to watch deer in the past 12 months (p < 0.05). 4. Considers the deer population in his/her area to be too high (p < 0.001). 4. Strongly or moderately supports professionals or sharpshooters as a method of controlling deer populations in PA (p < 0.001). 4. Strongly or moderately supports fertility or birth control as a method of controlling deer populations in PA (p < 0.001). 4. Does not strongly or moderately support legal, regulated hunting as a method of controlling deer populations in PA (p < 0.001). 4. Strongly or moderately agrees that deer populations should be managed for safe and acceptable levels of deer-human conflicts (p < 0.001). 4. Strongly or moderately supports lethal methods to manage deer populations in PA (p < 0.05). 5. Indicates that he/she or another person living in the immediate household has been diagnosed by a physician with a tick-borne disease in the past 12 months (p < 0.001). 5. Rates concern about deer-vehicle accidents in PA as a 9 or 10 (p < 0.001). 5. Indicates having experienced a problem with deer at his/her primary place of residence in the past 12 months (p < 0.001). 5. Does not strongly or moderately agree that it is OK for private citizens to feed or attract deer in PA (p < 0.001). 5. Rates concern about deer damage to plants and landscaping in their yard as a 9 or 10 (p < 0.01). 6. Does not rate concern about the health of the deer population in PA as a 9 or 10 (p < 0.01). 6. Does not rate concern about the quality of deer habitat in PA as a 9 or 10 (p < 0.01). 8. Considers place of residence to be an urban or suburban area (p < 0.001). 8. Primary place of residence is a single-family home (p < 0.001). 8. Has more than median number of people living in his/her household (p < 0.001). 8. Has lived at his/her primary place of residence for the median number of years or less (p < 0.001). 8. Is the median age or younger (p < 0.05). See page 9 through 11 for explanation of how to interpret z-score tables.
WMU 5C

1376 Responsive Management Results for WMU 5C
PARTICIPATION IN VIEWING DEER A majority of residents of WMU 5C (59%) spent time viewing deer
around their home in the past 12 months, and 20% took a trip of at
least a mile to view deer.
• A quarter of those who took a deer-viewing trip (25%) used a spotlight to view the deer
at night.
A majority of residents of WMU 5C (65%) are satisfied with opportunities to view deer in
Pennsylvania. Because a relatively large percentage answer neutrally, only 7% indicate
being dissatisfied.
WMU 5C
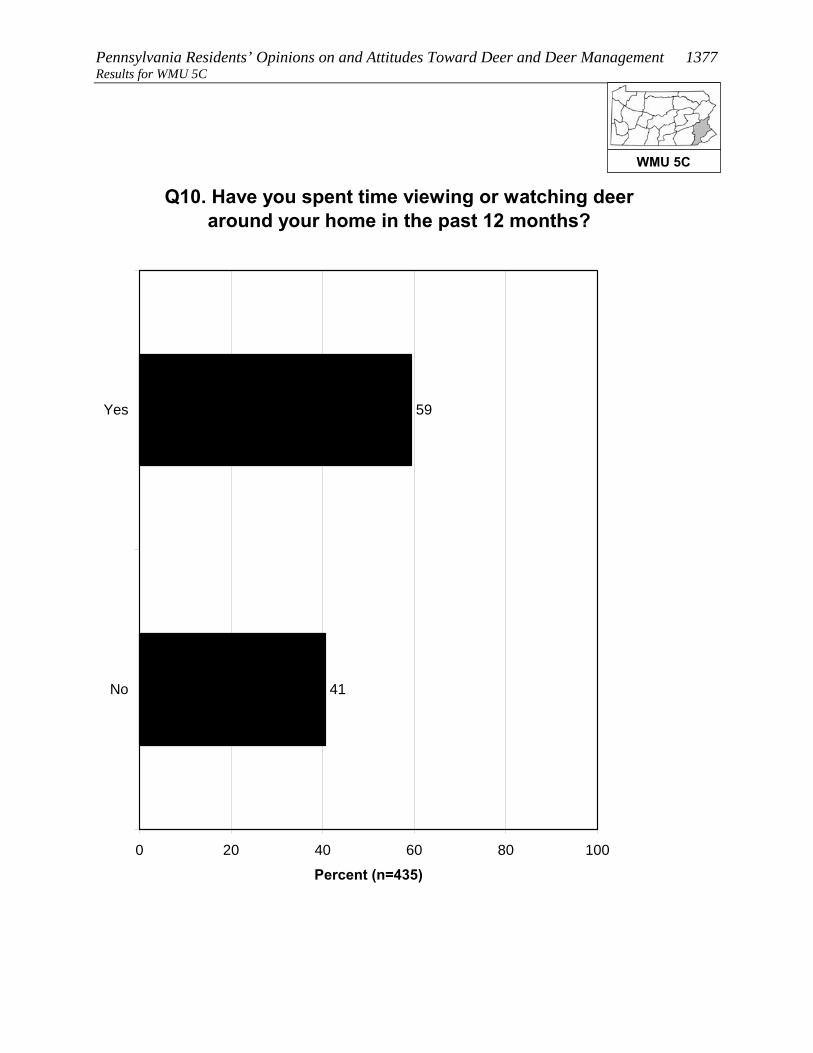
Pennsylvania Residents’ Opinions on and Attitudes Toward Deer and Deer Management 1377 Results for WMU 5C
Q10. Have you spent time viewing or watching deer around your home in the past 12 months?
59
41
0 20 40 60 80 100
Yes
No
Percent (n=435)
WMU 5C

1378 Responsive Management Results for WMU 5C
Q11. Have you taken a trip at least 1 mile from your home for the primary purpose of viewing or
watching deer in the past 12 months?
20
80
0 20 40 60 80 100
Yes
No
Percent (n=435)
WMU 5C
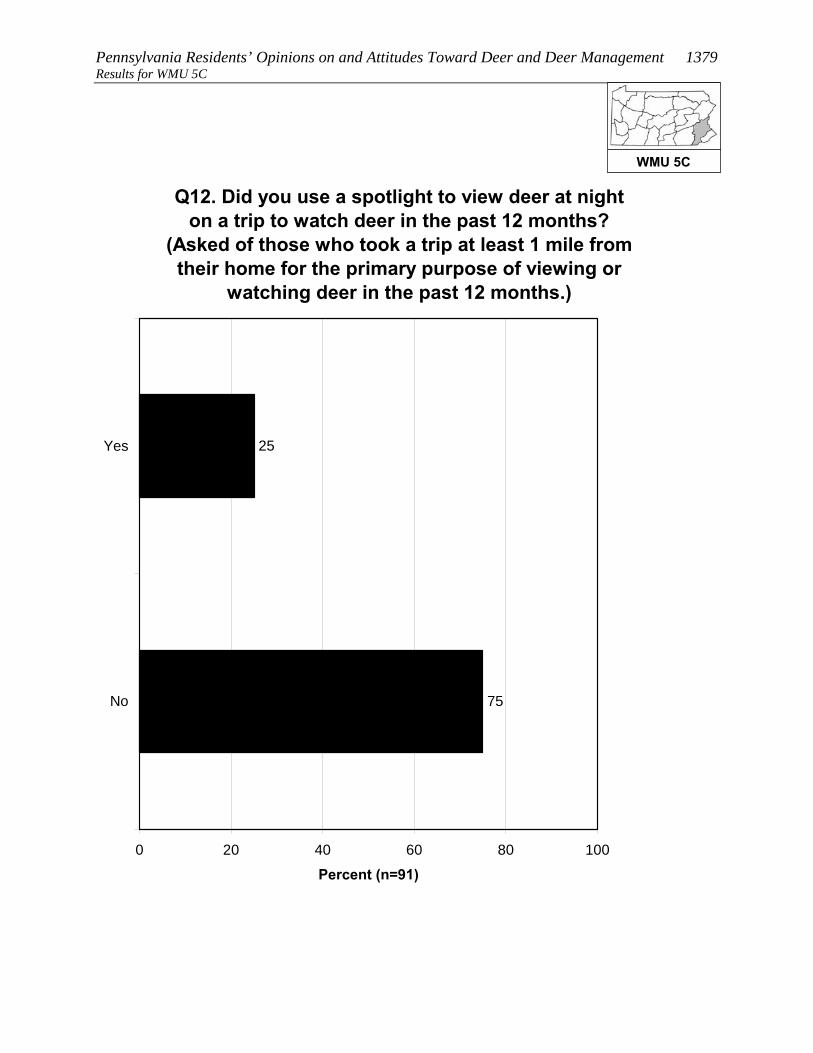
Pennsylvania Residents’ Opinions on and Attitudes Toward Deer and Deer Management 1379 Results for WMU 5C
Q12. Did you use a spotlight to view deer at night on a trip to watch deer in the past 12 months?
(Asked of those who took a trip at least 1 mile from their home for the primary purpose of viewing or
watching deer in the past 12 months.)
25
75
0 20 40 60 80 100
Yes
No
Percent (n=91)
WMU 5C

1380 Responsive Management Results for WMU 5C
Q13. How satisfied are you with opportunities to view or watch deer in Pennsylvania?
45
20
23
5
2
5
0 20 40 60 80 100
Very satisfied
Somewhatsatisfied
Neither satisfiednor dissatisfied
Somewhatdissatisfied
Very dissatisfied
Don't know
Percent (n=435)
WMU 5C
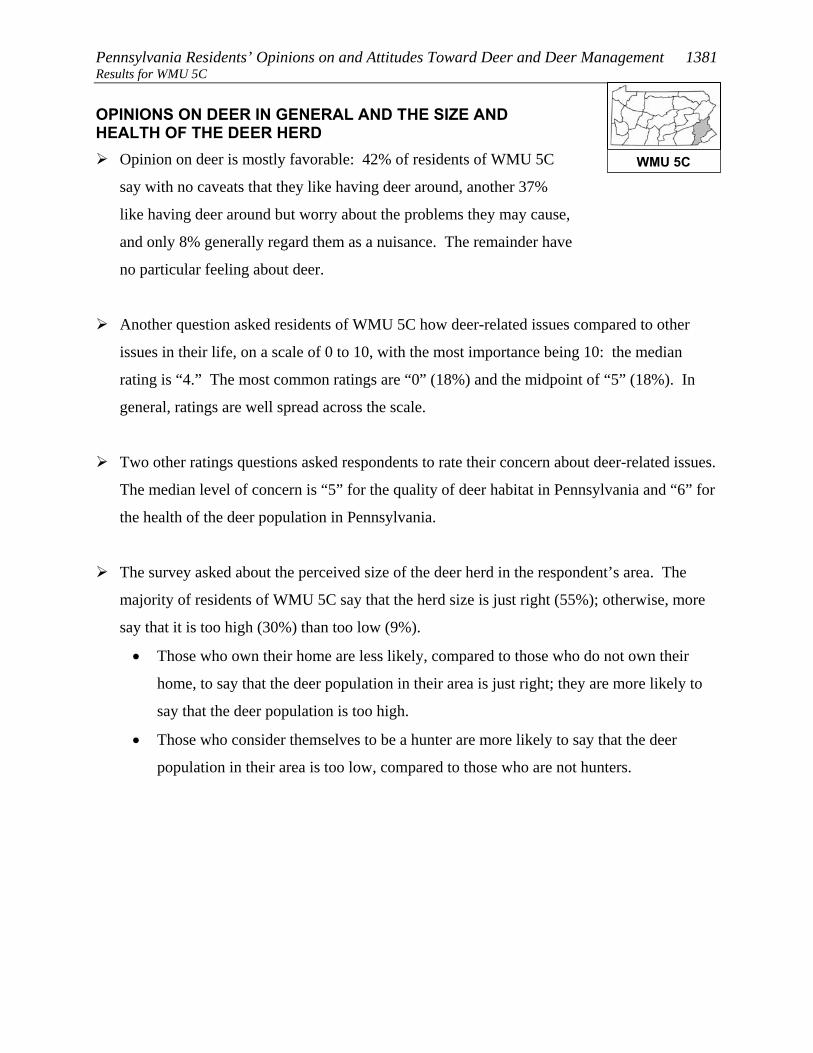
Pennsylvania Residents’ Opinions on and Attitudes Toward Deer and Deer Management 1381 Results for WMU 5C OPINIONS ON DEER IN GENERAL AND THE SIZE AND HEALTH OF THE DEER HERD
Opinion on deer is mostly favorable: 42% of residents of WMU 5C
say with no caveats that they like having deer around, another 37%
like having deer around but worry about the problems they may cause,
and only 8% generally regard them as a nuisance. The remainder have
no particular feeling about deer.
Another question asked residents of WMU 5C how deer-related issues compared to other
issues in their life, on a scale of 0 to 10, with the most importance being 10: the median
rating is “4.” The most common ratings are “0” (18%) and the midpoint of “5” (18%). In
general, ratings are well spread across the scale.
Two other ratings questions asked respondents to rate their concern about deer-related issues.
The median level of concern is “5” for the quality of deer habitat in Pennsylvania and “6” for
the health of the deer population in Pennsylvania.
The survey asked about the perceived size of the deer herd in the respondent’s area. The
majority of residents of WMU 5C say that the herd size is just right (55%); otherwise, more
say that it is too high (30%) than too low (9%).
• Those who own their home are less likely, compared to those who do not own their
home, to say that the deer population in their area is just right; they are more likely to
say that the deer population is too high.
• Those who consider themselves to be a hunter are more likely to say that the deer
population in their area is too low, compared to those who are not hunters.
WMU 5C
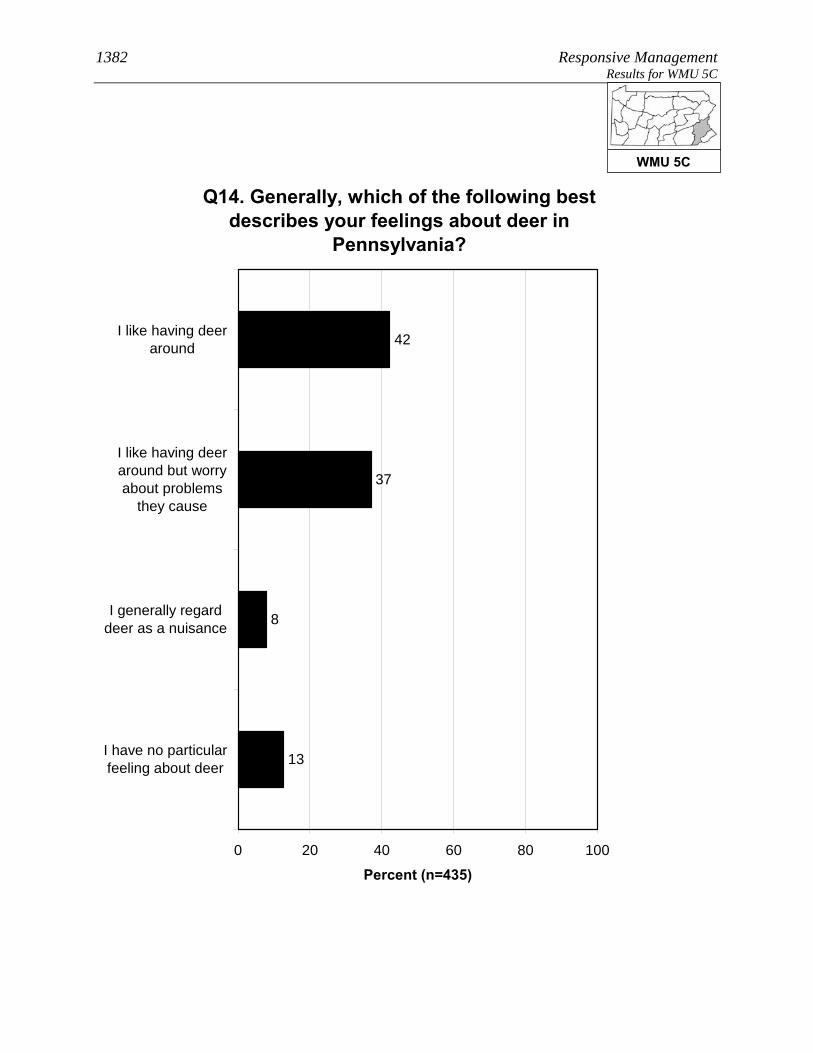
1382 Responsive Management Results for WMU 5C
Q14. Generally, which of the following best describes your feelings about deer in
Pennsylvania?
42
37
8
13
0 20 40 60 80 100
I like having deeraround
I like having deeraround but worryabout problems
they cause
I generally regarddeer as a nuisance
I have no particularfeeling about deer
Percent (n=435)
WMU 5C

Pennsylvania Residents’ Opinions on and Attitudes Toward Deer and Deer Management 1383 Results for WMU 5C
Q15. Compared to other issues in your life, how important to you, personally, are deer-related
issues on a scale of 0 to 10 where 0 is not at all important and 10 is extremely important?
9
9
8
7
3
8
5
7
18
7
18
1
0 20 40 60 80 100
10
9
8
7
6
5
4
3
2
1
0
Don't know
Percent (n=435)
Mean = 4.15Median = 4
WMU 5C
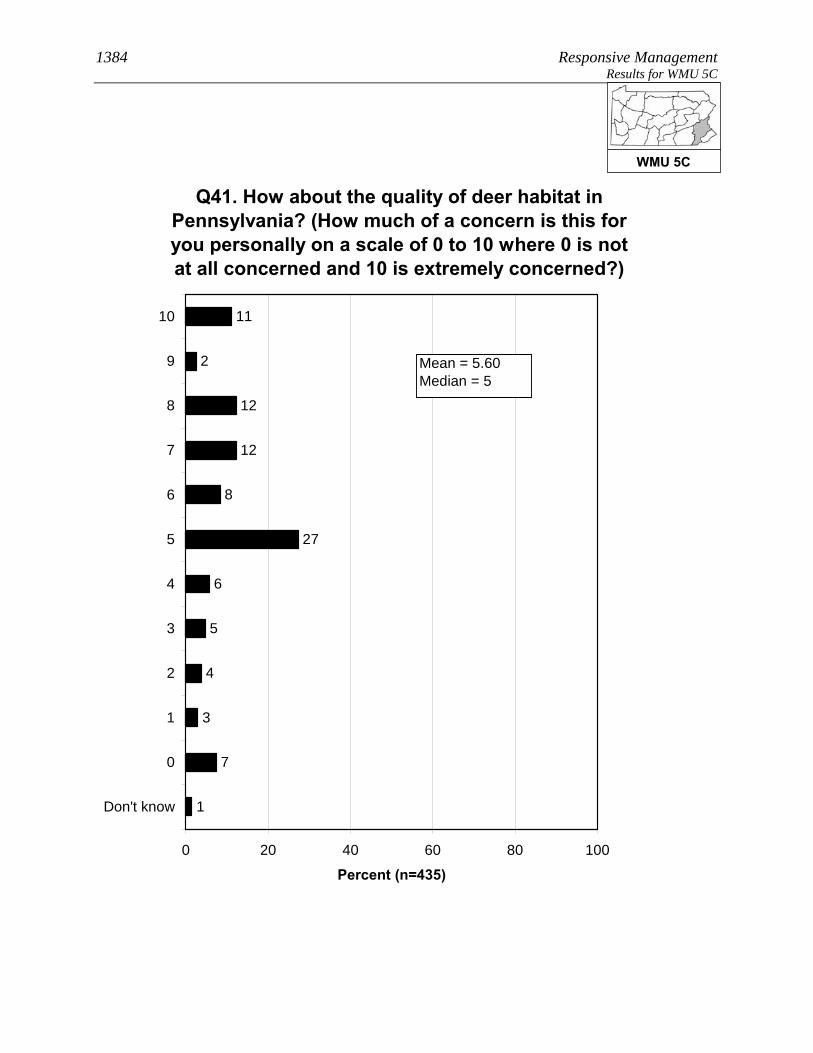
1384 Responsive Management Results for WMU 5C
Q41. How about the quality of deer habitat in Pennsylvania? (How much of a concern is this for you personally on a scale of 0 to 10 where 0 is not at all concerned and 10 is extremely concerned?)
4
5
6
11
2
12
12
8
27
3
7
1
0 20 40 60 80 100
10
9
8
7
6
5
4
3
2
1
0
Don't know
Percent (n=435)
Mean = 5.60Median = 5
WMU 5C

Pennsylvania Residents’ Opinions on and Attitudes Toward Deer and Deer Management 1385 Results for WMU 5C
5
5
3
14
4
16
12
10
22
2
7
1
0 20 40 60 80 100
10
9
8
7
6
5
4
3
2
1
0
Don't know
Percent (n=435)
Q42. How about health of the deer population, such as adequate food resources for the size of the deer herd, in Pennsylvania? (How much of a concern is this for you
personally on a scale of 0 to 10 where 0 is not at all concerned and 10 is extremely concerned?)
Mean = 6.01Median = 6
WMU 5C

1386 Responsive Management Results for WMU 5C
Q16. In your opinion, is the deer population in the area where you live too high, just right, or too low?
30
55
9
7
0 20 40 60 80 100
Too high
Just right
Too low
Don't know
Percent (n=435)
WMU 5C
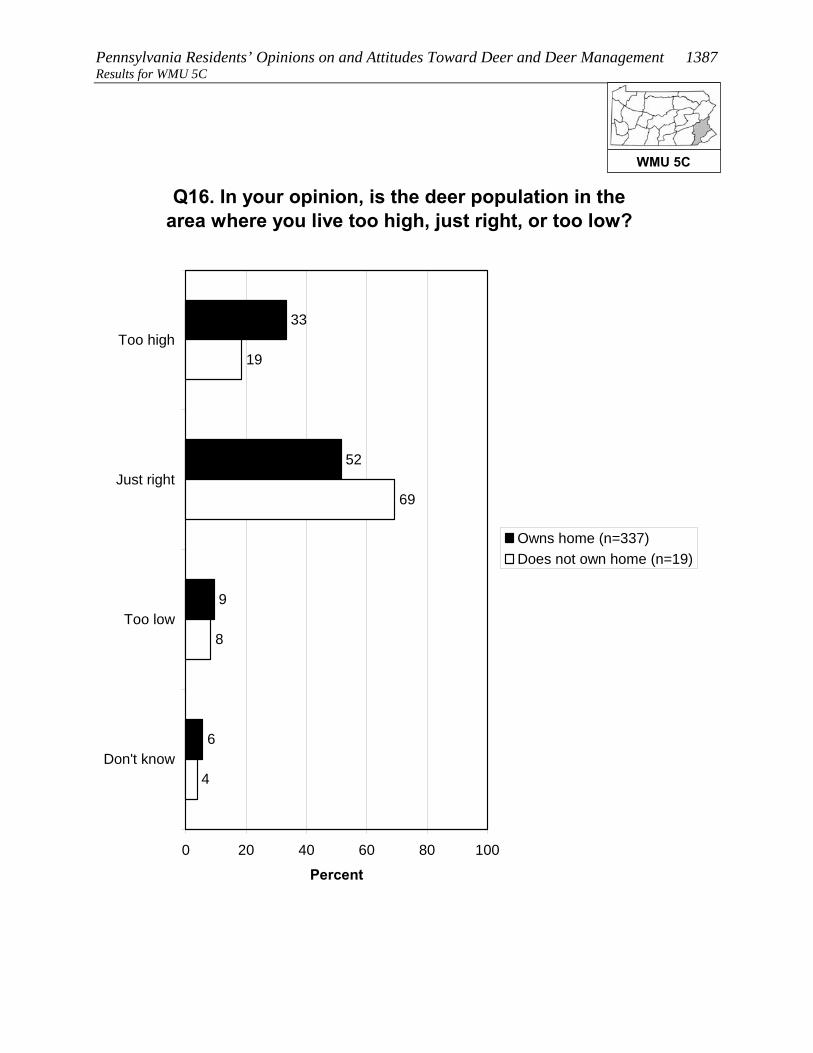
Pennsylvania Residents’ Opinions on and Attitudes Toward Deer and Deer Management 1387 Results for WMU 5C
Q16. In your opinion, is the deer population in the area where you live too high, just right, or too low?
33
52
9
6
8
69
19
4
0 20 40 60 80 100
Too high
Just right
Too low
Don't know
Percent
Owns home (n=337)Does not own home (n=19)
WMU 5C

1388 Responsive Management Results for WMU 5C
Q16. In your opinion, is the deer population in the area where you live too high, just right, or too low?
27
42
29
2
3
58
31
8
0 20 40 60 80 100
Too high
Just right
Too low
Don't know
Percent
Consider themselves ahunter (n=93)Do not consider themselvesa hunter (n=340)
WMU 5C

Pennsylvania Residents’ Opinions on and Attitudes Toward Deer and Deer Management 1389 Results for WMU 5C OPINIONS ON MANAGEMENT EFFORTS AND MANAGEMENT GOALS
The survey asked about three deer population management goals. For
all three, a large majority agree with the management goal: 89% agree
with managing the deer for a healthy and sustainable forest habitat,
92% agree with managing for healthy and sustainable deer
populations, and 89% agree with managing for safe, acceptable levels
of deer-human conflicts.
Residents of WMU 5C who said that the deer population in their area is too high or too low
were asked to indicate the reasonable number of years it should take to achieve an acceptable
deer population. The mean amount is 4.05 years. While 35% said that they do not know,
nearly all the rest gave a number of years of 10 or less. Note that this is only among those
who said the deer population was too high or too low.
• Because management plans typically look at a time frame of about 10 years to effect
change, the survey specifically asked if these respondents would be willing to wait
more than 10 years to achieve an acceptable deer population: a majority (52%)
indicated that they would be willing to wait that long.
WMU 5C

1390 Responsive Management Results for WMU 5C
Q24-26. Deer populations should be managed for the following. (Do you agree or disagree with this
deer management goal?)
53
36
4
2
3
1
3
34
58
2
2
1
4
52
37
3
4
1
0 20 40 60 80 100
Stronglyagree
Moderatelyagree
Neither agreenor disagree
Moderatelydisagree
Stronglydisagree
Don't know
Percent (n=435)
Healthy and sustainableforest habitatHealthy and sustainabledeer populationsSafe and acceptable levelsof deer-human conflicts
WMU 5C

Pennsylvania Residents’ Opinions on and Attitudes Toward Deer and Deer Management 1391 Results for WMU 5C
35
1
5
1
7
19
3
17
12
0 20 40 60 80 100
More than 10years
6-10 years
5 years
4 years
3 years
2 years
1 year
Less than a year
Don't know
Percent (n=172)
Q18. You said the deer population in the area where you live is [too high / too low]. In years, what is a reasonable amount of time to achieve an acceptable deer population in the area where you live? (Asked of those who think thedeer population in the area where they live is too high or
too low.)
Mean = 4.05Median = 3
WMU 5C

1392 Responsive Management Results for WMU 5C
Q21. Would you be willing to wait more than 10 years to achieve an acceptable deer population in the area where you live? (Among those who think the deer population in the area where they live is
too high or too low.)
52
44
4
0 20 40 60 80 100
Yes
No
Don't know
Percent (n=172)
WMU 5C
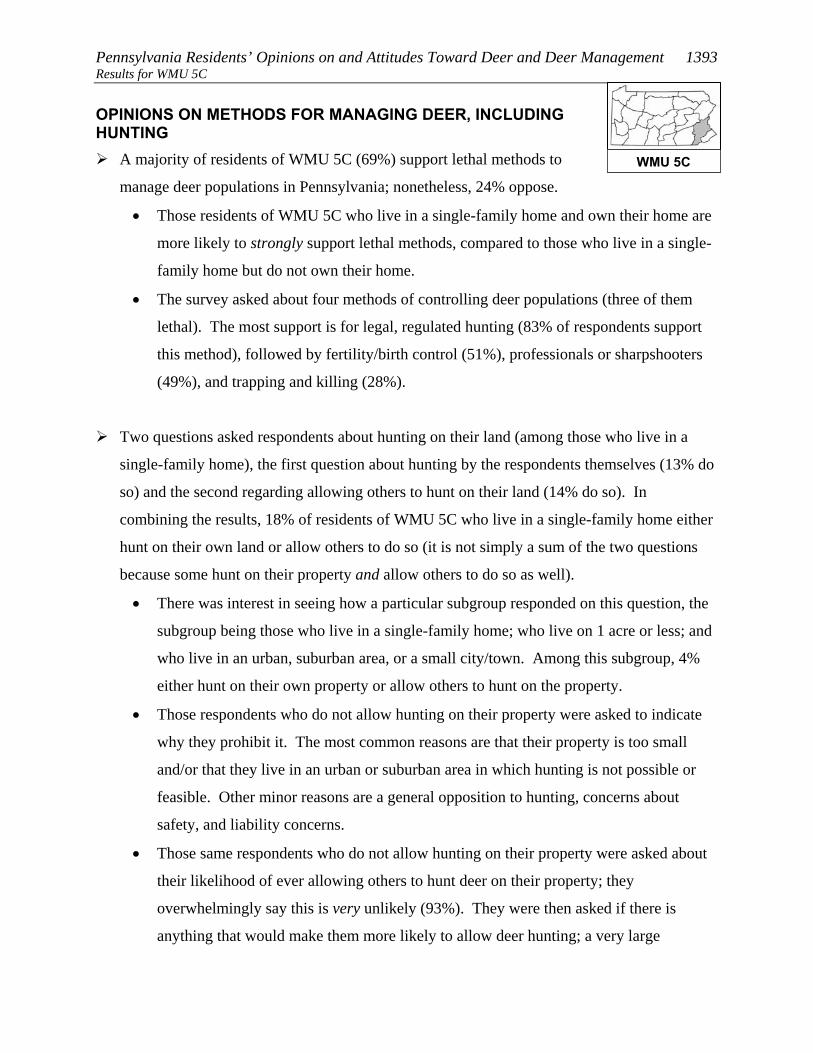
Pennsylvania Residents’ Opinions on and Attitudes Toward Deer and Deer Management 1393 Results for WMU 5C OPINIONS ON METHODS FOR MANAGING DEER, INCLUDING HUNTING
A majority of residents of WMU 5C (69%) support lethal methods to
manage deer populations in Pennsylvania; nonetheless, 24% oppose.
• Those residents of WMU 5C who live in a single-family home and own their home are
more likely to strongly support lethal methods, compared to those who live in a single-
family home but do not own their home.
• The survey asked about four methods of controlling deer populations (three of them
lethal). The most support is for legal, regulated hunting (83% of respondents support
this method), followed by fertility/birth control (51%), professionals or sharpshooters
(49%), and trapping and killing (28%).
Two questions asked respondents about hunting on their land (among those who live in a
single-family home), the first question about hunting by the respondents themselves (13% do
so) and the second regarding allowing others to hunt on their land (14% do so). In
combining the results, 18% of residents of WMU 5C who live in a single-family home either
hunt on their own land or allow others to do so (it is not simply a sum of the two questions
because some hunt on their property and allow others to do so as well).
• There was interest in seeing how a particular subgroup responded on this question, the
subgroup being those who live in a single-family home; who live on 1 acre or less; and
who live in an urban, suburban area, or a small city/town. Among this subgroup, 4%
either hunt on their own property or allow others to hunt on the property.
• Those respondents who do not allow hunting on their property were asked to indicate
why they prohibit it. The most common reasons are that their property is too small
and/or that they live in an urban or suburban area in which hunting is not possible or
feasible. Other minor reasons are a general opposition to hunting, concerns about
safety, and liability concerns.
• Those same respondents who do not allow hunting on their property were asked about
their likelihood of ever allowing others to hunt deer on their property; they
overwhelmingly say this is very unlikely (93%). They were then asked if there is
anything that would make them more likely to allow deer hunting; a very large
WMU 5C

1394 Responsive Management Results for WMU 5C
percentage (94%) say that there is nothing that would
make them more likely to allow deer hunting.
• The question about allowing others to hunt on their property was
examined among the subgroup previously discussed (those who live in a single-family
home; who live on 1 acre or less; and who live in an urban, suburban area, or a small
city/town). Among this group who got the question, nearly all say that they would
never allow hunting.
o Additional follow-up questions to be asked of those who indicated that something
might prompt them to allow hunting on their property did not have enough
respondents for statistical validity; therefore, they are not shown.
WMU 5C
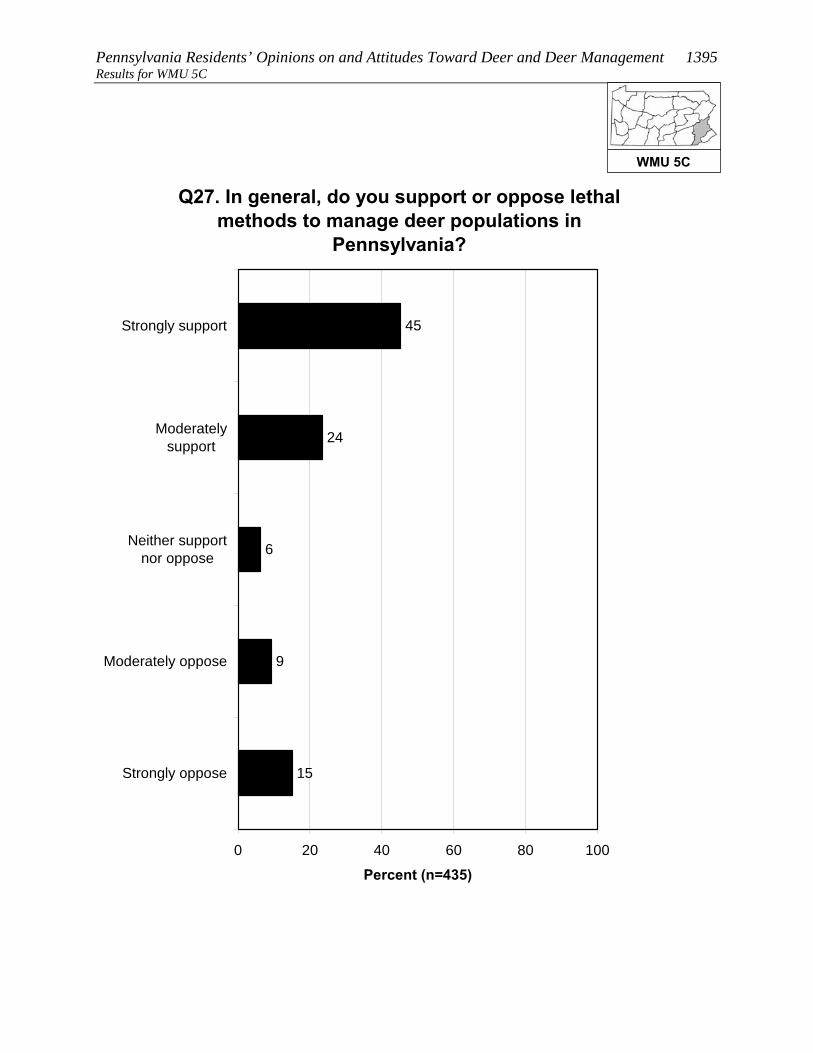
Pennsylvania Residents’ Opinions on and Attitudes Toward Deer and Deer Management 1395 Results for WMU 5C
Q27. In general, do you support or oppose lethal methods to manage deer populations in
Pennsylvania?
45
24
6
9
15
0 20 40 60 80 100
Strongly support
Moderatelysupport
Neither supportnor oppose
Moderately oppose
Strongly oppose
Percent (n=435)
WMU 5C
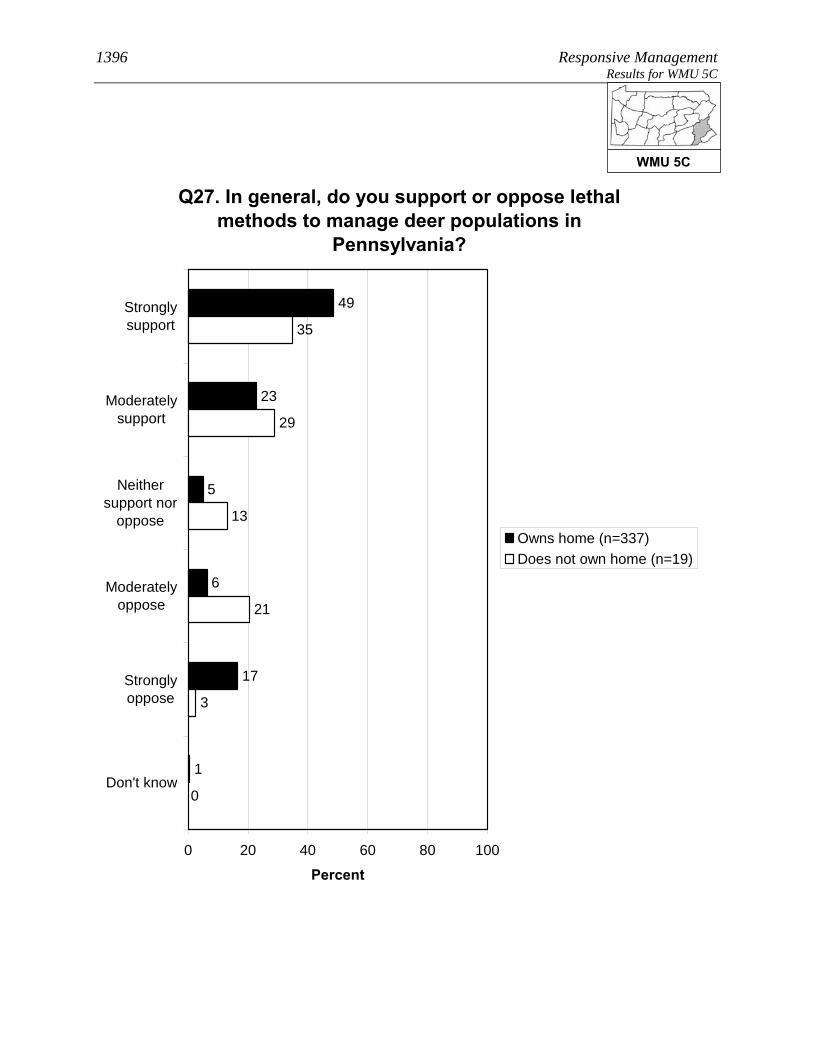
1396 Responsive Management Results for WMU 5C
Q27. In general, do you support or oppose lethal methods to manage deer populations in
Pennsylvania?
49
23
5
6
17
1
13
29
35
21
3
0
0 20 40 60 80 100
Stronglysupport
Moderatelysupport
Neithersupport nor
oppose
Moderatelyoppose
Stronglyoppose
Don't know
Percent
Owns home (n=337)Does not own home (n=19)
WMU 5C
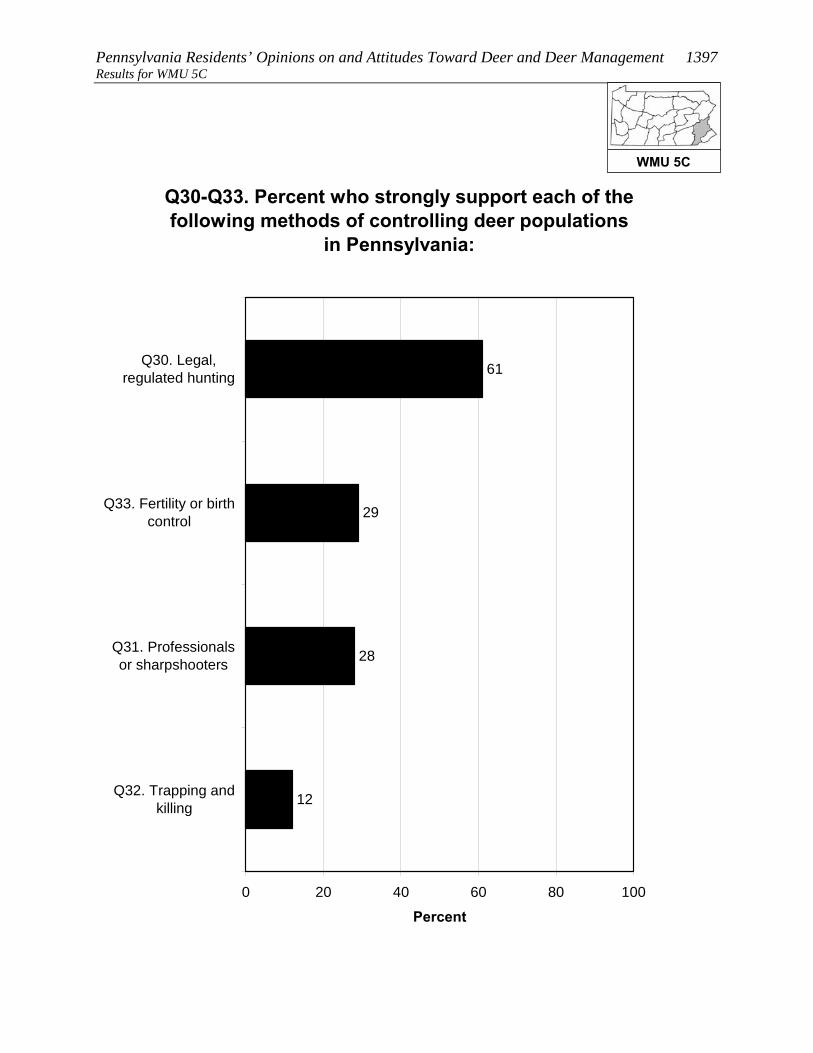
Pennsylvania Residents’ Opinions on and Attitudes Toward Deer and Deer Management 1397 Results for WMU 5C
Q30-Q33. Percent who strongly support each of the following methods of controlling deer populations
in Pennsylvania:
12
28
29
61
0 20 40 60 80 100
Q30. Legal,regulated hunting
Q33. Fertility or birthcontrol
Q31. Professionalsor sharpshooters
Q32. Trapping andkilling
Percent
WMU 5C
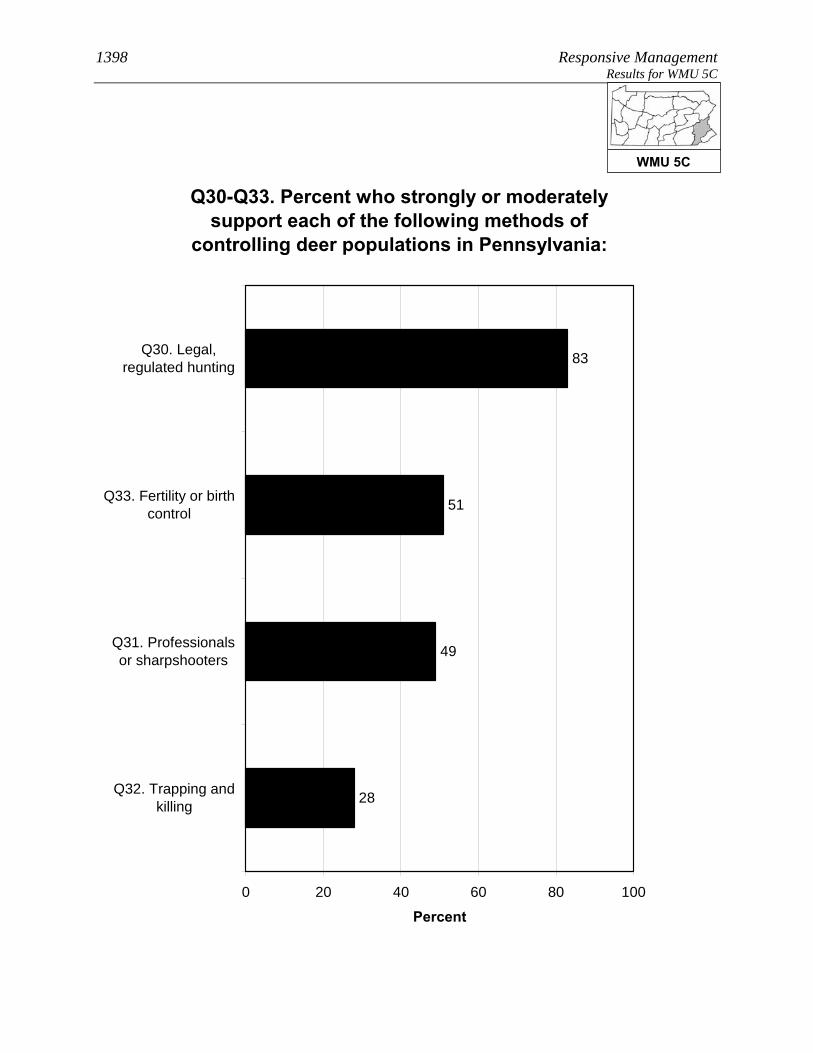
1398 Responsive Management Results for WMU 5C
Q30-Q33. Percent who strongly or moderately support each of the following methods of
controlling deer populations in Pennsylvania:
28
49
51
83
0 20 40 60 80 100
Q30. Legal,regulated hunting
Q33. Fertility or birthcontrol
Q31. Professionalsor sharpshooters
Q32. Trapping andkilling
Percent
WMU 5C

Pennsylvania Residents’ Opinions on and Attitudes Toward Deer and Deer Management 1399 Results for WMU 5C
Q30-Q33. Percent who strongly or moderately oppose each of the following methods of
controlling deer populations in Pennsylvania:
14
43
47
68
0 20 40 60 80 100
Q32. Trapping andkilling
Q31. Professionalsor sharpshooters
Q33. Fertility or birthcontrol
Q30. Legal,regulated hunting
Percent
WMU 5C
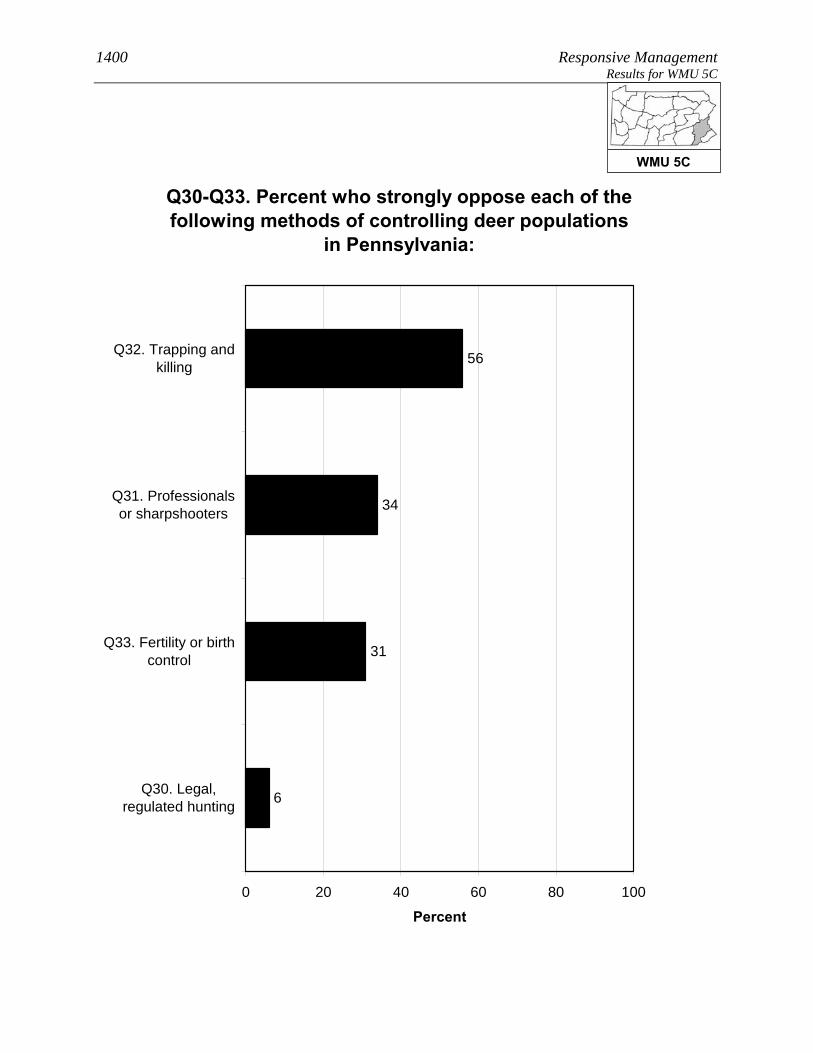
1400 Responsive Management Results for WMU 5C
Q30-Q33. Percent who strongly oppose each of the following methods of controlling deer populations
in Pennsylvania:
6
31
34
56
0 20 40 60 80 100
Q32. Trapping andkilling
Q31. Professionalsor sharpshooters
Q33. Fertility or birthcontrol
Q30. Legal,regulated hunting
Percent
WMU 5C

Pennsylvania Residents’ Opinions on and Attitudes Toward Deer and Deer Management 1401 Results for WMU 5C
Q59/60. Deer hunts and/or allows others to deer hunt on property. (Among respondents living in a
single-family home.)
18
82
0 20 40 60 80 100
Yes
No
Percent (n=356)
WMU 5C

1402 Responsive Management Results for WMU 5C
Q59/60. Deer hunts and/or allows others to deer hunt on property. (Among respondents living in a
single-family home.)
4
96
0 20 40 60 80 100
Yes
No
Percent
Lives in a single familyhome on 1 acre or less inan urban area, a suburbanarea, or a small city/town(n=173)
WMU 5C

Pennsylvania Residents’ Opinions on and Attitudes Toward Deer and Deer Management 1403 Results for WMU 5C
Q63. What are the main reasons you do not allow others to hunt deer on your property? (Asked of
those whose primary place of residence is a single-family home and who do not allow others to hunt
deer on their property.)
1
1
51
43
13
13
3
1
0 20 40 60 80 100
Property is too small / neighbors too close
Live in residential neighborhood /suburban or urban area
Oppose hunting in general
Concerned about safety
Liability
Not enough deer on property / notenough habitat
No one has asked for hunting access
Want to save hunting opportunities forself / family
Mul
tiple
Res
pons
es A
llow
ed
Percent (n=311)
WMU 5C

1404 Responsive Management Results for WMU 5C
Q65. How likely are you to ever allow others to deer hunt on your property? (Asked of those whose
primary place of residence is a single-family home and who do not allow others to hunt deer on their
property.)
1
2
1
3
93
0 20 40 60 80 100
Very likely
Somewhat likely
Neither likely norunlikely
Somewhat unlikely
Very unlikely
Percent (n=311)
WMU 5C

Pennsylvania Residents’ Opinions on and Attitudes Toward Deer and Deer Management 1405 Results for WMU 5C
Q66. Is there anything that would make you more likely to allow deer hunting on your property?
(Asked of those whose primary place of residence is a single-family home and who do not allow
others to hunt deer on their property.)
4
94
2
0 20 40 60 80 100
Yes
No
Don't know
Percent (n=311)
WMU 5C

1406 Responsive Management Results for WMU 5C
Q65. How likely are you to ever allow others to deer hunt on your property? (Asked of those whose
primary place of residence is a single-family home and who do not allow others to hunt deer on their
property.)
0
0
1
2
96
1
0 20 40 60 80 100
Very likely
Somewhatlikely
Neither likelynor unlikely
Somewhatunlikely
Very unlikely
Don't know
Percent
Lives in a single familyhome on 1 acre or less inan urban area, a suburbanarea, or a small city/town(n=168)
WMU 5C
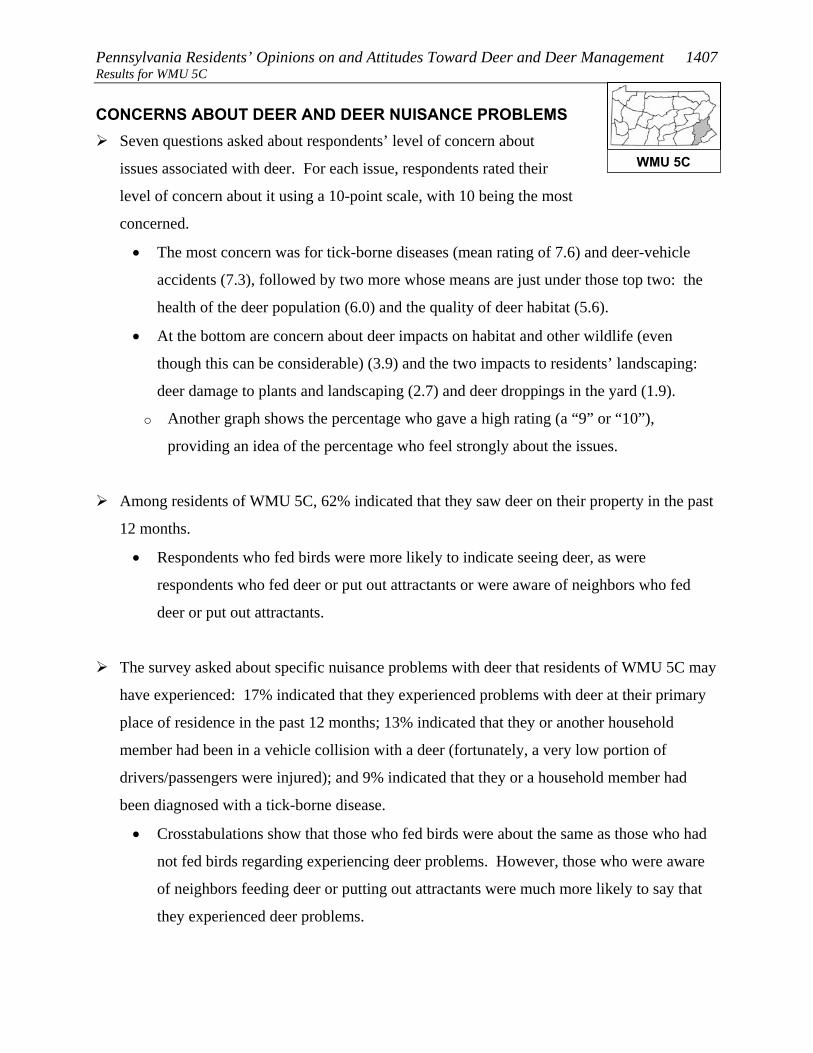
Pennsylvania Residents’ Opinions on and Attitudes Toward Deer and Deer Management 1407 Results for WMU 5C CONCERNS ABOUT DEER AND DEER NUISANCE PROBLEMS
Seven questions asked about respondents’ level of concern about
issues associated with deer. For each issue, respondents rated their
level of concern about it using a 10-point scale, with 10 being the most
concerned.
• The most concern was for tick-borne diseases (mean rating of 7.6) and deer-vehicle
accidents (7.3), followed by two more whose means are just under those top two: the
health of the deer population (6.0) and the quality of deer habitat (5.6).
• At the bottom are concern about deer impacts on habitat and other wildlife (even
though this can be considerable) (3.9) and the two impacts to residents’ landscaping:
deer damage to plants and landscaping (2.7) and deer droppings in the yard (1.9).
o Another graph shows the percentage who gave a high rating (a “9” or “10”),
providing an idea of the percentage who feel strongly about the issues.
Among residents of WMU 5C, 62% indicated that they saw deer on their property in the past
12 months.
• Respondents who fed birds were more likely to indicate seeing deer, as were
respondents who fed deer or put out attractants or were aware of neighbors who fed
deer or put out attractants.
The survey asked about specific nuisance problems with deer that residents of WMU 5C may
have experienced: 17% indicated that they experienced problems with deer at their primary
place of residence in the past 12 months; 13% indicated that they or another household
member had been in a vehicle collision with a deer (fortunately, a very low portion of
drivers/passengers were injured); and 9% indicated that they or a household member had
been diagnosed with a tick-borne disease.
• Crosstabulations show that those who fed birds were about the same as those who had
not fed birds regarding experiencing deer problems. However, those who were aware
of neighbors feeding deer or putting out attractants were much more likely to say that
they experienced deer problems.
WMU 5C

1408 Responsive Management Results for WMU 5C
Q36-Q42. Mean rating of respondents' concern about each of the following on a 10-point scale:
2.7
3.9
5.6
6.0
7.3
7.6
1.9
0 2 4 6 8 10
Q36. Tick-borne diseases, such as Lymedisease, in Pennsylvania
Q40. Deer-vehicle accidents inPennsylvania
Q42. The health of the deer population,such as adequate food resources for the
size of the deer herd, in Pennsylvania
Q41. The quality of deer habitat inPennsylvania
Q39. Deer impacts on the habitat andother wildlife in Pennsylvania
Q38. Deer damage to plants andlandscaping in his/her yard
Q37. Deer droppings in his/her yard
Mean
WMU 5C

Pennsylvania Residents’ Opinions on and Attitudes Toward Deer and Deer Management 1409 Results for WMU 5C
Q36-Q42. Percent who rated their concern about each of the following as a 9 or 10 on a 10-point
scale:
7
10
14
18
41
47
6
0 20 40 60 80 100
Q36. Tick-borne diseases, such as Lymedisease, in Pennsylvania
Q40. Deer-vehicle accidents inPennsylvania
Q42. The health of the deer population,such as adequate food resources for the
size of the deer herd, in Pennsylvania
Q41. The quality of deer habitat inPennsylvania
Q38. Deer damage to plants andlandscaping in his/her yard
Q39. Deer impacts on the habitat andother wildlife in Pennsylvania
Q37. Deer droppings in his/her yard
Percent
WMU 5C

1410 Responsive Management Results for WMU 5C
Q49. How often have you seen deer on your property in the past 12 months?
26
16
21
37
1
0 20 40 60 80 100
Frequently
Sometimes
Rarely
Never
Don't know
Percent (n=435)
WMU 5C
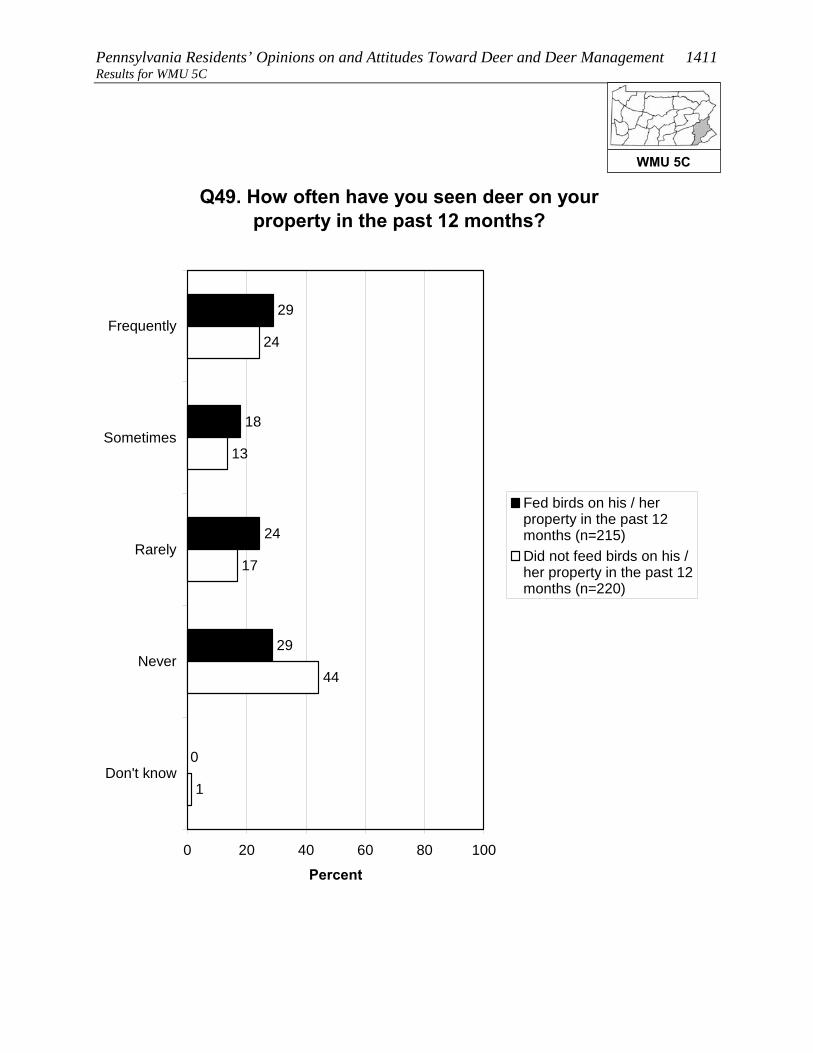
Pennsylvania Residents’ Opinions on and Attitudes Toward Deer and Deer Management 1411 Results for WMU 5C
Q49. How often have you seen deer on your property in the past 12 months?
29
18
24
29
0
17
13
24
44
1
0 20 40 60 80 100
Frequently
Sometimes
Rarely
Never
Don't know
Percent
Fed birds on his / herproperty in the past 12months (n=215)Did not feed birds on his /her property in the past 12months (n=220)
WMU 5C

1412 Responsive Management Results for WMU 5C
Q49. How often have you seen deer on your property in the past 12 months?
41
16
15
28
0
20
16
26
38
1
0 20 40 60 80 100
Frequently
Sometimes
Rarely
Never
Don't know
Percent
Has fed deer or put outattractants in the past 12months (n=25)Has not fed deer or put outattractants in the past 12months (n=409)
WMU 5C
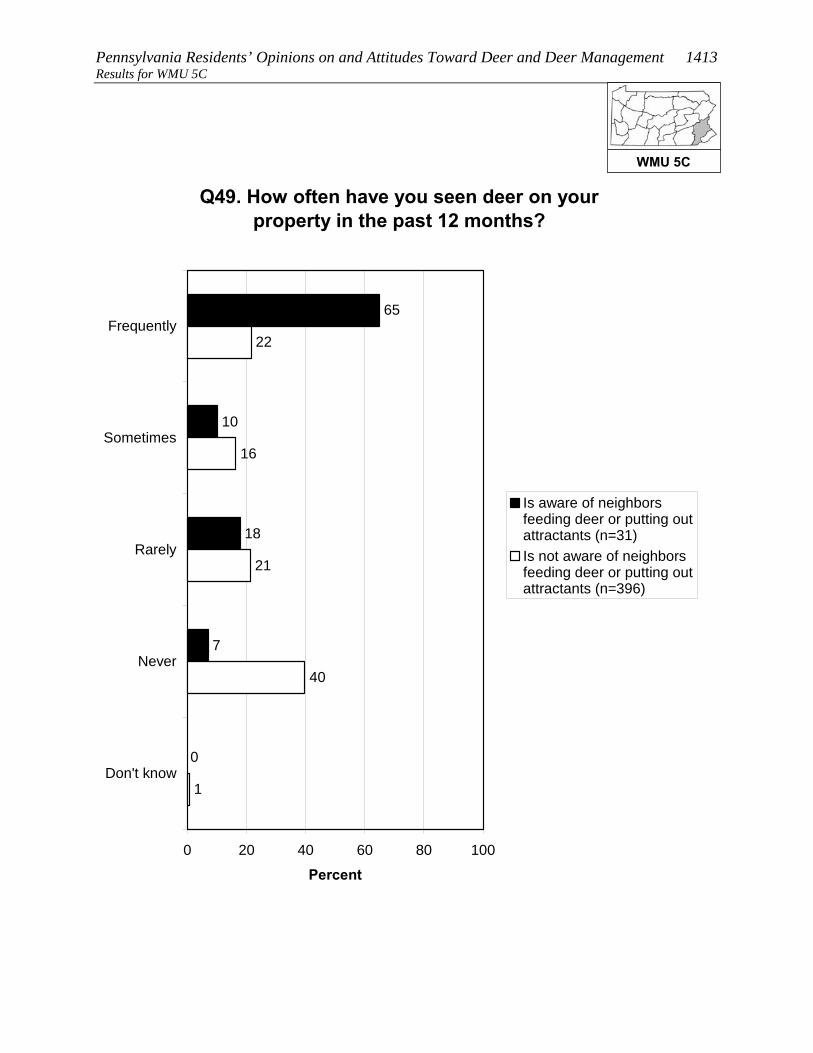
Pennsylvania Residents’ Opinions on and Attitudes Toward Deer and Deer Management 1413 Results for WMU 5C
Q49. How often have you seen deer on your property in the past 12 months?
65
10
18
7
0
21
16
22
40
1
0 20 40 60 80 100
Frequently
Sometimes
Rarely
Never
Don't know
Percent
Is aware of neighborsfeeding deer or putting outattractants (n=31)Is not aware of neighborsfeeding deer or putting outattractants (n=396)
WMU 5C

1414 Responsive Management Results for WMU 5C
Q43. In the past 12 months, have you experienced any problems with deer at your primary place of
residence?
17
83
0 20 40 60 80 100
Yes
No
Percent (n=435)
WMU 5C

Pennsylvania Residents’ Opinions on and Attitudes Toward Deer and Deer Management 1415 Results for WMU 5C
Q43. In the past 12 months, have you experienced any problems with deer at your primary place of
residence?
17
83
84
16
0 20 40 60 80 100
Yes
No
Percent
Fed birds on his / herproperty in the past 12months (n=215)Did not feed birds on his /her property in the past 12months (n=220)
WMU 5C

1416 Responsive Management Results for WMU 5C
Q43. In the past 12 months, have you experienced any problems with deer at your primary place of
residence?
23
77
85
15
0 20 40 60 80 100
Yes
No
Percent
Is aware of neighborsfeeding deer or putting outattractants (n=31)Is not aware of neighborsfeeding deer or putting outattractants (n=396)
WMU 5C

Pennsylvania Residents’ Opinions on and Attitudes Toward Deer and Deer Management 1417 Results for WMU 5C
Q44. In the past 12 months, have you or any other person living in your immediate household been in a vehicle collision with or an accident involving a
deer on Pennsylvania's roads or highways?
13
87
0 20 40 60 80 100
Yes
No
Percent (n=435)
WMU 5C

1418 Responsive Management Results for WMU 5C
Q45. Were you or anyone else injured? (Asked of those who had a household member who was in or
who have personally been in a vehicle collision with or an accident involving a deer on
Pennsylvania's roads or highways in the past 12 months.)
17
83
0 20 40 60 80 100
Yes
No
Percent (n=58)
WMU 5C

Pennsylvania Residents’ Opinions on and Attitudes Toward Deer and Deer Management 1419 Results for WMU 5C
Q46. In the past 12 months, have you or any other person living in your immediate household been
diagnosed by a physician with a tick-borne disease, such as Lyme disease?
9
90
Less than 1%
0 20 40 60 80 100
Yes
No
Don't know
Percent (n=435)
WMU 5C

1420 Responsive Management Results for WMU 5C
FEEDING WILDLIFE AND HUNTING DEER Several questions asked about feeding wildlife.
• Feeding deer or putting out deer attractants: 7% of residents of
WMU 5C did this, and 9% are aware of neighbors who did this.
o The most typical feeds or attractants put out by respondents are salt/mineral blocks,
corn, and apples.
• Feeding birds: 49% of residents of WMU 5C did this.
There is no consensus on whether it is okay for private citizens to feed or attract deer in
Pennsylvania: 41% agree that this is okay, but 50% disagree (the rest are neutral).
More than a quarter of residents of WMU 5C (21%) consider themselves to be a hunter,
about three-fourths of whom have a Pennsylvania hunting license.
• Among residents of WMU 5C who live in a single-family home, 13% personally hunt
deer on their property.
• A large majority of residents of WMU 5C (72%) say that they, family members, and/or
friends hunt.
WMU 5C

Pennsylvania Residents’ Opinions on and Attitudes Toward Deer and Deer Management 1421 Results for WMU 5C
Q50. Did you ever feed deer intentionally or put out attractants, such as a salt or mineral block, in the
past 12 months?
7
93
1
0 20 40 60 80 100
Yes
No
Don't know
Percent (n=435)
WMU 5C

1422 Responsive Management Results for WMU 5C
Q55. Are you aware of any of your neighbors feeding deer intentionally or trying to attract deer
on their property in the past 12 months?
9
88
3
0 20 40 60 80 100
Yes
No
Don't know
Percent (n=435)
WMU 5C
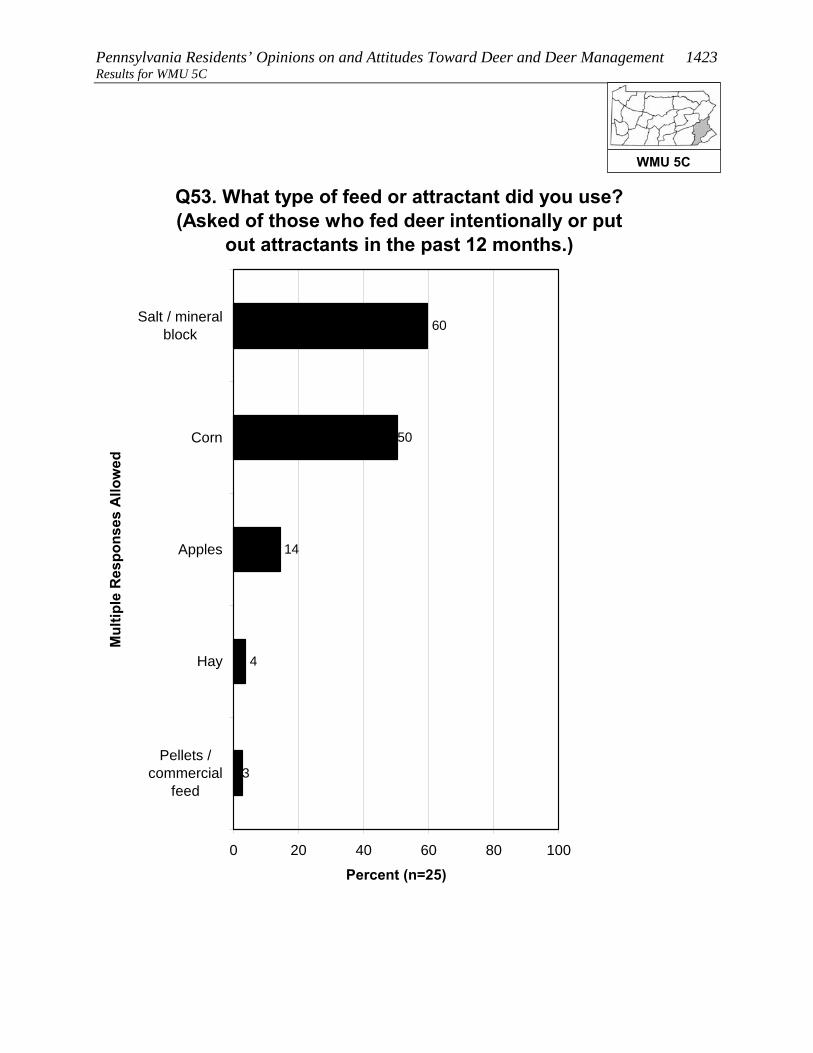
Pennsylvania Residents’ Opinions on and Attitudes Toward Deer and Deer Management 1423 Results for WMU 5C
Q53. What type of feed or attractant did you use? (Asked of those who fed deer intentionally or put
out attractants in the past 12 months.)
60
50
14
4
3
0 20 40 60 80 100
Salt / mineralblock
Corn
Apples
Hay
Pellets /commercial
feed
Mul
tiple
Res
pons
es A
llow
ed
Percent (n=25)
WMU 5C

1424 Responsive Management Results for WMU 5C
Q48. Did you feed birds or make birdfeed available on your property in the past 12 months?
49
51
0 20 40 60 80 100
Yes
No
Percent (n=435)
WMU 5C
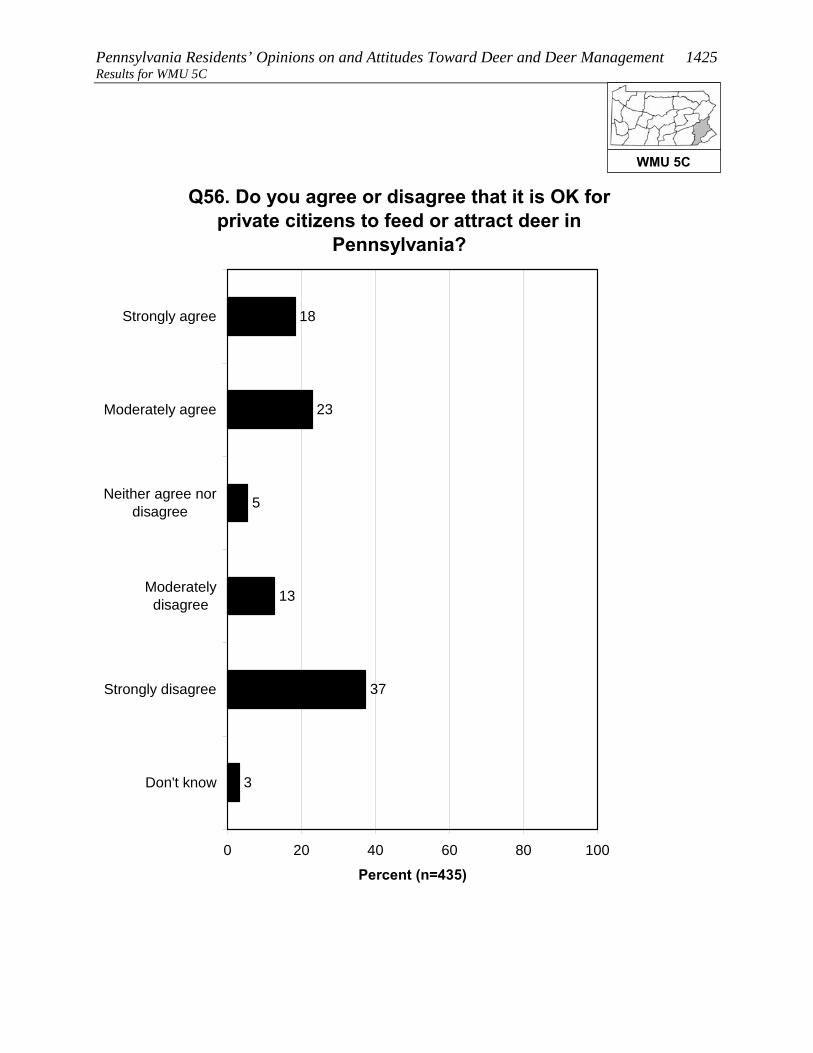
Pennsylvania Residents’ Opinions on and Attitudes Toward Deer and Deer Management 1425 Results for WMU 5C
Q56. Do you agree or disagree that it is OK for private citizens to feed or attract deer in
Pennsylvania?
18
23
5
13
37
3
0 20 40 60 80 100
Strongly agree
Moderately agree
Neither agree nordisagree
Moderatelydisagree
Strongly disagree
Don't know
Percent (n=435)
WMU 5C
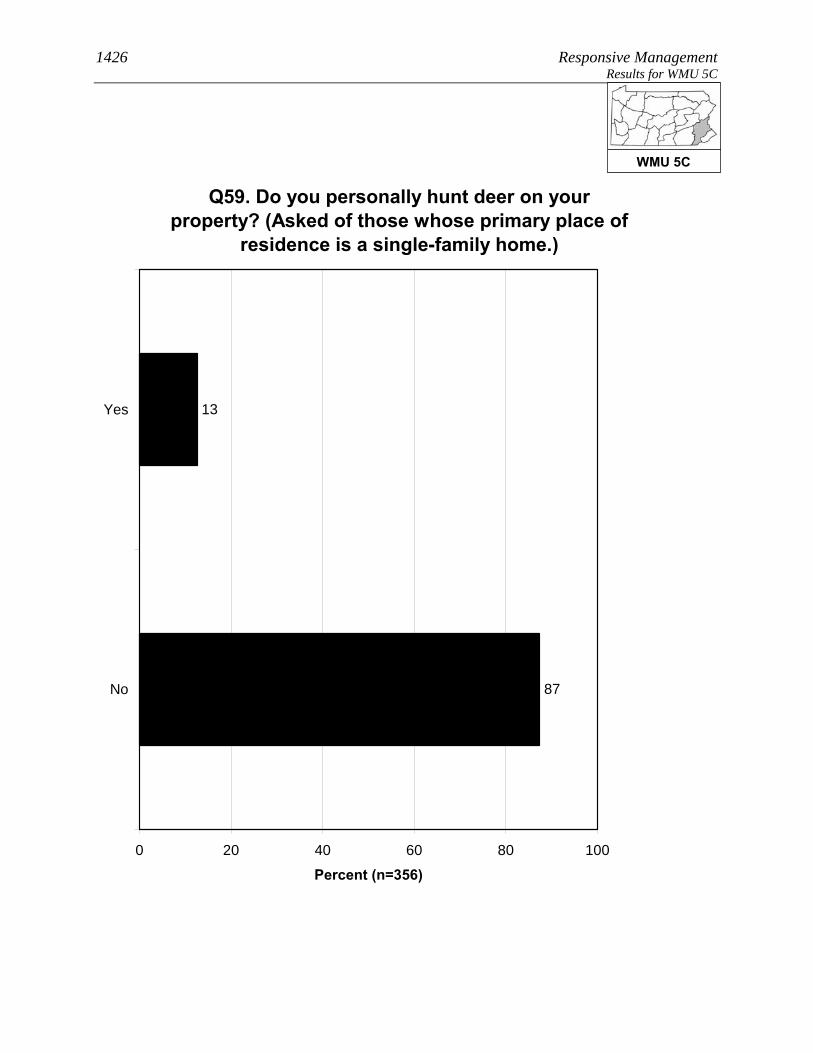
1426 Responsive Management Results for WMU 5C
Q59. Do you personally hunt deer on your property? (Asked of those whose primary place of
residence is a single-family home.)
13
87
0 20 40 60 80 100
Yes
No
Percent (n=356)
WMU 5C

Pennsylvania Residents’ Opinions on and Attitudes Toward Deer and Deer Management 1427 Results for WMU 5C
Q79. Do you, any of your family members, or any friends hunt any wildlife species?
72
27
2
0 20 40 60 80 100
Yes
No
Don't know
Percent (n=435)
WMU 5C

1428 Responsive Management Results for WMU 5C
SOURCES OF INFORMATION Most commonly, residents of WMU 5C say that the best way to
provide them with information about deer in Pennsylvania is through
direct mail (34% gave this response), followed by email (22%), the
Internet (16% saying an Internet site other than the PGC and 6%
saying the agency website; note that some said both), and newspaper
(12%).
Just under half of residents of WMU 5C (46%) use social media, the most common primary
site being Facebook.
WMU 5C
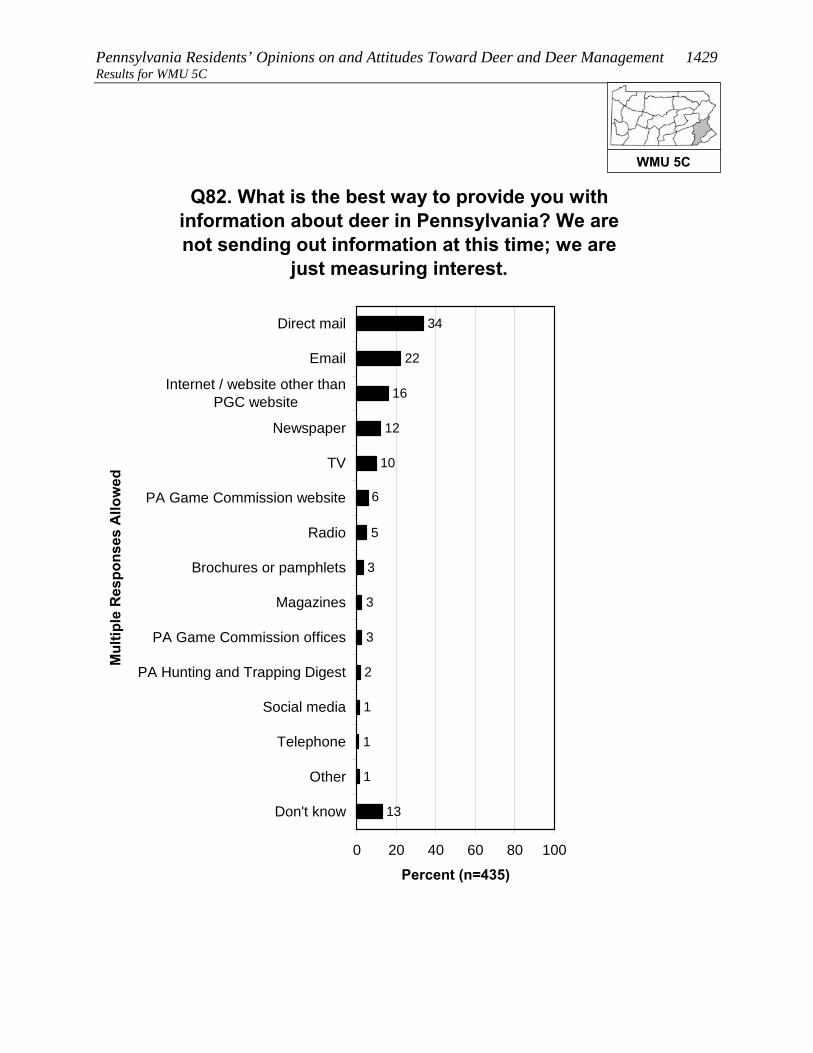
Pennsylvania Residents’ Opinions on and Attitudes Toward Deer and Deer Management 1429 Results for WMU 5C
Q82. What is the best way to provide you with information about deer in Pennsylvania? We are not sending out information at this time; we are
just measuring interest.
3
3
5
34
22
16
12
10
6
3
2
1
1
1
13
0 20 40 60 80 100
Direct mail
Internet / website other thanPGC website
Newspaper
TV
PA Game Commission website
Radio
Brochures or pamphlets
Magazines
PA Game Commission offices
PA Hunting and Trapping Digest
Social media
Telephone
Other
Don't know
Mul
tiple
Res
pons
es A
llow
ed
Percent (n=435)
WMU 5C

1430 Responsive Management Results for WMU 5C
Q84. Do you use social media, such as Facebook, Twitter, or YouTube?
46
53
1
0 20 40 60 80 100
Yes
No
Don't know
Percent (n=435)
WMU 5C

Pennsylvania Residents’ Opinions on and Attitudes Toward Deer and Deer Management 1431 Results for WMU 5C
Q85. Which social media site do you use most often? (Asked of those who use social media.)
85
7
6
1
1
0 20 40 60 80 100
YouTube
Other
Don't know
Percent (n=209)
WMU 5C
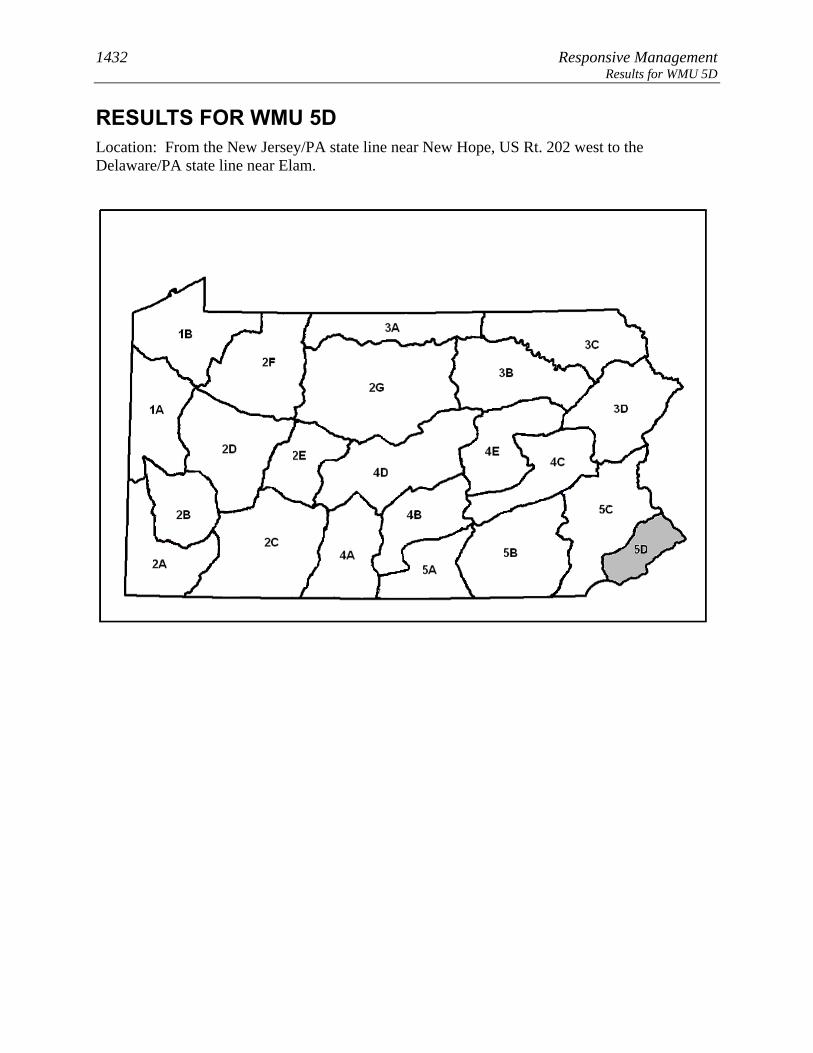
1432 Responsive Management Results for WMU 5D
RESULTS FOR WMU 5D Location: From the New Jersey/PA state line near New Hope, US Rt. 202 west to the Delaware/PA state line near Elam.

Pennsylvania Residents’ Opinions on and Attitudes Toward Deer and Deer Management 1433 Results for WMU 5D
8. Lives in WMU 5D 1. Does not consider deer-related issues as a 9 or 10 in importance as compared to other issues in his/her life (p < 0.001). 2. Does not indicate having seen deer frequently on his/her property in the past 12 months (p < 0.001). 3. Does not Indicate that he/she or any of his/her family members hunt (p < 0.001). 3. Does not indicate considering himself/herself to be a hunter (p < 0.001). 3. Does not indicate having spent time viewing or watching deer around home in the past 12 months (p < 0.001). 3. Does not indicate having a valid 2011 PA general hunting license (p < 0.001). 3. Does not indicate having taken a trip more than a mile from home for the primary purpose of viewing or watching deer in the past 12 months (p < 0.001). 3. Does not indicate having fed birds or made birdfeed available on his/her property in the past 12 months (p < 0.001). 3. Does not indicate having fed deer intentionally or having put out attractants in the past 12 months (p < 0.001). 3. Does not indicate being very or somewhat satisfied with opportunities to view or watch deer in PA (p < 0.001). 3. Does not indicate having used a spotlight to view deer at night on a trip to watch deer in the past 12 months (p < 0.01). 4. Does not strongly or moderately support legal, regulated hunting as a method of controlling deer populations in PA (p < 0.001). 4. Strongly or moderately supports fertility or birth control as a method of controlling deer populations in PA (p < 0.001). 4. Strongly or moderately supports professionals or sharpshooters as a method of controlling deer populations in PA (p < 0.001). 4. Considers the deer population in his/her area to be too high (p < 0.001). 4. Does not strongly or moderately support lethal methods to manage deer populations in PA (p < 0.01). 4. Does not strongly or moderately agree that deer populations should be managed for healthy and sustainable deer populations (p < 0.05). 4. Strongly or moderately agrees that deer populations should be managed for safe and acceptable levels of deer-human conflicts (p < 0.05). 5. Does not strongly or moderately agree that it is OK for private citizens to feed or attract deer in PA (p < 0.001). 5. Rates concern about deer-vehicle accidents in PA as a 9 or 10 (p < 0.001). 5. Rates concern about deer droppings in their yard as a 9 or a 10 (p < 0.001). 5. Does not indicate that he/she or another person living in the immediate household has been in a vehicle collision with or an accident involving a deer on PA's roads or highways in the past 12 months (p < 0.001). 5. Rates concern about deer damage to plants and landscaping in their yard as a 9 or 10 (p < 0.001). 6. Rates concern about deer impacts on the habitat and other wildlife in PA as a 9 or 10 (p < 0.001). 7. Uses social media, such as Facebook, Twitter, or YouTube (p < 0.001). 7. Uses Facebook (p < 0.05). 8. Considers place of residence to be an urban or suburban area (p < 0.001). 8. Primary place of residence is a single-family home (p < 0.001). 8. Has more than median number of people living in his/her household (p < 0.001). 8. Has lived at his/her primary place of residence for the median number of years or less (p < 0.01). 8. Is the median age or younger (p < 0.05). See page 9 through 11 for explanation of how to interpret z-score tables.
WMU 5D

1434 Responsive Management Results for WMU 5D
PARTICIPATION IN VIEWING DEER Two-fifths of residents of WMU 5D (40%) spent time viewing deer
around their home in the past 12 months, and 11% took a trip of at
least a mile to view deer.
• About one in six of those who took a deer-viewing trip (16%) used a spotlight to view
the deer at night.
A majority of residents of WMU 5D (59%) are satisfied with opportunities to view deer in
Pennsylvania. Because a relatively large percentage answer neutrally, only 8% indicate
being dissatisfied.
WMU 5D

Pennsylvania Residents’ Opinions on and Attitudes Toward Deer and Deer Management 1435 Results for WMU 5D
Q10. Have you spent time viewing or watching deer around your home in the past 12 months?
40
59
Less than 1%
0 20 40 60 80 100
Yes
No
Don't know
Percent (n=440)
WMU 5D
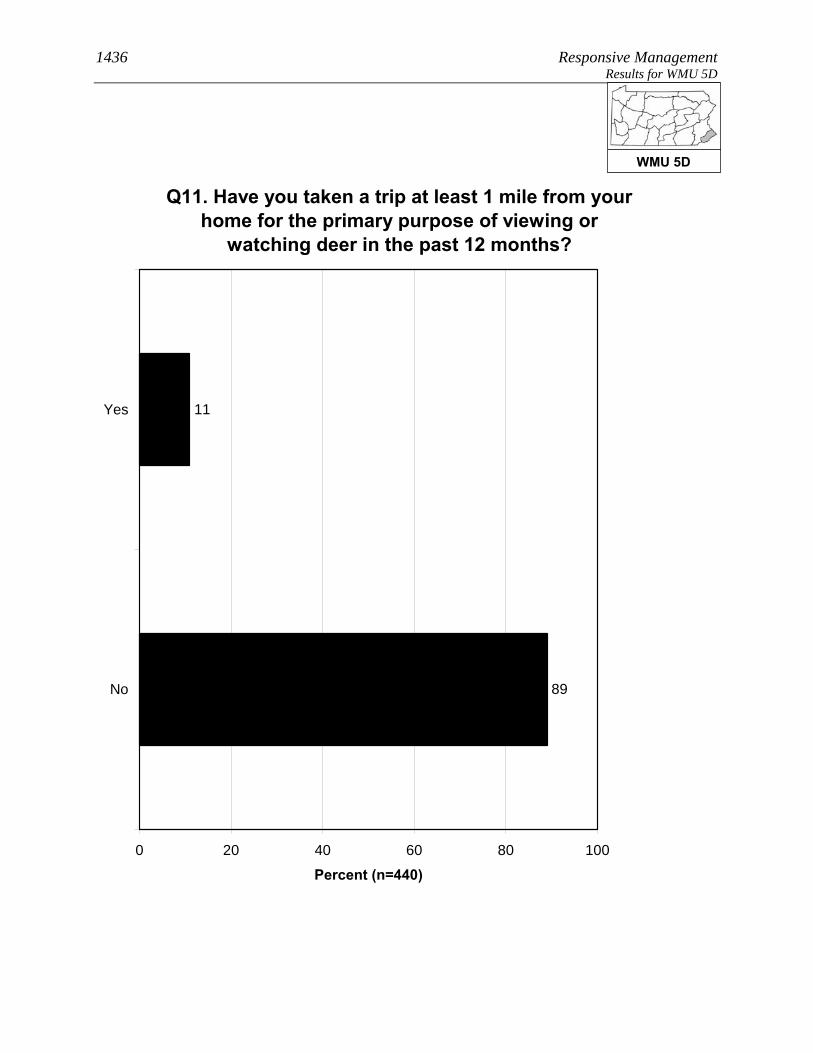
1436 Responsive Management Results for WMU 5D
Q11. Have you taken a trip at least 1 mile from your home for the primary purpose of viewing or
watching deer in the past 12 months?
11
89
0 20 40 60 80 100
Yes
No
Percent (n=440)
WMU 5D
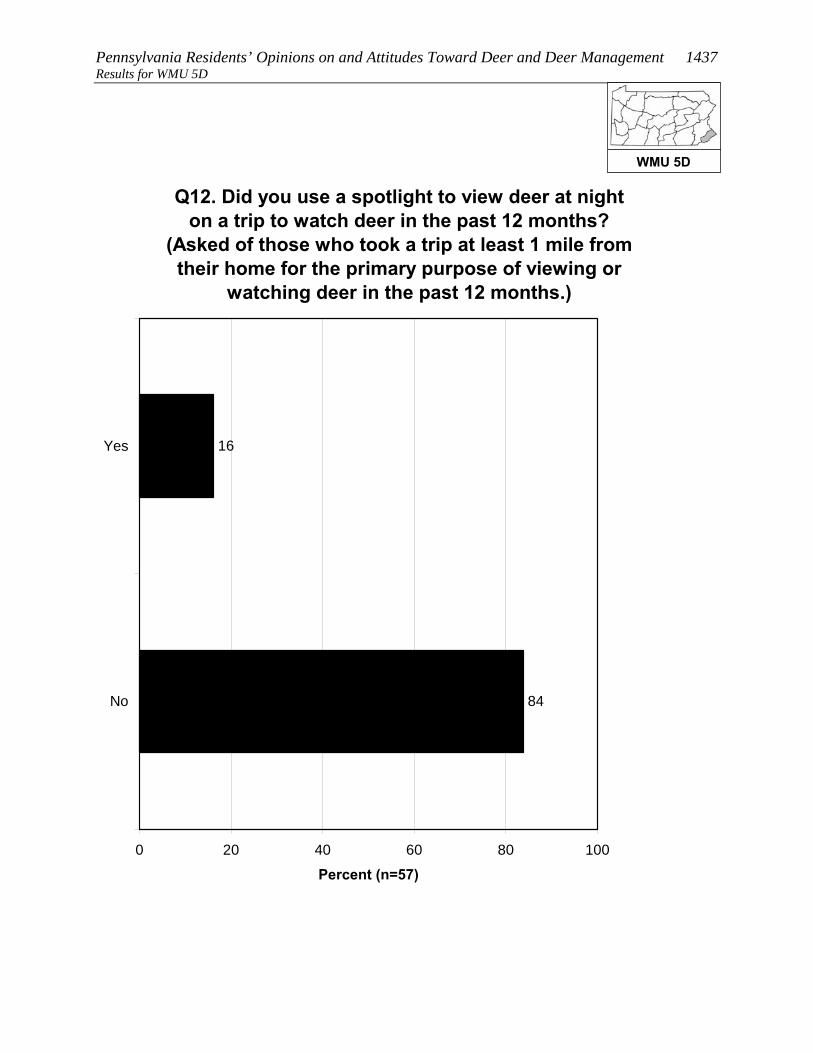
Pennsylvania Residents’ Opinions on and Attitudes Toward Deer and Deer Management 1437 Results for WMU 5D
Q12. Did you use a spotlight to view deer at night on a trip to watch deer in the past 12 months?
(Asked of those who took a trip at least 1 mile from their home for the primary purpose of viewing or
watching deer in the past 12 months.)
16
84
0 20 40 60 80 100
Yes
No
Percent (n=57)
WMU 5D
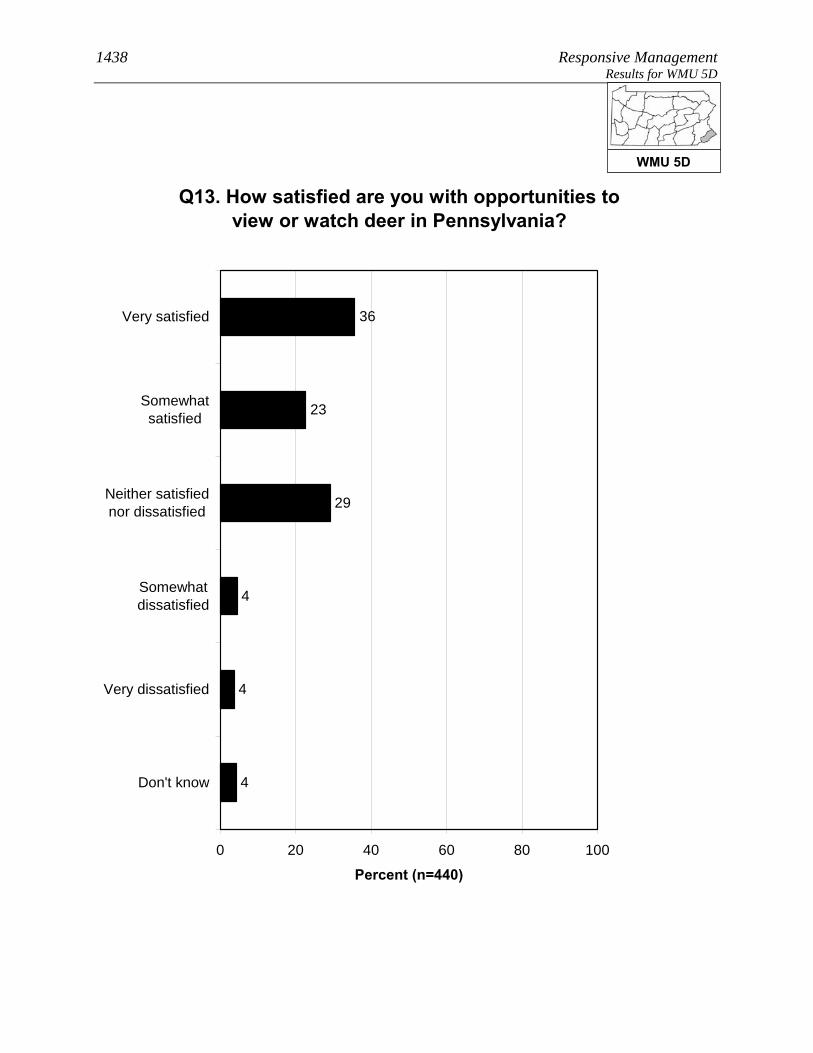
1438 Responsive Management Results for WMU 5D
Q13. How satisfied are you with opportunities to view or watch deer in Pennsylvania?
36
23
29
4
4
4
0 20 40 60 80 100
Very satisfied
Somewhatsatisfied
Neither satisfiednor dissatisfied
Somewhatdissatisfied
Very dissatisfied
Don't know
Percent (n=440)
WMU 5D

Pennsylvania Residents’ Opinions on and Attitudes Toward Deer and Deer Management 1439 Results for WMU 5D OPINIONS ON DEER IN GENERAL AND THE SIZE AND HEALTH OF THE DEER HERD
Opinion on deer is mostly favorable: 37% of residents of WMU 5D
say with no caveats that they like having deer around, another 32%
like having deer around but worry about the problems they may cause,
and only 8% generally regard them as a nuisance. The remainder have
no particular feeling about deer.
Another question asked residents of WMU 5D how deer-related issues compared to other
issues in their life, on a scale of 0 to 10, with the most importance being 10: the median
rating is “3.” The most common ratings are “0” (25%) and the midpoint of “5” (18%). In
general, ratings are spread across the scale.
Two other ratings questions asked respondents to rate their concern about deer-related issues.
The median level of concern is “6” for the quality of deer habitat in Pennsylvania and “7” for
the health of the deer population in Pennsylvania.
The survey asked about the perceived size of the deer herd in the respondent’s area. The
majority of residents of WMU 5D say that the herd size is just right (55%); otherwise, more
say that it is too high (25%) than too low (10%).
• Those who own their home are just slightly more likely, compared to those who do not
own their home, to say that the deer population in their area is just right; they are also
more likely to say that the deer population is too high.
• Those who consider themselves to be a hunter are not markedly different than
non-hunters regarding their opinion on the size of the deer population in their area.
WMU 5D

1440 Responsive Management Results for WMU 5D
Q14. Generally, which of the following best describes your feelings about deer in
Pennsylvania?
37
32
8
22
1
0 20 40 60 80 100
I like having deeraround
I like having deeraround but worryabout problems
they cause
I generally regarddeer as a nuisance
I have no particularfeeling about deer
Don't know
Percent (n=440)
WMU 5D

Pennsylvania Residents’ Opinions on and Attitudes Toward Deer and Deer Management 1441 Results for WMU 5D
Q15. Compared to other issues in your life, how important to you, personally, are deer-related
issues on a scale of 0 to 10 where 0 is not at all important and 10 is extremely important?
11
6
7
6
2
5
4
5
18
11
25
1
0 20 40 60 80 100
10
9
8
7
6
5
4
3
2
1
0
Don't know
Percent (n=440)
Mean = 3.45Median = 3
WMU 5D
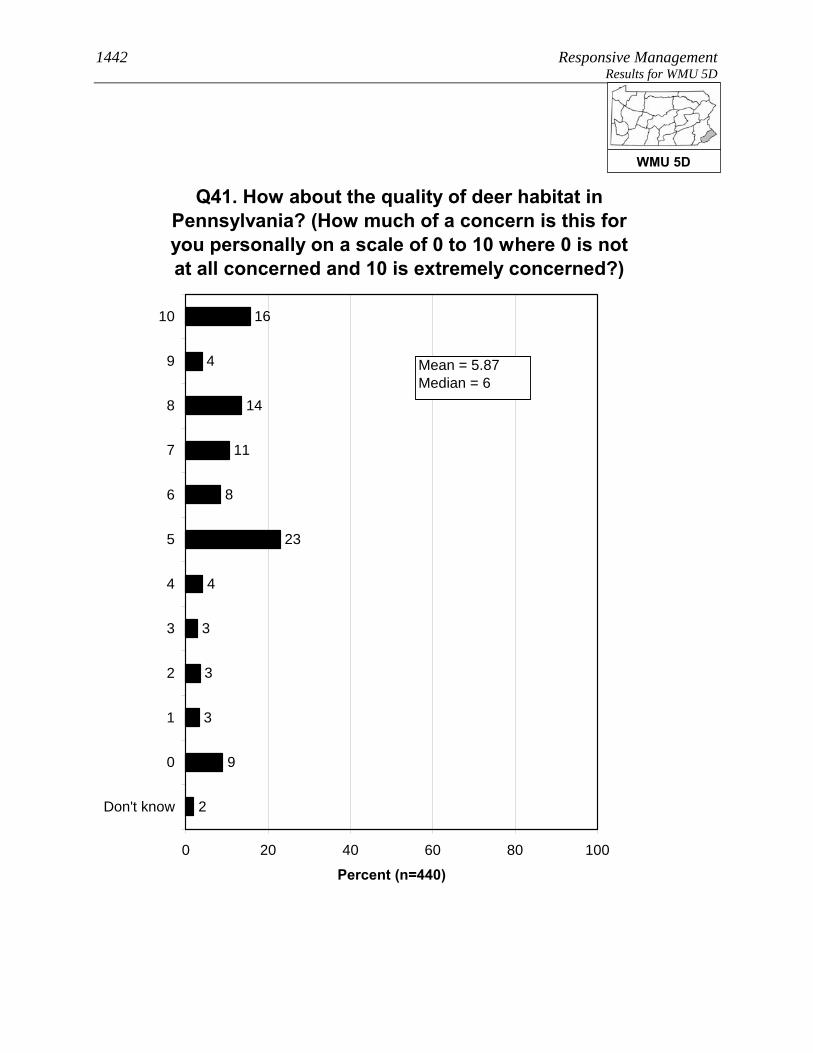
1442 Responsive Management Results for WMU 5D
Q41. How about the quality of deer habitat in Pennsylvania? (How much of a concern is this for you personally on a scale of 0 to 10 where 0 is not at all concerned and 10 is extremely concerned?)
3
3
4
16
4
14
11
8
23
3
9
2
0 20 40 60 80 100
10
9
8
7
6
5
4
3
2
1
0
Don't know
Percent (n=440)
Mean = 5.87Median = 6
WMU 5D

Pennsylvania Residents’ Opinions on and Attitudes Toward Deer and Deer Management 1443 Results for WMU 5D
3
3
5
20
4
14
12
7
20
1
9
1
0 20 40 60 80 100
10
9
8
7
6
5
4
3
2
1
0
Don't know
Percent (n=440)
Q42. How about health of the deer population, such as adequate food resources for the size of the deer herd, in Pennsylvania? (How much of a concern is this for you
personally on a scale of 0 to 10 where 0 is not at all concerned and 10 is extremely concerned?)
Mean = 6.25Median = 7
WMU 5D
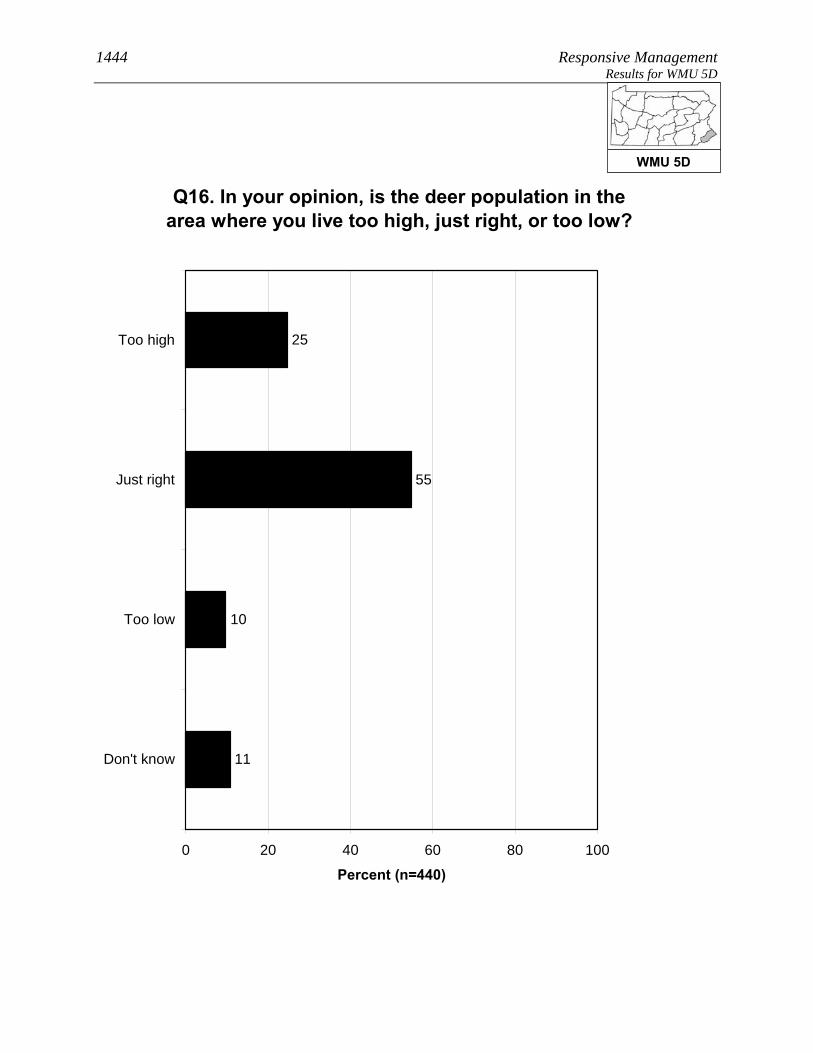
1444 Responsive Management Results for WMU 5D
Q16. In your opinion, is the deer population in the area where you live too high, just right, or too low?
25
55
10
11
0 20 40 60 80 100
Too high
Just right
Too low
Don't know
Percent (n=440)
WMU 5D

Pennsylvania Residents’ Opinions on and Attitudes Toward Deer and Deer Management 1445 Results for WMU 5D
Q16. In your opinion, is the deer population in the area where you live too high, just right, or too low?
31
52
9
8
10
48
23
19
0 20 40 60 80 100
Too high
Just right
Too low
Don't know
Percent
Owns home (n=281)Does not own home (n=24)
WMU 5D

1446 Responsive Management Results for WMU 5D
Q16. In your opinion, is the deer population in the area where you live too high, just right, or too low?
29
59
11
0
10
54
24
12
0 20 40 60 80 100
Too high
Just right
Too low
Don't know
Percent
Consider themselves ahunter (n=46)Do not consider themselvesa hunter (n=391)
WMU 5D

Pennsylvania Residents’ Opinions on and Attitudes Toward Deer and Deer Management 1447 Results for WMU 5D OPINIONS ON MANAGEMENT EFFORTS AND MANAGEMENT GOALS
The survey asked about three deer population management goals. For
all three, a large majority agree with the management goal: 90% agree
with managing the deer for a healthy and sustainable forest habitat,
89% agree with managing for healthy and sustainable deer
populations, and 86% agree with managing for safe, acceptable levels
of deer-human conflicts.
Residents of WMU 5D who said that the deer population in their area is too high or too low
were asked to indicate the reasonable number of years it should take to achieve an acceptable
deer population. The mean amount is 4.67 years. While 35% said that they do not know,
nearly all the rest gave a number of years of 10 or less. Note that this is only among those
who said the deer population was too high or too low.
• Because management plans typically look at a time frame of about 10 years to effect
change, the survey specifically asked if these respondents would be willing to wait
more than 10 years to achieve an acceptable deer population: a majority (56%)
indicated that they would be willing to wait that long.
WMU 5D

1448 Responsive Management Results for WMU 5D
Q24-26. Deer populations should be managed for the following. (Do you agree or disagree with this
deer management goal?)
54
36
4
3
2
1
4
36
53
3
4
1
5
53
33
5
4
1
0 20 40 60 80 100
Stronglyagree
Moderatelyagree
Neither agreenor disagree
Moderatelydisagree
Stronglydisagree
Don't know
Percent (n=440)
Healthy and sustainableforest habitatHealthy and sustainabledeer populationsSafe and acceptable levelsof deer-human conflicts
WMU 5D
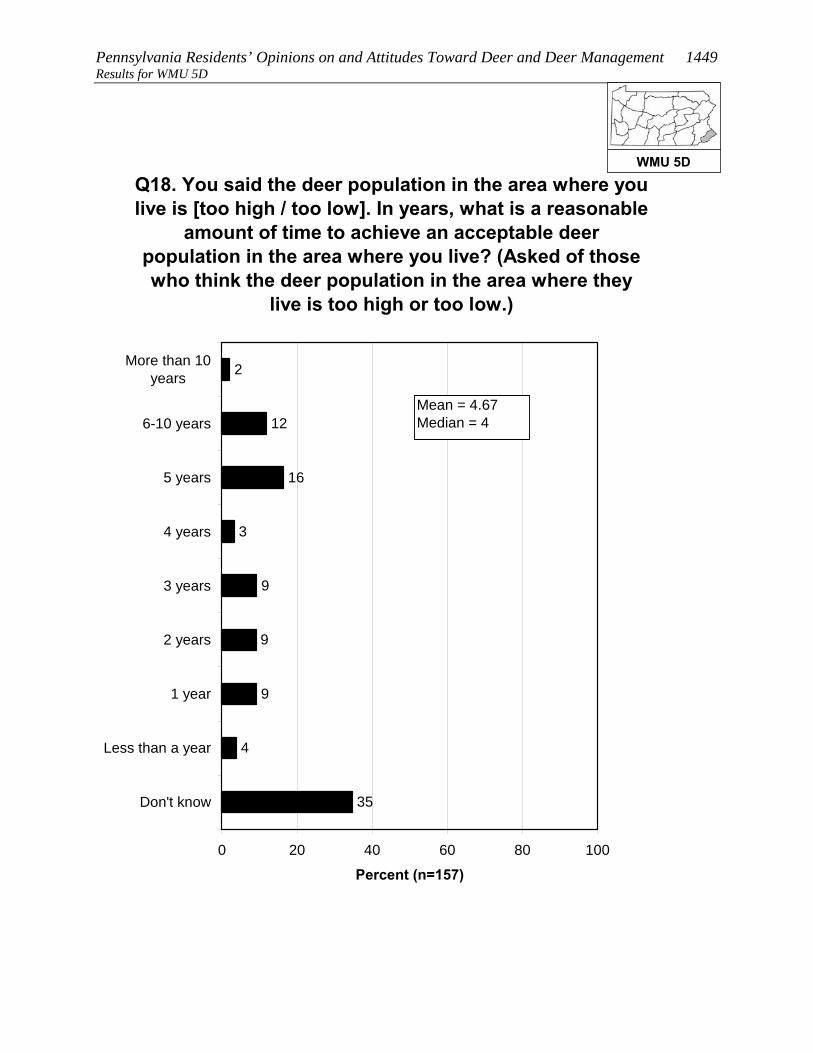
Pennsylvania Residents’ Opinions on and Attitudes Toward Deer and Deer Management 1449 Results for WMU 5D
35
4
9
2
12
16
3
9
9
0 20 40 60 80 100
More than 10years
6-10 years
5 years
4 years
3 years
2 years
1 year
Less than a year
Don't know
Percent (n=157)
Q18. You said the deer population in the area where you live is [too high / too low]. In years, what is a reasonable
amount of time to achieve an acceptable deer population in the area where you live? (Asked of those who think the deer population in the area where they
live is too high or too low.)
Mean = 4.67Median = 4
WMU 5D

1450 Responsive Management Results for WMU 5D
Q21. Would you be willing to wait more than 10 years to achieve an acceptable deer population in the area where you live? (Among those who think the deer population in the area where they live is
too high or too low.)
56
38
6
0 20 40 60 80 100
Yes
No
Don't know
Percent (n=157)
WMU 5D
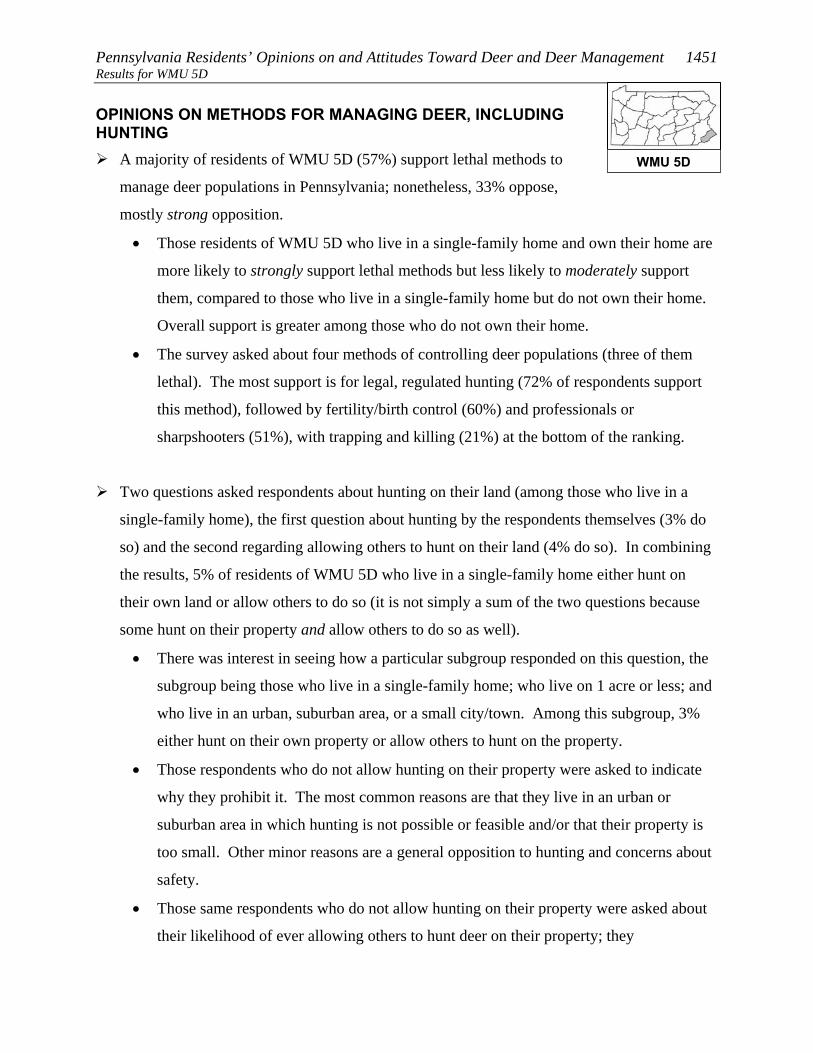
Pennsylvania Residents’ Opinions on and Attitudes Toward Deer and Deer Management 1451 Results for WMU 5D OPINIONS ON METHODS FOR MANAGING DEER, INCLUDING HUNTING
A majority of residents of WMU 5D (57%) support lethal methods to
manage deer populations in Pennsylvania; nonetheless, 33% oppose,
mostly strong opposition.
• Those residents of WMU 5D who live in a single-family home and own their home are
more likely to strongly support lethal methods but less likely to moderately support
them, compared to those who live in a single-family home but do not own their home.
Overall support is greater among those who do not own their home.
• The survey asked about four methods of controlling deer populations (three of them
lethal). The most support is for legal, regulated hunting (72% of respondents support
this method), followed by fertility/birth control (60%) and professionals or
sharpshooters (51%), with trapping and killing (21%) at the bottom of the ranking.
Two questions asked respondents about hunting on their land (among those who live in a
single-family home), the first question about hunting by the respondents themselves (3% do
so) and the second regarding allowing others to hunt on their land (4% do so). In combining
the results, 5% of residents of WMU 5D who live in a single-family home either hunt on
their own land or allow others to do so (it is not simply a sum of the two questions because
some hunt on their property and allow others to do so as well).
• There was interest in seeing how a particular subgroup responded on this question, the
subgroup being those who live in a single-family home; who live on 1 acre or less; and
who live in an urban, suburban area, or a small city/town. Among this subgroup, 3%
either hunt on their own property or allow others to hunt on the property.
• Those respondents who do not allow hunting on their property were asked to indicate
why they prohibit it. The most common reasons are that they live in an urban or
suburban area in which hunting is not possible or feasible and/or that their property is
too small. Other minor reasons are a general opposition to hunting and concerns about
safety.
• Those same respondents who do not allow hunting on their property were asked about
their likelihood of ever allowing others to hunt deer on their property; they
WMU 5D
1452 Responsive Management Results for WMU 5D
overwhelmingly say this is very unlikely (95%). They were then
asked if there is anything that would make them more likely to allow
deer hunting; they are almost unanimous (98%) in saying that there
is nothing that would make them more likely to allow deer hunting.
• The question about allowing others to hunt on their property was examined among the
subgroup previously discussed (those who live in a single-family home; who live on 1
acre or less; and who live in an urban, suburban area, or a small city/town). Among
this group who got the question, nearly all say that they would never allow hunting.
o Additional follow-up questions to be asked of those who indicated that something
might prompt them to allow hunting on their property did not have enough
respondents for statistical validity; therefore, they are not shown.
WMU 5D
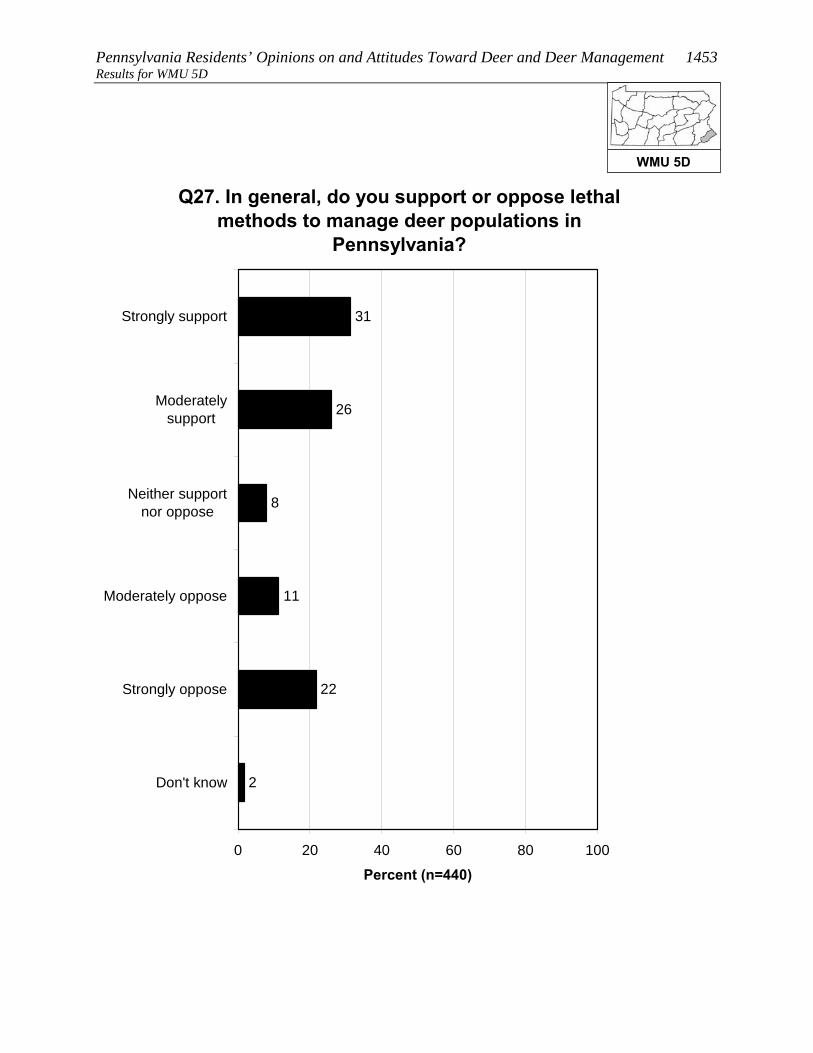
Pennsylvania Residents’ Opinions on and Attitudes Toward Deer and Deer Management 1453 Results for WMU 5D
Q27. In general, do you support or oppose lethal methods to manage deer populations in
Pennsylvania?
31
26
8
11
22
2
0 20 40 60 80 100
Strongly support
Moderatelysupport
Neither supportnor oppose
Moderately oppose
Strongly oppose
Don't know
Percent (n=440)
WMU 5D
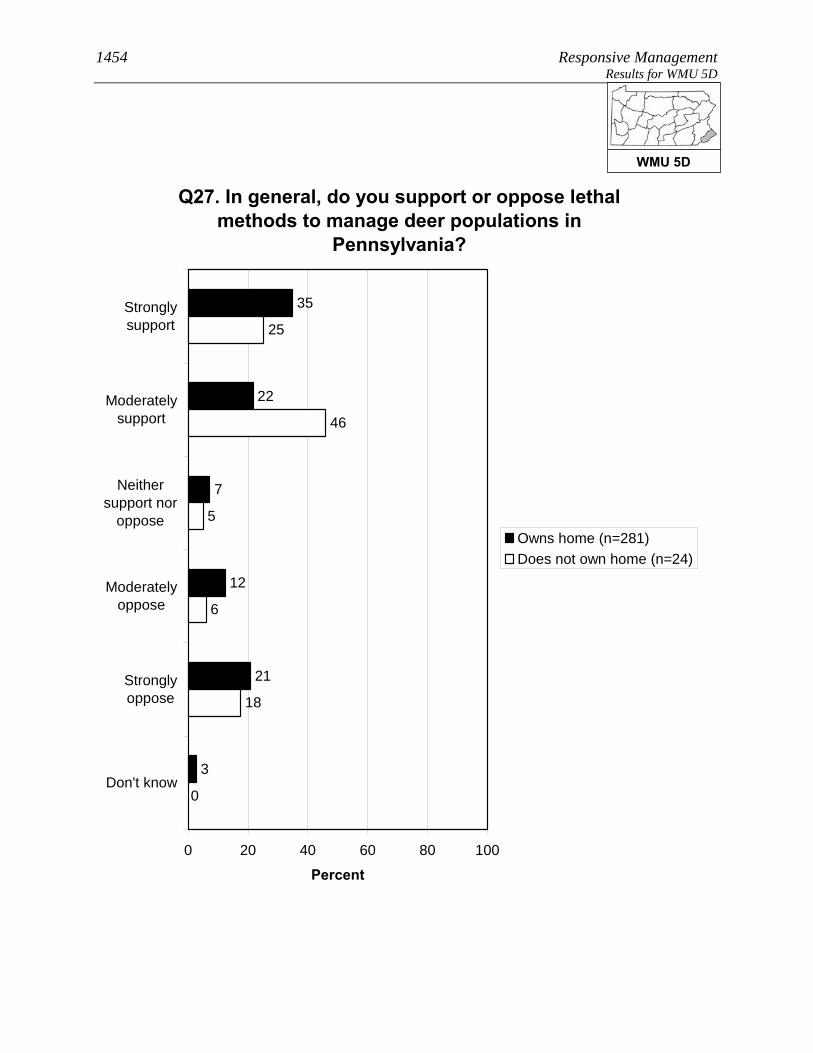
1454 Responsive Management Results for WMU 5D
Q27. In general, do you support or oppose lethal methods to manage deer populations in
Pennsylvania?
35
22
7
12
21
3
5
46
25
6
18
0
0 20 40 60 80 100
Stronglysupport
Moderatelysupport
Neithersupport nor
oppose
Moderatelyoppose
Stronglyoppose
Don't know
Percent
Owns home (n=281)Does not own home (n=24)
WMU 5D

Pennsylvania Residents’ Opinions on and Attitudes Toward Deer and Deer Management 1455 Results for WMU 5D
Q30-Q33. Percent who strongly support each of the following methods of controlling deer populations
in Pennsylvania:
7
24
34
48
0 20 40 60 80 100
Q30. Legal,regulated hunting
Q33. Fertility or birthcontrol
Q31. Professionalsor sharpshooters
Q32. Trapping andkilling
Percent
WMU 5D

1456 Responsive Management Results for WMU 5D
Q30-Q33. Percent who strongly or moderately support each of the following methods of
controlling deer populations in Pennsylvania:
21
51
60
72
0 20 40 60 80 100
Q30. Legal,regulated hunting
Q33. Fertility or birthcontrol
Q31. Professionalsor sharpshooters
Q32. Trapping andkilling
Percent
WMU 5D
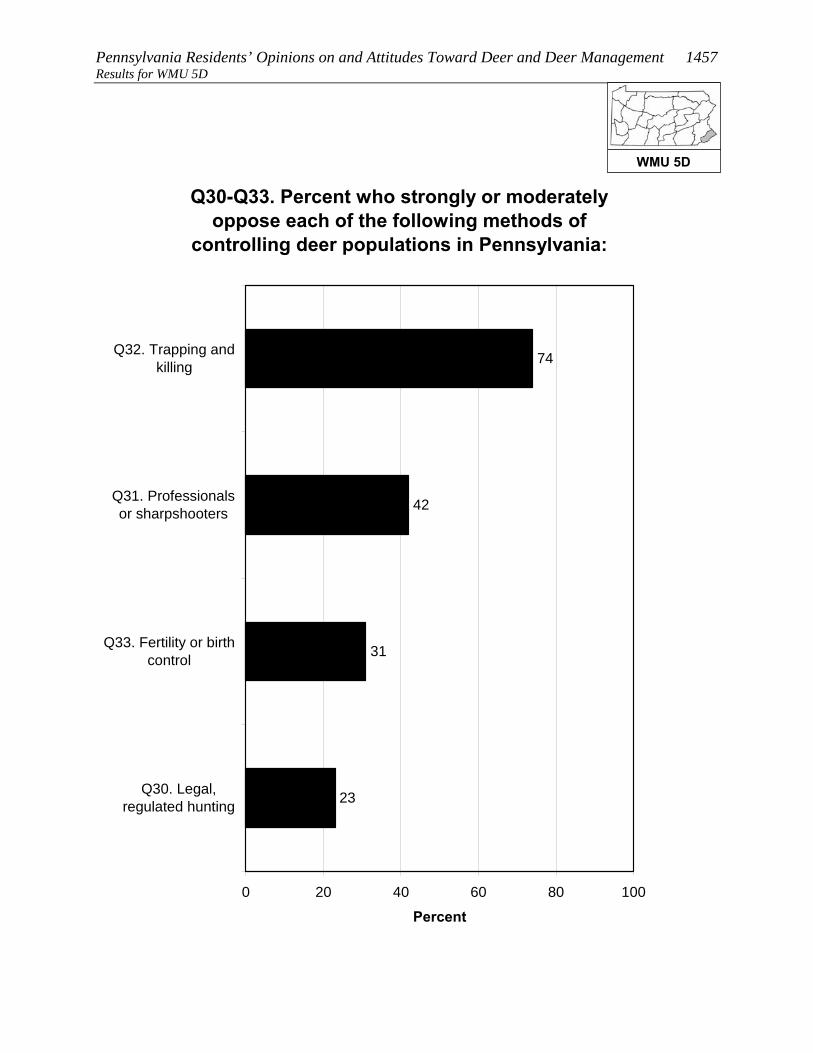
Pennsylvania Residents’ Opinions on and Attitudes Toward Deer and Deer Management 1457 Results for WMU 5D
Q30-Q33. Percent who strongly or moderately oppose each of the following methods of
controlling deer populations in Pennsylvania:
23
31
42
74
0 20 40 60 80 100
Q32. Trapping andkilling
Q31. Professionalsor sharpshooters
Q33. Fertility or birthcontrol
Q30. Legal,regulated hunting
Percent
WMU 5D

1458 Responsive Management Results for WMU 5D
Q30-Q33. Percent who strongly oppose each of the following methods of controlling deer populations
in Pennsylvania:
16
19
30
57
0 20 40 60 80 100
Q32. Trapping andkilling
Q31. Professionalsor sharpshooters
Q33. Fertility or birthcontrol
Q30. Legal,regulated hunting
Percent
WMU 5D
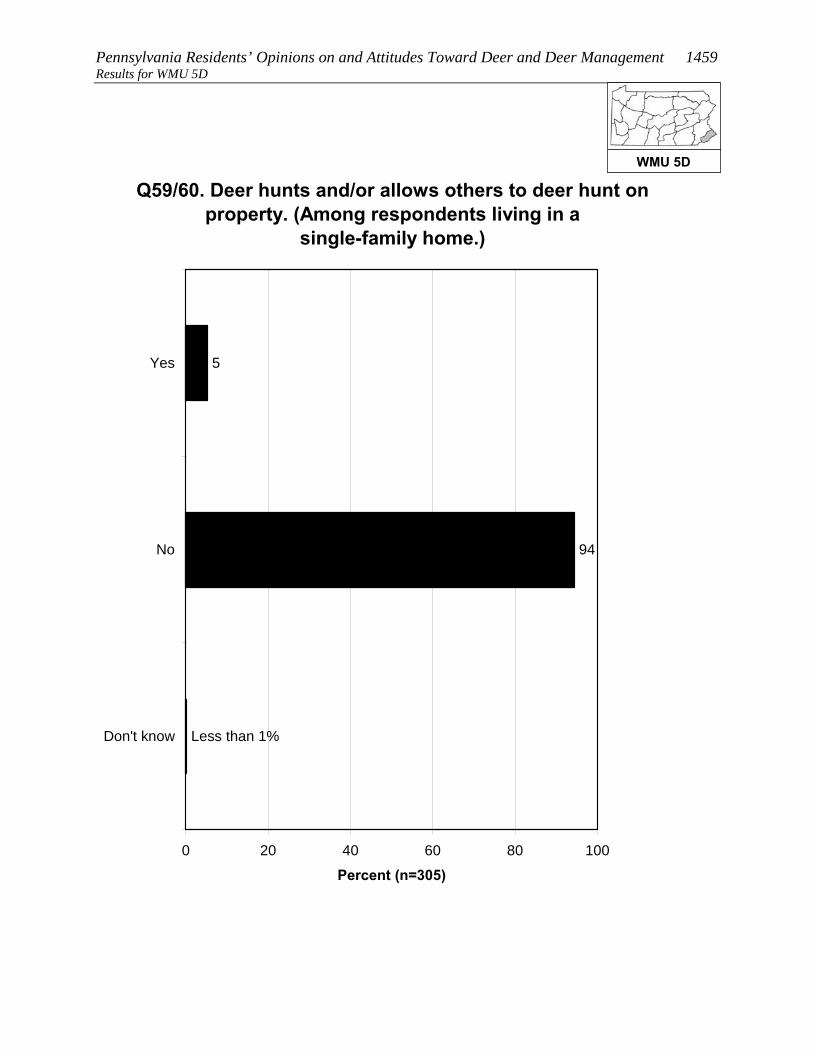
Pennsylvania Residents’ Opinions on and Attitudes Toward Deer and Deer Management 1459 Results for WMU 5D
5
94
Less than 1%
0 20 40 60 80 100
Yes
No
Don't know
Percent (n=305)
Q59/60. Deer hunts and/or allows others to deer hunt on property. (Among respondents living in a
single-family home.)
WMU 5D
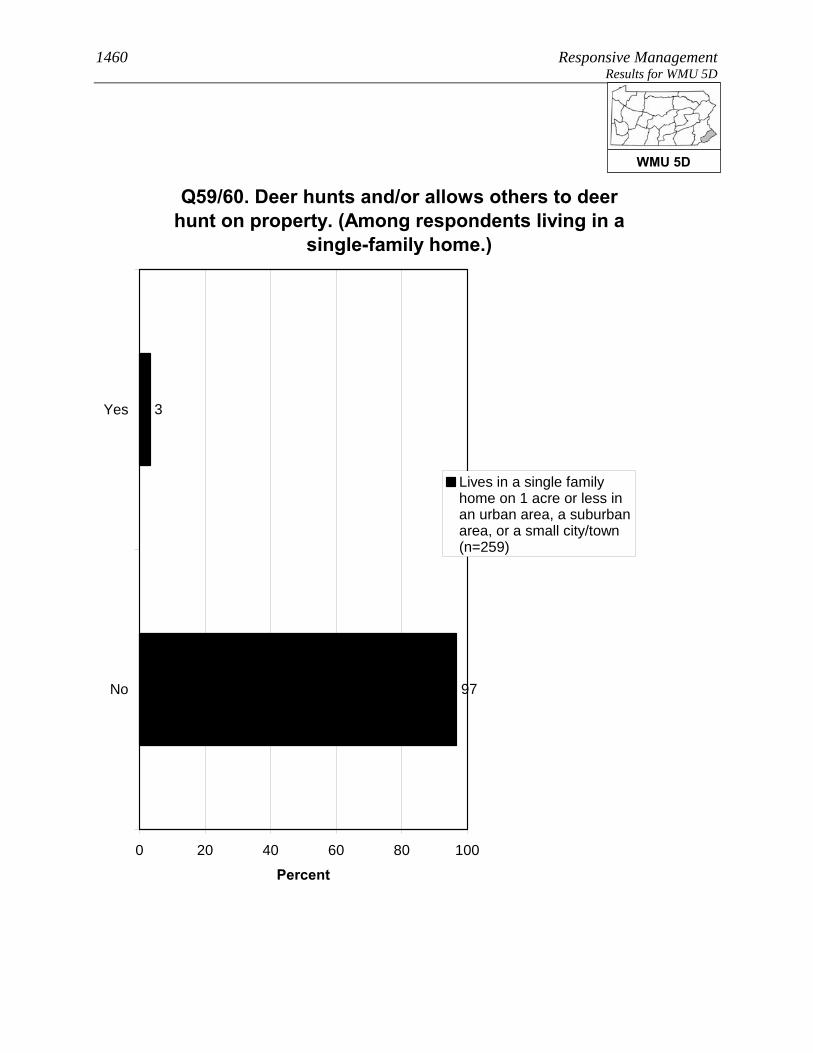
1460 Responsive Management Results for WMU 5D
Q59/60. Deer hunts and/or allows others to deer hunt on property. (Among respondents living in a
single-family home.)
3
97
0 20 40 60 80 100
Yes
No
Percent
Lives in a single familyhome on 1 acre or less inan urban area, a suburbanarea, or a small city/town(n=259)
WMU 5D
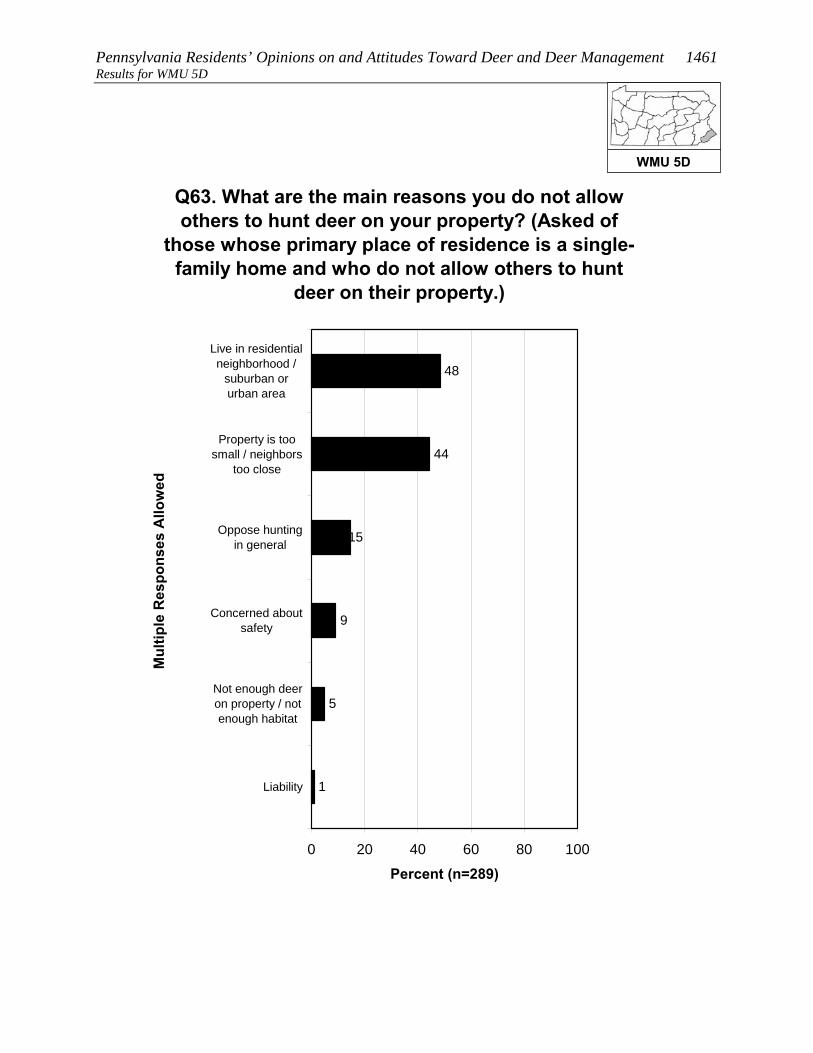
Pennsylvania Residents’ Opinions on and Attitudes Toward Deer and Deer Management 1461 Results for WMU 5D
Q63. What are the main reasons you do not allow others to hunt deer on your property? (Asked of
those whose primary place of residence is a single-family home and who do not allow others to hunt
deer on their property.)
48
44
15
9
5
1
0 20 40 60 80 100
Live in residentialneighborhood /
suburban orurban area
Property is toosmall / neighbors
too close
Oppose huntingin general
Concerned aboutsafety
Not enough deeron property / notenough habitat
Liability
Mul
tiple
Res
pons
es A
llow
ed
Percent (n=289)
WMU 5D
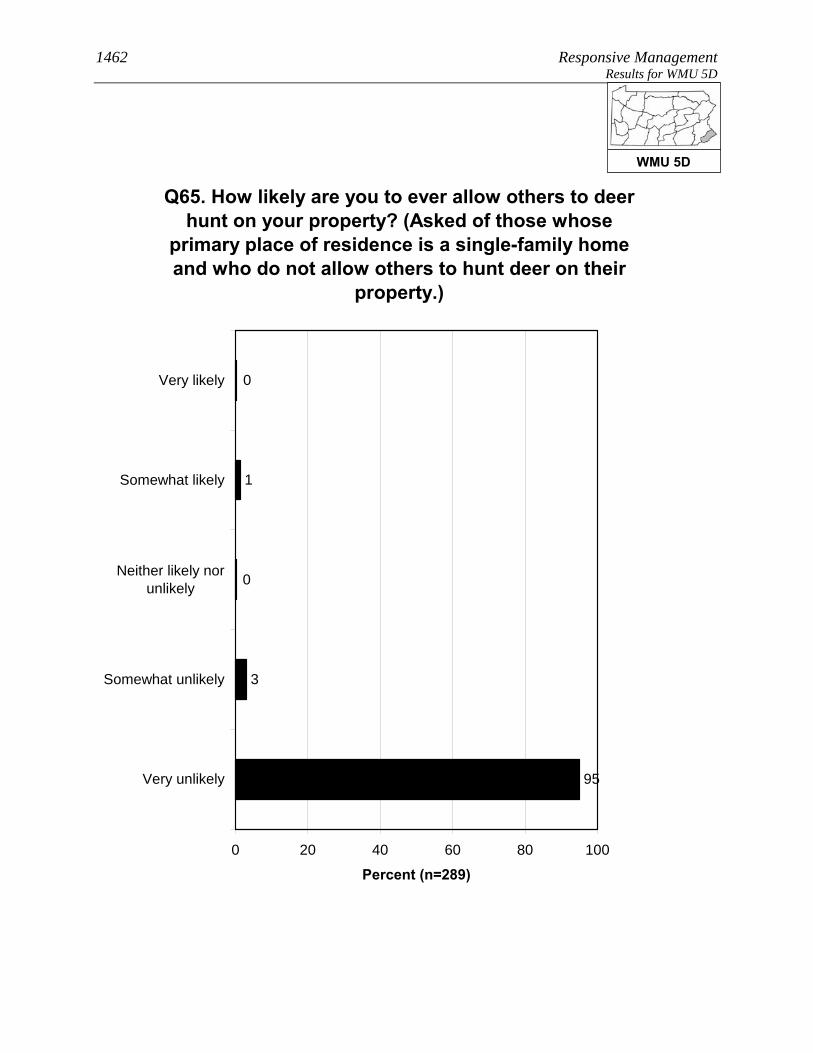
1462 Responsive Management Results for WMU 5D
Q65. How likely are you to ever allow others to deer hunt on your property? (Asked of those whose
primary place of residence is a single-family home and who do not allow others to hunt deer on their
property.)
0
1
0
3
95
0 20 40 60 80 100
Very likely
Somewhat likely
Neither likely norunlikely
Somewhat unlikely
Very unlikely
Percent (n=289)
WMU 5D
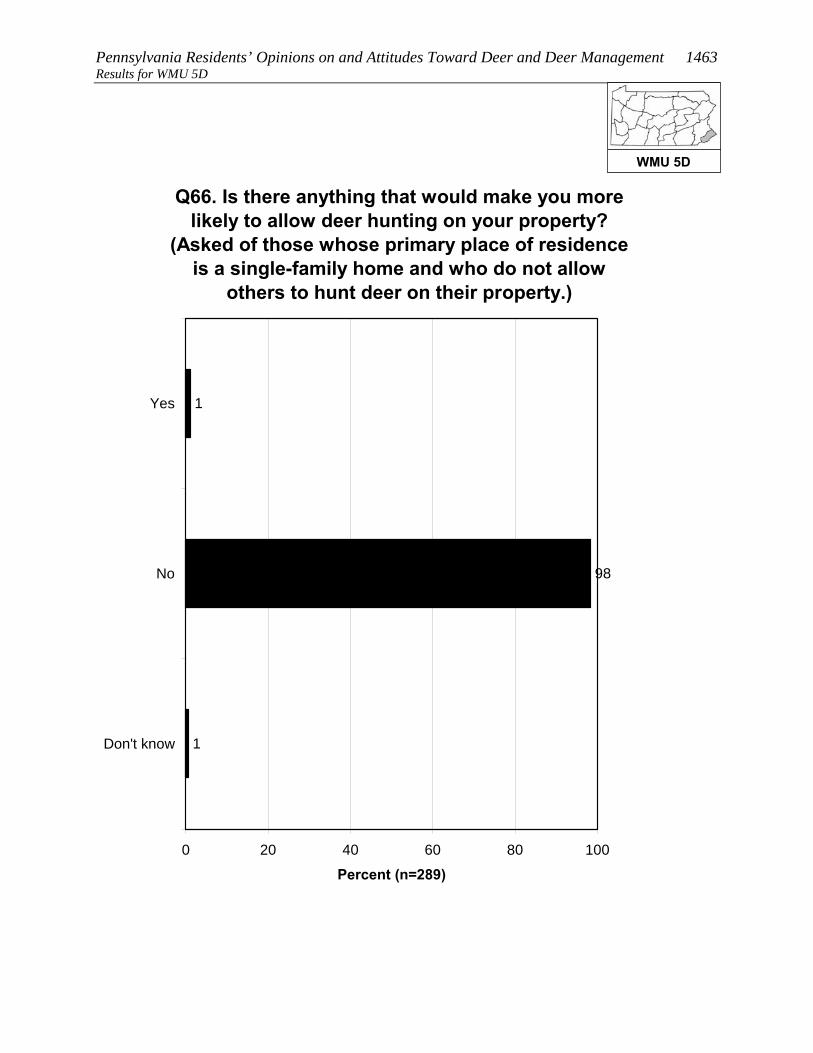
Pennsylvania Residents’ Opinions on and Attitudes Toward Deer and Deer Management 1463 Results for WMU 5D
Q66. Is there anything that would make you more likely to allow deer hunting on your property?
(Asked of those whose primary place of residence is a single-family home and who do not allow
others to hunt deer on their property.)
1
98
1
0 20 40 60 80 100
Yes
No
Don't know
Percent (n=289)
WMU 5D

1464 Responsive Management Results for WMU 5D
Q65. How likely are you to ever allow others to deer hunt on your property? (Asked of those whose
primary place of residence is a single-family home and who do not allow others to hunt deer on their
property.)
0
1
0
2
96
0 20 40 60 80 100
Very likely
Somewhatlikely
Neither likelynor unlikely
Somewhatunlikely
Very unlikely
Percent
Lives in a single familyhome on 1 acre or less inan urban area, a suburbanarea, or a small city/town(n=253)
WMU 5D

Pennsylvania Residents’ Opinions on and Attitudes Toward Deer and Deer Management 1465 Results for WMU 5D CONCERNS ABOUT DEER AND DEER NUISANCE PROBLEMS
Seven questions asked about respondents’ level of concern about
issues associated with deer. For each issue, respondents rated their
level of concern about it using a 10-point scale, with 10 being the most
concerned.
• The most concern was for deer-vehicle accidents (mean rating of 7.5) and tick-borne
diseases (7.5), followed by two more whose means are just under those top two: the
health of the deer population (6.2) and the quality of deer habitat (5.9).
• At the bottom are concern about deer impacts on habitat and other wildlife (even
though this can be considerable) (4.5) and the two impacts to residents’ landscaping:
deer damage to plants and landscaping (2.7) and deer droppings in the yard (2.1).
o Another graph shows the percentage who gave a high rating (a “9” or “10”),
providing an idea of the percentage who feel strongly about the issues.
Among residents of WMU 5D, 41% indicated that they saw deer on their property in the past
12 months.
• Respondents who fed birds were more likely to indicate seeing deer, as were
respondents who fed deer or put out attractants or were aware of neighbors who fed
deer or put out attractants.
The survey asked about specific nuisance problems with deer that residents of WMU 5D may
have experienced: 12% indicated that they experienced problems with deer at their primary
place of residence in the past 12 months; 8% indicated that they or another household
member had been in a vehicle collision with a deer (fortunately, a very low portion of
drivers/passengers were injured); and 5% indicated that they or a household member had
been diagnosed with a tick-borne disease.
• Crosstabulations show that those who fed birds were about the same as those who had
not fed birds regarding experiencing deer problems. However, those who were aware
of neighbors feeding deer or putting out attractants were much more likely to say that
they experienced deer problems.
WMU 5D
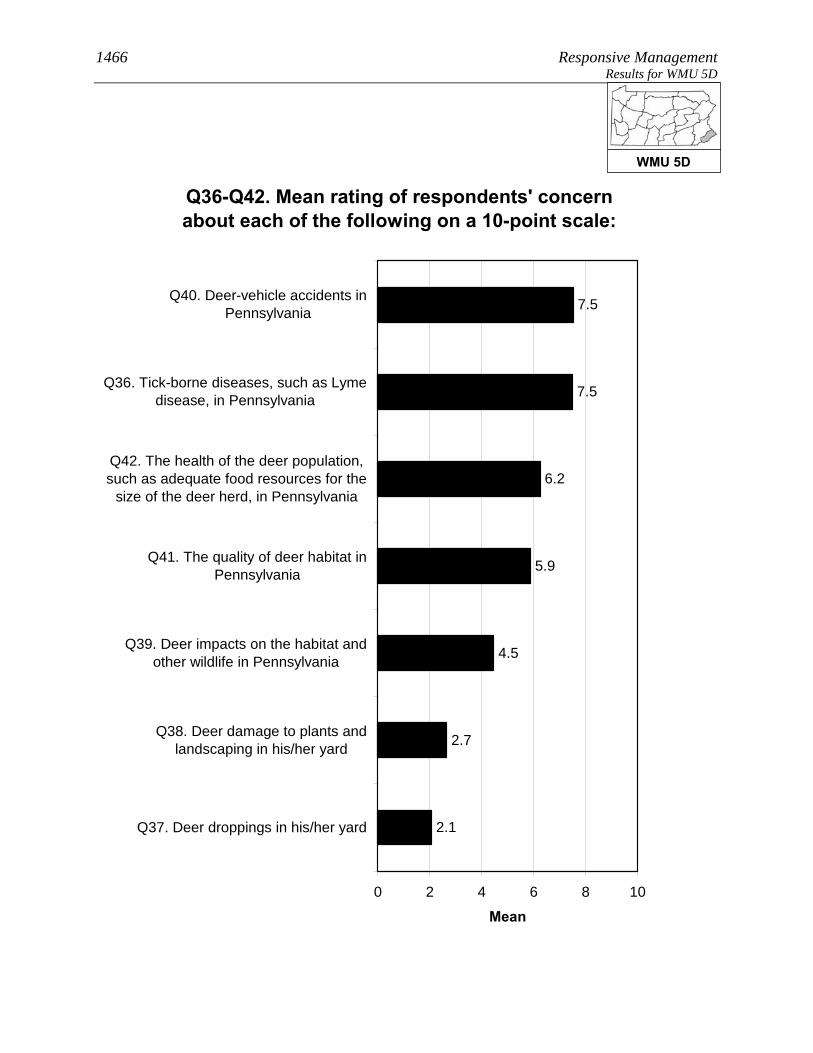
1466 Responsive Management Results for WMU 5D
Q36-Q42. Mean rating of respondents' concern about each of the following on a 10-point scale:
2.7
4.5
5.9
6.2
7.5
7.5
2.1
0 2 4 6 8 10
Q40. Deer-vehicle accidents inPennsylvania
Q36. Tick-borne diseases, such as Lymedisease, in Pennsylvania
Q42. The health of the deer population,such as adequate food resources for the
size of the deer herd, in Pennsylvania
Q41. The quality of deer habitat inPennsylvania
Q39. Deer impacts on the habitat andother wildlife in Pennsylvania
Q38. Deer damage to plants andlandscaping in his/her yard
Q37. Deer droppings in his/her yard
Mean
WMU 5D

Pennsylvania Residents’ Opinions on and Attitudes Toward Deer and Deer Management 1467 Results for WMU 5D
Q36-Q42. Percent who rated their concern about each of the following as a 9 or 10 on a 10-point
scale:
11
14
20
25
44
48
11
0 20 40 60 80 100
Q36. Tick-borne diseases, such as Lymedisease, in Pennsylvania
Q40. Deer-vehicle accidents inPennsylvania
Q42. The health of the deer population,such as adequate food resources for the
size of the deer herd, in Pennsylvania
Q41. The quality of deer habitat inPennsylvania
Q39. Deer impacts on the habitat andother wildlife in Pennsylvania
Q38. Deer damage to plants andlandscaping in his/her yard
Q37. Deer droppings in his/her yard
Percent
WMU 5D
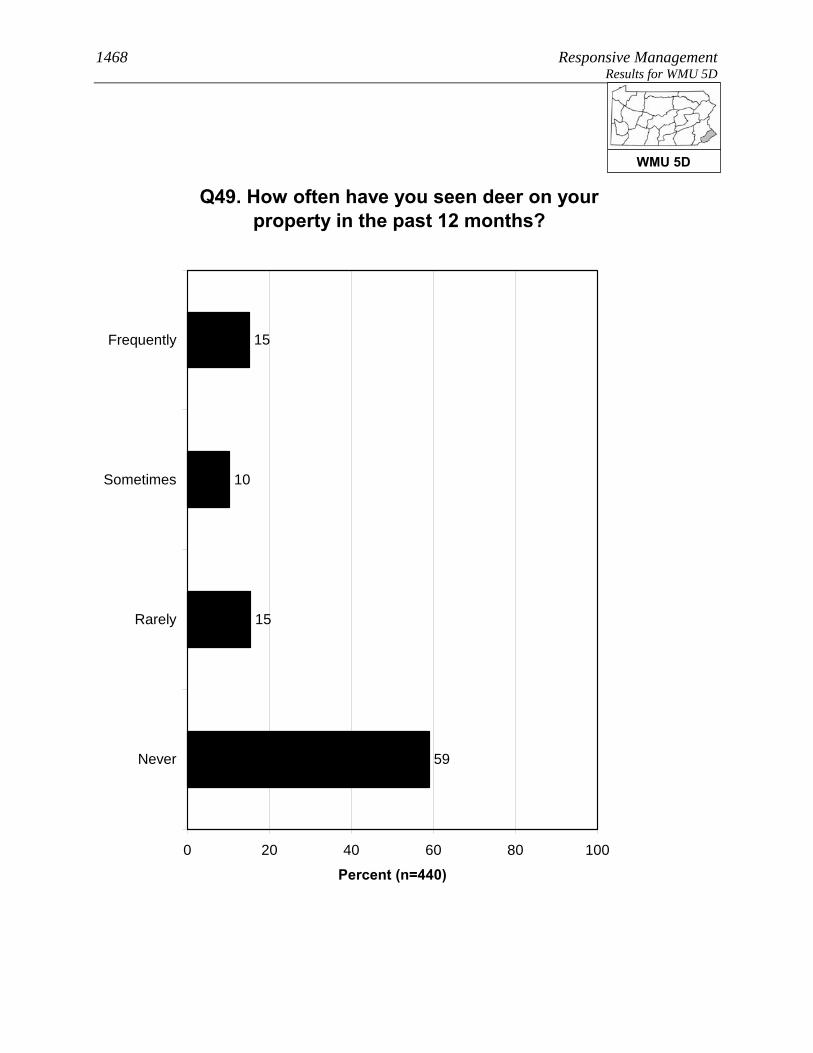
1468 Responsive Management Results for WMU 5D
Q49. How often have you seen deer on your property in the past 12 months?
15
10
15
59
0 20 40 60 80 100
Frequently
Sometimes
Rarely
Never
Percent (n=440)
WMU 5D
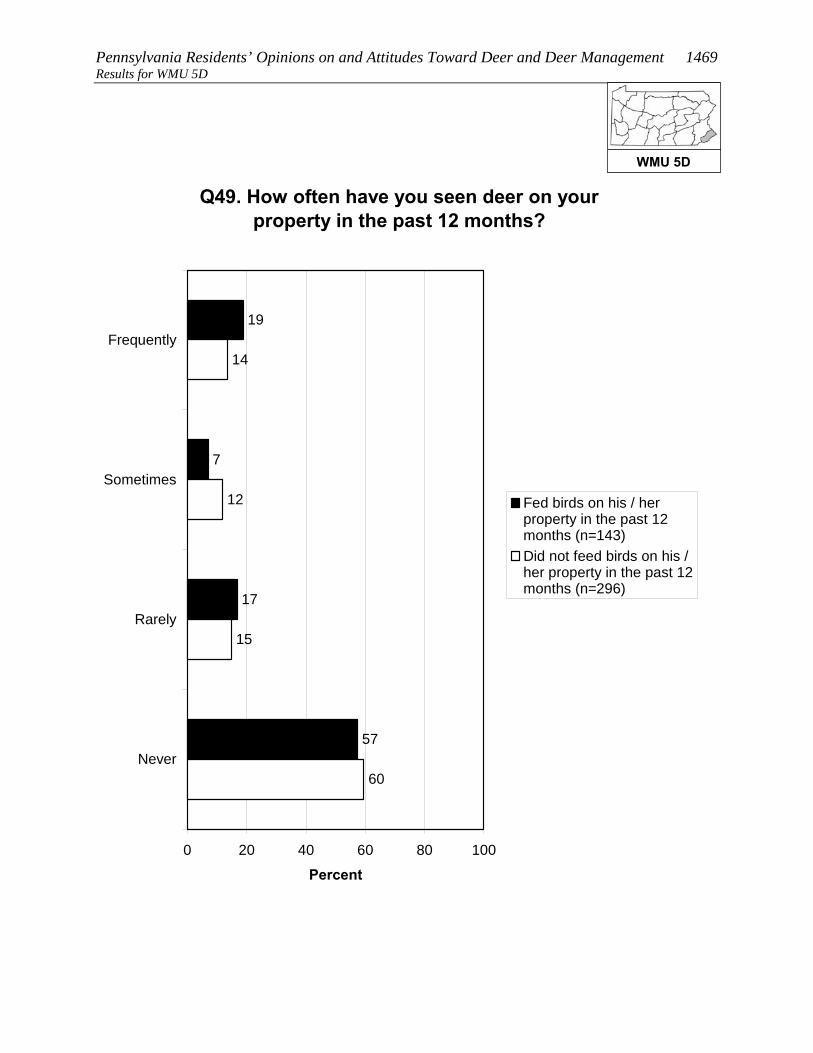
Pennsylvania Residents’ Opinions on and Attitudes Toward Deer and Deer Management 1469 Results for WMU 5D
Q49. How often have you seen deer on your property in the past 12 months?
19
7
17
57
15
12
14
60
0 20 40 60 80 100
Frequently
Sometimes
Rarely
Never
Percent
Fed birds on his / herproperty in the past 12months (n=143)Did not feed birds on his /her property in the past 12months (n=296)
WMU 5D

1470 Responsive Management Results for WMU 5D
Q49. How often have you seen deer on your property in the past 12 months?
70
0
0
30
16
11
14
60
0 20 40 60 80 100
Frequently
Sometimes
Rarely
Never
Percent
Has fed deer or put outattractants in the past 12months (n=14)Has not fed deer or put outattractants in the past 12months (n=426)
WMU 5D
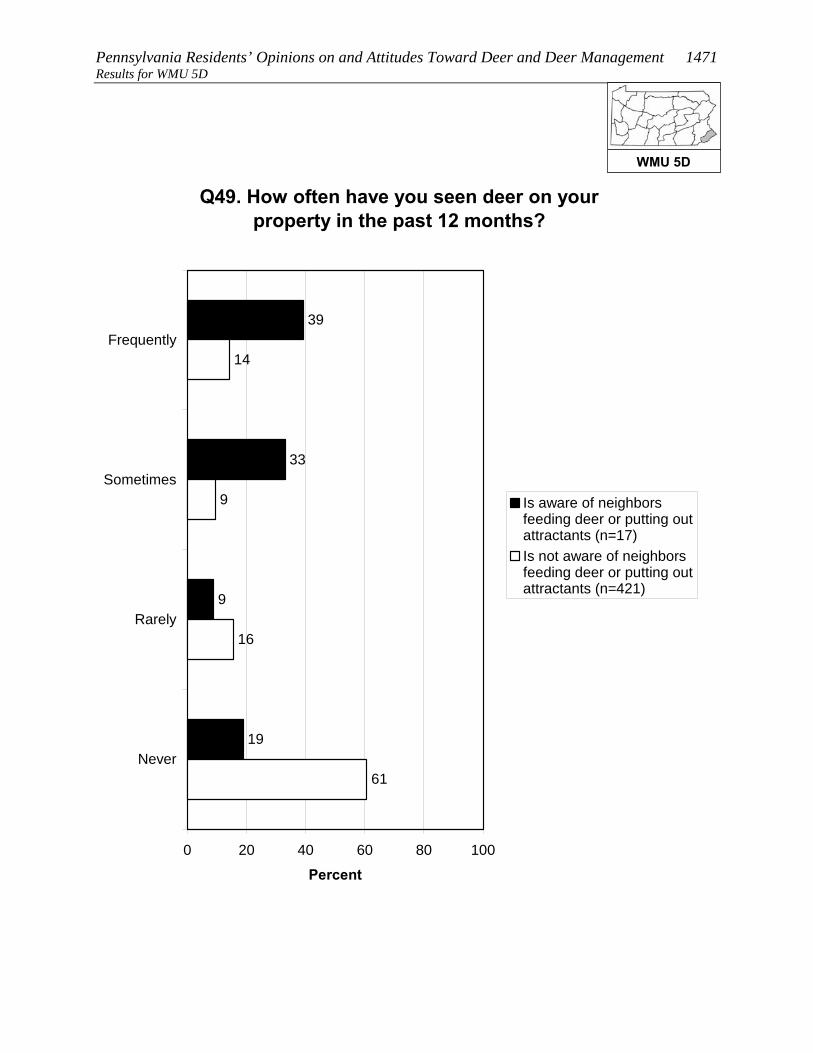
Pennsylvania Residents’ Opinions on and Attitudes Toward Deer and Deer Management 1471 Results for WMU 5D
Q49. How often have you seen deer on your property in the past 12 months?
39
33
9
19
16
9
14
61
0 20 40 60 80 100
Frequently
Sometimes
Rarely
Never
Percent
Is aware of neighborsfeeding deer or putting outattractants (n=17)Is not aware of neighborsfeeding deer or putting outattractants (n=421)
WMU 5D

1472 Responsive Management Results for WMU 5D
Q43. In the past 12 months, have you experienced any problems with deer at your primary place of
residence?
12
88
0 20 40 60 80 100
Yes
No
Percent (n=440)
WMU 5D

Pennsylvania Residents’ Opinions on and Attitudes Toward Deer and Deer Management 1473 Results for WMU 5D
Q43. In the past 12 months, have you experienced any problems with deer at your primary place of
residence?
14
86
89
11
0 20 40 60 80 100
Yes
No
Percent
Fed birds on his / herproperty in the past 12months (n=143)Did not feed birds on his /her property in the past 12months (n=296)
WMU 5D
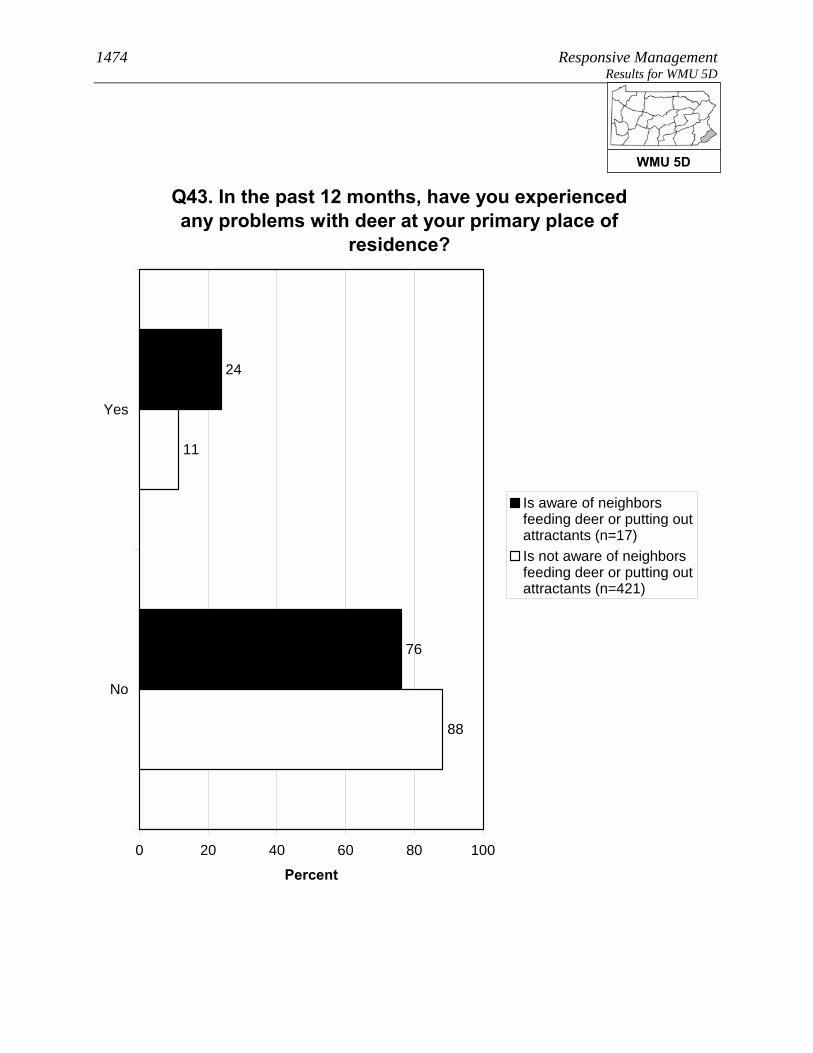
1474 Responsive Management Results for WMU 5D
Q43. In the past 12 months, have you experienced any problems with deer at your primary place of
residence?
24
76
88
11
0 20 40 60 80 100
Yes
No
Percent
Is aware of neighborsfeeding deer or putting outattractants (n=17)Is not aware of neighborsfeeding deer or putting outattractants (n=421)
WMU 5D

Pennsylvania Residents’ Opinions on and Attitudes Toward Deer and Deer Management 1475 Results for WMU 5D
Q44. In the past 12 months, have you or any other person living in your immediate household been in a vehicle collision with or an accident involving a
deer on Pennsylvania's roads or highways?
8
92
0 20 40 60 80 100
Yes
No
Percent (n=440)
WMU 5D

1476 Responsive Management Results for WMU 5D
Q45. Were you or anyone else injured? (Asked of those who had a household member who was in or
who have personally been in a vehicle collision with or an accident involving a deer on
Pennsylvania's roads or highways in the past 12 months.)
2
98
0 20 40 60 80 100
Yes
No
Percent (n=36)
WMU 5D

Pennsylvania Residents’ Opinions on and Attitudes Toward Deer and Deer Management 1477 Results for WMU 5D
Q46. In the past 12 months, have you or any other person living in your immediate household been
diagnosed by a physician with a tick-borne disease, such as Lyme disease?
5
95
0 20 40 60 80 100
Yes
No
Percent (n=440)
WMU 5D

1478 Responsive Management Results for WMU 5D
FEEDING WILDLIFE AND HUNTING DEER Several questions asked about feeding wildlife.
• Feeding deer or putting out deer attractants: 3% of residents of
WMU 5D did this, and 4% are aware of neighbors who did this.
o The most typical feeds or attractants put out by respondents are salt/mineral blocks,
corn, and apples.
• Feeding birds: 31% of residents of WMU 5D did this.
There is no consensus on whether it is okay for private citizens to feed or attract deer in
Pennsylvania: 31% agree that this is okay, but 60% disagree (the rest are neutral).
One in ten residents of WMU 5D (10%) consider themselves to be a hunter, about two-thirds
of whom have a Pennsylvania hunting license.
• Among residents of WMU 5D who live in a single-family home, 3% personally hunt
deer on their property.
• Just over half of residents of WMU 5D (53%) say that they, family members, and/or
friends hunt.
WMU 5D

Pennsylvania Residents’ Opinions on and Attitudes Toward Deer and Deer Management 1479 Results for WMU 5D
Q50. Did you ever feed deer intentionally or put out attractants, such as a salt or mineral block, in the
past 12 months?
3
97
0 20 40 60 80 100
Yes
No
Percent (n=440)
WMU 5D
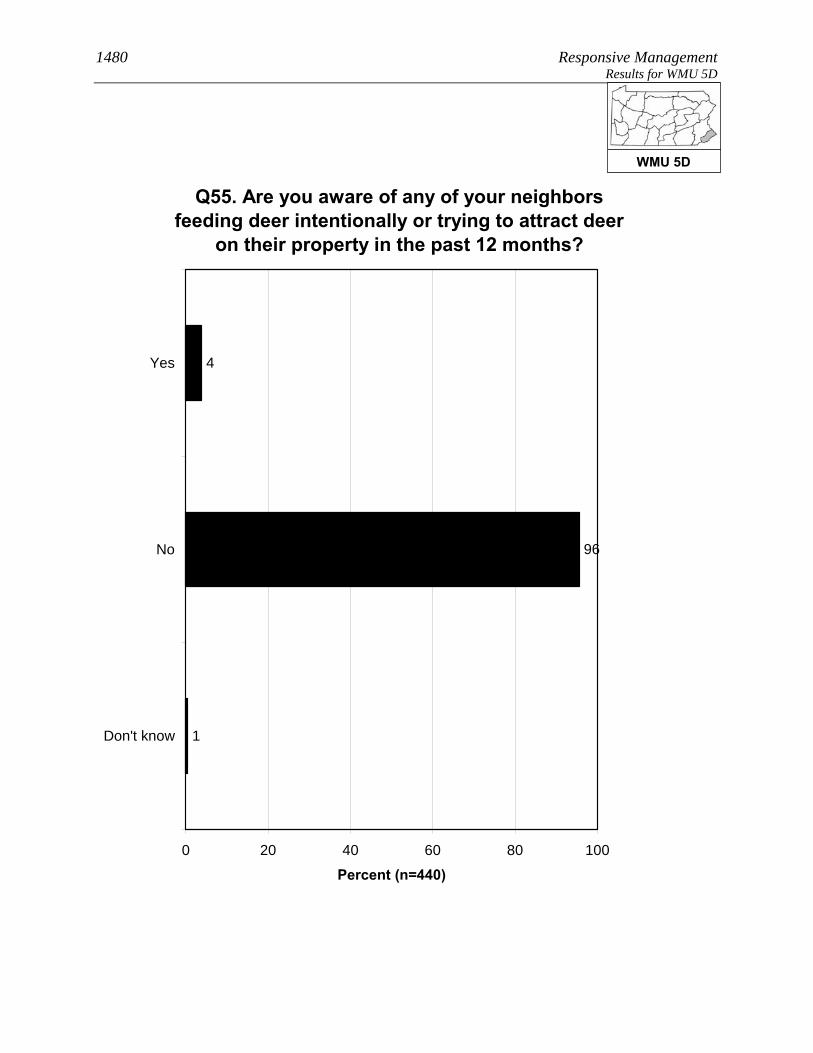
1480 Responsive Management Results for WMU 5D
Q55. Are you aware of any of your neighbors feeding deer intentionally or trying to attract deer
on their property in the past 12 months?
4
96
1
0 20 40 60 80 100
Yes
No
Don't know
Percent (n=440)
WMU 5D

Pennsylvania Residents’ Opinions on and Attitudes Toward Deer and Deer Management 1481 Results for WMU 5D
Q53. What type of feed or attractant did you use? (Asked of those who fed deer intentionally or put
out attractants in the past 12 months.)
8
8
13
35
67
0 20 40 60 80 100
Salt / mineralblock
Corn
Apples
Pellets /commercial feed
Other foodproducts
Mul
tiple
Res
pons
es A
llow
ed
Percent (n=14)
WMU 5D
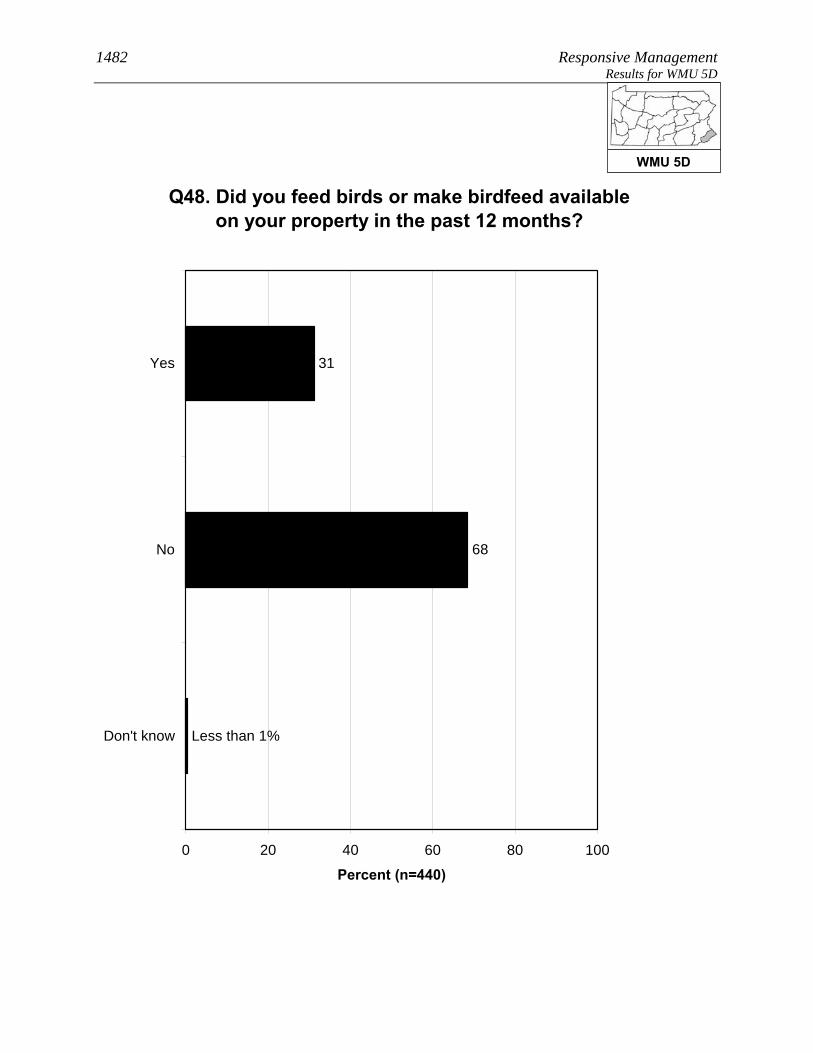
1482 Responsive Management Results for WMU 5D
Q48. Did you feed birds or make birdfeed available on your property in the past 12 months?
31
68
Less than 1%
0 20 40 60 80 100
Yes
No
Don't know
Percent (n=440)
WMU 5D
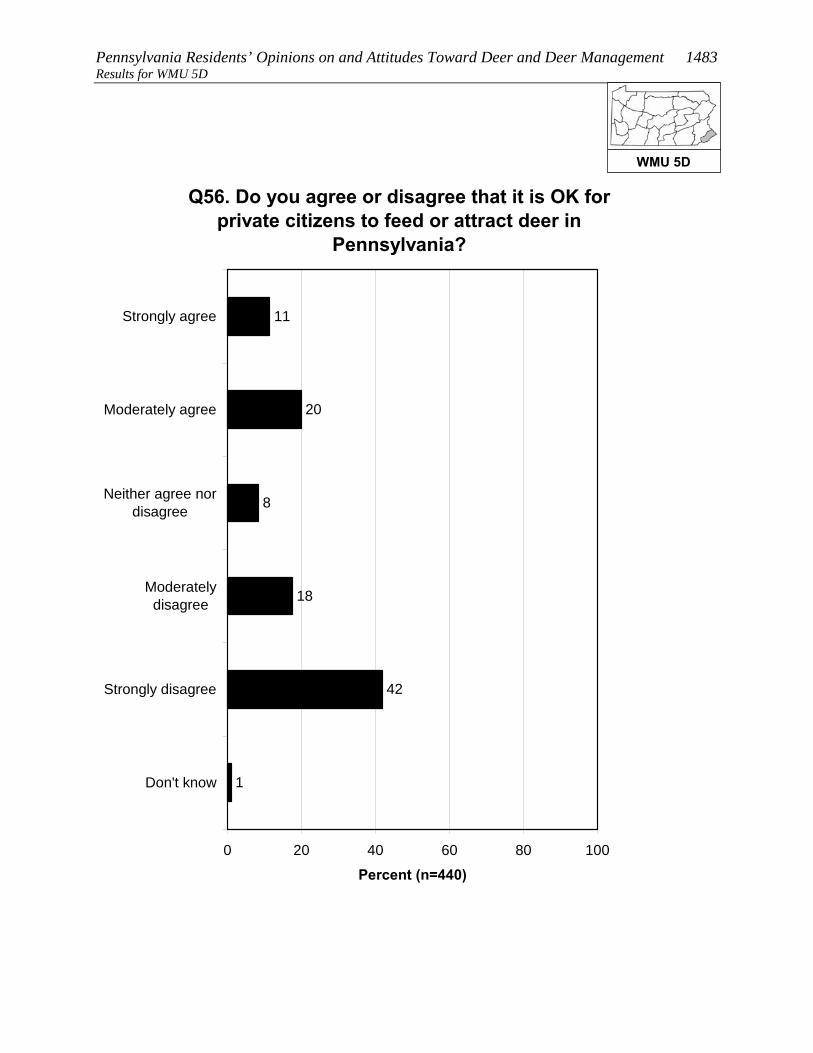
Pennsylvania Residents’ Opinions on and Attitudes Toward Deer and Deer Management 1483 Results for WMU 5D
Q56. Do you agree or disagree that it is OK for private citizens to feed or attract deer in
Pennsylvania?
11
20
8
18
42
1
0 20 40 60 80 100
Strongly agree
Moderately agree
Neither agree nordisagree
Moderatelydisagree
Strongly disagree
Don't know
Percent (n=440)
WMU 5D

1484 Responsive Management Results for WMU 5D
Q59. Do you personally hunt deer on your property? (Asked of those whose primary place of
residence is a single-family home.)
3
97
0 20 40 60 80 100
Yes
No
Percent (n=305)
WMU 5D
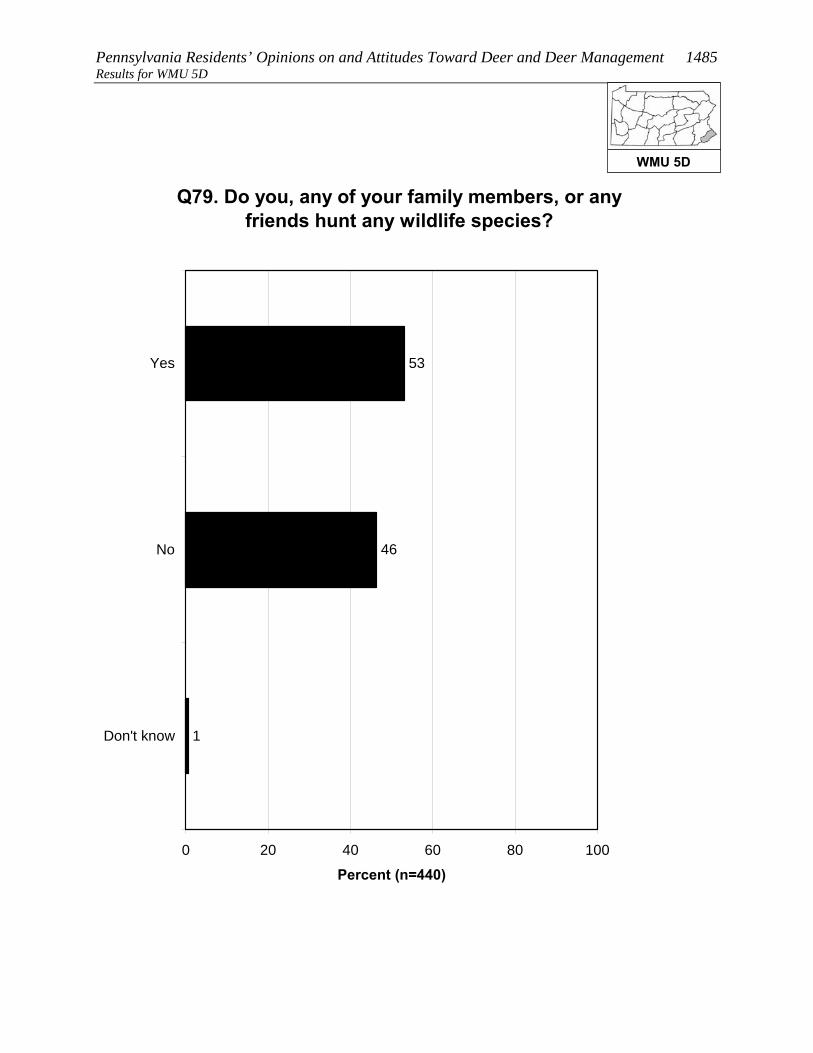
Pennsylvania Residents’ Opinions on and Attitudes Toward Deer and Deer Management 1485 Results for WMU 5D
Q79. Do you, any of your family members, or any friends hunt any wildlife species?
53
46
1
0 20 40 60 80 100
Yes
No
Don't know
Percent (n=440)
WMU 5D

1486 Responsive Management Results for WMU 5D
SOURCES OF INFORMATION Most commonly, residents of WMU 5D say that the best way to
provide them with information about deer in Pennsylvania is through
direct mail (38% gave this response), followed by email (22%), the
Internet (14% saying an Internet site other than the PGC and 2%
saying the agency website; note that some said both), newspaper
(14%), and TV (12%).
Just over half of residents of WMU 5D (52%) use social media, the most common primary
site being Facebook.
WMU 5D
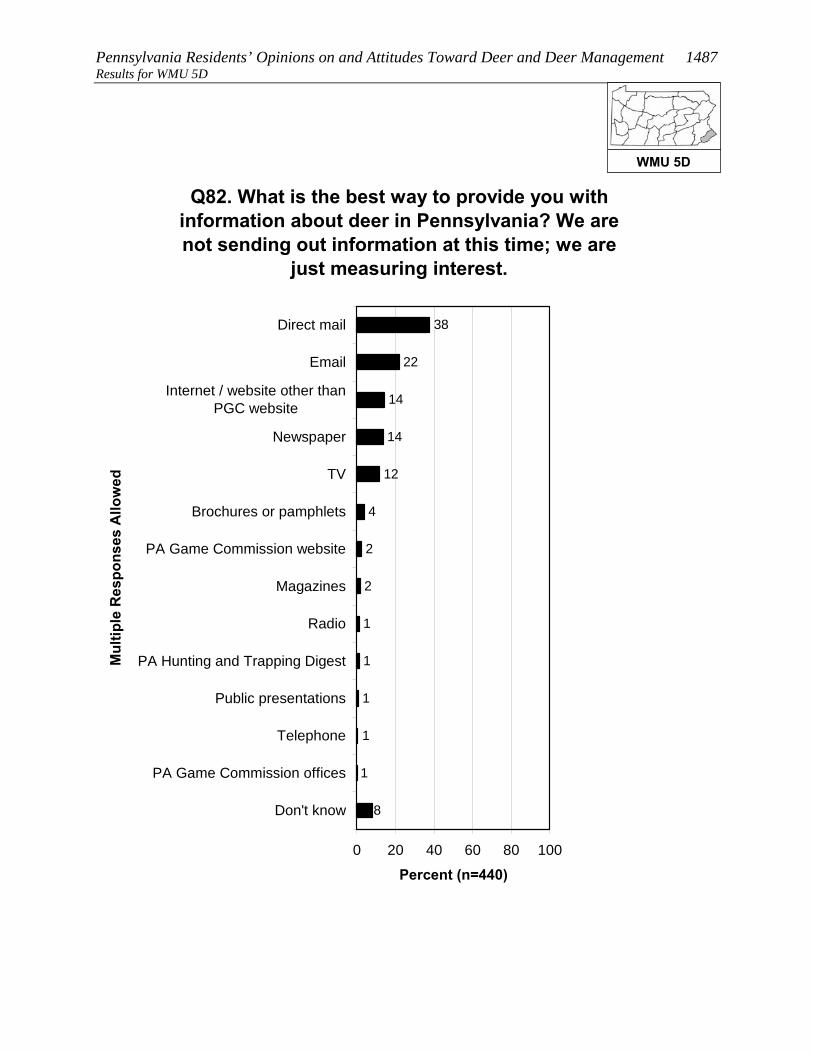
Pennsylvania Residents’ Opinions on and Attitudes Toward Deer and Deer Management 1487 Results for WMU 5D
Q82. What is the best way to provide you with information about deer in Pennsylvania? We are not sending out information at this time; we are
just measuring interest.
1
2
2
38
22
14
14
12
4
1
1
1
1
8
0 20 40 60 80 100
Direct mail
Internet / website other thanPGC website
Newspaper
TV
Brochures or pamphlets
PA Game Commission website
Magazines
Radio
PA Hunting and Trapping Digest
Public presentations
Telephone
PA Game Commission offices
Don't know
Mul
tiple
Res
pons
es A
llow
ed
Percent (n=440)
WMU 5D

1488 Responsive Management Results for WMU 5D
Q84. Do you use social media, such as Facebook, Twitter, or YouTube?
52
47
1
0 20 40 60 80 100
Yes
No
Don't know
Percent (n=440)
WMU 5D
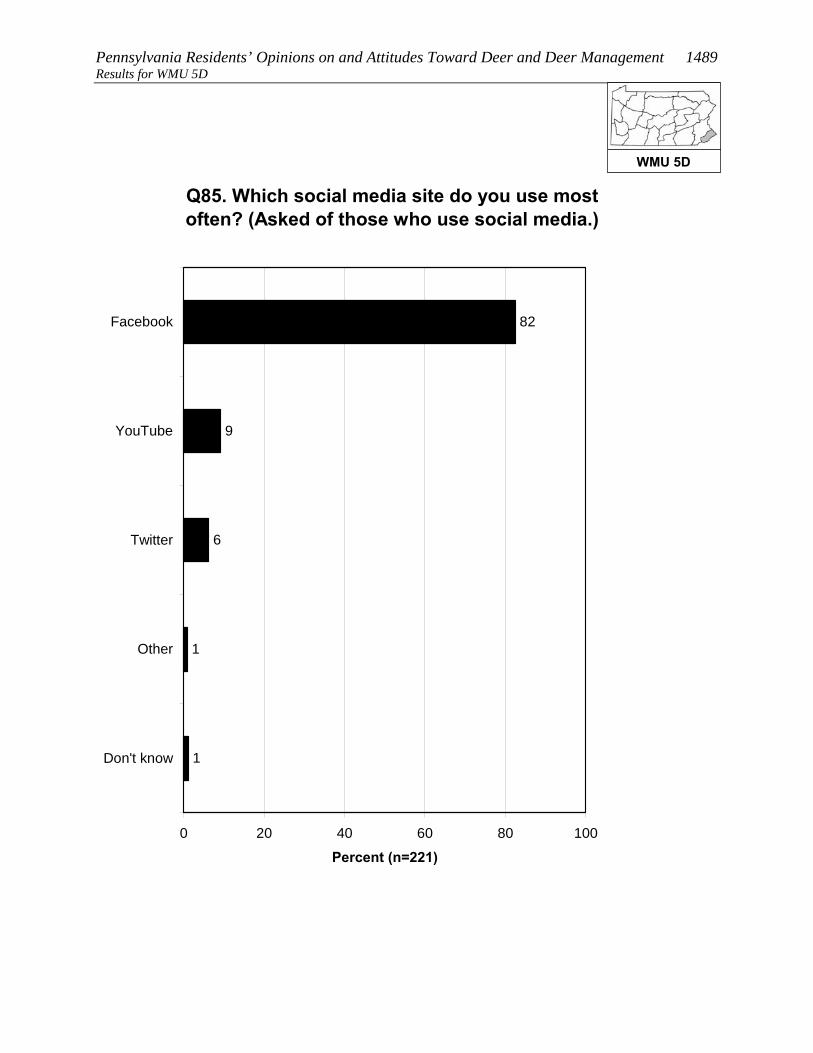
Pennsylvania Residents’ Opinions on and Attitudes Toward Deer and Deer Management 1489 Results for WMU 5D
Q85. Which social media site do you use most often? (Asked of those who use social media.)
82
9
6
1
1
0 20 40 60 80 100
YouTube
Other
Don't know
Percent (n=221)
WMU 5D
1490 Responsive Management
ABOUT RESPONSIVE MANAGEMENT Responsive Management is an internationally recognized public opinion and attitude survey research
firm specializing in natural resource and outdoor recreation issues. Our mission is to help natural
resource and outdoor recreation agencies and organizations better understand and work with their
constituents, customers, and the public.
Utilizing our in-house, full-service telephone, mail, and web-based survey center with 50
professional interviewers, we have conducted more than 1,000 telephone surveys, mail surveys,
personal interviews, and focus groups, as well as numerous marketing and communication plans,
needs assessments, and program evaluations.
Clients include the federal natural resource and land management agencies, most state fish and
wildlife agencies, state departments of natural resources, environmental protection agencies, state
park agencies, tourism boards, most of the major conservation and sportsmen’s organizations, and
numerous private businesses. Responsive Management also collects attitude and opinion data for
many of the nation’s top universities.
Specializing in research on public attitudes toward natural resource and outdoor recreation issues,
Responsive Management has completed a wide range of projects during the past 20 years, including
dozens of studies of hunters, anglers, wildlife viewers, boaters, park visitors, historic site visitors,
hikers, birdwatchers, campers, and rock climbers. Responsive Management has conducted studies
on endangered species; waterfowl and wetlands; and the reintroduction of large predators such as
wolves, grizzly bears, and the Florida panther.
Responsive Management has assisted with research on numerous natural resource ballot initiatives
and referenda and has helped agencies and organizations find alternative funding and increase their
membership and donations. Additionally, Responsive Management has conducted major
organizational and programmatic needs assessments to assist natural resource agencies and
organizations in developing more effective programs based on a solid foundation of fact.

Pennsylvania Deer Management 1491
Responsive Management has conducted research on public attitudes toward natural resources and
outdoor recreation in almost every state in the United States, as well as in Canada, Australia, the
United Kingdom, France, Germany, and Japan. Responsive Management has also conducted focus
groups and personal interviews with residents of the African countries of Algeria, Cameroon,
Mauritius, Namibia, South Africa, Tanzania, Zambia, and Zimbabwe.
Responsive Management routinely conducts surveys in Spanish and has conducted surveys in
Chinese, Korean, Japanese and Vietnamese and has completed numerous studies with specific target
audiences, including Hispanics, African-Americans, Asians, women, children, senior citizens, urban,
suburban and rural residents, large landowners, and farmers.
Responsive Management’s research has been upheld in U.S. District Courts; used in peer-reviewed
journals; and presented at major natural resource, fish and wildlife, and outdoor recreation
conferences across the world. Company research has been featured in most of the nation’s major
media, including CNN, The New York Times, The Wall Street Journal, and on the front pages of USA
Today and The Washington Post. Responsive Management’s research has also been highlighted in
Newsweek magazine.
Visit the Responsive Management website at:
www.responsivemanagement.com


