
Pavement Construction QAPredicting Finished Surface Parameters (deflections,
moduli, stresses and strains) from in situ testing duringconstruction at subgrade and/or subbase level
FSP ProjectComparisons and calibration of a pavement model that will correctly
predict performance in materials that have non-linearcharacteristics. (Stress-dependent properties).
Regional and site specific calibration

Programme - completed to Stage 5
Stage 1. FWD Tests on SIL (subgrade improvement layer) preferably subgrade alsoStage 2. Establish alternative models to predict performance of the pavement aftereach overlying layer is place. (Stresses, strains, moduli and deflections.)Stage 3. Tests on subbase to refine predictionsStage 4. Tests on basecourse to verify predictions for the “green” condition.Stage 5. Develop a simple spreadsheet to predict (1) properties after each layer isplaced (green), and (2) after bedding in from trafficking, and (3) hence predictexpected life.Stage 6. Tests after 20,000 ESA to establish bedding in.Stage 7. Refinement then validation of spreadsheet modelsStage 8. Reporting

Candidate pavements for study
• Minimal response with suitable case histories.• One site from NZTA, but no funding available, and a very lengthy task.• NZTA prefer empirical deflection based approach• However mechanistic approach will encompass a wider field of variables.
More insight provided by layer moduli, stresses/strains• Both empirical and mechanistic have been accommodated, and 3 models
used so far• Lengthy process to develop a universal model, but making progress
• Would appreciate more case histories, but must be from someone who hasdetailed knowledge of what happened during construction.

FWD testing on top of SIL layerAll runs have been modelled with SIL on infinite subgrade. Non-linearity of subgrade modulus calculated usingtraditional method (ELMOD). This package models only subgrades that are stress softening. ELMOD indicates thissubgrade varies from linear elastic to slightly stress softening. No FWD indication of any stress hardening.Conflicts with RLT, or is this just the criterion used, ELMOD equation for stress softening is Es= C0 (sv/100 kPa)^n
Method : Austroads deflection (linearelastic similar)
ELMOD ELMOD plus regional calibration.
ModulusDependence
Constant Deviator Stress Deviator Stress plus Confinement
Comments Inclusion of psuedo rigidlayer at depth, cangenerate any lesserdeflection that is desiredbut vertical strain at top ofsubgrade will be wrong.
Traditional method, goodwhen the totalincrement in pavementthickness is minimal, sayless than 100 mm.Otherwise result variessignificantly from reality.
Uses regional database ofstructural analyses to provide areality check adjustment forconfinement, after ELMOD’sdeviator stress model has beenapplied.

Non-linear Moduli
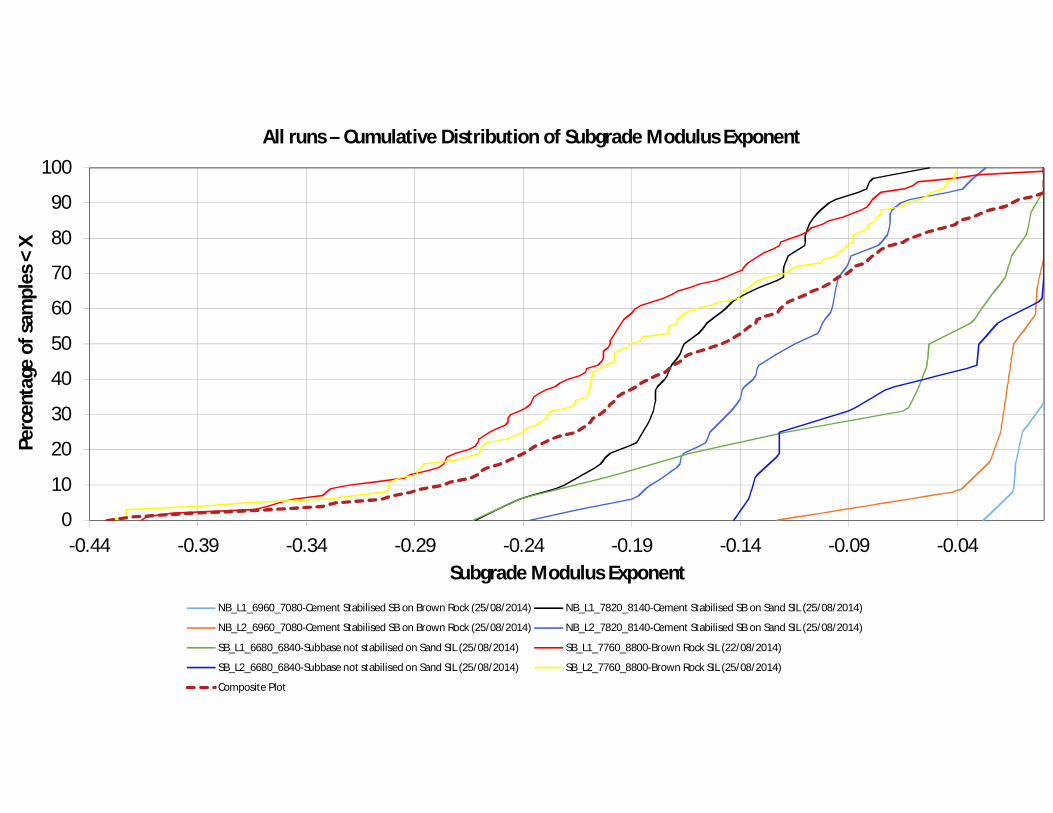
First site tested: Subgrade non-linearity at the site studied ranges from 0 to -0.35but most tests are around -0.1 to -0.2 and that is only slight non-linearity. (Fromcomparisons with national LTPP sites, less than -0.6 is strongly non linear)
Note: Two thirds of NZ pavements have non-linear subgrades (much greaterthan in Australia). A solution is essential for meaningful predictions.
Using the ELMOD solution for stress dependent moduli, (subgrade modulusdependent on deviator stress) the worst test point would need additional goodquality granular layers totalling 390 mm.
Using the ELMOD solution with stress dependent moduli, then correcting thatusing subgrade characteristic improvement for confinement, the requirementfor good quality granular layer totals 320 mm
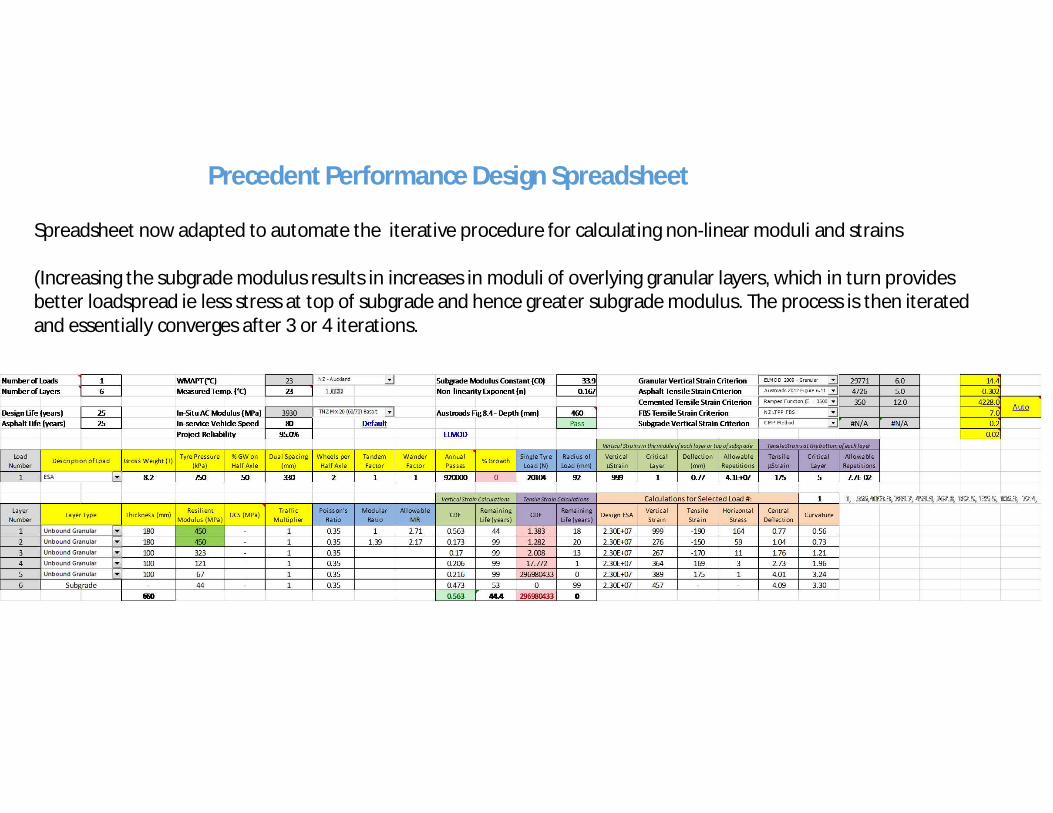
Precedent Performance Design Spreadsheet
Spreadsheet now adapted to automate the iterative procedure for calculating non-linear moduli and strains
(Increasing the subgrade modulus results in increases in moduli of overlying granular layers, which in turn providesbetter loadspread ie less stress at top of subgrade and hence greater subgrade modulus. The process is then iteratedand essentially converges after 3 or 4 iterations.

Precedent Performance Design Spreadsheet Input cells in yellowfrom FWD testELMOD output (Es,nes, LDE, kn, kc)
Input cellsSubgrade modulus at 100 kPa referencestressELMOD non-linearity exponentStrain at top of subgrade at FWD stressLoad damage exponentCalibration constants from precedentperformance.

Precedent Performance Design Spreadsheet
Cumulative damage factor for proposed design is0.47 for subgrade strain, <1 so design is OK (butbasecourse life will govern as CDF is 0.56)

Conclusion from FWD testing on top of SIL layer
Requiredsubbase plusbasecoursethickness(mm)
0
100
200
300
400
500Overlying Granular Layer Thickness (mm)
Method Austroads deflection(linear elastic similar)
ELMOD ELMOD plus regionalcalibration.
ModulusDependence
Constant Deviator Stress Deviator Stress plusConfinement
Function C f ( 1/s1) f (1/s1, s3)

End of main presentation.
• Attachments
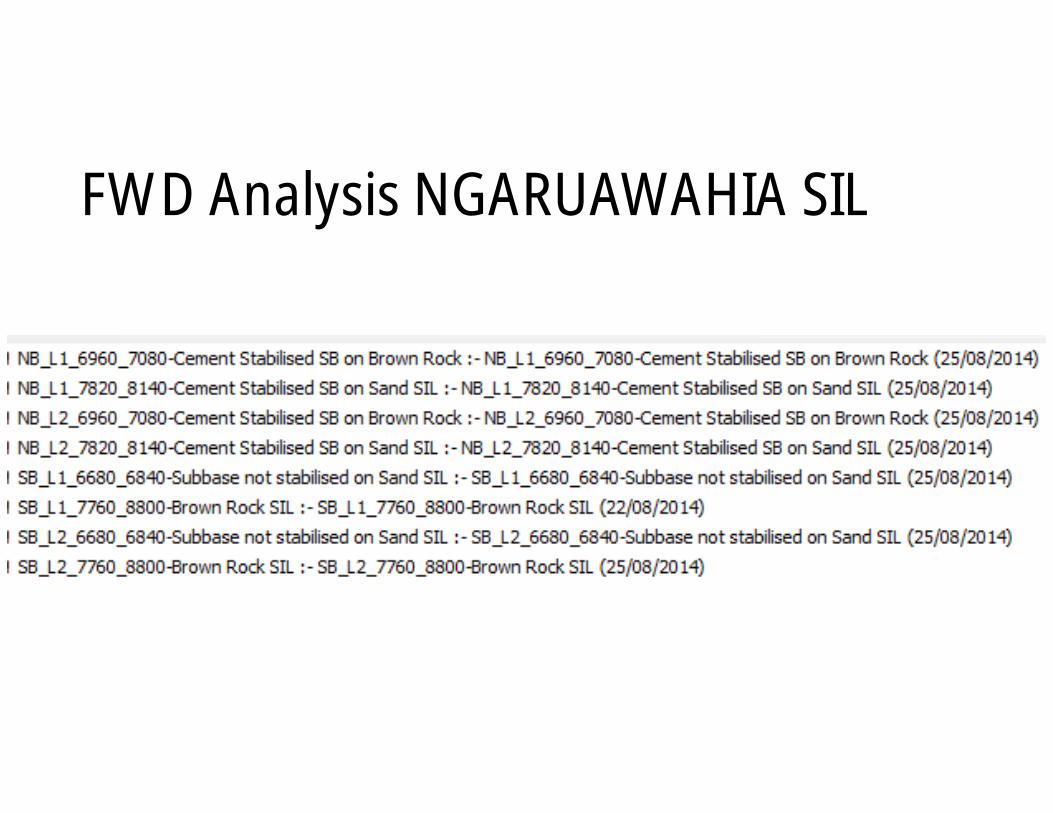
FWD Analysis NGARUAWAHIA SIL

0102030405060708090
100
0 0.5 1 1.5 2 2.5
Perc
enta
geof
sam
ples
<X
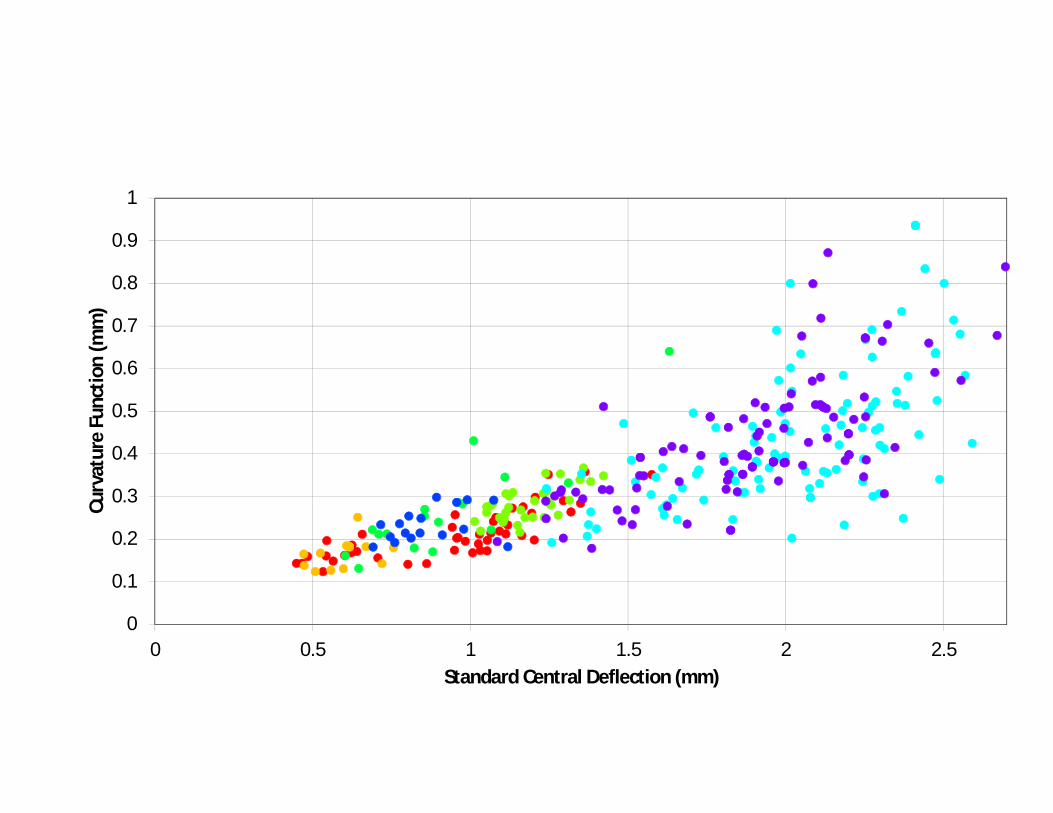
Standard Central Deflection (mm)
All runs
NB_L1_6960_7080-Cement Stabilised SB on Brown Rock (25/08/2014) NB_L1_7820_8140-Cement Stabilised SB on Sand SIL (25/08/2014)
NB_L2_6960_7080-Cement Stabilised SB on Brown Rock (25/08/2014) NB_L2_7820_8140-Cement Stabilised SB on Sand SIL (25/08/2014)
SB_L1_6680_6840-Subbase not stabilised on Sand SIL (25/08/2014) SB_L1_7760_8800-Brown Rock SIL (22/08/2014)
SB_L2_6680_6840-Subbase not stabilised on Sand SIL (25/08/2014) SB_L2_7760_8800-Brown Rock SIL (25/08/2014)
Composite Plot
0
0.1
0.2
0.3
0.4
0.5
0.6
0.7
0.8
0.9
1
0 0.5 1 1.5 2 2.5
Curv
atur
eFu
nctio
n(m
m)
Standard Central Deflection (mm)

-0.5
-0.45
-0.4
-0.35
-0.3
-0.25
-0.2
-0.15
-0.1
-0.05
0
10 100
Subg
rade
Mod
ulus
Expo
nent
Subgrade Modulus (100kPa Loading)
Non-linearity (Exponent <0)

FWD testing on top of SIL layerThe initial subgrademoduli range by anorder of magnitude.
And so does SILmodulus (includesstabilised soils).
However , modularratio between top ofSIL and top ofsubgrade is one totwo orders ofmagnitude

0
10
20
30
40
50
60
70
80
90
100
10 100
Perc
enta
geof
sam
ples
<X
Subgrade Modulus (MPa)
All runs – Cumulative Distribution of Subgrade Modulus (MPa)
NB_L1_6960_7080-Cement Stabilised SB on Brown Rock (25/08/2014) NB_L1_7820_8140-Cement Stabilised SB on Sand SIL (25/08/2014)
NB_L2_6960_7080-Cement Stabilised SB on Brown Rock (25/08/2014) NB_L2_7820_8140-Cement Stabilised SB on Sand SIL (25/08/2014)
SB_L1_6680_6840-Subbase not stabilised on Sand SIL (25/08/2014) SB_L1_7760_8800-Brown Rock SIL (22/08/2014)
SB_L2_6680_6840-Subbase not stabilised on Sand SIL (25/08/2014) SB_L2_7760_8800-Brown Rock SIL (25/08/2014)
Composite Plot
0
10
20
30
40
50
60
70
80
90
100
-0.44 -0.39 -0.34 -0.29 -0.24 -0.19 -0.14 -0.09 -0.04
Perc
enta
geof
sam
ples
<X
Subgrade Modulus Exponent
All runs – Cumulative Distribution of Subgrade Modulus Exponent
NB_L1_6960_7080-Cement Stabilised SB on Brown Rock (25/08/2014) NB_L1_7820_8140-Cement Stabilised SB on Sand SIL (25/08/2014)
NB_L2_6960_7080-Cement Stabilised SB on Brown Rock (25/08/2014) NB_L2_7820_8140-Cement Stabilised SB on Sand SIL (25/08/2014)
SB_L1_6680_6840-Subbase not stabilised on Sand SIL (25/08/2014) SB_L1_7760_8800-Brown Rock SIL (22/08/2014)
SB_L2_6680_6840-Subbase not stabilised on Sand SIL (25/08/2014) SB_L2_7760_8800-Brown Rock SIL (25/08/2014)
Composite Plot

0
10
20
30
40
50
60
70
80
90
100
100 1000
Perc
enta
geof
sam
ples
<X
Top 100 mm of SIL, Modulus (MPa)
All Runs – Modulus of top 100 mm of SIL (MPa)
NB_L1_6960_7080-Cement Stabilised SB on Brown Rock (25/08/2014) NB_L1_7820_8140-Cement Stabilised SB on Sand SIL (25/08/2014)
NB_L2_6960_7080-Cement Stabilised SB on Brown Rock (25/08/2014) NB_L2_7820_8140-Cement Stabilised SB on Sand SIL (25/08/2014)
SB_L1_6680_6840-Subbase not stabilised on Sand SIL (25/08/2014) SB_L1_7760_8800-Brown Rock SIL (22/08/2014)
SB_L2_6680_6840-Subbase not stabilised on Sand SIL (25/08/2014) SB_L2_7760_8800-Brown Rock SIL (25/08/2014)
Composite Plot

0102030405060708090
100
0 50 100 150 200 250 300 350 400 450 500
Perc
enta
geof
sam
ples
<X
Granular Overlay (mm) - Austroads 2011 (Part 5)
All runs- Granular Overlay (mm) - Austroads 2011 (Part 5)
NB_L1_6960_7080-Cement Stabilised SB on Brown Rock (25/08/2014) NB_L1_7820_8140-Cement Stabilised SB on Sand SIL (25/08/2014)
NB_L2_6960_7080-Cement Stabilised SB on Brown Rock (25/08/2014) NB_L2_7820_8140-Cement Stabilised SB on Sand SIL (25/08/2014)
SB_L1_6680_6840-Subbase not stabilised on Sand SIL (25/08/2014) SB_L1_7760_8800-Brown Rock SIL (22/08/2014)
SB_L2_6680_6840-Subbase not stabilised on Sand SIL (25/08/2014) SB_L2_7760_8800-Brown Rock SIL (25/08/2014)
Composite Plot
Austroadsdeflection basedmethod (similarto results oflinear elasticmodel?)
Up to 500 mm ofadditionalgranular layersindicated.

0102030405060708090
100
0 100 200 300 400 500
Perc
enta
geof
sam
ples
<X
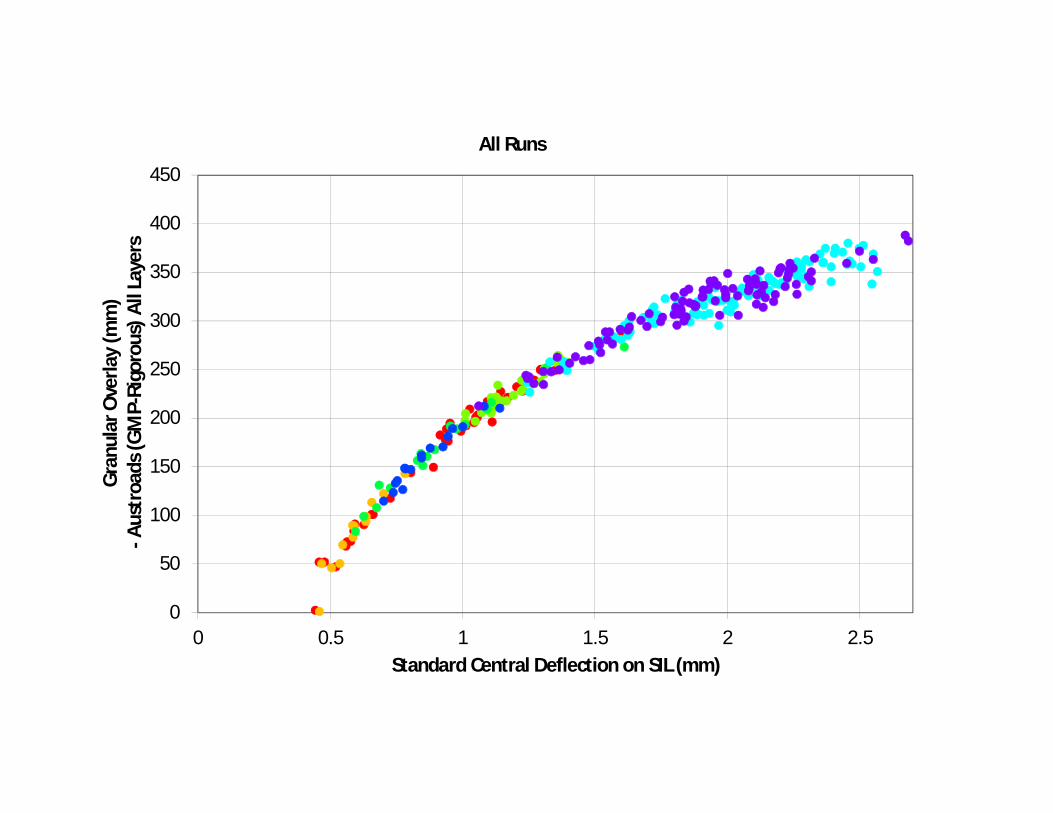
Granular Overlay (mm) - Austroads (GMP-Rigorous) All Layers
All Runs Granular Overlay (mm) - Austroads (GMP-Rigorous NL) All Layers
NB_L1_6960_7080-Cement Stabilised SB on Brown Rock (25/08/2014) NB_L1_7820_8140-Cement Stabilised SB on Sand SIL (25/08/2014)
NB_L2_6960_7080-Cement Stabilised SB on Brown Rock (25/08/2014) NB_L2_7820_8140-Cement Stabilised SB on Sand SIL (25/08/2014)
SB_L1_6680_6840-Subbase not stabilised on Sand SIL (25/08/2014) SB_L1_7760_8800-Brown Rock SIL (22/08/2014)
SB_L2_6680_6840-Subbase not stabilised on Sand SIL (25/08/2014) SB_L2_7760_8800-Brown Rock SIL (25/08/2014)
Composite Plot
Austroads subgradestrain criterion (iso)and using ELMODstress dependenceof subgrade modulus
Up to 390 mm ofadditional granularlayers indicated.

0102030405060708090
100
0 100 200 300 400 500
Perc
enta
geof
sam
ples
<X
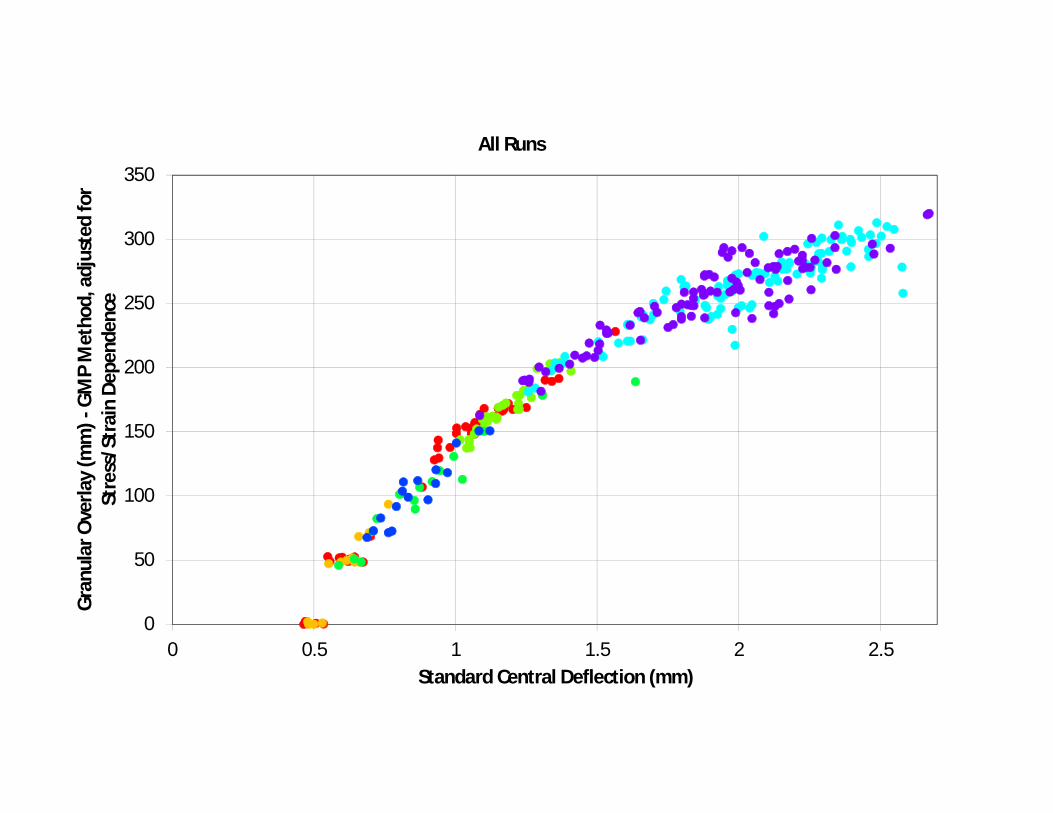
Granular Overlay (mm) - GMP Method, adjusted for Stress/StrainDependence
All Runs - Granular Overlay (mm) - GMP, adjusted for Stress/StrainDependence
NB_L1_6960_7080-Cement Stabilised SB on Brown Rock (25/08/2014) NB_L1_7820_8140-Cement Stabilised SB on Sand SIL (25/08/2014)
NB_L2_6960_7080-Cement Stabilised SB on Brown Rock (25/08/2014) NB_L2_7820_8140-Cement Stabilised SB on Sand SIL (25/08/2014)
SB_L1_6680_6840-Subbase not stabilised on Sand SIL (25/08/2014) SB_L1_7760_8800-Brown Rock SIL (22/08/2014)
SB_L2_6680_6840-Subbase not stabilised on Sand SIL (25/08/2014) SB_L2_7760_8800-Brown Rock SIL (25/08/2014)
Composite Plot
Austroads subgradestrain criterion (iso)and using ELMODstress dependenceof subgrade modulusplus calibration toconfinement ofsurcharge layers
Up to 320 mm ofadditional granularlayers indicated.
0
50
100
150
200
250
300
350
400
450
0 0.5 1 1.5 2 2.5
Gra
nula
rOve
rlay
(mm
)-A
ustr
oads
(GM
P-Ri
goro
us)A
llLa
yers
Standard Central Deflection on SIL (mm)
All Runs
0
50
100
150
200
250
300
350
0 0.5 1 1.5 2 2.5
Gra
nula
rOve
rlay
(mm
)-G
MP
Met
hod,
adju
sted
for
Stre
ss/S
trai
nDe
pend
ence
Standard Central Deflection (mm)
All Runs

-0.5
-0.45
-0.4
-0.35
-0.3
-0.25
-0.2
-0.15
-0.1
-0.05
0
0 0.5 1 1.5 2 2.5
Subg
rade
Mod
ulus
Expo
nent
Standard Central Deflection (mm)
All Runs
0
50
100
150
200
250
300
350
0 50 100 150 200 250 300 350
Gra
nula
rOve
rlay
(mm
)-G
MP
Met
hod,
adju
sted
forS
tres
s/St
rain
Depe
nden
ce
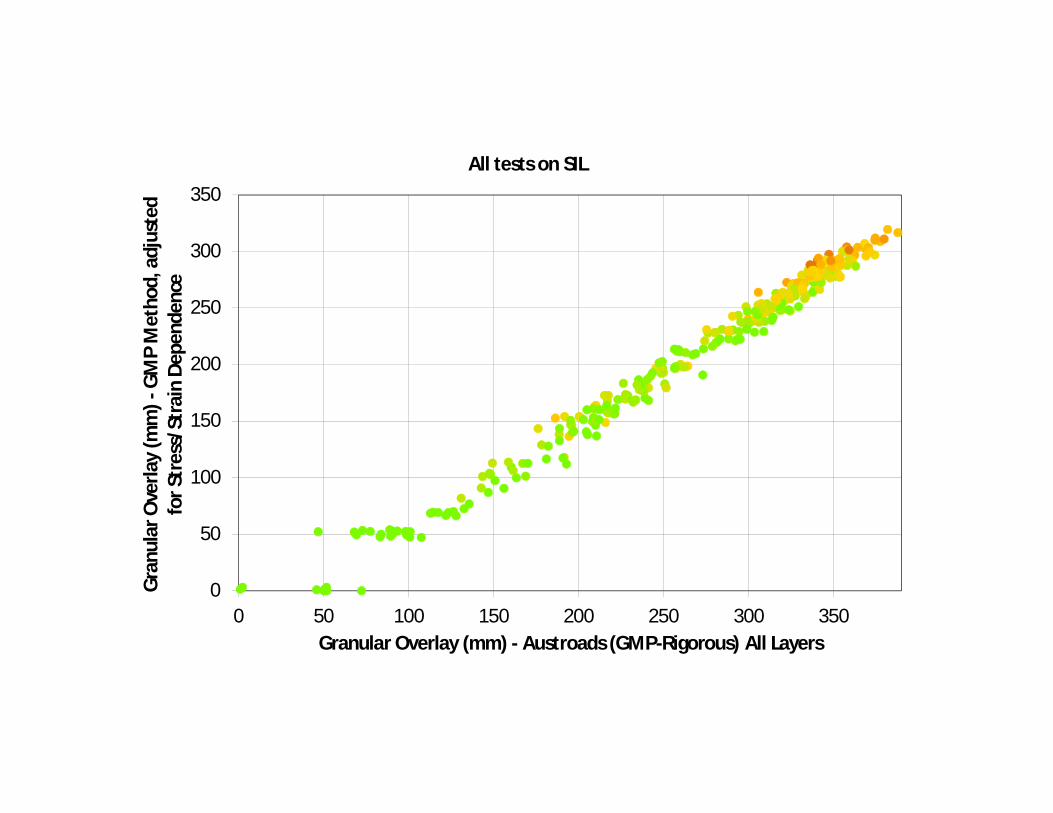
Granular Overlay (mm) - Austroads (GMP-Rigorous) All Layers
All tests on SIL

0
100
200
300
400
500
600
7.7 7.8 7.9 8 8.1 8.2 8.3 8.4 8.5 8.6 8.7 8.8
Gra
nula
rOve
rlay
(mm
)
Chainage (km)
SB_L1_7760_8800-Brown Rock SIL (22/08/2014)
Granular Overlay (mm) - Austroads (GMP-Rigorous) All Layers
Granular Overlay (mm) - Austroads 2011 (Part 5)
Granular Overlay (mm) - GMP Method, adjusted for Stress/Strain Dependence
Big differences in overlayrequirements, usingdifferent methods.
Hence, possible solutionmay be 30 m long trialpad at weakest point,Ch 8.15 Southbound inLane 1.
Construct 180 mmsubbase and 180 mmtemporary subbase, with30 FWD tests at 1 mintervals on each layer

Pavement Construction QAPredicting Finished Surface Parameters (deflections,
moduli, stresses and strains) from in situ testing duringconstruction at subgrade and/or subbase level
FSP Project
Comparisons and calibration of a pavement model that will correctlypredict performance in materials that have non-linear
characteristics. (Stress-dependent properties).
Regional and site specific calibration


