
Part 2 Separation Effects Modeling
IEEE SPDC Spring Meeting, May 16
• Christine Goldsworthy • Gerald Lee
• Bonneville Power Administration (BPA)
2
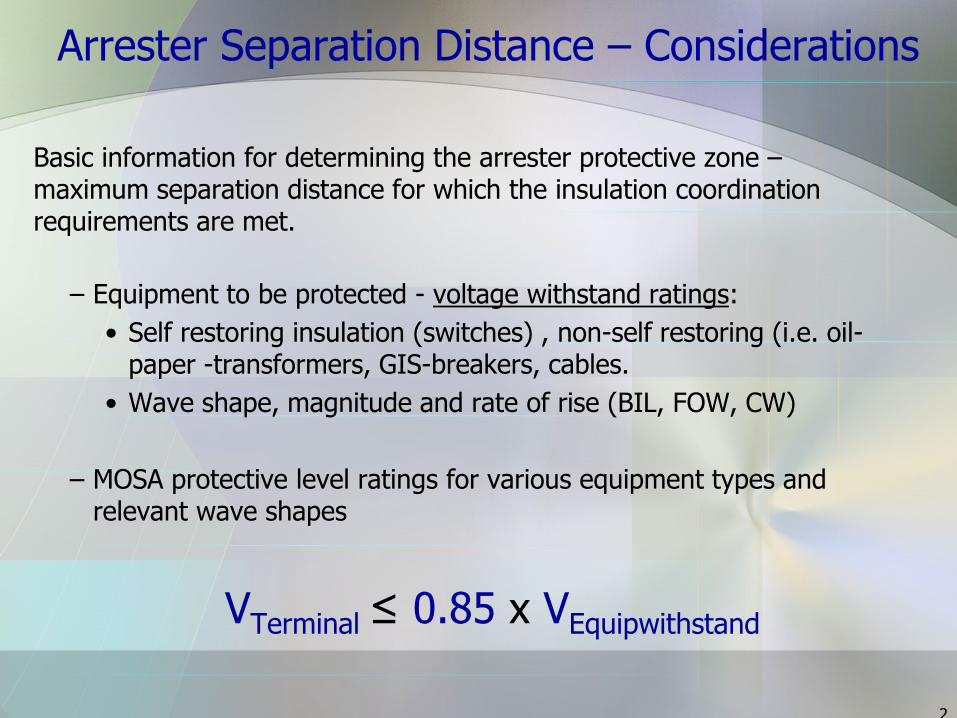
Arrester Separation Distance – Considerations
Basic information for determining the arrester protective zone – maximum separation distance for which the insulation coordination requirements are met.
– Equipment to be protected - voltage withstand ratings:
• Self restoring insulation (switches) , non-self restoring (i.e. oil-paper -transformers, GIS-breakers, cables.
• Wave shape, magnitude and rate of rise (BIL, FOW, CW)
– MOSA protective level ratings for various equipment types and relevant wave shapes
VTerminal ≤ 0.85 x VEquipwithstand

3
Arrester Separation Distance – Considerations
From C62.22: C.6.1 Calculated allowable separation distances.
“Allowable separation distances between the arrester and the transformer for the single-line, single transformer substation . . . for system voltages from 69 kV through 765 kV based on the following:”
– Typical values of BIL
– Station class surge arresters
– Minimum MCOV ratings
– Maximum value for the 0.5 μs FOW protective level from Table 1
– Surge arrester total lead length of 7.6 m
– Incoming steepness of 1000 kV/μs
– Protective margin of 15%
Clarify separation distance as used in C26

4
C62.22 Separation distances . . . The allowable separation distances are given in Table 7 of 5.2.5.4.

5
Modeling a simplified 500 kV – 230 kV separation distance case in ATP
• The Basic Model
– Sources
– Breakers
– Bus
– Lines
– Transformer
– MOSA
– Other Circuit Elements
• Running Simulations
– Verifying Circuit Operation
– Analyzing Waveforms
– Tabulating Results & Conclusions
• Bibliography

6
The Basic Circuit – Normal one line diagram
PCB
Lines 230 kV
500 kV
34.5 kV
PCB
Twr. 1Twr. 2Twr. 3Twr. 4PCB
SHER Sub
KEEL Sub
AC Source
500 kV
Bus
CVT
PERL Sub
Back
FlashoverShield
Failure
25 Ft Bus Sections
Lines
17.3
Miles
Direct
Stroke
.25 Mile Line Sections
Arrester Applied Here
MO
V

7
The Basic Circuit/Model – in ATPDraw

8
Getting Started – Making the circuit model
• Start with simple circuits, verify operation, & build gradually – Always check as you go.
• Use your own node names – For signal identification when plotting and for troubleshooting in the .atp & .lis files.
• Add comments in the component attribute boxes for the circuit elements.

9
Sources – AC sources
• Default source frequency is 50 Hz – change as needed (60 Hz)
• If you want power flow in the circuit use a phase angle between sources
• An accurate equivalent source model requires a voltage source plus a source impedance (R0, X0, R1 & X1 & the Surge Impedance).

10
Example: ATPDraw “HELP” = ATP Rule Book Element Definitions
Name : ACSOURCE - Steady-state (cosinus) function (current or voltage). 1 or 3 phase. Grounded or ungrounded. TYPE 14 (+type 18 for ungrounded voltage source). Card : SOURCE Data : AmplitudeA = The peak value of phase A in [A] or [V] of the function. 3x1-phase source has also B and C. Frequency = Frequence in [Hz]. PhaseAngleA= Phase angle in [deg] or [sec] for phase A. 3x1-phase source has also B and C. StartA = Starting time in [sec.] phase A. Add negative value to include in steady-state. Source value zero for T<StartA. 3x1-phase source has also B and C. StopA = Ending time in [sec] phase A. Source value zero for T>StopA. 3x1-phase source has also B and C. Current/Voltage: Select current or voltage source. Current source has rombe-shaped icon. Single phase/3-phase/3x1-phase: 3-phase model assumes symmetrical source with equal amplitudes and start/stop times. Positive phase sequence: Phase B shifted -120 deg., phase C shifted +120 deg. 3x1-phase enables full control of all phase quantities. Use this to allow external control via $PARAMETERS/Variables. Degrees/Seconds: Unit of phase angle. Peak L-G/RMS L-G/RMS-L-L: Amplitude multiplied by 1, sqrt(2), sqrt(2/3) respectively. Not used if Amplitude is a Variable. Grounded/Ungrounded: ATP requires generally grounded sources. Ungounded voltage sources handled via type 18 ideal transformers. Ungrounded current sources handled by using two sources with opposite polarity. Node : AC= 1 or 3-phase node. 1. node = phase A, phase shift PhaseAngleA. 2. node = phase B, phase shift PhaseAngleB. 3. node = phase C, phase shift PhaseAngleC. For trapped charge functions: Specify a current source, a very low frequency, Tsta=5432. and Tsto=0. RuleBook: VII.C.4 + VII.C.7

11
Sources: Type 15 – Impulse function
Tau = The stroke duration in [sec]. Interval between t=0 and the point on the tail where the function amplitude has fallen to 37% of its peak value.
T_f = The front duration in [sec]. Interval between t=0 to the time of the function peak.
Amp = Multiplicative number in [A] or [V] of the function. Does not represent peak value of surge.

12
Sources – Heidler impulse model varying the rate of rise
Varying “n”, the factor determines the rate of rise of the function.
“n” = rate of rise increases
“n” = rate of rise decreases
n=2
n=10
n=20
13
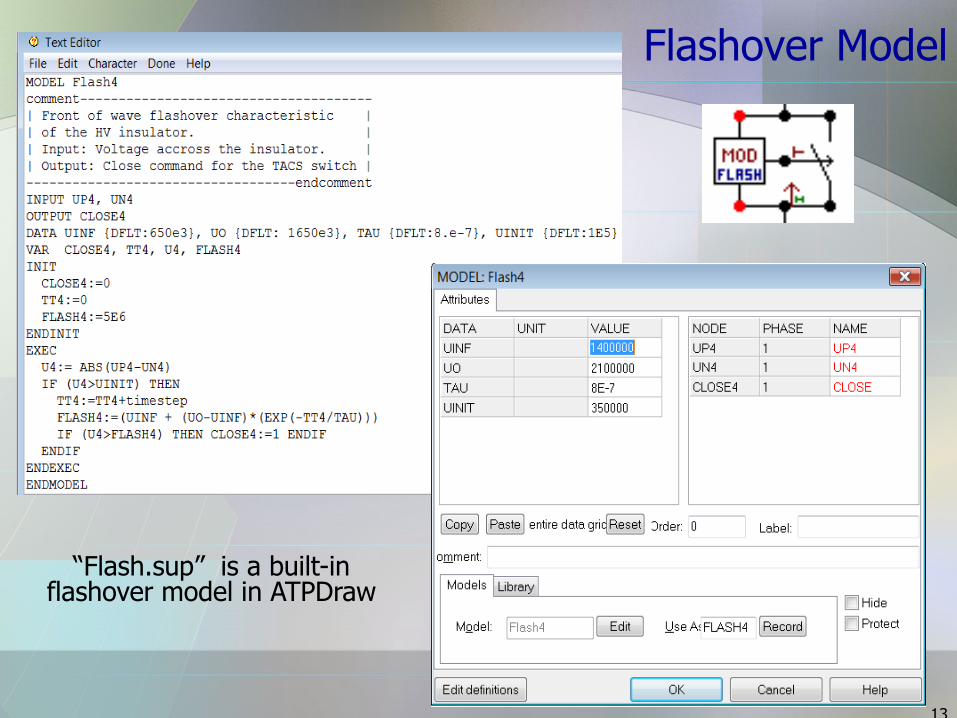
Flashover Model
“Flash.sup” is a built-in flashover model in ATPDraw

14
Breakers – 3-Phase Time-controlled switches
• Breakers are modeled as switches
• Some breakers may have transient recovery voltage (TRV) capacitors that should be included for High frequency modeling

15
Bus – Basics
• Ex. Using a BRANCH card (LINEZT_3) to represent a distributed parameters (Clarke) 3 phase. Transposed line
• Use distributed parameter, transposed line models (Clark)
• Use non-frequency dependent line models

16
Line model options . . . Non frequency dependent
Generally used for steady state modeling
Good for modeling lines that are remote from the area of
interest, where line characteristics have less effect
on the study area.

17
Line model options . . . Frequency dependent Most users prefer and get the best results using J-Marti for modeling overhead lines
ALWAYS ( ) check this box when performing
transient simulations as opposed to SS or the case
will give you erroneous data !

18
Lines - Basics
Lines – Modeling Basics
• The time-step must coordinate with your line models or ATP will crash. The time step must be less than the travel time of the shortest line segment in the model.
19
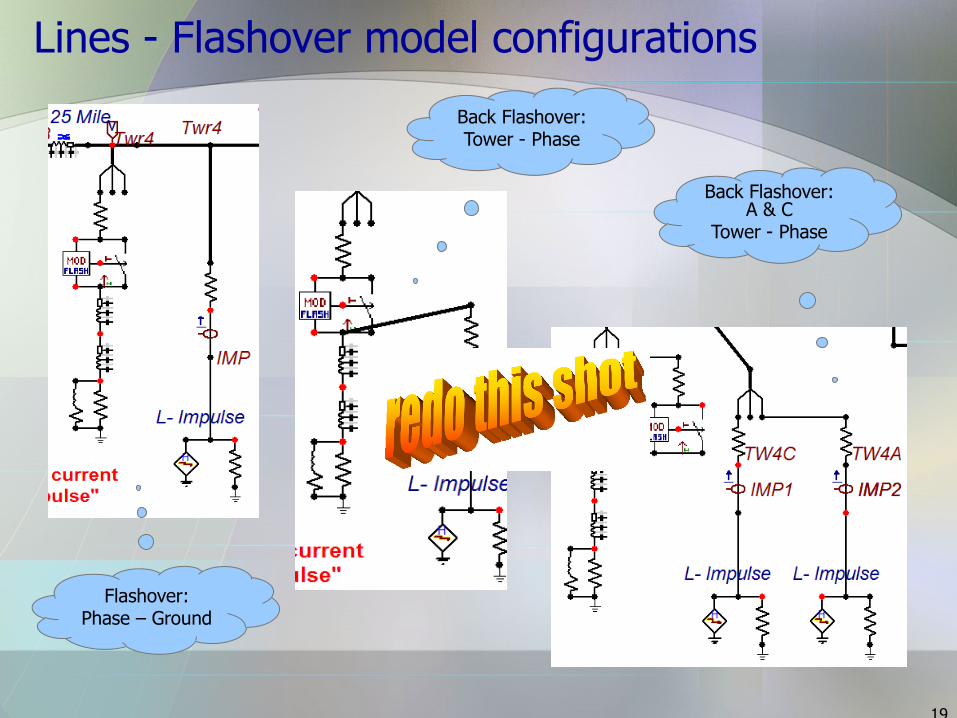
Lines - Flashover model configurations
Flashover: Phase – Ground
Back Flashover: Tower - Phase
Back Flashover: A & C
Tower - Phase
20
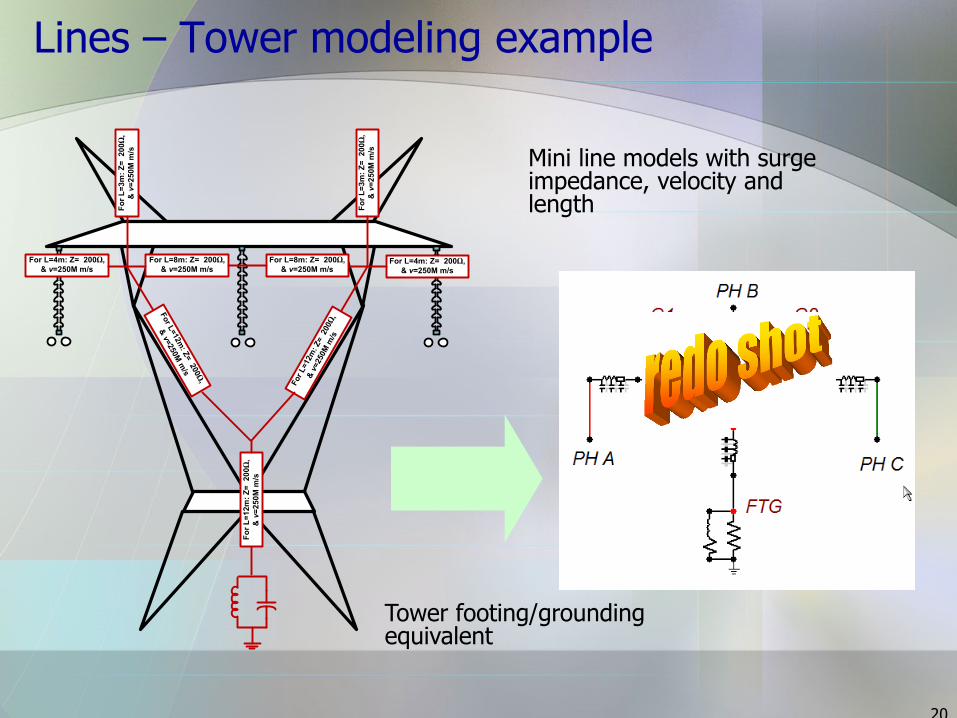
Lines – Tower modeling example
For L=4m: Z= 200Ω,
& v=250M m/s
Fo
r L
=3m
: Z
= 2
00Ω
,
& v
=2
50
M m
/s
For L=8m: Z= 200Ω,
& v=250M m/sFor L=4m: Z= 200Ω,
& v=250M m/s
Fo
r L
=3m
: Z
= 2
00Ω
,
& v
=2
50
M m
/s
For L=8m: Z= 200Ω,
& v=250M m/s
For
L=12m
: Z= 200Ω
,
& v
=250M
m/s
Fo
r L
=1
2m
: Z
= 2
00Ω
,
& v
=2
50M
m/s
For L
=12m
: Z= 2
00Ω
,
& v
=250M
m/s
Mini line models with surge impedance, velocity and length
Tower footing/grounding equivalent

21
Transformers
Leaving out transformer capacitance should provide the worst case voltage at the teminal.
Distributed capacitance modeling . . . More work is needed.

22
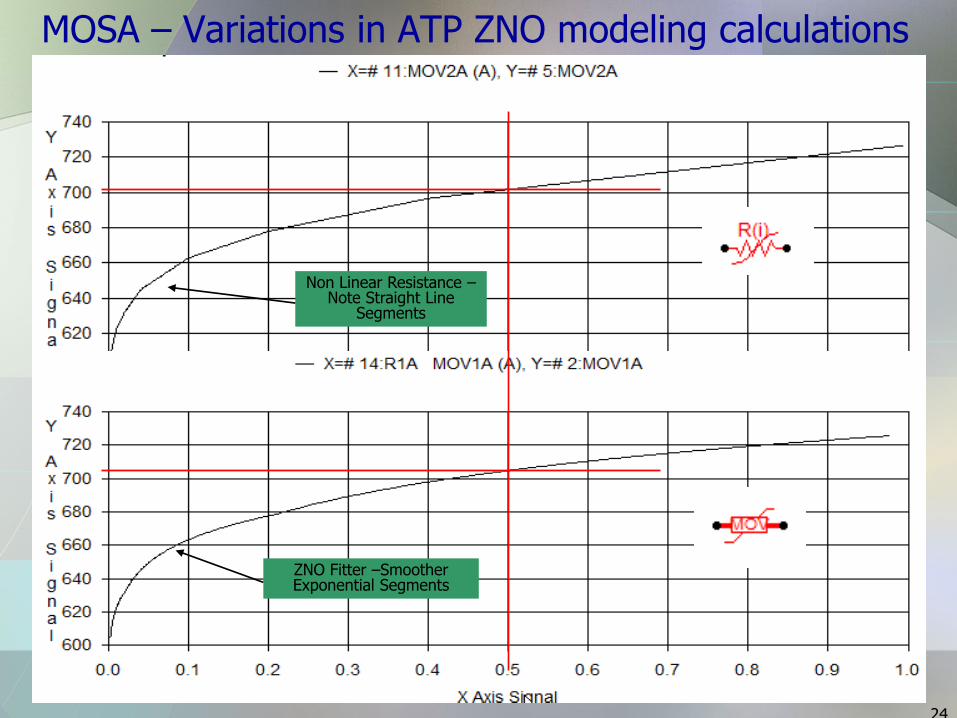
MOSA – Two Ways to Set Up Model
1. Piecewise Non-linear resistor (series of straight line resistors) - Type 92 (NLR92)
2. Exponential Current Dependent Resistor (Piecewise exponential) - Type 92 (MOV_3 or MOV_1)

23
MOSA – Two Ways to Set Up Model
1. Piecewise Non-linear resistor (series of straight line resistors) - Type 92 (NLR92)
2. Exponential Current Dependent Resistor (Piecewise exponential) - Type 92 (MOV_3 or MOV_1)
24
MOSA – Variations in ATP ZNO modeling calculations
Non Linear Resistance – Note Straight Line
Segments
ZNO Fitter –Smoother Exponential Segments

25
ZNO Modeling – High frequency models
• MOSA Characteristics – Using the ZNO Fitter card – The user modifies the “Type 92” card with the V-I characteristics
• Lead Inductance must be added as an external component to the model shown below.
Existing frequency-dependent Model in C62.22
New proposed frequency-dependent Model [R1]
26
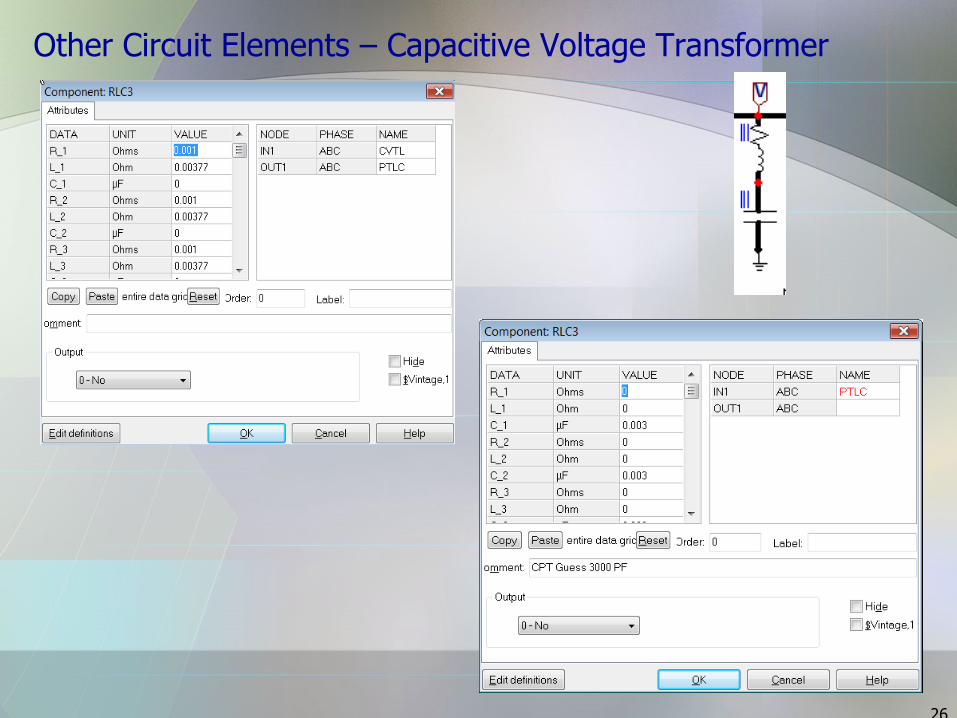
Other Circuit Elements – Capacitive Voltage Transformer

27
Verifying Circuit Operation
• Do simple hand calculations to verify steady state voltages & currents are what they should be
• Look at the ATP output files: .lis file shows the results after the case has been run – Again check SS values, minimum & maximum magnitudes – ARE they realistic (believable)?
• Use the .lis file to check/verify switches are closing and opening as needed.
• When the run crashes - Use the .atp file to verify circuit connections, verify that the various “cards” are being called.

28
Analyzing Waveforms 100 kA Lightning Surge at 1 Mile Out, Tower voltages after a direct stroke – showing wave propagation &
reflected wave
29
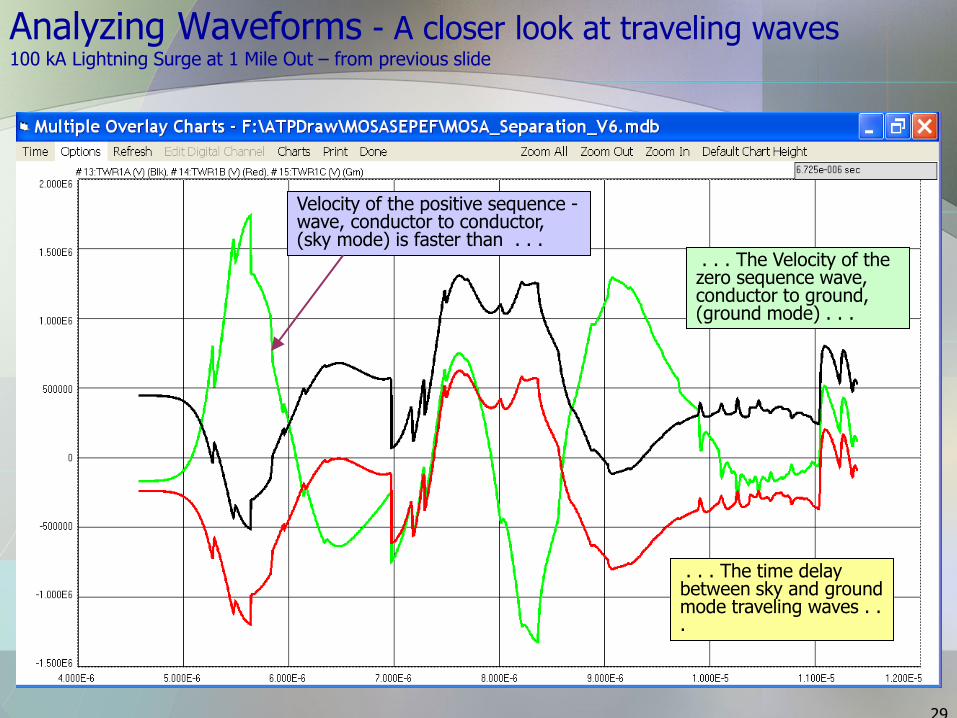
Analyzing Waveforms - A closer look at traveling waves 100 kA Lightning Surge at 1 Mile Out – from previous slide
. . . The Velocity of the zero sequence wave, conductor to ground, (ground mode) . . .
Velocity of the positive sequence - wave, conductor to conductor, (sky mode) is faster than . . .
. . . The time delay between sky and ground mode traveling waves . . .
30
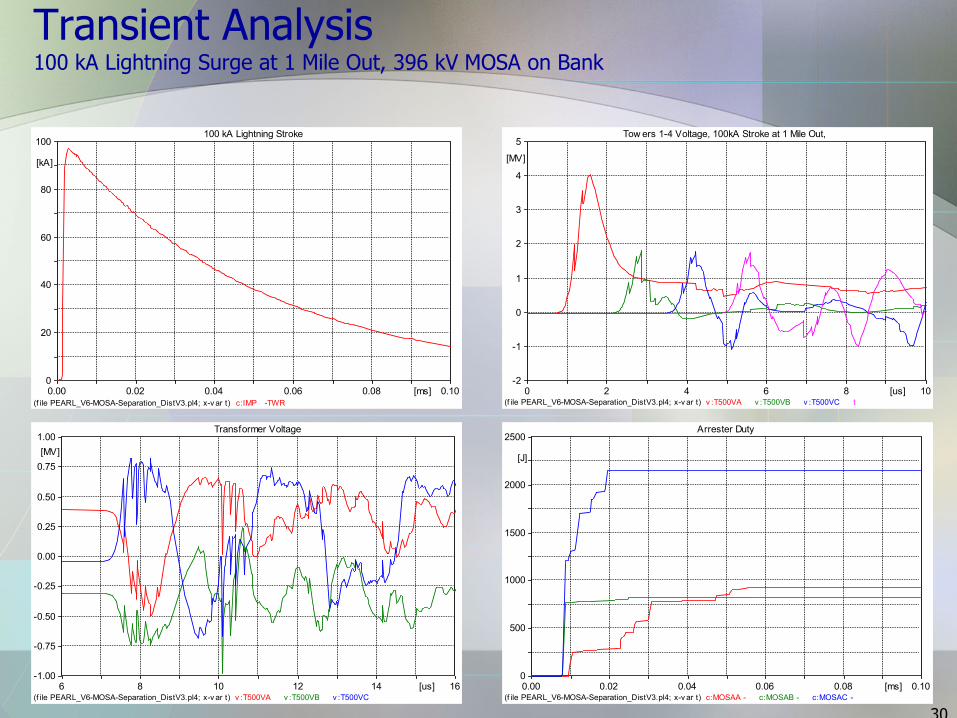
Transient Analysis 100 kA Lightning Surge at 1 Mile Out, 396 kV MOSA on Bank
(f ile PEARL_V6-MOSA-Separation_DistV3.pl4; x-v ar t) c:IMP -TWR
0.00 0.02 0.04 0.06 0.08 0.10[ms]0
20
40
60
80
100
[kA]
100 kA Lightning Stroke
(f ile PEARL_V6-MOSA-Separation_DistV3.pl4; x-v ar t) v :T500VA v :T500VB v :T500VC
6 8 10 12 14 16[us]-1.00
-0.75
-0.50
-0.25
0.00
0.25
0.50
0.75
1.00
[MV]
Transformer Voltage
(f ile PEARL_V6-MOSA-Separation_DistV3.pl4; x-v ar t) v :T500VA v :T500VB v :T500VC t
0 2 4 6 8 10[us]-2
-1
0
1
2
3
4
5
[MV]
Tow ers 1-4 Voltage, 100kA Stroke at 1 Mile Out,
(f ile PEARL_V6-MOSA-Separation_DistV3.pl4; x-v ar t) c:MOSAA - c:MOSAB - c:MOSAC -
0.00 0.02 0.04 0.06 0.08 0.10[ms]0
500
1000
1500
2000
2500
[J]
Arrester Duty

31
Transient Analysis 100 kA Lightning Surge at 1 Mile Out, 396 kV MOSA at HV Bushing vs 150 ft
(f ile PEARL_V6-MOSA-Separation_DistV3.pl4; x-v ar t) v :T500VA v :T500VB v :T500VC
6 8 10 12 14 16[us]-1.2
-0.8
-0.4
0.0
0.4
0.8
1.2
[MV]
Transformer Voltage w / MOSA at 150 Ft
(f ile PEARL_V6-MOSA-Separation_DistV3.pl4; x-v ar t) c:MOSAA - c:MOSAB - c:MOSAC -
0.00 0.02 0.04 0.06 0.08 0.10[ms]0
500
1000
1500
2000
2500
[J]
(f ile PEARL_V6-MOSA-Separation_DistV3.pl4; x-v ar t) v :T500VA v :T500VB v :T500VC
6 8 10 12 14 16[us]-1.00
-0.75
-0.50
-0.25
0.00
0.25
0.50
0.75
1.00
[MV]
Transformer Voltage
(f ile PEARL_V6-MOSA-Separation_DistV3.pl4; x-v ar t) c:MOSAA - c:MOSAB - c:MOSAC -
0.00 0.02 0.04 0.06 0.08 0.10[ms]0
500
1000
1500
2000
2500
[J]
Arrester Duty
Arrester at the Bank HV Bushing
Arrester Located 150 Ft Away from Bank
32
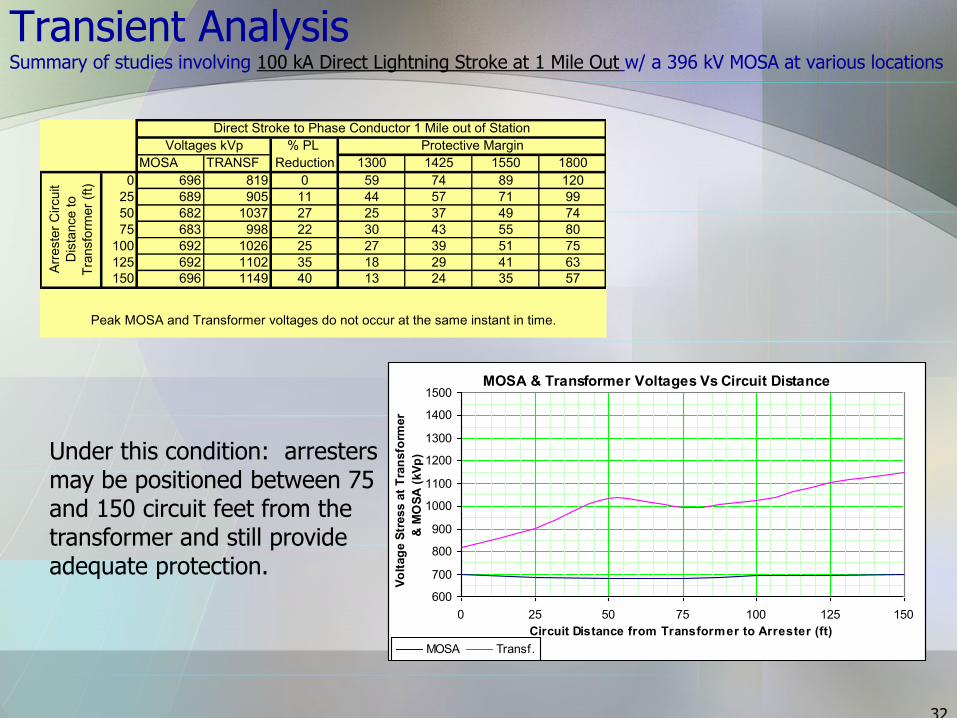
Transient Analysis Summary of studies involving 100 kA Direct Lightning Stroke at 1 Mile Out w/ a 396 kV MOSA at various locations
% PL
MOSA TRANSF Reduction 1300 1425 1550 1800
0 696 819 0 59 74 89 120
25 689 905 11 44 57 71 99
50 682 1037 27 25 37 49 74
75 683 998 22 30 43 55 80
100 692 1026 25 27 39 51 75
125 692 1102 35 18 29 41 63
150 696 1149 40 13 24 35 57
Direct Stroke to Phase Conductor 1 Mile out of Station
Peak MOSA and Transformer voltages do not occur at the same instant in time.
Voltages kVp
Arr
este
r C
ircuit
Dis
tance to
Tra
nsfo
rmer
(ft)
Protective Margin
MOSA & Transformer Voltages Vs Circuit Distance
600
700
800
900
1000
1100
1200
1300
1400
1500
0 25 50 75 100 125 150
Circuit Distance from Transformer to Arrester (ft)
Vo
ltag
e S
tress a
t T
ran
sfo
rmer
& M
OS
A (
kV
p)
MOSA Transf.
Under this condition: arresters may be positioned between 75 and 150 circuit feet from the transformer and still provide adequate protection.

33
Transient Analysis Summary of studies involving 100 kA Back flashover at Station Entrance w/ a 396 kV MOSA at various locations
Under this condition: The transformer is not adequately protected no matter where the arrester is located
% PL
MOSA TRANSF Reduction 1300 1425 1550 1800
0 789 1603 0 -19 -11 -3 12
25 788 1611 0 -19 -12 -4 12
50 790 1690 5 -23 -16 -8 7
75 797 2048 28 -37 -30 -24 -12
100 793 2127 33 -39 -33 -27 -15
125 798 2112 32 -38 -33 -27 -15
150 811 2100 31 -38 -32 -26 -14
Arr
este
r C
ircuit
Dis
tance to
Tra
nsfo
rmer
(ft)
Backflashover at Station (100 kA Stroke)
Voltages kVp Protective Margin
MOSA & Transformer Voltages Vs Circuit Distance
600
800
1000
1200
1400
1600
1800
2000
2200
0 25 50 75 100 125 150C ir c u it D is t a n c e f r o m T r a n s f o r me r t o A r r e s t e r (f t )
Vo
ltag
e S
tress a
t T
ran
sfo
rmer
&
MO
SA
(kV
p)
MOSA Transf.
34
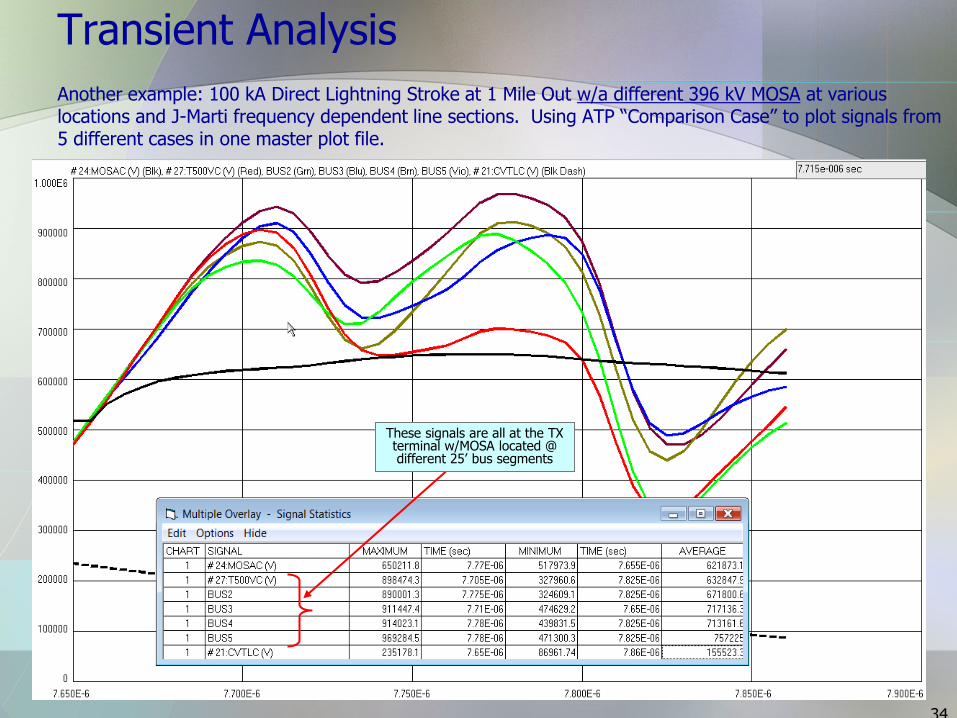
Transient Analysis Another example: 100 kA Direct Lightning Stroke at 1 Mile Out w/a different 396 kV MOSA at various locations and J-Marti frequency dependent line sections. Using ATP “Comparison Case” to plot signals from 5 different cases in one master plot file.
These signals are all at the TX terminal w/MOSA located @ different 25’ bus segments

35
Transient Analysis Summary of studies involving 33 kA Shield Failure at Station Entrance w/ a 396 kV MOSA at various locations
% PL
MOSA TRANSF Reduction 1300 1425 1550 1800
0 754 981 0 33 45 58 83
25 758 1132 15 15 26 37 59
50 760 1188 45 9 20 30 52
75 764 1128 38 15 26 37 60
100 762 1277 56 2 12 21 41
125 759 1411 72 -8 1 10 28
150 765 1489 82 -13 -4 4 21
Voltages kVp Protective Margin
Arr
este
r C
ircuit
Dis
tance to
Tra
nsfo
rmer
(ft)
Shield Failure at Station (32 kA Stroke)
MOSA & Transformer Voltages Vs Circuit Distance
600
700
800
900
1000
1100
1200
1300
1400
1500
0 25 50 75 100 125 150
Circuit Distance from Transformer to Arrester (ft)
Vo
ltag
e S
tress a
t T
ran
sfo
rmer
& M
OS
A (
kV
p)
MOSA Transf.
Under this condition: arrester must be located immediately adjacent to the bank or up to 125 circuit feet away

36
Transient Analysis Summary of studies involving 33 kA Back flashover at Station Entrance w/ a 396 kV MOSA at various locations
Under this condition: Arresters must be carefully positioned for transformers w/ 1300 and 1425 kV BIL.
% PL
MOSA TRANSF Reduction 1300 1425 1550 1800
0 706 1077 0 21 32 44 67
25 706 1132 5 15 26 37 59
50 706 1090 1 19 31 42 65
75 708 1130 5 15 26 37 59
100 706 1180 10 10 21 31 53
125 711 1181 10 10 21 31 52
150 716 1182 10 10 21 31 52
Arr
este
r C
ircuit
Dis
tance to
Tra
nsfo
rmer
(ft)
Backflashover at Station (33 kA Stroke)
Voltages kVp Protective Margin
MOSA & Transformer Voltages Vs Circuit Distance
600
700
800
900
1000
1100
1200
1300
0 25 50 75 100 125 150C irc u it D ist a nc e from Tra nsforme r t o A rre st e r (ft )
Vo
ltag
e S
tress a
t T
ran
sfo
rmer
&
MO
SA
(kV
p)
MOSA Transf.
37
Bibliography
1. Numerical modelling of metal oxide varistors,
Proceedings of the XIVth International Symposium on High Voltage Engineering,
Tsinghua University, Beijing, China, August 25-29, 2005
Boris Žitnik1*, Maks Babuder1, Michael Muhr2, Mihael Žitnik3 and Rajeev Thottappillil3
1 Milan Vidmar Electric Power Research Institute, 1000 Ljubljana, Slovenia
2 Institute of High-Voltage Engineering and System Management, Graz, Austria
3 Division for Electricity and Lightning Research, Uppsala University, Sweden
2. Simulation of metal oxide surge arrester dynamic behavior under fast transients
The international Conference on Power Systems Transients -IPST 2003 in New Orleans, USA
A. BAYADI1, N. HARID 2, K. ZEHAR 1, S. BELKHIAT 1
(1) Université Ferhat Abbas Sétif, Faculté des sciences de l’ingénieur, Département d’électrotechnique
Algeria (e-mail : [email protected], [email protected])
(2) Cardiff School of Engineering, Engineering Electrical Division Cardiff, United Kingdom
3. Alternative Transients Program - Comparison of transmission line models
Orlando P. Hevia

38
Bibliography
4. Parameters Affecting the Back Flashover across the Overhead Transmission Line Insulator Caused by Lightning
Proceedings of the 14th International Middle East Power Systems Conference (MEPCON’10), Cairo University, Egypt, December 19-21, 2010, Paper ID 111.44
Ossama E. Gouda Adel Z. El Dein Ghada M. Amer
Department of Electric Engineering Department of Electric Engineering Department of Electric Engineering
Faculty of Engineering High Institute of Energy High Institute of Technology
Cairo University, Giza, Egypt South Valley University, Aswan, Egypt Benha University, Benha, Egypt
5. AN EFFICIENT MODELING OF TRANSMISSION LINES TOWERS AND GROUNDING SYSTEMS FOR LIGHTNING PROPAGATION STUDIES
IX International Symposium on Lightning Protection 26th-30th November 2007 – Foz do Iguaçu, Brazil João Clavio Salari Carlos Portela Rogério M. Azevedo CEPEL Electric Power Research Center COPPE / UFRJ
Federal University of Rio de Janeiro CEPEL Electric Power Research Center
[email protected] [email protected] [email protected] P.O. Box 68007 – Zip Code: 21941-911 – Rio de Janeiro – RJ – Brazil – Tel: (21) 2598-6223


