Page 1
Authors:
Theresa A. KirchnerKiran KarandeEdward P. Markowski
Old Dominion UniversityNorfolk, VA, USA
March 17, 2006
Perceived Organizational Business Continuity Readiness: Scale Development and Validation
Page 2
What is business continuity ? It provides protection for the mission, vision, and
values of the organization and mitigates the effects of disasters or severe disruptions on that mission, vision, and value set. (DRII / DRJ Glossary)
It facilitates continued performance of essential business functions / operations and the ongoing protection of vital company assets. (BCI Glossary)
It includes all measures and technologies that an organization implements to combat any potential significant disruption to its normal operations, competitive advantage, and ability to prove regulatory compliance. (Price)
It allows organizations to reasonably strive for continuous availability of processes, systems, and networks. (IBM Global Services)
Page 3
Related definitions Business Continuity Planning (BCP)
is a process of developing advance arrangements and procedures that enable an organization to respond to an event in such a manner that critical business functions continue with planned levels of interruption or essential change. (Disaster Recovery Institute / Disaster Recovery Journal Glossary 2004)
Rooted in a crisis management approach (Shrivastave 1987, Smith 1990, Pauchant and Mitroff 1992)
Broader in scope than more traditional “disaster recovery” approaches, which emphasize after-the-fact recovery of information technology hardware / software systems (Doswell 2000)
Focuses on business processes and assets (Elliott et al. 2002)
Page 4
Related definitions (cont) Crisis Management is an approach that:
recognizes the social and technical characteristics of business interruptions
emphasizes the contribution that managers and employees make to the resolution of interruptions
assumes that managers may build resilience into business interruptions through processes and changes to operating norms and practices
assumes that organizations themselves may play a major role in ‘incubating the potential for failure
recognizes that, if managed properly, interruptions do not inevitably result in crises
acknowledges the impact, potential or realized, of interruptions upon a wide range of stakeholders (Elliott et al. 2002)
Page 5
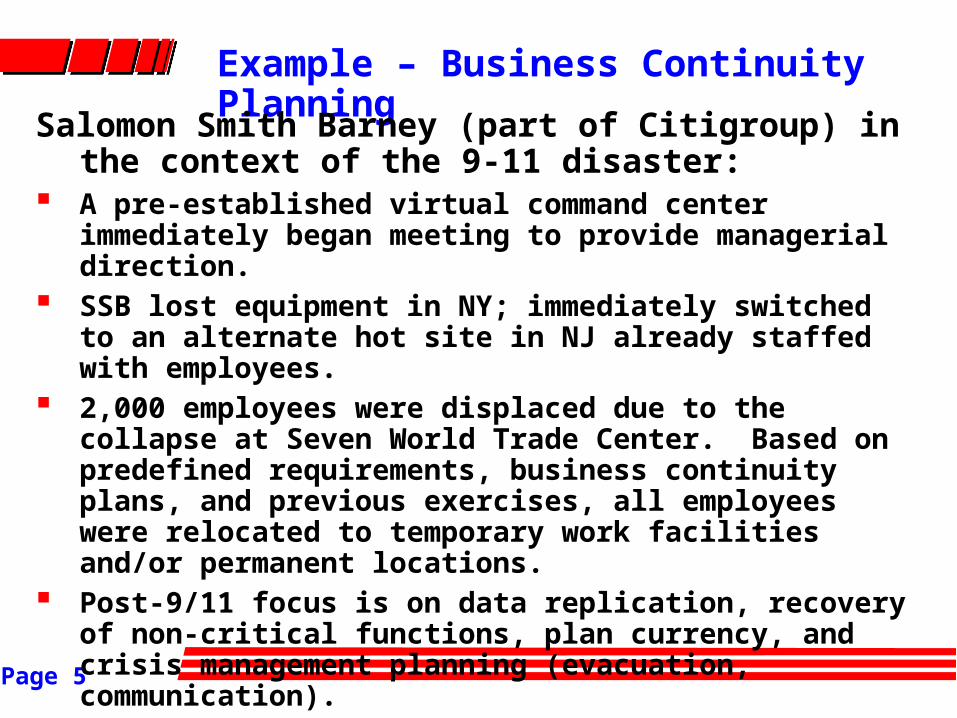
Example – Business Continuity Planning
Salomon Smith Barney (part of Citigroup) in the context of the 9-11 disaster:
A pre-established virtual command center immediately began meeting to provide managerial direction.
SSB lost equipment in NY; immediately switched to an alternate hot site in NJ already staffed with employees.
2,000 employees were displaced due to the collapse at Seven World Trade Center. Based on predefined requirements, business continuity plans, and previous exercises, all employees were relocated to temporary work facilities and/or permanent locations.
Post-9/11 focus is on data replication, recovery of non-critical functions, plan currency, and crisis management planning (evacuation, communication).

Page 6
Practical Examples Network outage “Sick building” Earthquake / fire / flood / hurricane / snowstorm WTO / World Bank protest situation Election-year party convention Major IT or operational system implementation Hacker / intruder situation Violence in the workplace Terrorist attack (or threat) Gas line explosion

Page 7
‘Standard practice’ ‘Better practice’ Continuous Improvement
Old New Future / Virtual Disaster Recovery Business Continuity (e-continuity + ?) Management IT focus Value chain focus Virtual value chain focus
IT staff Multi-disciplinary team Intra-organizational team
Existing structure New structures Virtual structures
Protect core operations Protect entire org Protect virtual org Sustain current position Create sustainable Compelling performance advantage
Parochial view Open system view Virtual system view
Recovery emphasis Prevention / continuity Virtual value chain emphasis continuity emphasis Adapted from Elliott et al. 2002
Business Continuity – Historical Perspective
Page 8
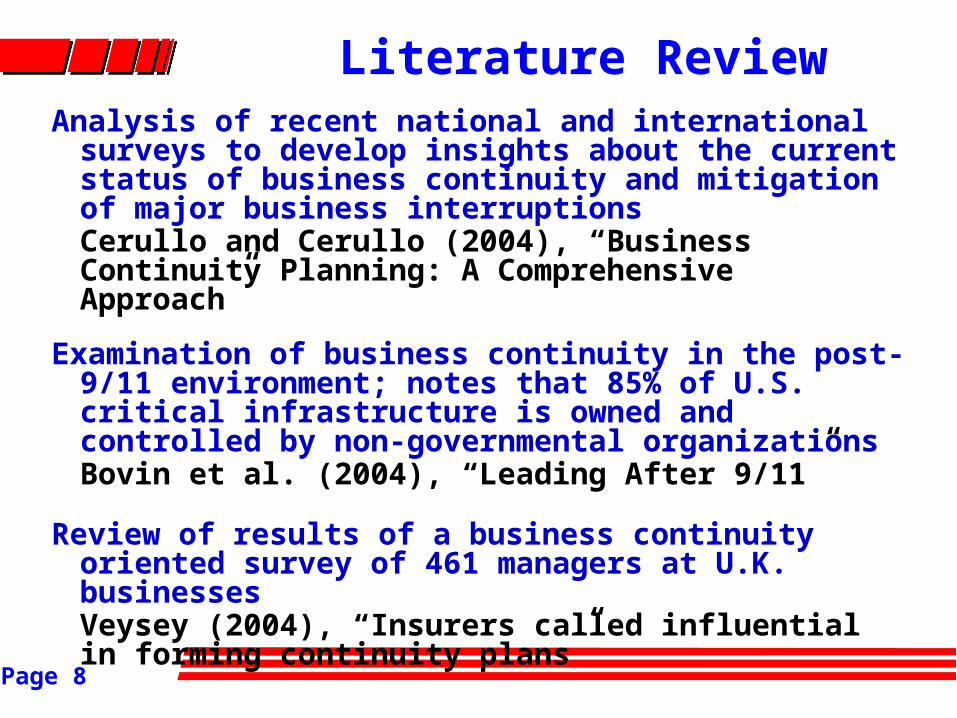
Literature ReviewAnalysis of recent national and international surveys to
develop insights about the current status of business continuity and mitigation of major business interruptionsCerullo and Cerullo (2004), “Business Continuity Planning: A Comprehensive Approach”
Examination of business continuity in the post-9/11 environment; notes that 85% of U.S. critical infrastructure is owned and controlled by non-governmental organizationsBovin et al. (2004), “Leading After 9/11”
Review of results of a business continuity oriented survey of 461 managers at U.K. businessesVeysey (2004), “Insurers called influential in forming continuity plans”
Page 9
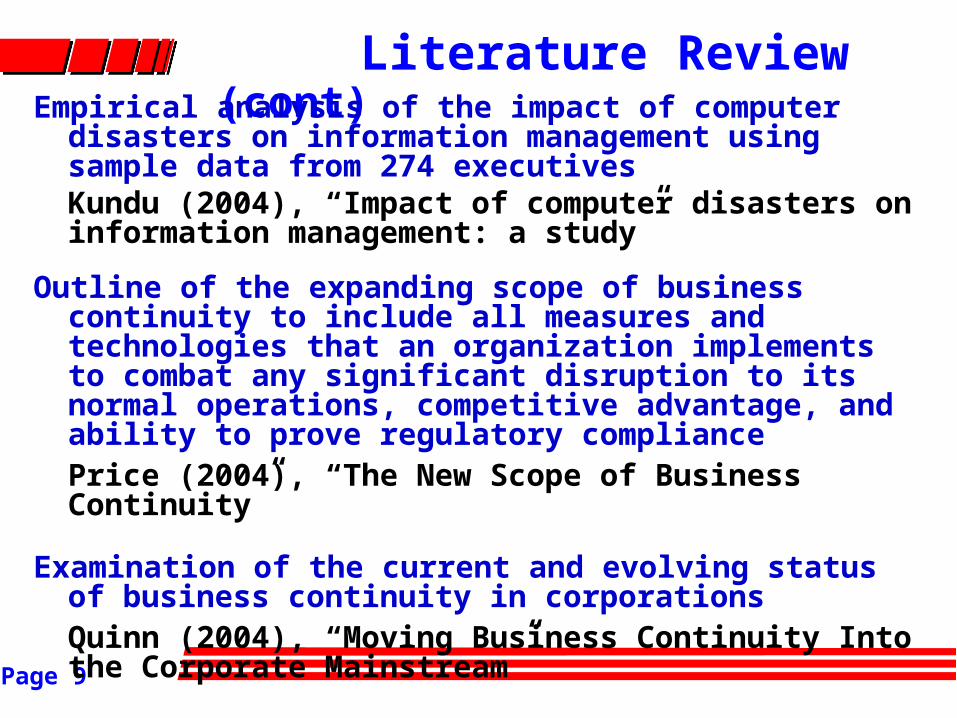
Literature Review (cont)Empirical analysis of the impact of computer disasters on
information management using sample data from 274 executivesKundu (2004), “Impact of computer disasters on information management: a study”
Outline of the expanding scope of business continuity to include all measures and technologies that an organization implements to combat any significant disruption to its normal operations, competitive advantage, and ability to prove regulatory compliance Price (2004), “The New Scope of Business Continuity”
Examination of the current and evolving status of business continuity in corporationsQuinn (2004), “Moving Business Continuity Into the Corporate Mainstream”
Page 10
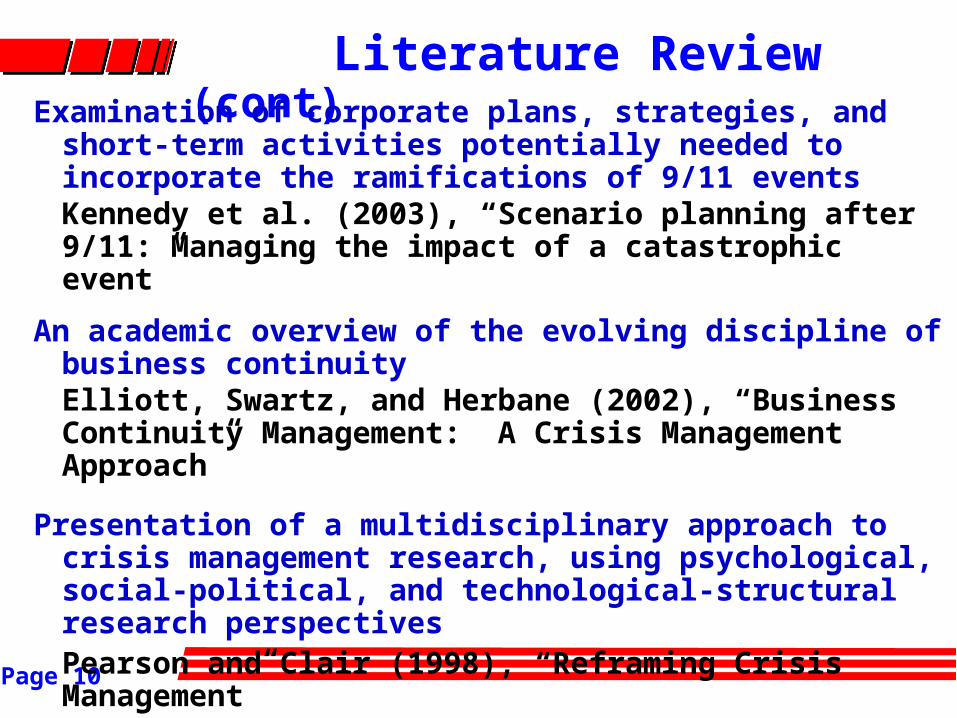
Literature Review (cont)Examination of corporate plans, strategies, and short-term
activities potentially needed to incorporate the ramifications of 9/11 eventsKennedy et al. (2003), “Scenario planning after 9/11: Managing the impact of a catastrophic event”
An academic overview of the evolving discipline of business continuityElliott, Swartz, and Herbane (2002), “Business Continuity Management: A Crisis Management Approach”
Presentation of a multidisciplinary approach to crisis management research, using psychological, social-political, and technological-structural research perspectives Pearson and Clair (1998), “Reframing Crisis Management”
Page 11
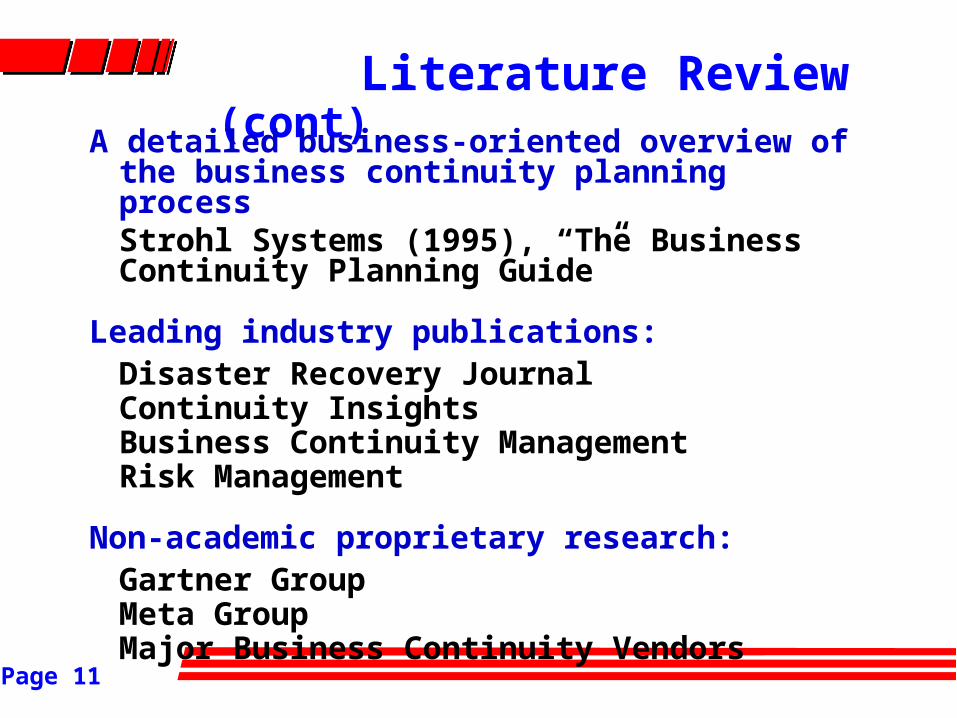
Literature Review (cont)
A detailed business-oriented overview of the business continuity planning processStrohl Systems (1995), “The Business Continuity Planning Guide”
Leading industry publications:Disaster Recovery JournalContinuity InsightsBusiness Continuity ManagementRisk Management
Non-academic proprietary research:Gartner GroupMeta GroupMajor Business Continuity Vendors

Page 12
Why is the research relevant ?Examples: The U.S. experienced 58 weather-related
disasters between 1980 and 2003, with normalized damages that exceeded $1 billion each and totaled $349 billion (NOAA 2004)
43% of firms hit by severe crises never reopen. Another 29% fail within two years. (Datapro Research Company 1990)
e.g. Of all business damaged by Hurricane Andrew in 1992, 80% of those lacking a business continuity plan failed within 2 years of the storm. (FEMA http://www.fema.gov/library/lib01.htm)

Page 13
Why is the research relevant ? (cont)
Examples:
More than 75% of organizations worldwide experienced unexpected unavailability of critical business systems in 2002. (Ernst & Young Global Information Security 2002 Survey)
Downtime costs $1300 per minute on average. (Oracle)
Downtime costs major Internet players an estimated $8000 per hour. (Forrester Research)
Typical medium-sized business downtime costs average $78,000 per hour; these sites typically lose more than $1 million annually due to downtime. (IDC)

Page 14
Cost of Downtime Revenue
• Direct loss• Compensatory payments• Lost future revenues• Billing losses• Investment losses
Productivity• Number of employees impacted X hours out X burdened hourly rate
Damaged Reputation• Customers• Suppliers• Financial markets• Banks• Business partners• Etc.
Financial Performance• Revenue recognition• Cash flow• Lost discounts (A/P)• Payment guarantees• Credit rating• Stock price
Other Expenses Temporary employees, equipment rental, overtime costs, extra shipping costs, travel expenses, opportunity costs, etc.
Copyright © 2001
Page 15
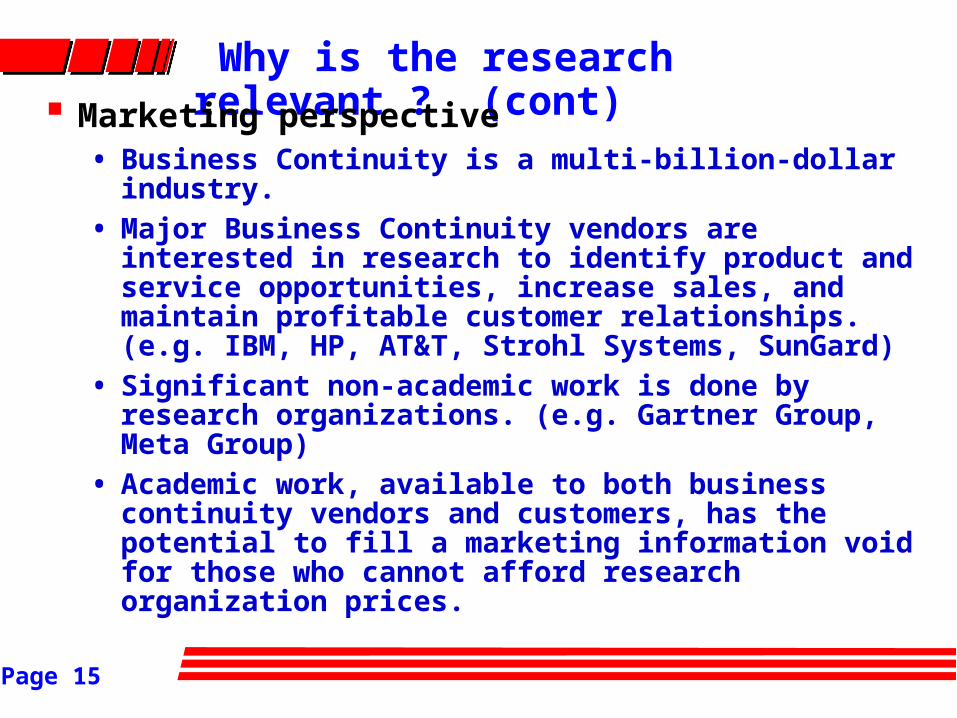
Why is the research relevant ? (cont) Marketing perspective
• Business Continuity is a multi-billion-dollar industry.
• Major Business Continuity vendors are interested in research to identify product and service opportunities, increase sales, and maintain profitable customer relationships. (e.g. IBM, HP, AT&T, Strohl Systems, SunGard)
• Significant non-academic work is done by research organizations. (e.g. Gartner Group, Meta Group)
• Academic work, available to both business continuity vendors and customers, has the potential to fill a marketing information void for those who cannot afford research organization prices.

Page 16
Why is the research relevant ? (cont) Managerial perspective
• In a 24x7 on-line world, managers must approximate 100% uptime and accessibility or customers will go elsewhere.“The wonder of the Web is that the customer knows about problems at the same time that you do. There’s no camouflage.” - Senior VP of electronic brokerage
• A business continuity readiness scale can provide an operational tool for managers to measure and assess readiness at both a firm level and, potentially, an industry level.
• A business continuity readiness scale can provide information for a scorecard useful for updating Boards of Directors, internal and external auditors, industry analysts, investors, and other stakeholders.

Page 17
Why is the research relevant ? (cont)
Academic perspective
• There is very little theoretical and empirical research in the literature.
• While university classes and academic degrees are beginning to be awarded in the areas of business continuity / disaster recovery / emergency response, the coursework and textbooks are based on non-academic research and case studies.
• There are no academic constructs / scales for organizational business continuity readiness and its antecedents.

Page 18
Proposed Construct:Perceived Organizational Business Continuity
Readiness
Related Research Questions: How is perceived organizational business
continuity readiness measured? What factors (antecedents) contribute to
perceived organizational business continuity readiness?
What are the consequences of organizational business continuity readiness?
How This Research Addresses the Gap
Page 19
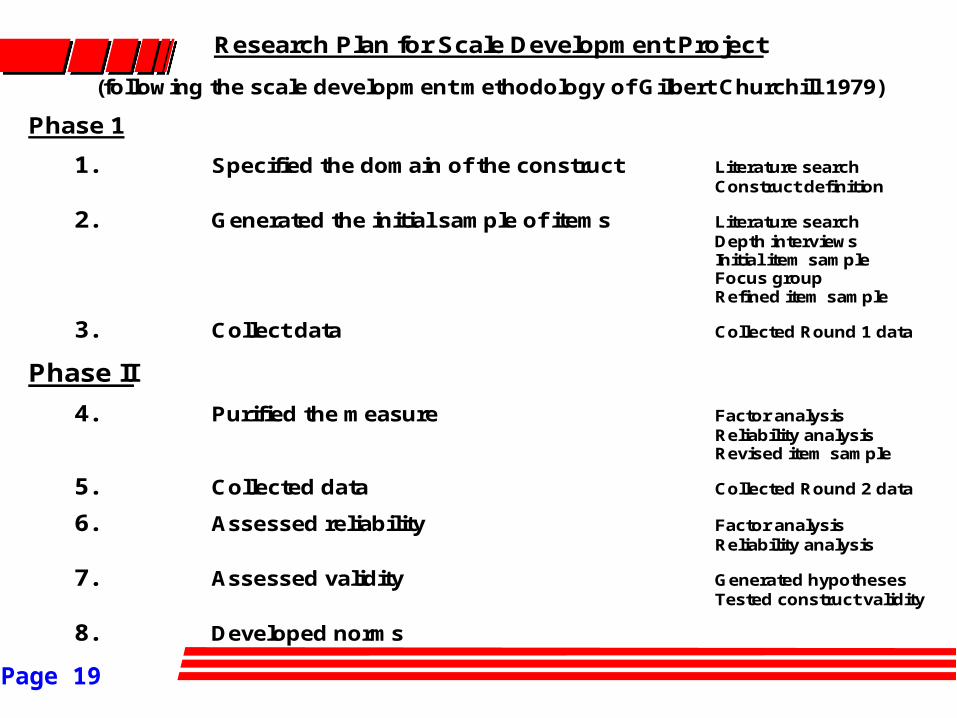
Research Plan for Scale Development Project
(following the scale development methodology of Gilbert Churchill 1979)
Phase 1
1. Specified the domain of the construct Literature search Construct definition
2. Generated the initial sample of items Literature search Depth interviews Initial item sample Focus group Refined item sample
3. Collect data Collected Round 1 data
Phase II
4. Purified the measure Factor analysis Reliability analysis Revised item sample
5. Collected data Collected Round 2 data
6. Assessed reliability Factor analysis Reliability analysis
7. Assessed validity Generated hypotheses Tested construct validity
8. Developed norms
Page 20
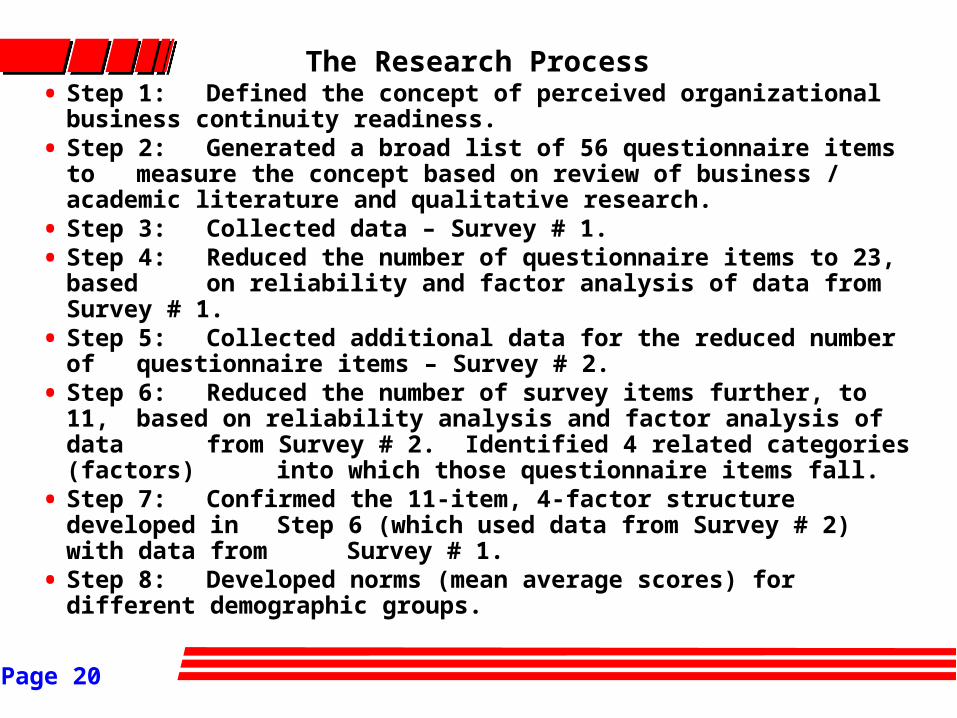
The Research Process• Step 1: Defined the concept of perceived organizational
business continuity readiness.• Step 2: Generated a broad list of 56 questionnaire items to
measure the concept based on review of business / academic literature and qualitative research.
• Step 3: Collected data – Survey # 1.• Step 4: Reduced the number of questionnaire items to 23,
based on reliability and factor analysis of data from Survey # 1.
• Step 5: Collected additional data for the reduced number of questionnaire items – Survey # 2.
• Step 6: Reduced the number of survey items further, to 11, based on reliability analysis and factor analysis of data from Survey # 2. Identified 4 related categories
(factors) into which those questionnaire items fall.• Step 7: Confirmed the 11-item, 4-factor structure developed in
Step 6 (which used data from Survey # 2) with data from Survey # 1.
• Step 8: Developed norms (mean average scores) for different demographic groups.
Page 21
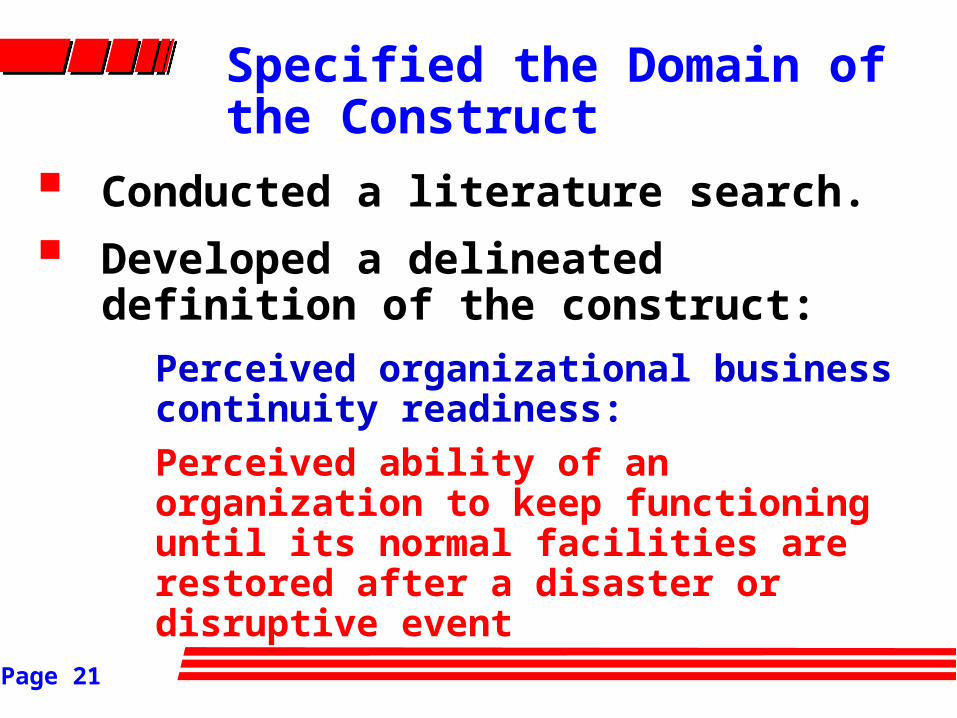
Specified the Domain of the Construct
Conducted a literature search.
Developed a delineated definition of the construct:
Perceived organizational business continuity readiness:
Perceived ability of an organization to keep functioning until its normal facilities are restored after a disaster or disruptive event
Page 22
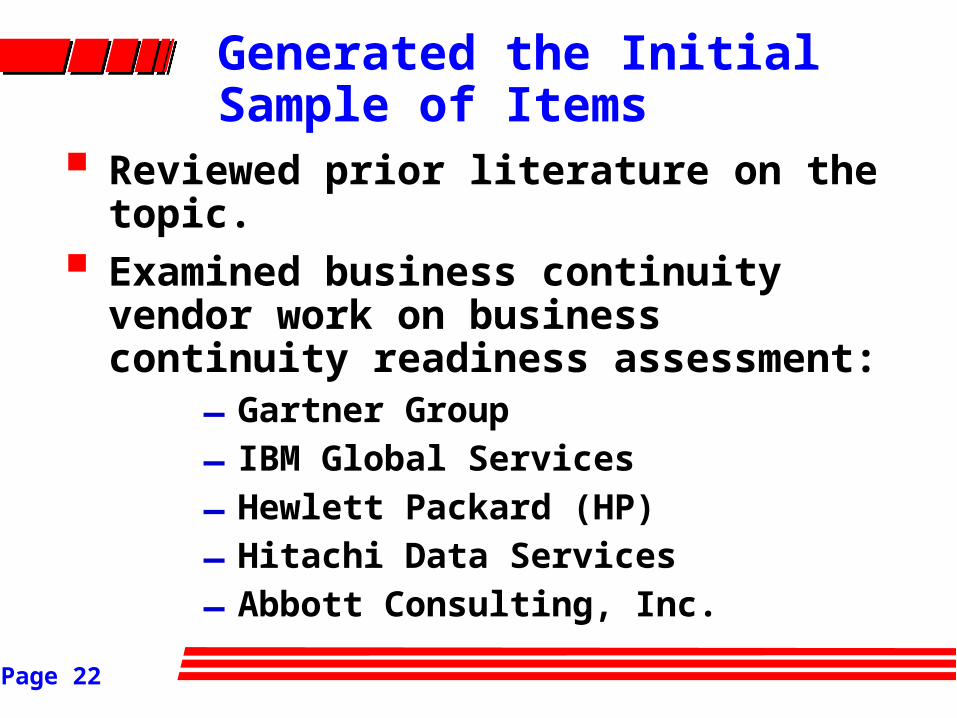
Generated the Initial Sample of Items
Reviewed prior literature on the topic.
Examined business continuity vendor work on business continuity readiness assessment:
– Gartner Group
– IBM Global Services
– Hewlett Packard (HP)
– Hitachi Data Services
– Abbott Consulting, Inc.
Page 23
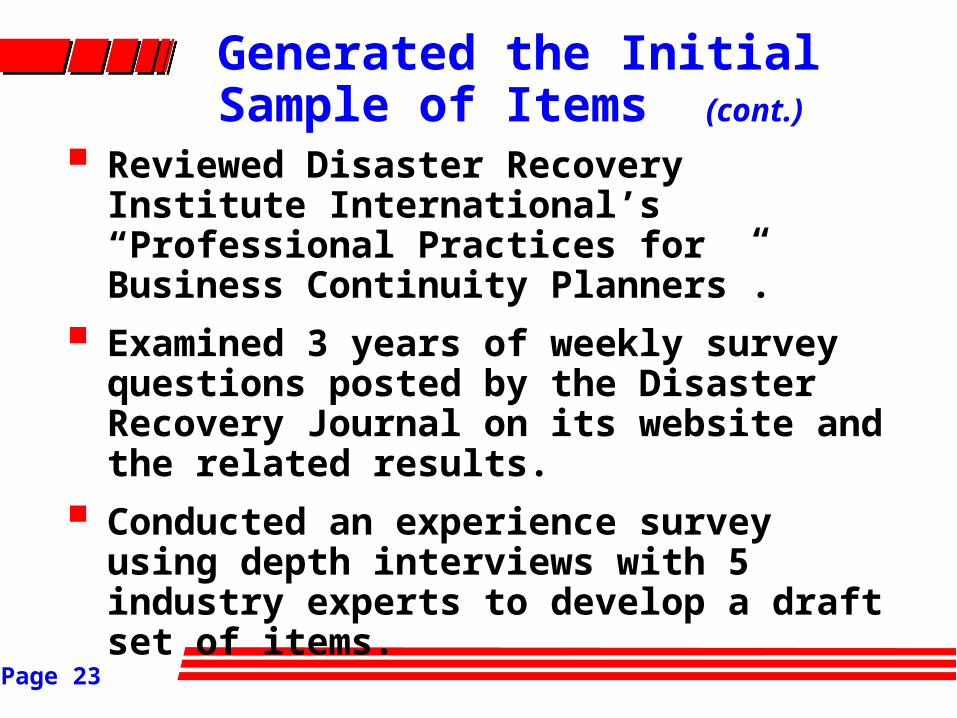
Generated the Initial Sample of Items (cont.)
Reviewed Disaster Recovery Institute International’s “Professional Practices for Business Continuity Planners”.
Examined 3 years of weekly survey questions posted by the Disaster Recovery Journal on its website and the related results.
Conducted an experience survey using depth interviews with 5 industry experts to develop a draft set of items.

Page 24
Generated the Initial Sample of Items (cont.)
Conducted an on-online focus group of 57 Master Certified Business Continuity Professionals (including business continuity planners, managers, and vendors) to develop a full range of items.
– Asked the participants: “How can business continuity readiness be measured?” in terms of dimensions and specific items.
– 11 participants discussed the topic in depth by proposing lists of potential measurement items. 10 additional participants commented on the appropriateness of those items.

Page 25
Generated the Initial Sample of Items (cont.)
Developed initial item sample characteristics: (cont.)– Structured questionnaire – all respondents
replied to the same questions.
– Undisguised questionnaire – did not attempt to hide the purpose of the study.
– Method of administration – on-line survey, accessed on a self-selecting basis, either from the Disaster Recovery Journal website or from a DRJ newsletter emailed to the respondent.
Page 26
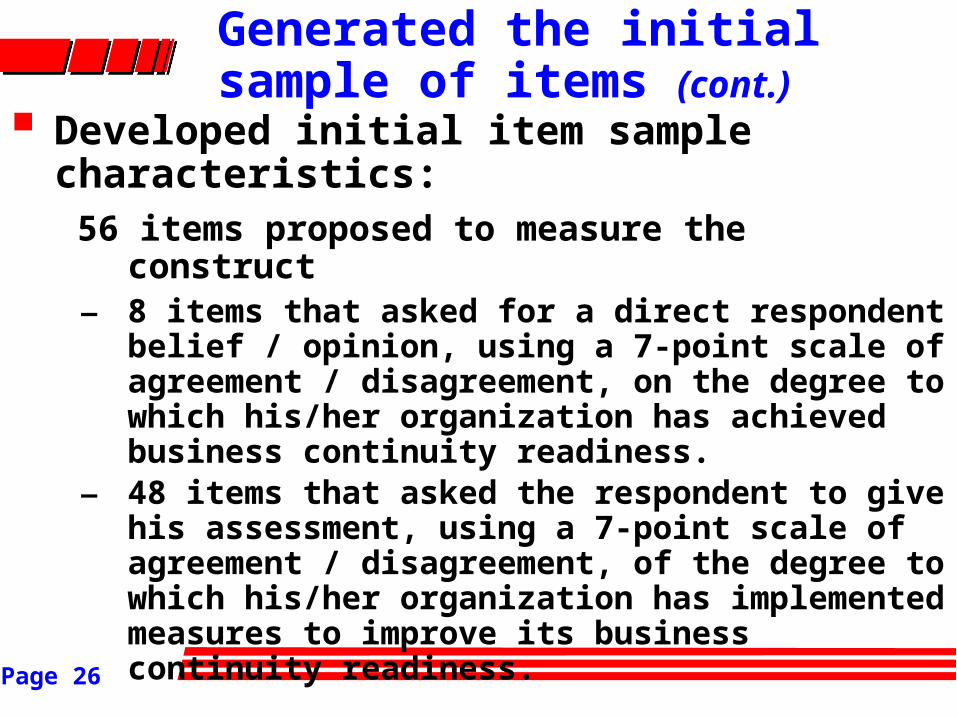
Generated the initial sample of items (cont.)
Developed initial item sample characteristics:
56 items proposed to measure the construct– 8 items that asked for a direct respondent belief /
opinion, using a 7-point scale of agreement / disagreement, on the degree to which his/her organization has achieved business continuity readiness.
– 48 items that asked the respondent to give his assessment, using a 7-point scale of agreement / disagreement, of the degree to which his/her organization has implemented measures to improve its business continuity readiness.
Page 27
Refined the Sample of Items
Developed initial item sample characteristics:4 additional questions:
1. What is your level of expertise in the area of business continuity planning? (Novice to Advanced / Expert)
2. Have you earned a certification in the area of business continuity planning? (Yes or No)
3. What is the size of your company (approximate number of employees - all locations) (7 ranges, from “Sole” to “10,000+”)
4. What is the primary business of your organization? (18 options, including “Other”)
Page 28
Refined the Sample of Items (cont.)
Implemented the on-line version of the questionnaire to the ODU Inquisite server using Inquisite (ODU) survey software. (Contact: Dr. Joan Mann, ODU CBPA)
Verified that the questionnaire functioned correctly by entering a complete set of survey responses.
Asked 3 subjects without business continuity planning knowledge or experience to complete the survey to assess clarity and understandability.
Page 29
Refined the Sample of Items (cont.)
Conducted a pre-test using input from 5 experts (practitioner and consultant) to assess content validity in terms of applicability and representation of the perceived organizational business continuity readiness dimension.
No duplication or inappropriate items were identified based on the above analysis.
Finalized the initial version of the scale.
Deleted the responses of the pre-testers.

Page 30
Collected Data – Round 1
Survey population: Executives, managers, employees, and vendors with a specific interest in business continuity planning
Potential sampling units:
– Disaster Recovery Journal website visitors *
– Disaster Recovery Journal on-line newsletter recipients *
– Disaster Recovery Journal conference attendees
– Disaster Recovery Institute website visitors*
Selected
Page 31
Collected Data – Round 1 (cont.)
Posted the survey announcement and link on the Disaster Recovery Journal site.
Modified and reimplemented the survey after 2 days based on belated input from one of the pre-test participants:– Enhanced survey instructions to
prepare participants for questions in the form of declarative sentences with an agree / disagree scale.
Page 32
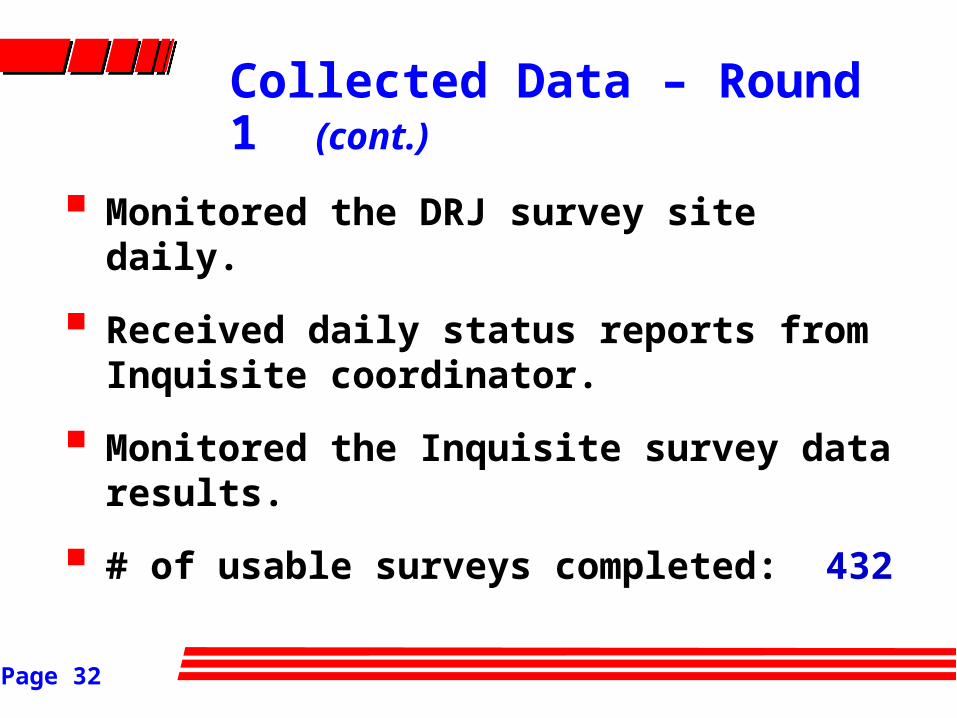
Collected Data – Round 1 (cont.)
Monitored the DRJ survey site daily.
Received daily status reports from Inquisite coordinator.
Monitored the Inquisite survey data results.
# of usable surveys completed: 432
Page 33
Lessons Learned – On-line Surveys
Build a detailed plan with completion dates; allow enough time for each step of the project.
Expert interviewees and pre-testers are likely to respond with second or third responses after their initial input; sometimes their late responses are important.
Website – related lessons learned:• The host website may change; daily
monitoring is important.
• Other website items and placement on website may impact response.
• Holiday periods may impact response.

Page 34
Lessons Learned – On-Line Surveys (cont.)
Inquisite is an excellent survey tool but currently has some drawbacks:• The entire survey cannot be printed for
review; must print 1 page at a time.• It’s often difficult or not possible to
create desired customization• What you see is not necessarily what
you get. It’s important to preview the survey itself as you build it.
Offer participants something; in this case, they responded well to the offer of research results.

Page 35
Purified the Measure
Analyzed the results of the initial data, using:
- Reliability analysis (Cronbach’s Alpha)
- Factor analysis
Revised the questionnaire by reducing the number of items from 56 to 23.
Added 18 items to measure antecedents.
Added 10 items to collect demographic information about the respondent and the respondent’s organization.
Page 36
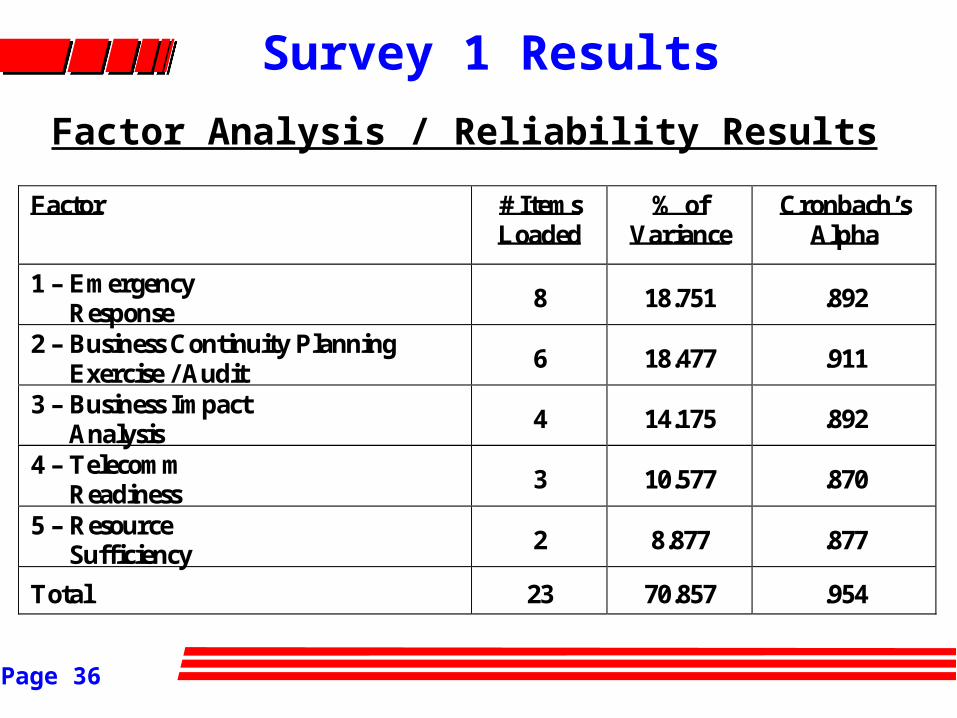
Survey 1 Results
Factor # Items Loaded
% of Variance
Cronbach’s Alpha
1 – Emergency Response
8 18.751 .892
2 – Business Continuity Planning Exercise / Audit
6 18.477 .911
3 – Business Impact Analysis
4 14.175 .892
4 – Telecomm Readiness
3 10.577 .870
5 – Resource Sufficiency
2 8.877 .877
Total 23 70.857 .954
Factor Analysis / Reliability Results
Page 37
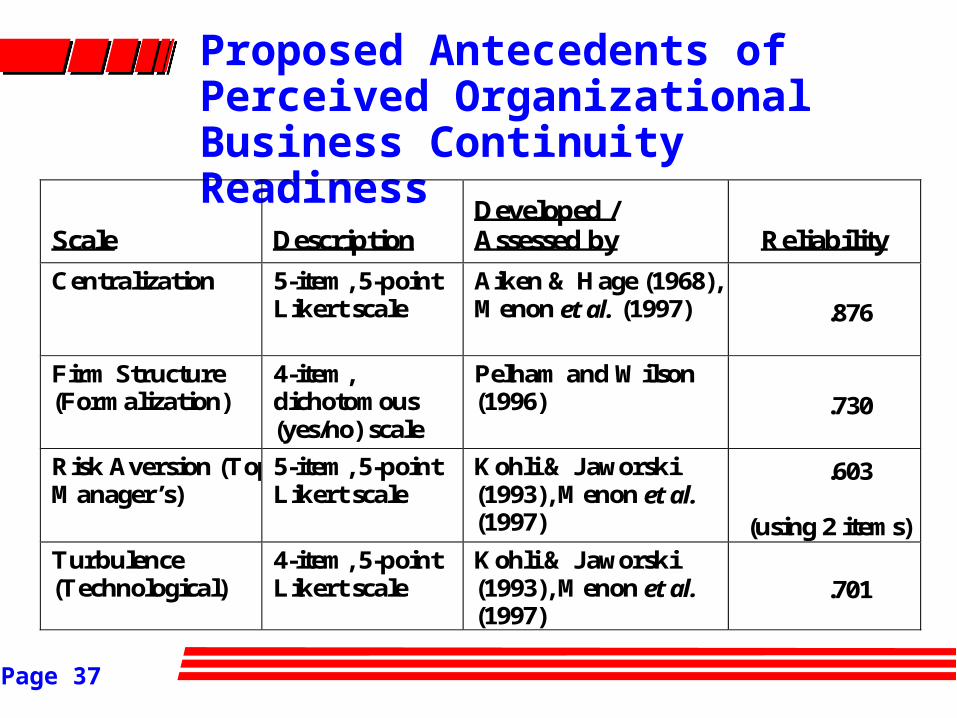
Proposed Antecedents of Perceived Organizational Business Continuity Readiness
Scale
Description Developed / Assessed by
Reliability
Centralization 5-item, 5-point Likert scale
Aiken & Hage (1968), Menon et al. (1997) .876
Firm Structure (Formalization)
4-item, dichotomous (yes/no) scale
Pelham and Wilson (1996) .730
Risk Aversion (Top Manager’s)
5-item, 5-point Likert scale
Kohli & Jaworski (1993), Menon et al. (1997)
.603
(using 2 items)
Turbulence (Technological)
4-item, 5-point Likert scale
Kohli & Jaworski (1993), Menon et al. (1997)
.701

Page 38
Collected Data – Round 2
Used a paper survey distributed in the registration packages of the 03/2005 Disaster Recovery Journal Conference
# of surveys distributed: 895
# of usable surveys completed: 126

Page 39
Survey 2 Results – Final 11-Item Scale
Factor Analysis / Reliability Results
Factor # Items Loaded
% of Variance
Cronbach’s Alpha
1 – Business Continuity Plan Exercise
4 31.164 .942
2 – Emergency Response Readiness
3 20.384 .812
3 – Resource Sufficiency
2 16.131 .842
4 – Business Impact Analysis / (RTO/RPO)
2 15.370 .827
Total 11 83.050 .911

Page 40
Confirmatory Factor Analysis – SEM (AMOS) Diagram – Survey 1 Data

Page 41
Confirmatory Factor Analysis (AMOS) – Data from Survey 1
Page 42
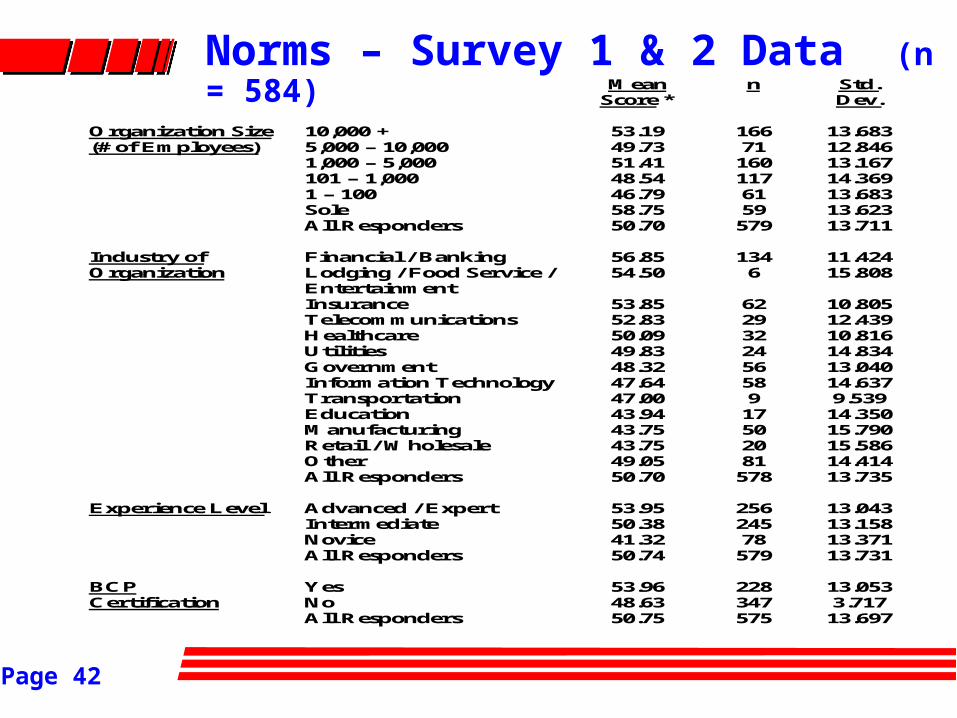
Norms – Survey 1 & 2 Data (n = 584) Mean
Score * n Std.
Dev. Organization Size 10,000 + 53.19 166 13.683 (# of Employees) 5,000 – 10,000 49.73 71 12.846 1,000 – 5,000 51.41 160 13.167 101 – 1,000 48.54 117 14.369 1 – 100 46.79 61 13.683 Sole 58.75 59 13.623 All Responders 50.70 579 13.711 Industry of Financial / Banking 56.85 134 11.424 Organization Lodging / Food Service /
Entertainment 54.50 6 15.808
Insurance 53.85 62 10.805 Telecommunications 52.83 29 12.439 Healthcare 50.09 32 10.816 Utilities 49.83 24 14.834 Government 48.32 56 13.040 Information Technology 47.64 58 14.637 Transportation 47.00 9 9.539 Education 43.94 17 14.350 Manufacturing 43.75 50 15.790 Retail / Wholesale 43.75 20 15.586 Other 49.05 81 14.414 All Responders 50.70 578 13.735 Experience Level Advanced / Expert 53.95 256 13.043 Intermediate 50.38 245 13.158 Novice 41.32 78 13.371 All Responders 50.74 579 13.731 BCP Yes 53.96 228 13.053 Certification No 48.63 347 3.717 All Responders 50.75 575 13.697
Page 43
Next Steps Multigroup analysis (AMOS), using the 2
groups of data collected from the 2 surveys, to determine whether or not the factor structure and factor loadings are similar between the groups.
Additional analysis – Survey 2 antecedent data
Enhancement of questionnaire to include additional antecedents and consequences
Survey 3 data collection (using international Association of Contingency Planners members) and analysis
Page 44
Managerial & Research Implications
Caveat: It’s perceived, not actual. First study of its type to develop a measurement scale
for perceived organizational business continuity readiness.
Useful for both business continuity vendors and practitioners, as a tool for filling a marketing information void for consultants and small vendors.
Can provide an evaluation tool for executives and an operational tool for managers, to be used to measure and assess readiness at both a firm level and, potentially, an industry level.
Might be used to formulate a scorecard, or balanced scorecard component, useful for updating Boards of Directors, internal and external auditors, industry analysts, investors, and other stakeholders.

Page 45
Opportunities for Future Research
Conduct testing within individual organizations
Develop antecedents and consequences of perceived organizational business continuity readiness
Develop an assessment tool for actual organizational business continuity readiness, which might be compared and contrasted with this perceived organizational business continuity readiness scale.

Page 46
Questions
and
Comments . . .


