Download - P NATIONAL STATISTICAL DEVELOPMENT

PLAN FOR
NATIONAL STATISTICAL DEVELOPMENT
(2006/7 – 2010/11)
Published 2006 Published by: Uganda Bureau of Statistics
Address: Plot 9 Colville Street P.O. Box 7186 Kampala Tel: 041 256 706000
Fax: 041-256-237553 Email: [email protected] Website: www.ubos.org
Copyright 2006 Uganda Bureau of Statistics (UBOS) The material in this document may be freely reproduced provided due acknowledgement is made to the publisher and source.

NSS- PNSD, October 2006
i
TABLE OF CONTENTS
ACRONYMS .............................................................................................................. III
FOREWORD ................................................................................................................V
PREFACE....................................................................................................................VI
EXECUTIVE SUMMARY .............................................................................................VII
1. BACKGROUND ................................................................................................. 10
1.1 ECONOMIC AND SOCIAL SETTING .................................................................................... 10
1.2 THE CASE FOR STATISTICS IN THE NATIONAL PLANNING FRAMEWORK ................................... 10
2. THE PNSD PLANNING PROCESS ....................................................................... 12
3. THE NATIONAL STATISTICAL SYSTEM................................................................ 14
3.1 THE CONCEPT OF A NATIONAL STATISTICAL SYSTEM ........................................................... 14
3.2 CHARACTERISTICS OF A GOOD NATIONAL STATISTICAL SYSTEM .......................................... 15
3.3 REGULATORY FRAMEWORK FOR STATISTICS ........................................................................ 15
3.4 ROLES OF VARIOUS STAKEHOLDERS IN THE NSS.................................................................. 17
3.4.1 Uganda Bureau of Statistics (UBOS) ................................................................................17
3.4.2 National Integrated Monitoring and Evaluation Strategy (NIMES) ...........................17
3.4.3 Producers, Suppliers and Users of Statistics ....................................................................17
3.5 CURRENT COORDINATION ARRANGEMENTS ...................................................................... 18
3.6 DEMAND FOR DATA ........................................................................................................ 18
3.7 MAIN DATA TYPES ........................................................................................................... 18
3.8 SOURCES OF DATA.......................................................................................................... 22
4. VISION, MISSION, AND CORE VALUES OF THE NSS ........................................ 23
4.1 VISION OF THE NSS.......................................................................................................... 23
4.2 MISSION OF THE NSS ....................................................................................................... 23
4.3 KEY OUTPUTS OF THE NSS................................................................................................. 23
4.4 CORE VALUES AND PRINCIPLES ........................................................................................ 23
5. STRATEGIC GOALS........................................................................................ 25
5.1 STRATEGIC GOAL 1: STATISTICAL ADVOCACY ................................................................... 26
5.2 STRATEGIC GOAL 2: ORGANISATIONAL AND INSTITUTIONAL DEVELOPMENT ......................... 27
5.3 STRATEGIC GOAL 3: HUMAN RESOURCE MANAGEMENT AND DEVELOPMENT...................... 28
5.4 STRATEGIC GOAL 4: INFRASTRUCTURE DEVELOPMENT ........................................................ 29
5.5 STRATEGIC GOAL 5: INFORMATION TECHNOLOGY STRATEGY............................................. 30
5.6 STRATEGIC GOAL 6: DATA DEVELOPMENT AND MANAGEMENT.......................................... 31
5.7 STRATEGIC GOAL 7: DATA DISSEMINATION POLICY AND PLANS........................................... 32
5.8 STRATEGIC GOAL 8: COORDINATION OF CENSUSES AND SURVEYS .................................... 33
5.9 STRATEGIC GOAL 9: PRODUCTION OF ADMINISTRATIVE DATA ............................................ 34
5.10 STRATEGIC GOAL 10: STATISTICAL AUDITING FOR COMPLIANCE......................................... 35

NSS- PNSD, October 2006
ii
6. IMPLEMENTATION STRATEGY AND PLAN......................................................... 37
6.1 INVOLVE ALL KEY STAKEHOLDERS IN ALL START-UP ASPECTS................................................. 37
6.2 ESTABLISH THE INTER-AGENCY AND STEERING COMMITTEES................................................. 37
6.3 PROMOTE PARTNERSHIP AND COLLABORATION AMONGST KEY PLAYERS IN THE NSS ............ 37
6.4 PROMOTE OWNERSHIP OF THE NSS CONCEPT ................................................................... 37
6.5 INVOLVE DEVELOPMENT PARTNERS ................................................................................... 37
6.6 DEVELOP JOINT WORK PLANS FOR COLLECTING AND DISSEMINATING DATA ....................... 37
6.7 CAPACITY BUILDING........................................................................................................ 38
6.8 INSTITUTIONAL AND COORDINATION ARRANGEMENTS ........................................................ 38
6.9 IMPLEMENTATION ACTIVITIES............................................................................................. 40
6.10 MONITORING AND EVALUATION....................................................................................... 40
7. BUDGET AND FINANCING PLAN .................................................................. 40
ANNEX 1: PROGRAMME OF CENSUSES AND SURVEYS, 2005 - 2017................ 42
ANNEX 2: CHALLENGES, STRATEGIES AND PRIORITY ACTIVITIES FOR MDAS... 43
ANNEX 3: PNSD LOGICAL FRAMEWORK............................................................ 53

NSS- PNSD, October 2006
iii
ACRONYMS
ABI Annual Business Inquiry
AfDB African Development Bank
AIS Agricultural Information System
APIR Annual PEAP Implementation Review
BoU Bank of Uganda
CIS Community Information System
COBE Census of Business Establishments
CPI Consumer Price Index
CSO(s) Civil Society Organisation(s)
DENIVA Development Network of Indigenous Voluntary Associations
DfID Department for International Development (of the UK)
DQAF Data Quality Assessment Framework
ECA Economic Commission for Africa
EMIS Education Management Information System
EPRC Economic Policy Research Centre
FDI Foreign Direct Investment
FPOS Fundamental Principles of Official Statistics (of the UN)
GDDS General Data Dissemination System
GDP Gross Domestic Product
GFS Government Finance Statistics
GIS Geographical Information System
HBS Household Budget Survey
HMIS Health Management Information System
HMN Health Metrics Network
IAC Inter Agency Committee
ICT Information and Communication Technology
IFMIS Integrated Financial Management Information System
IHS Integrated Household Survey
ISAE Institute of Statistics and Applied Economics
IT Information Technology
LG Local Government
LoGICS Local Government Information Communication System
M&E Monitoring & Evaluation
MAPS Marrakech Action Plan for Statistics
MDAs Ministries, Departments and Agencies
MDG(s) Millennium Development Goal(s)
MFPED Ministry of Finance Planning and Economic Development
MIS Management Information System
NSS- PNSD, October 2006
iv
MISR Makerere Institute of Social Research
MoU Memorandum of Understanding
MTEF Medium Term Expenditure Framework
MTR Mid-Term Review
NAADS National Agricultural Advisory Services
NEMA National Environment Management Authority
NGO(s) Non Governmental Organisation(s)
NIMES National Integrated Monitoring and Evaluation Strategy
NPA National Planning Authority
NSDS National Strategy for the Development of Statistics
NSS National Statistical System
OPM Office of the Prime Minister
PARIS21 Partnerships in Statistics for Development in the 21st Century
PASS Permanent Agricultural Statistics System
PAYE Pay As You Earn
PCF Private Capital Flows
PEAP Poverty Eradication Action Plan
PHC Population and Housing Census
PMA Plan for Modernisation of Agriculture
PMAU Policy Monitoring and Analysis Unit
PNSD Plan for National Statistical Development
PSR(s) Poverty Status Report(s)
SA Statistical Abstract
SDDS Special Data Dissemination Standards
SNA System of National Accounts
SSC(s) Sector Statistics Committee(s)
SSPS Sector Strategic Plan for Statistics
SWOT Strengths, Weaknesses, Opportunities and Threats
TFSCB Trust Fund for Statistical Capacity Building
TR Terminal Review
UBOS Uganda Bureau of Statistics
UK United Kingdom
UN United Nations
UNHS Uganda National Household Survey
UPPAP Uganda Participatory Poverty Assessment Programme
URA Uganda Revenue Authority
VAT Value Added Tax
VRS Vital Registration System
WPS Working Papers Series

NSS- PNSD, October 2006
v
FOREWORD
The Government of the Republic of Uganda is committed to the
principle of Results-Oriented-Management and achievement of
development results targeted towards reducing poverty, and
supporting sustainable and equitable economic growth. Quality
statistical information is required to better define and measure
development outcomes, identify development issues, inform policy
design and debate, and facilitate planning, implementation,
monitoring and measuring of the impact of development
interventions. Managing for results has brought to the fore critical
inter-related challenges facing the National Statistical System. These
challenges include, but are not limited to: capacity for collecting and managing adequate
data; analysing and transforming the data; and ensuring the systematic flow and usage of
the resulting information for evidence-based policy formulation and decision-making.
The challenges are critical and are best dealt with in a holistic way, taking into account key
stakeholder and sectoral concerns. This Plan for National Statistical Development (PNSD) has
been designed in a consultative and inclusive manner to provide a unified framework for
addressing these challenges. It is important to note that this Plan which is anchored in the
PEAP, MDGs and other development initiatives uses Sector Strategic Plans for Statistics (SSPS)
which were developed in the context of this Plan as building blocks. Indeed the
implementation of the Plan must go hand in hand with the implementation of the sector
plans. The uniqueness of the Uganda Plan for National Statistical Development is that it
mainstreams sector and cross-sectoral issues and concerns in statistical development.
As is the case with any development activity many resources are required. Concerted effort is
required to ensure that the PNSD and the initiatives that it will support are fully and
appropriately implemented.
I would like to thank all those who have participated
in producing this document, and hope that they will continue to show the same vision and
enthusiasm during the implementation of the Plan.
Head of Public Service and Secretary to the Cabinet
Government of Uganda

NSS- PNSD, October 2006
vi
PREFACE
The Government of the Republic of Uganda has always looked forward to
the establishment of an integrated National Statistical System (NSS) in
which all key stakeholders are brought together in the production,
dissemination and use of statistics. The ever-increasing demand for
comprehensive, accurate, reliable, and timely statistics has made
collaboration among data producers and users more critical now than
ever before. The NSS has to produce statistics that respond to the priority
needs of the country and are in line with the government’s development
programmes.
The Plan for National Statistical Development (PNSD) presents an assessment of the NSS status,
and the strategic issues to be addressed during a 5-year implementation period. It provides a
framework for development and ownership of statistics in the country. Implementation of the
Plan will require: revising the legal framework governing statistical production; developing
organizational structures and coordination mechanisms; raising general awareness about
statistics; embracing change and knowledge management; improving staff motivation;
promoting team work, developing business plans; reviewing and implementing IT policies and
strategies; developing dissemination policies; creating quality consciousness; and mobilizing
financial resources at all levels.
The plan is organised in six chapters. Chapter one briefly describes the national economy
and development frameworks. Chapter two presents the framework under which the PNSD
was developed while Chapter three looks at the current status of the NSS with a detailed
description of the NSS concept. In chapter four, the vision, mission and the strategic
objectives of the plan are presented followed by the strategic goals in chapter five. Chapter
six outlines the implementation strategy including monitoring, evaluation and reporting
mechanisms, and, the budget and financing plan, sector specific challenges and the PNSD
Logical Framework are found in chapter seven and Appendix respectively.
John B. Male-Mukasa Executive Director Uganda Bureau of Statistics

NSS- PNSD, October 2006
vii
EXECUTIVE SUMMARY
1. Introduction and Background
The Uganda Bureau of Statistics (UBOS) was created as a semi-autonomous agency of
government under the UBOS Act 1998. This reform was intended to ensure more impartial
and credible collection, analysis and publication of integrated, relevant, reliable and timely
official statistics, and to constitute a coordinating, monitoring and supervisory body for the
National Statistical System (NSS).
Despite the reform, Uganda’s NSS is still fragile and vulnerable due to a number of challenges
including: organizational and institutional weaknesses; unpredictable and insufficient funding;
data gaps on key indicators; inadequate infrastructure; unsatisfactory data flows; and under
utilization of existing data. The Plan for National Statistical Development (PNSD) is designed to
address these shortcomings in the next five years. In particular, the PNSD aims at:
• strengthening the production of quality statistics based on international best practice
and guidelines,
• improving coordination and promoting synergy among and between data producers
and users,
• strengthening national capacity to produce, analyze and use reliable statistics
through an integrated NSS, and
• ensuring the long term sustainability of the NSS by securing funding for priority data
production, analysis and dissemination.
2. The Plan for National Statistical Development (PNSD)
The PNSD covers 5 years (2006/7 – 2010/11) and provides a framework and mechanisms for
further reform of the NSS and acceleration of statistical development in Uganda. The
purpose is to develop an integrated, harmonised, coordinated and coherent NSS which
ensures unified data production processes. It covers the entire National Statistical System and
draws together all data producing sectors and users. These include among others line
Ministries, Departments and Agencies (MDAs) which produce data from censuses, surveys
and administrative systems. While the PNSD has been designed to strengthen the NSS to
effectively address and meet the national, regional and international data needs, it
emphasises production of quality data to inform national development priorities.
Accordingly, the PNSD is anchored in the PEAP, which is Uganda’s national development
framework, and the MDGs. To ensure ownership and effective implementation the Plan was
designed in a participatory and consultative manner with key data producers, data users,
researchers, training institutions and development partners.
One important step in the PNSD process was the comprehensive assessment of the current
status of the NSS including its challenges. The challenges identified related to:
• organizational and institutional framework (including statistical legislation) for
production of official statistics;
• linkages and co-ordination arrangements among producers and between producers
and users of statistics;
• current and future user needs;
• existing capacity (institutional, infrastructural, technical and resources) to meet these
needs and fill existing capacity gaps;

NSS- PNSD, October 2006
viii
• how statistics are collected, processed and analysed;
• methods and procedures, adherence to international standards, etc.; and
• how statistical data are disseminated and archived (IT policies, standards and
databases).
Based on the challenges identified, strategies were developed to strengthen the NSS.
3. Challenges and Strategies
3.1 Statistical awareness
There is limited statistical awareness and inadequate attention to appreciation of statistics by
policy makers and decision makers at different levels and across society. In order to address
this challenge, UBOS will extensively and consistently improve numeracy in society (creating a
knowledge-based information society), and make a general case for statistics as a necessary
requirement for policy formulation and decision-making at all levels.
3.2 Organisational and institutional development
The current organisational and institutional framework does not allow the NSS to operate
efficiently and meet user data requirements. The existing legal framework is focused on UBOS
but does not provide mechanisms for it to effectively discharge its responsibility of
coordinating and supervising the NSS. There is also limited coordination within and across
agencies. This has made it difficult to comprehensively assess user data requirements and to
uniformly develop capacity and standards for generation and use of statistics. Within the
framework of the PNSD, formulation of new legislation and institutional re-engineering to
improve coordination and synergy will be undertaken. Key among institutional re-organisation
strategies will be the possibility of re-establishing a Common Statistical Service and setting up
a NSS Resource Centre.
3.3 Human resource development and management
Skills gaps in a number of areas as well as lack of motivation among professional staff in the
sectoral ministries widely exist. The following strategic actions, among others, will be
undertaken:
• design a human resource management and development strategy for all categories
of practitioners and users of statistics.
• enhance collaboration between data producers and research and training
institutions.
• support the Uganda Statistical Society (USS) to promote professional development
and ethical standards among statisticians, and to facilitate information sharing
among its members.
3.4 Infrastructure development
Most MDAs have inadequate statistical and supportive infrastructure. The PNSD will facilitate
the identification and acquisition of the infrastructure required for each sector for effective
production of quality statistics.
NSS- PNSD, October 2006
ix
3.5 Data Development
There is inadequate capacity for identifying and responding to emerging data needs and
difficulty in linking statistics to policy processes. Insufficient coordination is leading to extensive
duplication of effort and lack of synergy among data producers. Inadequate information
flow and sharing within and across sectors, and between central and local government levels
limits the usefulness of data and statistics.
The strategy under PNSD is to ensure continuous dialogue between data users and
producers, link and sequence surveys, censuses and administrative data collection to policy
processes, and to strengthen collaboration among key players in data systems.
In addition, periodic statistical audits of all key data systems in the country will be undertaken;
and standards and guidelines for official statistics and products will be developed and
harmonised to ensure they meet the quality requirements.
3.6 Data dissemination policy and plans/data accessibility
A lot of data in sectors is not disseminated for general use and is not readily accessible.
Strategies aim at increasing access to statistical data and information as a “public good”,
and empowering existing and potential data users to access and effectively utilise data.
4. Implementation, Monitoring, Reporting and Evaluation
The PNSD implementation will involve revising the legal framework and promoting joint action
and sharing/pooling of resources. An NSS Steering Committee and an Inter-Agency
Committee will be created. The statistics units in MDAs will be re-organised and where they
do not exist, will be created. System-wide and specific monitorable indicators will be
developed to track progress of statistical production and strengthening of the statistical
system across the NSS.
Quarterly progress reports relating to the implementation of SSPSs, and annual, joint mid-term,
and terminal reviews will be conducted. The reviews will involve all key stakeholders and
report on the overall PNSD implementation status.
5. Budget and Financing
The estimated cost for implementing the PNSD is UGShs. 56.9 billion or US$ 28.4 million in the
first three years. The budget will be annually reviewed and revised in line with the MTEF
planning and budgeting process. The PNSD is expected to be financed by the government
with contributions from development agencies.

NSS- PNSD, October 2006
10
1. BACKGROUND
1.1 Economic and Social Setting
Uganda has attained good progress in economic growth and development since the 1990’s.
Programmes such as the Poverty Eradication Action Plan, Universal Primary Education, Plan for
Modernisation of Agriculture, the Basic Minimum Health Package and “Wealth for All”, plus
reforms such as decentralisation and economic liberalisation have been instrumental in bringing
about positive socio-economic change. This progress is manifested in the improvements in many
of the development indicators, including per capita GDP growth and poverty reduction.
On average, the economy has grown at a rate of 5.9% per annum over the last 15 years.
Nevertheless, the economy remains characterized by low levels of income as shown by per
capita income of about US$ 300 and the revenue/GDP ratio of about 11.3%. Agriculture still
engages 80% of the labour force and most industries and services are agro based. The
contribution of agriculture to total GDP decreased from 37.4% in 2000/01 to 33.0% in 2004/05. The
key social indicators as at 2002 (Population and Housing Census) were as follows; Infant Mortality
Rate of 87 deaths per 1000 live births; literacy rate of 70% (for persons aged 10 years and above);
and 61% of the households had access to safe water supply.
The Poverty Eradication Action Plan (PEAP) is Uganda’s national development framework. It
guides public action towards eradication of poverty. Poverty in Uganda is characterised by
limited human development as expressed in terms of low incomes; lack of basic needs and
services such as food, clothing, bedding, shelter, basic healthcare and education; powerlessness
and the inability to influence one’s own condition and social exclusion. The PEAP provides the
framework within which sectors develop detailed plans for addressing these and other dimensions
of poverty.
1.2 The Case for Statistics in the National Planning Framework
National development is most effective if the macro planning process is integrated through
alignment of supply and demand for goods, services and intellectual capital. For this to happen
there must be a framework for coordinating, streamlining and harmonizing the activities of
government, business, labour and civil society to work in partnership towards a common purpose.
In Uganda, the National Planning Authority (NPA) is responsible for integrated national planning.
The long-term vision that is guiding all planning frameworks is to transform Uganda into a modern
industrialised and knowledge-based society, by the year 2035.
The national policies and plans, such as the PEAP, must be based on good statistics (i.e. statistics
that are comprehensive, accurate, informative and meet the needs of their users) if Uganda is to
address its development challenges effectively. Good statistics provide a sound basis for making
choices over competing demands and for deciding over allocation of scarce resources. They
provide sub-national, national level planners and managers with critical insights into macro and
micro development patterns and trends, without which they cannot develop effective and
realistic policies and plans or take corrective action in time. They are important for the
implementation of national and sub-national plans and programmes. Statistics support
measurement of inputs, outputs, outcomes and impact. They also provide reliable assessments of
key economic and social indicators, and cover all aspects of development ranging from
measures of economic output and price inflation, to the well-being of individuals. 1
Uganda’s development frameworks and sectoral strategies have to be monitored to ensure that:
inputs are of the right quality; the procedures and operational mechanisms are appropriate to
deliver the intended outputs; and the intended outputs are of the right quantity and quality to
deliver development outcomes. Other than the outcome and impact indicators which require
information from census and survey data, the inputs, process and output indicators rely on
1 Paris 21 Secretariat, National Strategy for the Development of Statistics (NSDS) Documentation (2004
Version), p.2.

NSS- PNSD, October 2006
11
information administratively generated by MDAs and their partners. The whole essence of the
PNSD is to have all these processes well coordinated and synchronised.
Presently, MDAs and other significant players in the economy produce and use statistics. The
efforts of all these players are not sufficiently coordinated and harmonised to ensure data
consistency, quality and effective use. Consequently, this has led to duplication of effort,
wastage or misallocation of resources, thus costly and unsustainable development policies and
programmes. Monitoring and evaluation has also been difficult due to inconsistent and
incomparable data sets.

NSS- PNSD, October 2006
12
2. THE PNSD PLANNING PROCESS
The PNSD is being developed as a framework for strengthening statistical capacity across the
entire NSS for results-based management. It will provide an integrated framework within which
different stakeholders will generate, disseminate and use statistics that are credible, meet their
individual needs and provide a sound basis for national planning and development. In particular
the PNSD will:
(i) strengthen the production of quality statistics based on international best practice and
guidelines to support national development initiatives and programmes
(ii) improve coordination and promote synergy among and between data producers and
users
(iii) strengthen national capacity to produce, analyze and use reliable statistics through an
integrated NSS.
(iv) ensure long term sustainability of the NSS by securing funding for priority data
production, analysis and dissemination.
The Uganda PNSD has its roots in the Second International Roundtable on Managing for
Development Results, held in Marrakech, Morocco, in February 2004. The Marrakech Action Plan
for Statistics (MAPS) set a target for all low-income countries to have designed NSDS by 2006 and
to have started to implement them by 2007 in order to have high quality, locally produced data
for the next major review of the MDGs in 2010.
The Uganda Bureau of Statistics (UBOS), with support of development partners, coordinated the
preparation of the statistical development strategy for the entire National Statistical System which
has culminated in this document – the Plan for National Statistical Development.
The PNSD design was phased with the initial phase covering the Ministries of: Health; Education
and Sports; Agriculture, Animal Industry and Fisheries; Labour, Gender and Social Development;
Local Government; Trade, Tourism and Industry, as well as the Bank of Uganda and the Uganda
Police Force and UBOS. The second phase covers the Ministry of Water and Environment (MoWE);
Ministry of Energy and Mineral Development (MEMD); Ministry of Justice and Constitutional Affairs
(MoJCA); Ministry of Works and Transport (MoWT); Ministry of Finance, Planning and Economic
Development (MFPED); Ministry of Lands, Housing and Urban Development (MLH&UD) as well as
the Uganda National Council for Science and Technology (UNCST), the Uganda Revenue
Authority (URA); the Civil Aviation Authority (CAA); Development Network for Indigenous Voluntary
Associations (DENIVA) and the Department of Meteorology.
Each participating MDA prepared a sector-specific statistical strategy which identified priority
data needs as well as the challenges faced in current data production and ways to address
these challenges. Sector strategies also include an implementation strategy for improving
statistics through a time bound plan, a financing strategy and a monitoring and evaluation
framework (including indicators) to assess implementation progress. The following steps were
taken in designing the Sector Strategic Plans for Statistics (SSPSs):
Step 1 – Sensitisation of Key Stakeholders
This step preceded the design process to create awareness of the PNSD concept and
generate initial commitment from managers, policy makers and staff.
Step 2 – Launching of the PNSD Concept
The PNSD concept was officially launched to kick start the process. Similarly, a PNSD Bulletin
was established as a medium for updating stakeholders about progress and planned
activities.

NSS- PNSD, October 2006
13
Step 3 – The Road Map
The Road Map outlining the tasks, key activities, timelines and responsible actors was
developed.
Step 4 – Sector Statistics Committees (SSCs)
SSCs were initiated and constituted within MDAs to facilitate internal coordination of the sub-
sectors during the design of the SSPSs. In addition, an Inter Agency Committee (IAC) was
formed and provided a facilitated platform for sharing lessons and experiences among
MDA representatives in addition to enhancing skills.
Step 5 – Assessment of the Current Status of Statistics
User needs were assessed through discussions with key data users in various user consultative
workshops and review sessions. These fora enabled MDAs and their respective data users to
agree on the modalities of prioritising needs and corresponding data supply. Furthermore,
statistics production processes were reviewed using data production and quality assessment
formats. In addition, a SWOT Analysis was conducted to assess the capacity of MDAs to
produce adequate, complete, timely and accessible statistics.
Step 6 – Drafting MDA Sector Strategic Plans for Statistics
A report outline was developed and discussed with MDA statistical committees. The
Committees undertook a visioning exercise and generated plans covering 5 years with a 3
year implementation plan in line with the Medium Term Expenditure Framework (MTEF) and
a 1 year detailed costed action plan to kick start the implementation process. MDAs costed
their plans – which were eventually consolidated into a budget for the PNSD. A budgeting
seminar was held to empower MDA representatives and accounting officers with skills in
preparing realistic budgets and financing plans.
Step 7 – Stakeholder approval and finalisation of PNSD and SSPS
A stakeholders’ workshop was convened to discuss the key features of SSPS. This provided a
platform for interactive discussions and synthesis of emerging issues, strategies and
recommendations. A high level seminar was attended by MDAs accounting officers, policy
makers, technical managers and development partners in which the emerging issues and
strategies were discussed and an action plan agreed on. The final PNSD was peer reviewed,
refined, published and launched.

NSS- PNSD, October 2006
14
3. THE NATIONAL STATISTICAL SYSTEM
3.1 The Concept of a National Statistical System
Section 2 of the UBOS Act 1998 defines the NSS as including all agencies in Uganda, whether
government or not, responsible, whether under any enactment or otherwise, for gathering
statistical data directly through surveys or through administrative action. This statement does not
mention the users of statistics as part of the NSS. However, the Act defines an “Agency” as
including a Ministry, Department or any other organ of government, a local authority or an
agency of a local authority and generally, any other user or provider of statistics.
Statistical production including dissemination and usage of statistical products is a venture that
requires collaborative effort (teamwork) with a broad spectrum of the population (the society)
being involved in different functions. The team consists of producers, users and suppliers/providers
of data/statistics, who compile, use and supply the raw materials (data) respectively. It should be
noted however, that each group is involved to varying degrees in the functions of the others. The
significant entities within these broad categories and their inter-related functions constitute the
National Statistical System (NSS) of a country. The NSS is steered and coordinated by a national
statistical agency, which, in Uganda’s case, is the Uganda Bureau of Statistics.
The players in the National Statistical System are defined more specifically as follows:
Producers: These include data production agencies in the Public Sector – Central (National)
statistical agency, the statistical units in line Ministries, Departments and Executive Agencies
(MDAs), and public institutions such as the central bank. There are other producers of
statistics in the private sector, NGOs, civil society organizations and training and research
institutions.
Users: These cover policy formulation/ decision-making institutions and development
framework designers across government in the Ministries, Departments, Agencies,
Parastatals and other Public Institutions as well as Private Sector Companies, NGOs and
CSOs, Researchers, Development Partners and International Organizations, Regional
Organizations and Individuals in the Society. Other users of statistics and data within the NSS
include the Media due to its involvement in advocacy and information dissemination
through the publication of press releases and briefings.
Suppliers/Providers: These include establishments/institutions in the public sector, business
establishments in the private sector, NGOs, informal sector establishments, private
households, persons/individuals within the society.
Statistical training institutions/centres: These contribute to skills development of the
producers and users of data.
The essence of establishing a National Statistical System is to bring all players in the data
production industry together, working as a team. This consequently results in the generation of
coherent, reliable and demand-driven data products in an efficient manner to support
management and development initiatives including policy formation and critical decision-
making. The Central Statistical Agency of the NSS has the responsibility to coordinate all key
players institutionally, technically and with respect to their programmes and budgets in order to
organize an integrated system of socio-economic statistics for the country.
NSS- PNSD, October 2006
15
3.2 Characteristics of a Good National Statistical System
A good NSS has relatively uniform capacity for generation and use of statistics in its constituent
parts. The system operates with impartiality in data collection and releases, ensures confidentiality
of supplied data, and acts with objectivity, transparency, integrity and independence in all its
operations. The elements of the system produce relevant data (through users and producer
interaction), turn data into information through policy/research analysis and ensure timeliness of
data release as a result of good cooperation between, and responsiveness of, suppliers to the
producers.
Extensive statistical advocacy about the importance of statistics to the society and wide spread
dissemination of data to the public are roles carried out by the media while training institutions
ensure that there is effective and relevant capacity building. The entire NSS players are quality
conscious in that, data being generated in the system pass the assessment tests across all the
quality dimensions – relevance, accuracy, completeness, consistency, timeliness, accessibility and
appropriate levels of disaggregation.
In the context of these characteristics, a SWOT analysis of the Uganda NSS was carried out. The
results of this analysis are summarised in Box 1.
3.3 Regulatory Framework for Statistics
An effective NSS is underpinned by an appropriate statistical legislation. Such legislation should
provide for an enabling institutional and regulatory framework for production and management
of official statistics; and ensure professional independence of a national statistical agency and
other agencies within the NSS to enhance the integrity, and impartiality and credibility of official
statistics as well as data confidentiality.
The demand for statistics has grown tremendously in response to the social, economic and
political developments in the country especially since the 1990s. In order for the NSS to meet this
demand in an efficient and effective manner, the Uganda Bureau of Statistics was established by
an Act of Parliament in 1998 as a semi-autonomous body. However, the Act does not
appropriately empower UBOS to perform the supervisory role. This is largely due to the following
reasons:
� Other players in the NSS have regulations from which they derive their mandate. The
current UBOS Act does not state in explicit terms which Act prevails over the other with
respect to statistical production. This is especially the case for Local Governments and
Line Ministries.
� The current Statistical Act is essentially a UBOS Act and not for the entire NSS. Although
the NSS is alluded to in the Act, it is not sufficiently articulated in its current form. In
particular, it does not mention the users of statistics – instead it emphasizes those
involved in gathering statistical data directly through surveys or through administrative
action.

NSS- PNSD, October 2006
16
Box 1: Strengths, Weaknesses, Opportunities and Threats of the NSS
Strengths
• Semi-autonomous status of UBOS (a relatively strong, well-managed and resourced institution at the centre of the NSS) enhances the impartiality and credibility of official statistics and creates opportunities for hiring and retaining highly trained and skilled personnel.
• Stakeholders of the NSS are known and they recognize the various synergies across the different MDAs. The Sectors/Institutions also acknowledge the need for a strong NSS.
• Competencies or unique capabilities give some institutions comparative advantage over others in performing certain statistical tasks (e.g. conducting large scale surveys and censuses by UBOS, undertaking school censuses by the MoES, and compiling data on disease burden by the MoH).
• Existence of the ISAE at Makerere University that guarantees high quality training for the NSS,
• Existence of specialized research and analysis centres [e.g. EPRC, PMAU, MISR] that make great contribution in policy-related analysis of existing data.
Weaknesses
• Limited coordination and collaboration among MDAs because of largely informal institutional linkages.
• Lack of joint programmes and comprehensive plans for data collection, analysis and dissemination which lead to duplication of efforts and wastage of scarce resources.
• Lack of awareness of the value of statistics by policy makers and the general public leading to inadequate resource allocation for collection, analysis and dissemination of statistics.
• Varying degrees of data accuracy among and within sectors due to limited training of staff in data collection and management, lack of standards, methodologies and definitions, multiple data sources and inadequate coordination of data generation processes.
• Incomplete data due to inadequate content and geographical coverage arising out of lack of resources to undertake surveys, weak standards and limited compliance, and spatial omission from data generation exercises due to civil strife.
• Inconsistency of data due to differences in methodologies and collection, analysis and interpretation of data dictated by differing objectives, mandates and resource outlay.
• Delays in submitting data and information due to limited personnel, funds and facilities, lack of release calendars, bureaucratic constraints which prevent the production of statistics in a timely manner, lack of a statistical culture and inadequate statistical advocacy, insufficient coordination of the NSS and feedback mechanisms, conflicting mandates, competing Management Information Systems e.g. LOGICS, EMIS, HMIS.
Opportunities
• Emphasis on evidence-based policy-making and results-based agenda (PEAP, MDGs, and other national and sectoral development initiatives) has increased demand for statistics both nationally and internationally in terms of quantity, type and quality.
• Existence of international frameworks, increased international cooperation and partnerships for statistical development and sharing experiences, good practice and facilities with other countries.
Threats
• Insecurity and conflict that affects the completeness and comprehensiveness of data collected across all sectors and the entire NSS
• Varying reporting requirements by donors that are not harmonized with the national reporting standards.
• Limited awareness by policy makers, decision makers and the general public about the role of statistics in national development
• Limited funding of the NSS due to low prioritization of statistical production.

NSS- PNSD, October 2006
17
3.4 Roles of Various Stakeholders in the NSS
Other than UBOS, which is the coordinator and producer of mandatory and non mandatory
statistics, there are several other players in the production and use of statistics in Uganda. They
include: the National Integrated Monitoring and Evaluation Strategy (NIMES) secretariat, Ministries,
Departments and Executive Agencies, the Private Sector, Non-Governmental Organizations and
Development Partners.
3.4.1 Uganda Bureau of Statistics (UBOS)
UBOS’s mandate is to develop and maintain the NSS to ensure collection, analysis and
dissemination of integrated statistical information and to act as a coordinating, monitoring and
supervisory body for the entire system. The Bureau’s diverse responsibilities include:
� Providing high quality central statistical information services on social, environmental and
economic conditions in the country.
� Promoting standards in the collection, analysis and publication of statistics to ensure
uniformity in quality, adequacy of coverage and reliability of the statistical system.
� Providing guidance, skills development and other assistance as may be required by
other users and providers.
� Promoting cooperation, coordination and rationalization among users and providers at
national and local levels to avoid duplication of effort and ensure optimal utilization of
scarce resources.
� Promoting and being the focal point of cooperation with statistics users and providers at
regional and international levels.
� Ensuring that agreed standards and methods of data collection, and analysis are
adopted and maintained.
� Sharing programmes across the NSS to maximize on the synergies and supporting other
key stakeholders that may not be able to participate in the NSS.
3.4.2 National Integrated Monitoring and Evaluation Strategy (NIMES)
The NIMES Secretariat is located in the Office of the Prime Minister (OPM) which is functionally
responsible for coordination, monitoring and evaluation of GoU policies, programmes and
projects. The NIMES is a framework for ensuring that the culture of evidence-based decision-
making is entrenched in the public sector. It aims at harmonizing existing systems of data
collection, reporting and review in order to encourage, facilitate and promulgate the use of
Monitoring and Evaluation information in policy making and resource allocation at all levels of
government in Uganda. Its key objectives are to:
� ensure that a sound evidence base is available to inform decision making in national
policy frameworks such as the PEAP.
� enhance M&E capacity in Uganda.
� ensure that key stakeholders have a forum for articulating data and information needs.
� coordinate M&E initiatives in Uganda by providing mechanisms which align the existing
M&E initiatives with identified data and information needs
3.4.3 Producers, Suppliers and Users of Statistics
Other producers, suppliers and users of statistics in Uganda are varied according to their
mandates and responsibilities. Government Ministries issue policies and regulations, set standards, inspect, supervise, monitor and evaluate performance, and provide technical support and
advice to local governments to enable them to execute their mandate. Local Governments are a
NSS- PNSD, October 2006
18
key source of statistics arising out of administrative action. Civil Society in performing their functions, produce and use data and statistics to monitor programmes and for advocacy and
awareness purposes, thus helping raising the profile of statistics in the country. The Private Sector on the other hand seeks for statistics to make sound investment decisions. The private sector also
produces data and is an important source of statistical information especially from surveys of
establishments and enterprises.
The public service reform programme created a number of Departments and Executive Agencies that operate more or less independently of their parent Ministries. These generate and use
statistics in the process of undertaking their work. The Media help in raising the profile of statistics by using data to support their reports and by publishing statistics regularly. Training and Research Institutions play a role in statistical capacity development through training, using statistics and by participating effectively in mining of statistics databases through policy related research and
analysis. Development Partners (Donors), for their part, provide funding and technical assistance. They also use statistics to identify sectoral areas that need financial and technical support, and to
monitor development results.
3.5 Current Coordination Arrangements
Institutionally, the NSS brings together all key stakeholders and institutions in the field of producing,
supplying and using statistics. UBOS is the agency responsible for coordinating, monitoring and
supervising the NSS in Uganda, and ensuring that international and national standards are
adhered to. Presently, the linkages within the NSS are inconsistent, informal and relatively weak.
There is no comprehensive common understanding of the actual implications of the activities of
one sector with respect to others.
Nevertheless, there is consensus that coordination and collaboration among data producers and
users is needed to (i) prevent duplication of effort and generation of inconsistent data, (ii)
achieve cost-effectiveness in utilization of scarce resources, (iii) avoid working at cross-purposes,
and (iv) produce higher quality data.
3.6 Demand for Data
While challenges for data supply have been well articulated and strategies for dealing with them
reasonably developed, the data demand situation is not adequately understood. It is not only
important to clearly identify the needs for data in the existing development frameworks, but also
necessary to recognise that new initiatives will require data. The issues of adequacy and timeliness
of data must be addressed to ensure effective formulation, monitoring and evaluation of policies
and development outcomes.
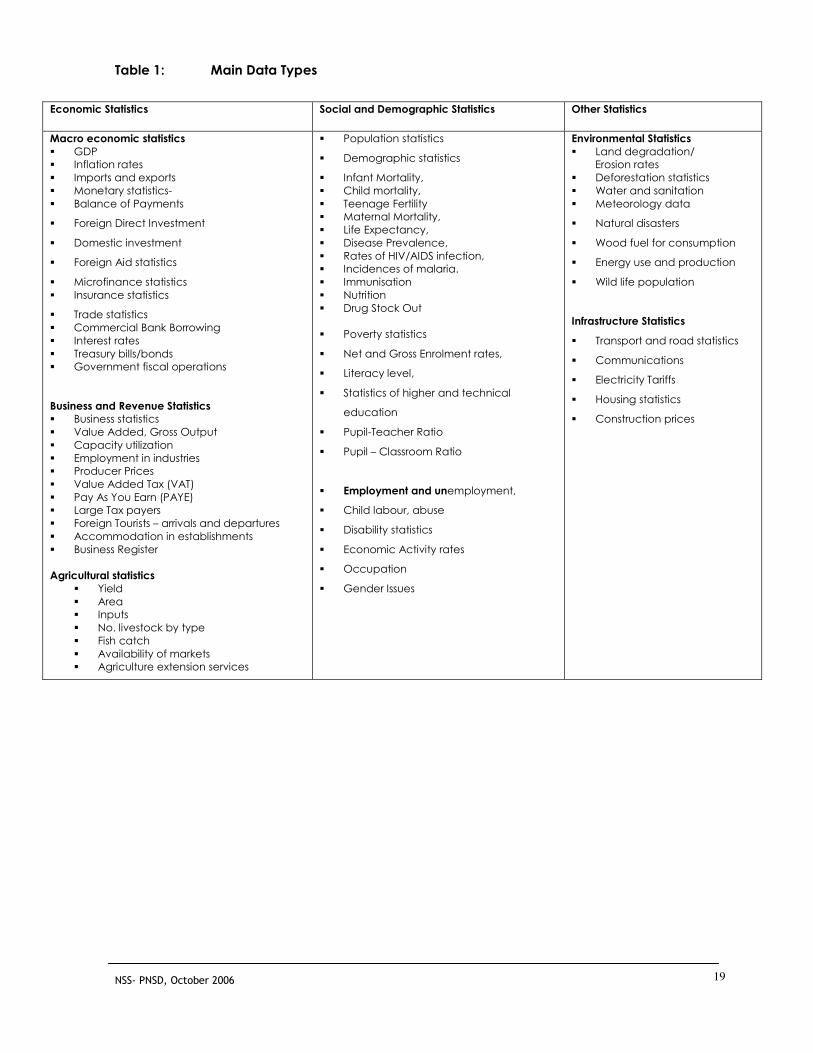
3.7 Main Data Types
The NSS is mandated to provide statistical information on the basis of Economic, Social, and
Demographic data (Table 1 and Box 2) collected from different sources. On the basis of these
statistics, key social and economic indicators (Table 2) are generated by the NSS.
NSS- PNSD, October 2006
19
Table 1: Main Data Types
Economic Statistics Social and Demographic Statistics Other Statistics
Macro economic statistics � GDP � Inflation rates
� Imports and exports
� Monetary statistics-
� Balance of Payments
� Foreign Direct Investment
� Domestic investment
� Foreign Aid statistics
� Microfinance statistics
� Insurance statistics
� Trade statistics
� Commercial Bank Borrowing
� Interest rates
� Treasury bills/bonds � Government fiscal operations
Business and Revenue Statistics � Business statistics
� Value Added, Gross Output
� Capacity utilization
� Employment in industries � Producer Prices
� Value Added Tax (VAT)
� Pay As You Earn (PAYE) � Large Tax payers
� Foreign Tourists – arrivals and departures
� Accommodation in establishments
� Business Register
Agricultural statistics � Yield
� Area � Inputs
� No. livestock by type
� Fish catch
� Availability of markets � Agriculture extension services
� Population statistics
� Demographic statistics
� Infant Mortality,
� Child mortality,
� Teenage Fertility � Maternal Mortality,
� Life Expectancy,
� Disease Prevalence,
� Rates of HIV/AIDS infection, � Incidences of malaria.
� Immunisation
� Nutrition
� Drug Stock Out
� Poverty statistics
� Net and Gross Enrolment rates,
� Literacy level,
� Statistics of higher and technical
education
� Pupil-Teacher Ratio
� Pupil – Classroom Ratio
� Employment and unemployment,
� Child labour, abuse
� Disability statistics
� Economic Activity rates
� Occupation
� Gender Issues
Environmental Statistics � Land degradation/ Erosion rates
� Deforestation statistics
� Water and sanitation
� Meteorology data
� Natural disasters
� Wood fuel for consumption
� Energy use and production
� Wild life population
Infrastructure Statistics
� Transport and road statistics
� Communications
� Electricity Tariffs
� Housing statistics
� Construction prices

NSS- PNSD, October 2006
20
Box 2: Key Economic Statistics Generated by the Uganda NSS
National Accounts data: UBOS currently compiles Annual GDP estimates using SNA 68. There is a progressive migration to SNA 93 and compilation of Quarterly GDP. The Producer Price Index for Manufacturing already in
production will be a direct input to the QGDP and annual GDP. Construction of the supply and use tables shall be
completed in FY2005/2006 for the compilation of Input-Output tables. National Accounts utilize information from several sources. Virtually all the information generated by UBOS is an input into national accounts. In addition,
information is also collected from other agencies and institutions within the NSS or posted to UBOS through electronic
mail. The process of establishing and producing quarterly GDP series will continue and shall become a regular series
of UBOS. Progress has also been made in producing the Social Accounting Matrix (SAM) using information from the Supply and Use Tables (SUT) as well as the input-output tables, and the final SAM shall be ready by the financial year
2007/2008.
Government Finance Statistics (GFS): Government Finance statistics are collected from central government ministries and local government authorities. The information collected is a major input to the GDP expenditure aggregates, and widely used by BOU, MFPED, IMF and the general Public. Plans to expand GFS to sub-counties
(lowest level of local government that receive funds from central government) are underway.
Consumer Price Statistics (Inflation Measure): UBOS collects prices of consumer goods and services from 6 urban centers for computing inflation rates and is disseminated on the last working day of every month. Plans are
underway to expand coverage to include another urban centre and at least 4 rural centres. This will provide a
Consumer Price Index (CPI) that better reflects price movements for the different income levels as well as the rural
and urban prices. Rebasing of the CPI from 1997/08 to 2005/2006 has commenced.
Trade statistics: Statistics on imports and exports are useful in monitoring the direction of trade among other factors. Uganda Revenue Authority (URA) compiles most trade statistics and is an administrative source for other MDAs.
Plans are underway to automate customs stations with the EUROTRACE software. Other related statistics are
collected through the Informal Cross Border Trade (ICBT) Survey by UBOS in collaboration with Bank of Uganda (BOU) and URA. Trade statistics are useful in computing GDP, Balance of Payments (BOP), and Current Accounts. UBOS
plans to produce Import Price Index in 2007/08 for importing companies following the completion of an Enterprise
survey, and plans to establish a Wholesale and Retail price index are underway.
Index of Industrial Production (IIP): UBOS collects production data from a sample of manufacturing business establishments spread out in the industrial belt of the country. Information obtained is used to compile the Major
and Main Index of Industrial Production (IIP). The Major IIP is a monthly index based on the major manufactured
goods while the Main index is a quarterly index covering about 200 business establishments. UBOS plans to produce
an Index of Production (IoP) covering manufacturing, utilities, mining and quarrying sectors. In addition, a new sample for IIP is to be drawn and the current IIP rebased.
Producer Price Index (PPI): UBOS collects producer prices (factory gate prices) from a sample of manufacturing establishments located in different parts of the country and undertaking manufacturing activities as classified by
International Standard Industrial Classification (ISIC) Rev III. Price information obtained is used to compute the Producer Price Index for Manufacturing (PPI-M) which is used as a measure of short time inflation for different types of
production, thus a great utility in informing decision making throughout the private sector. It is a quarterly index
disseminated during the 10th week after the preceding quarter. There are intentions to expand the PPI to cover other sectors such as the informal Manufacturing, Agriculture, Utilities, Mining and Quarrying and Hotels and Restaurants.
Energy, Building and Construction: Energy statistics cover statistics on electricity supply and generation as well as other energy statistics mainly produced by the ministry of Energy and Mineral Resources. The other forms of energy
statistics are collected through household surveys and censuses. Statistics on building are collected from the Ministry of Works and Transport, and municipalities and UBOS plans to expand coverage to all Town Councils. Plans to
establish Construction Sector Indices (CSI) are underway and it will be based on prices of the main construction
materials sold at wholesale outlets in selected urban centres.
Value Added Tax (VAT) and Pay As You Earn (PAYE): The Uganda Revenue Authority (URA) collects a wide range of tax statistics. VAT data is obtained monthly from businesses with an annual turnover of at least of 50 million shillings.
Currently efforts are underway to update the forms for collecting VAT statistics so in line with international standards.
In addition, PAYE as filed in by businesses provides statistics for various economic uses.
Balance of Payment (BOP): The BOU compiles BOP data mainly from administrative sources and data generated from the ICBT survey. BOP data is used for GDP estimation. In addition the Bank periodically collects data on
Commercial Bank Reserves, Foreign Reserves and Private Capital Flows among other things.
Biomass statistics: So far only one survey has been undertaken to generate statistics in this area. It is hoped that the National Forest Authority will make an attempt to produce more data in this area.

NSS- PNSD, October 2006
21
Table 2: Regular Economic and Social Indicators produced by the NSS
Economic Indicators Coverage Period Publication
Consumer Price Index CPI Urban centres* monthly monthly
Producer Price Index PPI Manufacturing quarterly quarterly
Index of Industrial
Production IIP Manufacturing quarterly quarterly
Index of Industrial
Production-Major IIPM Manufacturing monthly monthly
Construction Sector Indices CSI
Construction
Products quarterly quarterly
Energy & Building statistics ES
Municipalities &
Power stations quarterly quarterly, annually
Electricity Tariffs National monthly
monthly, quarterly,
annually
Trade Statistics (Imports
and Exports)**
IPI &
EPI All major ports quarterly
quarterly and
annually
Government Finance
Statistics GF Govt institutions quarterly annually
GDP series GDP All sectors annually annually
Biomass Data*** BD
National/sub
national quarterly quarterly, annually
Animal Disease Surveillance DS District monthly quarterly, annually
Livestock slaughters, and
movements District monthly quarterly, annually
Balance of Payments BOP National monthly
monthly, quarterly,
annually
Commercial Bank, Foreign
Reserves Commercial Banks monthly
monthly, quarterly,
annually
Pay As You Earn PAYE PAYE returns monthly
monthly, quarterly,
annually
Value Added Tax Statistics VAT VAT tax payers monthly
monthly, quarterly,
annually
Informal Cross Border Trade ICBT 14 border posts quarterly quarterly, annually
Migration Statistics MS Main entry points quarterly annually
Crime Statistics CS National quarterly annually
Education Statistics ES National quarterly annually
Health Statistics HS National quarterly annually
Labour Cost Index LCI Manufacturing, quarterly annually
* Mbale, Jinja, Kampala, Entebbe, Masaka, Mbarara, Gulu, Arua
** The export price index is still in development
*** Coverage varies depending on data source

NSS- PNSD, October 2006
22
3.8 Sources of Data
MDAs obtain data through Censuses, Sample Surveys, Administrative Records and
Qualitative/Participatory Measurement studies. The key censuses include the census of Population
and Housing, census of Agriculture and Livestock, Education census and the census of Businesses.
The main sample surveys undertaken in Uganda include:
• Demographic and Health Survey (DHS) which collects data on demographic
characteristics and health issues including HIV/AIDS.
• Household Budget survey (HBS) which collects basic data for compiling the weights for
the consumer price index and the household final consumption expenditure.
• Uganda National Household Survey (UNHS), which is a multi-subject multi-round survey,
collecting socio-economic, agriculture, community and price data.
• The Sero Behavioural survey collects data on HIV/AIDS prevalence and other health
indicators related to HIV/AIDS.
• The National Service Delivery Survey (NSDS) measures the level of service delivery in the
sectors of education, health, agriculture, water and sanitation.
• The Informal Cross Border Trade Survey (ICBT) collects data on informal cross border
trade necessary for estimating the magnitude of unrecorded trade, revenue loss due to
informal trade activities and compilation of Balance of Payments (BOP).
• The Foreign Private Capital (FPC) survey collects data from businesses on foreign assets
and liabilities among other things, necessary for improving the country’s BOP data and
international investment position.
Administrative records are usually generated and kept in registers or in completed forms through
administrative action or regulatory processes. Examples of such records include immigration forms
(arrival/departure cards), population registers, register of companies as kept in the Company
Registry, tax records, register of in- and out- patients in hospitals and registration of vital events
(births, deaths, marriages and divorces), etc. Many of these records tend to be consistently
incomplete and poorly managed resulting in low quality statistics.
The Uganda Participatory Poverty Assessment Programme (UPPAP) uses a non-probability
approach, collecting information from focus group discussions (group that has not been selected
with any known probability) using unstructured questionnaires in addition to quantitative methods
of data collection like sample surveys. Information obtained through qualitative approaches
helps users to better understand and interpret quantitative estimates obtained from sample
surveys.

NSS- PNSD, October 2006
23
4. VISION, MISSION, AND CORE VALUES OF THE NSS
4.1 Vision of the NSS
The PNSD sees the vision of the NSS to be “a world class National Statistical System” with key
partners playing leading roles in nurturing the system through innovative and responsive
processes, procedures and practices in accordance with their mandates and competencies.
4.2 Mission of the NSS
The mission of the NSS is “to develop a coherent, reliable, efficient and demand-driven NSS that
supports management and development initiatives.”
4.3 Key Outputs of the NSS
The following will be the core services (key outputs) of the NSS:
Production and dissemination of social statistics: These shall include statistics on population
and demography, migration and vital statistics, gender statistics, labour statistics, geo-
information, education statistics, health statistics and poverty statistics.
Production and dissemination of economic statistics: Economic statistics shall comprise
national accounts, finance and price statistics, external trade and distributive trade statistics
and statistics on business and agriculture.
Production and dissemination of other statistics: These shall include environmental statistics,
land degradation/erosion rates, deforestation statistics, water and sanitation, meteorology
data, natural disasters, wood fuel consumption, energy use and production, and wildlife
population, and infrastructure statistics.
4.4 Core Values and Principles
All stakeholders in the NSS shall share and be guided by the following set of values and principles:
� User-orientation: Users are the reason for the existence of the NSS. Therefore the system
shall be sufficiently demand driven to respond to user needs and priorities.
� Quality: The quality of products is what defines the image and the usefulness of the NSS.
The NSS shall be committed to producing increasingly better quality products that
conform to international quality principles of timeliness, coherence, completeness,
accessibility, reliability and relevance. The NSS shall invest in human resource
development and create a framework that recognizes and promotes quality.
� Efficiency: Efficiency is a prerequisite for success. In order to promote efficiency the NSS
shall promote and facilitate teamwork, networking, co-operation, motivation,
responsibility, innovation and resource awareness.
� Sustainability: The NSS shall be funded in a sustainable manner to enable it to realise its
medium and long term objectives.
� Professionalism: In order to retain trust in official statistics, the NSS shall produce outputs
on the basis of internationally acceptable and strictly professional considerations,
including scientific principles and professional ethics, with respect to the methods and
procedures for the collection, processing, storage and presentation of statistical data.
� Best Practices: To facilitate correct interpretation of data, the producers shall produce
and disseminate statistics following international best practice.
� Promoting standardisation: Data for statistical purposes shall be drawn from different
types of sources, including statistical surveys, administrative records and censuses. The
sources shall be selected on the basis of quality, timeliness, and cost. Standardisation
shall be followed to the extent possible.

NSS- PNSD, October 2006
24
� Confidentiality: Individual data collected for statistical compilation, whether they refer to
natural or legal entities, shall be strictly confidential and used exclusively for statistical
purposes as provided for in the Statistics Act.
� Regulatory Framework: The laws, regulations and measures under which the NSS and
Statistical Systems operate shall be made public.
� Effective Coordination within the NSS: The NSS shall be effectively coordinated to
achieve consistency and efficiency in statistical production, management,
dissemination and use.
� Protection of the Statistical Profession: The NSS shall comment on and correct erroneous
interpretation and misuse of statistics.
� Promoting Accountability and Transparency: The NSS shall strive to promote
accountability to the public through provision of reliable data, and to ensure
transparency in statistical production.

NSS- PNSD, October 2006
25
5. STRATEGIC GOALS
The core of an organizational strategy is formed by the strategic objectives or goals. Strategic
goals embrace the central thrusts and performance areas which the NSS pursues to achieve its
vision and mission. The strategic objectives of Uganda’s NSS are to:
• contribute towards the development of an information society.
• provide high quality statistical information.
• promote standardisation in the collection, analysis and publication of statistics to ensure
uniformity in quality, adequacy of scope and coverage and reliability of statistical
information across the entire NSS.
• provide guidance, develop skills and provide other assistance that may be required by
users and providers of statistics.
• promote co-operation, coordination and rationalization among users and providers of
statistics at national and local levels in order to prevent duplication of effort and ensure
optimal utilization of scarce resources.
• promote and support result based management and policy making informed by data.
Ten strategic goals were derived from the challenges the national statistical system faces, the
vision of the impact which the NSS would like to achieve and the functions at different levels
which were identified as necessary to produce the desired impact. They relate to organizational
and institutional development, human resource management and development, infrastructural
development, information technology, data development, data dissemination policy and plans
(including data accessibility), surveys, censuses and administrative data, strengthening data from
administrative sources and statistical auditing. They were formulated as:
1. Statistical Advocacy for proactively creating statistical awareness, improving demand
for and use of statistics and promoting investment in statistical production.
2. Organisational and Institutional Development to improve regulation and coordination
3. Human Resource Management and Development in terms of numbers and skills to
produce, supply and use statistics efficiently and effectively.
4. Physical and Statistical Infrastructure Development for efficient and effective production
and dissemination of statistics.
5. IT Architecture, Training, Hardware and Software Polices and Plans for harnessing
information technology in statistics
6. Data Development and Management Techniques for data production and
dissemination tasks across the entire NSS.
7. Data Dissemination Policy and Plans to ensure data products reach all categories of
users in the most user-friendly formats.
8. Coordination of Censuses and Surveys
9. Production and Coordination of Administrative and Census Data
10. Statistical Auditing to ensure Compliance with international standards

NSS- PNSD, October 2006
26
5.1 Strategic Goal 1: Statistical Advocacy
What is involved?
Statistical advocacy is about proactively creating statistical awareness, improving demand for
and use of statistics and promoting investment in statistical production. It entails creating greater
statistical awareness and numeracy in society. This means having a feel for numbers, an
appreciation of appropriate levels of accuracy, the making of sensible estimates, a common
sense approach to the use of data in supporting an argument, the awareness of the variety of
interpretations of figures, and a judicious understanding of widely used concepts such as means
and percentages. It also involves creating a knowledge-based information society2.
Main strategies
The main strategies to achieve this goal are:
� Making the general case for statistics as a necessary part of the enabling environment
for improving development outcomes [i.e. that statistics are needed to inform the
process of government (e.g. supporting decentralization, accountability and good
governance, and to manage for results)], facilitate better policy and decision-making
and hence more effective use of resources for development and poverty reduction.
� Demonstrating the use of statistical data for decision-making at sectoral level by
presenting examples of how policy-makers can use available data from a range of
sources to improve policy development and day-to-day management.
� Emphasizing the role of statistics in supporting private sector investment and in promoting
the development of effective and efficient markets.
� Making a case for specific statistical activities (e.g. the Population and Housing Census)
drawing attention to the range of uses census data could be put to and highlighting the
costs and benefits of the census compared to other information sources.
� Mobilizing and properly using national and international resources for statistics, and
promoting coordinated investments in the development of statistical capacity.
Specific actions
SG1.1: Mount statistical awareness programmes in order to create a numerate society
SG1.2: Facilitate information sharing at the national, regional and international level on such
topics as tourism, trade, education, culture, energy, health, transport, natural resources
management and information and knowledge.
SG1.3: Create awareness about the importance of statistics in the process of government.
SG1.4: Demonstrate the use of statistical data for decision making at sectoral level by
presenting examples of how policy- makers can use available data.
SG1.5: Emphasise the role of statistics in supporting private sector investment and in promoting
the development of effective and efficient markets.
SG1.6: Make a case for statistical activities like the Population and Housing Census by drawing
attention to the range of uses of census data and highlighting the costs and benefits of
the census compared to other information sources.
2 The African Information Society Initiative envisages an information society in Africa where: “every man, woman, student, village and
government office and business will be able to access information through computers and telecommunications; information and decision support systems will be used to support decision-making in all major sectors of the nation’s economy; access will be made available throughout the region to the international, regional and national “information highway” ; a vibrant information sector will exhibit strong leadership in growing information-based economies; African information resources will be globally accessible and will provide content on a range of topics including tourism, trade, education, culture, energy, health, transport, and natural resources management; and information and knowledge will empower all sectors of society.” (Executive Secretary of ECA, 1996).

NSS- PNSD, October 2006
27
SG1.7: Mobilise and properly use national and international resources for statistics and promote
coordinated investment in the development of statistical capacity.
5.2 Strategic Goal 2: Organisational and Institutional Development
What is involved?
The organizational and institutional development issues which must be addressed, if the NSS is to
operate efficiently and meet national and international statistical needs, include reforming the
legal framework, institutional restructuring, streamlining the coordination arrangements and
exploring the possibility of or reinstating the common statistical cadre. There is need for a
comprehensive regulatory framework that guides the production, dissemination and use of official
statistics in the NSS. The law defines the roles of, and guides the mandates of the different players
in the NSS. The provisions of the law must enshrine the fundamental principles of official statistics,
namely: impartiality, objectivity, independence, transparency, integrity and confidentiality.
Sanctions must be stipulated for non-compliance with these principles. The provisions for use of
sound methodology and established standards should equally be entrenched in the law.
Restructuring and re-organisation should focus on:
� Promotion of professionalism and effective coordination of statistical work across the
NSS;
� Cost-effectiveness in statistical production through sharing of human resources, skills and
statistical and ICT Infrastructures
� Improved career prospects for all statistical personnel
� Better prospects for training and professional advancement for statistical staff
� Enhanced data quality particularly of administrative data through technical back-
stopping.
� Better collaborations across the NSS on administrative data, survey and census
programmes.
Main strategies
The main strategies shall include:
• Amending the UBOS Act to embrace the various institutions in the NSS. It will set out the
responsibilities/functions, rights and obligations of MDAs in NSS. This will be called the
Statistics Act.
• Legally providing for and establishing a Common Statistical Service to support the
generation of a wider range of official statistics and the facilitation of data exchange
policies between the NSS components and the public. Provision will also be made for
UBOS to centrally manage the service.
• Harmonizing all existing laws of other agencies (e.g. the law guiding the Registrar –
General over the registration of Births and Deaths and other vital events) so that they are
consistent with the Statistics Act.
• Developing statistics outfits in the various Ministries, Departments and Agencies.
Specific actions
SG2.1: Review and revise the UBOS Act 1998 to cover the entire NSS and ensure that the new
Statistics Act supercedes other laws with regard to statistics.
SG2.2: Restructure Ministries, Departments and Agencies in order to establish high level
separate units for statistics that are uniform across the board.
SG2.3: Institute internal coordination arrangements in each sector (Ministry/Agency).

NSS- PNSD, October 2006
28
SG2.4: Establish a statistical basket fund.
SG2.5: Establish standing committees to handle technical and programme coordination issues
in order to bring about appropriate data production processes.
SG2.6: Develop a concept paper on re-establishing the Common Statistical Service, which
would be managed technically by UBOS and administratively by the sector
(Ministry/Agency).
5.3 Strategic Goal 3: Human Resource Management and Development
What is involved?
The NSS concept is still evolving and therefore needs a human resource that is adequate in terms
of numbers and skills to produce, supply and use statistics efficiently and effectively. The NSS
needs high calibre, well-qualified staff with the requisite knowledge and skills to produce quality
statistics in a rationalized manner. Data users need to be empowered to appreciate data by
focusing on how to access and use data from statistical reports and existing databases and how
to use data for results-based planning and management.
Main strategies
• Establishing policies and guidelines with respect to staff matters covering recruitment,
promotion/ advancement, postings and transfers, reporting lines, training, leave matters,
and conditions of service
• Developing and implementing a NSS-wide strategy for human resource management.
• Establishing job profiles by function and corresponding salary scales and standard
career paths for each profile;
• Defining and setting up a system of internal promotion and merit based remuneration.
� Training of Statistical Producers, Trainers, Managers, Disseminators and IT Staff
� Training and sensitizing main data users in line ministries and government agencies
through workshops, computer aided training, secondments and on-the-job learning.
� Strengthening the link between NSS needs and objectives and statistical research and
training activities so as to make the teaching of the production of statistics in Uganda
more relevant for the NSS by focusing on practical-oriented approaches to social,
economic and administrative statistics, and to incorporate the use of statistics in courses
attended by future managers and planners.
� Supporting the Uganda Statistical Society and other relevant Associations
Specific actions
SG3.1: Develop a framework for human resource management.
SG3.2: Implement the framework for human resource management.
SG3.3: Establish job profiles by function and corresponding salary scales and standard career
paths for each profile.
SG3.4: Define and set up a system of internal promotion and merit based remuneration.
SG3.5: Develop a training programme that will improve the requisite knowledge and strategic
skills of statistical managers, trainers, data producers, disseminators, and IT staff in
general management, induction courses, short specialized refresher courses,
postgraduate courses, data dissemination and report writing training courses; training for
surveys including sampling, study tours and secondments and professional seminars and
workshops.
SG3.6: Implement a training programme that will develop the requisite knowledge

NSS- PNSD, October 2006
29
SG3.7: Hold workshops in collaboration with the NIMES secretariat to empower main users to
appreciate how to access and use data from statistical reports and existing data banks
for results based planning and management.
SG3.8: Strengthen the link between NSS needs and objectives with research and statistical
training activities currently being carried out by the Universities to make the teaching of
the production of statistics in Uganda more relevant, and to incorporate the use of
statistics in courses attended by future managers and planners.
SG3.9: Support the Uganda Statistical Society to share information between members. Provide
a peer review mechanism for members work and promote professionalism in the
country.
SG3.10: Launch a nationally peer-reviewed working papers series (WPS) and ensure that the best
research papers are submitted for publication in internationally recognised journals.
SG3.11: Establish a peer review mechanism for new methodology and conceptual issues such as
sampling techniques and data collection approaches.
SG3.12: Liaise with policy makers in identifying a priority research agenda to inform government’s
strategy/policy. This should include collaboration with peers in East Africa.
5.4 Strategic Goal 4: Infrastructure Development
What is involved?
MDAs participating in the first phase of developing the PNSD indicated inadequacy of physical
and statistical infrastructure, which was compromising efficiency and effectiveness in the
production and dissemination of statistics. Only UBOS and the Bank of Uganda have a relatively
good physical environment and ICT infrastructure for statistical work.
Main strategies
• Providing the MDAs with ICT equipment including computers and networking
equipment, IT accessories and software, survey equipment and accessories.
• Restructuring the update of the Business Register (BR) through formalized linkages to sub-
registers like VAT, Customs, PAYE, Large Taxpayers, Company registers and Labour
registers and making it accessible to users outside the NSS.
• Maintaining and developing the existing GIS capability by setting standards and
protocols for GIS data capture and encouraging knowledge and data exchange by
different data producers.
• Establishing a national GIS data repository to provide users with access to all available
layers of geographic information.
• Developing and maintaining a National Master Sample Frame for guiding household
survey programmes for the generation of data to inform government, development
partners and the entire public about the progress being made towards achievement of
PEAP objectives and the MDGs.
• Adopting global methodologies and classifications of statistics to improve harmonization
and consistency among various data sets in Uganda and to ensure international
comparability. Compendiums on statistical definitions, concepts and methodologies will
be elaborated to cover the entire NSS on the basis of best international practice.
• Establishing a field organization covering the entire NSS. This may consist of field offices at
regional/zonal levels with adequate ICT facilities, and core field staff with appropriate
training.
• Establishing and equipping the Statistical Resource Centre.
Specific actions

NSS- PNSD, October 2006
30
SG4.1: Provide Ministries/Agencies with transport, computers and networking equipment, IT
accessories, survey equipment and accessories and office furniture and supplies.
SG4.2: Develop basic elements of the statistical infrastructure such as statistical registers, sample
frames, classifications and methodologies, statistical computer packages for analysis of
survey data and Geographical Information Systems (GIS) for statistical mapping.
SG4.3: Restructure and update the BR continuously through formalised linkages to sub-registers,
like VAT, PAYE, Large Taxpayers, Company registers and Labour registers and make it
accessible to users outside the NSS, in a not identifiable manner.
SG4.4: Continue to digitalise Enumeration Areas (EAs) and Local Council 1 boundaries (which
will be required for the 2012 census), and setting of standards and protocols for GIS data
collection and exchange by different data producers. Set up a national GIS data
repository providing users with access to all available layers of geographic information.
SG4.5: Develop and maintain a National Master Sample Frame for guiding household survey
programmes for the generation of data to inform government, development partners
and the entire public about the progress in meeting the PEAP objectives and MDGs.
SG4.6: Adopt global classifications to improve harmonization and consistency among various
data sets in Uganda and to ensure international comparability.
SG4.7: Further develop the existing compendium on statistical definitions, concepts and
methodologies to cover the entire NSS on the basis of best international standards and
manuals, and sound international practices, and ensure that it is implemented.
SG4.8: Implement revised classifications on the basis of standardized international
classifications/codes.
SG4.9: Harmonize methods used in data collection to eliminate or at least minimize
unacceptable methods of production.
5.5 Strategic Goal 5: Information Technology Strategy
What is involved?
An IT strategy covers IT architecture, training hardware and software polices and plans for
harnessing information technology. It defines the steps required to improve IT usage in data
production and identifies minimum standards for the IT infrastructure required for each sector for
the effective production of quality statistics.
Main strategies
• Developing the standards and infrastructure for supporting more effective use of IT to
promote high quality data and reduce management costs.
• Facilitating access to broadband technology by players within the NSS to ease access
to data/information through the web or online.
• Developing internal sharing channels or intranets to improve data/information sharing
within the MDAs.
• Designing and developing a web based but exclusive platform (Extranet) for
data/information and knowledge sharing.

NSS- PNSD, October 2006
31
Specific actions
SG5.1: Develop standards and infrastructure to support more effective use of IT to enable high
quality data to be produced and management costs to be reduced.
SG5.2: Install internets and extranets for the entire NSS to facilitate communication and
exchange of information.
SG5.3: Promote access and sharing of data to increase its utility.
SG5.4: Create and maintain an NSS website to facilitate communication and sharing of
information.
5.6 Strategic Goal 6: Data Development and Management
What is involved?
This involves the use of sound and well-accepted statistical techniques for data production and
management across the entire NSS. Combining sources of data and synchronising programmes
are important considerations in reducing the costs of data production. Similarly, participatory
data prioritization is essential to meet the diverse data needs, identified national sectoral
programme requirements, and mandatory statistics required for policy formulation, monitoring
and evaluation. Data collected from various sources and often in varied formats must be
organized and processed to provide meaningful interpretations to users, while also facilitating the
ease of access and sharing the data.
Main strategies
• Identifying data gaps – agricultural statistics, quarterly GDP, implementation of SNA 93,
expansion of CPI, PPI, panel data for poverty analysis, etc.
• Strengthening the existing data systems, namely, Management Information Systems
(MIS), surveys and censuses.
• Preparing and gaining experience with new and existing data systems – Community
Information System (CIS), Census of Agriculture and Livestock, other surveys and
censuses covering different development areas.
• Disaggregating data at sub-national level, and by other important domains such as
gender and economic activity.
• Adopting participatory approaches in obtaining qualitative measures that are highly
useful in data interpretation.
• Improving data analysis, and using the Geographic Information Systems (GIS) technique
to present data spatially.
• Strengthening coordination mechanisms for inter-agency data production processes
and technical coordination on the establishment and implementation of standards and
methodologies throughout the entire NSS.
Specific actions
SG6.1: Carry out data needs assessment along with an inventory of data available to identify
data gaps in all sectors and in such areas as agricultural statistics, quarterly GDP,
implementation of SNA 93, expansion of CPI, PPI, and panel data for poverty analysis.
SG6.2: Strengthen existing Management Information System (MIS).
SG6.3: Gain experience with new and existing data systems such as the Community Information
System (CIS), Agriculture Information System (AIS), and Vital Registration System (VRS)
among others.

NSS- PNSD, October 2006
32
SG6.4: Develop systems and techniques for institutionalising the production and use of statistics at
sub-national level.
SG6.5: Engender statistics.
SG6.6: Adopt the use of participatory approaches to obtain qualitative data, which will be useful
as an information source in itself, but also to complement quantitative statistics.
SG6.7: Explore the possibilities to combine sources and synchronise programmes in order to
minimise the costs of data collection.
SG6.8: Identify national sectoral programme requirements including mandatory statistics required
for the management of the economy, policy formulation and monitoring and evaluation.
SG6.9: Establish sectoral databases that store away all the statistical outputs and ensure that
data are accessible with an easy to use retrieval system.
SG6.10: Establish a national database as well as sectoral databases that are synchronized and
linked.
SG6.11: Set up a warehouse for the various sets of micro-data for easy access by relevant
stakeholders.
5.7 Strategic Goal 7: Data dissemination policy and plans
What is involved?
Data dissemination must be efficient and data products must reach all categories of users in the
most usable format and through reader-friendly reports. Policies and plans must be established
for the dissemination of statistical information. Such policies should be on pricing and accessibility.
Accessibility policy should be in line with the Fundamental Principles of Official Statistics (FPOS)
which demand that statistics should be impartial including that producers must release data
simultaneously to all categories of users. As a “public good” the statistics should be readily
accessible to the public. Different dissemination media should be used including; hard copy
publications, abridged reports, press releases and press briefings, websites, CD-ROM, internet (e-
mails) and user/producer workshops. A data release plan and dissemination strategy should be
developed to make effective use of these media.
Main strategies
• Establishing policies and plans for the dissemination of statistical information.
• Making effective use of diverse media.
• Establishing a modern and computerized one-stop statistical resource with information
from all MDAs. The resource centre will provide data and database operations to the
entire NSS and will be available for use by members of the NSS. Sectors, with or without
resource centres will be encouraged to link up to the NSS Resource Centre.
Specific actions
SG7.1: Develop a data dissemination policy/strategy to ensure that users obtain data in the form
that they require by improving on data analysis and using Geographic Information Systems
(GIS) to present data spatially.
SG7.2: Establish policies for disseminating statistical information which cover pricing and
accessibility issues.
SG7.3: Draw up a plan for the release of statistical information using appropriate media such as
hard copy publications including abridged reports, press releases and press briefings,
websites, CD-ROM, e-mails and user/producer workshops.
SG7.4: Develop provisions for data security and confidentiality as part of the legal framework
under which data is produced and stored.

NSS- PNSD, October 2006
33
SG7.5: Store micro-data that are already anonymised from surveys, censuses and make the data
easily retrievable for research purposes.
SG7.6: Establish and equip the Statistical Resource Centre
5.8 Strategic Goal 8: Coordination of Censuses and Surveys
What is involved?
The manner in which surveys and censuses are carried out and administrative records kept affects
the quality of statistics produced. There is lack of comprehensive and reliable data in nearly all
sectors/institutions. In the majority of cases, census, survey and administrative data are
inaccurate, incomplete, and inconsistent and are not produced in a timely manner. The
consequence is that data users might lose confidence in the entire NSS.
UBOS and other players in the NSS often undertake social and economic surveys without involving
other relevant players yet for purposes of synergy and cost effectiveness, it would be better to
undertake these activities jointly. These surveys should be in line with the review of development
and policy processes so that their data is relevant and supports development outcomes.
The most relevant driving force for survey-based data is Uganda’s PEAP which is the national
development framework. The PEAP is developed through an elaborate consultative process in
which line ministries develop their detailed sector plans under this overarching framework. The
PEAP is revised every 4 years.
The PEAP monitoring and evaluation strategy identifies indicators that need to be monitored to
appraise the progress made by the country towards the eradication of poverty. Many of them
can be computed from household survey data. In addition to the PEAP’s outcome indicators,
survey data are expected to provide an assessment of Uganda’s progress towards the MDGs.
Main strategies
• Developing and implementing a synchronised long term survey programme to provide
the required information that addresses all the stakeholders’ needs and is anchored on
the national development framework.
• Strengthening collaboration between the key players clearly spelling out the rights and
obligations of each party in the NSS.
• Enhancing analytical capabilities and collaboration with MDAs.
• Collecting data from all economic activities undertaken in the country necessary for the
computation of main economic indicators (see economic statistics future work
programme).
• Updating the Statistical Business Register to be used as a sampling frame for economic
surveys, for instance the Uganda Business Inquiry (UBI).
• Collecting agricultural statistics through household based surveys, administrative sources,
and occasional Aerial Crop and Livestock Surveys.
• Measuring and monitoring capital flows in and out of the country and foreign assets and
liabilities of businesses.
• Enhancing the ICBT survey by expanding coverage.
Specific actions
SG8.1: Carry out joint surveys
SG8.2: Develop memoranda of understanding (MoU) for carrying out surveys specifying the rights
and obligations of each party in the relationship.
SG8.3: Ensure that surveys are cost effective and timely, and are synchronised to the PEAP review
process.

NSS- PNSD, October 2006
34
SG8.4: Develop a comprehensive and holistic census programme that captures all the required
data in a coordinated manner.
SG8.5: Mobilise revenue for Census programmes
5.9 Strategic Goal 9: Production of Administrative Data
What is involved?
The PEAP monitoring process derives its indicators not only from surveys and censuses but also
from administrative data produced by MDAs as part of their routine activities. Monitoring of inputs
and outputs is a critical component within the national development frameworks and
administrative data plays a central role in servicing this need. Indeed it is the only source of data
on inputs and outputs of various government interventions. In addition, administrative data
provides some of the outcome and to some extent impact indicators and supplements
information from household surveys and censuses. One of the key challenges for the NSS is the
generation and utilization of administrative data. A lot of administrative data is being produced
but its quality leaves a lot to be desired.
Coordination mechanisms for data from administrative sources across government have not been
as smooth as they should have been. Given the diversity of the NSS and the role they play in
informing the policy processes, it is important that they are well coordinated. The NIMES was
established as the coordinating framework that provides the link between the policy makers and
the different sector Ministries and Agencies with regard to dissemination and use of statistics on
performance, either as inputs, outputs, outcomes or impacts. NIMES aims to ensure a smooth flow
of information between the various stakeholders and to coordinate the M&E functions in MDAs.
The PNSD plays an important function for NIMES by providing a framework for the production of
data across the NSS.
Censuses, on their part, are huge and expensive exercises which individual sectors cannot
undertake without the collaboration of UBOS. In Uganda, they include the Population and
Housing Census, Agriculture and Livestock Census, Census of Business Establishments and the
School Census of Education. Given that these exercises are very expensive to carry out, the
strategy is to develop a comprehensive and holistic census programme (Annex 1) that captures
all the required data in a coordinated manner.
Main strategies
• As part of the NIMES framework, strengthening the information sharing network and
hence increasing the visibility and utility of the monitoring and evaluation function across
government ministries/agencies.
• Eliminating or minimising variations in reporting mechanisms of different
sectors/institutions so as to improve the data collection process.
• Many Ministries rely on other institutions and districts to submit returns which they use to
generate data in a consolidated form. In many instances, the returns and the
information itself are incomplete; which makes data unusable. The strategy is to improve
the consistency and completeness of data collected.
• In some MDAs, information is collected as routine data and not used for planning. The
strategy is to increase awareness of the importance of this information at all levels of
decision-making.
• Identifying the types of data that exist in various MDAs and the form in which they are
kept.

NSS- PNSD, October 2006
35
• Standardising data collection instruments, providing regular training for data collectors
and supporting the continuous coordination with the respective Ministries, Departments
and Agencies.
Specific actions
SG9.1: Develop a mechanism for the coordination of administrative data across government.
SG9.2: As part of the NIMES framework, strengthen the information sharing network in order to
increase the visibility and utility of the monitoring and evaluation function across
government ministries/agencies.
SG9.3: Support the development of administrative data as a reliable source through
standardisation of data collection instruments, regular training for data collectors and
continuous coordination between the respective ministries and agencies.
SG9.4: Establish MOUs between institutions to ease data sharing.
5.10 Strategic Goal 10: Statistical Auditing for Compliance
What is involved?
Key data producers in the NSS use internationally recommended standards, classifications,
guidelines and methodologies adapted to national conditions. These standards and guidelines
include, among others: the Fundamental Principles of Official Statistics (FPOS) adopted by the UN
Commission in 1994; Classification of Individual Consumption According to Purpose (COICOP) for
recording prices and expenditure; International Standard Industrial Classification (ISIC) Rev.2 for
classifying businesses; the Government Finance Statistics (GFS) 2001 manual and the Chart of
Accounts for classification for compiling public finance statistics; the System of National Accounts
(SNA)1993 a system for estimating national accounts; the Central Product Classification (CPC) for
classifying products; the Harmonised Commodity Description and Coding System (HS) for trade
classification. Agriculture Censuses, Population and Housing Censuses and the Census of Business
Establishments, Private Capital Flows have all benefited from UN guidelines for conducting
censuses. Subject-specific surveys have also benefited from relevant international guidelines.
In 1999, Uganda, started to subscribe to the IMFs General Data Dissemination system (GDDS)
which aims to improve data quality, provides a framework for identifying needs for data
improvement and setting priorities, and guides the country in the dissemination to the public of
comprehensive, timely and accessible statistics.
Main strategies
• Preparing statistical auditing guidelines and putting in place mechanisms for periodic
statistical audit of the units at the MDAs.
• Ensuring that international standards, classifications and guidelines are adhered to.
• Fulfilling the GDDS requirement in totality and subscribing to the Special Data
Dissemination Standards (SDDS) in order to provide investors with up-to date data that are
frequent, timely and accessible
• Conducting statistical audits of major statistical collections at agreed intervals to promote
continuous improvements in official statistics by verifying that operational procedures and
controls comply with the documented procedures and to determine their effectiveness in
delivering products and services.
Specific actions
SG10.1: Prepare statistical auditing guidelines
SG10.2: Conduct statistical audits of major statistical collections every other year to monitor the quality of statistical production across the NSS.

NSS- PNSD, October 2006
36
SG10.3: Regular appraisal of classifications and coding systems used.

NSS- PNSD, October 2006
37
6. IMPLEMENTATION STRATEGY AND PLAN
6.1 Involve all Key Stakeholders in all Start-up Aspects
In addition to several meetings that have been held so far, the NSS Coordinator (UBOS) shall
discuss elements of the PNSD with the individual MDAs so that they are adequately conversant
with the issues at hand and ratify the key elements. MDAs shall prepare and submit detailed
annual workplans and budgets to facilitate implementation of the SSPS and PNSD. All annual
workplans and budgets shall be presented to a stakeholders meeting for ratification.
6.2 Establish the Inter-Agency and Steering Committees.
The terms of reference for the Inter-Agency and NSS Steering Committee, their composition and
mode of appointment shall be further developed and agreed upon.
6.3 Promote Partnership and Collaboration amongst Key Players in the NSS
In order to effectively support the implementation of the PNSD, the key players in the NSS shall
work together and agree on their rights and obligations in the production and use of statistics. This
will entail developing various forms of formal and informal collaboration through recognised
instruments (e.g. Memoranda of Understanding) that specify the relationship between different
players in the NSS.
6.4 Promote ownership of the NSS Concept
In order to increase the MDAs’ ownership of the NSS concept the Permanent Secretaries and
Chief Executives of Agencies shall be expected to effectively and consistently mobilise resources
for the implementation of the PNSD and MDAs to internally mobilise resources for implementing
the SSPSs. Horizontal coordination of MDAs shall be emphasised to address their heterogeneous
nature. The MDAs shall designate focal persons for participating in inter agency meetings,
including Producer – Producer and User – Producer committees. Presentations and reviews of
sector strategies will be carried out through sector working groups and other existing fora.
6.5 Involve Development Partners
Various development partners shall be involved in annual reviews for the purpose of acquainting
them with the achievements and progress of the NSS. In addition, they will be requested to
provide financial support to the priorities that have been set out in the plan.
6.6 Develop Joint Work plans for Collecting and Disseminating Data
The following joint responsibilities, among others, are envisaged:
� Ministries of Gender, Labour and Social Development, Local Government and UBOS shall
collaborate to collect and disseminate data on employment.
� Ministries of: Health, Local Government, Education and Sports, Agriculture, Water, Lands
and Environment as well as UBOS, Police and the National Environment Management
Authority (NEMA) shall collaborate to collect and disseminate data on health statistics.
� Ministries of Agriculture and Local Government as well as UBOS shall jointly collect and
disseminate data on agriculture.
� The Bank of Uganda, Uganda Revenue Authority (URA), the Ministry of Finance, Planning
and Economic Development, Ministry of Trade, Tourism and Industry, Uganda Investment
Authority and UBOS shall collaborate to collect and disseminate trade data and other
main economic indicators.
� Ministry of Trade, Tourism and Industry, UBOS, Bank of Uganda, URA and the Ministry of
Agriculture shall work together to collect and disseminate data on prices.
� The Police, Prisons Service, Ministry of Internal Affairs, the Ministry of Justice and UBOS
shall collaborate to collect and disseminate data on crime.
NSS- PNSD, October 2006
38
� Bank of Uganda, and UBOS shall jointly collect and disseminate data on the balance of
payments.
� The Ministry of Trade, Tourism and Industry, Economic Policy Research Centre (EPRC) and
UBOS shall collaborate to collect and disseminate data on industry.
� Uganda Revenue Authority, Office of the Registrar general and UBOS shall collaborate
and disseminate data on businesses, and birth and death registration.
� Ministry of Local Government, Local Governments, Office of the Auditor General and
UBOS shall collaborate to collect and disseminate data on government finance.
� Ministry of Energy and Mineral Development and UBOS shall collaborate to collect and
disseminate data on energy.
� Bank of Uganda, Uganda Investment Authority and UBOS shall jointly collect and
disseminate data on foreign private capital flows and investment climate.
6.7 Capacity Building
The NSS shall undertake a capacity needs assessment to identify capacity gaps; identify capacity
building opportunities within and outside the MDAs; develop a capacity building plan; and
identify/mobilize resources for its implementation.
6.8 Institutional and Coordination Arrangements
The NSS shall have well streamlined institutional and coordination arrangements (Figure 1) to
operate effectively. There are several functions that must be performed within the system
including policy making and oversight; generation, dissemination and use of statistics;
coordination; supervision; monitoring and evaluation and capacity building – all of which must be
assigned to appropriate responsibility centres to ensure effective harmonization and
synchronization.
The NSS Steering Committee will oversee the implementation of the PNSD. The broad functions of
NSS Steering Committee will be to:
� consider and approve statistics policies, developed by the Inter Agency Committee
� provide advice to the Ministries on matters relating to statistics in national development.
� provide effective guidance and supervision to the NSS through the Inter Agency
Committee.
� review progress of the implementation of PNSD
� approve work programmes, the budget and procurement plans
� address critical issues that could hinder the implementation of the PNSD
� oversee the recruitment, promotion and disciplining of staff
The Inter-Agency Committee will provide the platform for regular stakeholder discussion,
consultation and coordination of the implementation of the PNSD. The functions of the IAC will
among others include:
� taking the NSS through change management by establishing or re-organising statistics
units in MDAs;
� promoting different types of collaboration across the NSS;
� working out details for (re) establishment of a Common Statistical Service;
� developing data management systems;

NSS- PNSD, October 2006
39
� harnessing ICT;
� developing and implementing business plans among MDAs;
� creating quality consciousness among data producers and users;
� developing and operationalising dissemination policies; and
� mobilising resources for statistical development.
UBOS will be the NSS Coordinator and will, therefore, have the following roles:
� acting as Secretariat to the InterAgency Committee and the NSS Steering Committee.
� setting standards and protocols for the generation, dissemination and use of official
statistics, and ensuring that they are observed within the NSS.
� coordinating the generation, dissemination and use of official statistics within the NSS to
enhance synergy, minimize duplication, and promote optimal use of resources.
� linking the NSS to external statistical systems.
� guiding MDAs on capacity building and technical issues.
� promoting statistical research and setting research agendas for the different
components of the NSS.
� liaising with the Office of the Prime Minister (OPM) to ensure that MDA statistical activities
are captured by the NIMES
The MDAs will on their part be responsible for:
� setting up and ensuring effective operation of sector statistical committees.
� synchronizing own statistical generation processes to ensure coherence in data
generation within their own sectors.
� generating statistics and disseminating them to relevant stakeholders and the general
public.
� collaborating with other sectors and stakeholders in the generation, dissemination and
use of statistics.
� providing support to local governments and other stakeholders to enhance the quality
of generation, analysis, dissemination and use of statistics.
� collaborating with UBOS in implementing the Plan for National Statistics Development.
� participating actively in the activities of the Inter Agency Committee.

NSS- PNSD, October 2006
40
6.9 Implementation Activities
The generic actions that relate to the entire NSS and address all the needs of the MDAs were
presented along with the strategic goals (Chapter 5). Priorities for implementation by each MDA
during the first year of the PNSD were generated on the basis of expressed need (urgency) for
strengthening the state of the statistics, the extent (scope) to which the need was widespread or
common, and the effects (impact) it would have if the need was not addressed. The priorities,
guided by the principle of sustainability, include improvement of existing statistics structures or
establishing statistics units, improving data production tools, streamlining data flows, improving
MISs and GIS and training staff of statistics units (Annex 2).
6.10 Monitoring and Evaluation
The key monitoring indicators are set out in the PNSD logical framework (Annex 3). Each MDA shall
produce quarterly progress reports relating to the implementation of their SSPS. In addition, there
will be joint annual reviews relating to the implementation of the PNSD to assess the achievement
made and the challenges faced. All the key stakeholders shall participate in the annual review
meetings.
The annual reviews will be largely used to commit the MDAs to implement their SSPSs, appraise
stakeholders of current developments, make adjustments to the PNSD in the light of changing
circumstances, identify upcoming priorities and adjust work plans accordingly, and provide 3 year
rolling budgets for the MTEF.
A mid-term review (MTR) of the PNSD will be conducted in the 3rd year of implementation to assess
relevance of the plan and to agree on the changes in both the strategy and work programmes.
In addition, the mid-term review will re-examine the resource envelope and re-allocate the
resources according to performance and priority needs.
At the end of the plan, there will be a Terminal Review (TR) and an ex-post evaluation. Lessons
learnt and challenges faced will be documented all along.
7. BUDGET AND FINANCING PLAN
The estimated cost for executing the plan over a three year period is UGShs 56.9 billion,
approximately equivalent to US$ 28.4 million (Table 3). The PNSD will be financed by the GoU and
development partners.

NSS- PNSD, October 2006
41
TABLE 3: THREE YEAR COST ESTIMATES (UGShs) FOR THE 9 MDAs
Strategic Goal Year 2006/07 Year 2007/08 Year 2008/09 3Yr Total Share
Advocacy 1,267,226,580 860,459,779 346,300,189 2,473,986,548 4%
Org &Inst. Devt. 1,278,540,000 2,281,540,000 1,811,132,850 5,371,212,850 9%
HRD 3,536,261,419 5,113,218,304 5,087,066,032 13,736,545,755 24%
Infrastructure 3,891,702,438 2,544,676,126 1,772,443,154 8,208,821,718 14%
IT Strategy 975,347,000 1,054,855,400 1,467,035,109 3,497,237,509 6%
Data Development 1,463,509,631 1,466,542,039 2,216,200,276 5,146,251,945 9%
Data dissemination 249,752,200 9,614,000 275,351,801 534,718,001 1%
Surveys 211,060,000 2,427,370,500 2,411,230,150 5,049,660,650 9%
Administrative Data 309,743,600 319,084,000 410, 051,410 1,038,879,010 2%
Data from census 1,274,968,000 5,274,968,000 4,658,811,300 11,208,747,300 20%
Statistical Auditing 181,266,353 192,636,759 237,834,185 611,737,297 1%
TOTAL 14,639,377,221 21,544,964,907 20,693,456,456 56,877,798,583 100%
US$ Equivalent 28,438,899.29

NSS- PNSD, October 2006
42
Annex 1: Programme of Censuses and Surveys, 2005 - 2017
Censuses
PSR
PSR
PSR
PSR
Population Census
PSR
PSR
PSR
Policy Framework
PEAP
Revision
PEAP
Revision
PEAP
Revision
Household Surveys
Cartographic Updating
Cartographic Updating and
Inventory of Infrastructure
Service
Delivery Survey
Service
Delivery Survey
DHS 4
Sero Survey
Sero Survey
Sero Survey
UNHS III
2012
2013
2014
2008
2009
2010
2011
2004
2005 Agricultural Census
2015 Agricultural Census
PEAP
Revision
2006
2007
Census of Businesses and
Enterprises (COBE)
2016
UNHS V
Service
Delivery Survey
2017
2010
2011
DHS 6
UNHS IV
DHS 5
UNHS
2016
2017
2015
Sero Survey
2012
2013
2014
2004
2005
2006
2007
2008
2009

NSS- PNSD, October 2006
43
ANNEX 2: CHALLENGES, STRATEGIES AND PRIORITY ACTIVITIES FOR MDAs
Challenges Strategies Priority Activities for the Initial year
BANK OF UGANDA
Implementing Dept: Research Department
Headed by: Director Research
• Untimely submission of required statistics
and data by Commercial Banks, Forex
Bureaus, Micro Deposit Taking Institutions
(MDIs).
• Low Response from data providers.
• Inability of Users to access BOU reports and
data.
• Inconsistent government policies.
• High staff turnover.
• Duplication of data production with other
MDAs.
• Increase collaboration with primary data
providers.
• Develop and implement of
comprehensive database.
• Provide training including refresher
courses.
• Carry out effective planning &
coordination.
• Improve dissemination.
• Minimise internal bureaucracy to ease
access to data.
• Increase staff in the Research
Department.
• Improve coordination and collaboration
arrangements with providers of primary
data.
• Improve data production processes.
• Maintain a strong data system.
• Ensure that non-reporting institutions are
compelled to report through non-
provision of licenses.
• Train staff of statistics unit in IT, production,
analysis dissemination and use of statistics
and other areas depending on their
actual needs.

NSS- PNSD, October 2006
44
Challenges Strategies Priority Activities for the Initial years
MINISTRY OF TRADE TOURISM AND INDUSTRY (MTTI)
Implementing Dept: None so far, needs to be created
Headed by: Not identified
• Statistics receives inadequate attention from the key
policy and decision makers as such limited funds are
allocated to statistical work.
• Lack of a statistical unit in the Ministry
• Lack of well developed standards relating to collection
and release of data. Consequently, data collectors and
suppliers are not quality conscious regarding the
relevance, accuracy, completeness, consistency,
timeliness accessibility and right levels of disaggregation
• Inadequate human resource management and
development
• Poor infrastructural development, in particular,
inadequate equipment, transport and stationary facilities
to effectively carry out statistical work and disseminate
information.
• Data collected and the techniques used do not meet
international standards.
• UBOS and other MDA’s undertake surveys with limited
involvement of other relevant players, similarly MTTI has
undertaken surveys that do not involve UBOS.
• Poor coordination mechanisms across MDAs.
• Due to inadequate methods of data compilation and
capture, data collected from administrative sources is
inconsistent with that collected through other means.
• Extensive statistical advocacy is required.
• Establish a statistical unit in the Ministry to help
enhance coordination and effectiveness
• Strengthen coordination mechanisms for inter-
agency data production processes, and to
establish and implement standards and
methodologies.
• Ensure adequate skilled human resource is
available in the Ministry to produce, analyse
and supply statistics efficiently and effectively.
• Sensitise and train data users in order to
promote the use of data in policy formulation
and decision making
• Provide the necessary physical and statistical
infrastructure for statistical work
• Apply international standards and best
practices.
• Strengthen the corroboration between the
Government and other data producing
agencies to strengthen the notion of synergy
and cost-effectiveness.
• Harmonise the coordination and strengthen the
linkages between the agencies.
• Support and strengthen the production of
quality administrative data.
• Establish a functional MIS.
• Establish a unified statistics
unit.
• Establish a regular statistics
programme of data
collection that is not
project based.
• Determine data priorities.
• Train staff of statistics unit
in IT, production, analysis
dissemination and use of
statistics and other areas
depending on their actual
needs.

NSS- PNSD, October 2006
45
Challenges Strategies Priority Activities for the initial year
MINISTRY OF LOCAL GOVERNMENT (MOLG)
Implementing Dept: Policy and Planning Division (PPD).
Headed by: Assistant Commissioner.
• Lack of a Local Government Information
and Communication Technology (ICT)
Sector Policy Framework
• Limited human resource recruitment,
training and retention
• Existence of a MIS (LoGICS), which is not
harmonised nor interfaced with other
sector MIS e.g. HMIS and EMIS.
• LoGICS is used and seen as a secondary
data reservoir.
• Lack of a clear strategy for, and
investment, in data collection.
• Formulate policy to guide LGs on ICT
matters including roles of stakeholders,
procurement and standardisation.
• Increase the human resource base and
enhance training.
• Ensure LOGICS is interfaced with other
sector MIS like IFMIS, EMIS, HMIS etc and
other Local Government systems.
• Change the role of LoGICS at the District
level from a secondary data reservoir to
an active MIS (District Master Database).
• Enhance the rollout strategy for, and
investment in, data collection and ensure
ownership and commitment of top
management
• Establish a statistics unit.
• Improve data flows.
• Link up LoGICS with other MIS.
• Train staff of established statistics unit in IT,
production, analysis dissemination and
use of statistics and other areas
depending on their actual needs.
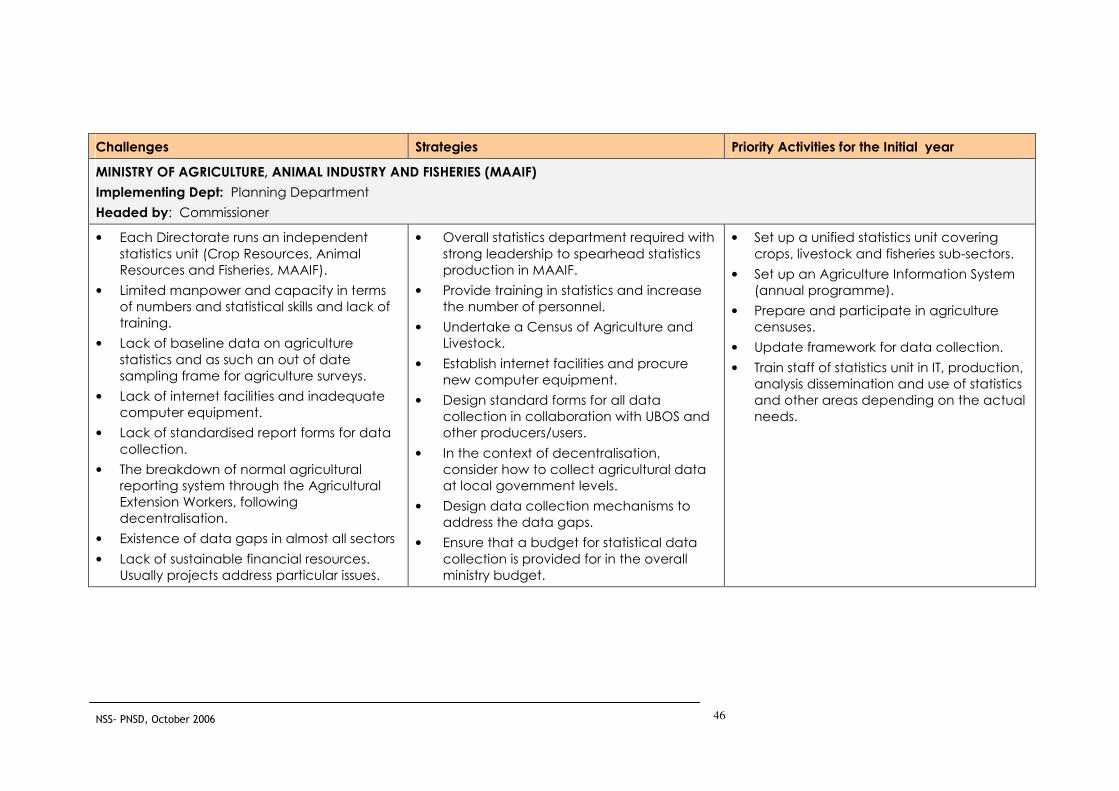
NSS- PNSD, October 2006
46
Challenges Strategies Priority Activities for the Initial year
MINISTRY OF AGRICULTURE, ANIMAL INDUSTRY AND FISHERIES (MAAIF)
Implementing Dept: Planning Department
Headed by: Commissioner
• Each Directorate runs an independent
statistics unit (Crop Resources, Animal
Resources and Fisheries, MAAIF).
• Limited manpower and capacity in terms
of numbers and statistical skills and lack of
training.
• Lack of baseline data on agriculture
statistics and as such an out of date
sampling frame for agriculture surveys.
• Lack of internet facilities and inadequate
computer equipment.
• Lack of standardised report forms for data
collection.
• The breakdown of normal agricultural
reporting system through the Agricultural
Extension Workers, following
decentralisation.
• Existence of data gaps in almost all sectors
• Lack of sustainable financial resources.
Usually projects address particular issues.
• Overall statistics department required with
strong leadership to spearhead statistics
production in MAAIF.
• Provide training in statistics and increase
the number of personnel.
• Undertake a Census of Agriculture and
Livestock.
• Establish internet facilities and procure
new computer equipment.
• Design standard forms for all data
collection in collaboration with UBOS and
other producers/users.
• In the context of decentralisation,
consider how to collect agricultural data
at local government levels.
• Design data collection mechanisms to
address the data gaps.
• Ensure that a budget for statistical data
collection is provided for in the overall
ministry budget.
• Set up a unified statistics unit covering
crops, livestock and fisheries sub-sectors.
• Set up an Agriculture Information System
(annual programme).
• Prepare and participate in agriculture
censuses.
• Update framework for data collection.
• Train staff of statistics unit in IT, production,
analysis dissemination and use of statistics
and other areas depending on the actual
needs.

NSS- PNSD, October 2006
47
Challenges Strategies Priority Activities for the Initial year
MINISTRY OF HEALTH (MOH)
Implementing Dept: Resource Centre Division
Headed by: Assistant Commissioner for Health Services
• Data is currently facility based and does
not include community data. It therefore
provides an incomplete representation of
the real situation in communities.
• Lack of mechanisms in place to obtain
data from private service providers due to
poor co-ordination of data producers, users
and suppliers
• With inadequate integration, information
sub-systems have emerged. This has made
existing systems inefficient due to the
unnecessary demands placed on
producers of data especially at health unit
level.
• Insufficient funding due to limited budget
support for the provision and use of data.
Technical support supervision, training and
dissemination of data are seldom carried
out due to lack of funds.
• Due to insufficient funding, activities are
either delayed or not implemented.
• Human resource capacity to handle data
and equipment in the sector remains
inadequate.
• Insufficient statistical infrastructure in place.
• Expand data collection to community
levels.
• Improve the coordination and
management of all data producers, users
and suppliers.
• Procure and install WAN and LAN
equipment to support the use of HMIS at
both national and district levels to avoid
the emergence of information subsystems.
• Improve funding and mainstream
statistical activities in order to improve the
timeliness of data production.
• Facilitate recruitment of staff appropriate
for data management and provide
training on data analysis.
• Establish a database for routine and non-
routine data and complete development
of the databank
• Improve data collection by increasing
compliance/response of the private
sector.
• Review tools for data collection.
• Prepare Health Metrics Network (HMN)
strategy.
• Identify priorities not captured by the HMN
strategy.
• Train staff of statistics unit in IT, production,
analysis dissemination and use of statistics
and other areas depending on their
actual needs.

NSS- PNSD, October 2006
48
Challenges Strategies Priority Activities for the Initial year
MINISTRY OF EDUCATION AND SPORTS (MOES)
Implementing Dept: Statistics and Data Processing Section (SDPS) in the Education Planning Dept (EPD)
Headed by: Commissioner
• Higher Gross Enrolment Ratio (GER) and Net
Enrolment Ratio (NER) than expected i.e. NER is
above 100%. Estimation of foreign pupils
attending schools in Uganda is problematic.
These data limitations impact on the quality of
statistics.
• Inflexibility in handling new data demands and
unmet needs.
• Bureaucracy within and outside the various
organisations delays the linking of EMIS data
with other information systems and prevents
speedy access to
complementary/supplementary data from
other sources e.g. Exams/performance from
Uganda National Examinations Board (UNEB),
household surveys from the Uganda Bureau of
Statistics (UBOS).
• Non-reporting schools, especially those in the
private sector, make it difficult to produce
accurate estimates of enrolment.
• The IT and physical infrastructure both at the
centre and in local governments is outdated
and requires replacement.
• Staff lack necessary IT skills and require training
in, among others, Microsoft Certified Systems
Engineer (MCSE) and Microsoft Certified
Database Administration (MCDBA)
• Improve records at institution level through the
introduction of uniform records and
institutionalisation of birth certificates in the
education system.
• Create a one-stop centre for all data
requirements for the entire sector thus eliminating
duplication, and formalise a user consultation
mechanism
• Apply appropriate measures improve the
response rates of data suppliers including
designing strategies to improve response rates of
secondary and tertiary sub sectors through
sensitisation of data providers.
• Improve the infrastructure and sustain it (both
hard- and softwares).
• Integrate all subsystems into one (i.e. different
sub sectors e.g. pre-primary, primary, and
secondary) and simplify EMIS interfaces so that
the system is easier to use and eliminate.
• Continually enhance the quality of data by
eliminating errors/misreporting of data sources
and improving the accuracy during data
processing.
• Improve utilisation of the EMIS data and
strengthen the currently weak integration with
other systems and efforts e.g. UNEB, school
• Strengthen the statistics unit.
• Improve EMIS.
• Prepare a replacement plan for
IT equipment.
• Ensure that other agencies
responsible for tertiary
education, especially the
private sector, provide data
(comply with requirements of
reporting).
• Expand the database to
include tertiary institutions and
other sub-sectors in education.
• Train staff of statistics unit in IT,
production, analysis
dissemination and use of
statistics and other areas
depending on their actual
needs.

NSS- PNSD, October 2006
49
Challenges Strategies Priority Activities for the Initial year
MINISTRY OF EDUCATION AND SPORTS (MOES)
Implementing Dept: Statistics and Data Processing Section (SDPS) in the Education Planning Dept (EPD)
Headed by: Commissioner
• EMIS interfaces are complicated and not all
stakeholders are able to utilise. They therefore
need to be simplified.
• Lack of centralised data collection unit with
multiple data collection departments in
existence, resulting in duplication of efforts.
• Quality of data sources is poor i.e. at
institutional levels, local government levels and
at the centre.
mapping, MPS, MoFPED and UBOS.
• Design and establish a District-based
computerised EMIS to improve data processing
and data analysis at District levels

NSS- PNSD, October 2006
50
Challenges Strategies Priority Activities for the Initial year
UGANDA POLICE
Implementing Dept: Does not exist
Headed by: Not identified
• Currently, there is no Police Information
System Centre in Uganda. The Police
system is characterised by a decentralised
system with isolated and uncoordinated
pockets of statistical units at different levels
of development found at district, Sub
County and parish levels.
• No statistical unit exists.
• The collection, analysis and dissemination
of statistics is poor, inaccurate, untimely
and uncoordinated.
• Lack of adequately trained personnel in
the production of statistics
• Limited use and sharing of existing data as
police information flows are through
channels of command.
• Data collected use outdated forms and
books which were designed during the
colonial times.
• Inadequate computer equipment to
capture the data and as such data are
stored manually in files
• Put in place a Police Information System –
POLIS
• Establish a statistical unit/department to
strengthen data production and ensure
the coordination and utilisation of Police
Force statistics.
• Improve on collection, analysis and
dissemination techniques through the
revision of the data production
instruments and methodologies.
• Train staff involved in the production and
management of statistics.
• Develop and implement a policy guide to
govern the dissemination, sharing and use
of data.
• Update forms and books in line with the
changing times and provide necessary IT
equipment to the statistical unit.
• Set up an MIS and provide IT equipment
required to support this system.
• Link the MIS with the GIS facility.
• Establish a statistics unit as part of the
Research Department or subsume the
research unit to statistics unit and properly
equip it with IT equipment.
• Review the instruments being used for
data collection.
• Train in IT, GIS, production, analysis
dissemination and use of statistics and
other areas depending on their actual
needs.
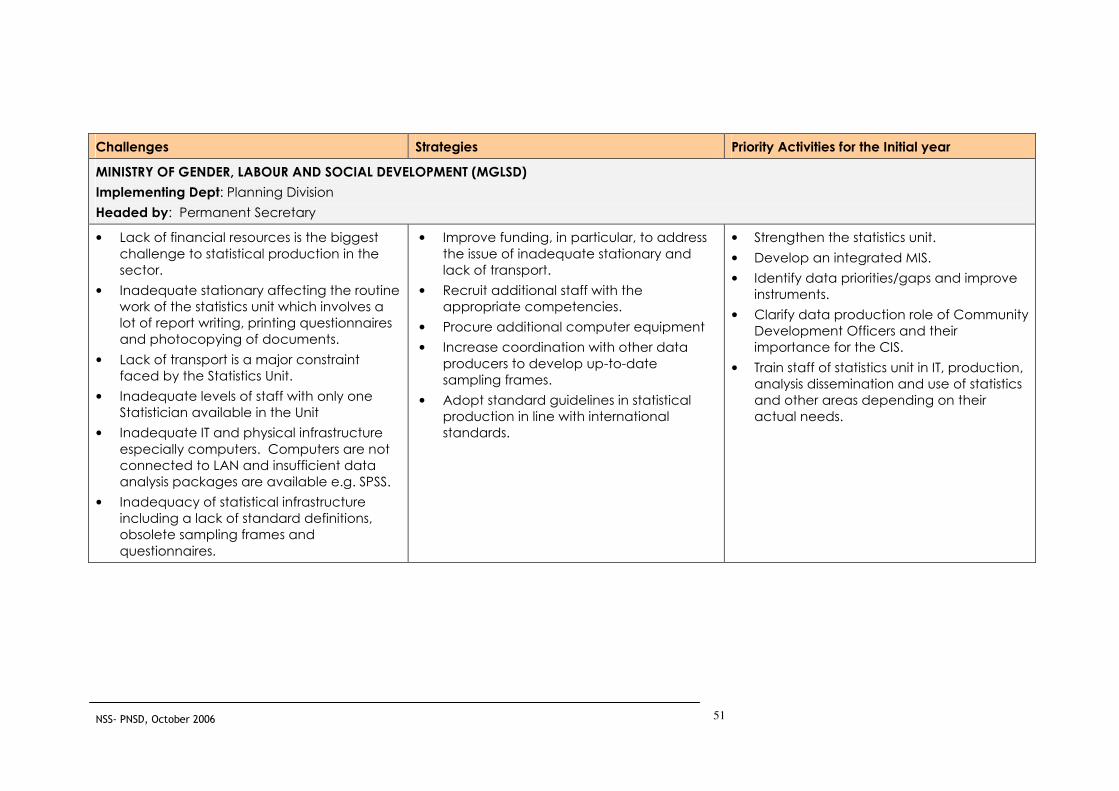
NSS- PNSD, October 2006
51
Challenges Strategies Priority Activities for the Initial year
MINISTRY OF GENDER, LABOUR AND SOCIAL DEVELOPMENT (MGLSD)
Implementing Dept: Planning Division
Headed by: Permanent Secretary
• Lack of financial resources is the biggest
challenge to statistical production in the
sector.
• Inadequate stationary affecting the routine
work of the statistics unit which involves a
lot of report writing, printing questionnaires
and photocopying of documents.
• Lack of transport is a major constraint
faced by the Statistics Unit.
• Inadequate levels of staff with only one
Statistician available in the Unit
• Inadequate IT and physical infrastructure
especially computers. Computers are not
connected to LAN and insufficient data
analysis packages are available e.g. SPSS.
• Inadequacy of statistical infrastructure
including a lack of standard definitions,
obsolete sampling frames and
questionnaires.
• Improve funding, in particular, to address
the issue of inadequate stationary and
lack of transport.
• Recruit additional staff with the
appropriate competencies.
• Procure additional computer equipment
• Increase coordination with other data
producers to develop up-to-date
sampling frames.
• Adopt standard guidelines in statistical
production in line with international
standards.
• Strengthen the statistics unit.
• Develop an integrated MIS.
• Identify data priorities/gaps and improve
instruments.
• Clarify data production role of Community
Development Officers and their
importance for the CIS.
• Train staff of statistics unit in IT, production,
analysis dissemination and use of statistics
and other areas depending on their
actual needs.
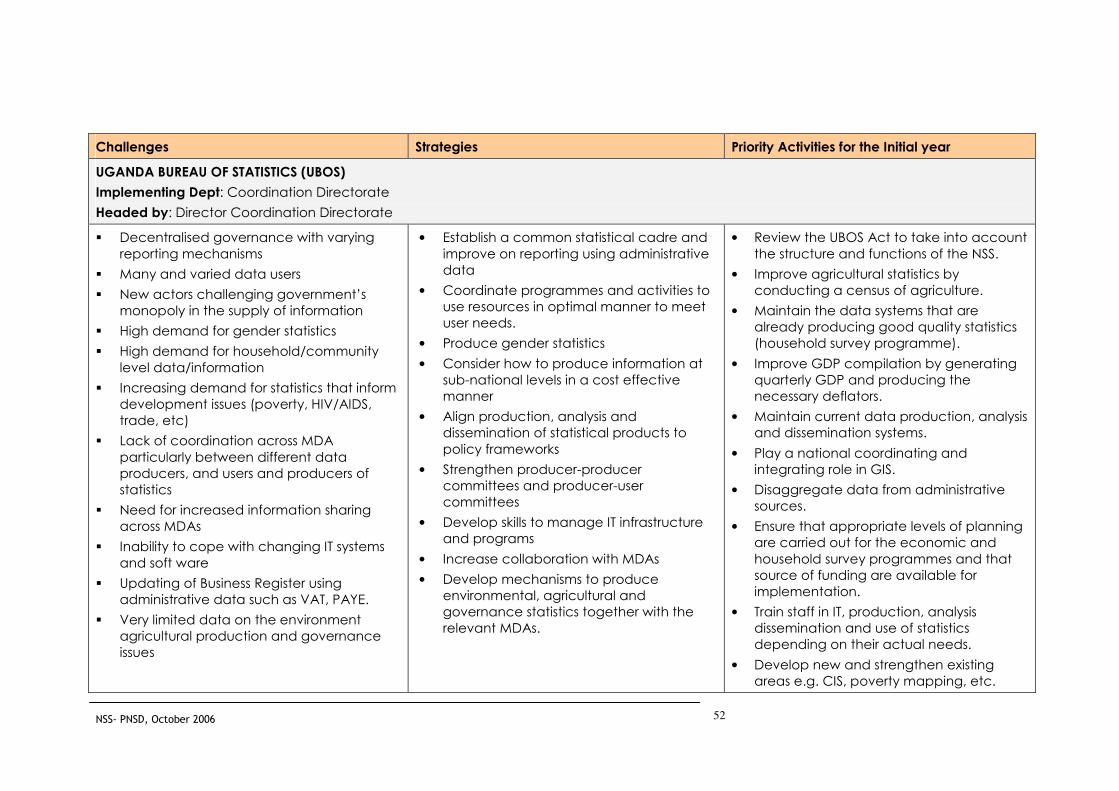
NSS- PNSD, October 2006
52
Challenges Strategies Priority Activities for the Initial year
UGANDA BUREAU OF STATISTICS (UBOS)
Implementing Dept: Coordination Directorate
Headed by: Director Coordination Directorate
� Decentralised governance with varying
reporting mechanisms
� Many and varied data users
� New actors challenging government’s
monopoly in the supply of information
� High demand for gender statistics
� High demand for household/community
level data/information
� Increasing demand for statistics that inform
development issues (poverty, HIV/AIDS,
trade, etc)
� Lack of coordination across MDA
particularly between different data
producers, and users and producers of
statistics
� Need for increased information sharing
across MDAs
� Inability to cope with changing IT systems
and soft ware
� Updating of Business Register using
administrative data such as VAT, PAYE.
� Very limited data on the environment
agricultural production and governance
issues
• Establish a common statistical cadre and
improve on reporting using administrative
data
• Coordinate programmes and activities to
use resources in optimal manner to meet
user needs.
• Produce gender statistics
• Consider how to produce information at
sub-national levels in a cost effective
manner
• Align production, analysis and
dissemination of statistical products to
policy frameworks
• Strengthen producer-producer
committees and producer-user
committees
• Develop skills to manage IT infrastructure
and programs
• Increase collaboration with MDAs
• Develop mechanisms to produce
environmental, agricultural and
governance statistics together with the
relevant MDAs.
• Review the UBOS Act to take into account
the structure and functions of the NSS.
• Improve agricultural statistics by
conducting a census of agriculture.
• Maintain the data systems that are
already producing good quality statistics
(household survey programme).
• Improve GDP compilation by generating
quarterly GDP and producing the
necessary deflators.
• Maintain current data production, analysis
and dissemination systems.
• Play a national coordinating and
integrating role in GIS.
• Disaggregate data from administrative
sources.
• Ensure that appropriate levels of planning
are carried out for the economic and
household survey programmes and that
source of funding are available for
implementation.
• Train staff in IT, production, analysis
dissemination and use of statistics
depending on their actual needs.
• Develop new and strengthen existing
areas e.g. CIS, poverty mapping, etc.

NSS- PNSD, October 2006
53
ANNEX 3: PNSD LOGICAL FRAMEWORK
Narrative Summary Key Performance indicators Means of Verification Important Assumptions
Strategic Framework
Vision
To be a World Class Statistical System Improve WB statistical capacity
indicator score from 73% in 2006
to 85% by 2011.
By 2011, all statistics produced
according to internationally
recognised standards, where
appropriate.
Compliance with GDDS
standards.
WB website
Quarterly progress reports,
statistical audits.
Assessment against GDDS
standards.
Continued commitment across
GoU to the production and use
of statistics
GoU commits adequate
resources to the NSS.
Mission
To develop a coherent, reliable,
efficient and demand-driven NSS that
supports management and
development initiatives
Implementation of sector
strategies according to
timetable.
Annual increase in resource
allocation to the NSS.
Resources for implementation of
the key data priorities identified
in the MTEF.
Increase in user satisfaction in
Quarterly and annual progress
reports
MTEF
MDAs are committed to
implementation of their sector
strategies.
Capacity is built for
implementation
GoU commit adequate
resources to the NSS.

NSS- PNSD, October 2006
54
Narrative Summary Key Performance indicators Means of Verification Important Assumptions
national statistics by 20% from
2006/7 to 2010/11 (baseline to
be defined).
NSS Steering Committee
established by 2006/7 with both
users and producers as members
of the Committee.
Statistics Act in place by
2006/07.
User survey
Board members acceptance
letters
Minutes of meetings
Act assented.
MDAs acceptance of UBOS’s
coordination role.
GoU willing to use statistics in
national policy making
Planning and budgeting systems
in place.
Strategic Objectives
1. To contribute towards the
development of an information
society
1.1 Statistics are released in a
pre-announced schedule
and are made available to
all users at the same time.
1.2 Press releases and briefings
accompany all major data
dissemination activities (list
major data activities).
1.3 Good quality NSS statistical
abstract produced by end of
May every year.
1.4 No. of visitors to NSS resource centre increased by 50%
between 2006/7 and
2010/11.
1.5 NSS website developed and operating by 2007/8.
Publication of calendar on
website and sent to key users
Dissemination events. Media
reports.
Annual reports – use of data in
background to the budget.
NSS resource centre records
Existence of NSS website
Resources available for
implementation.
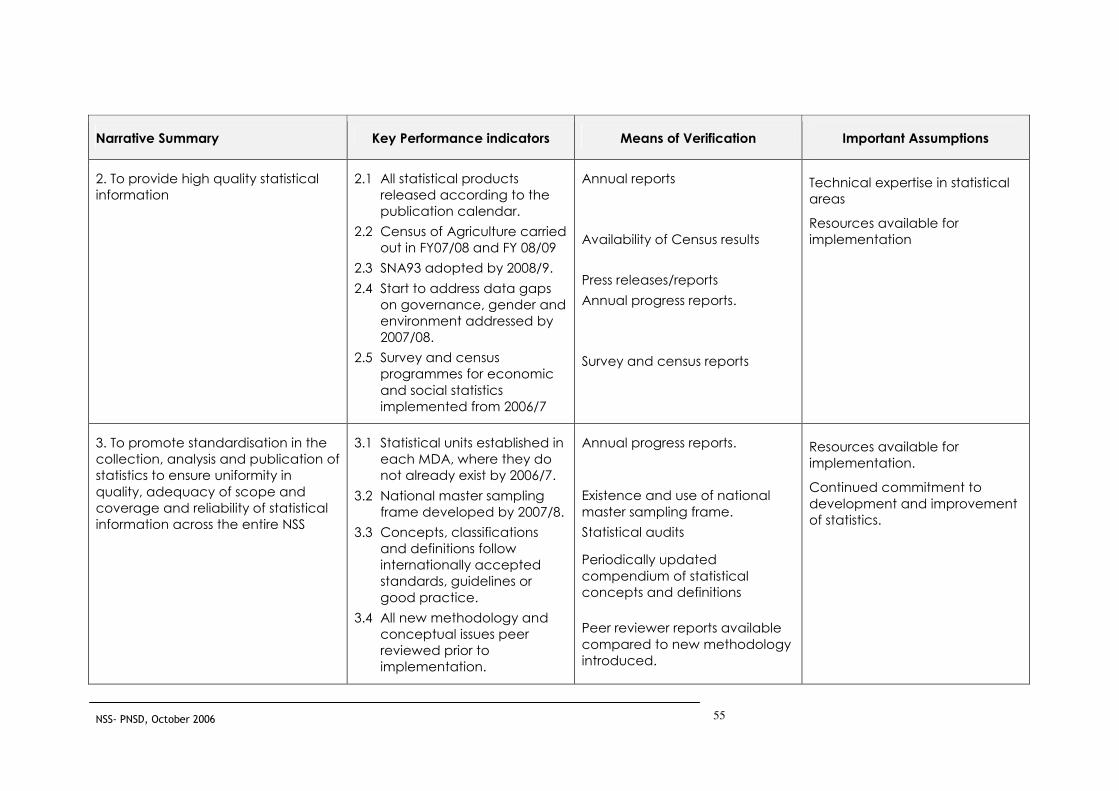
NSS- PNSD, October 2006
55
Narrative Summary Key Performance indicators Means of Verification Important Assumptions
2. To provide high quality statistical
information
2.1 All statistical products
released according to the
publication calendar.
2.2 Census of Agriculture carried
out in FY07/08 and FY 08/09
2.3 SNA93 adopted by 2008/9.
2.4 Start to address data gaps
on governance, gender and
environment addressed by
2007/08.
2.5 Survey and census
programmes for economic
and social statistics
implemented from 2006/7
Annual reports
Availability of Census results
Press releases/reports
Annual progress reports.
Survey and census reports
Technical expertise in statistical
areas
Resources available for
implementation
3. To promote standardisation in the
collection, analysis and publication of
statistics to ensure uniformity in
quality, adequacy of scope and
coverage and reliability of statistical
information across the entire NSS
3.1 Statistical units established in
each MDA, where they do
not already exist by 2006/7.
3.2 National master sampling
frame developed by 2007/8.
3.3 Concepts, classifications
and definitions follow
internationally accepted
standards, guidelines or
good practice.
3.4 All new methodology and
conceptual issues peer
reviewed prior to
implementation.
Annual progress reports.
Existence and use of national
master sampling frame.
Statistical audits
Periodically updated
compendium of statistical
concepts and definitions
Peer reviewer reports available
compared to new methodology
introduced.
Resources available for
implementation.
Continued commitment to
development and improvement
of statistics.

NSS- PNSD, October 2006
56
Narrative Summary Key Performance indicators Means of Verification Important Assumptions
3.5 GIS standards and common
definitions used across NSS
by 2008/9.
Annual progress reports.
4. To provide guidance, develop skills
and provide other assistance that
may be required by users and
providers of statistics
4.1 All MDA staff involved in
statistics have basic
computer literacy skills (e.g.
word, excel) by 2010/11.
4.2 At least one member of staff
within a MDA has advanced
computer skills (e.g. Access
and Stata) by 2010/11.
4.3 At least 50 users trained each year in accessing and
analysing data.
Annual progress reports.
Annual progress reports.
Annual progress reports.
Resources available for
implementation.
5. To promote cooperation,
coordination and rationalisation
among users and providers of
statistics at national and local level so
as to avoid duplication of effort and
ensure optimal use of scarce
resources
5.1 NSS Steering Committee
meets 3 times a year from
2006/7.
5.2 NSS/PNSD basket fund
mechanism designed and in
place by 2006/7.
5.3 Extranets in place for internal communication within the
NSS by 2010/11.
5.4 National databank for NSS in place by 2010/11.
5.5 Planning and budgeting for NSS feeding into MTEF from
Meeting minutes
Memorandum of Understanding
between key stakeholders.
Existence of operational
Extranets
Existence of operational national
databank
Financial reports.
Donors able to provide funding
through a basket arrangement.
Resources available for
implementation.
Effective coordination across
NSS.
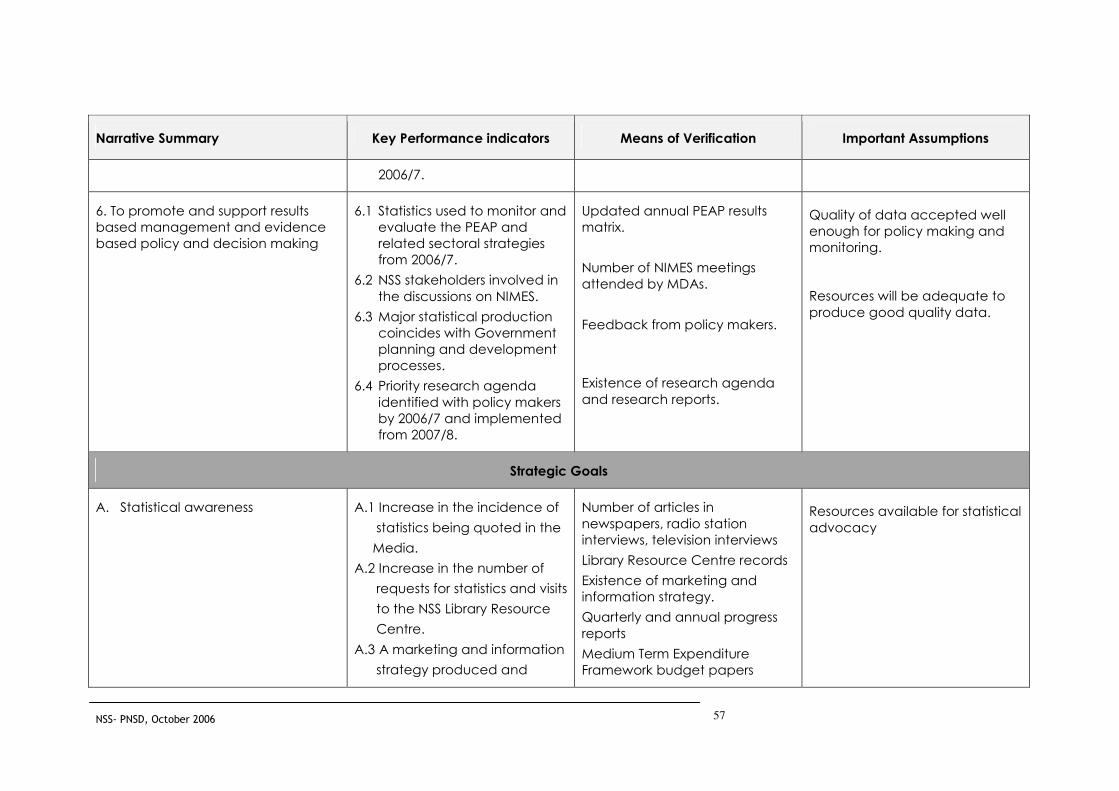
NSS- PNSD, October 2006
57
Narrative Summary Key Performance indicators Means of Verification Important Assumptions
2006/7.
6. To promote and support results
based management and evidence
based policy and decision making
6.1 Statistics used to monitor and
evaluate the PEAP and
related sectoral strategies
from 2006/7.
6.2 NSS stakeholders involved in
the discussions on NIMES.
6.3 Major statistical production
coincides with Government
planning and development
processes.
6.4 Priority research agenda
identified with policy makers
by 2006/7 and implemented
from 2007/8.
Updated annual PEAP results
matrix.
Number of NIMES meetings
attended by MDAs.
Feedback from policy makers.
Existence of research agenda
and research reports.
Quality of data accepted well
enough for policy making and
monitoring.
Resources will be adequate to
produce good quality data.
Strategic Goals
A. Statistical awareness A.1 Increase in the incidence of
statistics being quoted in the
Media.
A.2 Increase in the number of
requests for statistics and visits
to the NSS Library Resource
Centre.
A.3 A marketing and information
strategy produced and
Number of articles in
newspapers, radio station
interviews, television interviews
Library Resource Centre records
Existence of marketing and
information strategy.
Quarterly and annual progress
reports
Medium Term Expenditure
Framework budget papers
Resources available for statistical
advocacy

NSS- PNSD, October 2006
58
Narrative Summary Key Performance indicators Means of Verification Important Assumptions
implemented by 2007
A.4 Increase in resource
allocation to the
development of statistics
B. Organizational and institutional
development
B.1 Statistics Act in place by
2006/7
B.2 Statistical units functioning in
all first phase MDAs by 2006/7
B.3 The concept for the regional
zonal offices developed and
approved by 2010/11.
B.4 All surveys and censuses
carried out in consultation
with MDAs by June 2007.
B.5 Compendium of statistical
concepts, standards and
definitions updated, approved
by 2007/8 and used by
2010/11.
B.6 Each MDA produces at least
3, 5, 7 pieces of research in
collaboration with research
centres by 2007/8, 2009/10
and 2010/11 respectively.
B.7 The concept for the common
Statistics Act assented
MDA quarterly/annual reports.
Cabinet memos.
Survey and census reports
Reports
Government supportive of
strengthening organisational
and institutional development.
Resources available for
implementation
Research centres willing to
participate

NSS- PNSD, October 2006
59
Narrative Summary Key Performance indicators Means of Verification Important Assumptions
statistics service developed
and approved by 2010/11.
B.8 NSS Resource centre
functioning by 2007/08
C. Human resource development
and management
C.1 Human resource
management framework for
the NSS developed by 2006/7
and fully implemented by
2010/11.
C.2 Training programme for
MDAs developed and
implemented by 2006/7.
C.3 All higher education
institutions offer statistics as a
component of the curricula
by 2010/11
C.4 Increase the membership of
the Uganda Statistical
Society by 20% and 50% by
2008/9 and 2010/11
respectively and increase the
proportion of professionals.
Quarterly and annual progress
reports.
Curriculum
Resources available for
implementation
Ministry of Education and Sports
and higher education institutions
willing to change curriculum.
Willingness of professionals to
become members of USS.
D. Infrastructural development D.1 All Phase 1 MDAs have
office space, which are
Quarterly and annual progress
reports. Resources available for
implementation

NSS- PNSD, October 2006
60
Narrative Summary Key Performance indicators Means of Verification Important Assumptions
furnished and equipped by
2006/7.
D.2 All MDAs update the list of
relevant institutions at least
annually
from 2006/7
D.3 Business register updated by
2006/7, thereafter updated
continuously, and available
on request.
D.4 Establish minimum standards
for IT in collaboration with
the Ministry of ICT by 2007/8.
D.5 All MDA’s have sectoral
databases by 2007/8.
Annual progress reports.
Cabinet memos
E. Data development E.1 Data needs assessment and
an inventory of data
undertaken for each MDA
by 2006/7 and thereafter
annually.
E.2 All data collection in line
with key development and
policy processes (e.g. PEAP
revision) by 2010/11.
Reports on data needs and
priorities.
Feedback from policy makers.
MoU’s
Household survey programme.
Quarterly and annual progress
reports.
Financial reports.
Census programme and results
from Census of Agriculture and
Resources available for
implementation
Development and policy
processes are predictable.
Willingness of MDAs to share
information.
Research centres willing to

NSS- PNSD, October 2006
61
Narrative Summary Key Performance indicators Means of Verification Important Assumptions
E.3 Year on year increase in the
number of Memoranda of
Understanding agreed
between MDAs for the
sharing of data.
E.4 Proposed ten year
household survey
programme implemented
and updated in 2008/9.
E.5 For all surveys, results
available within 6 months of
the end of data collection
period by 2007/8.
E.6 Unit cost of undertaking
surveys reduces by 10% by
2010/11.
E.7 Census programme in place
by 2006/7 with Census of
Agriculture implemented in
2007-9, and Census of
Business Establishments in
2008/9.
E.8 Scope and coverage of
administrative data
improved continuously in line
COBE.
Statistical audit reports
NSS annual report
Existence of standards and
guidelines
participate.
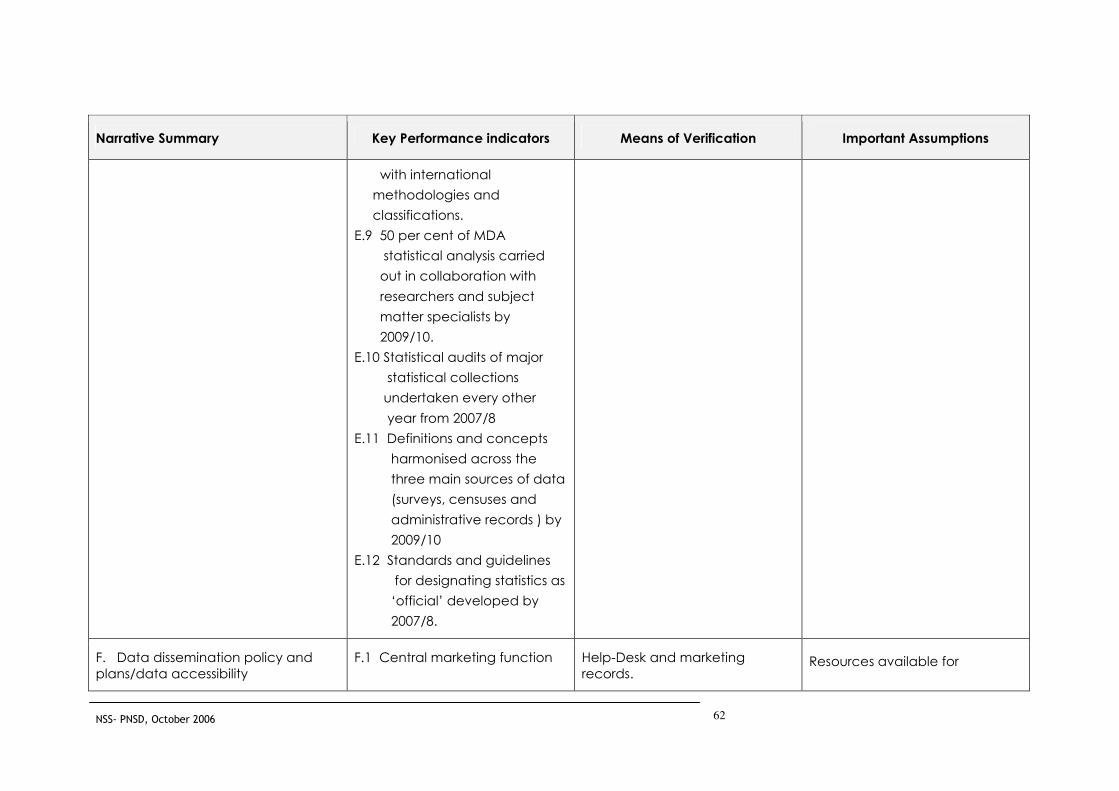
NSS- PNSD, October 2006
62
Narrative Summary Key Performance indicators Means of Verification Important Assumptions
with international
methodologies and
classifications.
E.9 50 per cent of MDA
statistical analysis carried
out in collaboration with
researchers and subject
matter specialists by
2009/10.
E.10 Statistical audits of major
statistical collections
undertaken every other
year from 2007/8
E.11 Definitions and concepts
harmonised across the
three main sources of data
(surveys, censuses and
administrative records ) by
2009/10
E.12 Standards and guidelines
for designating statistics as
‘official’ developed by
2007/8.
F. Data dissemination policy and
plans/data accessibility
F.1 Central marketing function Help-Desk and marketing
records. Resources available for
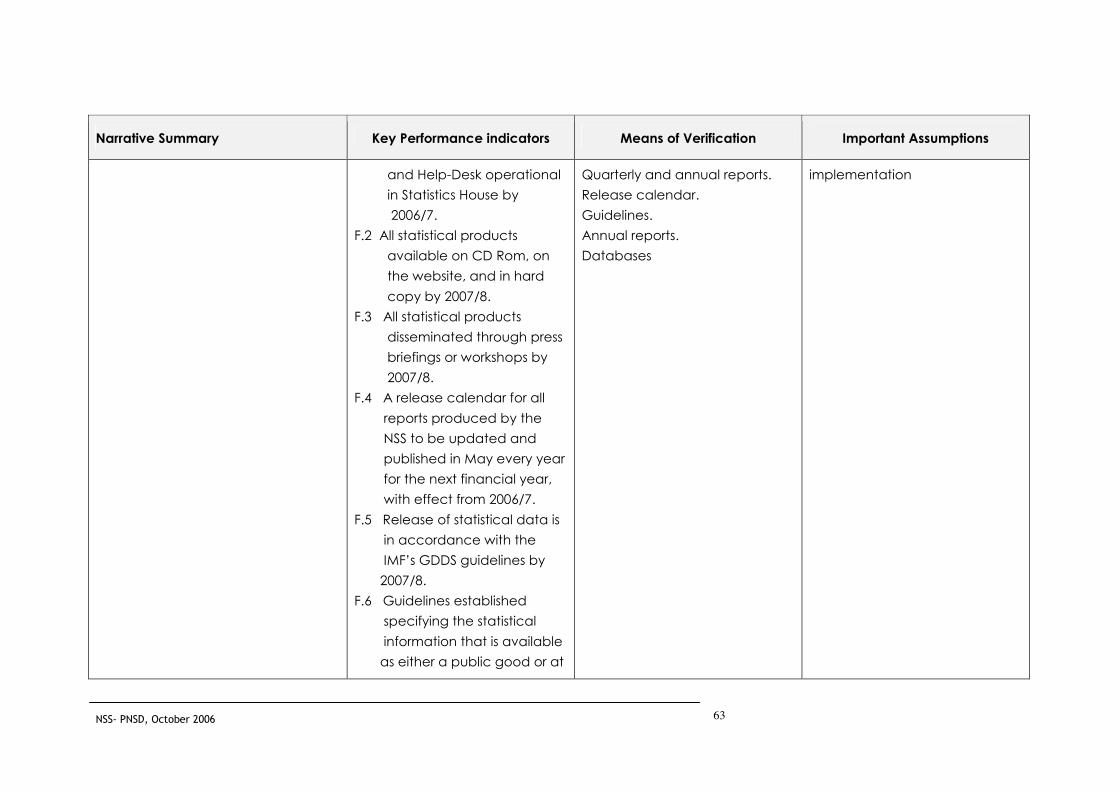
NSS- PNSD, October 2006
63
Narrative Summary Key Performance indicators Means of Verification Important Assumptions
and Help-Desk operational
in Statistics House by
2006/7.
F.2 All statistical products
available on CD Rom, on
the website, and in hard
copy by 2007/8.
F.3 All statistical products
disseminated through press
briefings or workshops by
2007/8.
F.4 A release calendar for all
reports produced by the
NSS to be updated and
published in May every year
for the next financial year,
with effect from 2006/7.
F.5 Release of statistical data is
in accordance with the
IMF’s GDDS guidelines by
2007/8.
F.6 Guidelines established
specifying the statistical
information that is available
as either a public good or at
Quarterly and annual reports.
Release calendar.
Guidelines.
Annual reports.
Databases
implementation

NSS- PNSD, October 2006
64
Narrative Summary Key Performance indicators Means of Verification Important Assumptions
a fee by 2006/7.
F.7 A year on year increase in
the number of micro-data-
sets available to researchers
on request.
F.8 Standardised and
harmonised databases
containing data from
different MDAs established
by 2009/10.
F.9 One workshop held per year
to train existing and
potential users of statistics
on accessing and using
data.

NSS- PNSD, October 2006
65
Acknowledgements
The PNSD Design Team would like to express its appreciation to the following people who
contributed to the preparation of the PNSD document:
1. Mr. Tony Williams, PARIS21
2. Ms. Kim Bradford Smith, DFID
3. Mr. Graham Eele, World Bank, Washington, USA
4. Ms. Jill Fletcher, DFID Statistical Advisor, UBOS
5. Prof. Ben Kiregyera, Chairman, UBOS Board
6. Chief O.O. Ajayi, AfDB, International Consultant
7. Mr. John Nsubuga-Kiyaga, PNSD National Consultant
8. Mr. Enock Mugyenyi, PNSD National Consultant
9. Ms. Feddy Mwerinde, PNSD National Consultant
10. Dr. C. Tizikara, Editor
11. All MDA Contact persons
UBOS PNSD Design Team
Mr. John B. Male-Mukasa
Mrs. Norah Madaya, PNSD Coordinator
Mr. Ben Paul Mungyereza,
Mr. James Muwonge
Ms. Imelda Musana
Special tribute goes to the entire UBOS fraternity for the significant role played throughout the
design of the PNSD.
![2012 PL CR final[1] - Cedefop · 2014. 11. 5. · 2012 national statistical Office, Warsaw 2012), GUS, Warszawa 2012 ... p. 17; Central Statistical Office, Prognoza ludności Polski](https://cdn.vdocuments.us/doc/165x107/60da69d007789c3c6851eb76/2012-pl-cr-final1-cedefop-2014-11-5-2012-national-statistical-office-warsaw.jpg)


