
rusar r%mumat rviaiuumar t%vLauciu, a I fNIVERSITI MALAYSIA SARAWAK
P. KHIDMAT MAKLUMAT AKADEMIK UNIMAS
1111111111111111111111111111 1000165786
DEVELOPMENT AND PERFORMANCE TESTS OF A SEDIMENTATION TRAP FOR SILT AND CLAY PARTICLES
PEDO ANAK EWAT
This project is submitted in partial fulfillment of the requirements for the Degree of Bachelor of Engineering with
Honours (Civil Engineering)
Faculty of Engineering UNIVERSITI MALAYSIA SARAWAK
2006

To my beloved parents
and
my siblings
i

ACKNOWLEDGEMENT
First and foremost, I would like to express my sincere gratitude to my supervisor, Ir.
Dr. Law Puong Ling, who has guided me along the whole research project and gave
me many useful theory guidance and suggestions during the process of this research.
I gratefully acknowledge all the technicians in Civil and Environmental Laboratories,
especially Mr Rozaini Ahmad, for his technical help during the preparation of
apparatus and running of experiments. Special thanks to Dr Kolay Kumar for
providing the hydrometer analysis procedure for determining the soil particle sizes
and Prof. F. J Putuhena for his advice regarding to the usage of Manning's formula.
My thanks also go to Jabatan Kerja Raya (JKR) for providing me with useful
information.
Finally, my deepest gratitude goes to my family for much love, patience and support
throughout the entire time of my study that led to the completion of this thesis.
ii

ABSTRACT
This research project focuses on the design, development and performance tests of a
sedimentation trap model regarding to its usage in civil engineering construction site
to remove or reduce the suspended solids (SS), especially for light soil particles such
as silt and clay contained in the surface runoffs. The system consists of two
components; a) the channel or drainage which is the main collecting point for the
surface runoff, and b) the sedimentation trap at which the main sedimentation
activities of suspended solids particles take place. The silt trap is divided into four
zones, namely i) Inlet Zone ii) Sedimentation/Settling Zone iii) Sludge Zone iv)
Outlet Zone. The flowrate values, Q= 3L/min and 5L/min are selected due to the
considerations on the size of the model and the apparatus for the experiment. For this
applied experimental research, it was found that at influent SS level of approximately
264 mg/L and flowrate, Q=3 L/min, the sedimentation trap would experience
sediment removal rate of approximately 23.11%; At influent SS level of
approximately 390 mg/L and flowrate, Q=3 L/min, the silt trap would operate in
approximately 17.18% sediments removal rate; and at influent SS level of
approximately 378 mg/L and Q=5 L/min, the performance of the system would be
about 12.17%. A11.14% reduction in sediment could be achieved with an influent SS
level of about 440 mg/L and Q=5 L/min.
111

ABSTRAK
Projek penyelidikan ini merupakan satu hasil kerja yang menumpukan kepada rekaan,
pembangunan dan ujian kecekapan bagi model sistem perangkap kelodak dan
lumpur. Objektif utama sistem ini adalah untuk mengurangkan dan menyingkirkan
kandungan partikel tanah terampai yang terkandung di dalam air kelodak yang
dilepaskan dari tapak pembinaan. Sistem ini terdiri daripada dua komponen; iaitu a)
terusan atau parit di mana ia berfungsi sebagai pusat pengumpulan dan laluan bagi air
kelodak yang dilepaskan dari tapak pembinaan, dan b) perangkap kelodak dan lumpur
di mana proses utama sedimentasi akan berlaku. Perangkap kelodak dan lumpur ini
dibahagikan kepada empat zon iaitu i) saluran masuk dari sistem perparitan ii) zon
sedimentasi iii) zon pengumpulan lumpur dan iv) saluran keluar. Kadar aliran air, Q=
3L/min dan 5L/min diaplikasikan di dalam eksperimen ini setelah mengambil kira
spesifikasi model dan kesesuaian peralatan eksperimen. Daripada eksperimen yang
telah dijalankan, didapati bahawa peratus kecekapan penyingkiran partikel tanah
terampai dari air kelodak bagi kepekatan ampaian permulaan 264 mg/L, 390 mg/L
dan kadar aliran air, Q=3 L/min ialah masing-masing 23.11 peratus dan 17.18
peratus. Bagi kepekatan ampaian permulaan 378 mg/L, 440 mg/L dan kadar aliran
air, Q=5 L/min, peratus kecekapan penyingkiran partikel tanah terampai ialah
masing-masing 12.17 peratus dan 1 1.14 peratus.
iv
Pusat Khldmat Nýakluruat tucademtx UfYIVERSITI MALAYSIA SARAWAK.
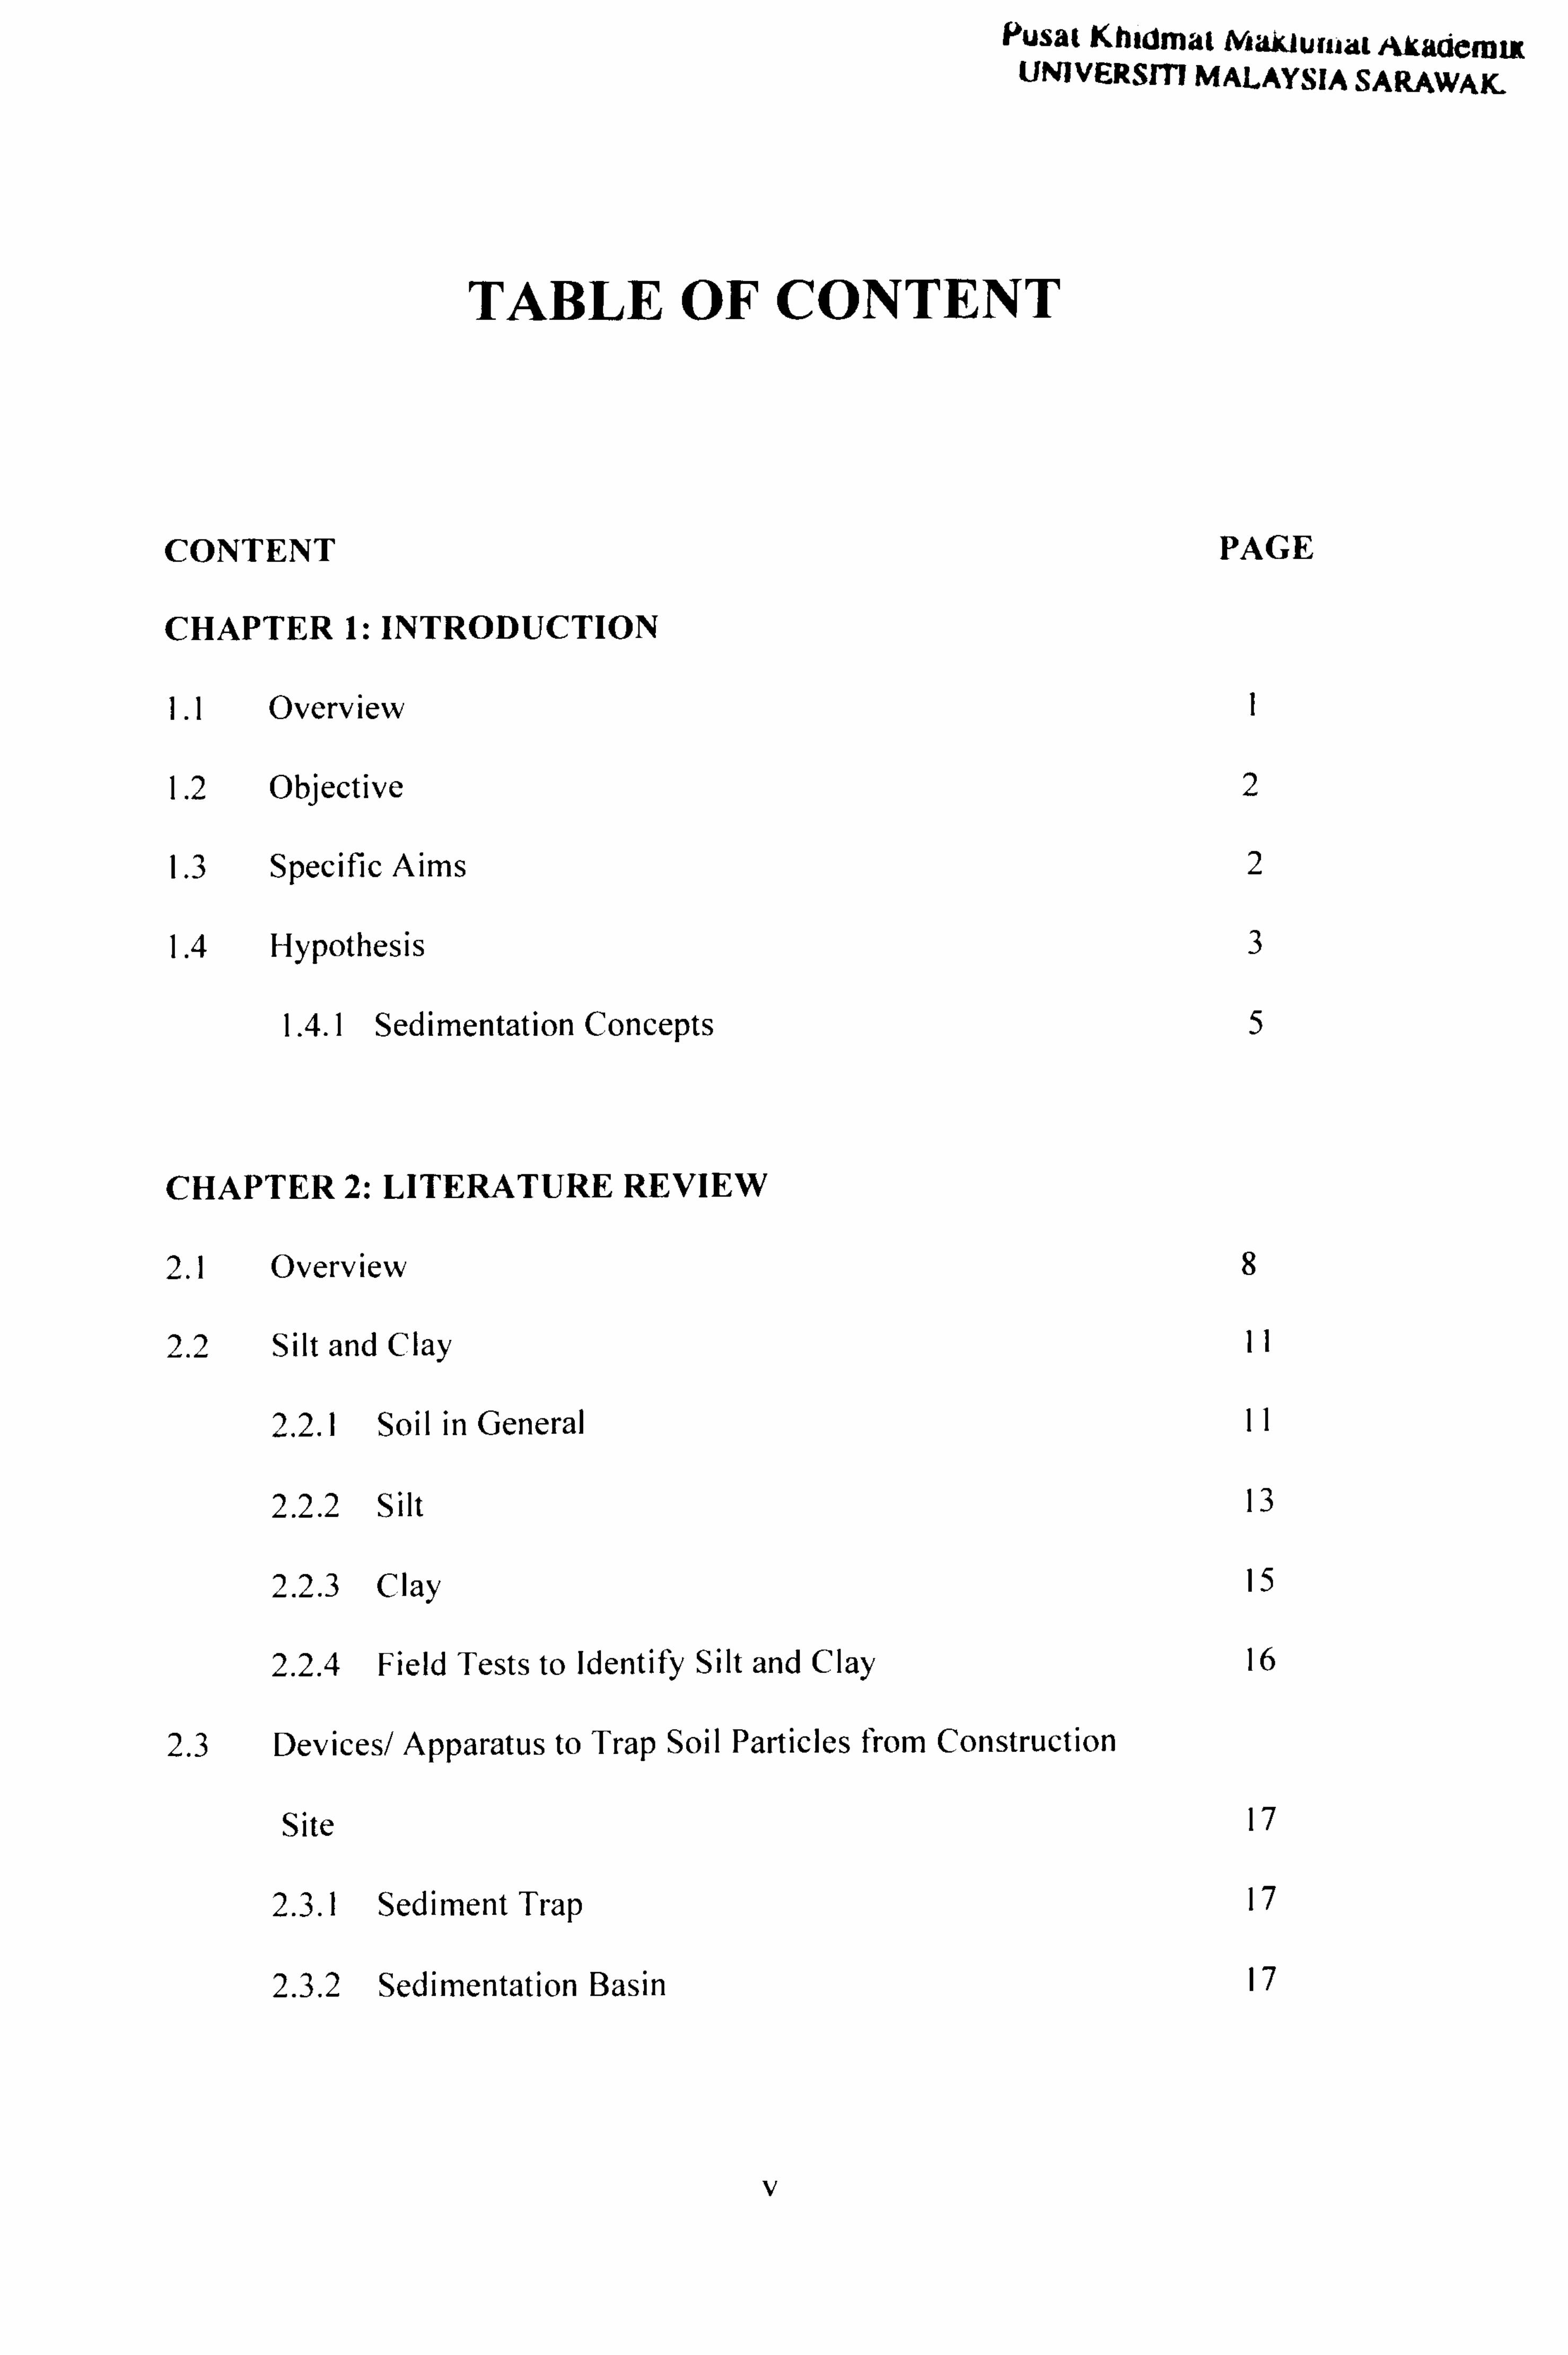
TABLE OF CONTENT
CONTENT
CHAPTER 1: INTRODUCTION
1.1 Overview
1.2 Objective
1.3 Specific Aims
1.4 Hypothesis
1.4.1 Sedimentation Concepts
CHAPTER 2: LITERATURE REVIEW
2.1 Overview
2.2 Silt and Clay
2.2.1 Soil in General
2.2.2 Silt
2.2.3 Clay
2.2.4 Field Tests to Identify Silt and Clay
2.3 Devices/ Apparatus to Trap Soil Particles from Construction
Site
2.3.1 Sediment Trap
2.3.2 Sedimentation Basin
PAGE
I
2
2 3
5
8
11
11
13
15
16
17
17
17
V

2.3.3 Silt Fence
2.3.4 Straw Bale Dikes/ Barriers
2.3.5 Check Dam
2.3.6 Inlet Protection
2.4 Manning Formula
18
19
20
21
22
CHAPTER 3: METHODOLOGY
3.1 Introduction 25
3.2 Design 25
3.2.1 Sizing of Sedimentation Trap for Implementation
Purpose 27
3.2.2 Plans 29
3.2.3 Estimation of Volume 33
3.2.4 Summary of Model Design Details 35
3.3 Development/ Fabrication 36
3.4 Performance Tests 38
3.4.1 Workability of Model 39
3.4.2 Determination of Manning's Roughness Coefficient, n 39
3.4.3 Procedure of Performance Tests and Samplings 40
3.4.4 Testing of Water Samples 44
3.4.5 Schematic Diagram of Experimental Procedures 45
3.4.6 Schematic Diagram illustrating Sampling and Analysis
of Samples 46
vi

CHAPTER 4: RESULTS AND DISCUSSION
4.1 Overview
4.2 Data Analysis
4.2.1 Manning's Roughness Coefficient Value, n
4.2.2 Suspended Solids Analysis
CHAPTER 5: CONCLUSIONS
5.1 Conclusions
CHAPTER 6: RECOMMENDATIONS
6.1 Limitations in the Research
47
48
48
50
60
61
6.2 Recommendations for Future Research 61
REFERENCES
APPENDIX A
Interim Water Quality Standards for Malaysia (1987)
APPENDIX B
Determination of Grain Size Distribution by Hydrometer
63
66
68
VII

LIST OF TABLES
PAGE
Table 2.1 Basic Types of Soil 12
Table 2.2 British Soil Classification System 13
Table 2.3 Field Test to Identify Silts and Clays 16
Table 2.4 Manning's Roughness Coefficients for the Design of
Improved Channels 24
Table 3.1 Estimated Side Area of Sedimentation Trap Model 33
Table 3.2 Estimated Volume of Sedimentation Trap Model 34
Table 3.3 Estimated Side Area of Actual Sedimentation Trap 34
Table 3.4 Estimated Volume of Actual Sedimentation Trap 35
Table 4.1 Section Properties of Selected Channel Sections with
Flow rate of 5.00 x 10-' m3/sec 48
Table 4.2 Section Properties of Selected Channel Sections with
Flow rate of 8.33 x 10-' m3/sec 49
Table 4.3 First Trial for Sampling with C1 = 300mg/L and
Flowrate Q=5.00 x 10⁻⁵ m3/sec 51
Table 4.4 Second Trial for Sampling with CI = 300mg/L and
Flowrate Q=8.33 x 10-' m3/sec 53
viu

Table 4.5 Third Trial for Sampling with Ct = 500mg/L and
Flowrate Q=5.00 x 10⁻⁵ m3/sec
Table 4.6 Fourth Trial for Sampling with Ct = 500mg/L and
Flowrate Q=8.33 x 10⁻⁵ m3/sec
Table 4.7 Comparison of Sedimentation Trap Removal Efficiencies
With Varying Parameters
55
57
59
ix
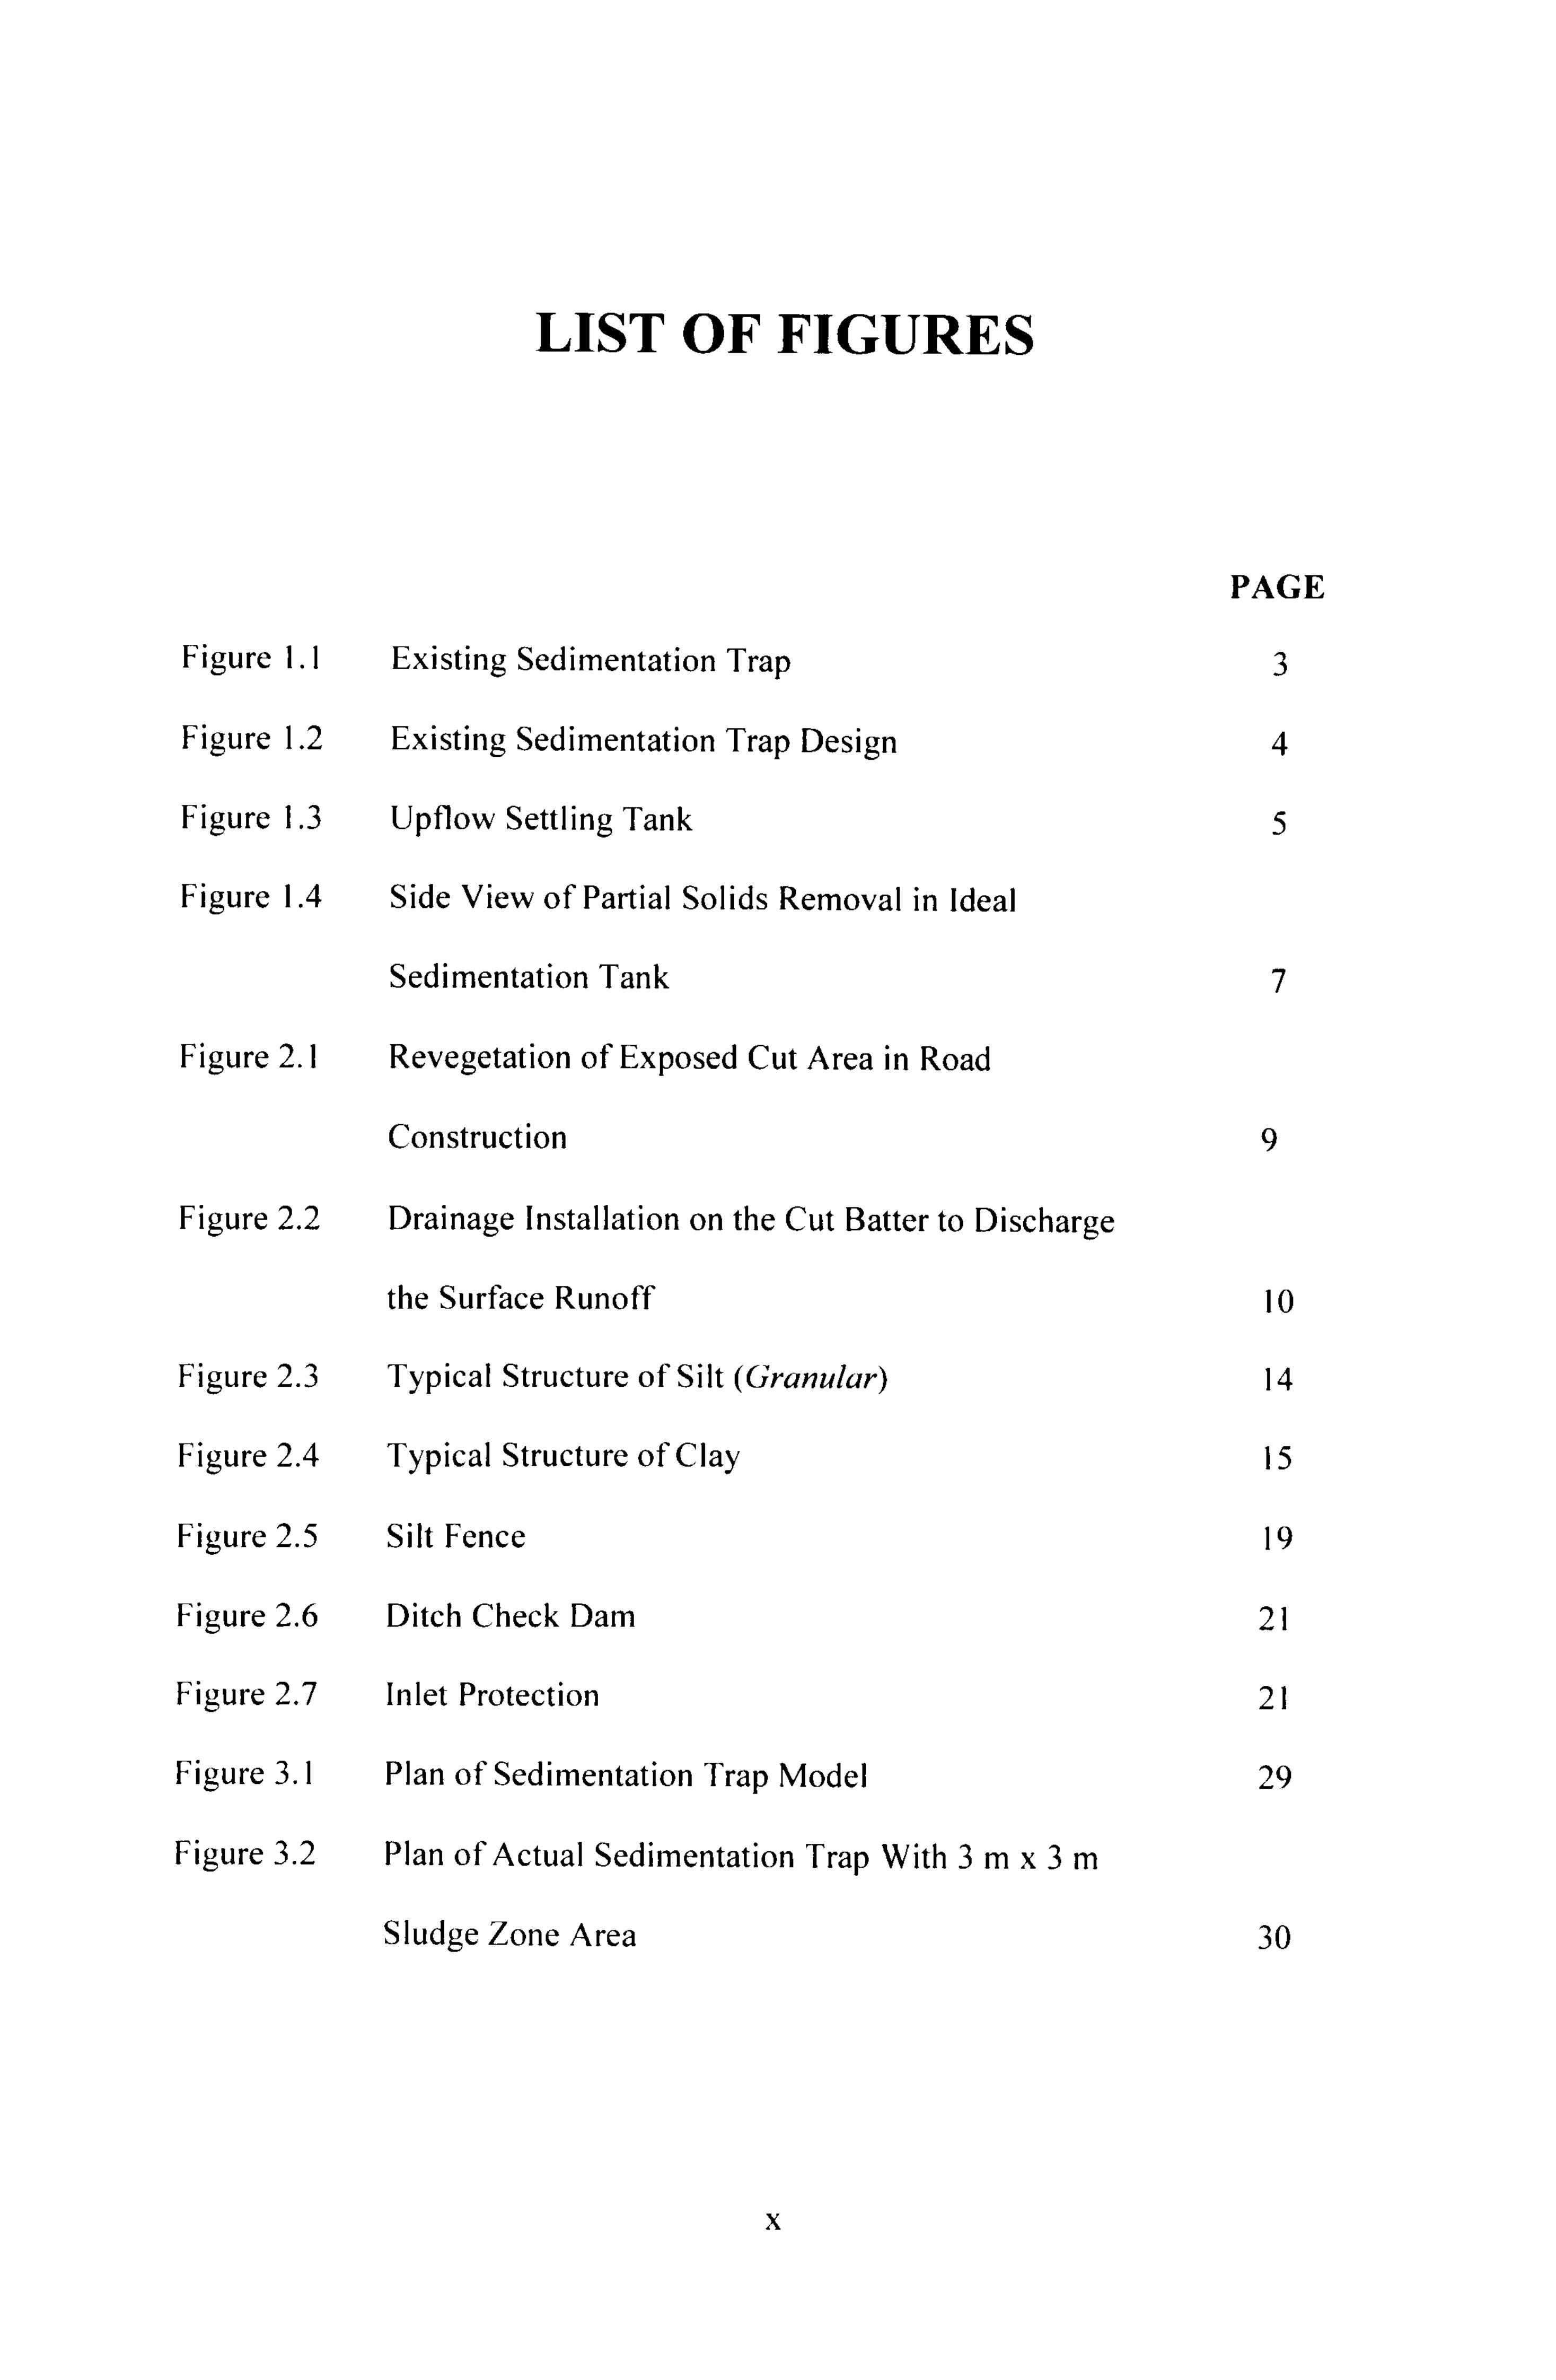
LIST OF FIGURES
PAGE
Figure 1.1 Existing Sedimentation Trap 3
Figure 1.2 Existing Sedimentation Trap Design 4
Figure 1.3 Upflow Settling Tank 5
Figure 1.4 Side View of Partial Solids Removal in Ideal
Sedimentation Tank 7
Figure 2.1 Revegetation of Exposed Cut Area in Road
Construction 9
Figure 2.2 Drainage Installation on the Cut Batter to Discharge
the Surface Runoff 10
Figure 2.3 Typical Structure of Silt (Granular) 14
Figure 2.4 Typical Structure of Clay 15
Figure 2.5 Silt Fence 19
Figure 2.6 Ditch Check Dam 21
Figure 2.7 Inlet Protection 21
Figure 3.1 Plan of Sedimentation Trap Model 29
Figure 3.2 Plan of Actual Sedimentation Trap With 3mx3m
Sludge Zone Area 30
X

Figure 3.3 Plan of Smaller Sedimentation Trap with 2mx2m
Sludge Zone Area. 31
Figure 3.4 Zones in Sedimentation Trap 32
Figure 3.5 Cross Sectional View of Channel 35
Figure 3.6 Fabricated Model 36
Figure 3.7 3- Dimensional View of Model 37
Figure 3.8 Sampling Locations 38
Figure 3.9 Trapezoidal Channel Section Geometric Elements 40
Figure 3.10 Mixer Tank 41
Figure 3.11 Silt and Clay Samples 41
Figure 3.12 Control valve
Figure 3.13 Water Sampling at point A
Figure 3.14 Hach DR/2400 Portable Spectrometer
Figure 4.1 First Trial (Influent Concentration, Can = 264 mg/L,
Flow rate, Q=5x 10 -' m3/sec)
Figure 4.2 Second Trial (Influent Concentration, Can = 378 mg/L,
Flow rate, Q=8.33 x 10 -s m3/sec)
Figure 4.3 Third Trial (Influent Concentration, Cm = 390 mg/L,
Flow rate, Q=5.00 x 10 -s m3/sec)
Figure 4.4 Fourth Trial (Influent Concentration, Cin = 440 mg/L,
Flow rate, Q=8.33 x 10 -' m3/sec)
42
43
44
52
54
56
58
XI

LIST OF CHARTS
PAGE
Chart 3.1 Schematic Diagram of Experiment Procedures 45
Chart 3.2 Schematic Diagram Illustrating Sampling and 46
Analysis of Samples
XII

LIST OF ABBREVIATIONS
C- Concentration
DO - Dissolved Oxygen
DOE - Department of Environmental
G- Gram
h- depth
L- Liter
m- Meter
ml - Mililiter
mm - Milimeter
min - Minutes
NREB - Natural Resources and Environmental Board
NTU - Nephelometry Turbidity Unit
N- Manning's Coefficient of Roughness
P- Wetted Perimeter
Pa - Pascal
Q- Flowrate/ Discharge
R- Hydraulic Radius
r- Radius
sec - Second
SS - Suspended Solids
X111
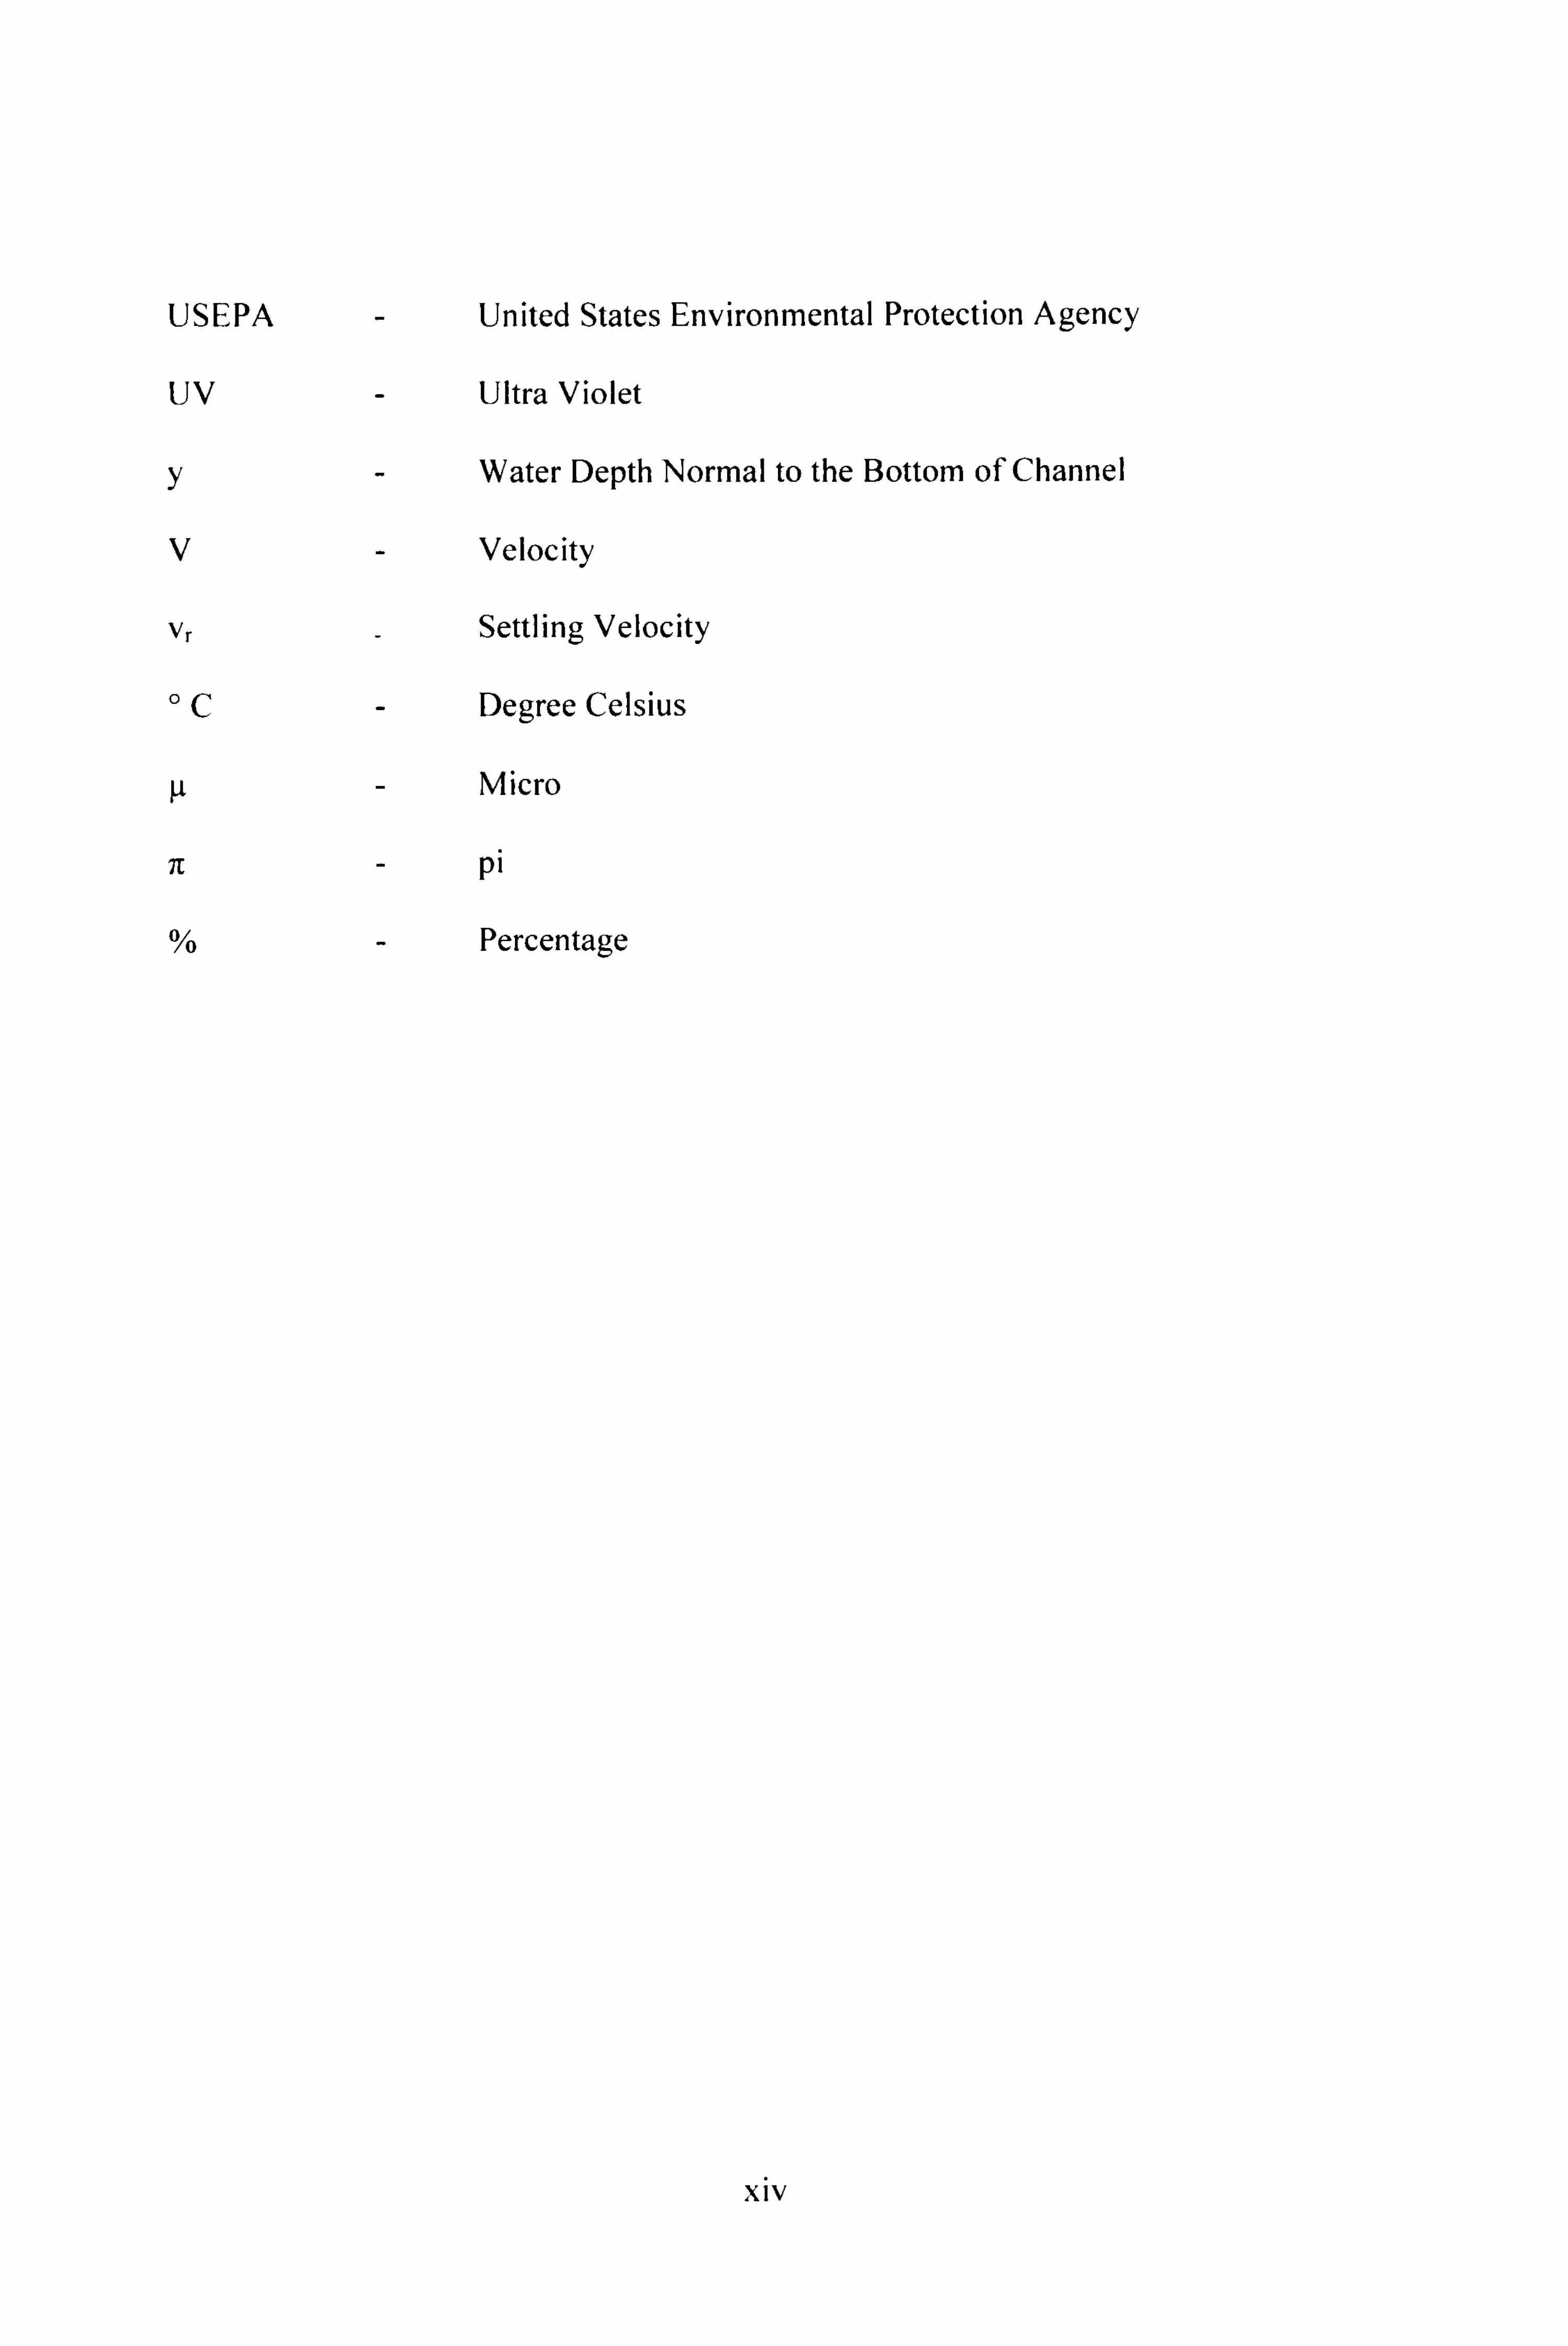
USEPA - United States Environmental Protection Agency
UV - Ultra Violet
y- Water Depth Normal to the Bottom of Channel
V- Velocity
Vr _ Settling Velocity
°C- Degree Celsius
µ- Micro
71 - pi
- Percentage
xiv

CHAPTER I
INTRODUCTION
1.1 Overview
At present, silt trap is one of the options to control the release of suspended
solids, mainly silt and clay particles from the construction site to the rivers and
streams. Sand particle is rarely taken into the consideration due to its high weight
ratio compared to the silt and clay particle and the settling path is shorter. A
proper control on the release of these particles into the river is important and
critical to preserve the natural condition of the river and streams. The release of
silt and clay particles into the river in vast amount can cause rapid settlement on
the river bed and reduce the depth of the river and will cause flooding. High total
suspended solids concentration in the river can block light from reaching
submerged vegetation. As the amount of light passing through the water is
reduced, photosynthesis slows down. Reduced rates of photosynthesis causes less
dissolved oxygen to be released into the water by plants. If light is completely
blocked from bottom dwelling plants, the plants will stop producing oxygen and
will die. As the plants are decomposed, bacteria will use up even more oxygen
from the water. Low dissolved oxygen can lead to fish kills. High concentration of
total suspended solids can also cause an increase in surface water temperature,
because the suspended particles absorb heat from sunlight. This can cause
I

dissolved oxygen levels to fall even further (because warmer waters can hold less
DO), and can harm aquatic life in many other ways (Mitchell and Stapp, 1992).
1.2 Objective
The objective of this research project attempts to develop a more reliable
sedimentation trap especially for silt and clay with special application to road
construction activities in the tropics. The main consideration for the application is
during the rainy season when an overflow case is considered.
1.3 Specific Aims
The primary components of the proposed system consist of 1) Inlet Zone, 2)
Sedimentation/Settling Zone, 3) Outlet Zone, and 4) Sludge Zone. This research
project focuses on relatively more effective design, development and performance
tests of a pilot scale sediments removal system. The system is suitable for
sediment loaded surface runoffs resulted from road construction activities such as
fill and cut areas.
The specific aims of this project are to:
i. Develop a pilot scale "sedimentation trap" model suitable for fill and cut
surface runoffs loaded with suspended solids especially silt and clay;
ii. Determine removal efficiencies of suspended solids such as silt and clay
by using overflow case; and
iii. Optimize system removal efficiencies by adjusting, changing, or
manipulating design and operating parameters.
2

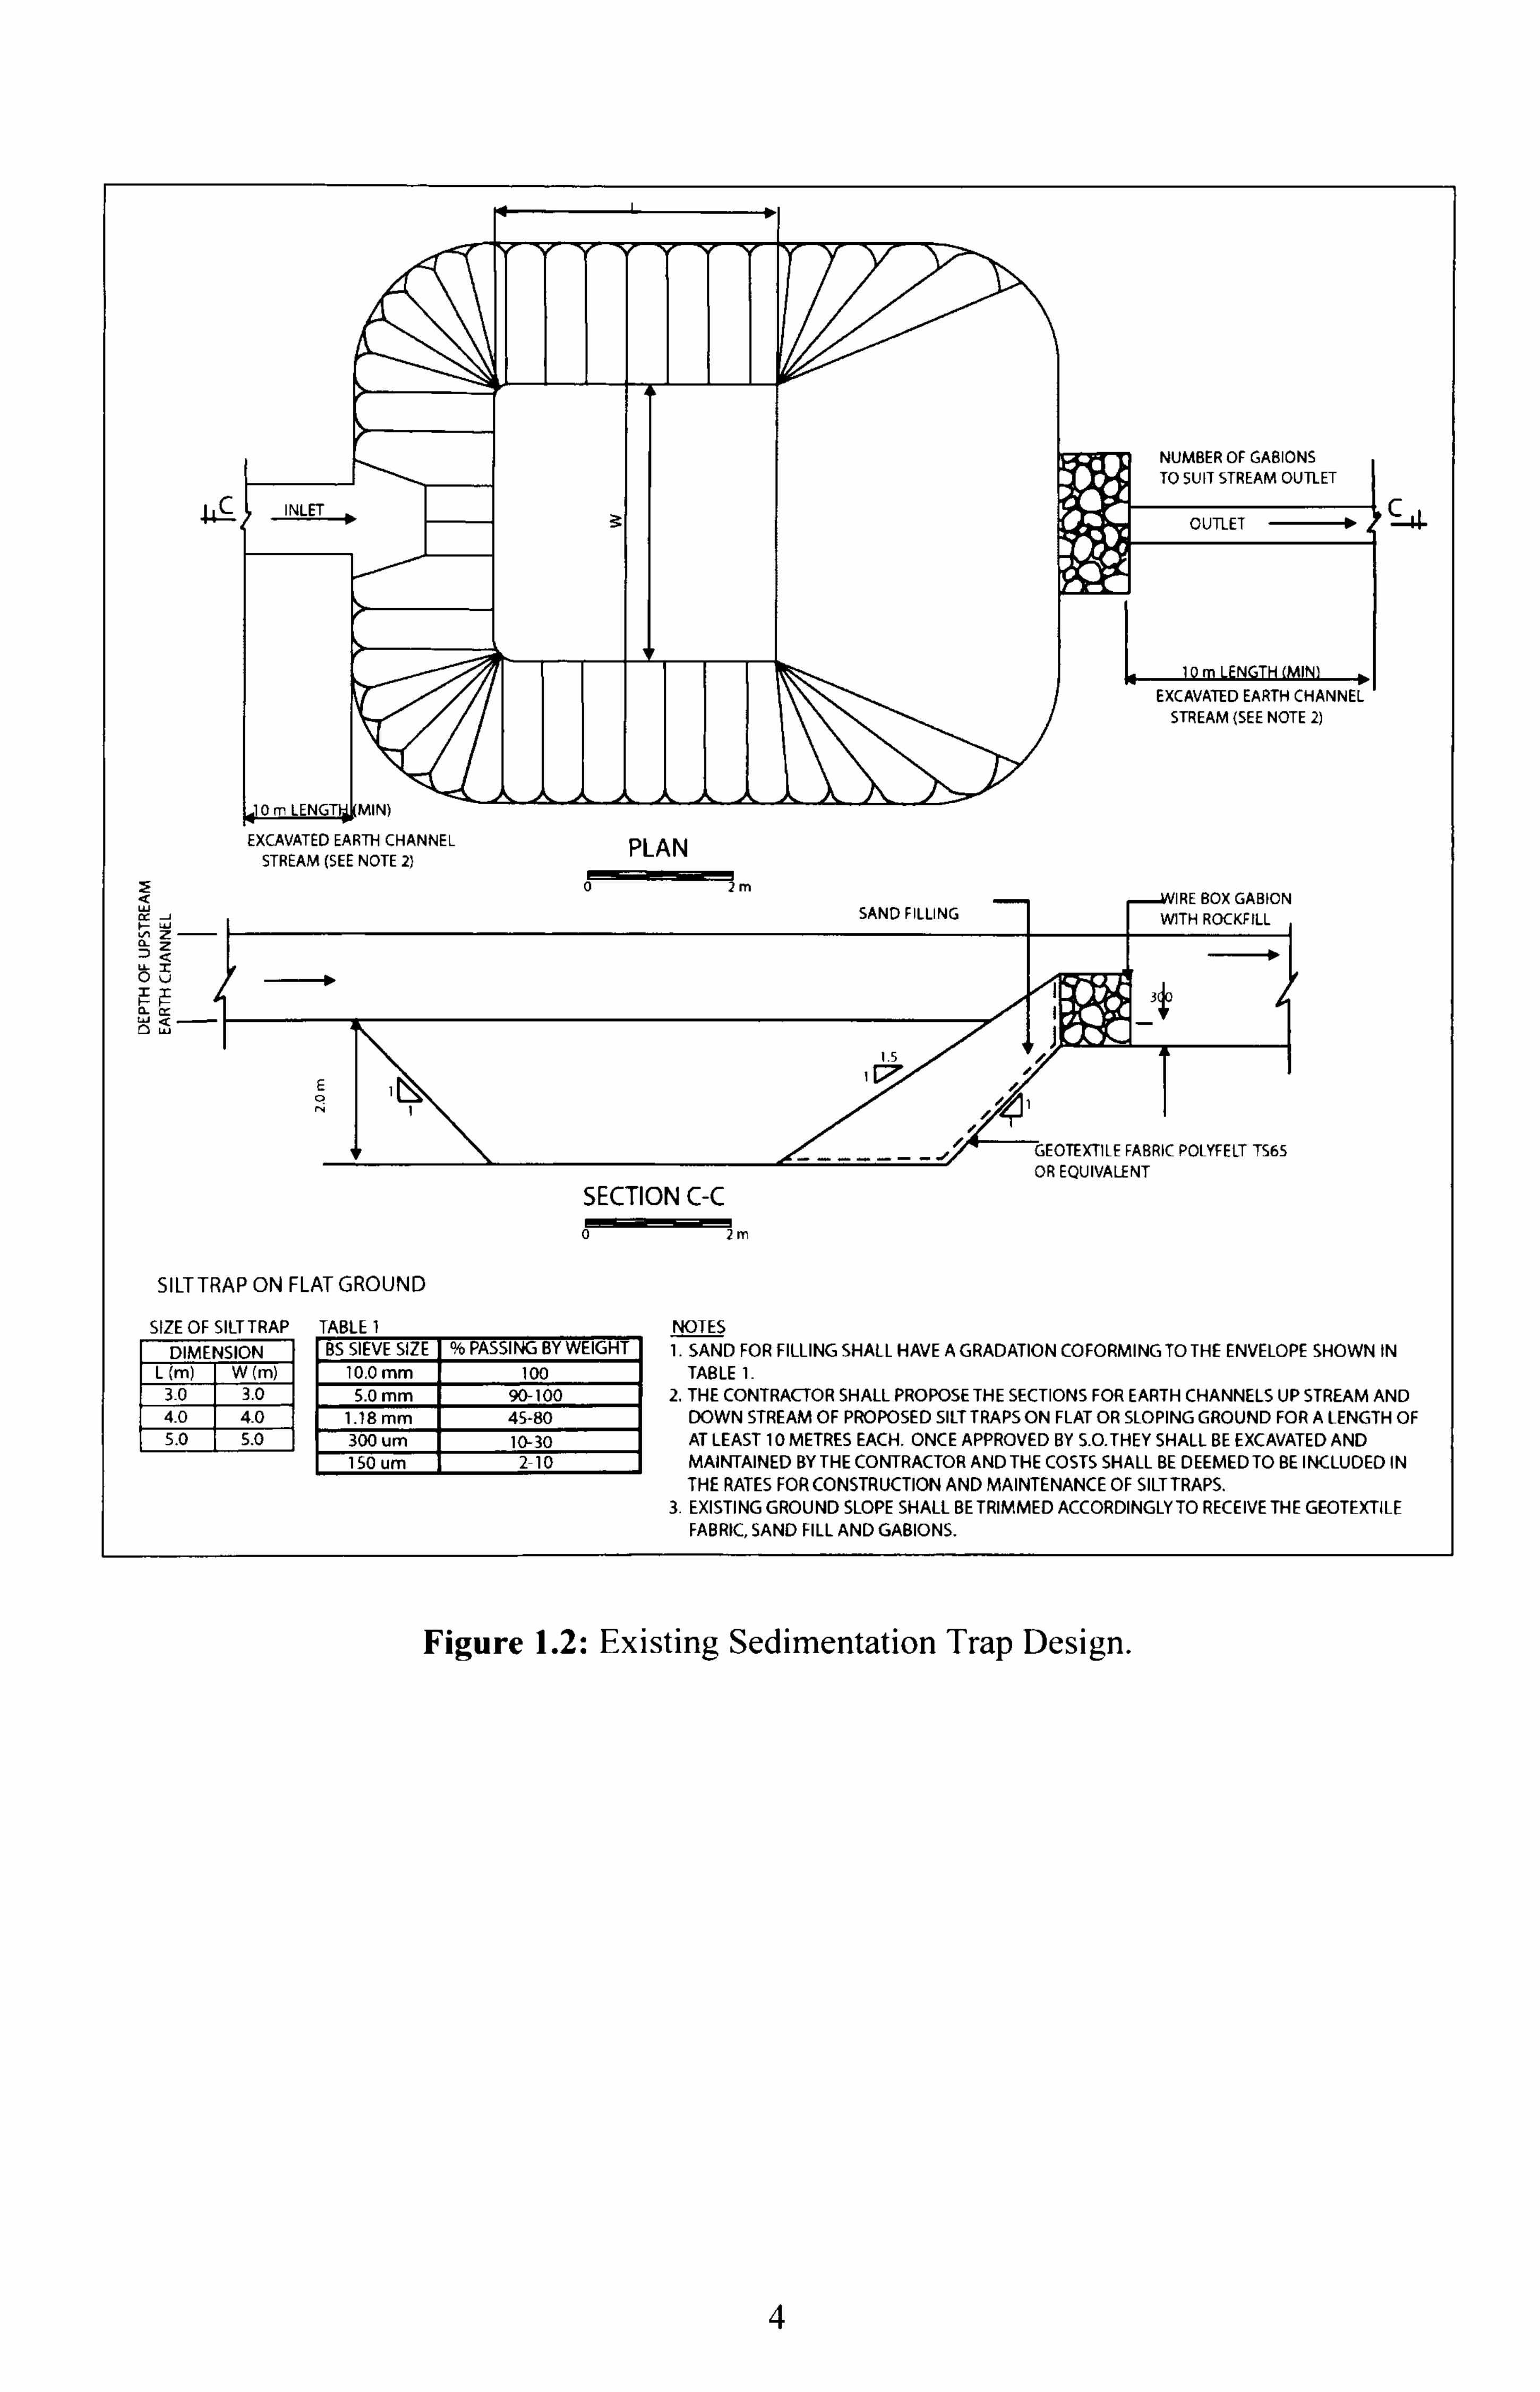
1.4 Hypothesis
Natural Resources and Environment Board, Sarawak (NREB) and
Department of Environment, Malaysia (DOE) currently accepted an existing
design of a sedimentation trap as a "suitable silt trap" for control of silt and clay
particles from being discharged into rivers and streams for a road construction
project. Figure 1 (a & b) and Figure 2 show the detailed design of an existing
sedimentation trap that is currently in use.
Current field studies on the performance of the existing sedimentation trap
found that those sedimentation traps are generally non-functional or serve very
little purpose for removal of silt and clay especially when overflow condition is
considered during the rainy season.
Figure 1.1 : Existing Sedimentation Trap.
Recently, NREB environmental control officials reviewed that the
department would welcome and adopt any alternative sedimentation trap of
different designs, provided that the design is certified by a registered
civil/environmental professional - Professional Engineer Registration with BEM.
3
fTHTT
- Z- öv
I
ý3 INLET
MIN) 111 EXCAVATED EARTH CHANNEL PLAN STREAM (SEE NOTE 2) PLAN
0 2m
SAND FILLING
I Is
NUMBER OF GASIONS TO SUIT STREAM OUTLET
OUTLET 0
10 m LENGTH (MINI b EXCAVATED EARTH CHANNEL
STREAM (SEE NOTE 2)
IRE BOX GABION WITH ROCKFILL
RIV-V I ýý ý
A
I J
GEOTEXTILE FABRIC POLYFELT TS65 .. J
OR EQUIVALENT
SECTION C-C
o2 m SILT TRAP ON FLAT GROUND
SIZE OF SILT TRAP TABLE i DIMENSION
L(m) 3.0 4.0
5.0
W (m) 3.0 4.0 5.0
BS SIEVE SIZE % PASSING BY WEIGHT 10.0 mm 100 5.0 mm 90-100
1.18 mm 45-80 300 um 10-30 150 um 2-10
NOTES 1. SAND FOR FILLING SHALL HAVE A GRADATION COFORMING TO THE ENVELOPE SHOWN IN
TABLE 1. 2. THE CONTRACTOR SHALL PROPOSE THE SECTIONS FOR EARTH CHANNELS UP STREAM AND
DOWN STREAM OF PROPOSED SILT TRAPS ON FLAT OR SLOPING GROUND FOR A LENGTH OF AT LEAST 10 METRES EACH. ONCE APPROVED BY S. O. THEY SHALL BE EXCAVATED AND MAINTAINED BY THE CONTRACTOR AND THE COSTS SHALL BE DEEMED TO BE INCLUDED IN THE RATES FOR CONSTRUCTION AND MAINTENANCE OF SILTTRAPS.
3. EXISTING GROUND SLOPE SHALL BE TRIMMED ACCORDINGLY TO RECEIVE THE GEOTEXTILE FABRIC, SAND FILL AND GABIONS.
Figure 1.2: Existing Sedimentation Trap Design.
4
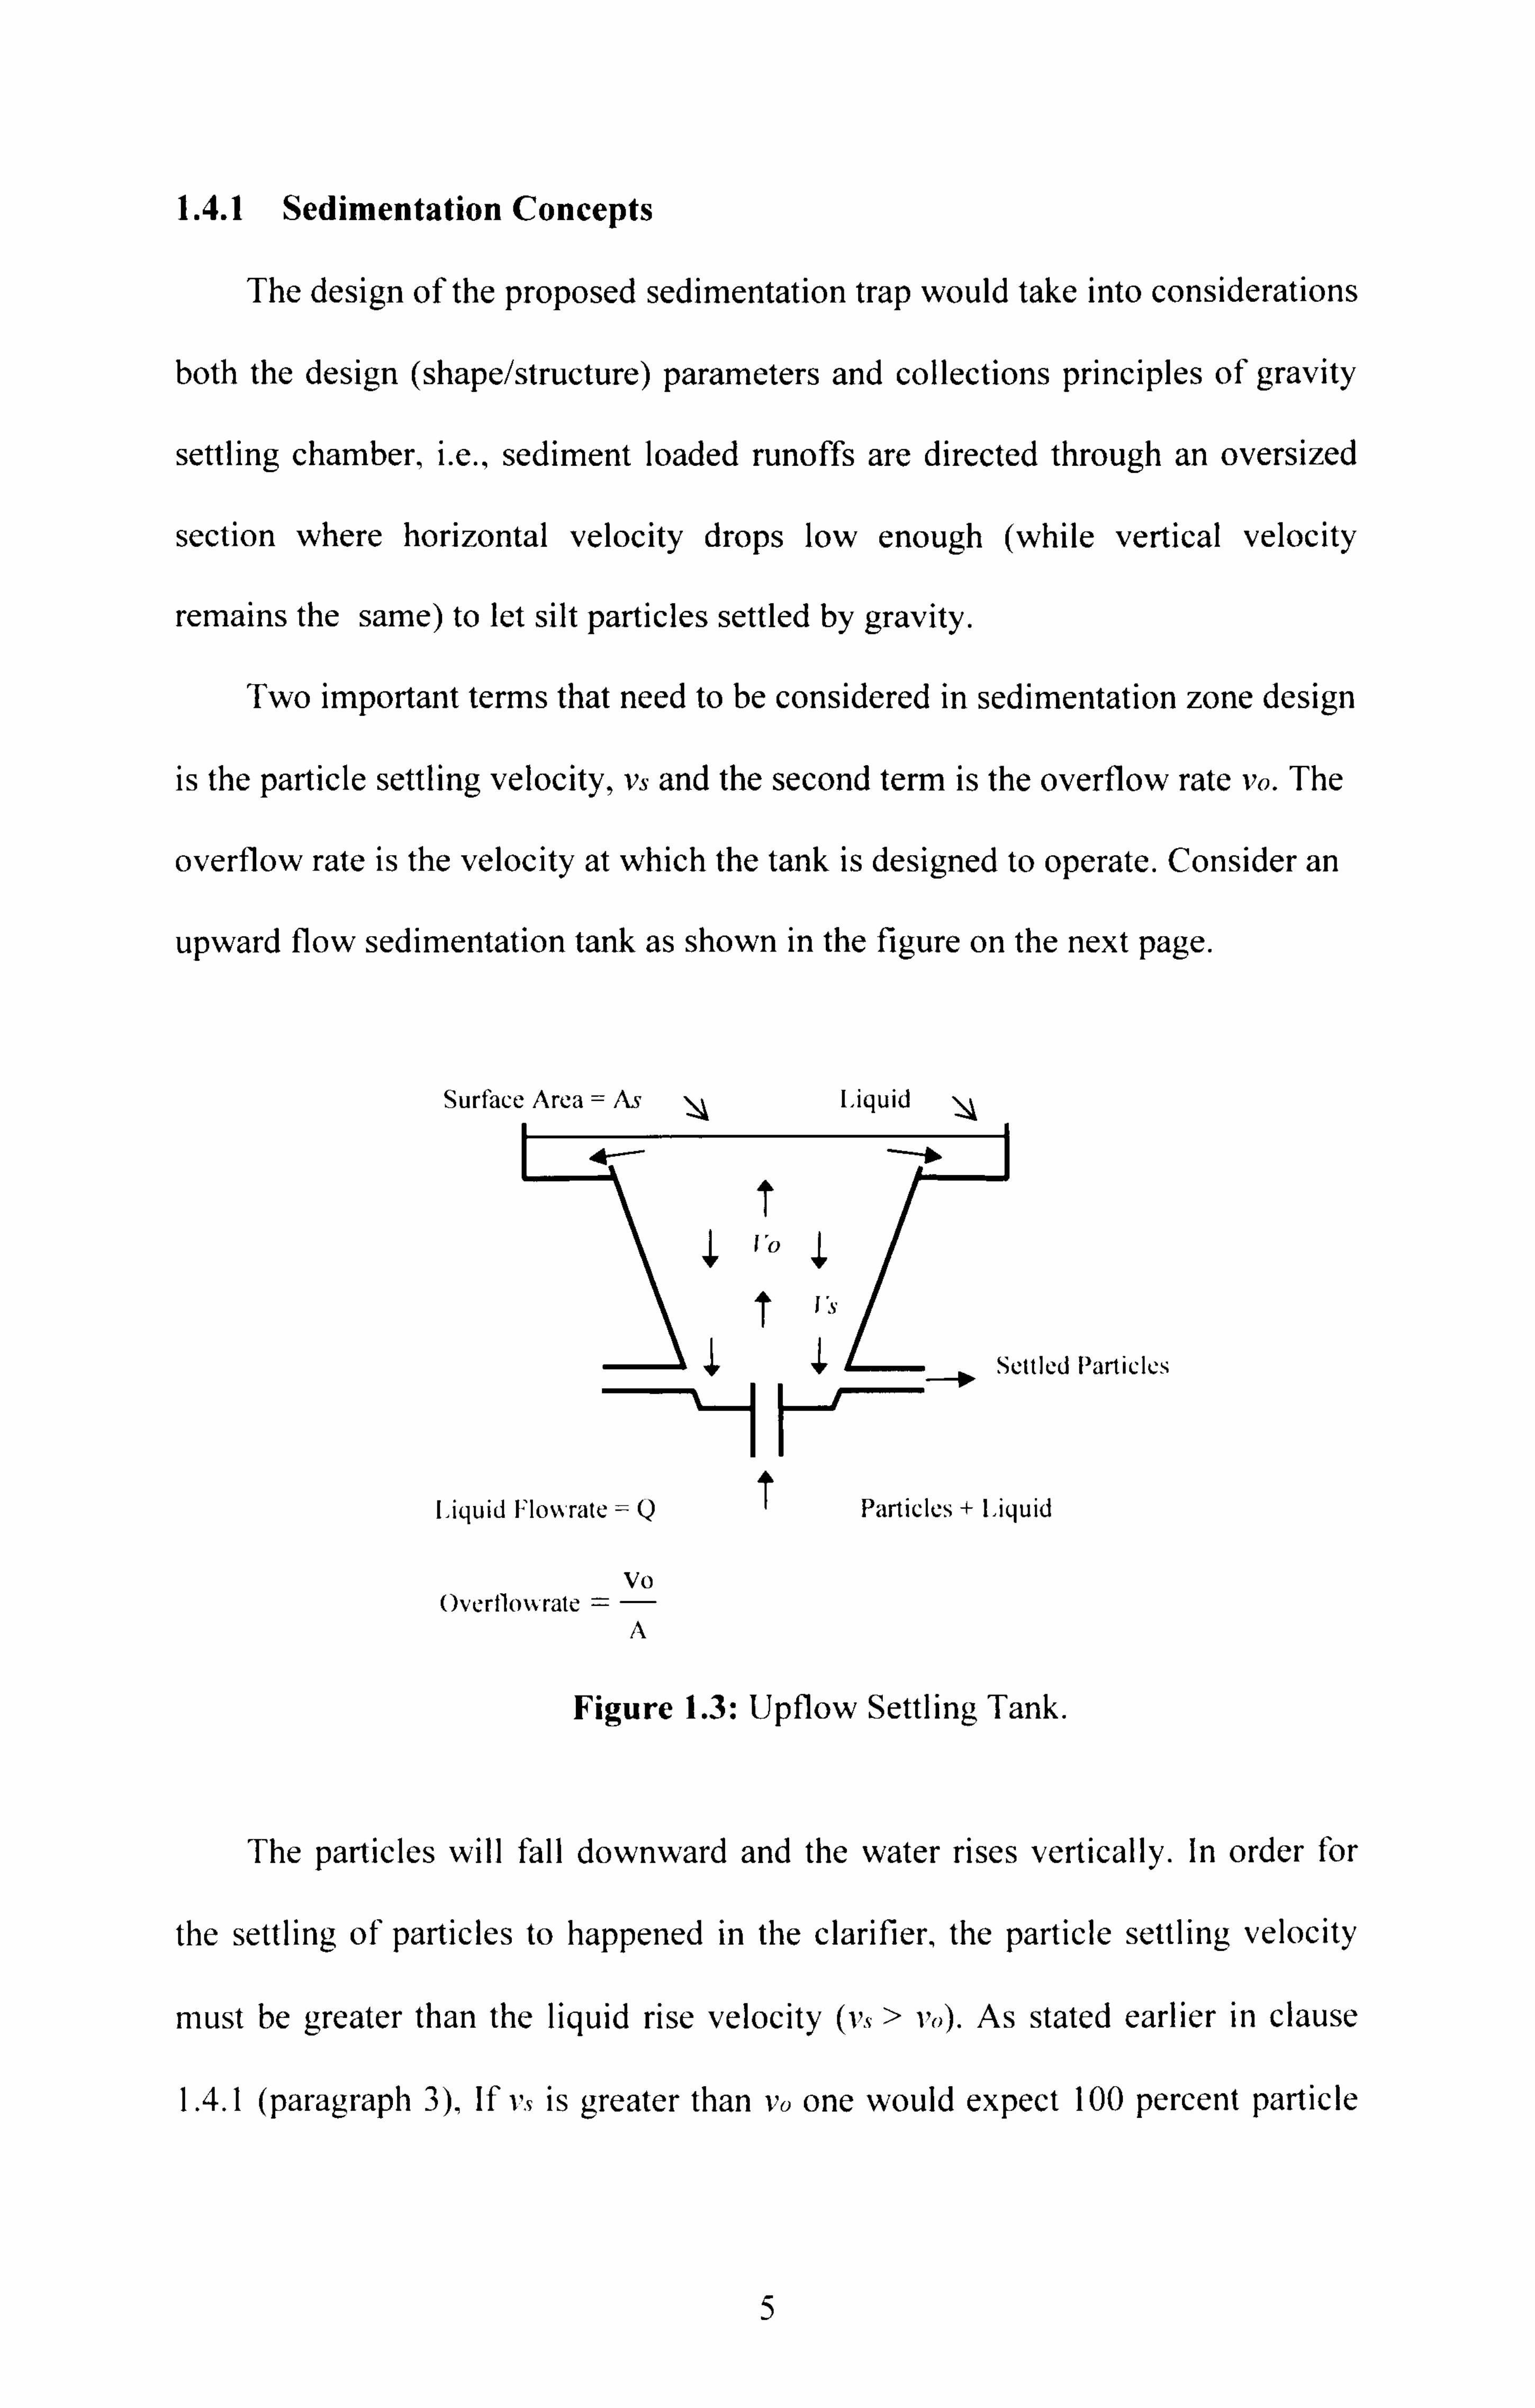
1.4.1 Sedimentation Concepts
The design of the proposed sedimentation trap would take into considerations
both the design (shape/structure) parameters and collections principles of gravity
settling chamber, i. e., sediment loaded runoffs are directed through an oversized
section where horizontal velocity drops low enough (while vertical velocity
remains the same) to let silt particles settled by gravity.
Two important terms that need to be considered in sedimentation zone design
is the particle settling velocity, vs and the second term is the overflow rate vo. The
overflow rate is the velocity at which the tank is designed to operate. Consider an
upward flow sedimentation tank as shown in the figure on the next page.
Surface Area = As \4
T
Liquid
/_, r
Its
f Settled Particles
ý-1 I--ý Liquid Floms rate =Q
Vo Overflow rate =-
A
1 Particles + Liquid
Figure 1.3: Upflow Settling Tank.
The particles will fall downward and the water rises vertically. In order for
the settling of particles to happened in the clarifier, the particle settling velocity
must be greater than the liquid rise velocity (vs > vo). As stated earlier in clause
1.4.1 (paragraph 3), If v., is greater than vo one would expect 100 percent particle
5

removal and if vs is less than vo one would expect 0 percent removal. For the
vertical settling tank, the term overflow rate is used since the water is flowing
over the top of the tank into the weir system and it is sometimes referred to as the
surface loading rate because it has units of m3/d. m2. This can be thought of as the
amount of water that goes through each m2 of tank surface area per day, which is
similar to a loading rate. From the equation below, an overflow rate is the same as
a liquid velocity:
Volume / Time (Depth)(SurfaceArea) Depth vo =__= Liquid Velocity (Eq. 1.9)
SurfaceArea (Time)(SurfaceArea) Time
From the equation above it can be seen that in vertical settling tank is
independent of the depth of the sedimentation tank.
An ideal horizontal sedimentation tank is based upon three assumptions ( A.
Hazen, 1904 & T. R. Camp, 1946).
1) Particles and velocity vectors are evenly distributed across the tank cross
section. This is the function of the inlet zone.
2) The liquid moves as an ideal slug down the length of the tank.
3) Any particle hitting the bottom of the tank is removed.
In a horizontal sedimentation tank, unlike an upflow clarifier, some
percentage of the particles with vs less than vo will be removed. For example,
consider particles having a settling velocity of 0.5 va entering uniformly into the
settling zone. Figure 3-26 shows that 50 percent of these particles (those below
half the depth of the tank) will be removed. That is they will hit the bottom of the
tank before being carried out because they only have to settle one-half the tank
depth. Likewise, one-fourth of the particles having a settling velocity of 0.25 v,,
will be removed.
6

50 %
50 %
i -01. ý ý ý ý
I ý ý AN. ý -00.
Escaped
Captured
Figure 1.4: Side View of Partial Solids Removal in Ideal Sedimentation Tank.
7

CHAPTER 2
LITERATURE REVIEW
2.1 Overview
In a tropical environment, "soil is moved primarily by runoff associated with
rainfall, thus, erosion is defined as the movement of soil particles either
individually or as aggregates, downslope as a result of the waterflow" (Crighton
and Tomkins, 2000). Erosion and sedimentation from construction of roads,
highways, and bridges, and from unstabilized cut-and-fill areas, can significantly
impact surface waters and wetlands with silt and other pollutants including heavy
metals, hydrocarbons, and toxic substances. Erosion and sediment control plans
are effective in describing procedures for mitigating erosion problems at
construction sites before any land-disturbing activity begins (U. S. Environmental
Protection Agency, 2005).
At present, methods of minimizing soil erosion and sedimentation of water
bodies (i. e., rivers and streams) for roadway/highway construction projects in the
State of Sarawak include some of the followings:
i. Minimize clearing to within 3m from the top of cut butters and within 5m
of the bottom of the road.
ii. Carry out directional felling so that tree fall into the road clearing area to
minimize damage to adjacent vegetation.
8

iii. Stockpile topsoil for later use in revegetation.
iv. Carry out progressive revegetation of exposed area in tandem with slope
stabilization work.
Figure 2.1: Revegetation oC Exposed Cut Area in Road Construction.
v. Retain a 50m buffer strip of vegetation fringing rivers within which
borrowed areas, spoil dumpsites and clearing (expected at stream
crossings) or dumping of vegetation is prohibited.
vi. During cut and fill operations, all fill areas must be firmly consolidated
and compacted.
vii. Both cut and fill batters should be turfed or hydroseeded as soon as
possible,
viii. Larger and/or steeper cut or fill batters must be terraced and provided with
appropriate drainage installation to discharge surface runoff.
9


