Overview & Initial Results
1 The World Bank
Skills are at the core of improving employment outcomes and increasing productivity and growth.
Yet, in many countries education and training systems often lack quality and labor market relevance, leaving workers ill-prepared for the labor market.
Many workers lack the right skills to match the requirements in available job openings or have limited opportunities to access high quality pre-employment or skills upgrading training programs that promote higher productivity jobs.
Despite the central role of skills in shaping employment outcomes, there is very little information about the distribution of different types of skills in the labor force and their distinctive contribution to labor market outcomes.
Ultimately, the lack of information affects the design of skills development policies and programs.
Why measure skills?
2
First-ever initiative to generate internationally comparable data on skills available in developing countries.
The program supports the implementation of standardized surveys to gather information on the supply and distribution of skills and the demand for such skills in the labor market.
The surveys include newly-designed modules that measure the cognitive skills, job-relevant skills, and socio-emotional skills of a representative sample of adults aged 15 to 64 living in urban areas, whether they work or not.
Survey modules collect information on respondents' skills acquisition and maintenance, transitions in the labor market, self-employed, health status and family background
What is the STEP Skills Measurement Program?
2/7/2014 3
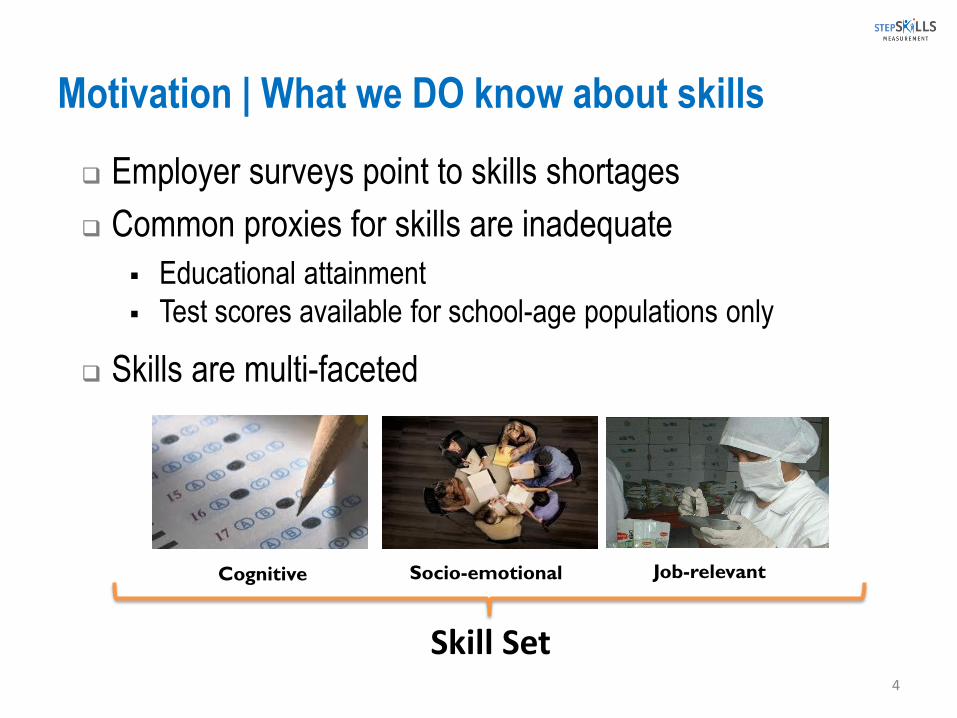
Motivation | What we DO know about skills
Employer surveys point to skills shortages
Common proxies for skills are inadequate
Educational attainment
Test scores available for school-age populations only
Skills are multi-faceted
4
Cognitive Socio-emotional Job-relevant
Skill Set
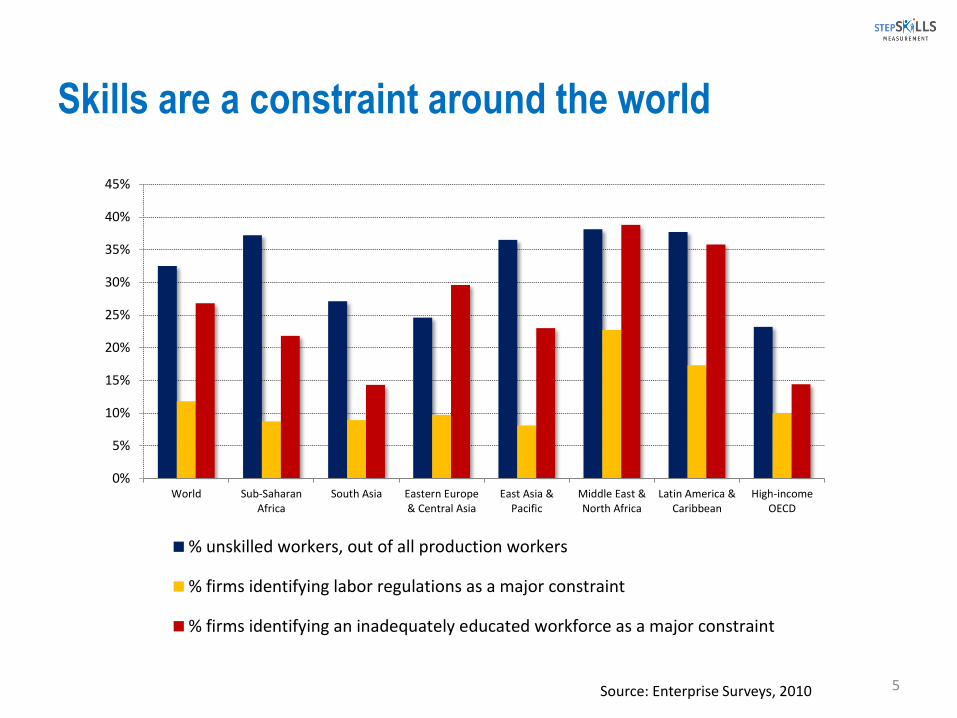
Skills are a constraint around the world
0%
5%
10%
15%
20%
25%
30%
35%
40%
45%
World Sub-SaharanAfrica
South Asia Eastern Europe& Central Asia
East Asia &Pacific
Middle East &North Africa
Latin America &Caribbean
High-incomeOECD
% unskilled workers, out of all production workers
% firms identifying labor regulations as a major constraint
% firms identifying an inadequately educated workforce as a major constraint
Source: Enterprise Surveys, 2010 5
Key Questions
What is the skills profile of the labor force?
What skills matter for employment and productivity?
What is the nature and size of skills gaps?
What interventions may be considered to improve employability and
productivity?
6
To address these questions
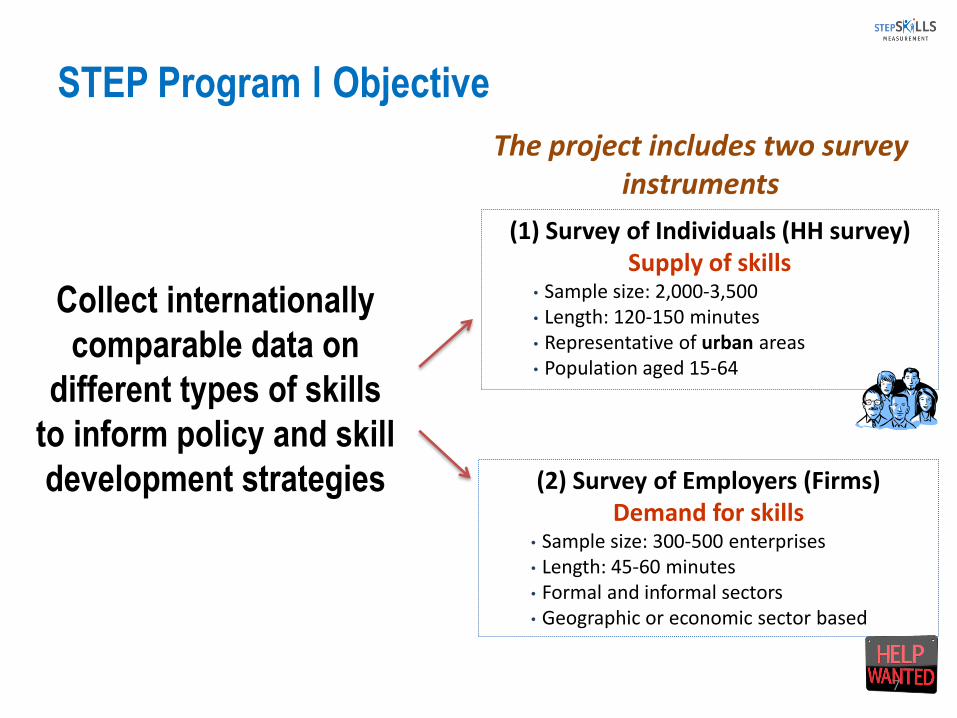
Collect internationally
comparable data on
different types of skills
to inform policy and skill
development strategies
(1) Survey of Individuals (HH survey) Supply of skills
• Sample size: 2,000-3,500 • Length: 120-150 minutes • Representative of urban areas • Population aged 15-64
The project includes two survey instruments
STEP Program ǀ Objective
(2) Survey of Employers (Firms) Demand for skills
• Sample size: 300-500 enterprises • Length: 45-60 minutes • Formal and informal sectors • Geographic or economic sector based
7
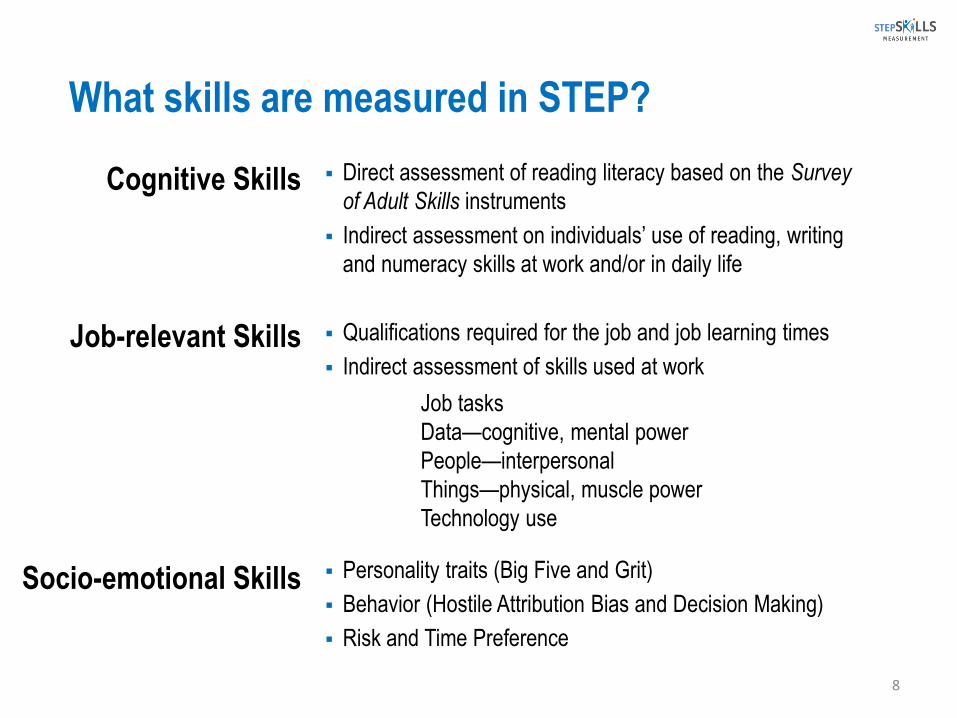
Direct assessment of reading literacy based on the Survey
of Adult Skills instruments
Indirect assessment on individuals’ use of reading, writing
and numeracy skills at work and/or in daily life
Qualifications required for the job and job learning times
Indirect assessment of skills used at work
Job tasks
Data—cognitive, mental power
People—interpersonal
Things—physical, muscle power
Technology use
Personality traits (Big Five and Grit)
Behavior (Hostile Attribution Bias and Decision Making)
Risk and Time Preference
What skills are measured in STEP?
Cognitive Skills
Job-relevant Skills
Socio-emotional Skills
8
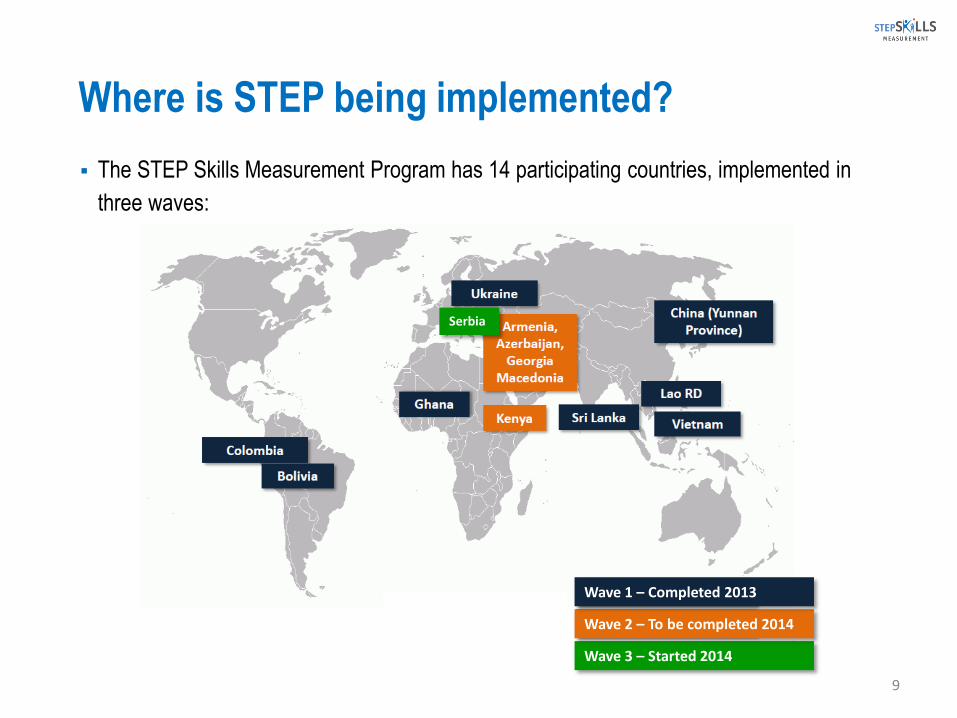
The STEP Skills Measurement Program has 14 participating countries, implemented in
three waves:
Where is STEP being implemented?
9
Wave 3 – Started 2014
Wave 2 – To be completed 2014
Wave 1 – Completed 2013
Serbia
Snapshot of results
10
General takeaways
11
Participation in early childhood education programs pays off
Past household socioeconomic status affects the acquisition of socio-emotional skills, however, the educational system also plays an important role
Strong foundational skills are a prerequisite for developing job-relevant skills
A smooth transition from school to work has long lasting positive effects on socio-emotional skills
The labor market rewards socio-emotional and job-relevant skills as much as educational attainment
Training to strengthen such skills can improve adult’s employability
Businesses are not making full use of workers’ skills. For example, employees are vastly underusing their employees’ computer skills in their jobs
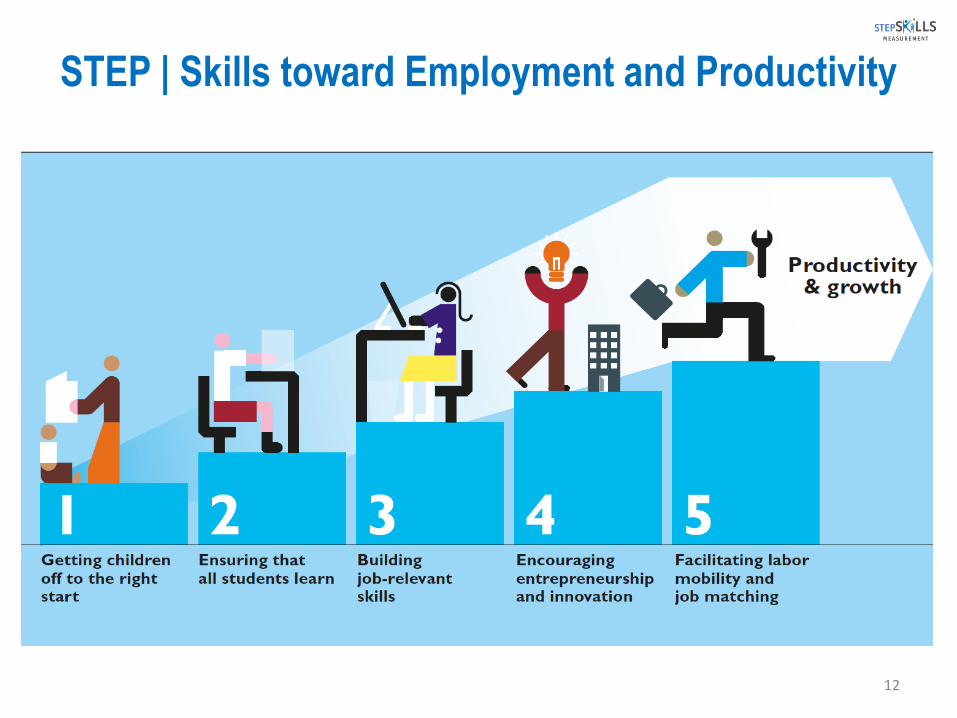
STEP | Skills toward Employment and Productivity
12
Step 1 | Getting children off to a new start
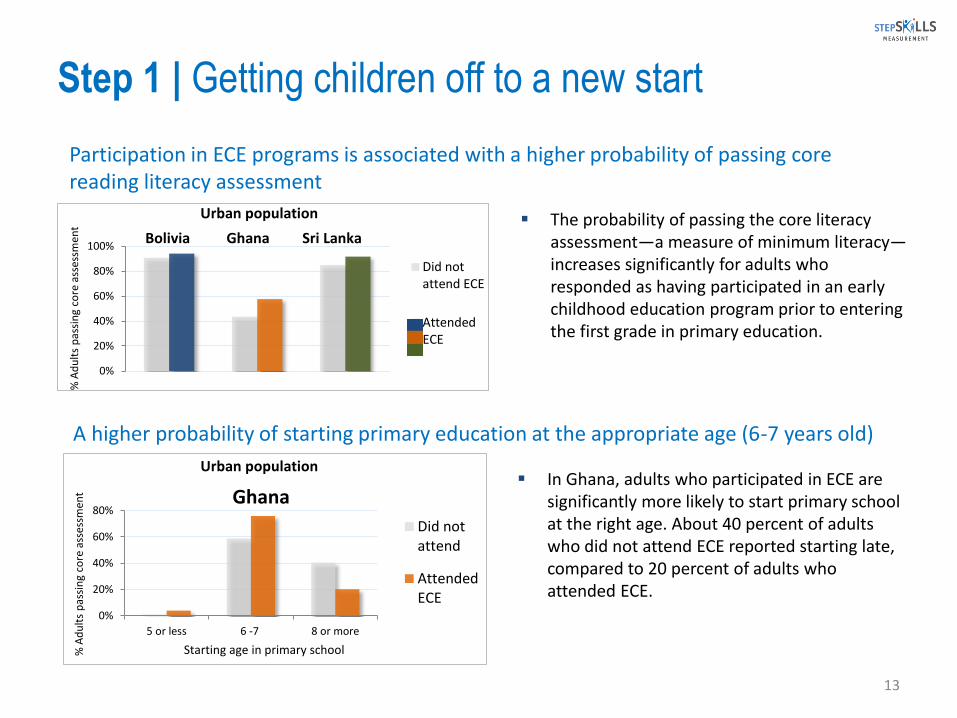
Participation in ECE programs is associated with a higher probability of passing core reading literacy assessment
A higher probability of starting primary education at the appropriate age (6-7 years old)
0%
20%
40%
60%
80%
100%
Did notattend ECE
AttendedECE
Bolivia Ghana Sri Lanka
Urban population
0%
20%
40%
60%
80%
5 or less 6 -7 8 or more
Did notattend
AttendedECE
Starting age in primary school
Ghana
Urban population
The probability of passing the core literacy assessment—a measure of minimum literacy—increases significantly for adults who responded as having participated in an early childhood education program prior to entering the first grade in primary education.
In Ghana, adults who participated in ECE are significantly more likely to start primary school at the right age. About 40 percent of adults who did not attend ECE reported starting late, compared to 20 percent of adults who attended ECE.
13
% A
du
lts
pas
sin
g co
re a
sses
smen
t %
Ad
ult
s p
assi
ng
core
ass
essm
ent
10%
20%
30%
40%
50%
60%
70%
80%
90%
100%
0 1 2 3 4 5 6 7 8
Yunnan
Vietnam
Sri Lanka
Bolivia
Laos
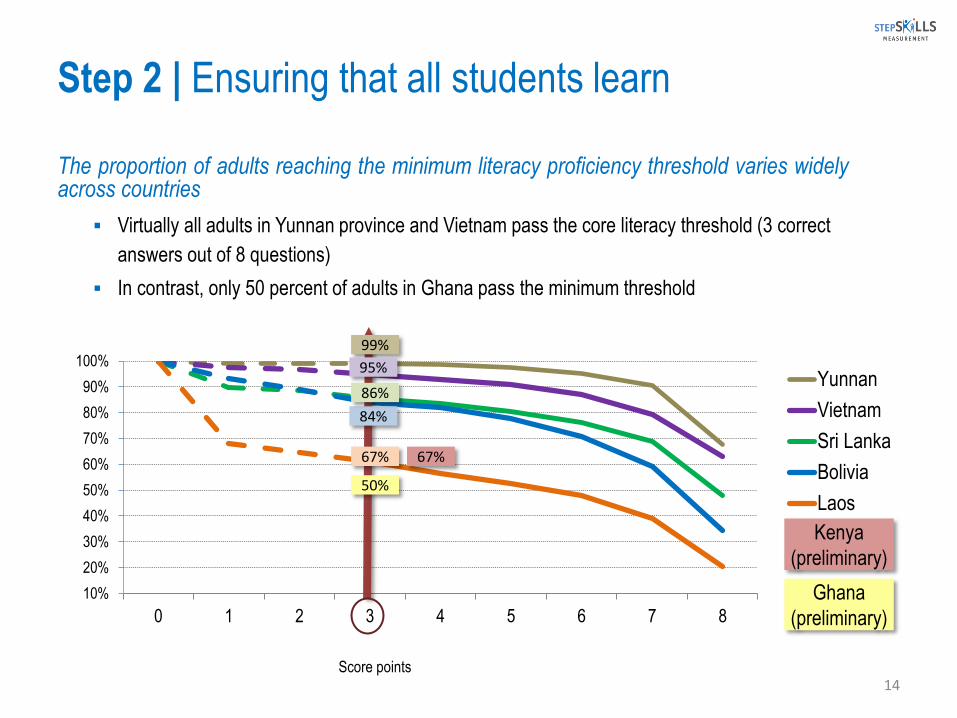
The proportion of adults reaching the minimum literacy proficiency threshold varies widely across countries
Virtually all adults in Yunnan province and Vietnam pass the core literacy threshold (3 correct
answers out of 8 questions)
In contrast, only 50 percent of adults in Ghana pass the minimum threshold
Ghana
(preliminary)
67%
Score points
84%
86%
99%
95%
50%
14
67%
Kenya
(preliminary)
Step 2 | Ensuring that all students learn
15
Step 2 | Ensuring that all students learn
50%
60%
70%
80%
90%
100%
Numeracy
Reading
Writing
Urban populations
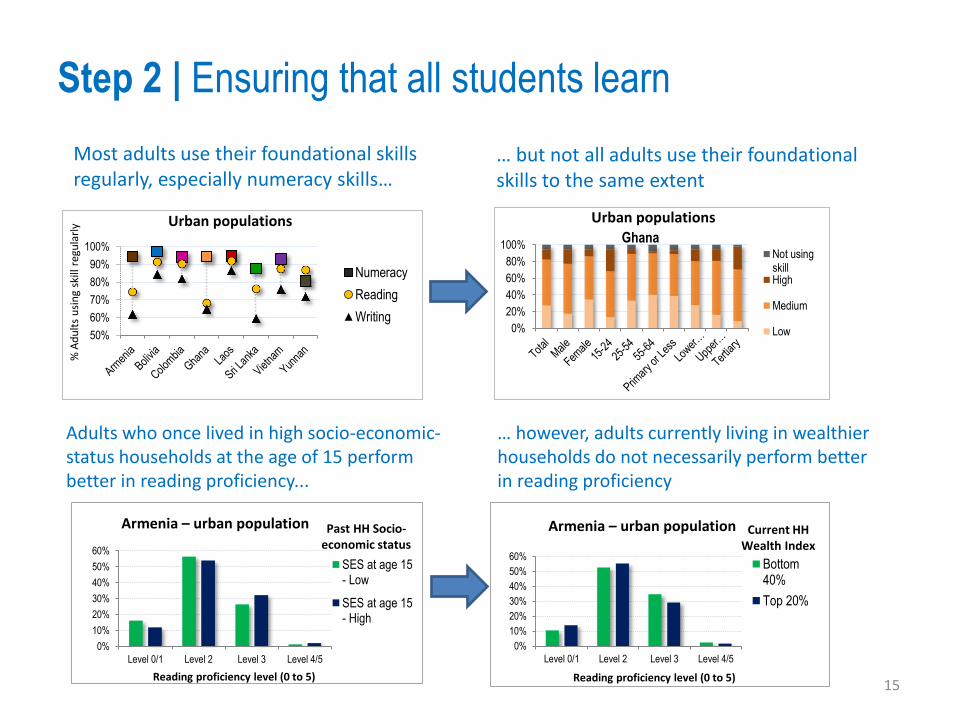
Most adults use their foundational skills regularly, especially numeracy skills…
0%
20%
40%
60%
80%
100%Not usingskillHigh
Medium
Low
Ghana
Urban populations
… but not all adults use their foundational skills to the same extent
0%
10%
20%
30%
40%
50%
60%
Level 0/1 Level 2 Level 3 Level 4/5
SES at age 15- Low
SES at age 15- High
0%
10%
20%
30%
40%
50%
60%
Level 0/1 Level 2 Level 3 Level 4/5
Bottom40%
Top 20%
Armenia – urban population
Reading proficiency level (0 to 5)
… however, adults currently living in wealthier households do not necessarily perform better in reading proficiency
Adults who once lived in high socio-economic-status households at the age of 15 perform better in reading proficiency...
Armenia – urban population Current HH Wealth Index
Past HH Socio-economic status
Reading proficiency level (0 to 5)
% A
du
lts
usi
ng
skill
reg
ula
rly
16
Step 3 | The Right Skills for the Job
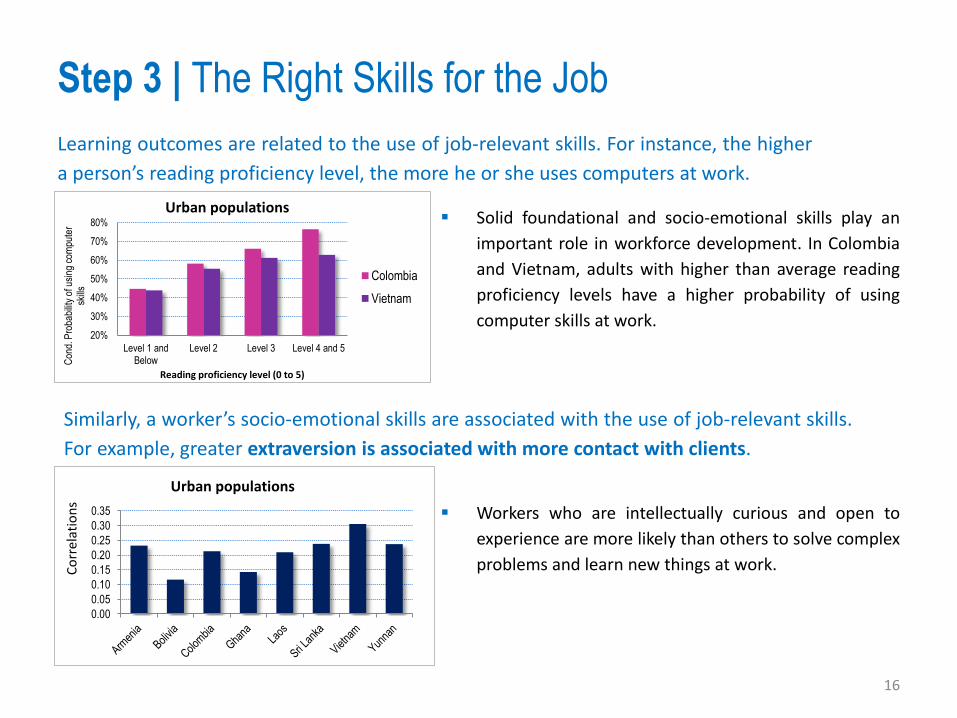
Learning outcomes are related to the use of job-relevant skills. For instance, the higher
a person’s reading proficiency level, the more he or she uses computers at work.
20%
30%
40%
50%
60%
70%
80%
Level 1 andBelow
Level 2 Level 3 Level 4 and 5
Con
d. P
roba
bilit
y of
usi
ng c
ompu
ter
skill
s
Reading proficiency level (0 to 5)
Colombia
Vietnam
Urban populations Solid foundational and socio-emotional skills play an
important role in workforce development. In Colombia
and Vietnam, adults with higher than average reading
proficiency levels have a higher probability of using
computer skills at work.
Similarly, a worker’s socio-emotional skills are associated with the use of job-relevant skills.
For example, greater extraversion is associated with more contact with clients.
Workers who are intellectually curious and open to
experience are more likely than others to solve complex
problems and learn new things at work.
0.00
0.05
0.10
0.15
0.20
0.25
0.30
0.35
Co
rrel
atio
ns
Urban populations
17
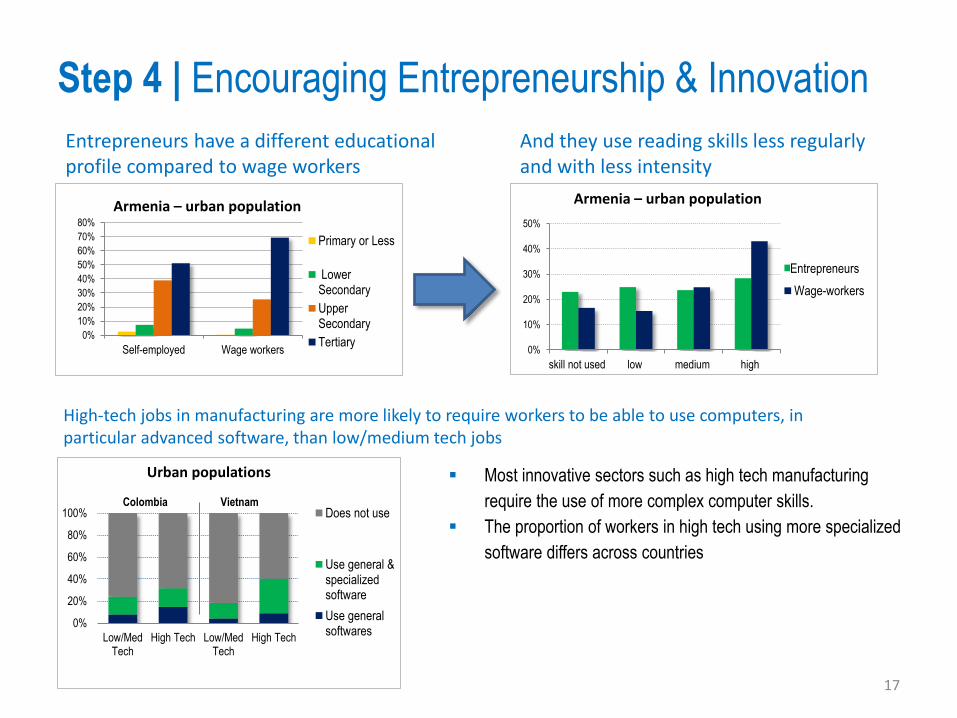
Step 4 | Encouraging Entrepreneurship & Innovation
0%
10%
20%
30%
40%
50%
60%
70%
80%
Self-employed Wage workers
Primary or Less
LowerSecondary
UpperSecondary
Tertiary
Armenia – urban population
Entrepreneurs have a different educational profile compared to wage workers
And they use reading skills less regularly and with less intensity
High-tech jobs in manufacturing are more likely to require workers to be able to use computers, in particular advanced software, than low/medium tech jobs
0%
20%
40%
60%
80%
100%
Low/MedTech
High Tech Low/MedTech
High Tech
Does not use
Use general &specializedsoftware
Use generalsoftwares
Colombia Vietnam
Urban populations
0%
10%
20%
30%
40%
50%
skill not used low medium high
Self-employed
Wage-workers
Armenia – urban population
Entrepreneurs
Most innovative sectors such as high tech manufacturing
require the use of more complex computer skills.
The proportion of workers in high tech using more specialized
software differs across countries
18
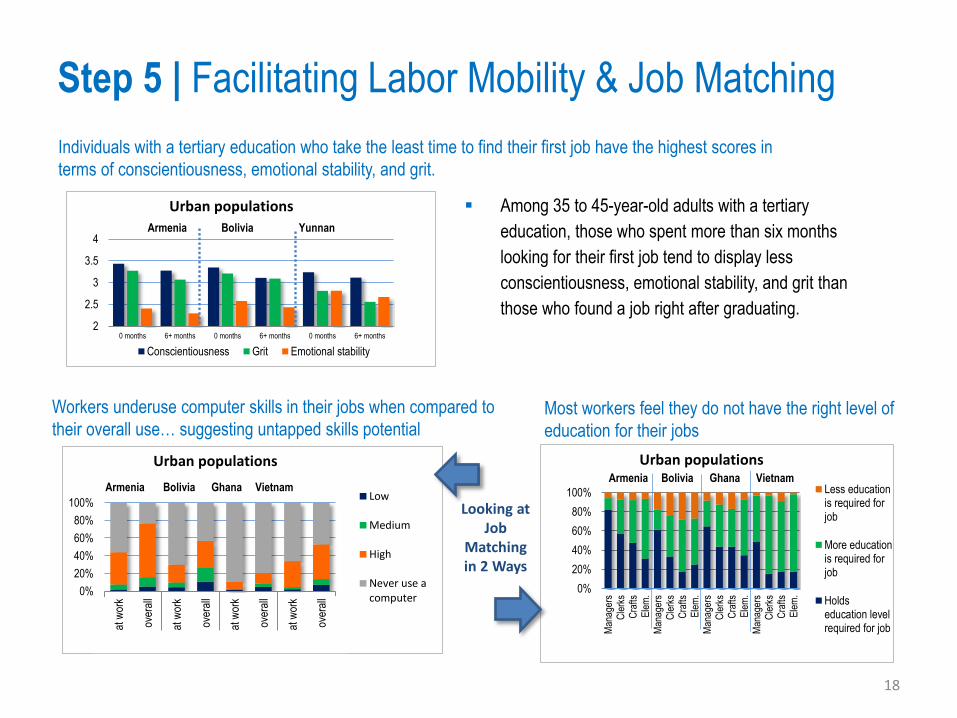
Step 5 | Facilitating Labor Mobility & Job Matching
Workers underuse computer skills in their jobs when compared to
their overall use… suggesting untapped skills potential
0%
20%
40%
60%
80%
100%
at w
ork
over
all
at w
ork
over
all
at w
ork
over
all
at w
ork
over
all
Armenia Bolivia Ghana Vietnam
Low
Medium
High
Never use acomputer
Armenia Bolivia Ghana Vietnam
Urban populations
Most workers feel they do not have the right level of
education for their jobs
0%
20%
40%
60%
80%
100%
Man
ager
sC
lerk
sC
rafts
Ele
m.
Man
ager
sC
lerk
sC
rafts
Ele
m.
Man
ager
sC
lerk
sC
rafts
Ele
m.
Man
ager
sC
lerk
sC
rafts
Ele
m.
Less educationis required forjob
More educationis required forjob
Holdseducation levelrequired for job
Armenia Bolivia Ghana Vietnam
Urban populations
Individuals with a tertiary education who take the least time to find their first job have the highest scores in
terms of conscientiousness, emotional stability, and grit.
2
2.5
3
3.5
4
0 months 6+ months 0 months 6+ months 0 months 6+ months
Conscientiousness Grit Emotional stability
Armenia Bolivia Yunnan
Urban populations
Looking at Job
Matching in 2 Ways
Among 35 to 45-year-old adults with a tertiary
education, those who spent more than six months
looking for their first job tend to display less
conscientiousness, emotional stability, and grit than
those who found a job right after graduating.
For additional information, please contact:
Task Team Leaders:
Core STEP Team:
Tania Rajadel [email protected]
Sebastian Monroy Taborda [email protected]
19
Alexandria Valerio [email protected]
Maria Laura Sanchez Puerta [email protected]
Annex
Survey Instruments
20
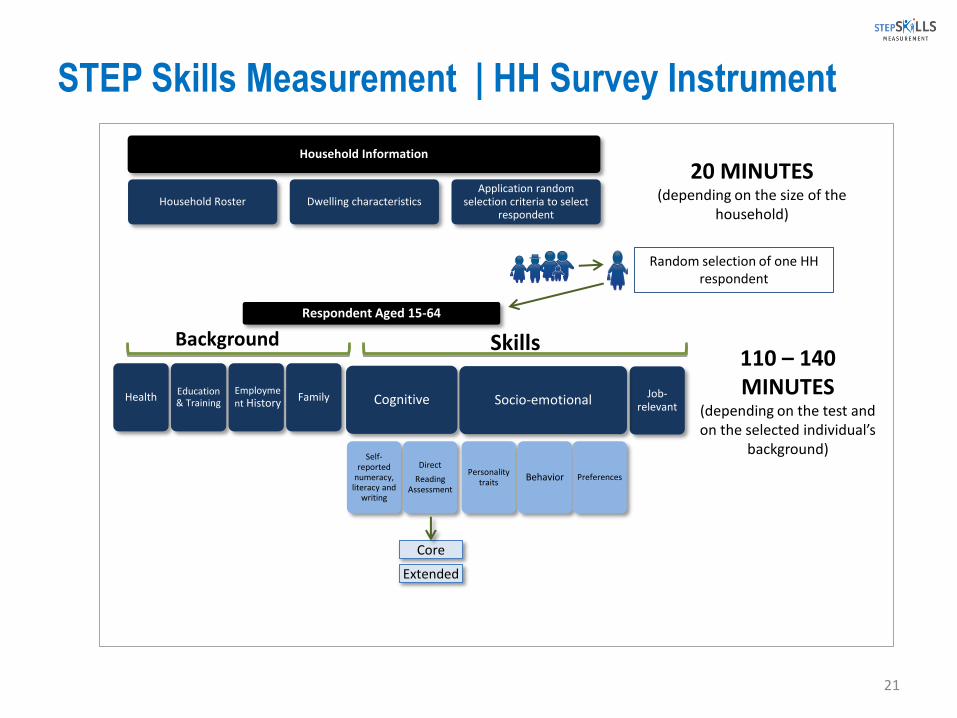
21
Respondent Aged 15-64
Background
Health Education & Training
Employment History Family
Skills
Cognitive
Self-reported
numeracy, literacy and
writing
Direct
Reading Assessment
Job-relevant
Socio-emotional
Personality traits
Behavior Preferences
Household Information
Household Roster Dwelling characteristics Application random
selection criteria to select respondent
STEP Skills Measurement | HH Survey Instrument
20 MINUTES (depending on the size of the
household)
110 – 140 MINUTES
(depending on the test and on the selected individual’s
background)
Core
Extended
Random selection of one HH respondent
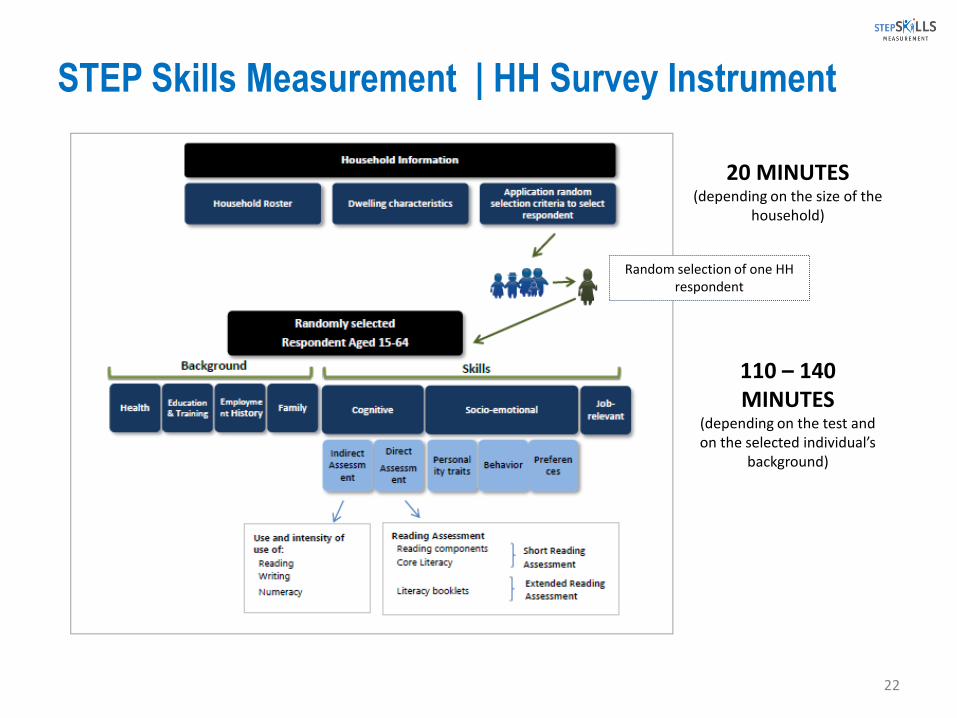
22
STEP Skills Measurement | HH Survey Instrument
20 MINUTES (depending on the size of the
household)
110 – 140 MINUTES
(depending on the test and on the selected individual’s
background)
Random selection of one HH respondent
Provides comprehensive skills modules for selected individuals aged 15-64 (employed, unemployed and inactive)
Tracks skills acquisition and maintenance through detailed education and training history, including non-formal and formal apprenticeships
Includes transitions in the labor market, including first job, current and previous spells, information on previous wage jobs for self-employed (voluntary/involuntary self-employment)
Provides information on labor market success of the self-employed (start-up capital, earnings, sales, business expansion)
Incorporates information on health status (BMI, chronic disease)
Instrumental variables (family background, distance to school)
23
STEP Skills Measurement | HH Survey Key Features
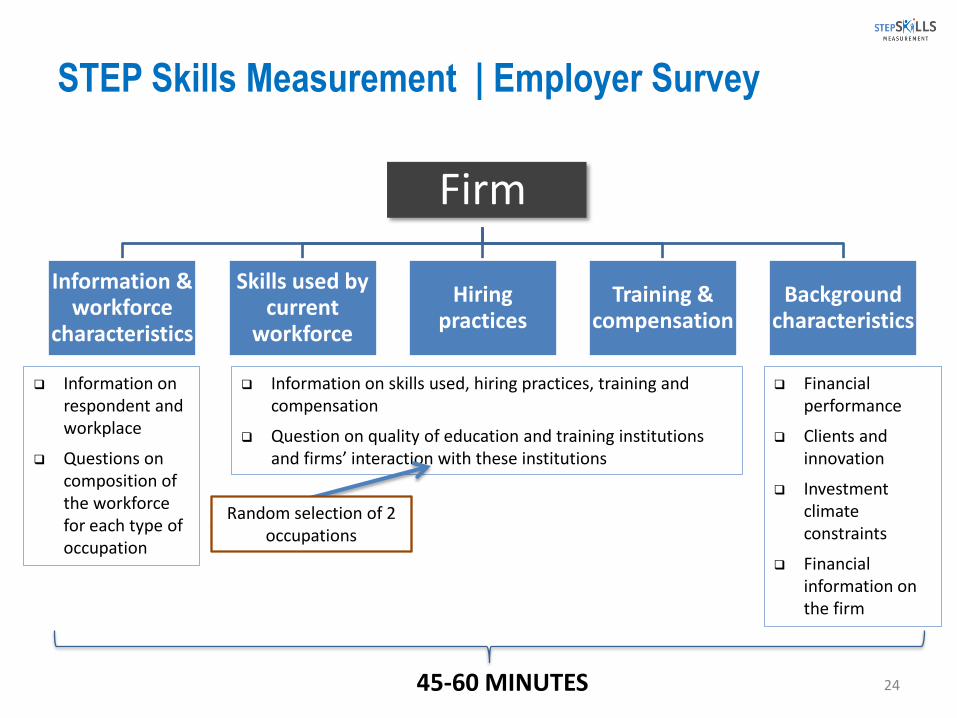
Firm
Information & workforce
characteristics
Skills used by current
workforce
Hiring practices
Training & compensation
Background characteristics
45-60 MINUTES
Information on respondent and workplace
Questions on composition of the workforce for each type of occupation
Information on skills used, hiring practices, training and compensation
Question on quality of education and training institutions and firms’ interaction with these institutions
Financial performance
Clients and innovation
Investment climate constraints
Financial information on the firm
24
STEP Skills Measurement | Employer Survey
Random selection of 2 occupations
Can be implemented to firms of any size (formal or informal), since it refers to occupations currently employed in firm
Provides comprehensive skills modules for selected types of occupation
Measures skills that are directly comparable to those of the household survey
Provides information on training provision and needs, as well as relationship with and opinion about education and training institutions
25
STEP Skills Measurement | Employer Survey Key Features


