
Why Africa?
In this section:
01.What is our vision?
02.Africa in numbers
03.Too big to ignore
04.The rise and rise of cities
05.Governance and the rule of law
06.Trade and investment
07.Natural resources
08.Technology
09.The Atlas Mara opportunity
An overview of our vision and the trends and opportunities that we see in sub-Saharan Africa.
Our business in numbers:
$625mof equity capital raised
$2.6bnin assets
1,600+employees 4
acquisitions completed in 2014
7countries
Operations and investments in
Annual Report 2014Atlas Mara Limited
17
Overview
Why A
frica?S
trategyP
erformance
Governance
Financial statements
Additional inform
ation
16 Annual Report 2014Atlas Mara Limited
01.
What is our vision?
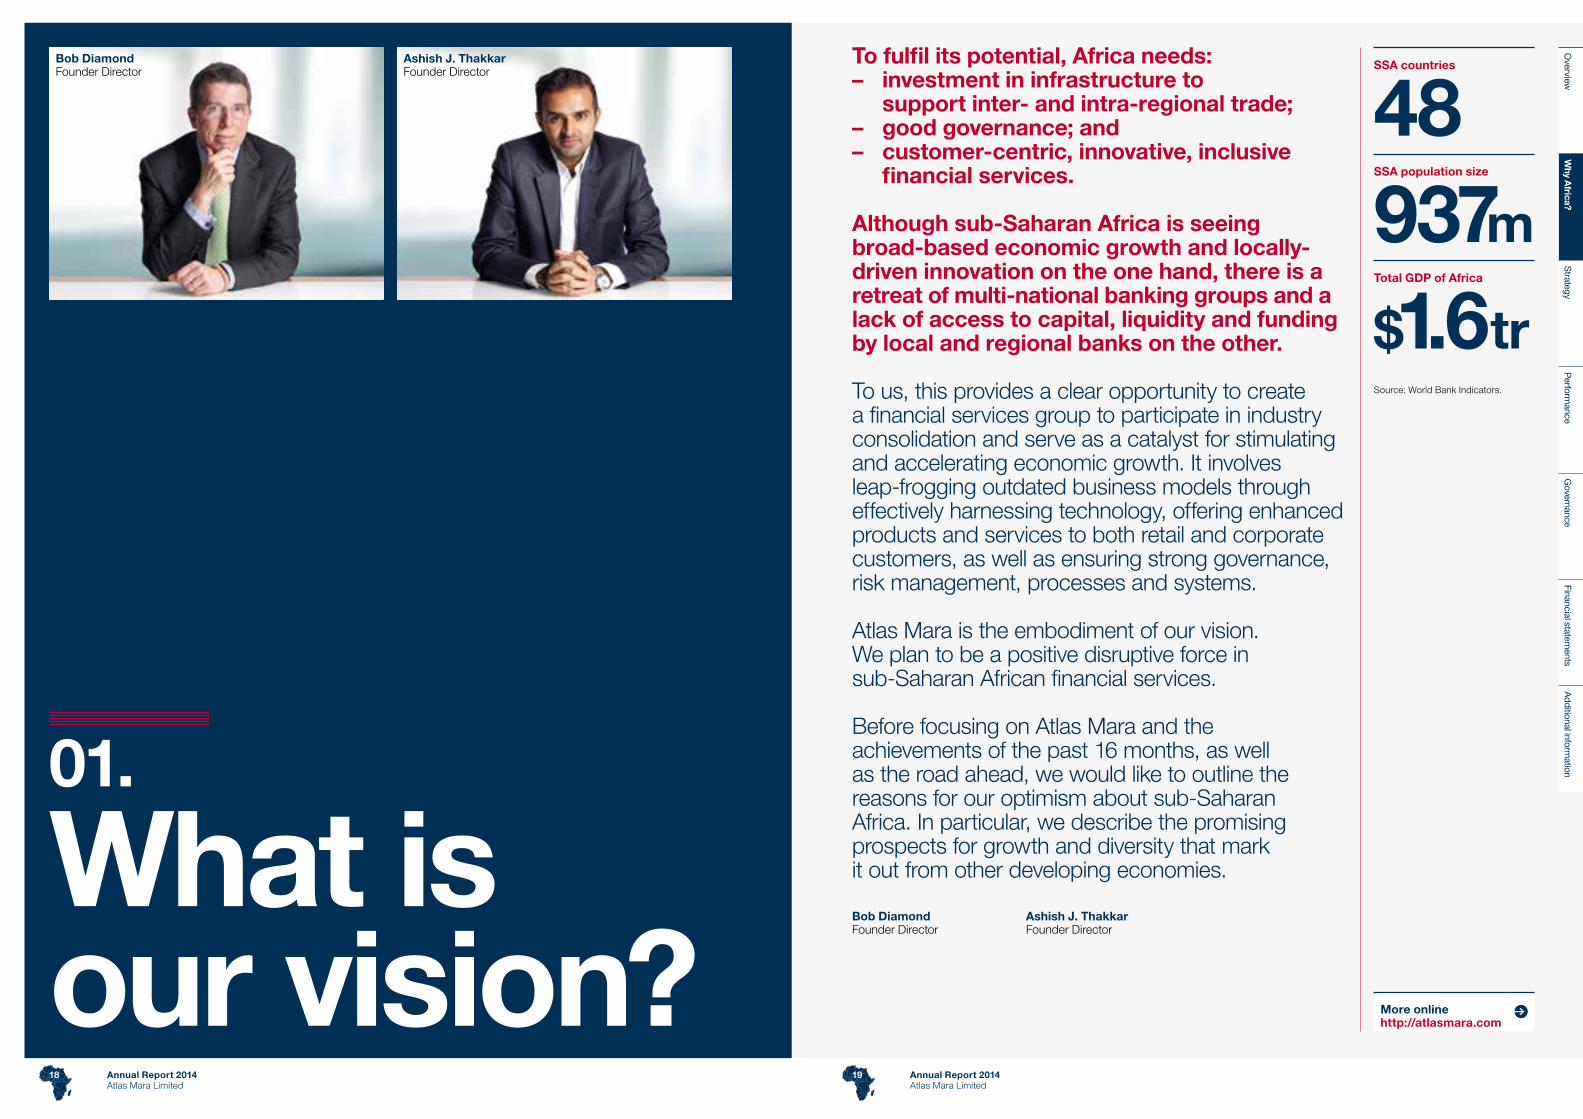
To fulfil its potential, Africa needs:– investment in infrastructure to
support inter- and intra-regional trade;– good governance; and – customer-centric, innovative, inclusive
financial services.
Although sub-Saharan Africa is seeing broad-based economic growth and locally-driven innovation on the one hand, there is a retreat of multi-national banking groups and a lack of access to capital, liquidity and funding by local and regional banks on the other.
To us, this provides a clear opportunity to create a financial services group to participate in industry consolidation and serve as a catalyst for stimulating and accelerating economic growth. It involves leap-frogging outdated business models through effectively harnessing technology, offering enhanced products and services to both retail and corporate customers, as well as ensuring strong governance, risk management, processes and systems.
Atlas Mara is the embodiment of our vision. We plan to be a positive disruptive force in sub-Saharan African financial services.
Before focusing on Atlas Mara and the achievements of the past 16 months, as well as the road ahead, we would like to outline the reasons for our optimism about sub-Saharan Africa. In particular, we describe the promising prospects for growth and diversity that mark it out from other developing economies.
Bob DiamondFounder Director
Ashish J. ThakkarFounder Director
SSA countries
48SSA population size
937mTotal GDP of Africa
$1.6tr
More onlinehttp://atlasmara.com
Source: World Bank Indicators.
Bob DiamondFounder Director
Ashish J. ThakkarFounder Director
Annual Report 2014Atlas Mara Limited
Annual Report 2014Atlas Mara Limited
18 19
Overview
Why A
frica?S
trategyP
erformance
Governance
Financial statements
Additional inform
ation

Dakar
Lagos
São Paulo
New York
Mumbai
London
Dar es Salaam
Johannesburg
Dakar to New York1
6,148km
Dakar to São Paulo1
5,306km
Dakar to Johannesburg1
6,698km
Dar es Salaam to Mumbai1
4,669km
Lagos to London1
5,021km
Sub-Saharan Africa
Non sub-Saharan Africa
02.Africa in numbersSub-Saharan Africa recorded a compound annual growth rate (“CAGR”) in GDP of approximately 5% for the period from 2008-2014. The underlying drivers of this growth are broad-based and robust:
– Favourable demographics – Increasing rates of urbanisation
– Relative political stability – Increased foreign direct investment
– Regional integration – Unparalleled natural resources
– Technological innovation and early adoption
The perception gap with respect of the realisable potential of sub-Saharan Africa is narrowing as people increasingly recognise the pace of change across the continent. Although negatives such as Ebola, terrorism and corruption continue to define some attitudes towards Africa,
the governments and citizenry of the 48 countries that constitute sub-Saharan Africa continue to make impressive forward strides. We aim to “change the conversation” when it comes to the expectations and opportunities that define Africa in the 21st century.
GDP and Population Source: World Bank, World Development Indicators Database. 1. Source: http://distance.to.2. Somalia GDP as at 2012. Source: http://data.un.org.
Overview
Why A
frica?S
trategyP
erformance
Governance
Financial statements
Additional inform
ation
Annual Report 2014Atlas Mara Limited
20
Lesotho
CapitalMaseru
GDP$2.3bn
Population2.1m
Chad
CapitalN’Djamena
GDP$13.5bn
Population12.8m
Nigeria
CapitalAbuja
GDP$521.8bn
Population173.6m
Burkina Faso
CapitalOuagadougou
GDP$11.6bn
Population16.9m
Mauritania
CapitalNouakchott
GDP$4.2bn
Population3.9m
Sierra Leone
CapitalFreetown
GDP$4.1bn
Population6.1m
Central African Republic
CapitalBangui
GDP$1.5bn
Population4.6m
Democratic Republic of the Congo
CapitalKinshasa
GDP$32.7bn
Population67.5m
Niger
CapitalNiamey
GDP$7.4bn
Population17.8m
Botswana
CapitalGaborone
GDP$14.8bn
Population2.0m
Mauritius
CapitalPort Louis
GDP$11.9bn
Population1.3m
Mozambique
CapitalMaputo
GDP$15.6bn
Population25.8m
Rwanda
CapitalKigali
GDP$7.5bn
Population11.8m
Eritrea
CapitalAsmara
GDP$3.4bn
Population6.3m
Malawi
CapitalLilongwe
GDP$3.7bn
Population16.4m
Seychelles
CapitalVictoria
GDP$1.4bn
Population0.1m
Ethiopia
CapitalAddis Ababa
GDP$47.5bn
Population94.1m
Comoros
CapitalMoroni
GDP$0.6bn
Population0.7m
Tanzania
CapitalDodoma
GDP$33.2bn
Population49.3m
South Sudan
CapitalJuba
GDP$11.8bn
Population11.3m
South Africa
CapitalsPretoria, Cape Town, Bloemfontein
GDP$350.6bn
Population53.0m
Mali
CapitalBamako
GDP$10.9bn
Population15.3m
Senegal
CapitalDakar
GDP$14.8bn
Population14.1m
Liberia
CapitalMonrovia
GDP$2.0bn
Population4.3m
Côte d’Ivoire
CapitalYamoussoukro
GDP$31.1bn
Population20.3m
The Gambia
CapitalBanjul
GDP$0.9bn
Population1.8m
Cape Verde
CapitalPraia
GDP$1.9bn
Population0.5m
Guinea-Bissau
CapitalBissau
GDP$1.0bn
Population1.7m
Guinea
CapitalConakry
GDP$6.1bn
Population11.7m
Namibia
CapitalWindhoek
GDP$13.1bn
Population2.3m
Angola
CapitalLuanda
GDP$124.2bn
Population21.5m
Republic of Congo
CapitalBrazzaville
GDP$14.1bn
Population4.4m
Cameroon
CapitalYaoundé
GDP$29.6bn
Population22.3m
Benin
CapitalPorto Novo
GDP$8.3bn
Population10.3m
Gabon
CapitalLibreville
GDP$19.3bn
Population1.7m
Equatorial Guinea
CapitalMalabo
GDP$15.6bn
Population0.8m
São Tomé and Príncipe
CapitalSão Tomé
GDP$0.3bn
Population0.2m
Togo
CapitalLomé
GDP$4.3bn
Population6.8m
Ghana
CapitalAccra
GDP$48.1bn
Population25.9m
Swaziland
CapitalsLobamba, Mbabane
GDP$3.8bn
Population1.2m
Madagascar
CapitalAntananarivo
GDP$10.6bn
Population22.9m
Zimbabwe
CapitalHarare
GDP$13.5bn
Population14.1m
Kenya
CapitalNairobi
GDP$55.2bn
Population44.4m
Uganda
CapitalKampala
GDP$21.5bn
Population37.6m
Sudan
CapitalKhartoum
GDP$66.6bn
Population38.0m
Zambia
CapitalLusaka
GDP$26.8bn
Population14.5m
Burundi
CapitalBujumbura
GDP$2.7bn
Population10.2m
Somalia
CapitalMogadishu
GDP$1.3bn2
Population10.5m
USA2
India
China
Brazil UK
Modern Africa snapshot: 51.6m
Facebook users
50%of urban residents are online
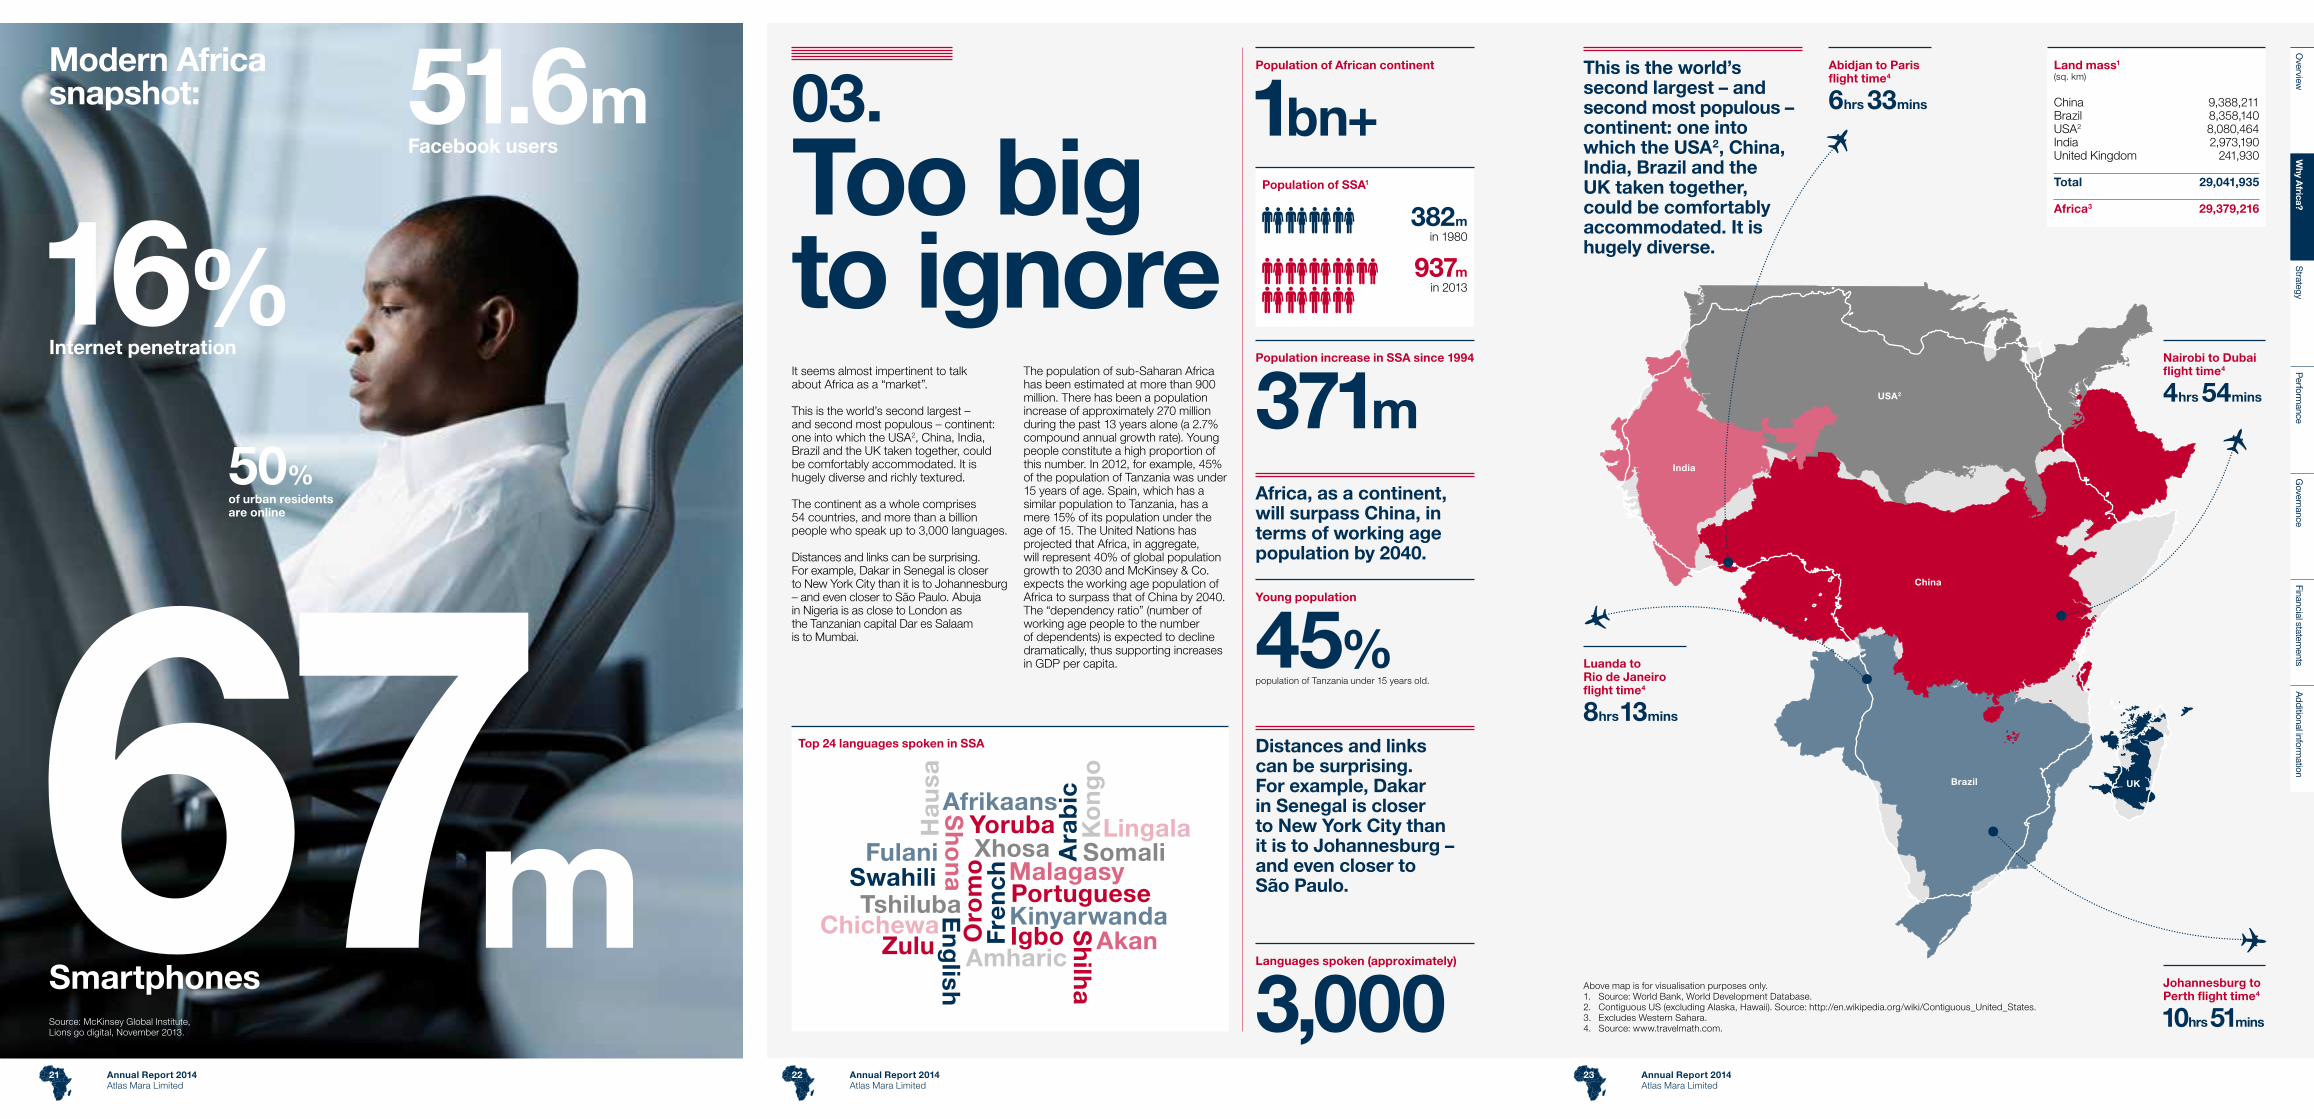
03.Too big to ignoreIt seems almost impertinent to talk about Africa as a “market”.
This is the world’s second largest – and second most populous – continent: one into which the USA2, China, India, Brazil and the UK taken together, could be comfortably accommodated. It is hugely diverse and richly textured.
The continent as a whole comprises 54 countries, and more than a billion people who speak up to 3,000 languages.
Distances and links can be surprising. For example, Dakar in Senegal is closer to New York City than it is to Johannesburg – and even closer to São Paulo. Abuja in Nigeria is as close to London as the Tanzanian capital Dar es Salaam is to Mumbai.
The population of sub-Saharan Africa has been estimated at more than 900 million. There has been a population increase of approximately 270 million during the past 13 years alone (a 2.7% compound annual growth rate). Young people constitute a high proportion of this number. In 2012, for example, 45% of the population of Tanzania was under 15 years of age. Spain, which has a similar population to Tanzania, has a mere 15% of its population under the age of 15. The United Nations has projected that Africa, in aggregate, will represent 40% of global population growth to 2030 and McKinsey & Co. expects the working age population of Africa to surpass that of China by 2040. The “dependency ratio” (number of working age people to the number of dependents) is expected to decline dramatically, thus supporting increases in GDP per capita.
Africa, as a continent, will surpass China, in terms of working age population by 2040.
Distances and links can be surprising. For example, Dakar in Senegal is closer to New York City than it is to Johannesburg – and even closer to São Paulo.
This is the world’s second largest – and second most populous – continent: one into which the USA2, China, India, Brazil and the UK taken together, could be comfortably accommodated. It is hugely diverse.
Population increase in SSA since 1994
371m
Population of African continent
1bn+
Languages spoken (approximately)
3,000
Nairobi to Dubai flight time4
4hrs 54mins
Johannesburg to Perth flight time4
10hrs 51mins
Abidjan to Paris flight time4
6hrs 33mins
Luanda to Rio de Janeiro flight time4
8hrs 13mins
Young population
45%population of Tanzania under 15 years old.
Land mass1 (sq. km)
China 9,388,211Brazil 8,358,140USA2 8,080,464India 2,973,190United Kingdom 241,930
Total 29,041,935
Africa3 29,379,216
Top 24 languages spoken in SSA
Population of SSA1
382min 1980
937m in 2013
Above map is for visualisation purposes only.1. Source: World Bank, World Development Database.2. Contiguous US (excluding Alaska, Hawaii). Source: http://en.wikipedia.org/wiki/Contiguous_United_States.3. Excludes Western Sahara.4. Source: www.travelmath.com.
16%Internet penetration
67m
SmartphonesSource: McKinsey Global Institute, Lions go digital, November 2013.
Overview
Why A
frica?S
trategyP
erformance
Governance
Financial statements
Additional inform
ation
Annual Report 2014Atlas Mara Limited
Annual Report 2014Atlas Mara Limited
22 23Annual Report 2014Atlas Mara Limited
21
Population greater than 10 million
Population between 5 million and 10 million
Population greater than 1 million
Johannesburg
Dar es SalaamLuanda
Durban
Soweto
Pretoria
Harare
Cape Town
Mogadishu
Lusaka
Addis Ababa
Shubra al-Khaymah
KhartoumOmdurman
Douala
Kaduna
Nairobi
Kano
Ibadan
Brazzaville
YaoundéPort Harcourt
Benin CityAbidjan
FreetownConakry
Accra
Dakar
Lubumbashi
Rabat
Maputo
Alexandria
Casablanca
Algiers
Tripoli
Giza
Kinshasha
Lagos
Cairo04.The rise and rise of cities
05.Governance and the rule of law
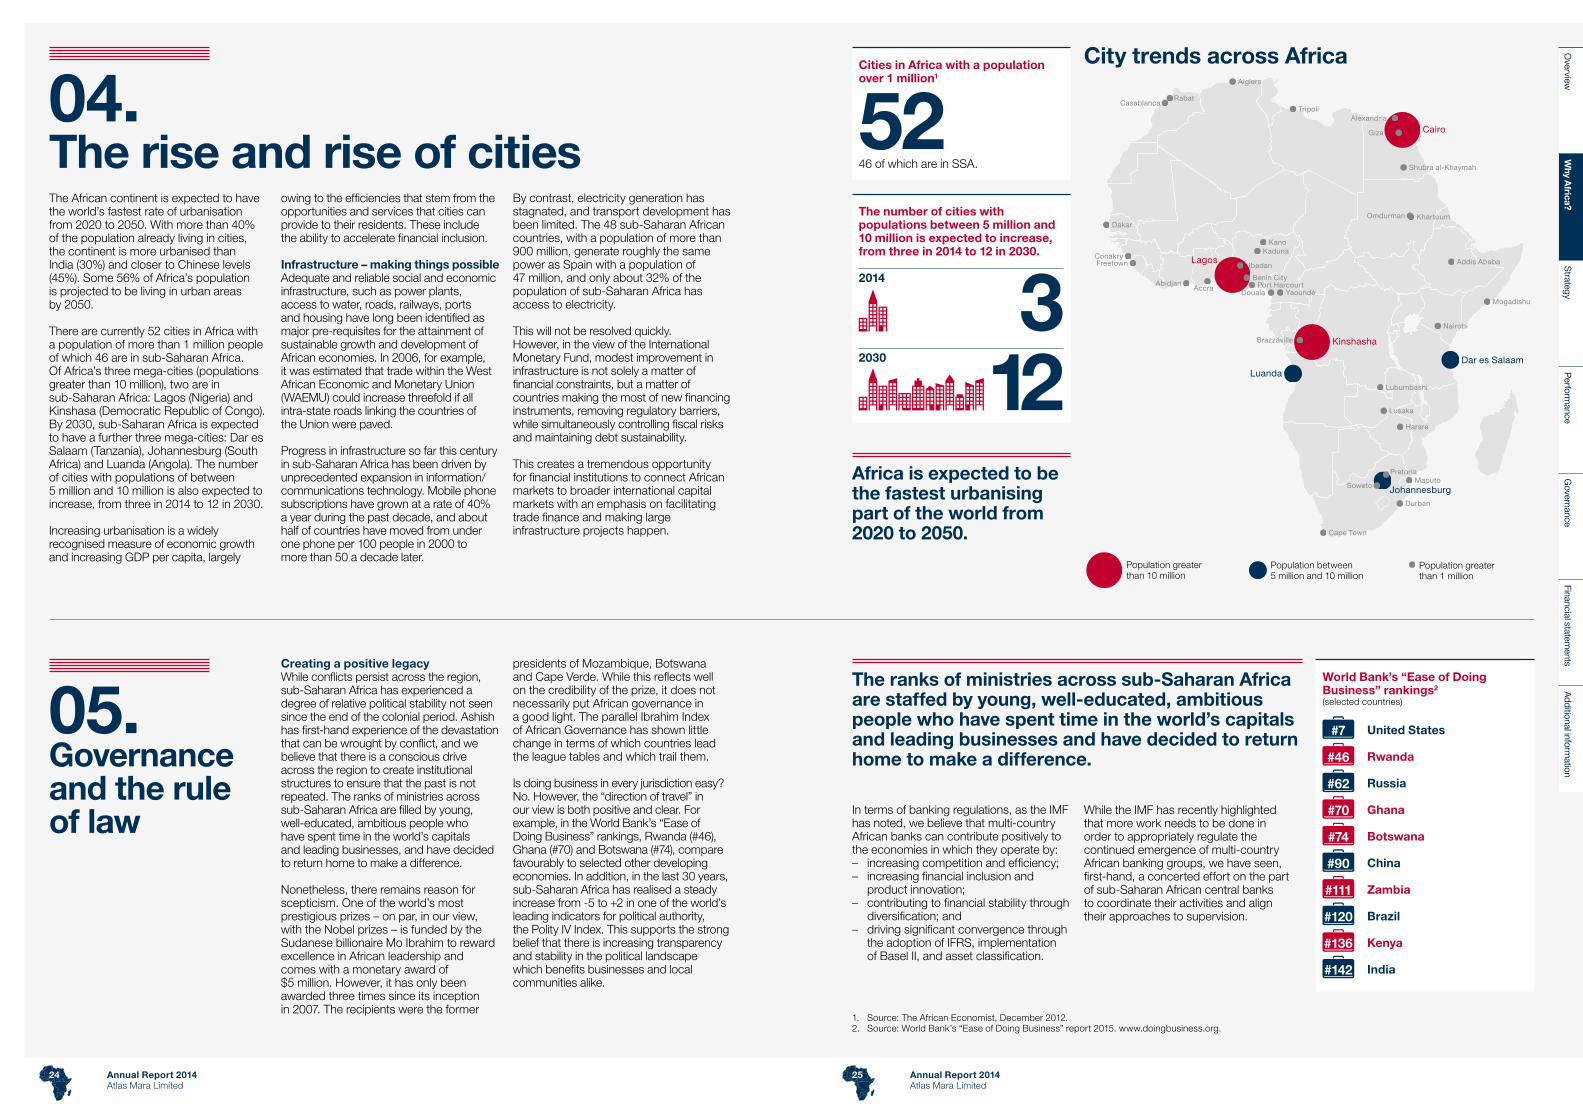
The African continent is expected to have the world’s fastest rate of urbanisation from 2020 to 2050. With more than 40% of the population already living in cities, the continent is more urbanised than India (30%) and closer to Chinese levels (45%). Some 56% of Africa’s population is projected to be living in urban areas by 2050.
There are currently 52 cities in Africa with a population of more than 1 million people of which 46 are in sub-Saharan Africa. Of Africa’s three mega-cities (populations greater than 10 million), two are in sub-Saharan Africa: Lagos (Nigeria) and Kinshasa (Democratic Republic of Congo). By 2030, sub-Saharan Africa is expected to have a further three mega-cities: Dar es Salaam (Tanzania), Johannesburg (South Africa) and Luanda (Angola). The number of cities with populations of between 5 million and 10 million is also expected to increase, from three in 2014 to 12 in 2030.
Increasing urbanisation is a widely recognised measure of economic growth and increasing GDP per capita, largely
owing to the efficiencies that stem from the opportunities and services that cities can provide to their residents. These include the ability to accelerate financial inclusion.
Infrastructure – making things possibleAdequate and reliable social and economic infrastructure, such as power plants, access to water, roads, railways, ports and housing have long been identified as major pre-requisites for the attainment of sustainable growth and development of African economies. In 2006, for example, it was estimated that trade within the West African Economic and Monetary Union (WAEMU) could increase threefold if all intra-state roads linking the countries of the Union were paved.
Progress in infrastructure so far this century in sub-Saharan Africa has been driven by unprecedented expansion in information/communications technology. Mobile phone subscriptions have grown at a rate of 40% a year during the past decade, and about half of countries have moved from under one phone per 100 people in 2000 to more than 50 a decade later.
Creating a positive legacyWhile conflicts persist across the region, sub-Saharan Africa has experienced a degree of relative political stability not seen since the end of the colonial period. Ashish has first-hand experience of the devastation that can be wrought by conflict, and we believe that there is a conscious drive across the region to create institutional structures to ensure that the past is not repeated. The ranks of ministries across sub-Saharan Africa are filled by young, well-educated, ambitious people who have spent time in the world’s capitals and leading businesses, and have decided to return home to make a difference.
Nonetheless, there remains reason for scepticism. One of the world’s most prestigious prizes – on par, in our view, with the Nobel prizes – is funded by the Sudanese billionaire Mo Ibrahim to reward excellence in African leadership and comes with a monetary award of $5 million. However, it has only been awarded three times since its inception in 2007. The recipients were the former
By contrast, electricity generation has stagnated, and transport development has been limited. The 48 sub-Saharan African countries, with a population of more than 900 million, generate roughly the same power as Spain with a population of 47 million, and only about 32% of the population of sub-Saharan Africa has access to electricity.
This will not be resolved quickly. However, in the view of the International Monetary Fund, modest improvement in infrastructure is not solely a matter of financial constraints, but a matter of countries making the most of new financing instruments, removing regulatory barriers, while simultaneously controlling fiscal risks and maintaining debt sustainability.
This creates a tremendous opportunity for financial institutions to connect African markets to broader international capital markets with an emphasis on facilitating trade finance and making large infrastructure projects happen.
presidents of Mozambique, Botswana and Cape Verde. While this reflects well on the credibility of the prize, it does not necessarily put African governance in a good light. The parallel Ibrahim Index of African Governance has shown little change in terms of which countries lead the league tables and which trail them.
Is doing business in every jurisdiction easy? No. However, the “direction of travel” in our view is both positive and clear. For example, in the World Bank’s “Ease of Doing Business” rankings, Rwanda (#46), Ghana (#70) and Botswana (#74), compare favourably to selected other developing economies. In addition, in the last 30 years, sub-Saharan Africa has realised a steady increase from -5 to +2 in one of the world’s leading indicators for political authority, the Polity IV Index. This supports the strong belief that there is increasing transparency and stability in the political landscape which benefits businesses and local communities alike.
In terms of banking regulations, as the IMF has noted, we believe that multi-country African banks can contribute positively to the economies in which they operate by: – increasing competition and efficiency; – increasing financial inclusion and
product innovation; – contributing to financial stability through
diversification; and – driving significant convergence through
the adoption of IFRS, implementation of Basel II, and asset classification.
Cities in Africa with a population over 1 million1
5246 of which are in SSA.
Africa is expected to be the fastest urbanising part of the world from 2020 to 2050.
The ranks of ministries across sub-Saharan Africa are staffed by young, well-educated, ambitious people who have spent time in the world’s capitals and leading businesses and have decided to return home to make a difference.
While the IMF has recently highlighted that more work needs to be done in order to appropriately regulate the continued emergence of multi-country African banking groups, we have seen, first-hand, a concerted effort on the part of sub-Saharan African central banks to coordinate their activities and align their approaches to supervision.
City trends across Africa
World Bank’s “Ease of Doing Business” rankings2
(selected countries)
United States
China
Zambia
Rwanda
Brazil
Russia
Kenya
Ghana
India
#7
#90
#111
#46
#120
#62
#136
#70
#142
1. Source: The African Economist, December 2012.2. Source: World Bank’s “Ease of Doing Business” report 2015. www.doingbusiness.org.
The number of cities with populations between 5 million and 10 million is expected to increase, from three in 2014 to 12 in 2030.
2030
2014
312
Botswana#74
Annual Report 2014Atlas Mara Limited
Annual Report 2014Atlas Mara Limited
24 25
Overview
Why A
frica?S
trategyP
erformance
Governance
Financial statements
Additional inform
ation
Imports in EAC, ECOWAS and SADC1
2010 2011 2012 2013
n/a
96.5
150.6
34.3
124.5
187.5
35.6
99.6
195.4
37.3
110.3
203.5
$bn
50
100
150
200
250
Exports in EAC, ECOWAS and SADC1
2010 2011 2012 2013
n/a
112.6
175.6
13.4
168.4
221.7
13.9
187.4222.1
12.9
139.3
220.0
$bn
50
100
150
200
250
BRICs exports to SSA2
’00 ’01 ’02 ’03 ’04 ’05 ’06 ’07 ’08 ’09 ’10 ’11 ’12 ’13
$bn
20
40
60
80
100
120
BRICs imports from SSA2
’00 ’01 ’02 ’03 ’04 ’05 ’06 ’07 ’08 ’09 ’10 ’11 ’12 ’13
$bn
20406080100120140160180
EAC ECOWAS SADC
EAC ECOWAS SADC
Brazil China India Russian Federation Total BRIC Brazil China India Russian Federation Total BRIC
’13’12’11’10’09’08’07’06’05’04’03’02’01’00’99’98’97’95 ’96
$bn
102030405060
Inward FDI �ows
06. Trade and investment
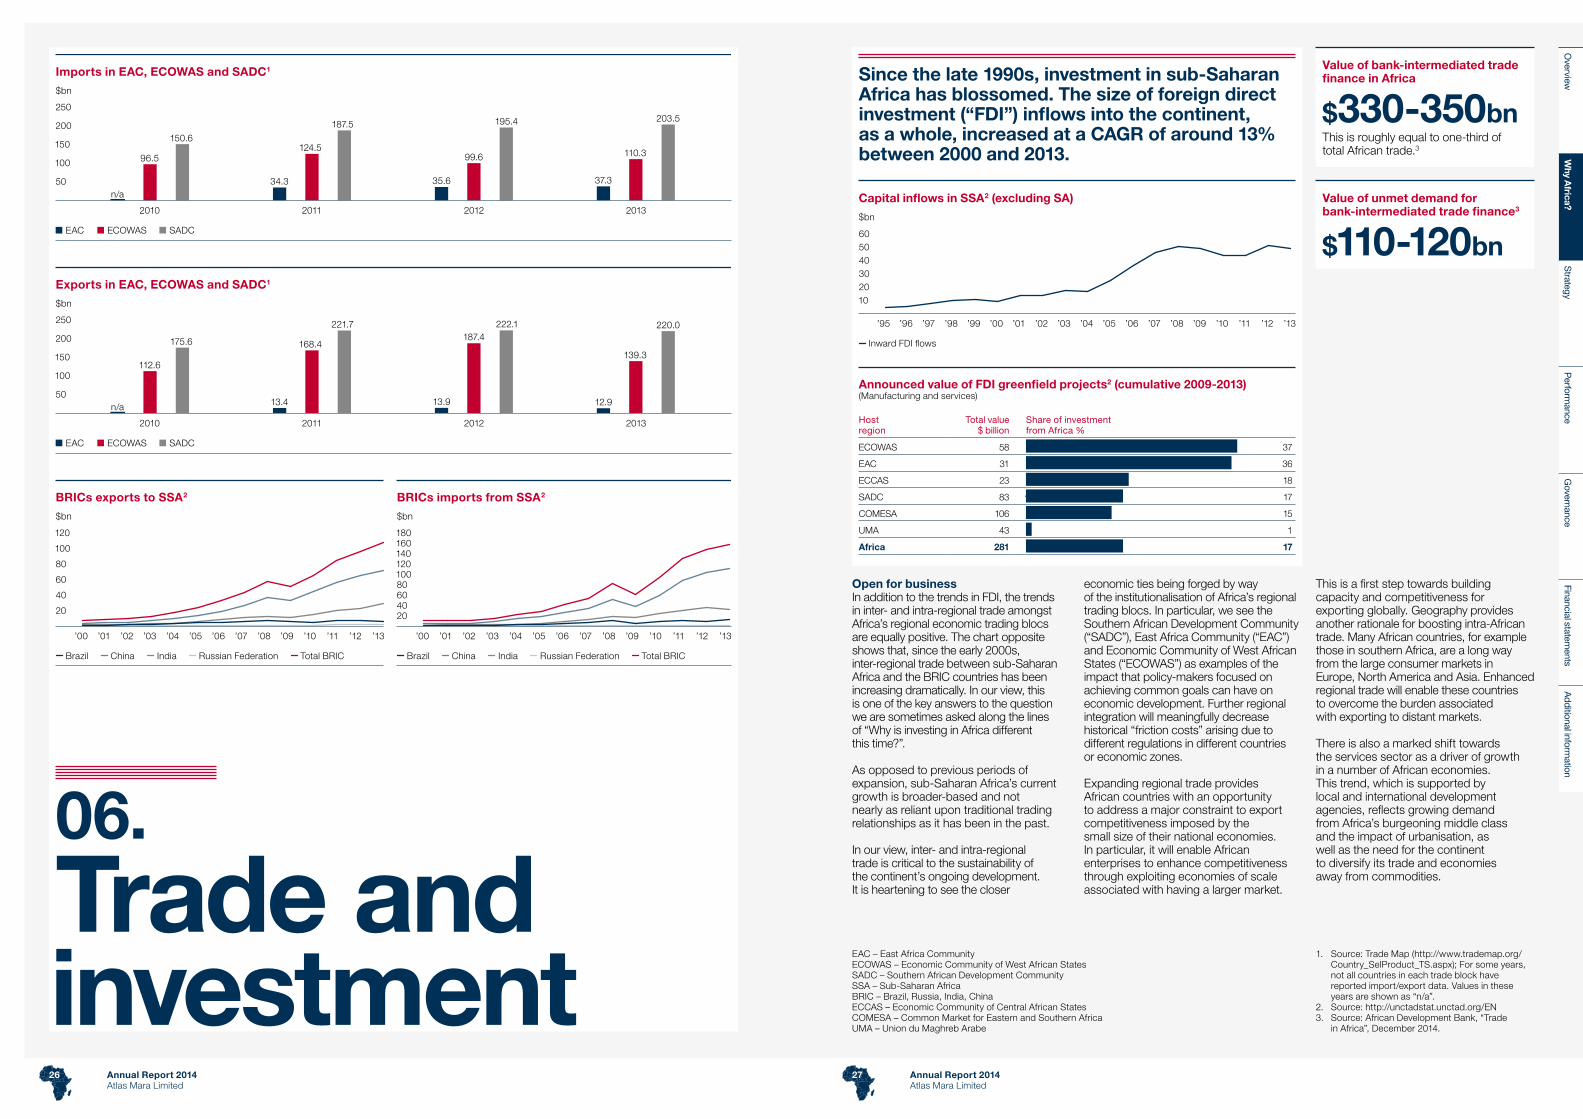
Since the late 1990s, investment in sub-Saharan Africa has blossomed. The size of foreign direct investment (“FDI”) inflows into the continent, as a whole, increased at a CAGR of around 13% between 2000 and 2013.
Open for businessIn addition to the trends in FDI, the trends in inter- and intra-regional trade amongst Africa’s regional economic trading blocs are equally positive. The chart opposite shows that, since the early 2000s, inter-regional trade between sub-Saharan Africa and the BRIC countries has been increasing dramatically. In our view, this is one of the key answers to the question we are sometimes asked along the lines of “Why is investing in Africa different this time?”.
As opposed to previous periods of expansion, sub-Saharan Africa’s current growth is broader-based and not nearly as reliant upon traditional trading relationships as it has been in the past.
In our view, inter- and intra-regional trade is critical to the sustainability of the continent’s ongoing development. It is heartening to see the closer
1. Source: Trade Map (http://www.trademap.org/Country_SelProduct_TS.aspx); For some years, not all countries in each trade block have reported import/export data. Values in these years are shown as “n/a”.
2. Source: http://unctadstat.unctad.org/EN3. Source: African Development Bank, “Trade
in Africa”, December 2014.
EAC – East Africa CommunityECOWAS – Economic Community of West African StatesSADC – Southern African Development CommunitySSA – Sub-Saharan AfricaBRIC – Brazil, Russia, India, ChinaECCAS – Economic Community of Central African StatesCOMESA – Common Market for Eastern and Southern AfricaUMA – Union du Maghreb Arabe
economic ties being forged by way of the institutionalisation of Africa’s regional trading blocs. In particular, we see the Southern African Development Community (“SADC”), East Africa Community (“EAC”) and Economic Community of West African States (“ECOWAS”) as examples of the impact that policy-makers focused on achieving common goals can have on economic development. Further regional integration will meaningfully decrease historical “friction costs” arising due to different regulations in different countries or economic zones.
Expanding regional trade provides African countries with an opportunity to address a major constraint to export competitiveness imposed by the small size of their national economies. In particular, it will enable African enterprises to enhance competitiveness through exploiting economies of scale associated with having a larger market.
This is a first step towards building capacity and competitiveness for exporting globally. Geography provides another rationale for boosting intra-African trade. Many African countries, for example those in southern Africa, are a long way from the large consumer markets in Europe, North America and Asia. Enhanced regional trade will enable these countries to overcome the burden associated with exporting to distant markets.
There is also a marked shift towards the services sector as a driver of growth in a number of African economies. This trend, which is supported by local and international development agencies, reflects growing demand from Africa’s burgeoning middle class and the impact of urbanisation, as well as the need for the continent to diversify its trade and economies away from commodities.
Value of bank-intermediated trade finance in Africa
$330-350bnThis is roughly equal to one-third of total African trade.3
Announced value of FDI greenfield projects2 (cumulative 2009-2013)(Manufacturing and services)
Host region
Total value $ billion
Share of investment from Africa %
ECOWAS 58 37
EAC 31 36
ECCAS 23 18
SADC 83 17
COMESA 106 15
UMA 43 1
Africa 281 17
Capital inflows in SSA2 (excluding SA) Value of unmet demand for bank-intermediated trade finance3
$110-120bn
Annual Report 2014Atlas Mara Limited
Annual Report 2014Atlas Mara Limited
26 27
Overview
Why A
frica?S
trategyP
erformance
Governance
Financial statements
Additional inform
ation

Spending by importers1
Tanzania6.3%
3.7%
6.2%
3.7%
6.0%
3.6%
4.8%
2.8%
2.7%
1.6%
15.7%
9.3%
56.0%
33.1%
Mozambique
Kenya
South Africa
Ghana
Nigeria
Angola
Revenue for exporters1
Brent crude, price per barrel
$108.56
$57.10
50-day average in June 2014
1 April 2015
At $108.56 (50-day average in June 2014)Brent crude, price per barrel
At $57.10 (on 1 April 2015)
Gold
9%
Jubilee Oil Fields
2.3%
Iron Ore and Petroleum
147.8%
Iron Ore
30.7%
Gas, Gold and Nickel
15.0%
Gas and Coal
27.3%
Bauxite
8%
Cobalt
53%
Industrial Diamonds
21%
Uranium
16%
Diamonds
22%
Platinum
77%
Manganese
21%
Chromite
46%
07.Natural resources
Investing in sub-Saharan Africa is about much more than commodities. However, the abundance of sub-Saharan Africa’s natural resources is difficult to overstate.
Beyond exportsInvesting in sub-Saharan Africa is about much more than commodities. Nonetheless, the natural resource wealth of the region cannot be overstated. Close to 90% of the world’s production of platinum group metals (PGMs) comes from mines in South Africa, Zimbabwe and Russia. A recent United States Geological Survey put South Africa’s gold reserves at about 6,000 tons – more than 10% of the world’s recoverable resources. Ghana has a further 1,400 tons of reserves.
The continent has globally significant quantities of oil and copper, uranium and diamonds, and is believed to be sitting on some of the world’s biggest untapped coal
reserves including 30 billion tons in South Africa and 23 billion tons in Mozambique.
Between 2011 and 2013, more hydrocarbons were discovered in East Africa than anywhere else in the world. Several countries are in the process of securing funding to build oil refineries over the next 5-10 years to meet the growing energy demand in the region.
Of particular importance, however, is that commodity value addition is increasingly happening within sub-Saharan Africa itself rather than abroad. Sub-Saharan Africa value-added on manufactured products increased by a CAGR of 8.3% from 2000 to 2011 (CAGR of 10.5% ex-SA).
Furthermore, internal markets are developing such that there is a beneficial multiplier effect from African resources being put to use by Africans for Africans. In terms of oil, we are following the price movements closely. While falling prices will certainly impact the economies and government budgets of oil exporting countries, oil importing nations are likely to benefit as can be seen in the following two charts which express the amount that net importers will spend on oil, or the revenue that net oil exporters will receive, expressed as a share of the country’s GDP assuming different oil prices.
Costs and benefitsOil-dependent economies are hurting because of sinking oil prices, but in the short term, cheaper oil is a boon for new producers still importing most of their energy.
Mapping Africa’s mineral wealth1
Percentage of world’s production
Average annual revenue from new projects2
Estimated annual export revenues
Ghana, Tanzania, Mali, Guinea and Burkina Faso
Guinea
Democratic Republic of Congo
South Africa
Namibia and Niger Botswana
Ghana($, constant 2011 dollars)
($, constant 2011 dollars)
($, constant 2011 dollars)
($, constant 2011 dollars)
($, constant 2011 dollars)
Per cent 2011 GDP
Per cent 2011 GDP
Per cent 2011 GDP
Per cent 2011 GDP
Per cent 2011 GDP
Nigeria oil exports
Angola oil exports
Guinea
Mozambique
Liberia
Tanzania3
8.5bn
$100bn
$70bn
1.7bn
3.5bn 1.6bn
3.5bn
1. Sources: Raw Materials Data, IntierraRMG, 2013, World Bank, Africa Pulse October 2012, Volume 6, IMF, Fiscal Regimes for Extractive Industries: Design and Implementation, 2012, US Geological Survey, Mineral commodity summaries 2013.
2. Estimates are intended to show order of magnitude. Revenue projections are highly sensitive to assumptions about prices, phasing of production, and underlying production and capital costs.
3. Data represents annual revenue at peak production.
Sources: Rhodium Group; US Energy Information Administration; International Monetary Fund.1. The amount that net importers will spend on oil,
or the revenue that net oil exporters will reap, expressed as a share of the country’s GDP.
Annual Report 2014Atlas Mara Limited
Annual Report 2014Atlas Mara Limited
28 29
Overview
Why A
frica?S
trategyP
erformance
Governance
Financial statements
Additional inform
ation
East Asia and Paci�c
Europe and Central Asia
Latin America and Caribbean
Middle East and North Africa
South Asia Sub-Saharan Africa
1.31 1.21 1.042.97 2.70 2.51 1.78 1.85
0.81 0.992.35
1.33 2.05 1.910.78
3.00
14.56
11.18
% age 15+
3
6
9
12
15
Mobile phone used to pay bills Mobile phone used to receive money Mobile phone used to send money
2000 2001 2002 2003 2004 2005 2006 2007 2008 2009 2010 2011 2012 2013
bn
0.5
1.0
1.5
2.0
2.5
European Union
East Asia and Paci�c (all income levels)
Sub-Saharan Africa (all income levels)
Middle East and North Africa (all income levels)
Europe and Central Asia (all income levels)
2000 2001 2002 2003 2004 2005 2006 2007 2008 2009 2010 2011 2012 2013
per 100 people
1020304050607080
European Union
East Asia and Paci�c (all income levels)
Sub-Saharan Africa (all income levels)
Middle East and North Africa (all income levels)
600m
167m
’00 ’01 ’02 ’03 ’04 ’05 ’06 ’07 ’08 ’09 ’10 ’11 ’12 ’13
per 100 people
5
10
15
20
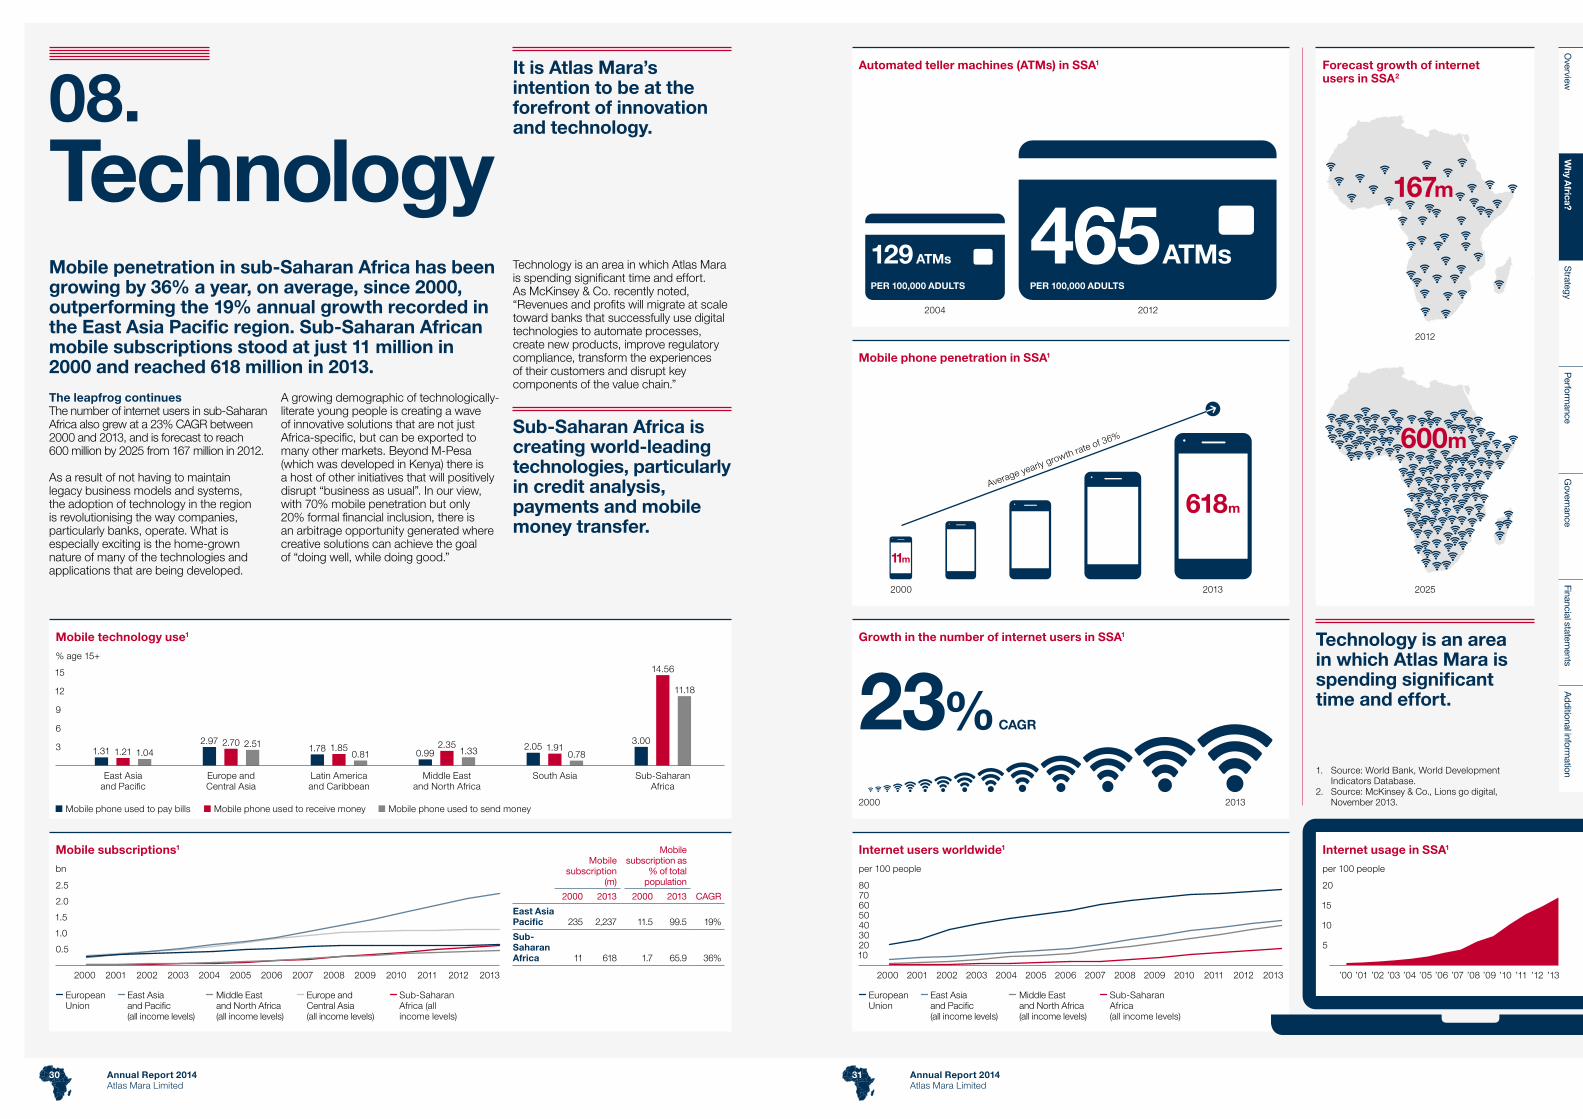
08.Technology
Technology is an area in which Atlas Mara is spending significant time and effort.
It is Atlas Mara’s intention to be at the forefront of innovation and technology.
Sub-Saharan Africa is creating world-leading technologies, particularly in credit analysis, payments and mobile money transfer.
1. Source: World Bank, World Development Indicators Database.
2. Source: McKinsey & Co., Lions go digital, November 2013. 2000
2012
11m
618m
465 ATMsPER 100,000 ADULTS
129 ATMs
PER 100,000 ADULTS
20252013
2012
Average yearly growth rate of 36%
2000
2004
2013
Mobile penetration in sub-Saharan Africa has been growing by 36% a year, on average, since 2000, outperforming the 19% annual growth recorded in the East Asia Pacific region. Sub-Saharan African mobile subscriptions stood at just 11 million in 2000 and reached 618 million in 2013.
The leapfrog continuesThe number of internet users in sub-Saharan Africa also grew at a 23% CAGR between 2000 and 2013, and is forecast to reach 600 million by 2025 from 167 million in 2012.
As a result of not having to maintain legacy business models and systems, the adoption of technology in the region is revolutionising the way companies, particularly banks, operate. What is especially exciting is the home-grown nature of many of the technologies and applications that are being developed.
A growing demographic of technologically-literate young people is creating a wave of innovative solutions that are not just Africa-specific, but can be exported to many other markets. Beyond M-Pesa (which was developed in Kenya) there is a host of other initiatives that will positively disrupt “business as usual”. In our view, with 70% mobile penetration but only 20% formal financial inclusion, there is an arbitrage opportunity generated where creative solutions can achieve the goal of “doing well, while doing good.”
Technology is an area in which Atlas Mara is spending significant time and effort. As McKinsey & Co. recently noted, “Revenues and profits will migrate at scale toward banks that successfully use digital technologies to automate processes, create new products, improve regulatory compliance, transform the experiences of their customers and disrupt key components of the value chain.”
Mobile subscription
(m)
Mobile subscription as
% of total population
CAGR2000 2013 2000 2013
East Asia Pacific 235 2,237 11.5 99.5 19%
Sub-Saharan Africa 11 618 1.7 65.9 36%
Mobile technology use1 Growth in the number of internet users in SSA1
23% CAGR
Mobile phone penetration in SSA1
Automated teller machines (ATMs) in SSA1 Forecast growth of internet users in SSA2
Mobile subscriptions1 Internet users worldwide1 Internet usage in SSA1
Annual Report 2014Atlas Mara Limited
Annual Report 2014Atlas Mara Limited
30 31
Overview
Why A
frica?S
trategyP
erformance
Governance
Financial statements
Additional inform
ation

2011 2012 2013 2014 2015 2016 2017 2018 2019 2020
%
100
200
300
400
15
30
45
60
140
380340
304272243218195174156
% bankedBanked populationSource: Finscope; EFinA; World Bank Findex; US Census Bureau International Program
m
Zambia MauritiusSouth AfricaBotswanaNigeriaKenyaGhanaMozambique
%
510152025
2520 18
15 14 12
7 6
SSA excl. SA 16% SSA incl. SA 13%Source: Annual �nancial statements, Morgan Stanley, BankScope
09.The Atlas Mara opportunitySub-Saharan Africa’s financial sectors present tremendous opportunities. The combination of strong projected GDP growth and low rates of financial inclusion (the African Development Bank estimates that SSA has the lowest deposit institution in the world, standing at 16.6%, on average) underpin projections of robust, sustainable growth in banking revenues, which is highlighted by the charts below.
Additionally, the snapshot of the current countries of operation of Atlas Mara illustrating the recent GDP growth, loan-to-deposit ratios, net interest margins and returns on equity recorded in these countries are likely to be the envy of any
mature-market-based banker. However, despite these statistics, it is interesting to note that sub-Saharan African banks’ average cost to income ratios rank among the highest in the world – which represents a substantial opportunity.
Despite these fundamentals, sub-Saharan Africa is not being inundated with expansionary capital from well-established, multi-national financial institutions. On the contrary, we are seeing the reverse. Lacklustre growth in many mature markets is requiring an enhanced focus on domestic operations. The constraints associated with the implementation of Basel III and rapidly increasing costs of regulatory compliance
Forecast formally banked population in SSA
are leading to a retrenchment by, particularly, European players.
Given the information provided above, we hope you can appreciate why we believe so firmly in sub-Saharan Africa’s promise. There are fundamental drivers of growth that are practically impossible to reverse. The macroeconomic prospects remain robust, despite challenges in selected markets.
There is an opportunity to deploy existing and emerging technologies and to effect positive change on the continent by accelerating the pace of financial inclusion.
At a time when many international financial institutions are retreating from sub-Saharan Africa, Atlas Mara is investing. We are investing in attractive markets. We are investing to create market leaders. And we are investing in talent.
We believe that as economies grow, trade expands, and a vibrant middle class emerges, an innovation-driven, customer-focused, well-managed and well-governed, multi-country financial institution like Atlas Mara will be able to reward its shareholders with attractive returns while contributing meaningfully to the communities in which it operates.
The Atlas Mara team has accomplished a tremendous amount during the past 16 months. We have no doubt that 2015 will be equally eventful as we continue to build sub-Saharan Africa’s premier financial services group.
Thank you for joining us on this journey.
34 Chairman’s letter38 Chief Executive Officer’s letter40 Business model42 Strategy and key performance indicators46 Relationships and responsibilities50 Principal risks
Strategy
Population (m)1
GDP ($bn)
GDP growth (%)
Household expenditure
($)
Loan to GDP ratio
(%)2
Total banking assets ($bn)3
Loan to deposit
(%)3
Return on equity
(%)4
Net interest margin
(%)3
Botswana 2.0 14.8 5.8 3,988 32.7 7.3 81.4 30.4 7.2
Mozambique 25.8 15.6 7.4 309.7 33.8 8.9 82.6 19.8 6.2
Nigeria 173.6 521.8 5.4 698.7 13.8 154.6 82.4 17.6 7.8
Rwanda 11.8 7.5 4.7 316.5 n/a n/a n/a 18.8 10.4
Tanzania 49.3 33.2 7.0 312.0 20.2 13.5 77.3 19.5 8.9
Zambia 14.5 26.8 6.7 n/a 13.7 7.5 74.4 21.1 8.9
Zimbabwe 14.2 13.5 4.5 634.6 27.5 6.0 78.3 21.1 8.9
1. Source: World Bank, World Development Indicators Database.2. Source: BMI Research, http://store.businessmonitor.com/africa.3. Source: Ibid.4. Source: Bankscope, Bureau van Dijk Electronic Publishing GmbH, 2013 data.
Macro review of current Atlas Mara countries
SSA banking revenue CAGR (%) 2013A-2016E(selected countries)
Overview
Why A
frica?S
trategy
Perform
anceG
overnanceFinancial statem
entsA
dditional information
Annual Report 2014Atlas Mara Limited
32 33 Annual Report 2014Atlas Mara Limited
![Second Health and Population Project (Loan 1189-SRI[SF])](https://cdn.vdocuments.us/doc/165x107/577ce6d91a28abf10393be48/second-health-and-population-project-loan-1189-srisf.jpg)


