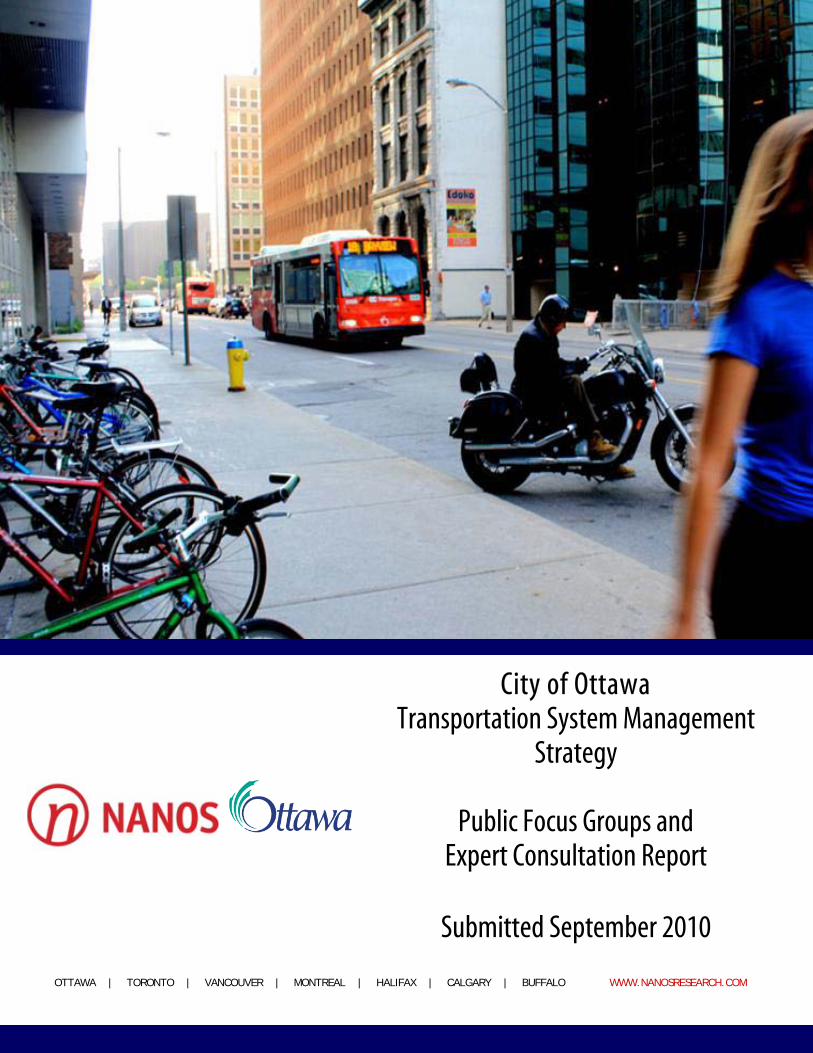
OTTAWA | TORONTO | VANCOUVER | MONTREAL | HALIFAX | CALGARY | BUFFALO WWW.NANOSRESEARCH.COM
City of Ottawa Transportation System Management
Strategy
Public Focus Groups and Expert Consultation Report
Submitted September 2010

Table of Contents
Background ............................................................................................................................................................ 3
Project Methodology ............................................................................................................................................... 4
Key Findings ........................................................................................................................................................... 6
The Travel Diaries ....................................................................................................................................................................................... 7
The Focus Groups ....................................................................................................................................................................................... 9
Trends and Forces that will Shape our Transportation Future .............................................................................................................. 10
DETAILED TRAVEL DIARY ANALYSIS ........................................................................................................................................ 12
Travel Diary Methodology .................................................................................................................................................. 13
Summary ............................................................................................................................................................................ 14
Trip Satisfaction .................................................................................................................................................................. 16
Average Trip Distance ......................................................................................................................................................... 18
Purpose of Trips .................................................................................................................................................................. 19
Factors for Choosing Mode ................................................................................................................................................. 20
Information Sources Consulted .......................................................................................................................................... 21
Challenges Encountered ..................................................................................................................................................... 26
Information to Improve Trip Experience ............................................................................................................................ 28
DETAILED FOCUS GROUP REPORT ........................................................................................................................................... 30
Focus Group Methodology ................................................................................................................................................. 31
Participant Transportation Profiles .................................................................................................................................... 32
Summary ............................................................................................................................................................................ 33
Travel Diary Component ..................................................................................................................................................... 35
Views on Getting Around the City of Ottawa ..................................................................................................................... 37
Impression of Modes and Travel Information Sources ....................................................................................................... 38
Perception of Getting Around Ottawa vs. Ideal City – Word Clouds .................................................................................. 40
The Travel Experience ......................................................................................................................................................... 41
The Purpose of the Travel Experience Section ........................................................................................................................................ 41
How Age Impacted Views on Improving Travel Experience ................................................................................................................. 41
Key Challenges for Pedestrians in Ottawa .......................................................................................................................... 42
Proposed Solutions to Walking Challenges ............................................................................................................................................ 42
Key Challenges for Cyclists in Ottawa ................................................................................................................................. 44
Proposed Solutions to Cycling Challenges .............................................................................................................................................. 44
Key Challenges for Transit Users in Ottawa ........................................................................................................................ 46
Nanos Research City of Ottawa Transportation System ManagementStrategy September 2010 (613) 234-4666 Public Focus Groups and Expert Consultation Report Page 2
Proposed Solutions to Transit Challenges .............................................................................................................................................. 46
Key Challenges for Drivers in Ottawa ................................................................................................................................. 48
Proposed Solutions to Driving Challenges .............................................................................................................................................. 48
Proposed Solutions to Challenges for More than One Mode .............................................................................................. 50
Global Leaders in Providing Information to Travelers ........................................................................................................ 51
Website Testing .................................................................................................................................................................. 52
Encouraging More Sustainable Modes of Transportation .................................................................................................. 55
DETAILED THOUGHT-LEADER OUTREACH REPORT ................................................................................................................... 56
Thought-Leader Outreach Methodology ............................................................................................................................ 57
Summary ............................................................................................................................................................................ 58
Information Needs of the Traveling Public ......................................................................................................................... 60
Technological Advances in Transportation ......................................................................................................................... 61
Changing Needs of the Traveling Public ............................................................................................................................. 62
Urban Challenges for Transportation ................................................................................................................................. 64
What Other Cities Do Well .................................................................................................................................................. 65
Appendix A – Travel Diary Tabulations
Appendix B – Thought-Leader Bios

Nanos Research City of Ottawa Transportation System ManagementStrategy September 2010 (613) 234-4666 Public Focus Groups and Expert Consultation Report Page 3
Background
Like many things in life, the journey is as important as the destination.
Our transportation system is a central part of the day-to-day journey of Ottawa residents and plays a critical role in our quality
of life, personal productivity and economic prosperity.
Although the City of Ottawa is already considered a leading North American jurisdiction in terms of transportation system
management, it is preparing to plan for an even stronger future. In order to best plan and anticipate future long-term needs,
two broad information perspectives were identified as positive contributors to the strategic planning process. The first
perspective included placing Ottawa residents at the centre of the transportation experience and understanding their views,
concerns and expectations in terms of our transportation system and their personal journey. Second, in order to identify trends,
opportunities and expected challenges, the perspectives of key Canadian and International thought-leaders in transportation
and technology were sought. Together these two perspectives marry the practical needs special to Ottawa and an
understanding of the possible future transportation journey.
As part of a broader planning process for the City’s Transportation System Management Strategy, the City of Ottawa retained
Nanos Research to collect input from Ottawa residents and key thought-leaders.
The goals of the project were twofold:
• to capture the “Ottawa Transportation Experience”; and,
• to better understand transportation needs in the long term.
Included in this report is a series of stand-alone documents which detail the respective findings of the building blocks of the
engagement including: a detailed analysis of the findings of the thought-leader research; an examination of the travel diaries;
and, a report on the focus group research.
Nanos Research City of Ottawa Transportation System ManagementStrategy September 2010 (613) 234-4666 Public Focus Groups and Expert Consultation Report Page 4
Project Methodology
A three-phased research methodology was developed. Phase 1 included conducting a series of interviews among
transportation and technology experts. The list of experts was created jointly between Nanos and the City of Ottawa. Phase 2
included recruiting residents from a diversity of transportation profiles (drivers, cyclists, public transit users and pedestrians)
and having residents complete travel diaries. Phase 3 involved bringing the recruited residents who completed the travel
diaries into a focus group setting to further explore their views on transportation system in the City of Ottawa.
Phase 1 – Thought-leader Outreach
Comprised of in-depth interviews (mostly by telephone) from transportation and technology thought leaders a consistent
series of prompts were developed for the interviews which took anywhere from between 30 to 60 minutes. The interviews
included two Nanos Analysts (one to conduct the interview and the other to take notes) as well as a representative from the
City of Ottawa’s project team. The Thought-leader Outreach engaged the following individuals:
• Dr. Baher Abdulhai, Canada Research Chair in Information and Technology Services and Director, ITS Centre,
University of Toronto (Toronto, Canada);
• Eran Gartner, President of Systems Division, Bombardier Transportation (Berlin, Germany);
• Keenan Kitasaka, Manager, Intelligent Transportation Systems, Translink (Vancouver, Canada);
• David Lively, Chief, Office of System Management Planning, CalTrans (Sacramento, USA);
• Ralph Menzano, Executive Director, Transportation Division, Oracle (Philadelphia, USA);
• Dr. Eric J. Miller, Director, Cities Centre and Professor, University of Toronto (Toronto, Canada);
• Ben Plowden, Director, Better Routes and Places, Transport for London (London, UK); and,
• Nancy Schepers, Deputy City Manager, Infrastructure Services and Community Sustainability, City of Ottawa (Ottawa, Canada).
Phases 2 and 3 – Travel Diaries and Focus Groups
Sixty-four (64) Ottawa residents were randomly recruited to complete travel diaries and to participate in focus group
discussions. An additional 18 individuals completed the travel diaries. A total of 744 trips were logged by participants in the
study.
The four transportation mode profiles created by Nanos were: drivers, cyclists, pedestrians and public transit users. Two groups
were conducted with each profile (eight groups in total) with one group being primarily comprised of Baby Boomers and the
other group comprised of Gen X and Gen Y-ers. The purpose of the generational component was to understand possible

Nanos Research City of Ottawa Transportation System ManagementStrategy September 2010 (613) 234-4666 Public Focus Groups and Expert Consultation Report Page 5
generational differences in the views of participants. The groups included a mix of men and women and Anglophones and
Francophones. An analysis of the travel diaries and the discussions was completed by Nanos Research.
The diary and focus group responses are reflective of the travel experience of participants during the summer. Readers should
note that the volume of traffic associated with this seasonal time period is typically lower than in other seasons and therefore,
responses may not represent the difficulties associated with travel in each of the modal choices or reflect the general network
and road conditions of other seasons.
Readers should note that the diary and focus group exercise should not be considered projectable to the Ottawa populace
because of the size of the samples and the nature of qualitative research. The objective was to understand broad perceptions
within transportation profile groups.

Nanos Research City of Ottawa Transportation System ManagementStrategy September 2010 (613) 234-4666 Public Focus Groups and Expert Consultation Report Page 6
Key Findings
The research and outreach conducted by Nanos suggests that the City of Ottawa is in a strong position in terms of preparation
for the future transportation needs of the city and that the situation should be considered more one of evolution than
revolution. The challenges relate to elevating the traveler experience to an even higher level and encouraging shifts in behavior
that are financially and environmentally sustainable in the long run.
Challenges identified by residents were primarily related to construction and detours with congestion being a secondary factor
that negatively influenced the travel experience. This suggested that the system in itself was perceived to work well but that it
could be stronger in terms of managing information related to construction and detours. This should be considered a top
immediate priority in terms of travel information for the City of Ottawa. With a car-centric system, it will be important to
ensure that accessible and real-time travel information includes travel mode alternatives such as public transit, cycling and
walking.
Transportation system travel information will be a critical element to the future travel experience in the city with very high
expectations from residents in terms of the availability of real-time access to travel information for automobiles, public transit,
cyclists and pedestrians. Residents used multiple modes to get around the city, and the integration of travel information for
wayfinding was seen as key to attaining an even higher level of satisfaction with their travel experience. There will be an
expectation that in the longer term, the City’s travel information strategy will include a combination of push
(applications/email) and pull (website) technology to get timely information in the hands of residents. This could include
enhanced trip planning, RSS and SMS feeds, Smartphone applications and an enhanced travel information portal. During the
focus groups, it was clear that the current travel information on the City of Ottawa website was seen as a positive step forward
but that there was little awareness because of its positioning on the City portal. A key immediate action for consideration by
the City should be to better market the current information and to provide it in an easily accessible, higher profile position on
the City of Ottawa website. Also of note, information integration should also include the availability of parking as the end point
in the travel experience.
The research also suggested that there were expectations that the modal split will evolve over time as a result of the economic
pressures (the price of gasoline) and infrastructure pressures (the capacity of the current system to work well). Residents
expect that, in the long run, cars will continue to be a major mode but that the dominance will diminish in favour of public
transit, cycling and walking.
To follow are the key findings of the travel diaries, the focus groups and the thought-leader outreach. The travel diaries provide
a snapshot of the Ottawa traveler today. The focus groups of residents provide an understanding of the needs and expectations
of Ottawa travelers into the future as well as opportunities for the City of Ottawa to consider. The thought-leader outreach
identifies key forces that will likely shape the future of our transportation system.
Nanos Research City of Ottawa Transportation System ManagementStrategy September 2010 (613) 234-4666 Public Focus Groups and Expert Consultation Report Page 7
The Travel Diaries
An analysis of the travel diaries provides a glimpse into the current journey through Ottawa’s transportation system. The travel
diary data suggests that residents were generally satisfied with their trips in terms of the experience, and that automobiles
yielded a time advantage for the distance travelled. This should not be surprising considering the fact that much of the urban
development in Ottawa, like many North American cities, is geared toward the automobile. Automobile travelers cited
convenience, time and the ability to transport goods as key advantages, while those who used public transit cited necessity and
convenience.
Regardless of the transportation mode, convenience was an important factor that led to the choice of a particular mode. For
the minority of trips that did encounter a challenge or travel issue, construction and detours were cited as the most frequent
problem among those travelling by automobile, bicycle or walking. For those travelling by public transit, making bus transfers
and insufficient travel information were more likely to be cited as problems. Congestion was more likely to be a negative factor
for those travelling by automobile (but still noticeably less of a problem than construction/detours).
Overall, the key takeaway from the travel diaries on the current experience is that residents are generally satisfied and that
construction/detours, not congestion, is the most common challenge that would have an impact on one’s travel experience in
Ottawa. This suggests that the transportation system was considered to be working well but that issues related to how it
manages construction/detours currently have a negative impact on the travel experience, more so than general congestion.
With a utilitarian traveler driven by convenience, any barriers to that convenience will have a significant negative impact on the
travel experience. Of note, focus on the travel information management available to the public related to construction and
detours will help those that travel by automobile, cyclists and walkers and could help positively drive the travel experience to
an even higher level.
In terms of what residents expected from the system, it centres on sharing more travel information to make better informed
travel decisions within the City of Ottawa.
Travel Diaries at a Glance
• Residents Generally Satisfied – The 82 individuals who completed travel diaries for 744 trips were generally
satisfied with the experience of their trip (rating of 4.14 on a 5-point scale where 1 was a very poor experience and 5
was a very good experience). Cyclists were comparatively more satisfied with their trip experiences (4.35 out of 5)
while public transit users and those using assistive mobility devices were comparatively less satisfied with their trip
experiences (3.85 and 3.57, respectively). Automobile drivers (4.18), pedestrians (4.16) and automobile passengers
were generally satisfied (4.08) with their trip experiences.

Nanos Research City of Ottawa Transportation System ManagementStrategy September 2010 (613) 234-4666 Public Focus Groups and Expert Consultation Report Page 8
• Distance and Time – Not surprisingly those who walked travelled the shortest distances (2.7 kilometers on average)
while those that were automobile passengers travelled the furthest distance (16.0 kilometers on average).
Participants who primarily drove travelled 14.2 kilometers on average while those using public transit said they
travelled, on average, 11.8 kilometers. Cyclists indicated they travelled 6.2 kilometers on average. Of note, trips as
driver of an automobile, although they did not register the shortest distance, registered the shortest travel time
(automobile trip 18.8 minutes on average compared to 20.3 for a bicycle trip, 20.8 for a walking trip and 33.4 for a
public transit trip).
• The Utilitarian Traveler – With convenience as an important determinant in terms of mode choice for automobile
drivers (27%), those taking public transit (27%), pedestrians (23%) and cyclists (22%), ensuring that the journey has
the fewest unanticipated disruptions will be key to an optimal travel experience. With the exception of convenience,
cyclists and pedestrians also cited exercise/health as factors influencing their choice (23% and 14% respectively).
Also of note, those individuals in the study who travelled predominantly by public transit were more likely to cite
necessity (16%).
• Current Sources of Traveler Information – Weather reports were the most frequently consulted sources of
information across modes (automobile 31%, bicycle 72%, walking 62%), although public transit users and persons
using an assistive mobility device were comparatively more likely to check a public transit schedule (55% and 100%,
respectively). Of note, weather reports were more likely to be consulted when a trip was for a work related purpose
(55%) or leisure purpose (52%). Other frequently consulted sources of information were maps. Participants were also
comparatively more likely to check the internet for information over television, radio, smart phone applications, the
newspaper, GPS or other sources.
• Construction/Detours outpace Congestion as Challenges - Nineteen percent of the 744 trips logged in the diaries
encountered a challenge or a travel issue. The most common travel issue encountered related to construction or
detours (automobile 50%, bicycle 53%, pedestrians 39%). However, among public transit users only 3% cited
construction or detours as a travel issue. Public transit users were more likely to cite bus transfers (23%) and
perceived insufficient travel information (20%) as key challenges encountered during their trip.
For more detailed information on the findings of the travel diaries, please refer to Page 12 which has the full report for this
phase of the research.
Nanos Research City of Ottawa Transportation System ManagementStrategy September 2010 (613) 234-4666 Public Focus Groups and Expert Consultation Report Page 9
The Focus Groups
The focus groups provided a setting to discuss future priorities and possible solutions that could improve the travel experience.
All participants in the focus groups generally expected that by 2020 a shift to a more environmentally sustainable modal split
would occur with a decrease in the proportionate share of driving and an increase in public transit and other alternatives to the
car. There was an expectation that in the future the incidence of single traveler vehicles would decline.
Many of the challenges related to the different modes had to do with infrastructure. For cyclists and pedestrians, the
infrastructure challenges related to an original urban design geared to automobiles. For automobiles, challenges related to
construction events were frequently cited by participants, while transit challenges primarily related to capacity, wayfinding and
service. However, a series of solutions were identified by the research participants that could help shape the long-term
transportation system management strategy in terms of improving the transportation journey in Ottawa.
Opportunities to Enhance the Travel Journey
• Overcoming Distance and Enhancing Wayfinding for Pedestrians – Technology enabled travel information
through either a website or through a Smartphone was seen as an expected reality. A number of participants
already used Google Maps for walking directions and there was the belief that a travel information technology
platform could include not just wayfinding recommendations and distance estimation but also local shopping
along planned routes.
• Better Leveraging Pedestrian Infrastructure – Participants in the focus groups preferred to see detailed
online maps of paths and sidewalks for the City of Ottawa to allow for greater planning in terms of personal
pedestrian travel within the City.
• Ensuring Pedestrian Safety – This took a number of forms including increasing the number of crossing signals
and also improving lighting, along key paths, with ‘smart lights’ using motion sensors that would turn on when
a person was on a pedestrian path.
• Managing the Risks of Cycling – To help effectively manage the relationship between cars and cyclists sharing
the road, a number of solutions were proposed by participants, including having advanced lights for cyclists at
target intersections to avoid being cut off, through to using reflective paint or lane edge reflectors when laying
out bike lanes.
• Preparing for Mobile Technology for Cyclists – Participants expected mobile technology through
Smartphones to be developed which would link to a GPS and help guide cyclists through the cyclist path system
using audio prompts.
Nanos Research City of Ottawa Transportation System ManagementStrategy September 2010 (613) 234-4666 Public Focus Groups and Expert Consultation Report Page 10
• Enabling Perception of Greater Control in Public Transit through Travel Information – Enabling a greater
real-time understanding of the transit system would likely have a major psychological impact on the travel
journey for public transit users. Participants expected to be able to get real-time travel information either
online, at transit stations or on their mobile devices so as to best plan their travel and to optimize mode selected
and route. In terms of intermodal travel using bicycle and public transit, real time information on which buses
had bicycle racks would also improve the travel experience.
• Optimizing the Driving Experience through Real-time Travel Information – With the proliferation of on-
board GPS systems in automobiles, there was an expectation that real-time traffic information should be
integrated with route planning in order to overcome traffic congestion and construction. Likewise, the greater
use of electronic signage would be another means of managing the travel experience. Also of note, real-time
information on parking availability was seen as a very important part of the travel experience for motorists. As a
result, there was an expectation that route planning (with information on congestion and construction
integrated) would also include the real-time availability of parking at the end of the journey.
For more detailed information the findings of the focus group research, please refer to Page 30 which has the full report for this
phase of the research.
Trends and Forces that will Shape our Transportation Future
Many of the views shared by the diversity of thought-leaders as part of the outreach were echoed in the focus group section.
There was an expectation that real-time travel information for each mode of transportation would be the norm and that it
would likely, in the longer term, help facilitate multimodal trips and also diminish reliance on the automobile, although it
would still be a very important mode for urban transportation. The key forces driving change and innovation related to
technology (in terms of real-time travel information), economics (in terms of the expected increased cost to operate
automobiles and maintain roads), through to the environment (and the desire to have a transportation system as sustainable
as possible). The experts consulted identified a series of trends, and possible solutions.
• Facing the Economic Crunch – One key thread of input that emerged was the perceived long-term
unsustainability of the costs to operate automobiles on the same scale in terms of the cost of fuel and the cost to
maintain expensive automobile road infrastructure. Restrictions on single passenger automobile travelers and
automobile sharing (either through a co-operative or fractional ownership) were seen as likely trends in the
future which would emerge in response to diminished cost advantage of automobiles and diminished advantage
Nanos Research City of Ottawa Transportation System ManagementStrategy September 2010 (613) 234-4666 Public Focus Groups and Expert Consultation Report Page 11
in terms of future road capacity. The cost borne by municipal government to maintain a road system was also
identified as a key financial force that would put pressures on future governments and taxpayers.
• Influencing the Behaviour of Travelers – In practical terms, urban planning decisions have a significant
impact in encouraging modal transportation choices. By building more roads, one encourages transportation by
automobile. A number of the experts noted that once modal targets were set, practical public policy choices
should be made to encourage priority modes over other modes.
• Integration of Multiple Travel Systems through Smartcards – A number of the experts consulted cited
“smart” electronic ticketing as a key opportunity to integrate services and improve efficiency. Many of the
examples included multi-mode systems (i.e., bus, subway, and rail) where one could easily transfer and
minimize transfer time. Smartcards were also expected to eventually include loyalty programs for transit users
with customized fares based on usage patterns of the traveler.
• Real-time Travel Information and Commercialization Opportunities – Numerous examples emerged,
similar to those identified in the focus groups, that related to the use of real-time information and GPS
technology on the web, on a Smartphone or transportation hub to help improve control and the travel
experience. This also included the possible use of 5-1-1 hotline service that consolidates transportation
information, traffic and weather. Of note, there was an expectation of an increasing level of commercialization
of the real-time information in terms of integrating shopping, dining and lifestyle opportunities with the travel
information.
• Beware of Long-term Technology Solutions – Because of the rapidity of change in terms of Internet,
Smartphone and application development, opinions were expressed that time horizons for real-time travel
technology solutions should be shorter than usual (three to five years) in order to have agile travel information
systems. Likewise, the market was seen as a more nimble mechanism to staying on the cutting edge in terms of
travel information technology. Controlled partnerships with third party technology solution developers in the
private sector were seen as a means to lessen the burden on municipalities to create the perfect application for
their data.
For more in-depth information the findings of the thought-leader outreach, please refer to Page 56 which has the full report for
this phase of the research.

Nanos Research City of Ottawa Transportation System ManagementStrategy September 2010 (613) 234-4666 Public Focus Groups and Expert Consultation Report Page 12
DETAILED TRAVEL DIARY ANALYSIS
Nanos Research City of Ottawa Transportation System ManagementStrategy September 2010 (613) 234-4666 Public Focus Groups and Expert Consultation Report Page 13
Travel Diary Methodology
Prior to participating in the focus groups, individuals recruited for the groups were asked to complete travel diaries
documenting two days of traveling around the City of Ottawa. The goal of these diaries was to capture “a day in the life of one’s
transportation journey.”Participants were mailed a spiral-bound booklet that included several copies of the same travel diary
questionnaire, as well as detailed instructions on how to complete the two-day diary as well as examples of properly completed
diary entries. Participants were then asked to select two days (preferably one working day and one leisure day) and to fill out a
travel diary questionnaire after completing each trip. At the end of their chosen two days, participants were asked to log their
trip information online. Booklets were collected by Nanos Research analysts at focus group sessions. The online and paper logs
were checked and reconciled by Nanos analysts who followed up with participants to confirm details.
The diary results capture the travel experience of participants during the summer. Readers should note that the volume of
traffic associated with this seasonal time period is typically lower than in other seasons and therefore, responses may not
represent the difficulties associated with travel in each of the modal choices or reflect the general network and road conditions
of other seasons.
Readers should note that the findings of the diaries cannot be projected to the populace or to a group but do provide an
understanding of the potential context and nuance of opinion. Ten percent of data collection was validated as part of the firm’s
quality and data integrity procedures. This research project was completed in accordance with the standards of, and registered
with, the Marketing Research and Intelligence Association of which Nanos is a Corporate Gold Seal member.
Nanos Research City of Ottawa Transportation System ManagementStrategy September 2010 (613) 234-4666 Public Focus Groups and Expert Consultation Report Page 14
Summary
An analysis of the travel diaries provides a glimpse into the participants’ journeys through Ottawa’s transportation system. The
travel diary data suggests that residents were generally satisfied but that construction/detours, not congestion, is the most
common challenge that impacts the travel experience in Ottawa. This suggested that the transportation system is considered
to be working well but that issues related to how it manages construction/detours, currently have a negative impact on the
travel experience, more so than general congestion. With a utilitarian traveler driven by convenience, any barriers to that
convenience will have a significant negative impact on the travel experience. Of note, focus on the travel information
management available to the public related to construction and detours will help those that travel by automobile, cyclists and
walkers and could help positively drive the travel experience to an even higher level.
• Residents Generally Satisfied – The 82 individuals who completed travel diaries for 744 trips were generally
satisfied with the experience of their trip (rating of 4.14 on a 5-point scale where 1 was a very poor experience and 5
was a very good experience). Cyclists were comparatively more satisfied with their trip experiences (4.35 out of 5)
while public transit users and those using assistive mobility devices were comparatively less satisfied with their trip
experiences (3.85 and 3.57, respectively). Automobile drivers (4.18), pedestrians (4.16) and automobile passengers
were generally satisfied (4.08) with their trip experiences.
• Distance and Time – Not surprisingly those who walked travelled the shortest distances (2.7 kilometers on average)
while those that were automobile passengers travelled the furthest distance (16.0 kilometers on average).
Participants who primarily drove travelled 14.2 kilometers on average while those using public transit said they
travelled, on average, 11.8 kilometers. Cyclists indicated they travelled 6.2 kilometers on average. Of note, trips as
driver of an automobile, although they did not register the shortest distance, registered the shortest travel time
(automobile trip 18.8 minutes on average compared to 20.3 for a bicycle trip, 20.8 for a walking trip and 33.4 for a
public transit trip).
• The Utilitarian Traveler – With convenience as an important determinant in terms of mode choice for automobile
drivers (27%), those taking public transit (27%), pedestrians (23%) and cyclists (22%), ensuring that the journey has
the fewest unanticipated disruptions will be key to an optimal travel experience. With the exception of convenience,
cyclists and pedestrians also cited exercise/health as factors influencing their choice (23% and 14% respectively).
Also of note, those individuals in the study who travelled predominantly by public transit were more likely to cite
necessity (16%).
• Current Sources of Traveler Information – Weather reports were the most frequently consulted sources of
information across modes (automobile 31%, bicycle 72%, walking 62%), although public transit users and persons
using an assistive mobility device were comparatively more likely to check a public transit schedule (55% and 100%,
Nanos Research City of Ottawa Transportation System ManagementStrategy September 2010 (613) 234-4666 Public Focus Groups and Expert Consultation Report Page 15
respectively). Of note, weather reports were more likely to be consulted when a trip was for a work related purpose
(55%) or leisure purpose (52%). Other frequently consulted sources of information were maps. Participants were also
comparatively more likely to check the internet for information over television, radio, smart phone applications, the
newspaper, GPS or other sources.
• Construction/Detours outpace Congestion as Challenges - Nineteen percent of the 744 trips logged in the diaries
encountered a challenge or a travel issue. The most common travel issue encountered related to construction or
detours (automobile 50%, bicycle 53%, pedestrians 39%). However, among public transit users only 3% cited
construction or detours as a travel issue. Public transit users were more likely to cite bus transfers (23%) and
perceived insufficient travel information (20%) as key challenges encountered during their trip.
For detailed tabulations on the findings of the travel diaries, please refer to Appendix A.
Nanos Research City of Ottawa Transportation System ManagementStrategy September 2010 (613) 234-4666 Public Focus Groups and Expert Consultation Report Page 16
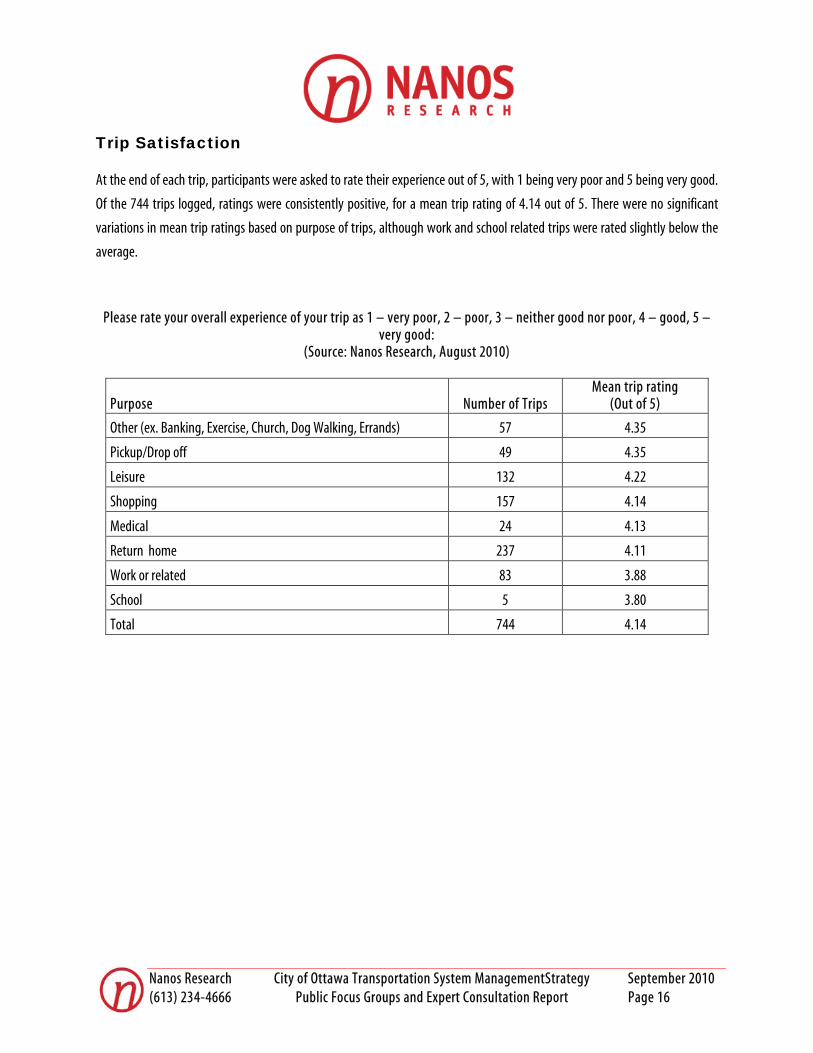
Trip Satisfaction
At the end of each trip, participants were asked to rate their experience out of 5, with 1 being very poor and 5 being very good.
Of the 744 trips logged, ratings were consistently positive, for a mean trip rating of 4.14 out of 5. There were no significant
variations in mean trip ratings based on purpose of trips, although work and school related trips were rated slightly below the
average.
Please rate your overall experience of your trip as 1 – very poor, 2 – poor, 3 – neither good nor poor, 4 – good, 5 – very good:
(Source: Nanos Research, August 2010)
Purpose Number of Trips Mean trip rating
(Out of 5)
Other (ex. Banking, Exercise, Church, Dog Walking, Errands) 57 4.35
Pickup/Drop off 49 4.35
Leisure 132 4.22
Shopping 157 4.14
Medical 24 4.13
Return home 237 4.11
Work or related 83 3.88
School 5 3.80
Total 744 4.14
Nanos Research City of Ottawa Transportation System ManagementStrategy September 2010 (613) 234-4666 Public Focus Groups and Expert Consultation Report Page 17
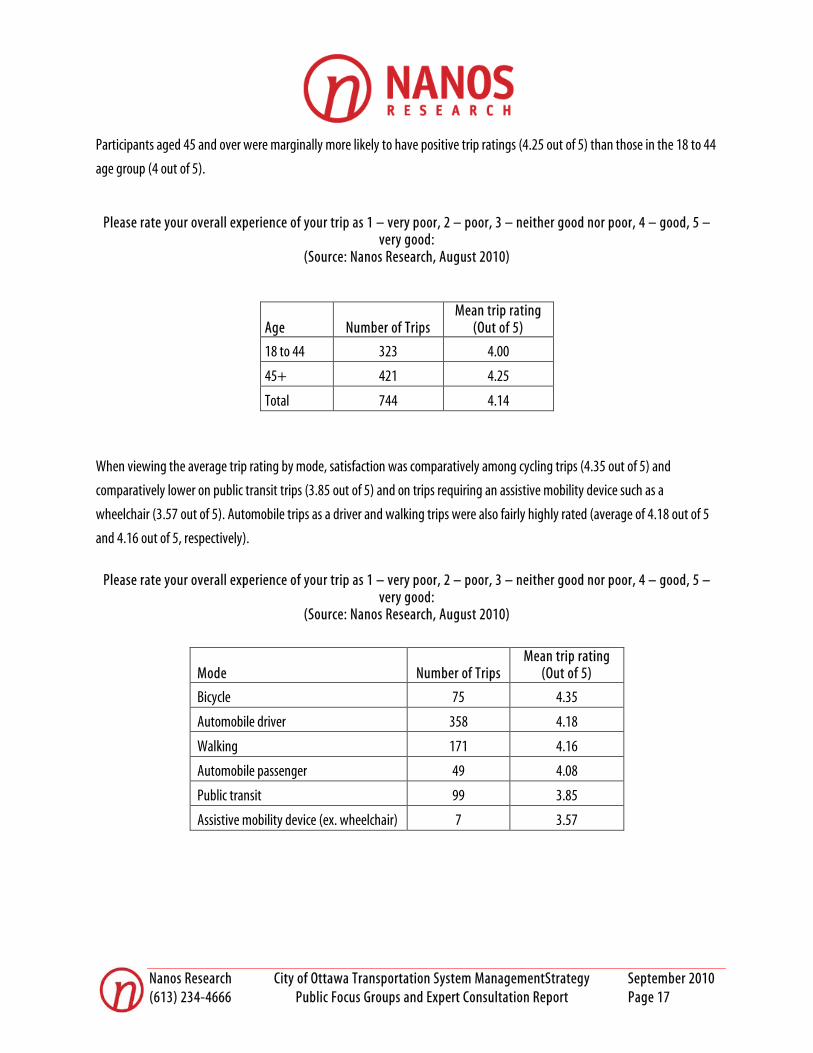
Participants aged 45 and over were marginally more likely to have positive trip ratings (4.25 out of 5) than those in the 18 to 44
age group (4 out of 5).
Please rate your overall experience of your trip as 1 – very poor, 2 – poor, 3 – neither good nor poor, 4 – good, 5 – very good:
(Source: Nanos Research, August 2010)
Age Number of Trips Mean trip rating
(Out of 5)
18 to 44 323 4.00
45+ 421 4.25
Total 744 4.14
When viewing the average trip rating by mode, satisfaction was comparatively among cycling trips (4.35 out of 5) and
comparatively lower on public transit trips (3.85 out of 5) and on trips requiring an assistive mobility device such as a
wheelchair (3.57 out of 5). Automobile trips as a driver and walking trips were also fairly highly rated (average of 4.18 out of 5
and 4.16 out of 5, respectively).
Please rate your overall experience of your trip as 1 – very poor, 2 – poor, 3 – neither good nor poor, 4 – good, 5 –
very good: (Source: Nanos Research, August 2010)
Mode Number of Trips Mean trip rating
(Out of 5)
Bicycle 75 4.35
Automobile driver 358 4.18
Walking 171 4.16
Automobile passenger 49 4.08
Public transit 99 3.85
Assistive mobility device (ex. wheelchair) 7 3.57
Nanos Research City of Ottawa Transportation System ManagementStrategy September 2010 (613) 234-4666 Public Focus Groups and Expert Consultation Report Page 18
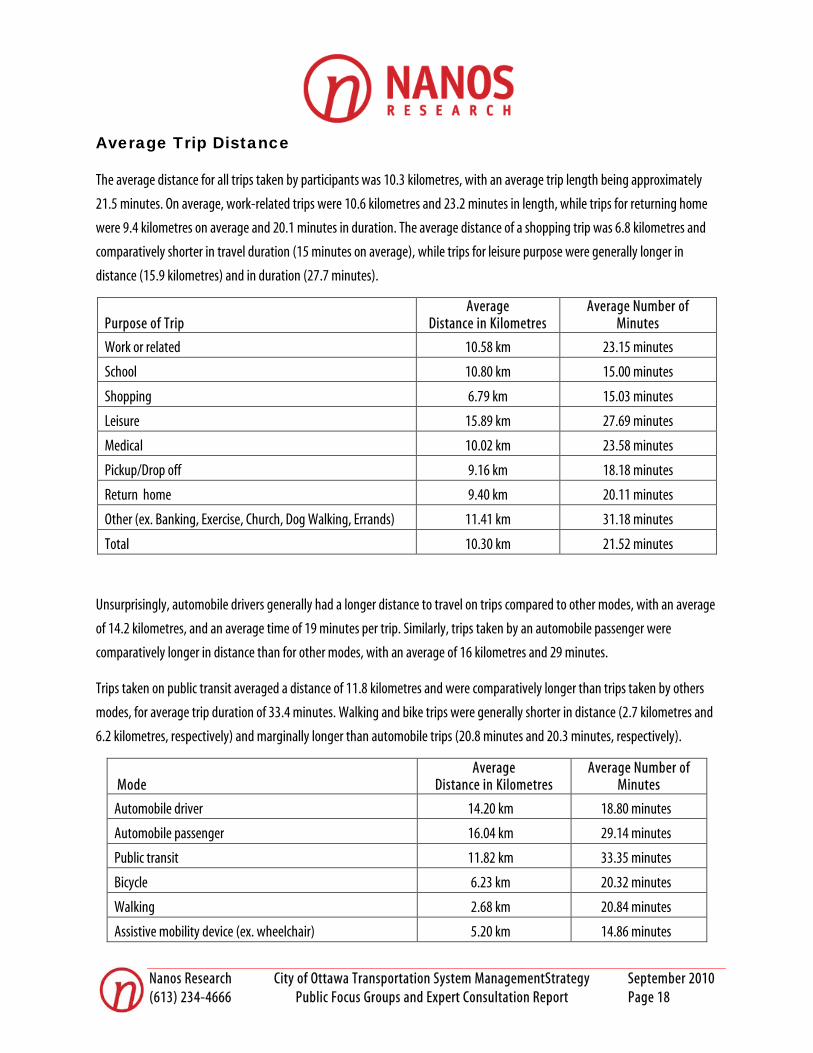
Average Trip Distance
The average distance for all trips taken by participants was 10.3 kilometres, with an average trip length being approximately
21.5 minutes. On average, work-related trips were 10.6 kilometres and 23.2 minutes in length, while trips for returning home
were 9.4 kilometres on average and 20.1 minutes in duration. The average distance of a shopping trip was 6.8 kilometres and
comparatively shorter in travel duration (15 minutes on average), while trips for leisure purpose were generally longer in
distance (15.9 kilometres) and in duration (27.7 minutes).
Purpose of Trip Average
Distance in Kilometres Average Number of
Minutes
Work or related 10.58 km 23.15 minutes
School 10.80 km 15.00 minutes
Shopping 6.79 km 15.03 minutes
Leisure 15.89 km 27.69 minutes
Medical 10.02 km 23.58 minutes
Pickup/Drop off 9.16 km 18.18 minutes
Return home 9.40 km 20.11 minutes
Other (ex. Banking, Exercise, Church, Dog Walking, Errands) 11.41 km 31.18 minutes
Total 10.30 km 21.52 minutes
Unsurprisingly, automobile drivers generally had a longer distance to travel on trips compared to other modes, with an average
of 14.2 kilometres, and an average time of 19 minutes per trip. Similarly, trips taken by an automobile passenger were
comparatively longer in distance than for other modes, with an average of 16 kilometres and 29 minutes.
Trips taken on public transit averaged a distance of 11.8 kilometres and were comparatively longer than trips taken by others
modes, for average trip duration of 33.4 minutes. Walking and bike trips were generally shorter in distance (2.7 kilometres and
6.2 kilometres, respectively) and marginally longer than automobile trips (20.8 minutes and 20.3 minutes, respectively).
Mode Average
Distance in Kilometres Average Number of
Minutes
Automobile driver 14.20 km 18.80 minutes
Automobile passenger 16.04 km 29.14 minutes
Public transit 11.82 km 33.35 minutes
Bicycle 6.23 km 20.32 minutes
Walking 2.68 km 20.84 minutes
Assistive mobility device (ex. wheelchair) 5.20 km 14.86 minutes
Nanos Research City of Ottawa Transportation System ManagementStrategy September 2010 (613) 234-4666 Public Focus Groups and Expert Consultation Report Page 19
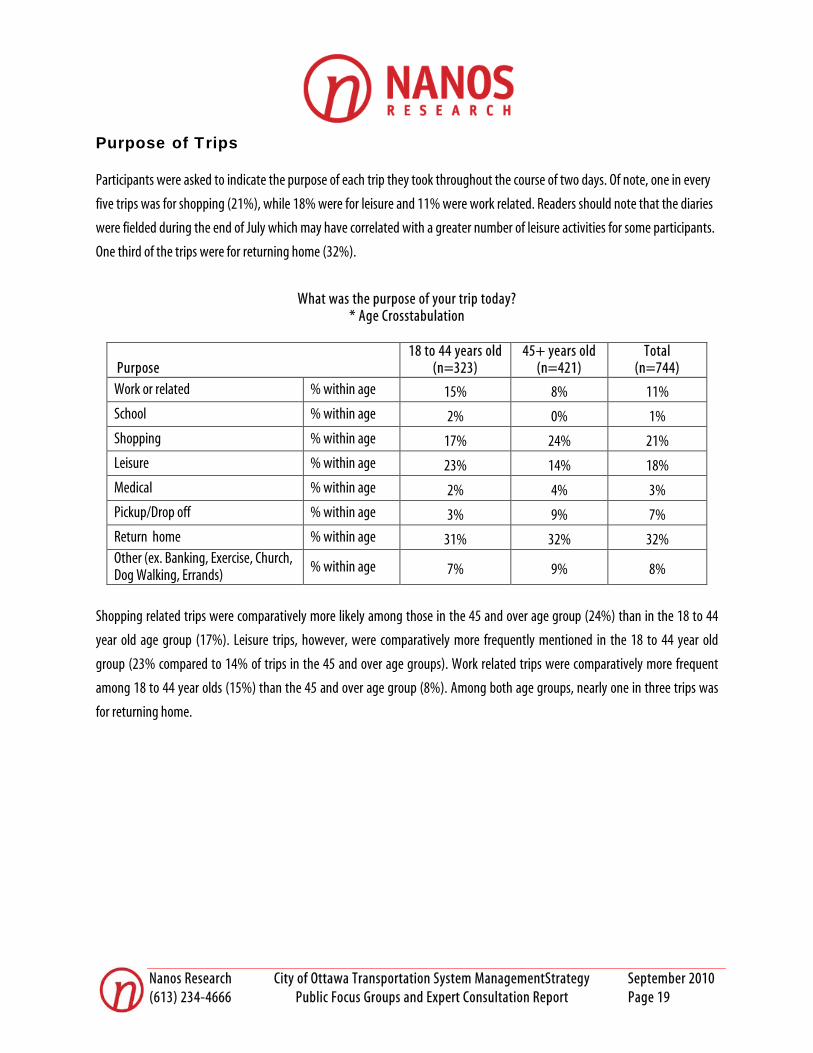
Purpose of Trips
Participants were asked to indicate the purpose of each trip they took throughout the course of two days. Of note, one in every
five trips was for shopping (21%), while 18% were for leisure and 11% were work related. Readers should note that the diaries
were fielded during the end of July which may have correlated with a greater number of leisure activities for some participants.
One third of the trips were for returning home (32%).
What was the purpose of your trip today?
* Age Crosstabulation
Purpose 18 to 44 years old
(n=323) 45+ years old
(n=421) Total
(n=744) Work or related % within age 15% 8% 11%
School % within age 2% 0% 1%
Shopping % within age 17% 24% 21%
Leisure % within age 23% 14% 18%
Medical % within age 2% 4% 3%
Pickup/Drop off % within age 3% 9% 7%
Return home % within age 31% 32% 32% Other (ex. Banking, Exercise, Church, Dog Walking, Errands) % within age 7% 9% 8%
Shopping related trips were comparatively more likely among those in the 45 and over age group (24%) than in the 18 to 44
year old age group (17%). Leisure trips, however, were comparatively more frequently mentioned in the 18 to 44 year old
group (23% compared to 14% of trips in the 45 and over age groups). Work related trips were comparatively more frequent
among 18 to 44 year olds (15%) than the 45 and over age group (8%). Among both age groups, nearly one in three trips was
for returning home.
Nanos Research City of Ottawa Transportation System ManagementStrategy September 2010 (613) 234-4666 Public Focus Groups and Expert Consultation Report Page 20
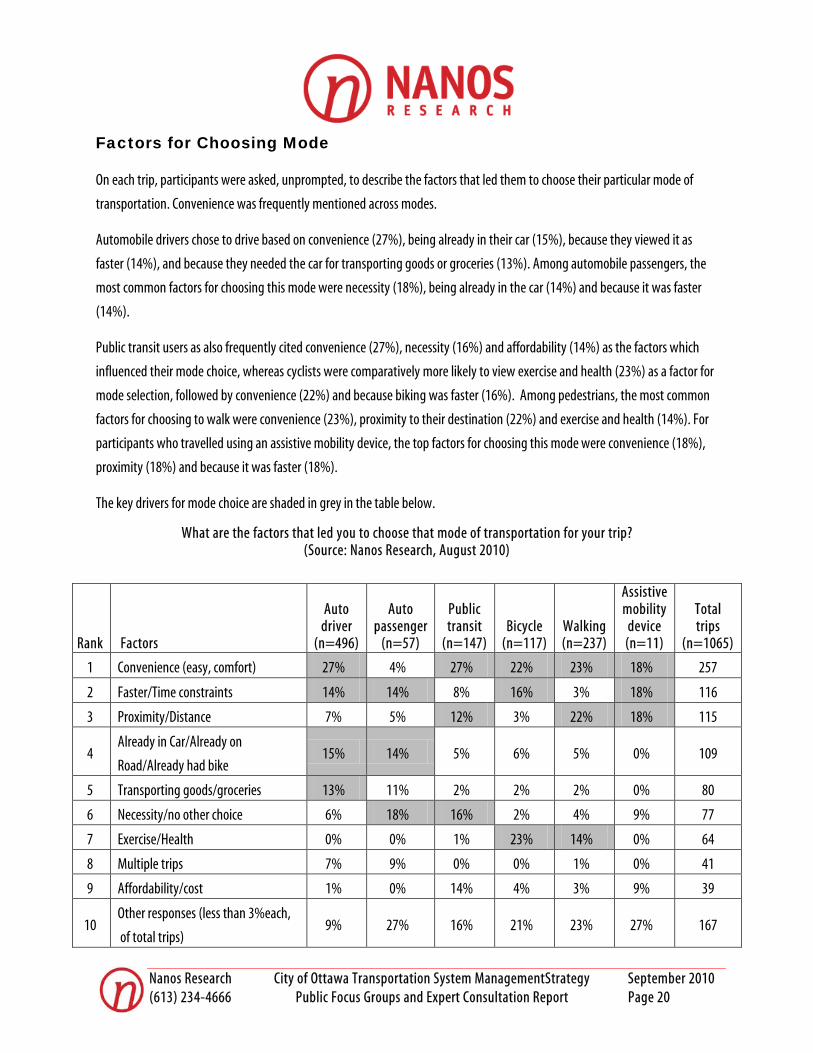
Factors for Choosing Mode
On each trip, participants were asked, unprompted, to describe the factors that led them to choose their particular mode of
transportation. Convenience was frequently mentioned across modes.
Automobile drivers chose to drive based on convenience (27%), being already in their car (15%), because they viewed it as
faster (14%), and because they needed the car for transporting goods or groceries (13%). Among automobile passengers, the
most common factors for choosing this mode were necessity (18%), being already in the car (14%) and because it was faster
(14%).
Public transit users as also frequently cited convenience (27%), necessity (16%) and affordability (14%) as the factors which
influenced their mode choice, whereas cyclists were comparatively more likely to view exercise and health (23%) as a factor for
mode selection, followed by convenience (22%) and because biking was faster (16%). Among pedestrians, the most common
factors for choosing to walk were convenience (23%), proximity to their destination (22%) and exercise and health (14%). For
participants who travelled using an assistive mobility device, the top factors for choosing this mode were convenience (18%),
proximity (18%) and because it was faster (18%).
The key drivers for mode choice are shaded in grey in the table below.
What are the factors that led you to choose that mode of transportation for your trip? (Source: Nanos Research, August 2010)
Rank Factors
Auto driver
(n=496)
Auto passenger
(n=57)
Public transit
(n=147) Bicycle
(n=117) Walking (n=237)
Assistive mobility
device (n=11)
Total trips
(n=1065)
1 Convenience (easy, comfort) 27% 4% 27% 22% 23% 18% 257
2 Faster/Time constraints 14% 14% 8% 16% 3% 18% 116
3 Proximity/Distance 7% 5% 12% 3% 22% 18% 115
4 Already in Car/Already on
Road/Already had bike 15% 14% 5% 6% 5% 0% 109
5 Transporting goods/groceries 13% 11% 2% 2% 2% 0% 80
6 Necessity/no other choice 6% 18% 16% 2% 4% 9% 77
7 Exercise/Health 0% 0% 1% 23% 14% 0% 64
8 Multiple trips 7% 9% 0% 0% 1% 0% 41
9 Affordability/cost 1% 0% 14% 4% 3% 9% 39
10 Other responses (less than 3%each,
of total trips) 9% 27% 16% 21% 23% 27% 167

Nanos Research City of Ottawa Transportation System ManagementStrategy September 2010 (613) 234-4666 Public Focus Groups and Expert Consultation Report Page 21
Information Sources Consulted
Participants were asked whether they consulted any information source to help prepare for their trip and were prompted on
various types of sources such as a map, weather report, transit schedule, traffic report/road conditions, or others. Participants
who answered “yes” were then asked to specify where they had gone to find this information.
Across modes, weather reports were consulted comparatively more often that other sources of information. For auto drivers
who consulted information sources, they most frequently consulted weather reports (31%), maps (30%) and traffic reports
(26%). For public transit users, over half consulted a transit schedule (55%), while 28% consulted the weather report. For
bicyclists, the weather report was consulted seven out of ten times (72%), followed by maps (14%). Similarly, pedestrians
primarily consulted a weather report (62%), followed by maps (16%) and transit schedules (14%).
Did you consult any of the following information sources to help you prepare for your trip? (Source: Nanos Research, August 2010)
Source
Auto driver
(n=78)
Auto passenger
(n=8)
Public transit (n=71)
Bicycle (n=29)
Walking (n=50)
Assistive mobility
device (n=1)
Total trips
(n=237)
Map % within mode 30% 38% 14% 14% 16% 0% 48
Weather report % within mode 31% 25% 28% 72% 62% 0% 98
Transit schedule % within mode 1% 0% 55% 7% 14% 100% 50
Traffic report % within mode 26% 13% 3% 3% 6% 0% 27
Other % within mode
13% 25% 0% 3% 2% 0% 14
Nanos Research City of Ottawa Transportation System ManagementStrategy September 2010 (613) 234-4666 Public Focus Groups and Expert Consultation Report Page 22
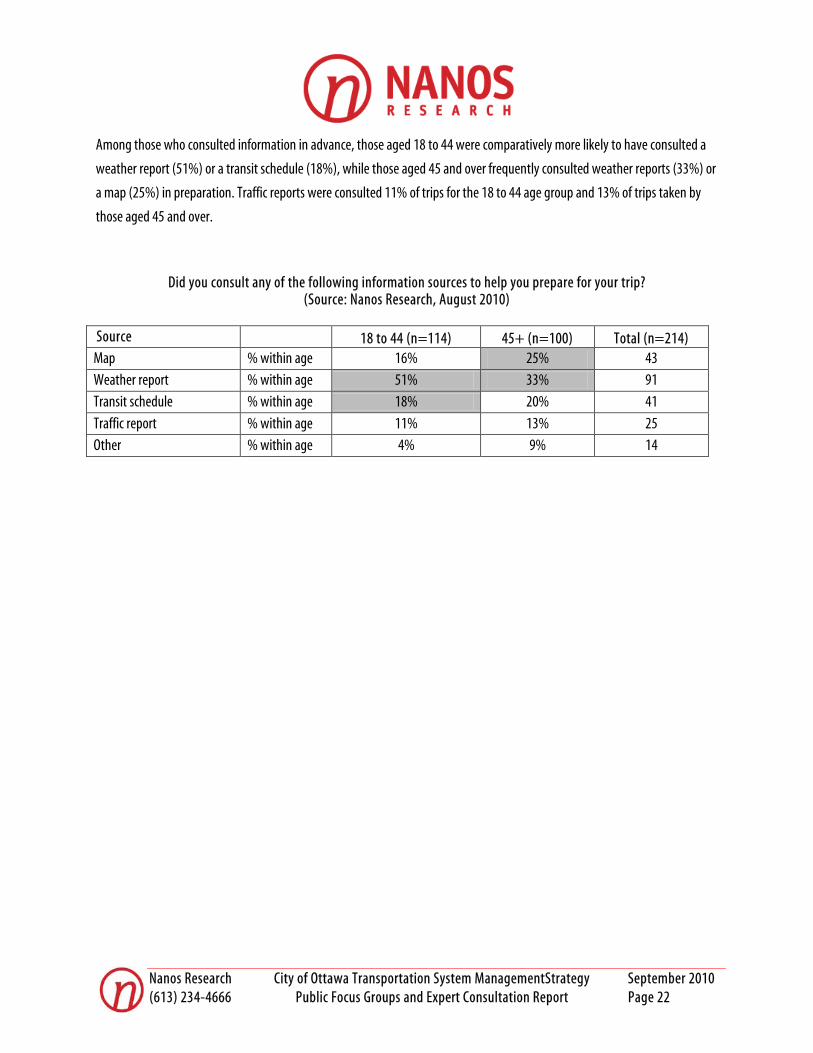
Among those who consulted information in advance, those aged 18 to 44 were comparatively more likely to have consulted a
weather report (51%) or a transit schedule (18%), while those aged 45 and over frequently consulted weather reports (33%) or
a map (25%) in preparation. Traffic reports were consulted 11% of trips for the 18 to 44 age group and 13% of trips taken by
those aged 45 and over.
Did you consult any of the following information sources to help you prepare for your trip? (Source: Nanos Research, August 2010)
Source 18 to 44 (n=114) 45+ (n=100) Total (n=214) Map % within age 16% 25% 43
Weather report % within age 51% 33% 91
Transit schedule % within age 18% 20% 41
Traffic report % within age 11% 13% 25
Other % within age 4% 9% 14
Nanos Research City of Ottawa Transportation System ManagementStrategy September 2010 (613) 234-4666 Public Focus Groups and Expert Consultation Report Page 23
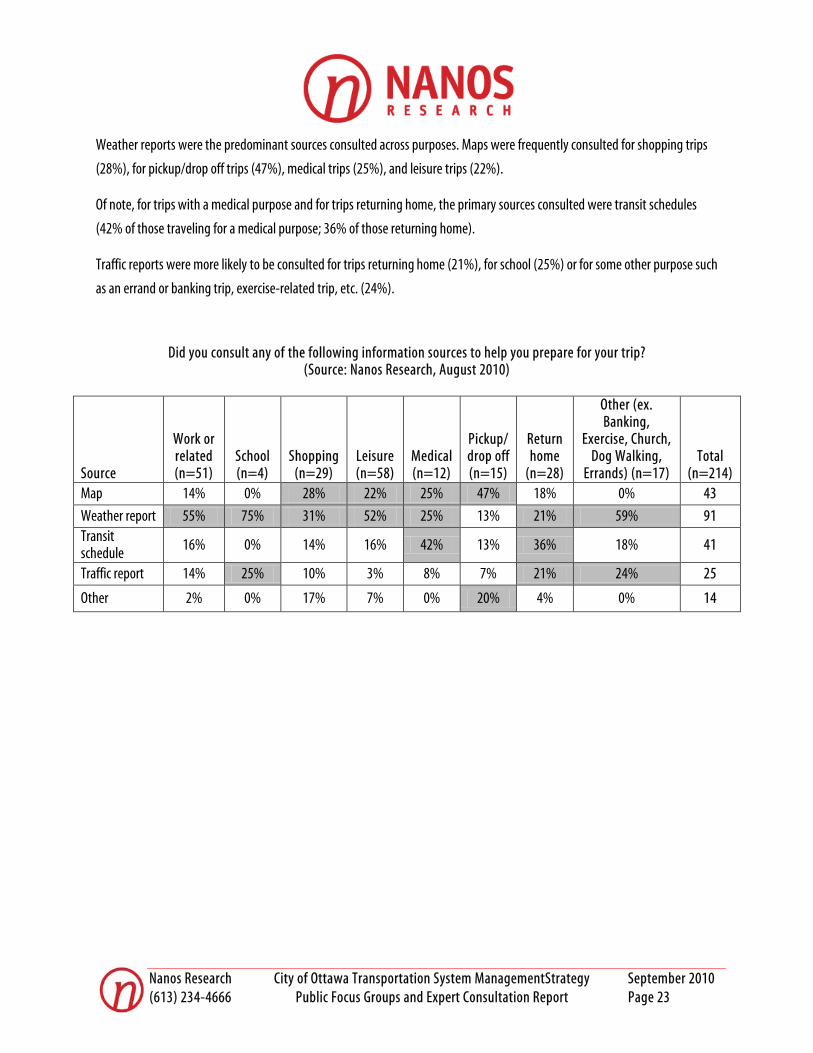
Weather reports were the predominant sources consulted across purposes. Maps were frequently consulted for shopping trips
(28%), for pickup/drop off trips (47%), medical trips (25%), and leisure trips (22%).
Of note, for trips with a medical purpose and for trips returning home, the primary sources consulted were transit schedules
(42% of those traveling for a medical purpose; 36% of those returning home).
Traffic reports were more likely to be consulted for trips returning home (21%), for school (25%) or for some other purpose such
as an errand or banking trip, exercise-related trip, etc. (24%).
Did you consult any of the following information sources to help you prepare for your trip? (Source: Nanos Research, August 2010)
Source
Work or related (n=51)
School (n=4)
Shopping (n=29)
Leisure (n=58)
Medical (n=12)
Pickup/ drop off (n=15)
Return home
(n=28)
Other (ex. Banking,
Exercise, Church, Dog Walking,
Errands) (n=17) Total
(n=214) Map 14% 0% 28% 22% 25% 47% 18% 0% 43
Weather report 55% 75% 31% 52% 25% 13% 21% 59% 91 Transit schedule 16% 0% 14% 16% 42% 13% 36% 18% 41
Traffic report 14% 25% 10% 3% 8% 7% 21% 24% 25
Other 2% 0% 17% 7% 0% 20% 4% 0% 14
Nanos Research City of Ottawa Transportation System ManagementStrategy September 2010 (613) 234-4666 Public Focus Groups and Expert Consultation Report Page 24
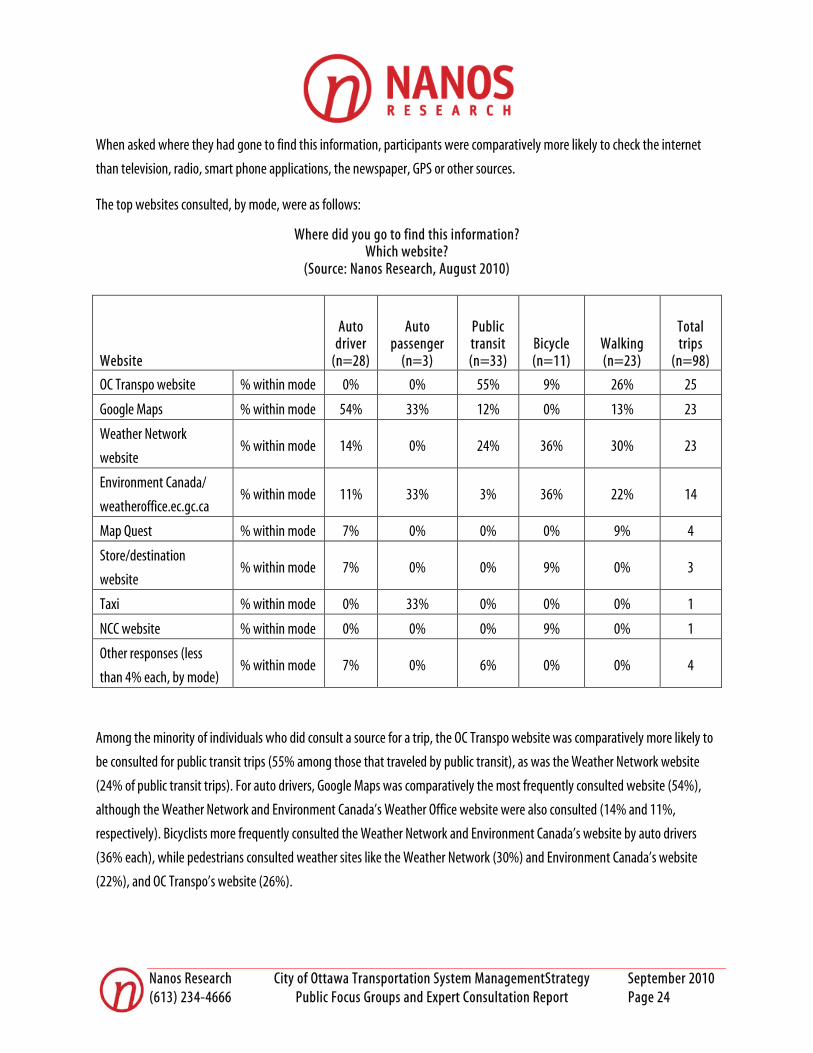
When asked where they had gone to find this information, participants were comparatively more likely to check the internet
than television, radio, smart phone applications, the newspaper, GPS or other sources.
The top websites consulted, by mode, were as follows:
Where did you go to find this information? Which website?
(Source: Nanos Research, August 2010)
Website
Auto driver
(n=28)
Auto passenger
(n=3)
Public transit (n=33)
Bicycle (n=11)
Walking (n=23)
Total trips
(n=98)
OC Transpo website % within mode 0% 0% 55% 9% 26% 25
Google Maps % within mode 54% 33% 12% 0% 13% 23
Weather Network
website % within mode 14% 0% 24% 36% 30% 23
Environment Canada/
weatheroffice.ec.gc.ca % within mode 11% 33% 3% 36% 22% 14
Map Quest % within mode 7% 0% 0% 0% 9% 4
Store/destination
website % within mode 7% 0% 0% 9% 0% 3
Taxi % within mode 0% 33% 0% 0% 0% 1
NCC website % within mode 0% 0% 0% 9% 0% 1
Other responses (less
than 4% each, by mode) % within mode 7% 0% 6% 0% 0% 4
Among the minority of individuals who did consult a source for a trip, the OC Transpo website was comparatively more likely to
be consulted for public transit trips (55% among those that traveled by public transit), as was the Weather Network website
(24% of public transit trips). For auto drivers, Google Maps was comparatively the most frequently consulted website (54%),
although the Weather Network and Environment Canada’s Weather Office website were also consulted (14% and 11%,
respectively). Bicyclists more frequently consulted the Weather Network and Environment Canada’s website by auto drivers
(36% each), while pedestrians consulted weather sites like the Weather Network (30%) and Environment Canada’s website
(22%), and OC Transpo’s website (26%).
Nanos Research City of Ottawa Transportation System ManagementStrategy September 2010 (613) 234-4666 Public Focus Groups and Expert Consultation Report Page 25
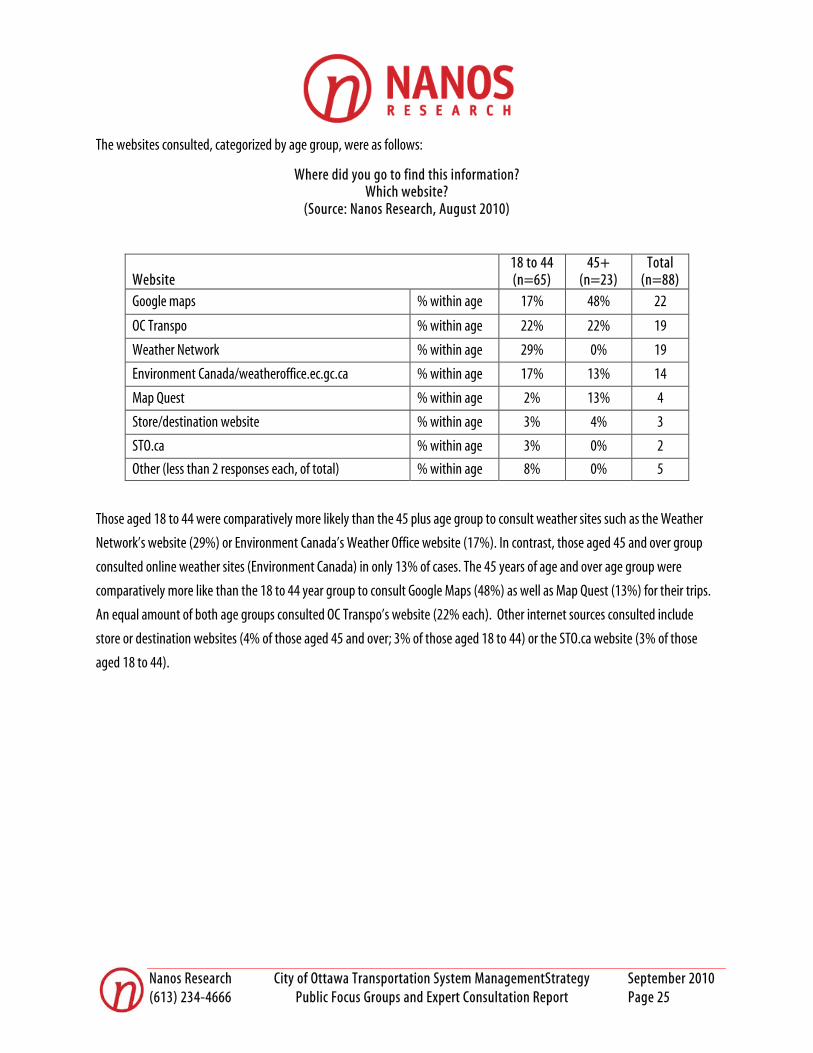
The websites consulted, categorized by age group, were as follows:
Where did you go to find this information? Which website?
(Source: Nanos Research, August 2010)
Website 18 to 44 (n=65)
45+ (n=23)
Total (n=88)
Google maps % within age 17% 48% 22
OC Transpo % within age 22% 22% 19
Weather Network % within age 29% 0% 19
Environment Canada/weatheroffice.ec.gc.ca % within age 17% 13% 14
Map Quest % within age 2% 13% 4
Store/destination website % within age 3% 4% 3
STO.ca % within age 3% 0% 2
Other (less than 2 responses each, of total) % within age 8% 0% 5
Those aged 18 to 44 were comparatively more likely than the 45 plus age group to consult weather sites such as the Weather
Network’s website (29%) or Environment Canada’s Weather Office website (17%). In contrast, those aged 45 and over group
consulted online weather sites (Environment Canada) in only 13% of cases. The 45 years of age and over age group were
comparatively more like than the 18 to 44 year group to consult Google Maps (48%) as well as Map Quest (13%) for their trips.
An equal amount of both age groups consulted OC Transpo’s website (22% each). Other internet sources consulted include
store or destination websites (4% of those aged 45 and over; 3% of those aged 18 to 44) or the STO.ca website (3% of those
aged 18 to 44).
Nanos Research City of Ottawa Transportation System ManagementStrategy September 2010 (613) 234-4666 Public Focus Groups and Expert Consultation Report Page 26
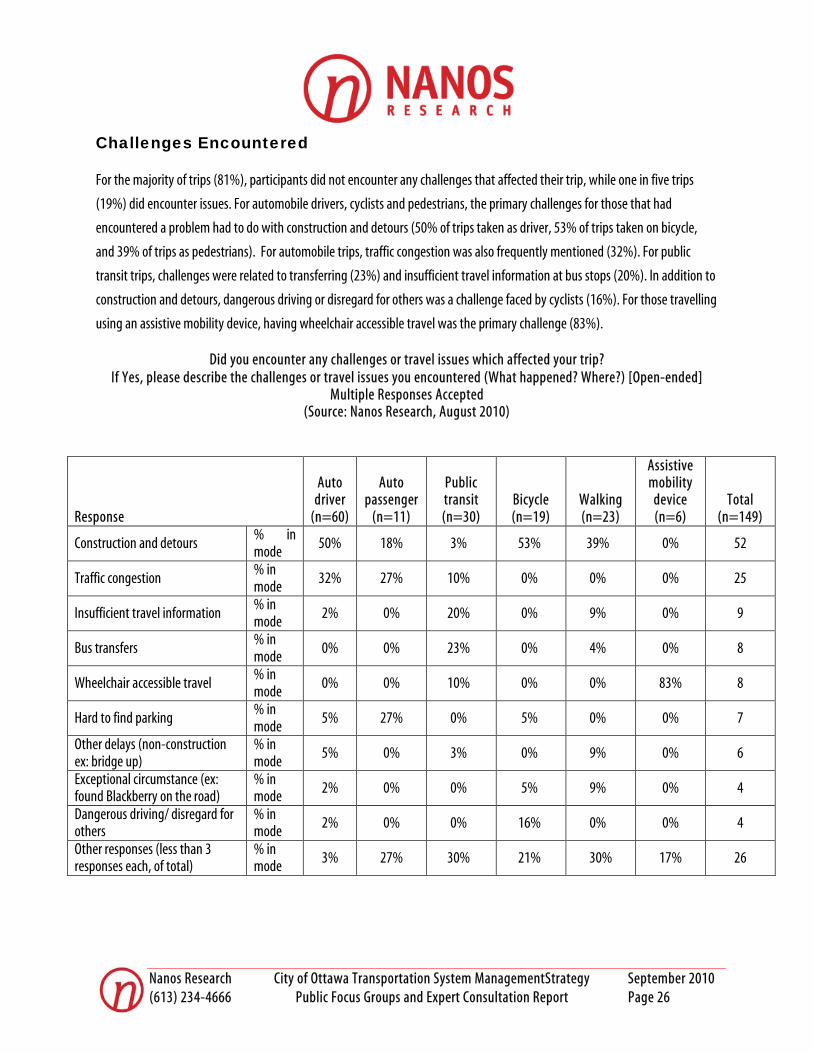
Challenges Encountered
For the majority of trips (81%), participants did not encounter any challenges that affected their trip, while one in five trips
(19%) did encounter issues. For automobile drivers, cyclists and pedestrians, the primary challenges for those that had
encountered a problem had to do with construction and detours (50% of trips taken as driver, 53% of trips taken on bicycle,
and 39% of trips as pedestrians). For automobile trips, traffic congestion was also frequently mentioned (32%). For public
transit trips, challenges were related to transferring (23%) and insufficient travel information at bus stops (20%). In addition to
construction and detours, dangerous driving or disregard for others was a challenge faced by cyclists (16%). For those travelling
using an assistive mobility device, having wheelchair accessible travel was the primary challenge (83%).
Did you encounter any challenges or travel issues which affected your trip? If Yes, please describe the challenges or travel issues you encountered (What happened? Where?) [Open-ended]
Multiple Responses Accepted (Source: Nanos Research, August 2010)
Response
Auto driver
(n=60)
Auto passenger
(n=11)
Public transit (n=30)
Bicycle (n=19)
Walking (n=23)
Assistive mobility
device (n=6)
Total (n=149)
Construction and detours % in mode
50% 18% 3% 53% 39% 0% 52
Traffic congestion % in mode
32% 27% 10% 0% 0% 0% 25
Insufficient travel information % in mode
2% 0% 20% 0% 9% 0% 9
Bus transfers % in mode
0% 0% 23% 0% 4% 0% 8
Wheelchair accessible travel % in mode
0% 0% 10% 0% 0% 83% 8
Hard to find parking % in mode
5% 27% 0% 5% 0% 0% 7
Other delays (non-construction ex: bridge up)
% in mode
5% 0% 3% 0% 9% 0% 6
Exceptional circumstance (ex: found Blackberry on the road)
% in mode 2% 0% 0% 5% 9% 0% 4
Dangerous driving/ disregard for others
% in mode 2% 0% 0% 16% 0% 0% 4
Other responses (less than 3 responses each, of total)
% in mode 3% 27% 30% 21% 30% 17% 26

Nanos Research City of Ottawa Transportation System ManagementStrategy September 2010 (613) 234-4666 Public Focus Groups and Expert Consultation Report Page 27
In both age groups, construction and detours were the most frequently cited challenge they encountered (35% of response
among those aged 18 to 44, 37% of responses among of those aged 45 and over). Traffic congestion was also frequently cited
both groups, although comparatively more often in the 18 to 44 age group (22%) than in the 45 and over group (15%) Those
aged 45 and over were comparatively more likely to encounter challenges related to a lack of sufficient travel information
(10%) and issues with bus transfers (8%) than those aged 18 to 44. Wheelchair accessible travel challenges were comparatively
more likely to be an issue for those over 45 years of age. Challenges related to dangerous driving or the perception that drivers
had disregard for others were more common among the 18 to 44 age group (5%) than the 45 and over group (1%).
Did you encounter any challenges or travel issues which affected your trip? If Yes, please describe the challenges or travel issues you encountered (What happened? Where?) [Open-ended]
(Source: Nanos Research, August 2010)
Responses 18 to 44 (n=58)
45+ (n=83)
Total (n=141)
Construction and detours % within age 35% 37% 51
Traffic congestion % within age 22% 15% 25
Insufficient travel information % within age 0% 10% 8
Bus transfers % within age 0% 8% 7
Hard to find parking % within age 2% 7% 7
Wheelchair accessible travel % within age 0% 6% 5
Other delays (non-construction ex: bridge up) % within age 2% 5% 5
Exceptional circumstance (ex: found Blackberry on the road) % within age 3% 2% 4
Dangerous driving/ disregard for others % within age 5% 1% 4
Other (less than 3 responses each) % within age 31% 8% 25
Nanos Research City of Ottawa Transportation System ManagementStrategy September 2010 (613) 234-4666 Public Focus Groups and Expert Consultation Report Page 28
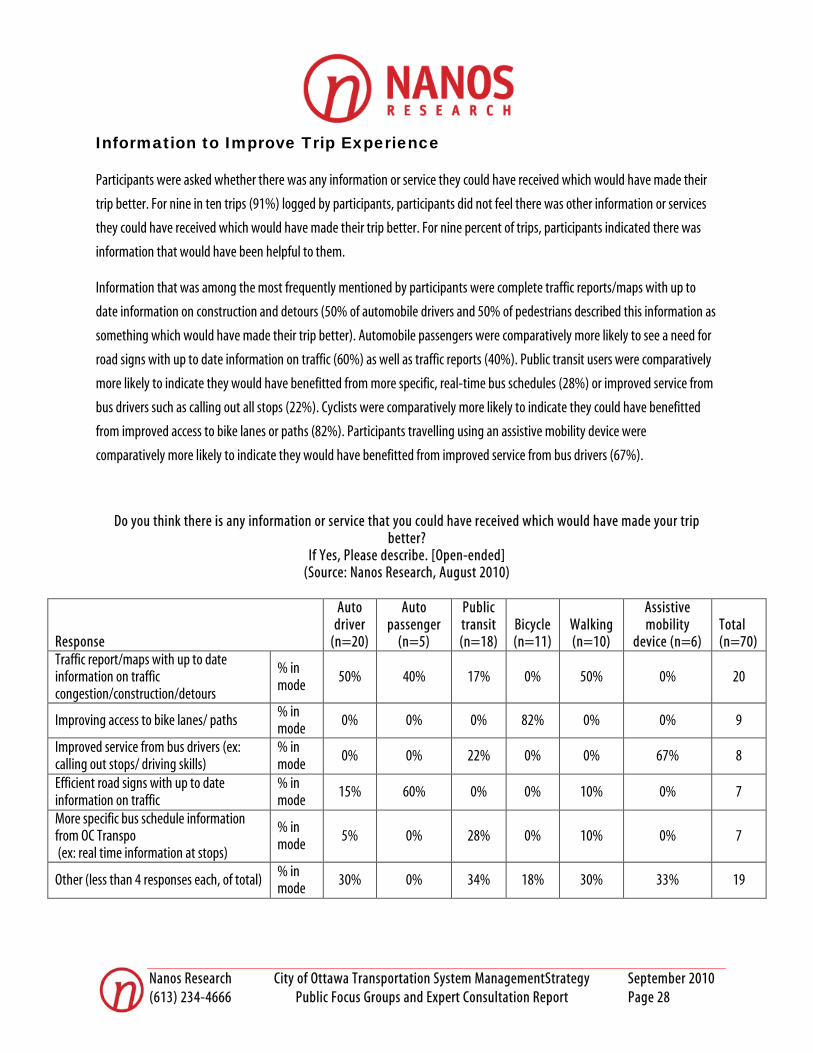
Information to Improve Trip Experience
Participants were asked whether there was any information or service they could have received which would have made their
trip better. For nine in ten trips (91%) logged by participants, participants did not feel there was other information or services
they could have received which would have made their trip better. For nine percent of trips, participants indicated there was
information that would have been helpful to them.
Information that was among the most frequently mentioned by participants were complete traffic reports/maps with up to
date information on construction and detours (50% of automobile drivers and 50% of pedestrians described this information as
something which would have made their trip better). Automobile passengers were comparatively more likely to see a need for
road signs with up to date information on traffic (60%) as well as traffic reports (40%). Public transit users were comparatively
more likely to indicate they would have benefitted from more specific, real-time bus schedules (28%) or improved service from
bus drivers such as calling out all stops (22%). Cyclists were comparatively more likely to indicate they could have benefitted
from improved access to bike lanes or paths (82%). Participants travelling using an assistive mobility device were
comparatively more likely to indicate they would have benefitted from improved service from bus drivers (67%).
Do you think there is any information or service that you could have received which would have made your trip better?
If Yes, Please describe. [Open-ended] (Source: Nanos Research, August 2010)
Response
Auto driver
(n=20)
Auto passenger
(n=5)
Public transit (n=18)
Bicycle (n=11)
Walking (n=10)
Assistive mobility
device (n=6) Total (n=70)
Traffic report/maps with up to date information on traffic congestion/construction/detours
% in mode
50% 40% 17% 0% 50% 0% 20
Improving access to bike lanes/ paths % in mode 0% 0% 0% 82% 0% 0% 9
Improved service from bus drivers (ex: calling out stops/ driving skills)
% in mode
0% 0% 22% 0% 0% 67% 8
Efficient road signs with up to date information on traffic
% in mode
15% 60% 0% 0% 10% 0% 7
More specific bus schedule information from OC Transpo (ex: real time information at stops)
% in mode
5% 0% 28% 0% 10% 0% 7
Other (less than 4 responses each, of total) % in mode
30% 0% 34% 18% 30% 33% 19
Nanos Research City of Ottawa Transportation System ManagementStrategy September 2010 (613) 234-4666 Public Focus Groups and Expert Consultation Report Page 29
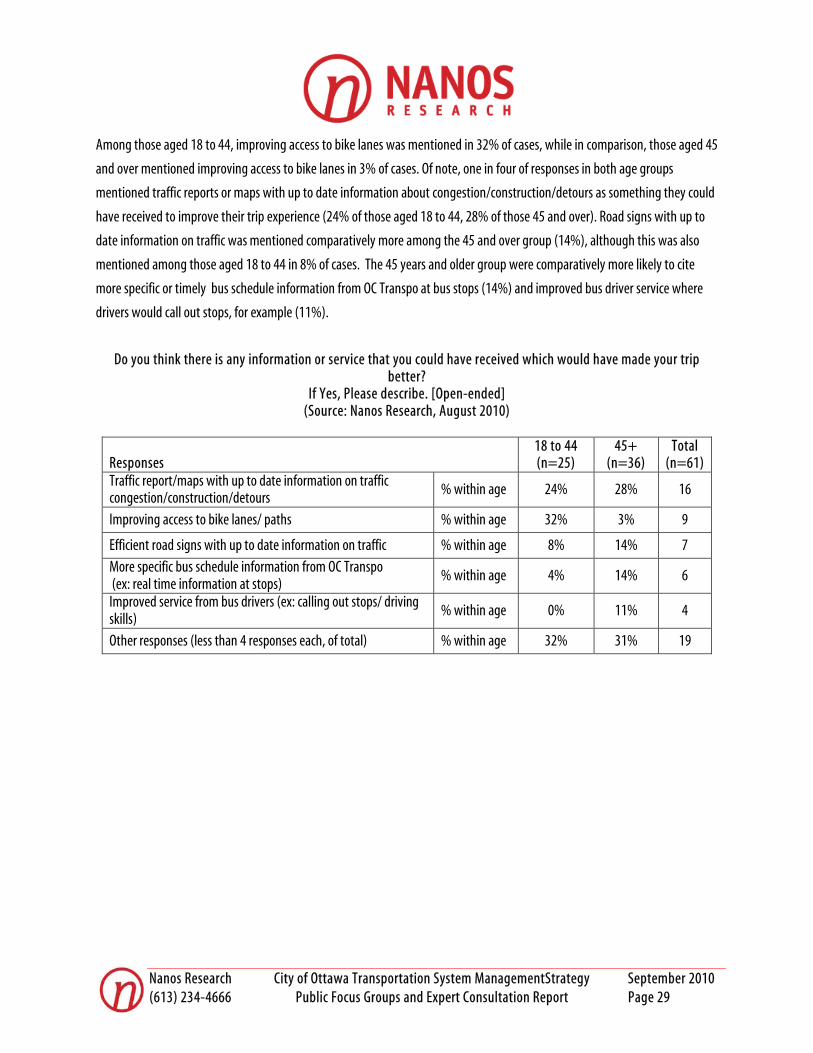
Among those aged 18 to 44, improving access to bike lanes was mentioned in 32% of cases, while in comparison, those aged 45
and over mentioned improving access to bike lanes in 3% of cases. Of note, one in four of responses in both age groups
mentioned traffic reports or maps with up to date information about congestion/construction/detours as something they could
have received to improve their trip experience (24% of those aged 18 to 44, 28% of those 45 and over). Road signs with up to
date information on traffic was mentioned comparatively more among the 45 and over group (14%), although this was also
mentioned among those aged 18 to 44 in 8% of cases. The 45 years and older group were comparatively more likely to cite
more specific or timely bus schedule information from OC Transpo at bus stops (14%) and improved bus driver service where
drivers would call out stops, for example (11%).
Do you think there is any information or service that you could have received which would have made your trip
better? If Yes, Please describe. [Open-ended]
(Source: Nanos Research, August 2010)
Responses 18 to 44 (n=25)
45+ (n=36)
Total (n=61)
Traffic report/maps with up to date information on traffic congestion/construction/detours
% within age 24% 28% 16
Improving access to bike lanes/ paths % within age 32% 3% 9
Efficient road signs with up to date information on traffic % within age 8% 14% 7
More specific bus schedule information from OC Transpo (ex: real time information at stops)
% within age 4% 14% 6
Improved service from bus drivers (ex: calling out stops/ driving skills)
% within age 0% 11% 4
Other responses (less than 4 responses each, of total) % within age 32% 31% 19

Nanos Research City of Ottawa Transportation System ManagementStrategy September 2010 (613) 234-4666 Public Focus Groups and Expert Consultation Report Page 30
DETAILED FOCUS GROUP REPORT

Nanos Research City of Ottawa Transportation System ManagementStrategy September 2010 (613) 234-4666 Public Focus Groups and Expert Consultation Report Page 31
Focus Group Methodology
Eight focus group discussions were conducted in Ottawa between August 9th and August 12th, 2010. The eight groups were split
into four profiles based on transportation mode: drivers, cyclists, pedestrians, and public transit users. Each night, two sessions
were conducted among participants who regularly used that night’s transportation mode as a means of getting around Ottawa.
In addition to the four transportation profiles, a generational sub-profile was also implemented. On each night, the first group
was conducted among residents who were Baby Boomers and older (those born before 1965), while the second group was
conducted among residents from Generation X and Generation Y (those born in 1965 and later).
Each group contained eight participants for a total of 64 participants for all eight groups. The sessions included a mix of
primarily English speaking and bilingual participants. There was also a mix of male and female participants. Each session of
eight participants was 90 minutes in duration and was conducted in English.
The objectives of the focus groups were to identify and understand residents’ views on the future of transportation in the City of
Ottawa, the key challenges residents face while getting around the city and how future innovations in information technology
could be used to overcome these challenges. The same moderator’s guide was used for all groups and all participants were
asked to comment on getting around Ottawa using all four modes of transportation.
Readers should note that the volume of traffic associated with this seasonal time period (summer) is typically lower than in
other seasons and therefore, feedback may not represent the difficulties associated with travel in each of the modal choices or
reflect the general network and road conditions of other seasons.
Readers should note that the findings of qualitative research cannot be projected to the populace or to a group but do provide
an understanding of the potential context and nuance of opinion. This research project was completed in accordance with the
standards of, and registered with, the Marketing Research and Intelligence Association of which Nanos is a Corporate Gold Seal
member.
Nanos Research City of Ottawa Transportation System ManagementStrategy September 2010 (613) 234-4666 Public Focus Groups and Expert Consultation Report Page 32
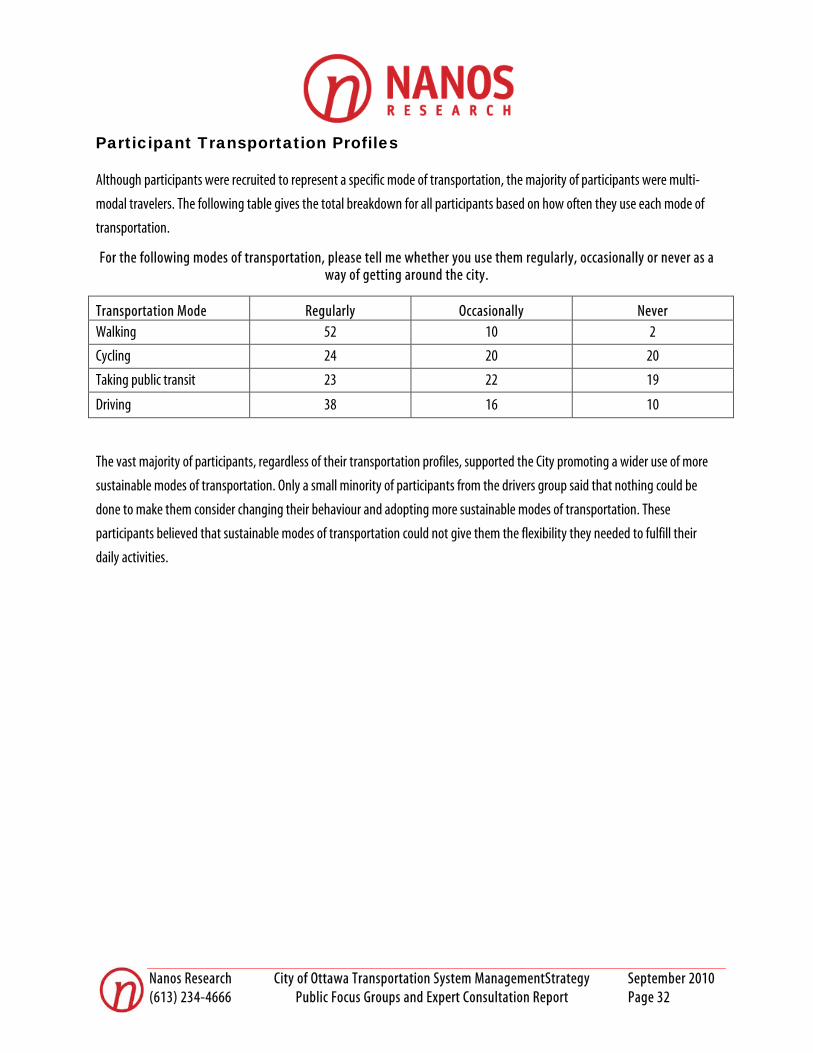
Participant Transportation Profiles
Although participants were recruited to represent a specific mode of transportation, the majority of participants were multi-
modal travelers. The following table gives the total breakdown for all participants based on how often they use each mode of
transportation.
For the following modes of transportation, please tell me whether you use them regularly, occasionally or never as a way of getting around the city.
Transportation Mode Regularly Occasionally Never Walking 52 10 2
Cycling 24 20 20
Taking public transit 23 22 19
Driving 38 16 10
The vast majority of participants, regardless of their transportation profiles, supported the City promoting a wider use of more
sustainable modes of transportation. Only a small minority of participants from the drivers group said that nothing could be
done to make them consider changing their behaviour and adopting more sustainable modes of transportation. These
participants believed that sustainable modes of transportation could not give them the flexibility they needed to fulfill their
daily activities.

Nanos Research City of Ottawa Transportation System ManagementStrategy September 2010 (613) 234-4666 Public Focus Groups and Expert Consultation Report Page 33
Summary
The focus groups provided a setting to discuss future priorities and possible solutions that could improve the travel experience.
All participants in the focus groups generally expected that by 2020 a shift to a more environmentally sustainable modal split
would occur with a decrease in the proportionate share of driving and an increase in public transit and other alternatives to the
car. There was an expectation that in the future the incidence of single traveler vehicles would decline.
Focus testing showed that there were a diversity of views and ideas on how to improve transportation in Ottawa. Many of the
challenges related to the different modes had to do with infrastructure. For cyclists and pedestrians, the infrastructure
challenges related to an original urban design geared to automobiles. For automobiles, challenges related to the perceived
need for more infrastructure was cited, while for transit challenges primarily related to capacity, wayfinding and service.
However, a series of solutions were identified by the research participants that could help shape the long-term transportation
system management strategy in terms of improving the transportation journey in Ottawa.
To follow is a summary of the focus group results.
Views on the future of sustainable transportation in Ottawa – Nearly all participants valued a wider use of more
sustainable modes of transportation and the majority of participants believed that in the next 10 years there would be more of
a shift away from single occupancy vehicles.
Key differences between the two generational sub-profiles – Participants from the Baby Boomer and older groups were
comparatively less likely to come up with a variety of innovative information technology solutions to overcome the City’s
transportation challenges than participants from the Generation X & Y groups.
Participants believed that information technology was best suited to overcome challenges for motorists – Many
participants believed that the challenges that drivers encounter are often the most easily overcome by information technology
and that this trend will continue as more and more vehicles on the road become equipped with onboard navigation systems.
The major challenges to cycling in Ottawa were not easily overcome using technology according to participants –The
most common challenge identified for cyclists in Ottawa was the lack of a comprehensive city bike path system. Participants
had difficulty finding an information technology solution for this challenge, since in their view this was, at its root, a challenge
caused by infrastructure.
Reliability was seen as a primary challenge to transit users – real-time information was the perceived solution –
Participants cited the lack of control over the amount of time it could potentially take to get to a destination as the primary
hindrance to using public transit. This lack of control is linked to having static transit schedules and the lack of knowledge as to
whether a bus has already come by a bus stop. Participants believed having real-time information about routes was the key to
giving more control to transit users.
Nanos Research City of Ottawa Transportation System ManagementStrategy September 2010 (613) 234-4666 Public Focus Groups and Expert Consultation Report Page 34
Awareness and usage of Interactive Traffic Map – The vast majority of participants, 57 out of 64, were unaware of the
existence of the City of Ottawa’s Interactive Traffic Map prior to the focus group discussion, while nearly all participants said
they would use the service now that they were aware.
View on the Interactive Traffic Map –The majority of participants said that they would like to have all their information
regarding traveling available in one place. Many of them believed that the Interactive Traffic Map had the potential to be a “one
stop shop” getting around Ottawa. Participants gave several suggestions for additional pieces of real-time information that
could be added to the Interactive Traffic Map including: OC Transpo routes and bus positions, colour- coded roads based on
levels of congestion, the progress of snow plows and the ability to plan a trip using any mode, among others.
Views on mobile applications using the Interactive Traffic Map – Participants were in favour of using the information
provided by the City on the Interactive Traffic Map through mobile applications, however, participants were divided on whether
the City should develop these applications or if they should rely on third parties to develop the applications. Those who
preferred for the City to wait for third parties to develop applications believed that an open data approach would be more
customer oriented, while those who preferred that the City develop applications generally believed that third parties might not
be interested given Ottawa’s population size and therefore local government had a role to play.
How to shift behaviour towards more sustainable modes of transportation – Participants were asked to come up with
ways the city could encourage residents to shift their behaviour away from single occupancy vehicles towards more sustainable
modes of transportation. The most frequent suggestions given by participants were implementing incentives for using
sustainable transportation, disincentives to driving, making sustainable modes more convenient, making driving less
convenient and using social marketing to encourage more sustainable modes.

Nanos Research City of Ottawa Transportation System ManagementStrategy September 2010 (613) 234-4666 Public Focus Groups and Expert Consultation Report Page 35
Travel Diary Component
In advance of the focus group sessions, each participant was required to select two days in his or her week and log all trips and travel experiences around the City of Ottawa. The key findings of the travel diaries were as follows. For further details on findings or the methodology, please refer to the Travel Diary Analysis (Page 12) or Appendix A for detailed tabulations.
• Residents Generally Satisfied – The 82 individuals who completed travel diaries for 744 trips were generally
satisfied with the experience of their trip (rating of 4.14 on a 5-point scale where 1 was a very poor experience and 5
was a very good experience). Cyclists were comparatively more satisfied with their trip experiences (4.35 out of 5)
while public transit users and those using assistive mobility devices were comparatively less satisfied with their trip
experiences (3.85 and 3.57, respectively). Automobile drivers (4.18), pedestrians (4.16) and automobile passengers
were generally satisfied (4.08) with their trip experiences.
• Distance and Time – Not surprisingly those who walked travelled the shortest distances (2.7 kilometers on average)
while those that were automobile passengers travelled the furthest distance (16.0 kilometers on average).
Participants who primarily drove travelled 14.2 kilometers on average while those using public transit said they
travelled, on average, 11.8 kilometers. Cyclists indicated they travelled 6.2 kilometers on average. Of note, trips as
driver of an automobile, although they did not register the shortest distance, registered the shortest travel time
(automobile trip 18.8 minutes on average compared to 20.3 for a bicycle trip, 20.8 for a walking trip and 33.4 for a
public transit trip).
• The Utilitarian Traveler – With convenience as an important determinant in terms of mode choice for automobile
drivers (27%), those taking public transit (27%), pedestrians (23%) and cyclists (22%), ensuring that the journey has
the fewest unanticipated disruptions will be key to an optimal travel experience. With the exception of convenience,
cyclists and pedestrians also cited exercise/health as factors influencing their choice (23% and 14% respectively).
Also of note, those individuals in the study who travelled predominantly by public transit were more likely to cite
necessity (16%).
• Current Sources of Traveler Information – Weather reports were the most frequently consulted sources of
information across modes (automobile 31%, bicycle 72%, walking 62%), although public transit users and persons
using an assistive mobility device were comparatively more likely to check a public transit schedule (55% and 100%,
respectively). Of note, weather reports were more likely to be consulted when a trip was for a work related purpose
(55%) or leisure purpose (52%). Other frequently consulted sources of information were maps. Participants were also
comparatively more likely to check the internet for information over television, radio, smart phone applications, the
newspaper, GPS or other sources.
Nanos Research City of Ottawa Transportation System ManagementStrategy September 2010 (613) 234-4666 Public Focus Groups and Expert Consultation Report Page 36
• Construction/Detours outpace Congestion as Challenges - Nineteen percent of the 744 trips logged in the diaries
encountered a challenge or a travel issue. The most common travel issue encountered related to construction or
detours (automobile 50%, bicycle 53%, pedestrians 39%). However, among public transit users only 3% cited
construction or detours as a travel issue. Public transit users were more likely to cite bus transfers (23%) and
perceived insufficient travel information (20%) as key challenges encountered during their trip.
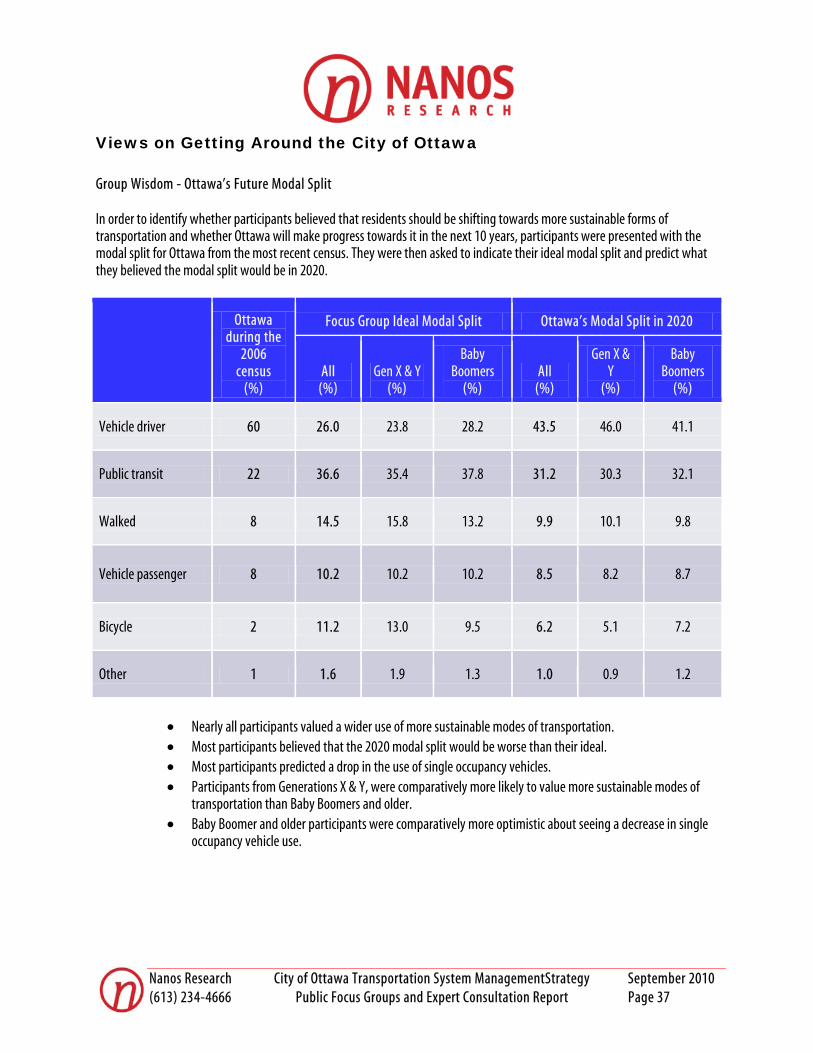
Nanos Research City of Ottawa Transportation System ManagementStrategy September 2010 (613) 234-4666 Public Focus Groups and Expert Consultation Report Page 37
Views on Getting Around the City of Ottawa
Group Wisdom - Ottawa’s Future Modal Split In order to identify whether participants believed that residents should be shifting towards more sustainable forms of transportation and whether Ottawa will make progress towards it in the next 10 years, participants were presented with the modal split for Ottawa from the most recent census. They were then asked to indicate their ideal modal split and predict what they believed the modal split would be in 2020.
Ottawa during the
2006 census
(%)
Focus Group Ideal Modal Split Ottawa’s Modal Split in 2020
All (%)
Gen X & Y (%)
Baby Boomers
(%) All
(%)
Gen X & Y
(%)
Baby Boomers
(%)
Vehicle driver 60 26.0 23.8 28.2 43.5 46.0 41.1
Public transit 22 36.6 35.4 37.8 31.2 30.3 32.1
Walked 8 14.5 15.8 13.2 9.9 10.1 9.8
Vehicle passenger 8 10.2 10.2 10.2 8.5 8.2 8.7
Bicycle 2 11.2 13.0 9.5 6.2 5.1 7.2
Other 1 1.6 1.9 1.3 1.0 0.9 1.2
• Nearly all participants valued a wider use of more sustainable modes of transportation. • Most participants believed that the 2020 modal split would be worse than their ideal. • Most participants predicted a drop in the use of single occupancy vehicles. • Participants from Generations X & Y, were comparatively more likely to value more sustainable modes of
transportation than Baby Boomers and older. • Baby Boomer and older participants were comparatively more optimistic about seeing a decrease in single
occupancy vehicle use.
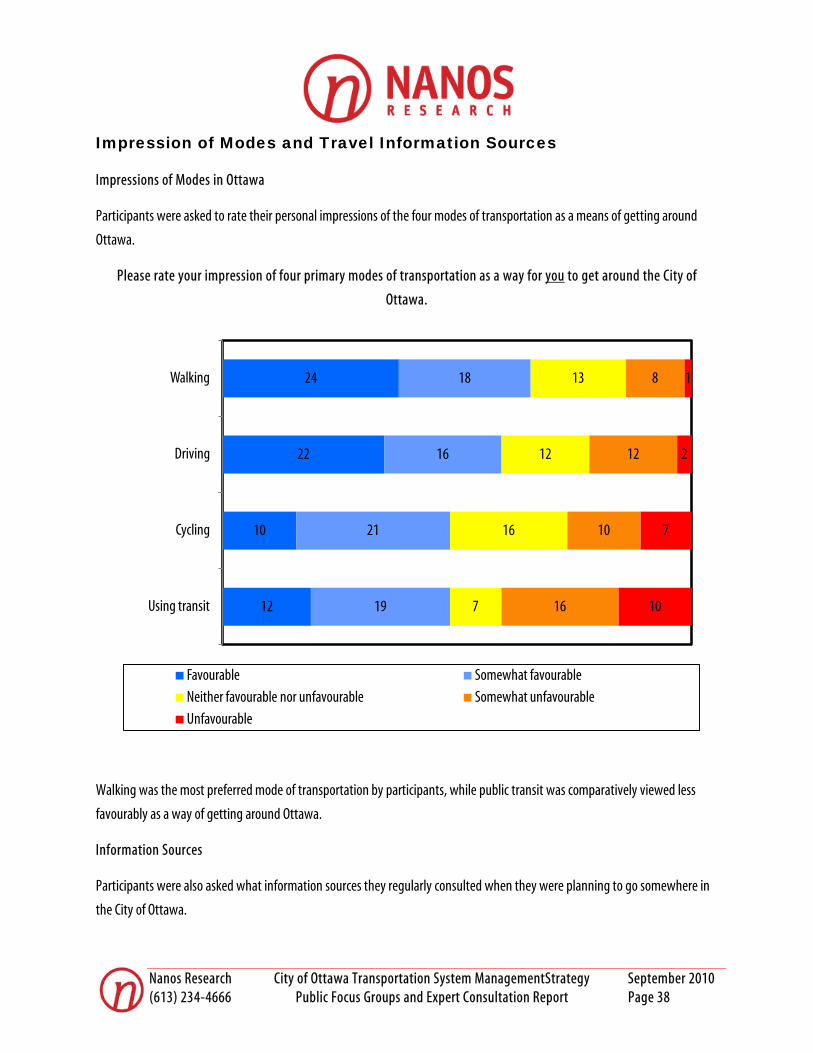
Nanos Research City of Ottawa Transportation System ManagementStrategy September 2010 (613) 234-4666 Public Focus Groups and Expert Consultation Report Page 38
12
10
22
24
19
21
16
18
7
16
12
13
16
10
12
8
10
7
2
1
Using transit
Cycling
Driving
Walking
Favourable Somewhat favourable
Neither favourable nor unfavourable Somewhat unfavourable
Unfavourable
Impression of Modes and Travel Information Sources
Impressions of Modes in Ottawa
Participants were asked to rate their personal impressions of the four modes of transportation as a means of getting around
Ottawa.
Please rate your impression of four primary modes of transportation as a way for you to get around the City of
Ottawa.
Walking was the most preferred mode of transportation by participants, while public transit was comparatively viewed less
favourably as a way of getting around Ottawa.
Information Sources
Participants were also asked what information sources they regularly consulted when they were planning to go somewhere in
the City of Ottawa.
Nanos Research City of Ottawa Transportation System ManagementStrategy September 2010 (613) 234-4666 Public Focus Groups and Expert Consultation Report Page 39
The most commonly used information sources were Google Maps, the OC Transpo website, the Weather Network (both the
television channel and the website), Environment Canada’s weather website, various radio stations and MapQuest.

Nanos Research City of Ottawa Transportation System ManagementStrategy September 2010 (613) 234-4666 Public Focus Groups and Expert Consultation Report Page 40
Perception of Getting Around Ottawa vs. Ideal City – Word Clouds
A word cloud is a visual representation of words used by participants based on their frequency.
Getting Around Ottawa Today
Participants were asked to list three words that describe what it is like to get around Ottawa. The following word cloud is based
on their responses. Only words which were used more than once are included in the word cloud.
Getting Around the Ideal City
Participants were asked to list three words that describe what it would be like to get around the ideal city. The following word
cloud is based on their responses. Only words which were used more than once are included in the word cloud.

Nanos Research City of Ottawa Transportation System ManagementStrategy September 2010 (613) 234-4666 Public Focus Groups and Expert Consultation Report Page 41
The Travel Experience
The Purpose of the Travel Experience Section
For each mode of transportation, participants were asked to identify some of the key challenges residents experience when
trying to get around Ottawa.
After participants had identified several challenges they were asked how information technology could play a role in
overcoming those challenges. Participants were encouraged to think into the future, at least 10 years, and based on what they
knew about the way technological innovation were moving, to think of ways they believed technological advances could
positively impact the way people get around Ottawa.
How Age Impacted Views on Improving Travel Experience
Not surprisingly, participants from the Generation X & Y groups were comparatively more likely to come up with a variety of
innovative information technology solutions to overcome the challenges than participants from the Baby Boomer and older
group.
There were several participants from the Baby Boomer and older group who were quite tech savvy, however there were others
who did not use technology at all when planning their travels around the city.
When considering what information channels to use, it is important to recognize that a large portion of the population
continues to rely on more traditional sources of information to plan their travels.

Nanos Research City of Ottawa Transportation System ManagementStrategy September 2010 (613) 234-4666 Public Focus Groups and Expert Consultation Report Page 42
Key Challenges for Pedestrians in Ottawa
The key challenges, identified by participants, to getting around the City of Ottawa as a pedestrian can be grouped into four
categories: safety challenges, infrastructure challenges, weather challenges and distance/wayfinding challenges.
Proposed Solutions to Walking Challenges
Participants were able to suggest potential information technology solutions for nearly all the challenges that pedestrians face
while trying to get around the city.
Wayfinding and Distance Challenges
A. It is difficult to walk in some areas of the city because of the distance between origins and destinations
Proposed Information Solution: Participants believed that, as information technology improved, they would be able to input
a product into a mobile device and this application would be able to tell them the nearest store or business which they could
walk to. This would make walking more convenient around Ottawa.
B. Knowing the best route to take as a pedestrian
Proposed Information Solution 1: Several participants expressed the desire to have interactive touch screen kiosks at key
activity centres which would provide information on the surrounding area and the best routes to take as a pedestrian.
Nanos Research City of Ottawa Transportation System ManagementStrategy September 2010 (613) 234-4666 Public Focus Groups and Expert Consultation Report Page 43
Proposed Information Solution 2: Participants believed that interactive travel planning applications could be used to provide
them with the quickest routes for walking. Some participants said that they regularly used Google Maps walking directions as a
means of planning their trips; however they also said that the service could still be improved in terms of providing the quickest
route.
Infrastructure Challenges
A. Lack of sidewalks for pedestrians
Proposed Information Solution: Participants said that they would like to have a detailed online map of where there are
sidewalks or paths in the city so they could plan their routes accordingly.
Safety Challenges
A. Crossing roads
Proposed Information Solution 1: Participants supported having more crossing signals which included a countdown timer
being installed across the city.
Proposed Information Solution 2: Some participants believed it should be possible to create a “smart crosswalk”, which
would be able to visually notify motorists when there were pedestrians in or approaching a crosswalk by using motion sensors.
B. Walking at night
Proposed Information Solution 1: Some participants felt that not feeling secure walking at night was a major obstacle to
increasing walking as a mode of transportation. They suggested using “alert kiosks” similar to those found on university
campuses in areas across the city.
Proposed Information Solution 2: Participants also believed that areas along paths that are dark at night should have “smart
lights” with motion sensors which would turn on as people walked by.
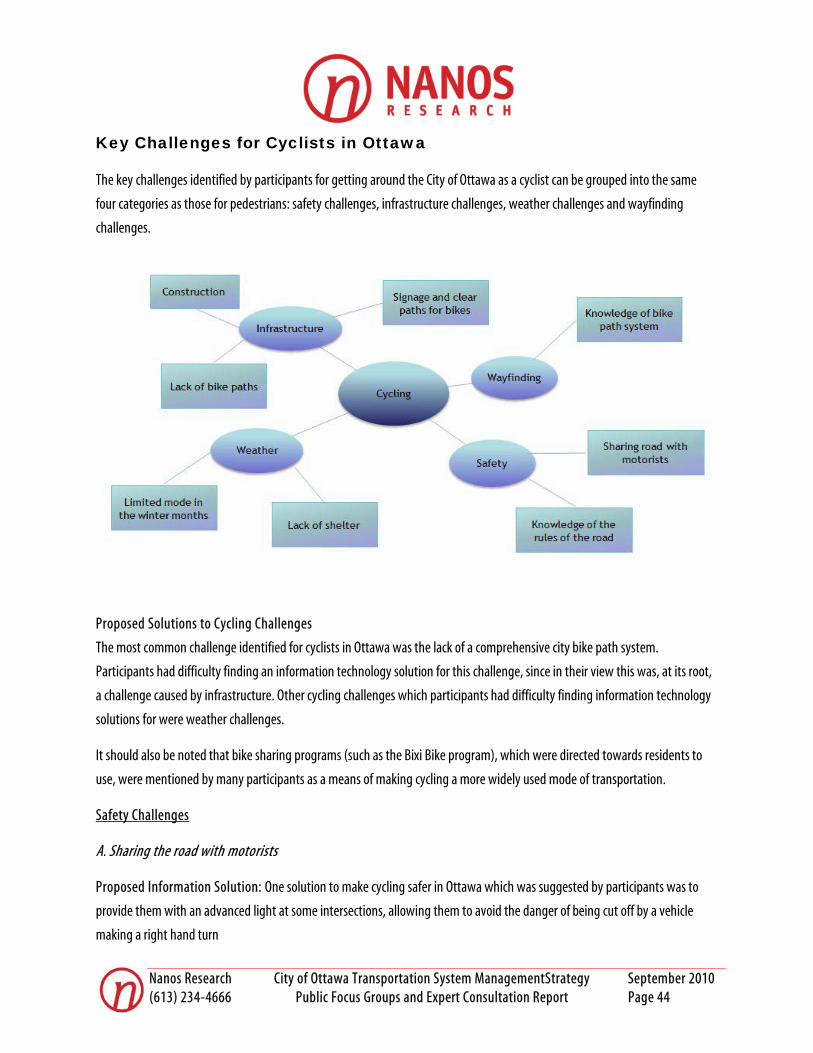
Nanos Research City of Ottawa Transportation System ManagementStrategy September 2010 (613) 234-4666 Public Focus Groups and Expert Consultation Report Page 44
Key Challenges for Cyclists in Ottawa
The key challenges identified by participants for getting around the City of Ottawa as a cyclist can be grouped into the same
four categories as those for pedestrians: safety challenges, infrastructure challenges, weather challenges and wayfinding
challenges.
Proposed Solutions to Cycling Challenges
The most common challenge identified for cyclists in Ottawa was the lack of a comprehensive city bike path system.
Participants had difficulty finding an information technology solution for this challenge, since in their view this was, at its root,
a challenge caused by infrastructure. Other cycling challenges which participants had difficulty finding information technology
solutions for were weather challenges.
It should also be noted that bike sharing programs (such as the Bixi Bike program), which were directed towards residents to
use, were mentioned by many participants as a means of making cycling a more widely used mode of transportation.
Safety Challenges
A. Sharing the road with motorists
Proposed Information Solution: One solution to make cycling safer in Ottawa which was suggested by participants was to
provide them with an advanced light at some intersections, allowing them to avoid the danger of being cut off by a vehicle
making a right hand turn
Nanos Research City of Ottawa Transportation System ManagementStrategy September 2010 (613) 234-4666 Public Focus Groups and Expert Consultation Report Page 45
Infrastructure Challenges
A. Signage and bike lanes which were difficult for both cyclists and motorists to see
Proposed Information Solution: Participants believed that signage and paths for cyclists could be laid out in a way which
could make them more visible to both cyclists and motorists. This could be done by using different coloured signage for cyclists
or using reflective paint or lane edge reflectors when laying out bike lanes.
Wayfinding Challenges
A. Lack of knowledge surrounding the bike path system
Proposed Information Solution: Some participants believed that, as mobile technology solutions become more widely used
by the population, it will become more common for them to be used with bicycles. Participants said that the City’s bike path
map could be loaded into a GPS or Smartphone, which would guide cyclists through the path system.
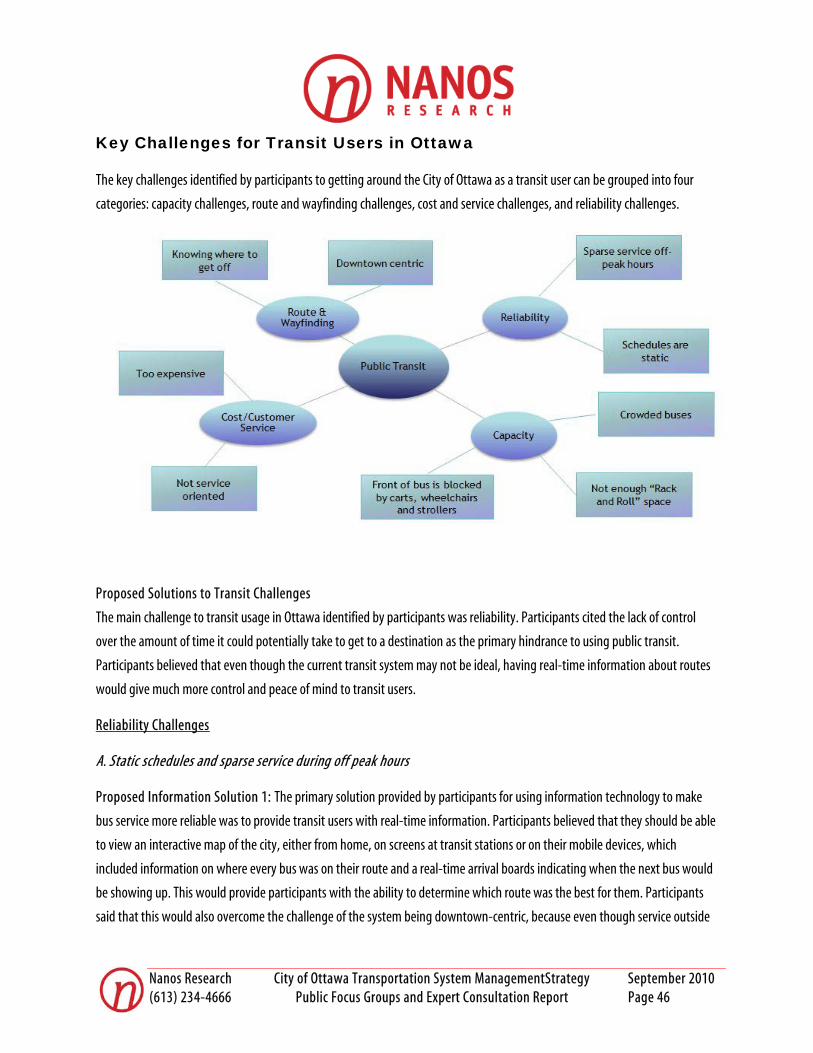
Nanos Research City of Ottawa Transportation System ManagementStrategy September 2010 (613) 234-4666 Public Focus Groups and Expert Consultation Report Page 46
Key Challenges for Transit Users in Ottawa
The key challenges identified by participants to getting around the City of Ottawa as a transit user can be grouped into four
categories: capacity challenges, route and wayfinding challenges, cost and service challenges, and reliability challenges.
Proposed Solutions to Transit Challenges
The main challenge to transit usage in Ottawa identified by participants was reliability. Participants cited the lack of control
over the amount of time it could potentially take to get to a destination as the primary hindrance to using public transit.
Participants believed that even though the current transit system may not be ideal, having real-time information about routes
would give much more control and peace of mind to transit users.
Reliability Challenges
A. Static schedules and sparse service during off peak hours
Proposed Information Solution 1: The primary solution provided by participants for using information technology to make
bus service more reliable was to provide transit users with real-time information. Participants believed that they should be able
to view an interactive map of the city, either from home, on screens at transit stations or on their mobile devices, which
included information on where every bus was on their route and a real-time arrival boards indicating when the next bus would
be showing up. This would provide participants with the ability to determine which route was the best for them. Participants
said that this would also overcome the challenge of the system being downtown-centric, because even though service outside
Nanos Research City of Ottawa Transportation System ManagementStrategy September 2010 (613) 234-4666 Public Focus Groups and Expert Consultation Report Page 47
of the core would be more sparse, having real-time information would allow users to know if they have missed a bus and
should find alternate means of getting to their destination.
Capacity Challenges
A. Not enough “Rack and Roll” space
Proposed Information Solution: Some participants complained that there was only space for two bicycles on OC Transpo’s
bicycle racks and they believed that information about which buses have bicycle racks should also be provided in real-time.
Wayfinding Challenges
A. Not knowing where to get off the bus
Proposed Information Solution: Many participants believed that it was necessary for buses to call out stops and that this
should be done automatically, using GPS systems.

Nanos Research City of Ottawa Transportation System ManagementStrategy September 2010 (613) 234-4666 Public Focus Groups and Expert Consultation Report Page 48
Key Challenges for Drivers in Ottawa
The key challenges identified by participants to getting around the City of Ottawa as a driver can be grouped into five
categories: safety challenges, infrastructure challenges, weather challenges, parking challenges and traffic challenges.
Proposed Solutions to Driving Challenges
Many participants believed that the challenges that drivers encounter are often most easily overcome by information
technology and that this trend will continue as more and more vehicles on the road become equipped with onboard navigation
systems.
Traffic Challenges
A. Congestion
Proposed Information Solution 1: Many participants suggested in car solutions to congestion, believing that real-time
information, which would be fed to an onboard navigation system, was the key to overcoming traffic congestion. Having
information before approaching a traffic back-up would allow motorists to respond before it was too late.
Proposed Information Solution 2: Other participants suggested information solutions which were outside of the vehicle.
Particularly electric information signs on roadways informing motorists about possible challenges ahead and providing
alternate routes.
Nanos Research City of Ottawa Transportation System ManagementStrategy September 2010 (613) 234-4666 Public Focus Groups and Expert Consultation Report Page 49
Parking Challenges
A. Not knowing where there is available parking
Proposed Information Solution: Participants believed that, since the city is shifting to a pay-and-display model, there should
be real-time information about which parking spaces are available. Participants believed that this information could be sent
directly to motorists who are looking for parking spaces via onboard navigation systems or mobile devices and notify them of
spaces that are available.
Nanos Research City of Ottawa Transportation System ManagementStrategy September 2010 (613) 234-4666 Public Focus Groups and Expert Consultation Report Page 50
Proposed Solutions to Challenges for More than One Mode
Participants proposed a number of solutions which could be used to overcome challenges which impact more than one mode of
transportation. The following suggestions apply to more than one mode of transportation.
Weather Challenges
Not knowing what roads are plowed
Proposed Information Solution: Many participants expressed a desire to know, in real-time, when streets were being plowed
and where the roads had already been plowed. Participants believed that this would be feasible using GPS units on the City of
Ottawa snow plows which could be relayed to an interactive map in real-time. As the plows moved through the streets they
could highlight the interactive map on streets that have been plowed.
Proposed solution applied to: Walking, Cycling and Driving
Information Challenges
Not knowing where construction is happening
Proposed Information Solution: Construction was a challenge that affected several modes of transportation. Participants
expressed the desire to know ahead of time where construction was happening and how it could potentially impact their
travels. Participants suggested that, if they were able to sign up for a route which they took regularly, then they would be able
to receive automatic notifications if there was construction happening along their route.
Proposed solution applied to: Walking, Cycling and Driving
Safety Challenges
Not knowing the rules of the road
Proposed Information Solution: Some participants believed that the City should explore more social marketing and education
campaigns in order to make travel safer in the city.
Proposed solution applied to: Walking, Cycling and Driving

Nanos Research City of Ottawa Transportation System ManagementStrategy September 2010 (613) 234-4666 Public Focus Groups and Expert Consultation Report Page 51
Global Leaders in Providing Information to Travelers
Participants were asked if they any had any experiences from another city, where information was passed to travelers which
enhanced the way they got around a city. The following table provides a summary of the cities which participants considered to
be leaders in providing information to travelers, by mode of transportation. The cities are in order from most commonly given
response to least commonly given response.
Walking Cycling Public Transit Driving
Toronto
New York
London, UK
Vienna
Zurich
San Francisco
Las Vegas
Saint John’s, NF
Taiwan
Copenhagen
Amsterdam
Montreal
New York
London, UK
Seattle
Atlanta
Portland
Washington DC
Bruges
Hamburg
Berlin
Tokyo
Denver
Toronto
Gatineau
New York
London, UK
Berlin
Rome
Edmonton
Calgary
Tokyo
Los Angeles
London, UK
Boston
Paris
Toronto
Vancouver
Montreal
Melbourne
Singapore
Washington DC
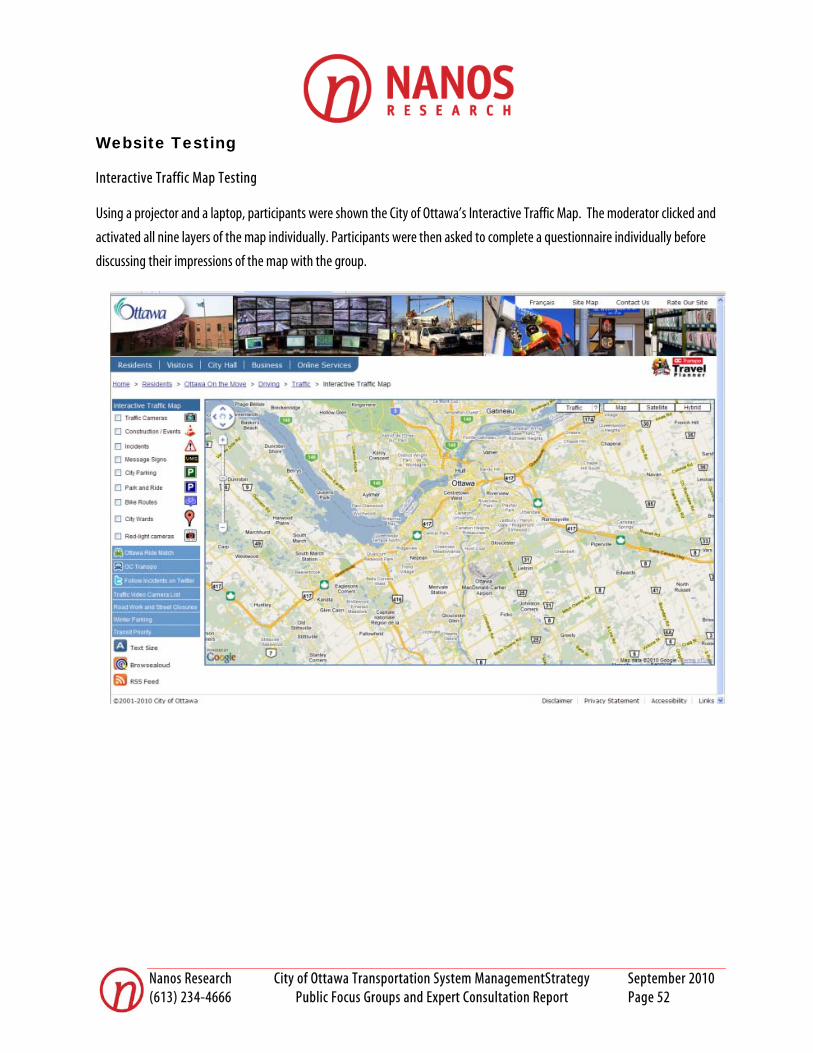
Nanos Research City of Ottawa Transportation System ManagementStrategy September 2010 (613) 234-4666 Public Focus Groups and Expert Consultation Report Page 52
Website Testing
Interactive Traffic Map Testing
Using a projector and a laptop, participants were shown the City of Ottawa’s Interactive Traffic Map. The moderator clicked and
activated all nine layers of the map individually. Participants were then asked to complete a questionnaire individually before
discussing their impressions of the map with the group.

Nanos Research City of Ottawa Transportation System ManagementStrategy September 2010 (613) 234-4666 Public Focus Groups and Expert Consultation Report Page 53
Views on the City of Ottawa’s Interactive Traffic Map
Awareness and Usage
The majority of participants were unaware of the existence of the City of Ottawa’s Interactive Traffic Map prior to the focus
group discussion, while nearly all participants said they would use the service.
Many participants were “pleasantly surprised” by the amount of information that was already available to them.
Most Useful Information on the Interactive Traffic Map
Participants were asked to identify which layer of the interactive map would be the most useful to them. The most commonly
identified helpful map layers were the “Construction/Events”, “Bike Routes” and “Traffic Cameras” layers.
How the City Should Leverage the Information
Many participants believed that the City should do more publicity on the Interactive Traffic Map. Some suggested ways of
advertising the site were buying ads on local radio and in local papers, putting flyers in City tax or water bills, putting ads on the
sides of buses, and using social media like Facebook or Twitter. Participants also suggested putting the Interactive Traffic Map
on a prominent place on the City website.
57
4
7
60
Previously aware of service
Would use service
No Yes
Nanos Research City of Ottawa Transportation System ManagementStrategy September 2010 (613) 234-4666 Public Focus Groups and Expert Consultation Report Page 54
Views on Creating Applications Using Information from the Interactive Traffic Map
Participants were divided on whether the City of Ottawa should create their own applications or whether they should rely on
third parties to develop applications.
Those who preferred for the City to wait for third parties to develop applications believed that an open data approach would be
more customer oriented, while those who preferred that the City develop applications generally believed that third parties
might not be interested given Ottawa’s population size and therefore local government had a role to play.
Additional Information for the Interactive Traffic Map
The majority of participants said that they would like to have all their information regarding traveling available in one place
and that the Interactive Traffic Map had the potential to be that source. The following list represents the most commonly
articulated suggestions for additional pieces of information that could be added to the Interactive Traffic Map:
• Colour coded roads at a glance based on the various levels of congestion • Route planning using any mode of transportation, as well as interest in multi-modal route options • Subscribing to a specific route and receiving real-time notifications when something happens along the route that
may cause delays • Mapping OC Transpo routes with real-time information on where buses are along a route • Special events (ex. Ottawa Senators Games, parades or music festivals) and their real-time impact on traffic • Mapping of real-time plowing status during winter months • Weather information • Real-time information on the number of parking spaces in City Parking and Park and Ride locations • Mapping with information on parking rules on each street • The ability to provide input on congestion and incidences in real-time using a mobile device
Many participants believed the Interactive Traffic Map should be more than just a traffic map, but instead should be “one stop
shop” for interactively mapping all City of Ottawa services.
Some participants also believed that the Interactive Map could be linked to commercial businesses and cultural institutions.
Some examples of these that participants believed could be helpful were museums, hotels, shopping centres and gas stations.

Nanos Research City of Ottawa Transportation System ManagementStrategy September 2010 (613) 234-4666 Public Focus Groups and Expert Consultation Report Page 55
Encouraging More Sustainable Modes of Transportation
Participants were asked to come up with ways the City could encourage residents to shift their behaviour away from single
occupancy vehicles towards more sustainable modes of transportation.
Incentives and Disincentives
Participants believed that one of the key ways to change behaviour was to provide people with incentives to use sustainable
transportation and disincentives to use automobiles. Two frequently articulated financial incentives suggested by participants
were tax credits and making public transit cheaper. Participants suggested a number of disincentives including implementing
taxes on vehicle or road usage.
Convenience and Inconvenience
Participants believed that another key way to change behaviour was to make using sustainable modes more convenient, while
at the same time making automobiles less convenient. Most participants believed that convenience/inconvenience was
something that was more influenced by the planning of the transportation system as opposed to its operation. Some ways to
make sustainable transportation more convenient were building a better transit system, creating more bike lanes,
implementing a city bike sharing program, while lane reductions and congestion were the primary suggestions for making
driving less convenient.
Social Marketing
Participants believed that the City should explore campaigns that explain the benefits, both economic and social, to using
sustainable modes of transportation.
Nanos Research City of Ottawa Transportation System ManagementStrategy September 2010 (613) 234-4666 Public Focus Groups and Expert Consultation Report Page 56
DETAILED THOUGHT-LEADER OUTREACH REPORT
Nanos Research City of Ottawa Transportation System ManagementStrategy September 2010 (613) 234-4666 Public Focus Groups and Expert Consultation Report Page 57
Thought-Leader Outreach Methodology
In order to gain insight into key issues and innovations that could influence the future of transportation system management in Ottawa, a global elite consultation was conducted with leaders who are experienced in and have knowledge of the fields of transportation, engineering, planning and technology. These interviews took place between July and August 2010 and were conducted by Nanos Research analysts by means of in-depth telephone and in-person interviews for participants in Ottawa. This initiative was part of a broader research project for the City of Ottawa. The overall objective was to help frame long term Transportation System Management strategy in Ottawa to ensure that the City of Ottawa can anticipate, meet and exceed the needs of residents. Potential participants were identified by the City of Ottawa and Nanos Research. Initial outreach was done by the City of Ottawa to inform potential participants of the objectives of the project and the process for the interviews. Nanos Research analysts then coordinated a convenient time for the interviews. Each interview was conducted by one Nanos analyst while a second analyst acted as a note-taker. At least one representative from the City of Ottawa’s project team sat in on the interview to observe and to ensure that the City garnered the maximum value from the elite outreach. The interviews ranged from 30 to 60 minutes in length, depending on the feedback and availability of the participant. Interviews were conducted with the following individuals (listed in alphabetical order):
• Dr. Baher Abdulhai, Canada Research Chair in ITS and Director, Toronto ITS Centre, University of Toronto (Toronto, Canada)
• Eran Gartner, President of Systems Division, Bombardier Transportation (Berlin, Germany)
• Keenan Kitasaka, Manager, Intelligent Transportation Systems, TransLink (Vancouver, Canada)
• David Lively, Chief, Office of System Management Planning, Caltrans (Sacramento, USA)
• Ralph Menzano, Executive Director, Transportation Division, Oracle (Philadelphia, USA)
• Dr. Eric J. Miller, Director, Cities Centre, and Professor, University of Toronto (Toronto, Canada)
• Ben Plowden, Director, Better Routes and Places, Transport for London (London, UK)
• Nancy Schepers, Deputy City Manager, Infrastructure Services and Community Sustainability, City of Ottawa (Ottawa, Canada)
For more detailed biographies on participants, please refer to Appendix B.
Nanos Research City of Ottawa Transportation System ManagementStrategy September 2010 (613) 234-4666 Public Focus Groups and Expert Consultation Report Page 58
Summary
Overall, a key finding from the thought leader consultation centred on an emerging trend in the travel experience, where the
expectation of real-time travel information for each mode of transportation will be the norm and that real-time information
would likely, in the longer term, help facilitate multimodal trips and also diminish reliance on the automobile, although it
would still be a very important mode for urban transportation. The key forces driving change and innovation related to
technology (in terms of real-time travel information), economics (in terms of the expected increased cost to operate
automobiles and maintain roads), through to the environment (and the desire to have a transportation system as sustainable
as possible). The experts consulted identified a series of trends, and possible solutions.
• Facing the Economic Crunch – One key thread of input that emerged was the perceived long-term
unsustainability of the costs to operate automobiles on the same scale in terms of the cost of fuel and the cost to
maintain expensive automobile road infrastructure. Restrictions on single passenger automobile travelers and
automobile sharing (either through a co-operative or fractional ownership) were seen as likely trends in the
future which would emerge in response to diminished cost advantage of automobiles and diminished advantage
in terms of future road capacity. The cost borne by municipal government to maintain a road system was also
identified as a key financial force that would put pressures on future governments and taxpayers.
• Influencing the Behaviour of Travelers – In practical terms, urban planning decisions have a significant
impact in encouraging modal transportation choices. By building more roads, one encourages transportation by
automobile. A number of the experts noted that once modal targets were set, practical public policy choices
should be made to encourage priority modes over other modes.
• Integration of Multiple Travel Systems through Smartcards – A number of the experts consulted cited
“smart” electronic ticketing as a key opportunity to integrate services and improve efficiency. Many of the
examples included multi-mode systems (i.e., bus, subway, and rail) where one could easily transfer and
minimize transfer time. Smartcards were also expected to eventually include loyalty programs for transit users
with customized fares based on usage patterns of the traveler.
• Real-time Travel Information and Commercialization Opportunities – Numerous examples emerged,
similar to those identified in the focus groups, which related to the use of real-time information and GPS
technology on the web, on a Smartphone or transportation hub to help improve control and the travel
experience. This also included the possible use of 5-1-1 hotline service that consolidates transportation
information, traffic and weather. Of note, there was an expectation of an increasing level of commercialization
of the real-time information in terms of integrating shopping, dining and lifestyle opportunities with the travel
information.
Nanos Research City of Ottawa Transportation System ManagementStrategy September 2010 (613) 234-4666 Public Focus Groups and Expert Consultation Report Page 59
• Beware of Long-term Technology Solutions – Because of the rapidity of change in terms of Internet,
Smartphone and application development, opinions were expressed that time horizons for real-time travel
technology solutions should be shorter than usual (three to five years) in order to have agile travel information
systems. Likewise, the market was seen as a more nimble mechanism to staying on the cutting edge in terms of
travel information technology. Controlled partnerships with third party technology solution developers in the
private sector were seen as a means to lessen the burden on municipalities to create the perfect application for
their data.
To follow is a summary of key findings related to each discussion thread.

Nanos Research City of Ottawa Transportation System ManagementStrategy September 2010 (613) 234-4666 Public Focus Groups and Expert Consultation Report Page 60
Information Needs of the Traveling Public
Participants were asked what kind of traveler information they thought the traveling public needed to move around a city more
easily or efficiently. The key thread to all of the discussions was the need for the public to know the best way to get there.
Accessible, real-time information will help the public make route and modal decisions. Many of the participants felt that
having real-time traffic information that was accessible from home and from mobile communications devices was something
the public needs to move around a city more efficiently. Likewise, real-time transit information would also benefit the public, as
the biggest issue with transit is usually the public’s perception of the reliability of service and punctuality. Information
technology is very valuable to those using public transportation as it can help alleviate the fears of being stranded or late. To
that end, another important aspect to collecting this information is to also supply accurate data (that would affect all users of
the road or transit-ways) through commonly used applications like Google Maps. In addition to providing this information
through portable devices, if high-frequency services are not financially feasible in particular areas, real-time information on
next arrivals that is also accessible from home will allow people to plan their trip in advance.
The traveling public will need and expect sophisticated route planning technology that is multi-modal. There was a
particular emphasis on reliable, real-time data that would speak to a ‘whole system’ view. That is, the information needed by
users applies to the entire journey experience – real-time parking availability, real-time transit information, next arrivals,
transfer points, detours, shopping, restaurants, construction, incidents – and how changes to some of these elements could
impact the whole experience of getting from origin to destination. One participant had an analogy for the importance of this
information for drivers: “An air traffic controller would never allow an airplane to take off until there is a confirmed ‘parking
space’ at the destination. The same information should be provided for drivers.” Another participant highlighted the need for
real-time information that applied to other modes:
“When we think of the real-time data we tend to think of road users. People should be able to know in real-time
when the next bus is coming and should have access to information on routes, trips, best travel options, duration of
trips, the costs, etc.”
Nanos Research City of Ottawa Transportation System ManagementStrategy September 2010 (613) 234-4666 Public Focus Groups and Expert Consultation Report Page 61
Technological Advances in Transportation
Overall, many of those consulted indicated that while they did not believe technology would dramatically impact the reasons
people travel around a city, information technology had a role to play in shifting their travel patterns.
Personal mobility devices are a recent technological advance that has been adopted on a worldwide scale. The
evolution of telecommunications technology affected the operating environment for the private and public sector in a relatively
short amount of time. It has provided an opening to develop a number of applications for various services. The advent of
Smartphones that have WiFi or Bluetooth or built-in navigational capabilities like GPS provides a host of opportunities for the
public to access information, as well as for providers to offer new services without significant capital investment.
Cell phones could be used as a complement to traditional detection methods of collecting information on the status
of the road network. A couple of participants described their city’s experiences using cell phones and GPS as a probe to collect
real-time data on the road network. Information about car speed, direction and location is transmitted anonymously to a
control centre. The data can then be extracted and used by traffic operators to better understand the status of traffic and travel
times or the patterns of road users. While this technology is still in the early stages of use, the approach has been found to be a
positive and cost-effective way to collect traffic information and will likely be developed further. It is also a way to potentially
provide real-time road information back to the public.
Advances in geographic positioning systems (GPS) and geographic information system (GIS) have also improved the
way people get around a city. An integration of these two systems could allow for dynamic information of the roads, and
information on travel patterns. In ten years, many cars will be equipped with some form of intelligent vehicle technology. Cars
could transmit information to a server for traffic operators using onboard diagnostics, such as fuel consumption, emissions, etc.
on a second-by-second basis. If fee-for-use model is implemented on roadways, this kind of information could be used to
determine road pricing if that was a public policy choice considered by the city.
With respect to enhancing the public transit experience, the development of contactless “smart” electronic ticketing
has provided new opportunities for integrating services and improving efficiency. For example, in London, the Oyster
system of ticketing has allowed transit users to “load up” their Oyster card through credit cards and online purchases. Moreover,
this technology is a first step at integrating multiple travel systems, by allowing users to travel on the Tube and the rail lines.
This method of ticketing has been a hugely important innovation for the City of London. A similar integrated tickets system is
being adopted in Hong Kong. Vancouver is also considering this kind of system for its buses and the SkyTrain as it would
decrease travel times for travelers and dwell times at stops. In addition to improving efficiency by decreasing travel times, the
data collected through smart-card systems could provide the ability to initiate loyalty programs for transit users, with
customization for fares and routes based on usage patterns.
Nanos Research City of Ottawa Transportation System ManagementStrategy September 2010 (613) 234-4666 Public Focus Groups and Expert Consultation Report Page 62
Changing Needs of the Traveling Public
When asked to describe how they imagined people’s transportation needs would change over the next ten years and why,
there were several common views related to data management and finding ways to accommodate all modes of transportation
in a sustainable way.
Travel data management will become increasingly important to improve the travel experience. The pervasiveness of
sophisticated communications technologies, such as the iPhone, will continually influence the expectation for mobile,
instantaneous and personalized information to improve the travel experience. This would be expected across all modes. The
public will hold information technology to a higher standard and citizen services will change as a result. The expectation will be
for information technology to provide a seamless, practical complement to everyday activities. To that end, most participants
emphasized that activities will stay the same – going to school, going to work, going shopping, etc., – but mobile technology
will play a greater role in planning these activities. As a result of this expectation, public and private sector models for acquiring
and distributing data will likely be further developed. Furthermore, data management specialists who can administer this
volume of data across various applications will become more important for municipal operations.
Increased commercialization was seen as a growing trend. Some of those consulted believed that market and business
principles would play a greater role in government policies related to certain activities. An example that was used by a number
of participants, as a way to improve the traveler experience, was that the integration of information about transportation
activities with shopping or other activities people normally do (for example, a route would be designed on a mobile device or
personal computer with that person’s preferences in mind – shops they are or could be interested in would be highlighted
along that route, as well as locations for other city services or amenities). People could be enticed to choose public transit,
cycling and walking more often if they were aware of how the journey would allow them to easily combine their regular travel
with other activities. This could also lead to potential new revenue streams for a city.
Greater mode transfer from cars to public transit would be likely based on cost. Several of those consulted believed that
it was likely that discretionary income for the majority of people would decrease, and the cost of automobiles and fuel would be
unaffordable for a number of residents. Demand for public transit will likely increase as a result and the supply will have to
meet that demand. There may also be a higher demand for convenient ways to take multi-modal journeys, with a greater
emphasis on amenities like park-and-ride locations, or space for bikes on buses and trains.
Alternate modes of transportation will be important for managing carbon emissions and automobile congestion.
While cars will continue to be prevalent, it is expected that more energy-efficient vehicles would be used. However, the
electrification of the automobile was seen as a key development that would pose new challenges for municipalities. On one
hand, it would result in fewer emissions, but on the other hand, congestion would not be alleviated by electric cars. As one
participant said, “The question that has to be asked when addressing the issue of congestion is not where people are going (i.e.
point A to point B) but where they are expected to move in the future.“ Many participants felt that a host of reasons (cost,

Nanos Research City of Ottawa Transportation System ManagementStrategy September 2010 (613) 234-4666 Public Focus Groups and Expert Consultation Report Page 63
environmental concerns, changing demographics) would necessitate greater use of alternate modes of transportation and that
encouraging alternatives, through means like marketing and infrastructure adjustments, could contribute to making alternate
modes a preferred option in the minds of people trying to get around the city.
Each participant was asked whether there were any technologies or approaches that were no longer meeting the needs of
people getting around a city and were likely to obsolesce based on not meeting those needs.
It was generally agreed upon that carbon-based vehicles would not obsolesce in the near future, although many
thought the single-occupancy vehicle would see a decline as it no longer provides a significant advantage for
travelers, primarily in terms of cost and potentially in terms of road capacity. Others felt that in ten years time, there will
at the very least be more electric motors in vehicles, although these could still be cost-prohibitive for the majority of people.
Travel data information is in high demand and more is needed. A couple of participants emphasized that a broad range of
robust, intelligent technologies are needed to assess the road network in a timely fashion, and a greater importance should be
placed improving data infrastructure throughout the city. While there are costs associated with installing detection
technologies like fiber optic systems, there are various implications associated with having to “catch up” ten years down the
line, as one participant noted. Another consideration mentioned by one of the participants was to strike a balance between
having both technologically robust solutions and those that are more easily updated: “It is important to invest in information
systems that allow for a renewal three to five years into the future. They should spend a little less here and think of information
technologies constantly evolving. Although it is an infrastructure investment, the attitude should be that these technologies
will evolve – they simply are not all built to last.”
Nanos Research City of Ottawa Transportation System ManagementStrategy September 2010 (613) 234-4666 Public Focus Groups and Expert Consultation Report Page 64
Urban Challenges for Transportation
When asked to describe what the primary challenges were for urban cities in terms of transportation, answers varied
considerably based on the participants’ background and experiences. In general, the transportation challenges identified
revolved around infrastructure, sustainability and finding ways to encourage alternate modes of transportation.
The existing car-centric infrastructure was seen as a challenge for enticing people to use other modes, as most road
information caters to vehicles. Finding ways to accommodate all modes within the existing infrastructure can be very
problematic. Most major activity centres such as shopping malls have been set up to have highway or arterial road access which
can make it difficult for non-drivers to access without careful planning or having a relatively short distance to go. Safety and
space for pedestrians and cyclists is therefore also a concern as the road network was designed to move vehicles more
efficiently. One participant said that these groups (cyclists and pedestrians) need to be informed of route changes the same way
that vehicles are because their journeys are affected in the most significant ways in instances of road closures, incidents, or
construction. Targeted information designed to guide pedestrians or cyclists to safe crossings or access points could be useful.
Encouraging sustainable modes of transportation like public transit is also a challenge due to the demand exceeding
the supply of infrastructure. Most cities want to reduce automobile congestion and need to find ways to reduce the public’s
dependency on single-occupancy vehicles. Making public transit or ride sharing the most attractive option for reducing that
dependency relies on better infrastructure support overall (through investments in transit, expanding the transit network,
maintaining the efficiency of entire transit network, state-of-the-art bus or train vehicles with ample space, moving away from
‘fixed’ schedules to real-time information, promoting transit as the less expensive option or the safest option).
There is constant pressure to manage an ever-evolving set of competing functions for a finite amount of space.
Updating some assets or services, which could improve multi-modal travel networks, may be difficult due to a lack of space or
the political will to make investments in transit or other modes of sustainable transportation. Furthermore, as one participant
noted, this challenge is also complicated in that all city roads essentially have two competing, and occasionally complementary,
functions of providing both link functions (i.e. traffic flow or people flow) and place functions (i.e. a public space, commercial
space, historical significance). There are trade-offs to privileging one over the other or when there are interruptions to either.
Nanos Research City of Ottawa Transportation System ManagementStrategy September 2010 (613) 234-4666 Public Focus Groups and Expert Consultation Report Page 65
What Other Cities Do Well
Participants were asked to share their views on what some of the challenges were for a medium or large-sized city in making
traveler information technologies available to the greatest number of people. They were also prompted on which cities
worldwide they felt were leaders in providing information technologies to the traveling public.
One challenge for making information available to the greatest number of people is related to marketing. Branding
the city’s information technology so that the public is aware how to obtain the information that is available to them is a pivotal
piece in adapting to the new telecommunications environment. People rely on mobile tools to get information more than ever
before and it is no longer only automobile drivers who expect updates (via radio, for example). Several cities have opted to
market their available traveler information through easily accessed services like a dedicated website or an N-1-1 hotline
number. Many North American cities, including San Francisco and New York City, have implemented a 5-1-1 hotline telephone
number that consolidates transportation and traffic information, as well as weather conditions. In addition, this particular
number is nationally standardized for traveler information. Using a telephone number to share this information has been
successful for these cities in that the telephone number is simple to use and it satisfies multiple constituencies within a city. It is
accessible to people who do not have internet access or mobile or smart phones. Furthermore, it provides information that
affects all modal travelers. In Vancouver, they have opted to use a website to consolidate traveler information. The website
Travelsmart2010 was originally marketed during the 2010 Olympics as a way to help visitors navigate around the city, but it has
now become the default source for regional traveler information. This website was to some extent a repackaged version of a
previous tool Vancouver’s TransLink had developed called iMove. As a way to capitalize on the public awareness that developed
for TravelSmart during the Olympics, many tools and functions from iMove will now be migrated over to the TravelSmart site.
Understanding how to package data in a way that is accessible to the public was seen as a challenge that most
medium or large sized cities faced but one that can be addressed in a variety of ways. One way to do this is to provide a
service such as a short dial hotline as mentioned above, or to provide other “opt-in” services such as SMS messaging or email
notification on route information, an approach currently being used in London, UK. Many participants believed that if the data
was openly provided, the private sector or third parties would take it upon themselves to develop user-friendly, accessible and
creative applications for this data. To highlight how public agencies can benefit from providing open data, one participant used
the example of a high-school aged boy in Seoul who addressed the challenge of the lack of integrated information between the
various transit and traffic agencies in the city by integrating their shared data to create a sophisticated iPhone application.
These kinds of ‘openings’ for the private sector or third parties developers can take the burden off public agencies to create that
perfect application for their data.

Nanos Research City of Ottawa Transportation System ManagementStrategy September 2010 (613) 234-4666 Public Focus Groups and Expert Consultation Report Page 66
On more than one occasion, the following cities or general locations were mentioned by participants as leaders in
providing information to the traveling public:
Where What they do well
London, United Kingdom • Satellite positioning on their transit network • SMS messaging and email notifications on route • Make use of vehicle and in-house information technology as much as
possible • Supplying more and more open data for app developers • Managing a built-up infrastructure
Paris, France • Managing a built-up infrastructure
San Francisco/ California in general • 5-1-1 consolidated transportation hotline • Route planning information for various modes
Tokyo / Japan in general • Dynamic GPS devices that inform on road and traffic conditions • Transit system information
Portland • Multi-modal information systems • Use transport apps and push traffic information through SMS or social
media
Vancouver • Multi-modal infrastructure and information systems • Coordinate between multiple agencies to improve ITS initiatives
Europe in general • Infrastructure and information systems for various modes • More emphasis on transit or other sustainable modes (but infrastructure
and city planning have necessitated this in some cases) • Use real-time information on parking in many places • Interactive tools like information kiosks – tourism/multiple languages
influence use of easy to use navigation or information tools
Other cities mentioned: Hong Kong, Seoul, Miami, Seattle, Washington DC, New York City, Toronto, Chicago, Singapore, Taipei,
Amsterdam, Sweden (in general).

OTTAWA | TORONTO | VANCOUVER | HALIFAX | CALGARY | WWW.NANOSRESEARCH.COM
Appendix A
Detailed Travel Diary Tabulations

CITY OF OTTAWA TSM STRATEGY – TRAVEL DIARY TABULATIONS
A total of744 trips were logged by 82 individuals between July 25th and August 11th, 2010.
www.nanosresearch.com - Page 1
Statistics
Approx. distance: Number of minutes for
trip: N Valid 742 744
No response 2 0 Mean 10.2990 km 21.5222 minutes
Approx. distance by Purpose
What was the purpose of your trip today? Mean N
Work or related 10.5777 km 83
School 10.8000 km 5
Shopping 6.7939 km 157
Leisure 15.8890 km 132
Medical 10.0167 km 24
Pickup/Drop off 9.1561 km 49
Return home 9.3975 km 236 Other (ex. Banking, Exercise, Church, Dog Walking, Errands)
11.4116 km 56
Total 10.2990 km 742
Approx. distance by Mode
Which mode(s) of transportation did you use for your trip? Number of trips Mean Distance (km)
Automobile driver 358 14.2010 km
Automobile passenger 49 16.0408 km
Public transit 97 11.8188 km
Bicycle 75 6.2267 km
Walking 171 2.6801 km
Assistive mobility device (ex. wheelchair) 5 5.1980 km

CITY OF OTTAWA TSM STRATEGY – TRAVEL DIARY TABULATIONS
A total of744 trips were logged by 82 individuals between July 25th and August 11th, 2010.
www.nanosresearch.com - Page 2
Number of minutes for trip: * What was the purpose of your trip today?
Number of minutes for trip:
What was the purpose of your trip today? Mean N Work or related 23.1506 minutes 83 School 15.0000 minutes 5 Shopping 15.0318 minutes 157 Leisure 27.6894 minutes 132 Medical 23.5833 minutes 24 Pickup/Drop off 18.1837 minutes 49 Return home 20.1139 minutes 237 Other (ex. Banking, Exercise, Church, Dog Walking, Errands) 31.1754 minutes 57 Total 21.5222 minutes 744
Number of minutes for trip: * Automobile driver
Number of minutes for trip:
Automobile driver Mean N
Total 18.7975 minutes 358
Number of minutes for trip: * Automobile passenger
Number of minutes for trip:
Automobile passenger Mean N Std. Deviation Total 29.1429 minutes 49 48.28431 minutes
Number of minutes for trip: * Public transit
Number of minutes for trip:
Public transit Mean N Std. Deviation Total 33.3535 minutes 99 27.24017 minutes
Number of minutes for trip: * Bicycle
Number of minutes for trip:
Bicycle Mean N Std. Deviation Total 20.3200 minutes 75 15.78158 minutes
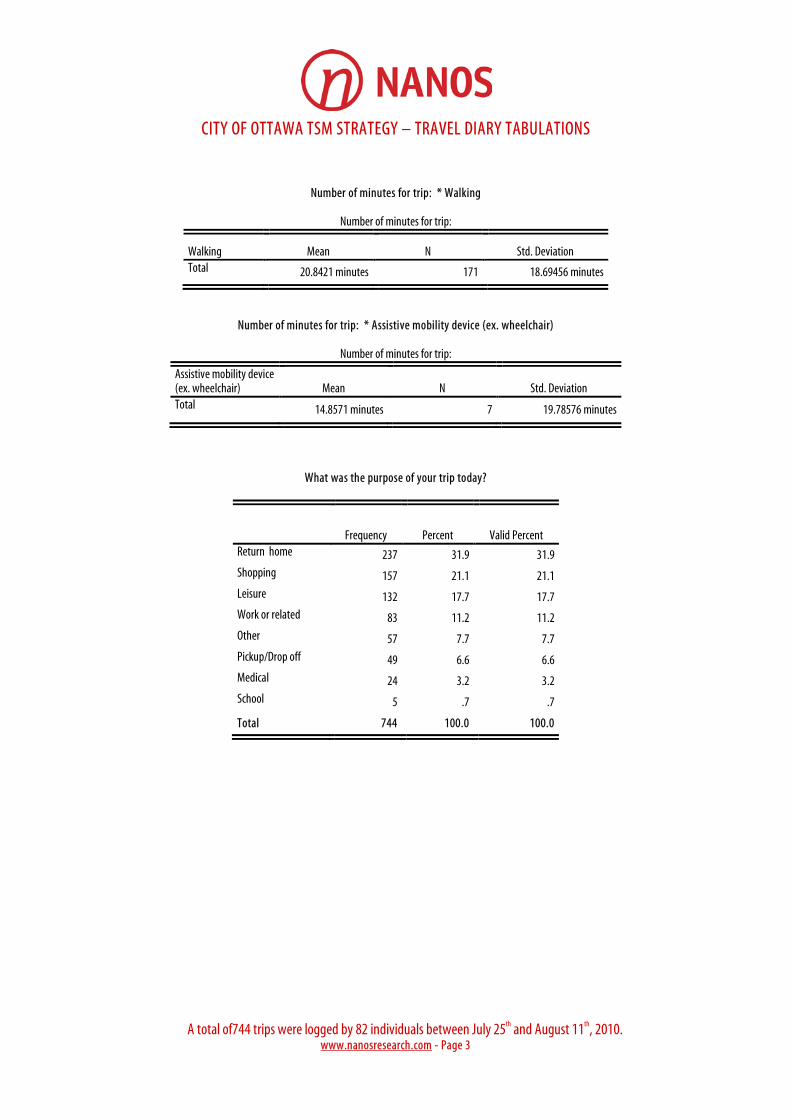
CITY OF OTTAWA TSM STRATEGY – TRAVEL DIARY TABULATIONS
A total of744 trips were logged by 82 individuals between July 25th and August 11th, 2010.
www.nanosresearch.com - Page 3
Number of minutes for trip: * Walking
Number of minutes for trip:
Walking Mean N Std. Deviation Total 20.8421 minutes 171 18.69456 minutes
Number of minutes for trip: * Assistive mobility device (ex. wheelchair)
Number of minutes for trip:
Assistive mobility device (ex. wheelchair) Mean N Std. Deviation Total 14.8571 minutes 7 19.78576 minutes
What was the purpose of your trip today?
Frequency Percent Valid Percent Return home 237 31.9 31.9 Shopping 157 21.1 21.1 Leisure 132 17.7 17.7 Work or related 83 11.2 11.2 Other 57 7.7 7.7 Pickup/Drop off 49 6.6 6.6 Medical 24 3.2 3.2 School 5 .7 .7
Total 744 100.0 100.0
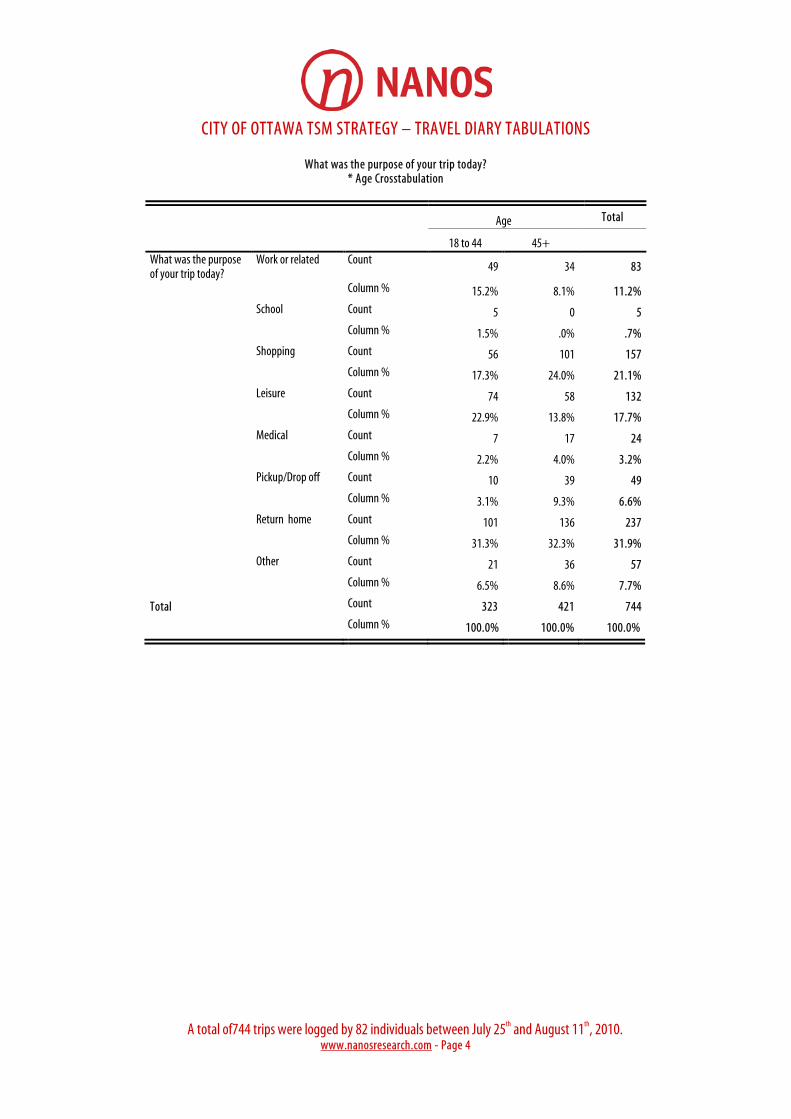
CITY OF OTTAWA TSM STRATEGY – TRAVEL DIARY TABULATIONS
A total of744 trips were logged by 82 individuals between July 25th and August 11th, 2010.
www.nanosresearch.com - Page 4
What was the purpose of your trip today? * Age Crosstabulation
Age Total
18 to 44 45+ What was the purpose of your trip today?
Work or related Count 49 34 83
Column % 15.2% 8.1% 11.2% School Count 5 0 5 Column % 1.5% .0% .7% Shopping Count 56 101 157 Column % 17.3% 24.0% 21.1% Leisure Count 74 58 132 Column % 22.9% 13.8% 17.7% Medical Count 7 17 24 Column % 2.2% 4.0% 3.2% Pickup/Drop off Count 10 39 49 Column % 3.1% 9.3% 6.6% Return home Count 101 136 237 Column % 31.3% 32.3% 31.9% Other Count 21 36 57 Column % 6.5% 8.6% 7.7%
Total Count 323 421 744 Column % 100.0% 100.0% 100.0%

CITY OF OTTAWA TSM STRATEGY – TRAVEL DIARY TABULATIONS
A total of744 trips were logged by 82 individuals between July 25th and August 11th, 2010.
www.nanosresearch.com - Page 5
Did you consult any of the following information sources to help you prepare for your trip? Source Frequencies
Responses
Percent of Cases N Percent Source Map 43 20.1% 24.7%
Weather report 91 42.5% 52.3% Transit schedule 41 19.2% 23.6% Traffic report 25 11.7% 14.4% Other 14 6.5% 8.0%
Total 214 100.0% 123.0%
Mode Frequencies (Multiple Responses)
Responses
Percent of Cases N Percent Mode Auto driver 358 47.2% 48.6%
Auto passenger 49 6.5% 6.6% Public transit 99 13.0% 13.4% Bicycle 75 9.9% 10.2% Walking 171 22.5% 23.2% Assistive mobility device 7 .9% .9%
Total 759 100.0% 103.0%
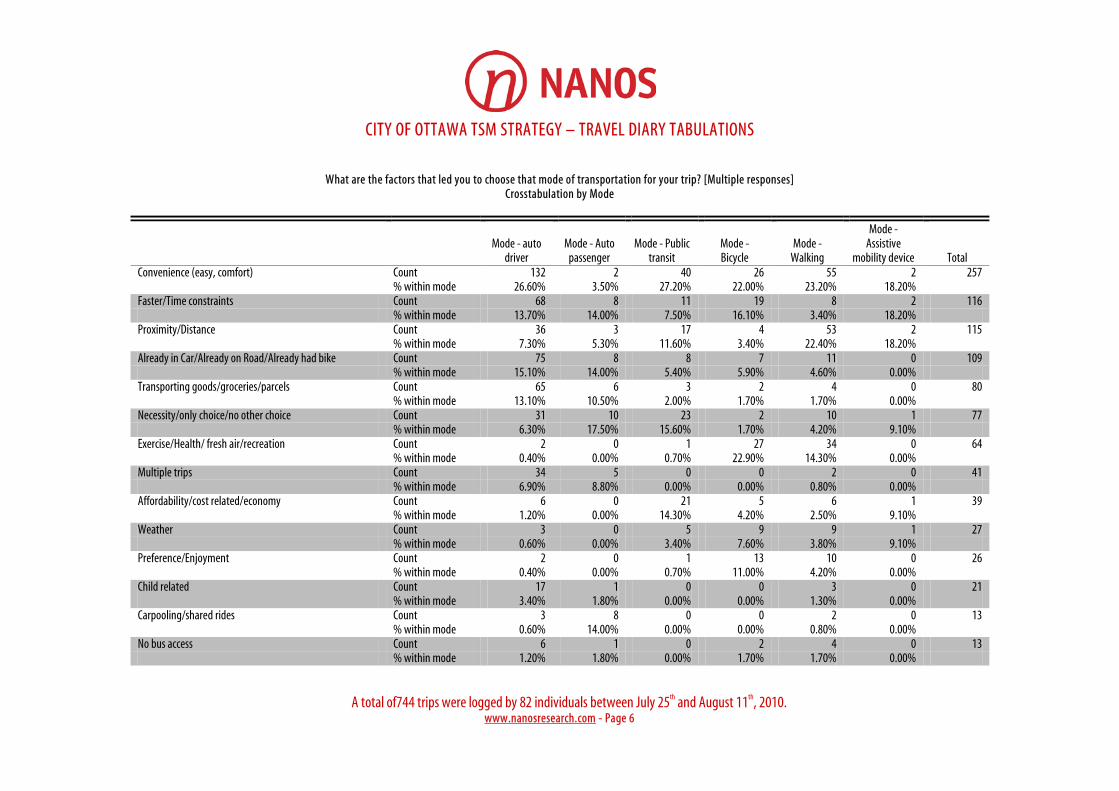
CITY OF OTTAWA TSM STRATEGY – TRAVEL DIARY TABULATIONS
A total of744 trips were logged by 82 individuals between July 25th and August 11th, 2010.
www.nanosresearch.com - Page 6
What are the factors that led you to choose that mode of transportation for your trip? [Multiple responses]
Crosstabulation by Mode
Mode - auto
driver Mode - Auto
passenger Mode - Public
transit Mode - Bicycle
Mode - Walking
Mode - Assistive
mobility device Total Convenience (easy, comfort) Count 132 2 40 26 55 2 257 % within mode 26.60% 3.50% 27.20% 22.00% 23.20% 18.20% Faster/Time constraints Count 68 8 11 19 8 2 116 % within mode 13.70% 14.00% 7.50% 16.10% 3.40% 18.20% Proximity/Distance Count 36 3 17 4 53 2 115 % within mode 7.30% 5.30% 11.60% 3.40% 22.40% 18.20% Already in Car/Already on Road/Already had bike Count 75 8 8 7 11 0 109 % within mode 15.10% 14.00% 5.40% 5.90% 4.60% 0.00% Transporting goods/groceries/parcels Count 65 6 3 2 4 0 80 % within mode 13.10% 10.50% 2.00% 1.70% 1.70% 0.00% Necessity/only choice/no other choice Count 31 10 23 2 10 1 77 % within mode 6.30% 17.50% 15.60% 1.70% 4.20% 9.10% Exercise/Health/ fresh air/recreation Count 2 0 1 27 34 0 64 % within mode 0.40% 0.00% 0.70% 22.90% 14.30% 0.00% Multiple trips Count 34 5 0 0 2 0 41 % within mode 6.90% 8.80% 0.00% 0.00% 0.80% 0.00% Affordability/cost related/economy Count 6 0 21 5 6 1 39 % within mode 1.20% 0.00% 14.30% 4.20% 2.50% 9.10% Weather Count 3 0 5 9 9 1 27 % within mode 0.60% 0.00% 3.40% 7.60% 3.80% 9.10% Preference/Enjoyment Count 2 0 1 13 10 0 26 % within mode 0.40% 0.00% 0.70% 11.00% 4.20% 0.00% Child related Count 17 1 0 0 3 0 21 % within mode 3.40% 1.80% 0.00% 0.00% 1.30% 0.00% Carpooling/shared rides Count 3 8 0 0 2 0 13 % within mode 0.60% 14.00% 0.00% 0.00% 0.80% 0.00% No bus access Count 6 1 0 2 4 0 13 % within mode 1.20% 1.80% 0.00% 1.70% 1.70% 0.00%
CITY OF OTTAWA TSM STRATEGY – TRAVEL DIARY TABULATIONS
A total of744 trips were logged by 82 individuals between July 25th and August 11th, 2010.
www.nanosresearch.com - Page 7
Lack of confidence in Public Transit Count 4 1 1 0 7 0 13 % within mode 0.80% 1.80% 0.70% 0.00% 3.00% 0.00% Walking dog Count 0 0 0 0 9 0 9 % within mode 0.00% 0.00% 0.00% 0.00% 3.80% 0.00% Habit/regular mode Count 3 1 3 0 1 0 8 % within mode 0.60% 1.80% 2.00% 0.00% 0.40% 0.00% Avoiding Traffic/Congestion related Count 0 0 4 1 3 0 8 % within mode 0.00% 0.00% 2.70% 0.80% 1.30% 0.00% Park and Ride/Between bus routes Count 2 0 3 0 2 0 7 % within mode 0.40% 0.00% 2.00% 0.00% 0.80% 0.00% Efficiency Count 3 2 0 0 1 0 6 % within mode 0.60% 3.50% 0.00% 0.00% 0.40% 0.00% Medical related Count 2 1 1 0 1 1 6 % within mode 0.40% 1.80% 0.70% 0.00% 0.40% 9.10% Reliability Count 0 0 3 0 0 1 4 % within mode 0.00% 0.00% 2.00% 0.00% 0.00% 9.10% Familiarity with Public Transit Count 2 0 1 0 0 0 3 % within mode 0.40% 0.00% 0.70% 0.00% 0.00% 0.00% Lack of parking Count 0 0 1 0 1 0 2 % within mode 0.00% 0.00% 0.70% 0.00% 0.40% 0.00% Environment Count 0 0 0 0 1 0 1 % within mode 0.00% 0.00% 0.00% 0.00% 0.40% 0.00% Total Count 496 57 147 117 237 11 1065 % within mode
CITY OF OTTAWA TSM STRATEGY – TRAVEL DIARY TABULATIONS
A total of744 trips were logged by 82 individuals between July 25th and August 11th, 2010.
www.nanosresearch.com - Page 8
What are the factors that led you to choose that mode of transportation for your trip? [Multiple responses] Crosstabulation by Age
Age Total
18 to 44 45+ Convenience (Close to destination, easy, comfort) Count 91 160 251
% within age 20.30% 27.00% Proximity/Distance Count 61 51 112
% within age 13.60% 8.60% Faster/Time constraints Count 48 62 110
% within age 10.70% 10.50% Already in Car/Already on Road/Already had car/already had bike Count 46 62 108
% within age 10.20% 10.50% Transporting goods/groceries/parcels Count 30 49 79 % within age 6.70% 8.30% Necessity/only choice/no other choice Count 24 51 75
% within age 5.30% 8.60% Exercise/Health/ fresh air/recreation Count 36 30 66
% within age 8.00% 5.10% Multiple trips Count 14 27 41 % within age 3.10% 4.60% Affordability/cost related/economy Count 20 15 35
% within age 4.50% 2.50% Weather Count 15 11 26
% within age 3.30% 1.90% Preference/Enjoyment Count 14 12 26
% within age 3.10% 2.00% Lack of confidence in Public Transit Count 7 6 13
% within age 1.60% 1.00% Child related Count 11 10 21
% within age 2.40% 1.70% Carpooling/shared rides Count 5 8 13
% within age 1.10% 1.40% No bus Count 5 7 12
% within age 1.10% 1.20% Walking dog Count 1 8 9
% within age 0.20% 1.40% Avoiding Traffic/Congestion related Count 4 4 8
% within age 0.90% 0.70% Habit/regular mode Count 5 4 9
% within age 1.10% 0.70% Medical related (Ex. cast) Count 3 4 7
% within age 0.70% 0.70% Park and ride/between bus routes Count 3 3 6
% within age 0.70% 0.50% Efficiency Count 1 5 6
% within age 0.20% 0.80% Reliability Count 2 1 3 % within age 0.40% 0.20% Lack of parking Count 2 0 2 % within age 0.40% 0.00% Familiarity with Public Transit Count 0 2 2
% within age 0.00% 0.30% Environment Count 1 0 1
% within age 0.20% 0.00% Total Count 449 592 1041
% within age
CITY OF OTTAWA TSM STRATEGY – TRAVEL DIARY TABULATIONS
A total of744 trips were logged by 82 individuals between July 25th and August 11th, 2010.
www.nanosresearch.com - Page 9
Did you consult any of the following information sources to help you prepare for your trip? (All Information Sources * Mode Crosstabulation)
Source
Mode Total
Auto driver
Auto passenger Public transit Bicycle Walking
Assistive mobility device
Map Count 23 3 10 4 8 0 48
% within mode
29.5% 37.5% 14.1% 13.8% 16.0% .0%
Weather report Count 24 2 20 21 31 0 98
% within mode
30.8% 25.0% 28.2% 72.4% 62.0% .0%
Transit schedule Count 1 0 39 2 7 1 50
% within mode
1.3% .0% 54.9% 6.9% 14.0% 100.0%
Traffic report Count 20 1 2 1 3 0 27
% within mode 25.6% 12.5% 2.8% 3.4% 6.0% .0%
Other Count 10 2 0 1 1 0 14
% within mode
12.8% 25.0% .0% 3.4% 2.0% .0%
Total Count 78 8 71 29 50 1 237
Did you consult any of the following information sources to help you prepare for your trip? (All Information Sources * Purpose Crosstabulation)
Source Work or related School Shopping Leisure Medical
Pickup/ drop off
Return home Other Total
Map Count 7 0 8 13 3 7 5 0 43 Percent 13.7% 0.0% 27.6% 22.4% 25.0% 46.7% 17.9% 0.0% Weather report Count 28 3 9 30 3 2 6 10 91
Percent 54.9% 75.0% 31.0% 51.7% 25.0% 13.3% 21.4% 58.8% Transit schedule
Count 8 0 4 9 5 2 10 3 41
Percent 15.7% 0.0% 13.8% 15.5% 41.7% 13.3% 35.7% 17.6% Traffic schedule Count 7 1 3 2 1 1 6 4 25
Percent 13.7% 25.0% 10.3% 3.4% 8.3% 6.7% 21.4% 23.5% Other Count 1 0 5 4 0 3 1 0 14 Percent 2.0% 0.0% 17.2% 6.9% 0.0% 20.0% 3.6% 0.0% Total 51 4 29 58 12 15 28 17 214
CITY OF OTTAWA TSM STRATEGY – TRAVEL DIARY TABULATIONS
A total of744 trips were logged by 82 individuals between July 25th and August 11th, 2010.
www.nanosresearch.com - Page 10
Did you consult any of the following information sources to help you prepare for your trip? (All Information Sources* Age Crosstabulation)
Age Total
18 to 44 45+
Map Count 18 25 43
% within age 15.8% 25.0%
Weather report Count 58 33 91
% within age 50.9% 33.0%
Transit schedule Count 21 20 41
% within age 18.4% 20.0%
Traffic report Count 12 13 25
% within age 10.5% 13.0%
Other Count 5 9 14
% within age 4.4% 9.0%
Total Count 114 100 214
% within age
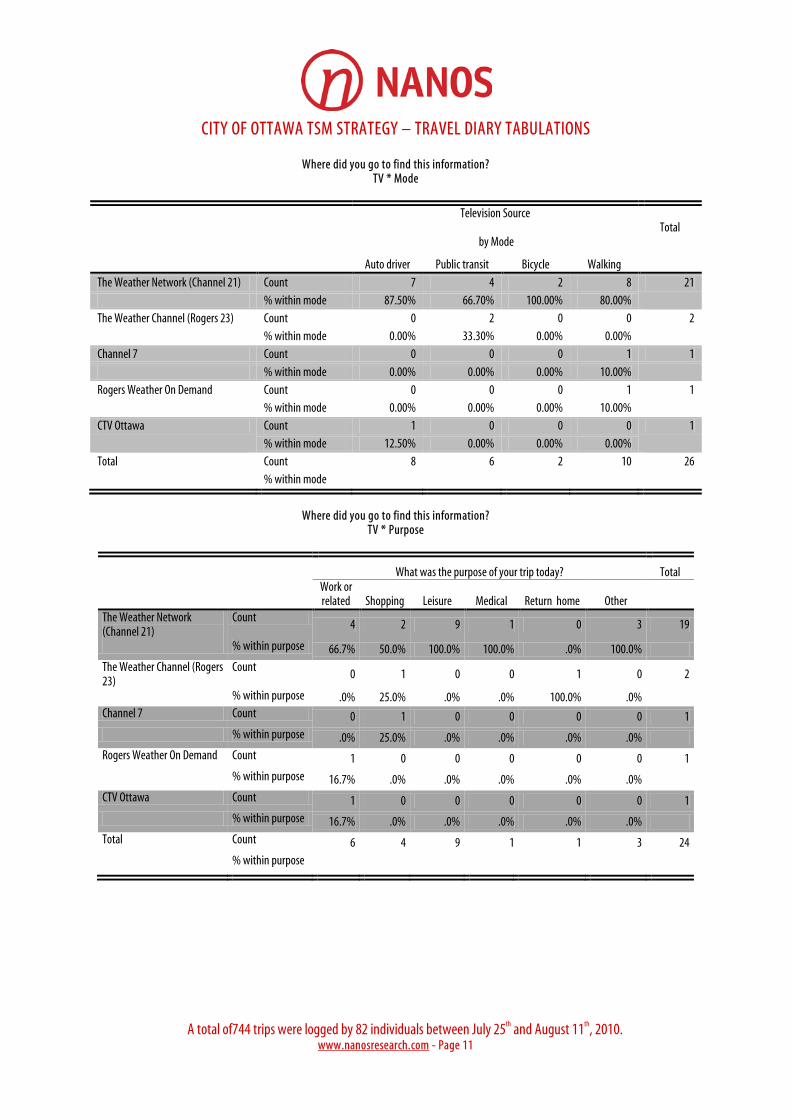
CITY OF OTTAWA TSM STRATEGY – TRAVEL DIARY TABULATIONS
A total of744 trips were logged by 82 individuals between July 25th and August 11th, 2010.
www.nanosresearch.com - Page 11
Where did you go to find this information? TV * Mode
Television Source
by Mode Total
Auto driver Public transit Bicycle Walking The Weather Network (Channel 21) Count 7 4 2 8 21
% within mode 87.50% 66.70% 100.00% 80.00%
The Weather Channel (Rogers 23) Count 0 2 0 0 2
% within mode 0.00% 33.30% 0.00% 0.00%
Channel 7 Count 0 0 0 1 1
% within mode 0.00% 0.00% 0.00% 10.00% Rogers Weather On Demand Count 0 0 0 1 1
% within mode 0.00% 0.00% 0.00% 10.00% CTV Ottawa Count 1 0 0 0 1
% within mode 12.50% 0.00% 0.00% 0.00%
Total Count 8 6 2 10 26
% within mode
Where did you go to find this information?
TV * Purpose
What was the purpose of your trip today? Total
Work or related Shopping Leisure Medical Return home Other
The Weather Network (Channel 21)
Count 4 2 9 1 0 3 19
% within purpose 66.7% 50.0% 100.0% 100.0% .0% 100.0% The Weather Channel (Rogers 23)
Count 0 1 0 0 1 0 2
% within purpose .0% 25.0% .0% .0% 100.0% .0% Channel 7 Count 0 1 0 0 0 0 1 % within purpose .0% 25.0% .0% .0% .0% .0% Rogers Weather On Demand Count 1 0 0 0 0 0 1 % within purpose 16.7% .0% .0% .0% .0% .0% CTV Ottawa Count 1 0 0 0 0 0 1 % within purpose 16.7% .0% .0% .0% .0% .0% Total Count 6 4 9 1 1 3 24 % within purpose

CITY OF OTTAWA TSM STRATEGY – TRAVEL DIARY TABULATIONS
A total of744 trips were logged by 82 individuals between July 25th and August 11th, 2010.
www.nanosresearch.com - Page 12
Where did you go to find this information? TV * Age Crosstabulation
Age Total 18 to 44 45+ The Weather Network (Channel 21) Count 9 10 19 % within age 90.0% 71.4% The Weather Channel (Rogers 23) Count 0 2 2 % within age .0% 14.3%
Channel 7 Count 0 1 1 % within age .0% 7.1% Rogers Weather On Demand Count 1 0 1 % within age 10.0% .0% CTV Ottawa Count 0 1 1 % within age .0% 7.1% Total Count 10 14 24 % within age
Where did you go to find this information? Radio *Mode Crosstabulation
Radio Source
By Mode Total Auto driver Auto passenger Public transit Bicycle Walking CBC Radio Count 6 0 5 1 2 14 % within mode 19.40% 0.00% 100.00% 12.50% 25.00% CFRA Count 11 1 0 4 3 19 % within mode 35.50% 100.00% 0.00% 50.00% 37.50% Hot 88.9 Count 0 0 0 0 1 1 % within mode 0.00% 0.00% 0.00% 0.00% 12.50% Magic 100 Count 3 0 0 0 0 3 % within mode 9.70% 0.00% 0.00% 0.00% 0.00% Live 88.5 Count 3 0 0 1 1 5 % within mode 9.70% 0.00% 0.00% 12.50% 12.50% 99.7 Count 2 0 0 0 0 2 % within mode 6.50% 0.00% 0.00% 0.00% 0.00% Virgin Rock 106.9
Count 0 0 0 2 1 3
% within mode 0.00% 0.00% 0.00% 25.00% 12.50% CHRI 99.1 FM Count 5 0 0 0 0 5 % within mode 16.10% 0.00% 0.00% 0.00% 0.00% Y101 Count 1 0 0 0 0 1 % within mode 3.20% 0.00% 0.00% 0.00% 0.00%
Total Count 31 1 5 8 8 53 % within mode

CITY OF OTTAWA TSM STRATEGY – TRAVEL DIARY TABULATIONS
A total of744 trips were logged by 82 individuals between July 25th and August 11th, 2010.
www.nanosresearch.com - Page 13
Where did you go to find this information? Radio *Purpose Crosstabulation
What was the purpose of your trip today? Total
Work or related School Shopping Leisure Medical
Pickup/Drop off
Return home Other
CBC Radio Count 3 0 1 3 0 3 2 1 13 % within
purpose 25.0% .0% 14.3% 60.0% .0% 75.0% 18.2% 16.7%
CFRA Count 3 0 2 2 0 0 5 4 16 % within
purpose 25.0% .0% 28.6% 40.0% .0% .0% 45.5% 66.7%
Hot 88.9 Count 1 0 0 0 0 0 0 0 1 % within
purpose 8.3% .0% .0% .0% .0% .0% .0% .0%
Magic 100 Count 0 2 1 0 0 0 0 0 3 % within
purpose .0% 100.0% 14.3% .0% .0% .0% .0% .0%
Live 88.5 Count 2 0 1 0 0 0 2 0 5 % within
purpose 16.7% .0% 14.3% .0% .0% .0% 18.2% .0%
99.7 Count 1 0 0 0 0 0 1 0 2 % within
purpose 8.3% .0% .0% .0% .0% .0% 9.1% .0%
Virgin Rock 106.9
Count 2 0 0 0 0 1 0 0 3
% within purpose 16.7% .0% .0% .0% .0% 25.0% .0% .0%
CHRI 99.1 FM Count 0 0 1 0 2 0 1 1 5 % within
purpose .0% .0% 14.3% .0% 100.0% .0% 9.1% 16.7%
Y101 Count 0 0 1 0 0 0 0 0 1 % within
purpose .0% .0% 14.3% .0% .0% .0% .0% .0%
Total Count 12 2 7 5 2 4 11 6 49 % within
purpose
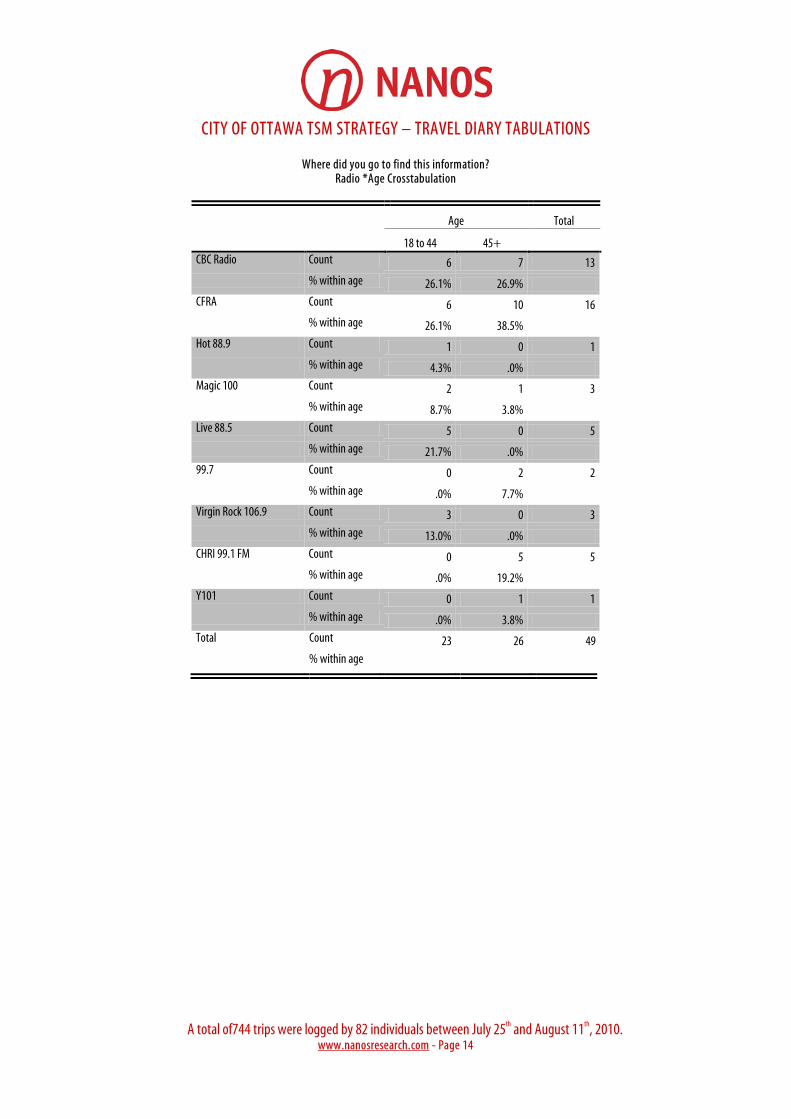
CITY OF OTTAWA TSM STRATEGY – TRAVEL DIARY TABULATIONS
A total of744 trips were logged by 82 individuals between July 25th and August 11th, 2010.
www.nanosresearch.com - Page 14
Where did you go to find this information? Radio *Age Crosstabulation
Age Total
18 to 44 45+ CBC Radio Count 6 7 13 % within age 26.1% 26.9% CFRA Count 6 10 16 % within age 26.1% 38.5% Hot 88.9 Count 1 0 1 % within age 4.3% .0% Magic 100 Count 2 1 3 % within age 8.7% 3.8% Live 88.5 Count 5 0 5 % within age 21.7% .0% 99.7 Count 0 2 2 % within age .0% 7.7% Virgin Rock 106.9 Count 3 0 3 % within age 13.0% .0% CHRI 99.1 FM Count 0 5 5 % within age .0% 19.2% Y101 Count 0 1 1 % within age .0% 3.8% Total Count 23 26 49 % within age
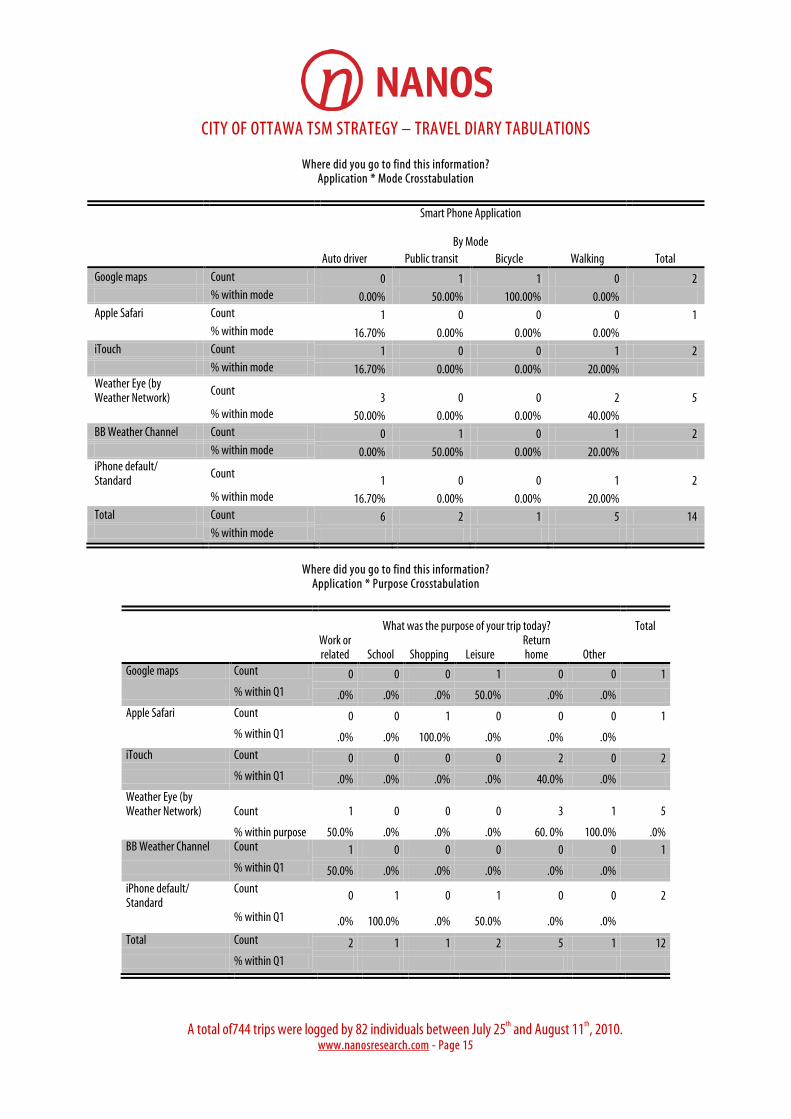
CITY OF OTTAWA TSM STRATEGY – TRAVEL DIARY TABULATIONS
A total of744 trips were logged by 82 individuals between July 25th and August 11th, 2010.
www.nanosresearch.com - Page 15
Where did you go to find this information? Application * Mode Crosstabulation
Smart Phone Application
By Mode Total Auto driver Public transit Bicycle Walking
Google maps Count 0 1 1 0 2 % within mode 0.00% 50.00% 100.00% 0.00% Apple Safari Count 1 0 0 0 1 % within mode 16.70% 0.00% 0.00% 0.00% iTouch Count 1 0 0 1 2 % within mode 16.70% 0.00% 0.00% 20.00% Weather Eye (by Weather Network)
Count 3 0 0 2 5
% within mode 50.00% 0.00% 0.00% 40.00% BB Weather Channel Count 0 1 0 1 2 % within mode 0.00% 50.00% 0.00% 20.00% iPhone default/ Standard
Count 1 0 0 1 2
% within mode 16.70% 0.00% 0.00% 20.00% Total Count 6 2 1 5 14 % within mode
Where did you go to find this information?
Application * Purpose Crosstabulation
What was the purpose of your trip today? Total
Work or related School Shopping Leisure
Return home Other
Google maps Count 0 0 0 1 0 0 1 % within Q1 .0% .0% .0% 50.0% .0% .0% Apple Safari Count 0 0 1 0 0 0 1 % within Q1 .0% .0% 100.0% .0% .0% .0% iTouch Count 0 0 0 0 2 0 2 % within Q1 .0% .0% .0% .0% 40.0% .0% Weather Eye (by Weather Network) Count 1 0 0 0 3 1 5
% within purpose 50.0% .0% .0% .0% 60. 0% 100.0% .0% BB Weather Channel Count 1 0 0 0 0 0 1 % within Q1 50.0% .0% .0% .0% .0% .0% iPhone default/ Standard
Count 0 1 0 1 0 0 2
% within Q1 .0% 100.0% .0% 50.0% .0% .0%
Total Count 2 1 1 2 5 1 12 % within Q1
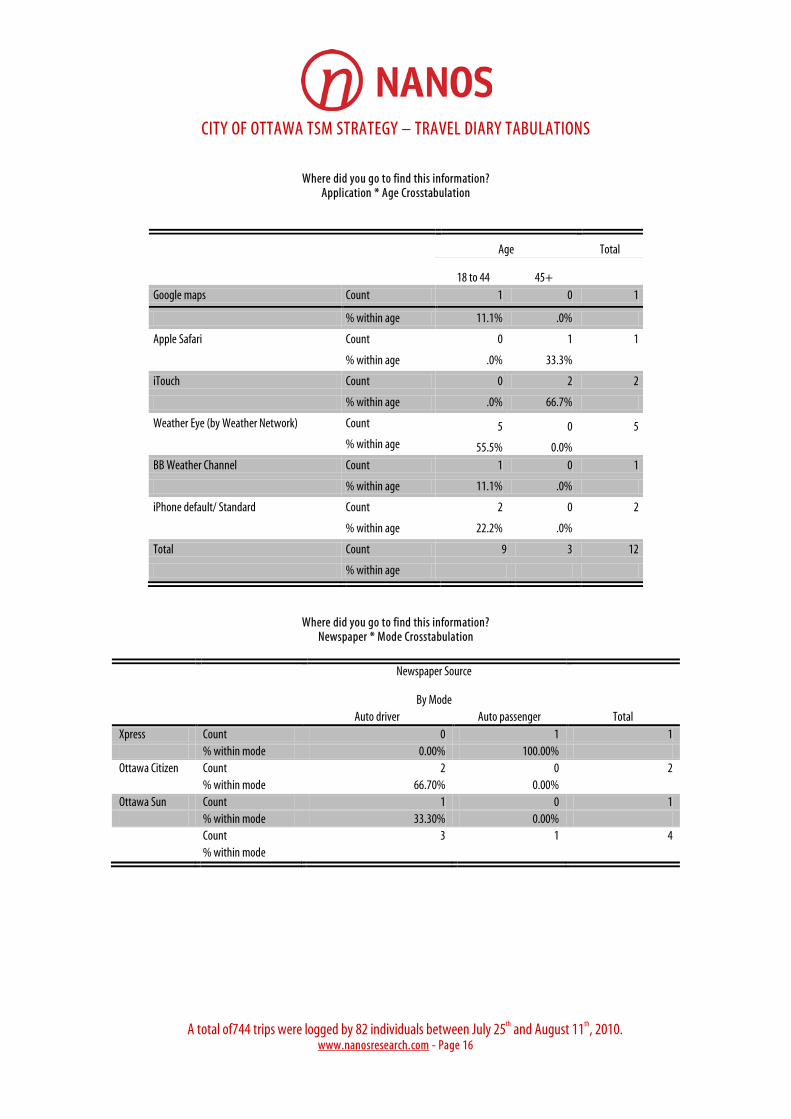
CITY OF OTTAWA TSM STRATEGY – TRAVEL DIARY TABULATIONS
A total of744 trips were logged by 82 individuals between July 25th and August 11th, 2010.
www.nanosresearch.com - Page 16
Where did you go to find this information?
Application * Age Crosstabulation
Age Total
18 to 44 45+ Google maps Count 1 0 1
% within age 11.1% .0%
Apple Safari Count 0 1 1
% within age .0% 33.3%
iTouch Count 0 2 2
% within age .0% 66.7%
Weather Eye (by Weather Network) Count 5 0 5 % within age 55.5% 0.0% BB Weather Channel Count 1 0 1
% within age 11.1% .0%
iPhone default/ Standard Count 2 0 2
% within age 22.2% .0%
Total Count 9 3 12
% within age
Where did you go to find this information? Newspaper * Mode Crosstabulation
Newspaper Source
By Mode Total Auto driver Auto passenger
Xpress Count 0 1 1 % within mode 0.00% 100.00% Ottawa Citizen Count 2 0 2 % within mode 66.70% 0.00% Ottawa Sun Count 1 0 1 % within mode 33.30% 0.00% Count 3 1 4 % within mode
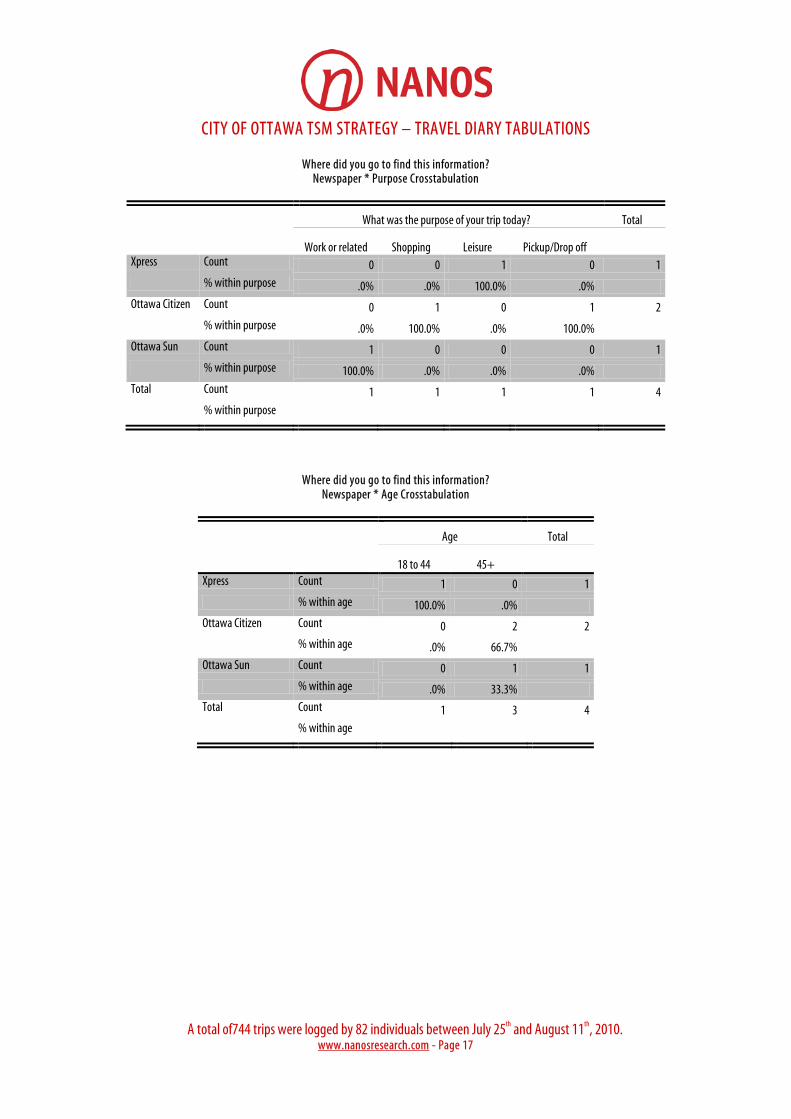
CITY OF OTTAWA TSM STRATEGY – TRAVEL DIARY TABULATIONS
A total of744 trips were logged by 82 individuals between July 25th and August 11th, 2010.
www.nanosresearch.com - Page 17
Where did you go to find this information? Newspaper * Purpose Crosstabulation
What was the purpose of your trip today? Total
Work or related Shopping Leisure Pickup/Drop off Xpress Count 0 0 1 0 1 % within purpose .0% .0% 100.0% .0% Ottawa Citizen Count 0 1 0 1 2 % within purpose .0% 100.0% .0% 100.0% Ottawa Sun Count 1 0 0 0 1
% within purpose 100.0% .0% .0% .0%
Total Count 1 1 1 1 4
% within purpose
Where did you go to find this information? Newspaper * Age Crosstabulation
Age Total
18 to 44 45+ Xpress Count 1 0 1 % within age 100.0% .0% Ottawa Citizen Count 0 2 2 % within age .0% 66.7% Ottawa Sun Count 0 1 1 % within age .0% 33.3% Total Count 1 3 4 % within age
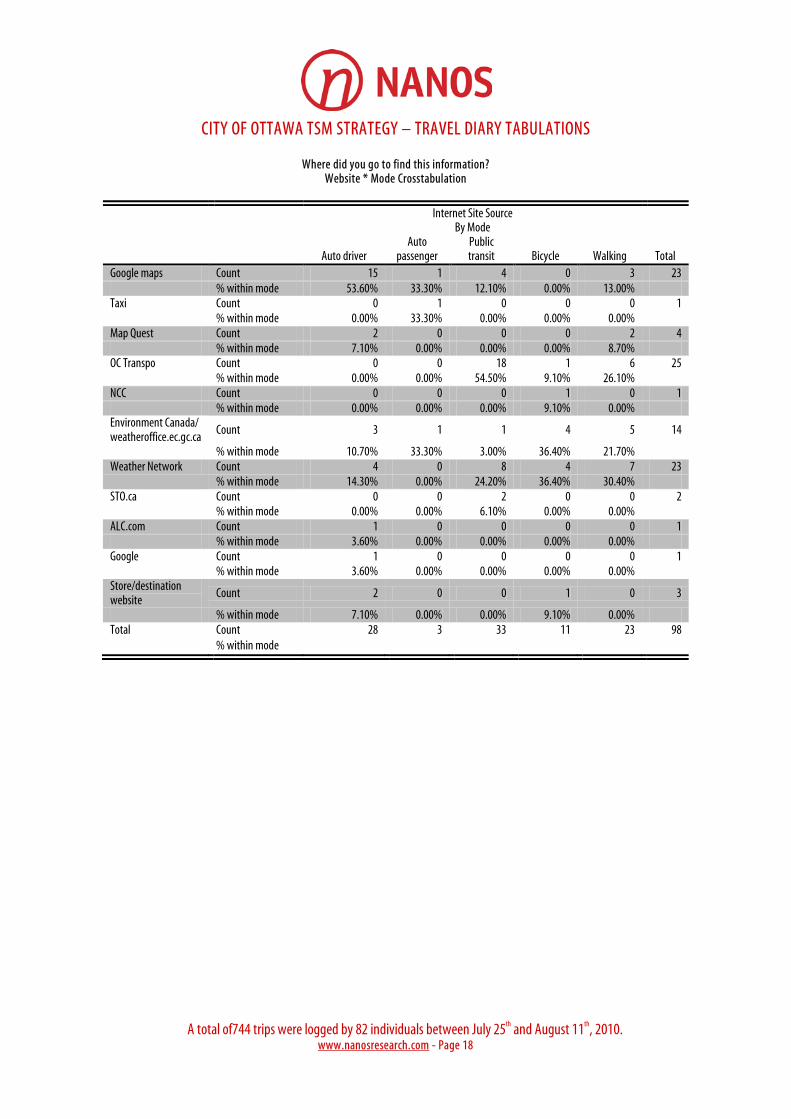
CITY OF OTTAWA TSM STRATEGY – TRAVEL DIARY TABULATIONS
A total of744 trips were logged by 82 individuals between July 25th and August 11th, 2010.
www.nanosresearch.com - Page 18
Where did you go to find this information? Website * Mode Crosstabulation
Internet Site Source
By Mode
Total Auto driver Auto
passenger Public transit Bicycle Walking
Google maps Count 15 1 4 0 3 23 % within mode 53.60% 33.30% 12.10% 0.00% 13.00% Taxi Count 0 1 0 0 0 1 % within mode 0.00% 33.30% 0.00% 0.00% 0.00% Map Quest Count 2 0 0 0 2 4 % within mode 7.10% 0.00% 0.00% 0.00% 8.70% OC Transpo Count 0 0 18 1 6 25 % within mode 0.00% 0.00% 54.50% 9.10% 26.10% NCC Count 0 0 0 1 0 1 % within mode 0.00% 0.00% 0.00% 9.10% 0.00% Environment Canada/ weatheroffice.ec.gc.ca
Count 3 1 1 4 5 14
% within mode 10.70% 33.30% 3.00% 36.40% 21.70%
Weather Network Count 4 0 8 4 7 23
% within mode 14.30% 0.00% 24.20% 36.40% 30.40%
STO.ca Count 0 0 2 0 0 2 % within mode 0.00% 0.00% 6.10% 0.00% 0.00% ALC.com Count 1 0 0 0 0 1 % within mode 3.60% 0.00% 0.00% 0.00% 0.00% Google Count 1 0 0 0 0 1 % within mode 3.60% 0.00% 0.00% 0.00% 0.00% Store/destination website
Count 2 0 0 1 0 3
% within mode 7.10% 0.00% 0.00% 9.10% 0.00% Total Count 28 3 33 11 23 98 % within mode
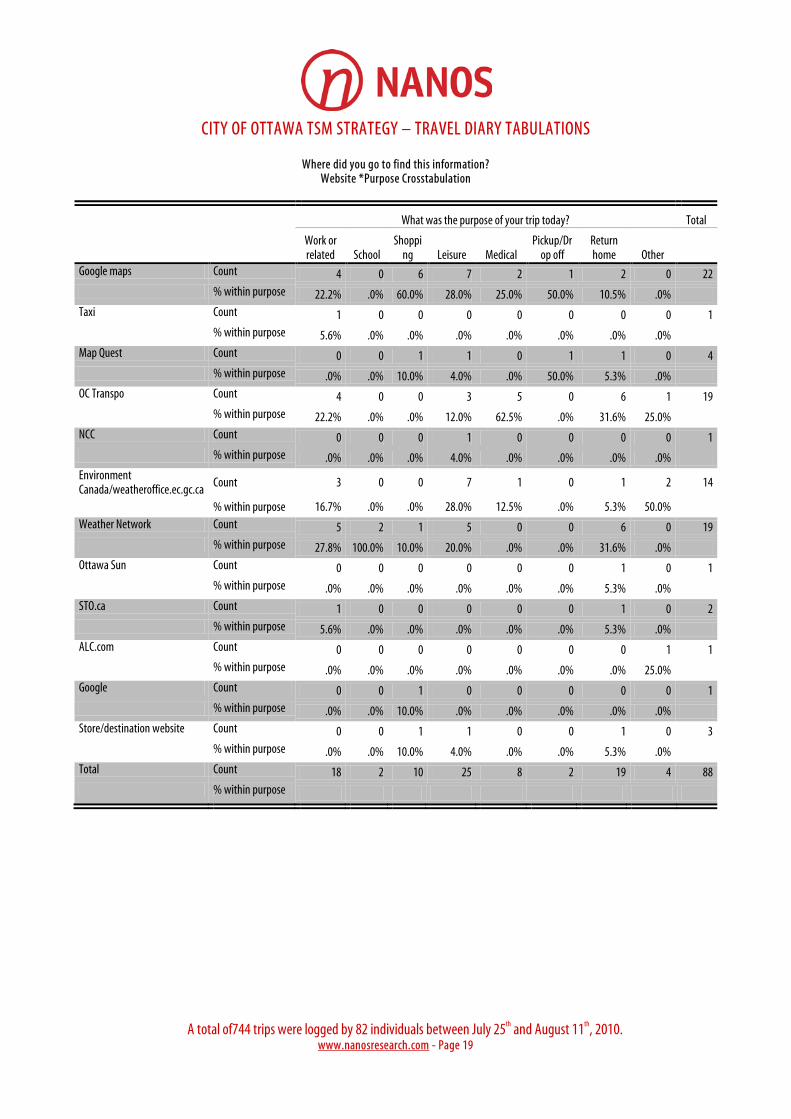
CITY OF OTTAWA TSM STRATEGY – TRAVEL DIARY TABULATIONS
A total of744 trips were logged by 82 individuals between July 25th and August 11th, 2010.
www.nanosresearch.com - Page 19
Where did you go to find this information? Website *Purpose Crosstabulation
What was the purpose of your trip today? Total
Work or related School
Shopping Leisure Medical
Pickup/Drop off
Return home Other
Google maps Count 4 0 6 7 2 1 2 0 22 % within purpose 22.2% .0% 60.0% 28.0% 25.0% 50.0% 10.5% .0% Taxi Count 1 0 0 0 0 0 0 0 1 % within purpose 5.6% .0% .0% .0% .0% .0% .0% .0% Map Quest Count 0 0 1 1 0 1 1 0 4 % within purpose .0% .0% 10.0% 4.0% .0% 50.0% 5.3% .0% OC Transpo Count 4 0 0 3 5 0 6 1 19 % within purpose 22.2% .0% .0% 12.0% 62.5% .0% 31.6% 25.0% NCC Count 0 0 0 1 0 0 0 0 1 % within purpose .0% .0% .0% 4.0% .0% .0% .0% .0% Environment Canada/weatheroffice.ec.gc.ca
Count 3 0 0 7 1 0 1 2 14
% within purpose 16.7% .0% .0% 28.0% 12.5% .0% 5.3% 50.0% Weather Network Count 5 2 1 5 0 0 6 0 19 % within purpose 27.8% 100.0% 10.0% 20.0% .0% .0% 31.6% .0% Ottawa Sun Count 0 0 0 0 0 0 1 0 1 % within purpose .0% .0% .0% .0% .0% .0% 5.3% .0% STO.ca Count 1 0 0 0 0 0 1 0 2 % within purpose 5.6% .0% .0% .0% .0% .0% 5.3% .0% ALC.com Count 0 0 0 0 0 0 0 1 1 % within purpose .0% .0% .0% .0% .0% .0% .0% 25.0% Google Count 0 0 1 0 0 0 0 0 1 % within purpose .0% .0% 10.0% .0% .0% .0% .0% .0% Store/destination website Count 0 0 1 1 0 0 1 0 3 % within purpose .0% .0% 10.0% 4.0% .0% .0% 5.3% .0% Total Count 18 2 10 25 8 2 19 4 88 % within purpose

CITY OF OTTAWA TSM STRATEGY – TRAVEL DIARY TABULATIONS
A total of744 trips were logged by 82 individuals between July 25th and August 11th, 2010.
www.nanosresearch.com - Page 20
Where did you go to find this information? Website * Age Crosstabulation
Age Total 18 to 44 45+ Google maps Count 11 11 22 % within age 16.9% 47.8% Taxi Count 1 0 1 % within age 1.5% .0% Map Quest Count 1 3 4 % within age 1.5% 13.0% OC Transpo Count 14 5 19 % within age 21.5% 21.7% NCC Count 1 0 1 % within age 1.5% .0% Environment Canada/weatheroffice.ec.gc.ca Count 11 3 14
% within age 16.9% 13.0% Weather Network Count 19 0 19 % within age 29.2% .0% Ottawa Sun Count 1 0 1 % within age 1.5% .0% STO.ca Count 2 0 2 % within age 3.1% .0% ALC.com Count 1 0 1 % within age 1.5% .0% Google Count 1 0 1 % within age 1.5% .0% Store/destination website Count 2 1 3 % within age 3.1% 4.3% Total Count 65 23 88 % within age
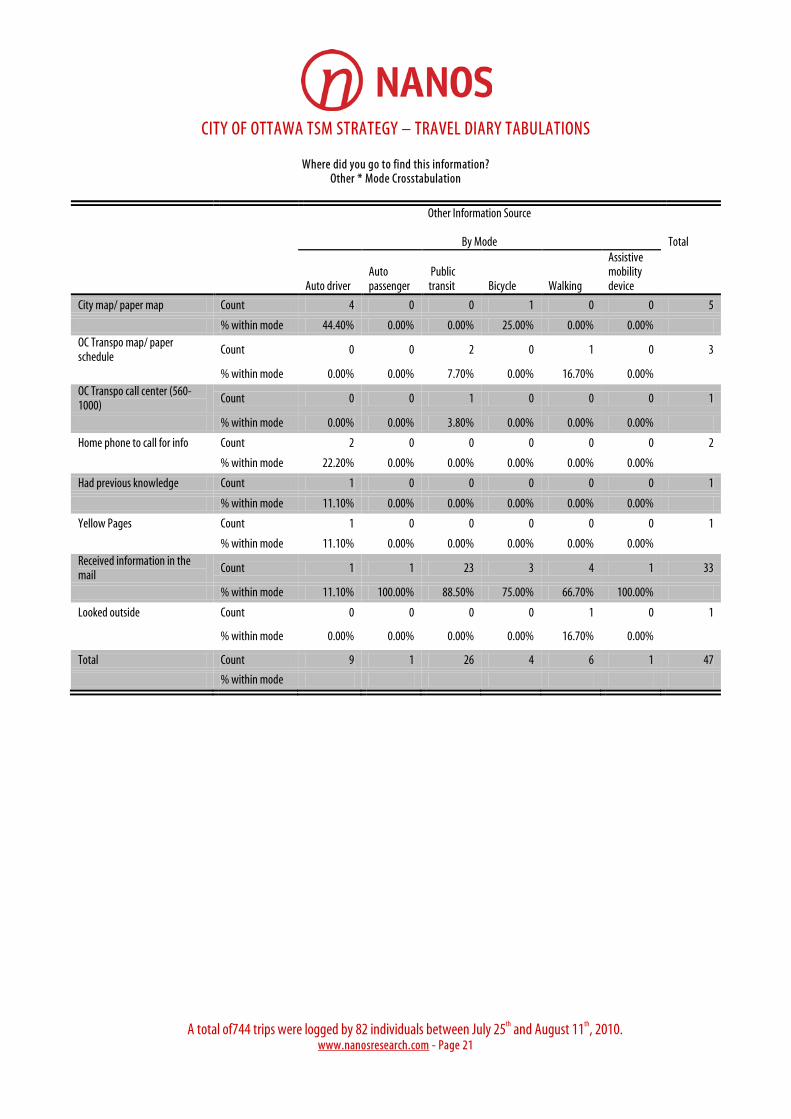
CITY OF OTTAWA TSM STRATEGY – TRAVEL DIARY TABULATIONS
A total of744 trips were logged by 82 individuals between July 25th and August 11th, 2010.
www.nanosresearch.com - Page 21
Where did you go to find this information? Other * Mode Crosstabulation
Other Information Source
By Mode Total
Auto driver Auto passenger
Public transit Bicycle Walking
Assistive mobility device
City map/ paper map Count 4 0 0 1 0 0 5
% within mode 44.40% 0.00% 0.00% 25.00% 0.00% 0.00% OC Transpo map/ paper schedule
Count 0 0 2 0 1 0 3
% within mode 0.00% 0.00% 7.70% 0.00% 16.70% 0.00% OC Transpo call center (560-1000)
Count 0 0 1 0 0 0 1
% within mode 0.00% 0.00% 3.80% 0.00% 0.00% 0.00%
Home phone to call for info Count 2 0 0 0 0 0 2
% within mode 22.20% 0.00% 0.00% 0.00% 0.00% 0.00%
Had previous knowledge Count 1 0 0 0 0 0 1
% within mode 11.10% 0.00% 0.00% 0.00% 0.00% 0.00%
Yellow Pages Count 1 0 0 0 0 0 1
% within mode 11.10% 0.00% 0.00% 0.00% 0.00% 0.00% Received information in the mail
Count 1 1 23 3 4 1 33
% within mode 11.10% 100.00% 88.50% 75.00% 66.70% 100.00%
Looked outside Count 0 0 0 0 1 0 1
% within mode 0.00% 0.00% 0.00% 0.00% 16.70% 0.00%
Total Count 9 1 26 4 6 1 47
% within mode
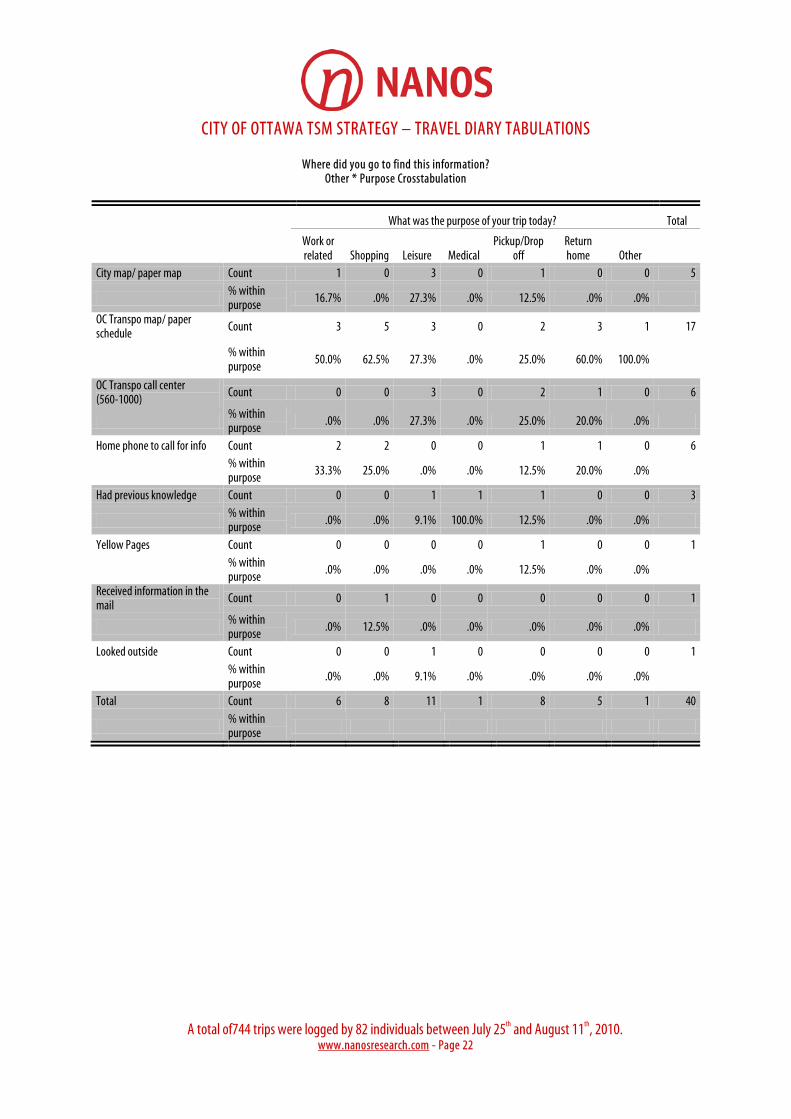
CITY OF OTTAWA TSM STRATEGY – TRAVEL DIARY TABULATIONS
A total of744 trips were logged by 82 individuals between July 25th and August 11th, 2010.
www.nanosresearch.com - Page 22
Where did you go to find this information? Other * Purpose Crosstabulation
What was the purpose of your trip today? Total
Work or related Shopping Leisure Medical
Pickup/Drop off
Return home Other
City map/ paper map Count 1 0 3 0 1 0 0 5
% within purpose 16.7% .0% 27.3% .0% 12.5% .0% .0%
OC Transpo map/ paper schedule Count 3 5 3 0 2 3 1 17
% within purpose
50.0% 62.5% 27.3% .0% 25.0% 60.0% 100.0%
OC Transpo call center (560-1000)
Count 0 0 3 0 2 1 0 6
% within purpose
.0% .0% 27.3% .0% 25.0% 20.0% .0%
Home phone to call for info Count 2 2 0 0 1 1 0 6
% within purpose
33.3% 25.0% .0% .0% 12.5% 20.0% .0%
Had previous knowledge Count 0 0 1 1 1 0 0 3
% within purpose .0% .0% 9.1% 100.0% 12.5% .0% .0%
Yellow Pages Count 0 0 0 0 1 0 0 1
% within purpose
.0% .0% .0% .0% 12.5% .0% .0%
Received information in the mail
Count 0 1 0 0 0 0 0 1
% within purpose
.0% 12.5% .0% .0% .0% .0% .0%
Looked outside Count 0 0 1 0 0 0 0 1
% within purpose
.0% .0% 9.1% .0% .0% .0% .0%
Total Count 6 8 11 1 8 5 1 40
% within purpose

CITY OF OTTAWA TSM STRATEGY – TRAVEL DIARY TABULATIONS
A total of744 trips were logged by 82 individuals between July 25th and August 11th, 2010.
www.nanosresearch.com - Page 23
Where did you go to find this information? Other *Age Crosstabulation
Age Total
18 to 44 45+
City map/ paper map Count 0 5 5
% within age .0% 17.2%
OC Transpo map/ paper schedule Count 4 13 17
% within age 36.4% 44.8%
OC Transpo call center (560-1000) Count 3 3 6
% within age 27.3% 10.3%
Home phone to call for info Count 2 4 6
% within age 18.2% 13.8%
Had previous knowledge Count 1 2 3
% within age 9.1% 6.9%
Yellow Pages Count 0 1 1
% within age .0% 3.4%
Received information in the mail Count 0 1 1
% within age .0% 3.4%
Looked outside Count 1 0 1
% within age 9.1% .0%
Total Count 11 29 40
% within age
Did you encounter any challenges or travel issues which affected your trip?
Frequency Percent Valid Percent Valid Yes 139 18.7 18.7 No 605 81.3 81.3 Total 744 100.0 100.0
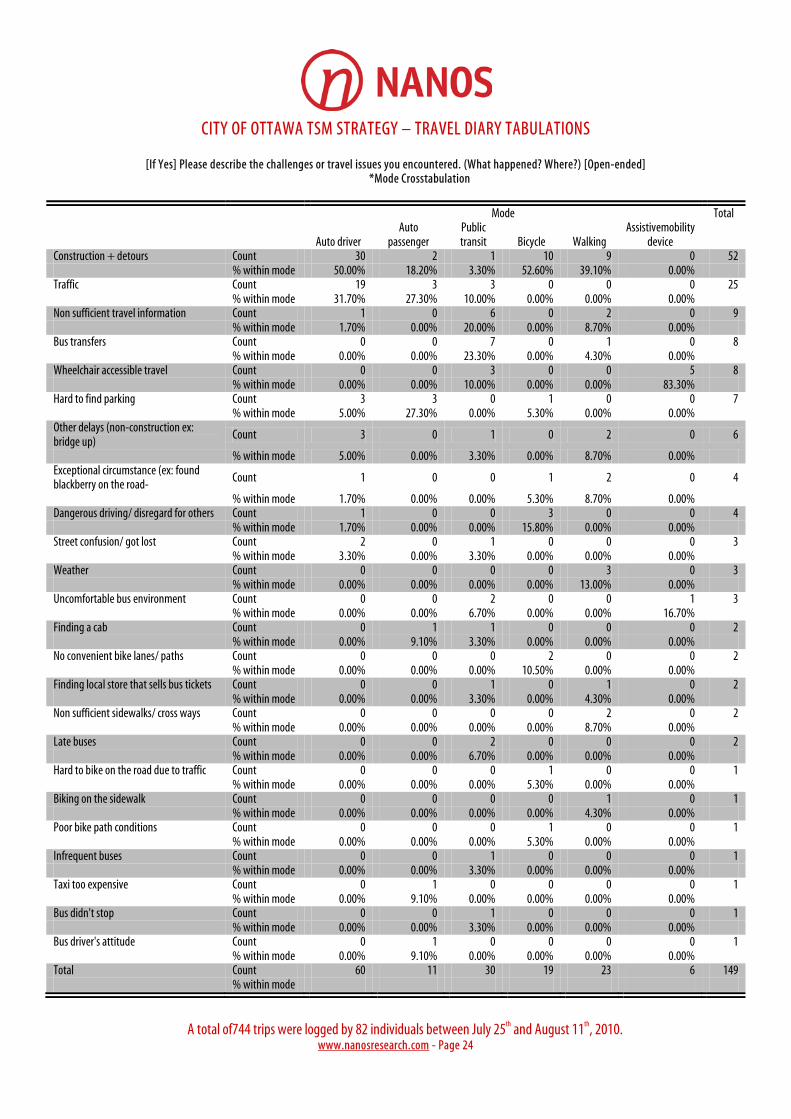
CITY OF OTTAWA TSM STRATEGY – TRAVEL DIARY TABULATIONS
A total of744 trips were logged by 82 individuals between July 25th and August 11th, 2010.
www.nanosresearch.com - Page 24
[If Yes] Please describe the challenges or travel issues you encountered. (What happened? Where?) [Open-ended] *Mode Crosstabulation
Mode Total
Auto driver Auto
passenger Public transit Bicycle Walking
Assistivemobility device
Construction + detours Count 30 2 1 10 9 0 52 % within mode 50.00% 18.20% 3.30% 52.60% 39.10% 0.00% Traffic Count 19 3 3 0 0 0 25 % within mode 31.70% 27.30% 10.00% 0.00% 0.00% 0.00% Non sufficient travel information Count 1 0 6 0 2 0 9 % within mode 1.70% 0.00% 20.00% 0.00% 8.70% 0.00% Bus transfers Count 0 0 7 0 1 0 8 % within mode 0.00% 0.00% 23.30% 0.00% 4.30% 0.00% Wheelchair accessible travel Count 0 0 3 0 0 5 8 % within mode 0.00% 0.00% 10.00% 0.00% 0.00% 83.30% Hard to find parking Count 3 3 0 1 0 0 7 % within mode 5.00% 27.30% 0.00% 5.30% 0.00% 0.00% Other delays (non-construction ex: bridge up)
Count 3 0 1 0 2 0 6
% within mode 5.00% 0.00% 3.30% 0.00% 8.70% 0.00% Exceptional circumstance (ex: found blackberry on the road- Count 1 0 0 1 2 0 4
% within mode 1.70% 0.00% 0.00% 5.30% 8.70% 0.00% Dangerous driving/ disregard for others Count 1 0 0 3 0 0 4 % within mode 1.70% 0.00% 0.00% 15.80% 0.00% 0.00% Street confusion/ got lost Count 2 0 1 0 0 0 3 % within mode 3.30% 0.00% 3.30% 0.00% 0.00% 0.00% Weather Count 0 0 0 0 3 0 3 % within mode 0.00% 0.00% 0.00% 0.00% 13.00% 0.00% Uncomfortable bus environment Count 0 0 2 0 0 1 3 % within mode 0.00% 0.00% 6.70% 0.00% 0.00% 16.70% Finding a cab Count 0 1 1 0 0 0 2 % within mode 0.00% 9.10% 3.30% 0.00% 0.00% 0.00% No convenient bike lanes/ paths Count 0 0 0 2 0 0 2 % within mode 0.00% 0.00% 0.00% 10.50% 0.00% 0.00% Finding local store that sells bus tickets Count 0 0 1 0 1 0 2 % within mode 0.00% 0.00% 3.30% 0.00% 4.30% 0.00% Non sufficient sidewalks/ cross ways Count 0 0 0 0 2 0 2 % within mode 0.00% 0.00% 0.00% 0.00% 8.70% 0.00% Late buses Count 0 0 2 0 0 0 2 % within mode 0.00% 0.00% 6.70% 0.00% 0.00% 0.00% Hard to bike on the road due to traffic Count 0 0 0 1 0 0 1 % within mode 0.00% 0.00% 0.00% 5.30% 0.00% 0.00% Biking on the sidewalk Count 0 0 0 0 1 0 1 % within mode 0.00% 0.00% 0.00% 0.00% 4.30% 0.00% Poor bike path conditions Count 0 0 0 1 0 0 1 % within mode 0.00% 0.00% 0.00% 5.30% 0.00% 0.00% Infrequent buses Count 0 0 1 0 0 0 1 % within mode 0.00% 0.00% 3.30% 0.00% 0.00% 0.00% Taxi too expensive Count 0 1 0 0 0 0 1 % within mode 0.00% 9.10% 0.00% 0.00% 0.00% 0.00% Bus didn't stop Count 0 0 1 0 0 0 1 % within mode 0.00% 0.00% 3.30% 0.00% 0.00% 0.00% Bus driver's attitude Count 0 1 0 0 0 0 1 % within mode 0.00% 9.10% 0.00% 0.00% 0.00% 0.00% Total Count 60 11 30 19 23 6 149 % within mode

CITY OF OTTAWA TSM STRATEGY – TRAVEL DIARY TABULATIONS
A total of744 trips were logged by 82 individuals between July 25th and August 11th, 2010.
www.nanosresearch.com - Page 25
[If Yes] Please describe the challenges or travel issues you encountered. (What happened? Where?) [Open-ended] *Age Crosstabulation
Age Total 18 to 44 45+ Construction and detours Count 20 31 51 % within age 34.50% 37.30% Traffic Count 13 12 25 % within age 22.40% 14.50% Insufficient travel information Count 0 8 8 % within age 0.00% 9.60% Bus transfers Count 0 7 7 % within age 0.00% 8.40% Hard to find parking Count 1 6 7 % within age 1.70% 7.20% Delays (non-construction ex: bridge up) Count 1 4 5 % within age 1.70% 4.80% Wheelchair accessible travel Count 0 5 5 % within age 0.00% 6.00% Exceptional circumstance (ex: found blackberry on the road- Count 2 2 4 % within age 3.40% 2.40% Dangerous driving/ disregard for others Count 3 1 4 % within age 5.20% 1.20% Street confusion/ got lost Count 2 1 3 % within age 3.40% 1.20% Weather Count 2 1 3 % within age 3.40% 1.20% Finding a cab Count 2 0 2 % within age 3.40% 0.00% In sufficient sidewalks/ cross ways Count 2 0 2 % within age 3.40% 0.00% Late buses Count 2 0 2 % within age 3.40% 0.00% No convenient bikelanes/ paths Count 1 1 2 % within age 1.70% 1.20% Uncomfortable bus environment Count 1 1 2 % within age 1.70% 1.20% Biking on the sidewalk Count 1 0 1 % within age 1.70% 0.00% Bus didn't stop Count 1 0 1 % within age 1.70% 0.00% Bus driver's attitude Count 0 1 1 % within age 0.00% 1.20% Hard to bike on the road due to traffic Count 1 0 1 % within age 1.70% 0.00% Problems with cab drivers Count 0 1 1 % within age 0.00% 1.20% Poor bike path conditions Count 1 0 1 % within age 1.70% 0.00% Finding local store that sells bus tickets Count 1 0 1 % within age 1.70% 0.00% Infrequent buses Count 0 1 1 % within age 0.00% 1.20% Taxi too expensive Count 1 0 1 % within age 1.70% 0.00%
Total Count 58 83 141 % within age
Do you think there is any information or service that you could have received which would have made your trip better?
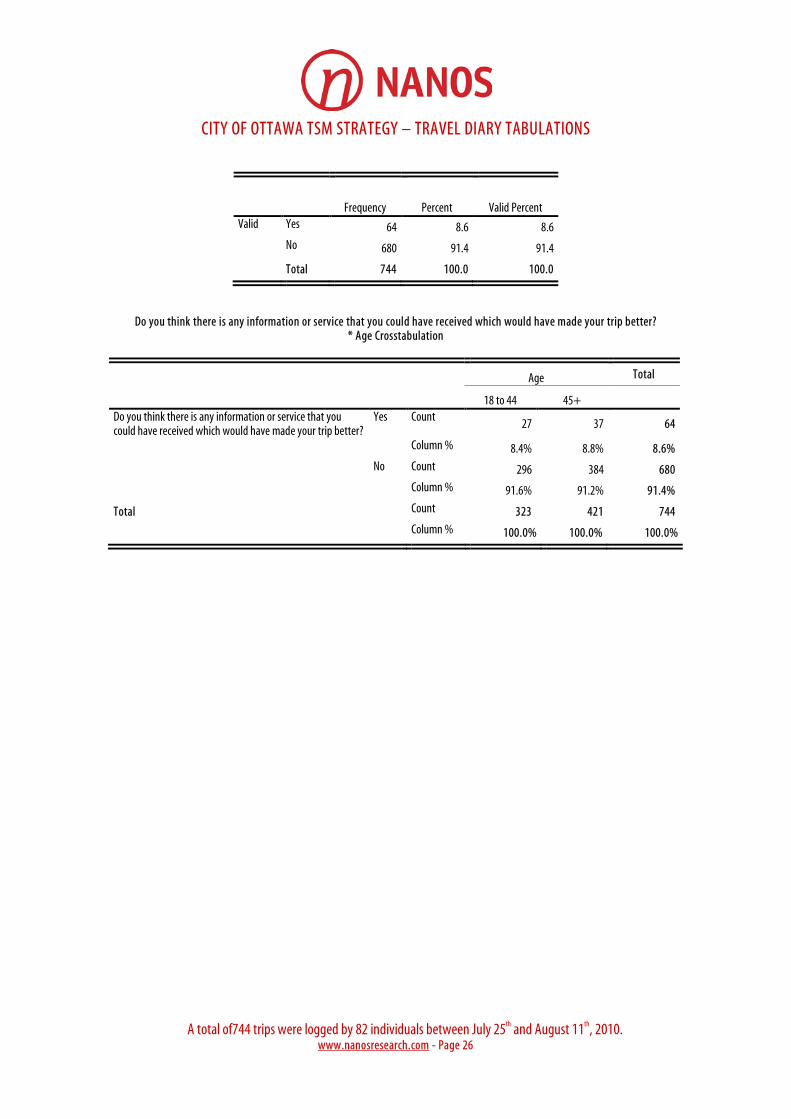
CITY OF OTTAWA TSM STRATEGY – TRAVEL DIARY TABULATIONS
A total of744 trips were logged by 82 individuals between July 25th and August 11th, 2010.
www.nanosresearch.com - Page 26
Frequency Percent Valid Percent Valid Yes 64 8.6 8.6 No 680 91.4 91.4 Total 744 100.0 100.0
Do you think there is any information or service that you could have received which would have made your trip better? * Age Crosstabulation
Age Total
18 to 44 45+ Do you think there is any information or service that you could have received which would have made your trip better?
Yes Count 27 37 64
Column % 8.4% 8.8% 8.6% No Count 296 384 680 Column % 91.6% 91.2% 91.4%
Total Count 323 421 744 Column % 100.0% 100.0% 100.0%

CITY OF OTTAWA TSM STRATEGY – TRAVEL DIARY TABULATIONS
A total of744 trips were logged by 82 individuals between July 25th and August 11th, 2010.
www.nanosresearch.com - Page 27
[If Yes] Please describe [Mode Crosstabulation]
Mode Total
Auto driver
Auto passenger
Public transit Bicycle Walking
Assistive mobility device
Traffic report/maps with up to date information on traffic congestion/ construction/detours
Count 10 2 3 0 5 0 20 % within mode 50.00% 40.00% 16.70% 0.00% 50.00% 0.00%
Improving Bike lanes/ paths to make them more accessible/
Count 0 0 0 9 0 0 9
% within mode 0.00% 0.00% 0.00% 81.80% 0.00% 0.00%
Improved bus drivers (ex: calling out stops/ driving skills)
Count 0 0 4 0 0 4 8
% within mode 0.00% 0.00% 22.20% 0.00% 0.00% 66.70% Efficient road signs with up to date information on traffic/
Count 3 3 0 0 1 0 7
% within mode 15.00% 60.00% 0.00% 0.00% 10.00% 0.00%
More specific bus schedule information from OC Transpo (ex: real time information at stops)
Count 1 0 5 0 1 0 7
% within mode 5.00% 0.00% 27.80% 0.00% 10.00% 0.00%
Light Rail System Count 0 0 1 1 0 1 3 % within mode 0.00% 0.00% 5.60% 9.10% 0.00% 16.70% Information on local gas stations with the best prices
Count 2 0 0 0 0 0 2
% within mode 10.00% 0.00% 0.00% 0.00% 0.00% 0.00% Different/ more bus route options Count 1 0 1 0 0 0 2 % within mode 5.00% 0.00% 5.60% 0.00% 0.00% 0.00% A change in bus schedules Count 0 0 2 0 0 0 2 % within mode 0.00% 0.00% 11.10% 0.00% 0.00% 0.00% Information on street parking/ parking lots Count 1 0 0 0 1 0 2 % within mode 5.00% 0.00% 0.00% 0.00% 10.00% 0.00%
More ‘stop’ signals on bus in accessible places Count 0 0 1 0 0 0 1 % within mode 0.00% 0.00% 5.60% 0.00% 0.00% 0.00%
Other modes of transportation Count 0 0 0 0 1 0 1 % within mode 0.00% 0.00% 0.00% 0.00% 10.00% 0.00% More frequent weekend bus trips Count 0 0 1 0 0 0 1 % within mode 0.00% 0.00% 5.60% 0.00% 0.00% 0.00% Report on pathway conditions Count 0 0 0 1 0 0 1 % within mode 0.00% 0.00% 0.00% 9.10% 0.00% 0.00% Need more traffic signs (ex: stop signs) Count 0 0 0 0 1 0 1 % within mode 0.00% 0.00% 0.00% 0.00% 10.00% 0.00% Improved sidewalks Count 0 0 0 0 0 1 1 % within mode 0.00% 0.00% 0.00% 0.00% 0.00% 16.70% Effort to try not to interrupt traffic during peak hours Count 1 0 0 0 0 0 1 % within mode 5.00% 0.00% 0.00% 0.00% 0.00% 0.00% Knowing the schedule for construction sites (start and completion)
Count 1 0 0 0 0 0 1
% within mode 5.00% 0.00% 0.00% 0.00% 0.00% 0.00% Total Count 20 5 18 11 10 6 70 % within mode
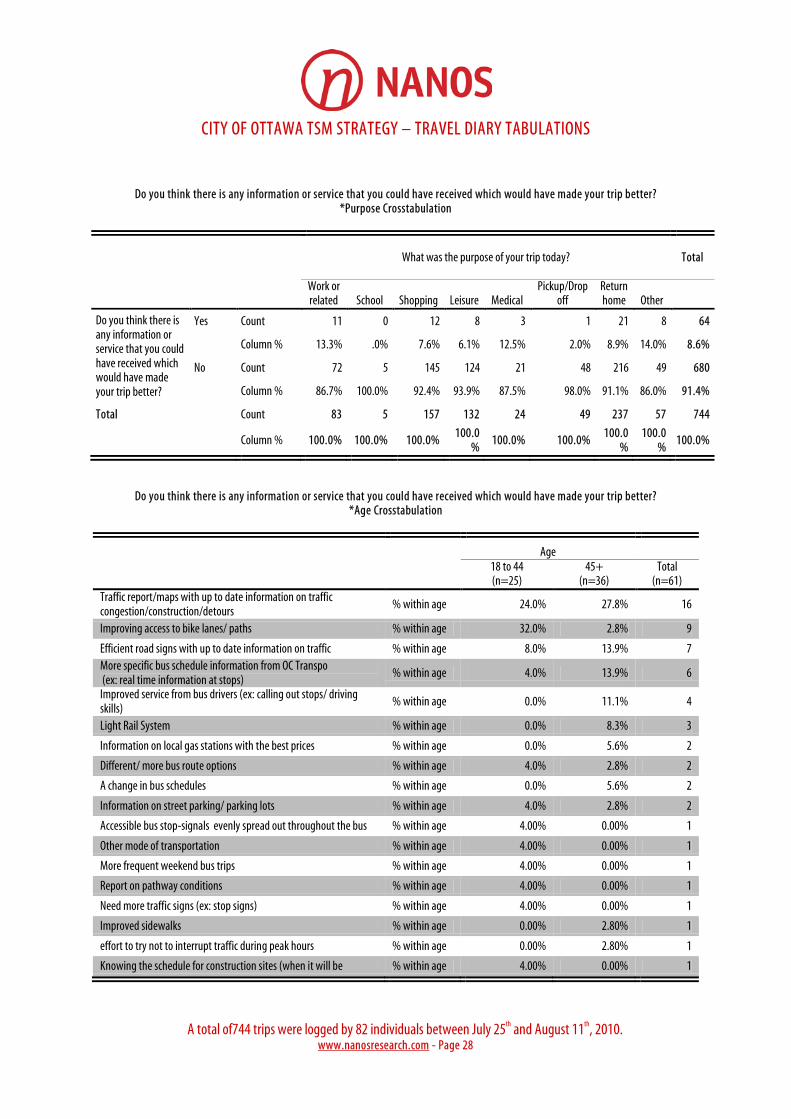
CITY OF OTTAWA TSM STRATEGY – TRAVEL DIARY TABULATIONS
A total of744 trips were logged by 82 individuals between July 25th and August 11th, 2010.
www.nanosresearch.com - Page 28
Do you think there is any information or service that you could have received which would have made your trip better? *Purpose Crosstabulation
What was the purpose of your trip today?
Total
Work or related School Shopping Leisure Medical
Pickup/Drop off
Return home Other
Do you think there is any information or service that you could have received which would have made your trip better?
Yes Count 11 0 12 8 3 1 21 8 64
Column % 13.3% .0% 7.6% 6.1% 12.5% 2.0% 8.9% 14.0% 8.6%
No Count 72 5 145 124 21 48 216 49 680
Column % 86.7% 100.0% 92.4% 93.9% 87.5% 98.0% 91.1% 86.0% 91.4%
Total Count 83 5 157 132 24 49 237 57 744
Column % 100.0% 100.0% 100.0% 100.0
% 100.0% 100.0%
100.0%
100.0%
100.0%
Do you think there is any information or service that you could have received which would have made your trip better? *Age Crosstabulation
Age
18 to 44 (n=25)
45+ (n=36)
Total (n=61)
Traffic report/maps with up to date information on traffic congestion/construction/detours
% within age 24.0% 27.8% 16
Improving access to bike lanes/ paths % within age 32.0% 2.8% 9
Efficient road signs with up to date information on traffic % within age 8.0% 13.9% 7 More specific bus schedule information from OC Transpo (ex: real time information at stops)
% within age 4.0% 13.9% 6
Improved service from bus drivers (ex: calling out stops/ driving skills)
% within age 0.0% 11.1% 4
Light Rail System % within age 0.0% 8.3% 3
Information on local gas stations with the best prices % within age 0.0% 5.6% 2
Different/ more bus route options % within age 4.0% 2.8% 2
A change in bus schedules % within age 0.0% 5.6% 2
Information on street parking/ parking lots % within age 4.0% 2.8% 2
Accessible bus stop-signals evenly spread out throughout the bus % within age 4.00% 0.00% 1
Other mode of transportation % within age 4.00% 0.00% 1
More frequent weekend bus trips % within age 4.00% 0.00% 1
Report on pathway conditions % within age 4.00% 0.00% 1
Need more traffic signs (ex: stop signs) % within age 4.00% 0.00% 1
Improved sidewalks % within age 0.00% 2.80% 1
effort to try not to interrupt traffic during peak hours % within age 0.00% 2.80% 1
Knowing the schedule for construction sites (when it will be % within age 4.00% 0.00% 1
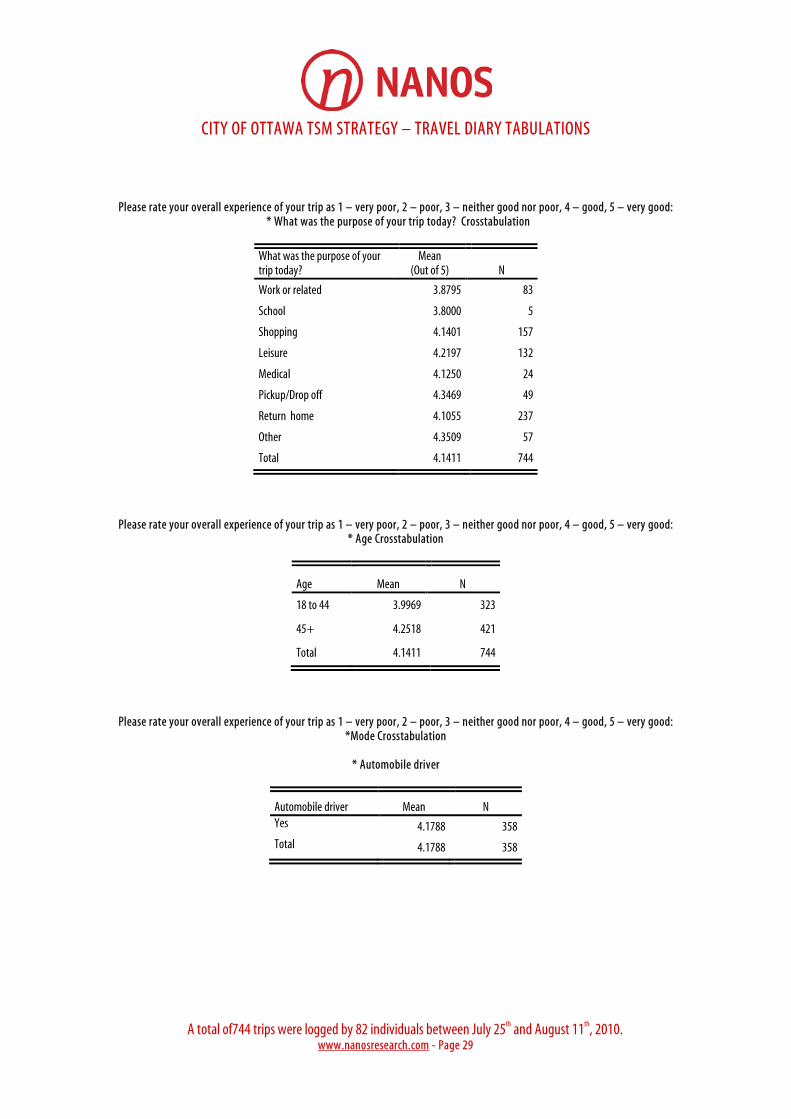
CITY OF OTTAWA TSM STRATEGY – TRAVEL DIARY TABULATIONS
A total of744 trips were logged by 82 individuals between July 25th and August 11th, 2010.
www.nanosresearch.com - Page 29
Please rate your overall experience of your trip as 1 – very poor, 2 – poor, 3 – neither good nor poor, 4 – good, 5 – very good: * What was the purpose of your trip today? Crosstabulation
What was the purpose of your trip today?
Mean (Out of 5) N
Work or related 3.8795 83
School 3.8000 5
Shopping 4.1401 157
Leisure 4.2197 132
Medical 4.1250 24
Pickup/Drop off 4.3469 49
Return home 4.1055 237
Other 4.3509 57
Total 4.1411 744
Please rate your overall experience of your trip as 1 – very poor, 2 – poor, 3 – neither good nor poor, 4 – good, 5 – very good: * Age Crosstabulation
Age Mean N
18 to 44 3.9969 323
45+ 4.2518 421
Total 4.1411 744
Please rate your overall experience of your trip as 1 – very poor, 2 – poor, 3 – neither good nor poor, 4 – good, 5 – very good: *Mode Crosstabulation
* Automobile driver
Automobile driver Mean N Yes 4.1788 358 Total 4.1788 358

CITY OF OTTAWA TSM STRATEGY – TRAVEL DIARY TABULATIONS
A total of744 trips were logged by 82 individuals between July 25th and August 11th, 2010.
www.nanosresearch.com - Page 30
Please rate your overall experience of your trip as: * Automobile passenger
Automobile passenger Mean N Yes 4.0816 49 Total 4.0816 49
Please rate your overall experience of your trip as: * Public transit
Public transit Mean N Yes 3.8485 99 Total 3.8485 99
Please rate your overall experience of your trip as: * Bicycle
Bicycle Mean N Yes 4.3467 75 Total 4.3467 75
Please rate your overall experience of your trip as: * Walking
Walking Mean N Yes 4.1579 171 Total 4.1579 171
Please rate your overall experience of your trip as: * Assistive mobility device (ex. wheelchair)
Assistive mobility device (ex. wheelchair) Mean N Yes 3.5714 7 Total 3.5714 7
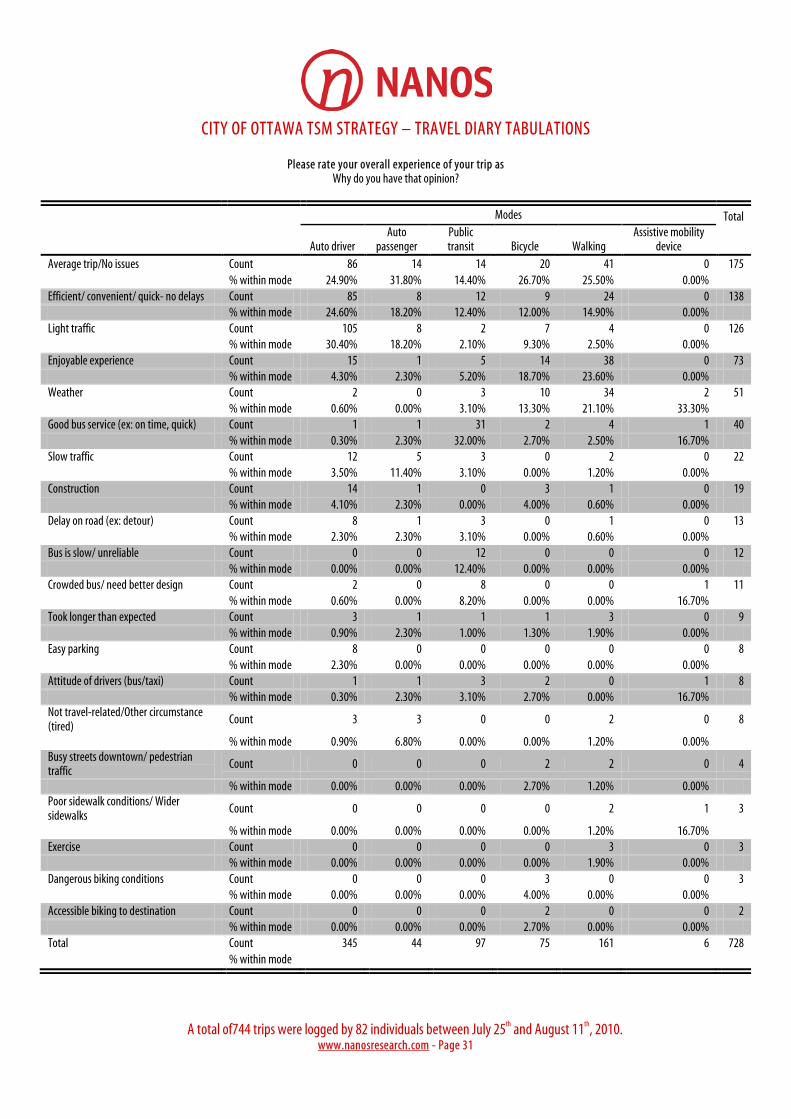
CITY OF OTTAWA TSM STRATEGY – TRAVEL DIARY TABULATIONS
A total of744 trips were logged by 82 individuals between July 25th and August 11th, 2010.
www.nanosresearch.com - Page 31
Please rate your overall experience of your trip as Why do you have that opinion?
Modes Total
Auto driver Auto
passenger Public transit Bicycle Walking
Assistive mobility device
Average trip/No issues Count 86 14 14 20 41 0 175 % within mode 24.90% 31.80% 14.40% 26.70% 25.50% 0.00% Efficient/ convenient/ quick- no delays Count 85 8 12 9 24 0 138 % within mode 24.60% 18.20% 12.40% 12.00% 14.90% 0.00% Light traffic Count 105 8 2 7 4 0 126 % within mode 30.40% 18.20% 2.10% 9.30% 2.50% 0.00% Enjoyable experience Count 15 1 5 14 38 0 73 % within mode 4.30% 2.30% 5.20% 18.70% 23.60% 0.00% Weather Count 2 0 3 10 34 2 51 % within mode 0.60% 0.00% 3.10% 13.30% 21.10% 33.30% Good bus service (ex: on time, quick) Count 1 1 31 2 4 1 40 % within mode 0.30% 2.30% 32.00% 2.70% 2.50% 16.70% Slow traffic Count 12 5 3 0 2 0 22 % within mode 3.50% 11.40% 3.10% 0.00% 1.20% 0.00% Construction Count 14 1 0 3 1 0 19 % within mode 4.10% 2.30% 0.00% 4.00% 0.60% 0.00% Delay on road (ex: detour) Count 8 1 3 0 1 0 13 % within mode 2.30% 2.30% 3.10% 0.00% 0.60% 0.00% Bus is slow/ unreliable Count 0 0 12 0 0 0 12 % within mode 0.00% 0.00% 12.40% 0.00% 0.00% 0.00% Crowded bus/ need better design Count 2 0 8 0 0 1 11 % within mode 0.60% 0.00% 8.20% 0.00% 0.00% 16.70% Took longer than expected Count 3 1 1 1 3 0 9 % within mode 0.90% 2.30% 1.00% 1.30% 1.90% 0.00% Easy parking Count 8 0 0 0 0 0 8 % within mode 2.30% 0.00% 0.00% 0.00% 0.00% 0.00% Attitude of drivers (bus/taxi) Count 1 1 3 2 0 1 8 % within mode 0.30% 2.30% 3.10% 2.70% 0.00% 16.70% Not travel-related/Other circumstance (tired)
Count 3 3 0 0 2 0 8
% within mode 0.90% 6.80% 0.00% 0.00% 1.20% 0.00% Busy streets downtown/ pedestrian traffic
Count 0 0 0 2 2 0 4
% within mode 0.00% 0.00% 0.00% 2.70% 1.20% 0.00% Poor sidewalk conditions/ Wider sidewalks
Count 0 0 0 0 2 1 3
% within mode 0.00% 0.00% 0.00% 0.00% 1.20% 16.70% Exercise Count 0 0 0 0 3 0 3 % within mode 0.00% 0.00% 0.00% 0.00% 1.90% 0.00% Dangerous biking conditions Count 0 0 0 3 0 0 3 % within mode 0.00% 0.00% 0.00% 4.00% 0.00% 0.00%
Accessible biking to destination Count 0 0 0 2 0 0 2 % within mode 0.00% 0.00% 0.00% 2.70% 0.00% 0.00% Total Count 345 44 97 75 161 6 728 % within mode
CITY OF OTTAWA TSM STRATEGY – TRAVEL DIARY TABULATIONS
A total of744 trips were logged by 82 individuals between July 25th and August 11th, 2010.
www.nanosresearch.com - Page 32
AUTUMN
During the autumn which mode of transportation do you use the most as your primary means of getting around the city? * Automobile driver Crosstabulation
Automobile Driver Total
Yes During the autumn which mode of transportation do you use the most as your primary means of getting around the city?
Automobile driver Count 28 28
Column % 73.70% 73.70% Automobile passenger Count 1 1 Column % 2.60% 2.60% Public transit Count 3 3 Column % 7.90% 7.90% Bicycle Count 3 3 Column % 7.90% 7.90% Walking Count 3 3
Column % 7.90% 7.90%
Total Count 38 38 Column % 100.00% 100.00%
During the autumn which mode of transportation do you use the most as your primary means of getting around the city? * Automobile passenger Crosstabulation
Automobile passenger Total
Yes During the autumn which mode of transportation do you use the most as your primary means of getting around the city?
Automobile driver Count 3 3
Column % 75.00% 75.00% Public transit Count 1 1 Column % 25.00% 25.00%
Total Count 4 4
Column % 100.00% 100.00%
CITY OF OTTAWA TSM STRATEGY – TRAVEL DIARY TABULATIONS
A total of744 trips were logged by 82 individuals between July 25th and August 11th, 2010.
www.nanosresearch.com - Page 33
During the autumn which mode of transportation do you use the most as your primary means of getting around the city? * Public transit Crosstabulation
Public transit Total
Yes During the autumn which mode of transportation do you use the most as your primary means of getting around the city?
Automobile driver Count 2 2
Column % 10.00% 10.00% Public transit Count 16 16 Column % 80.00% 80.00% Walking Count 2 2
Column % 10.00% 10.00%
Total Count 20 20
Column % 100.00% 100.00%
During the autumn which mode of transportation do you use the most as your primary means of getting around the city? * Bicycle crosstabulation
Bicycle Total
Yes During the autumn which mode of transportation do you use the most as your primary means of getting around the city?
Automobile driver
Count
1 1 Column % 10.00% 10.00% Public transit Count 1 1 Column % 10.00% 10.00% Bicycle Count 7 7 Column % 70.00% 70.00% Walking Count 1 1
Column % 10.00% 10.00%
Total Count 10 10
Column % 100.00% 100.00%
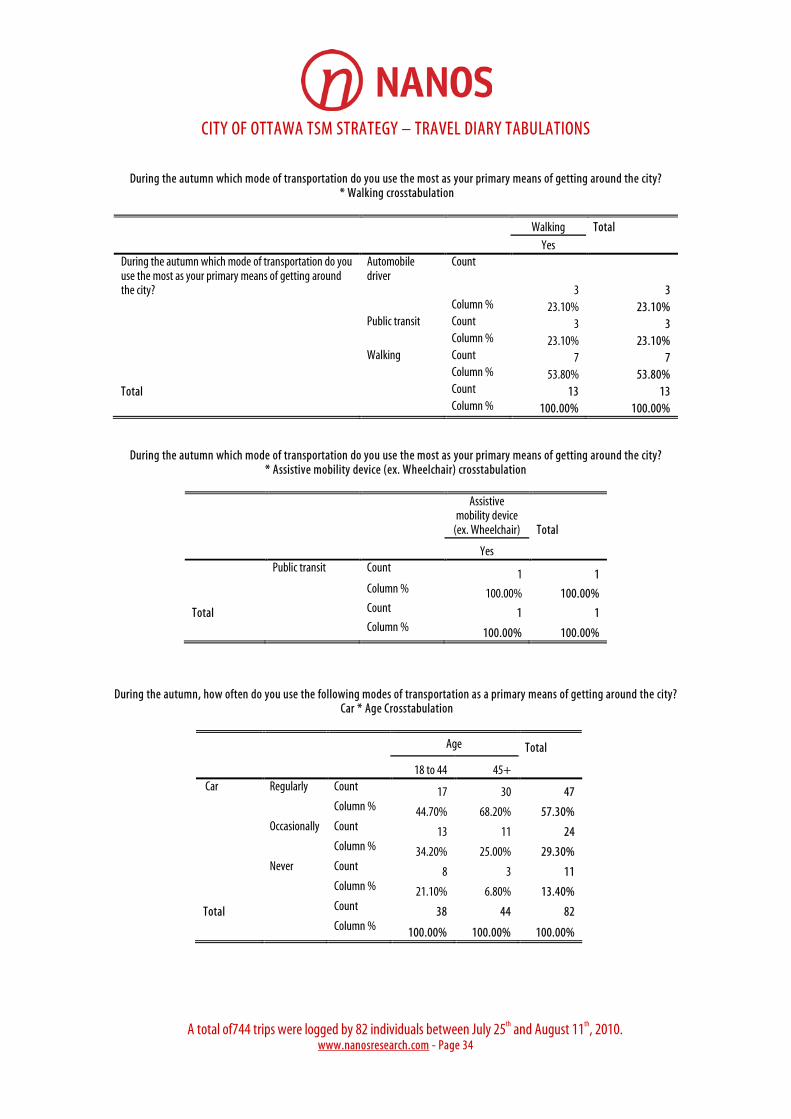
CITY OF OTTAWA TSM STRATEGY – TRAVEL DIARY TABULATIONS
A total of744 trips were logged by 82 individuals between July 25th and August 11th, 2010.
www.nanosresearch.com - Page 34
During the autumn which mode of transportation do you use the most as your primary means of getting around the city?
* Walking crosstabulation
Walking Total
Yes During the autumn which mode of transportation do you use the most as your primary means of getting around the city?
Automobile driver
Count
3 3 Column % 23.10% 23.10% Public transit Count 3 3 Column % 23.10% 23.10% Walking Count 7 7
Column % 53.80% 53.80%
Total Count 13 13 Column % 100.00% 100.00%
During the autumn which mode of transportation do you use the most as your primary means of getting around the city? * Assistive mobility device (ex. Wheelchair) crosstabulation
Assistive mobility device
(ex. Wheelchair) Total
Yes Public transit Count 1 1
Column % 100.00% 100.00%
Total
Count 1 1
Column % 100.00% 100.00%
During the autumn, how often do you use the following modes of transportation as a primary means of getting around the city? Car * Age Crosstabulation
Age Total
18 to 44 45+ Car Regularly Count 17 30 47 Column % 44.70% 68.20% 57.30% Occasionally Count 13 11 24 Column % 34.20% 25.00% 29.30% Never Count 8 3 11
Column % 21.10% 6.80% 13.40%
Total Count 38 44 82
Column % 100.00% 100.00% 100.00%
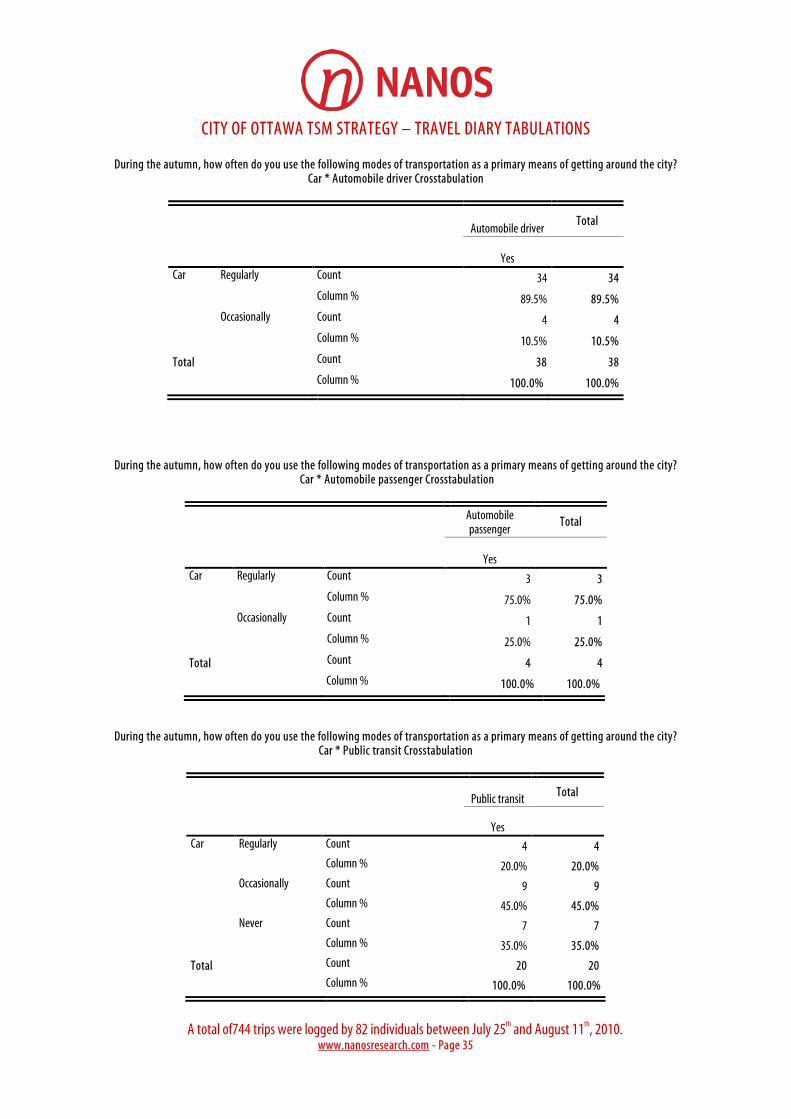
CITY OF OTTAWA TSM STRATEGY – TRAVEL DIARY TABULATIONS
A total of744 trips were logged by 82 individuals between July 25th and August 11th, 2010.
www.nanosresearch.com - Page 35
During the autumn, how often do you use the following modes of transportation as a primary means of getting around the city? Car * Automobile driver Crosstabulation
Automobile driver Total
Yes Car Regularly Count 34 34 Column % 89.5% 89.5% Occasionally Count 4 4 Column % 10.5% 10.5%
Total Count 38 38 Column % 100.0% 100.0%
During the autumn, how often do you use the following modes of transportation as a primary means of getting around the city? Car * Automobile passenger Crosstabulation
Automobile passenger
Total
Yes Car Regularly Count 3 3 Column % 75.0% 75.0% Occasionally Count 1 1 Column % 25.0% 25.0%
Total Count 4 4 Column % 100.0% 100.0%
During the autumn, how often do you use the following modes of transportation as a primary means of getting around the city? Car * Public transit Crosstabulation
Public transit Total
Yes Car Regularly Count 4 4 Column % 20.0% 20.0% Occasionally Count 9 9 Column % 45.0% 45.0% Never Count 7 7 Column % 35.0% 35.0%
Total Count 20 20 Column % 100.0% 100.0%

CITY OF OTTAWA TSM STRATEGY – TRAVEL DIARY TABULATIONS
A total of744 trips were logged by 82 individuals between July 25th and August 11th, 2010.
www.nanosresearch.com - Page 36
During the autumn, how often do you use the following modes of transportation as a primary means of getting around the city? Car * Bicycle Crosstabulation
Bicycle Total
Yes Car Regularly Count 3 3 Column % 30.0% 30.0% Occasionally Count 5 5 Column % 50.0% 50.0% Never Count 2 2 Column % 20.0% 20.0% Total Count 10 10 Column % 100.0% 100.0%
During the autumn, how often do you use the following modes of transportation as a primary means of getting around the city? Car * Walking Crosstabulation
Walking Total
Yes Car Regularly Count 6 6 Column % 46.2% 46.2% Occasionally Count 5 5 Column % 38.5% 38.5% Never Count 2 2 Column % 15.4% 15.4%
Total Count 13 13 Column % 100.0% 100.0%
During the autumn, how often do you use the following modes of transportation as a primary means of getting around the city? Car * Assistive mobility device (ex. wheelchair) Crosstabulation
Assistive mobility device (ex.
wheelchair) Total
Yes Car Occasionally Count 1 1 Column % 100.0% 100.0%
Total Count 1 1 Column % 100.0% 100.0%
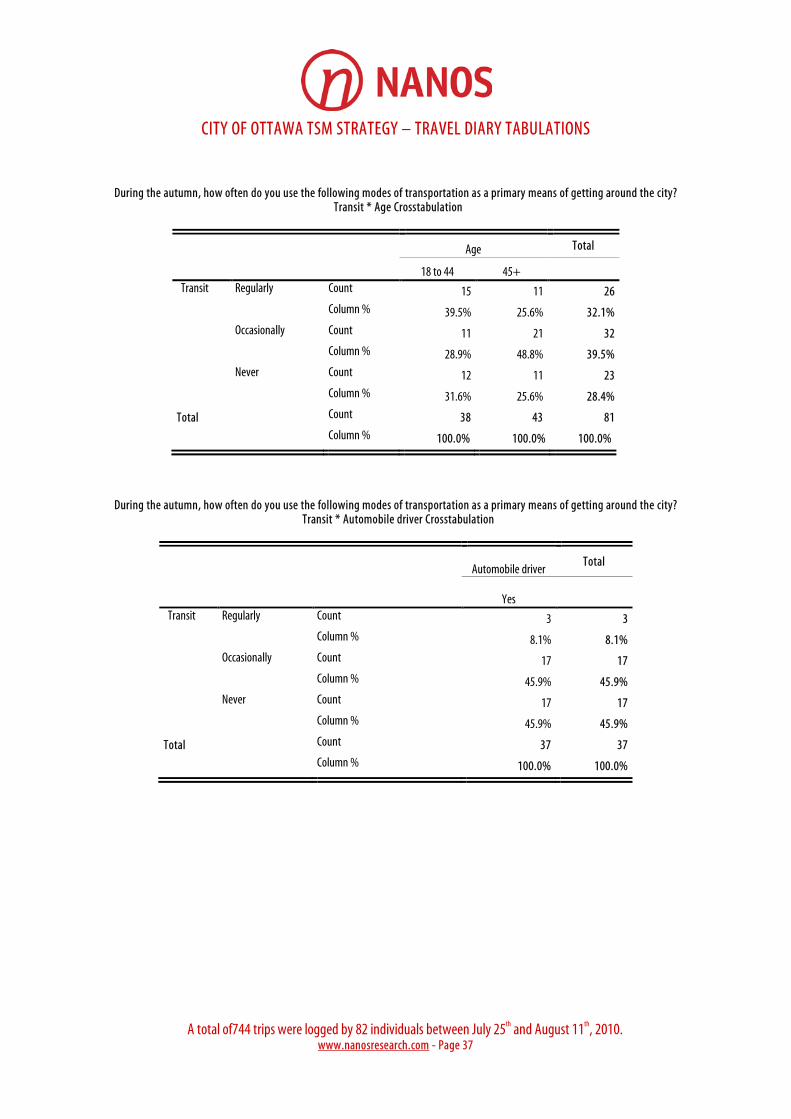
CITY OF OTTAWA TSM STRATEGY – TRAVEL DIARY TABULATIONS
A total of744 trips were logged by 82 individuals between July 25th and August 11th, 2010.
www.nanosresearch.com - Page 37
During the autumn, how often do you use the following modes of transportation as a primary means of getting around the city? Transit * Age Crosstabulation
Age Total
18 to 44 45+ Transit Regularly Count 15 11 26 Column % 39.5% 25.6% 32.1% Occasionally Count 11 21 32 Column % 28.9% 48.8% 39.5% Never Count 12 11 23 Column % 31.6% 25.6% 28.4%
Total Count 38 43 81 Column % 100.0% 100.0% 100.0%
During the autumn, how often do you use the following modes of transportation as a primary means of getting around the city? Transit * Automobile driver Crosstabulation
Automobile driver Total
Yes Transit Regularly Count 3 3 Column % 8.1% 8.1% Occasionally Count 17 17 Column % 45.9% 45.9% Never Count 17 17 Column % 45.9% 45.9%
Total Count 37 37 Column % 100.0% 100.0%
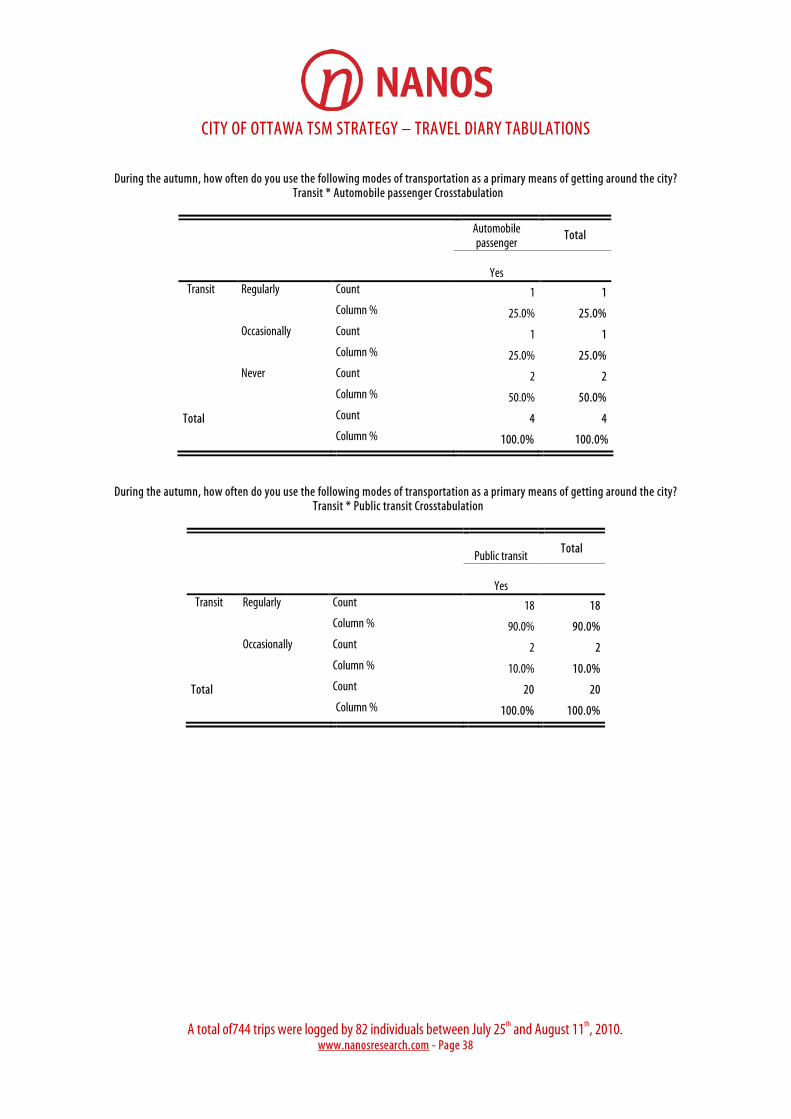
CITY OF OTTAWA TSM STRATEGY – TRAVEL DIARY TABULATIONS
A total of744 trips were logged by 82 individuals between July 25th and August 11th, 2010.
www.nanosresearch.com - Page 38
During the autumn, how often do you use the following modes of transportation as a primary means of getting around the city?
Transit * Automobile passenger Crosstabulation
Automobile passenger
Total
Yes Transit Regularly Count 1 1 Column % 25.0% 25.0% Occasionally Count 1 1 Column % 25.0% 25.0% Never Count 2 2 Column % 50.0% 50.0%
Total Count 4 4 Column % 100.0% 100.0%
During the autumn, how often do you use the following modes of transportation as a primary means of getting around the city? Transit * Public transit Crosstabulation
Public transit Total
Yes Transit Regularly Count 18 18 Column % 90.0% 90.0% Occasionally Count 2 2 Column % 10.0% 10.0%
Total Count 20 20 Column % 100.0% 100.0%
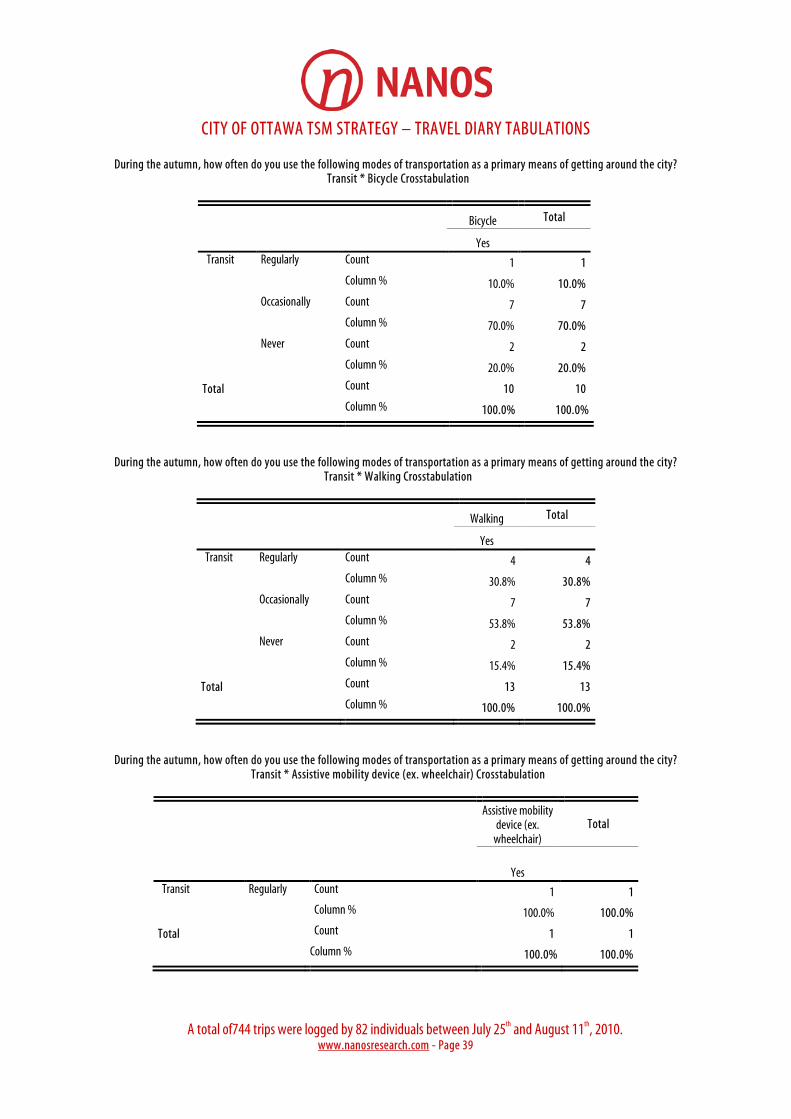
CITY OF OTTAWA TSM STRATEGY – TRAVEL DIARY TABULATIONS
A total of744 trips were logged by 82 individuals between July 25th and August 11th, 2010.
www.nanosresearch.com - Page 39
During the autumn, how often do you use the following modes of transportation as a primary means of getting around the city? Transit * Bicycle Crosstabulation
Bicycle Total
Yes Transit Regularly Count 1 1 Column % 10.0% 10.0% Occasionally Count 7 7 Column % 70.0% 70.0% Never Count 2 2 Column % 20.0% 20.0%
Total Count 10 10 Column % 100.0% 100.0%
During the autumn, how often do you use the following modes of transportation as a primary means of getting around the city? Transit * Walking Crosstabulation
Walking Total
Yes Transit Regularly Count 4 4 Column % 30.8% 30.8% Occasionally Count 7 7 Column % 53.8% 53.8% Never Count 2 2 Column % 15.4% 15.4%
Total Count 13 13 Column % 100.0% 100.0%
During the autumn, how often do you use the following modes of transportation as a primary means of getting around the city? Transit * Assistive mobility device (ex. wheelchair) Crosstabulation
Assistive mobility device (ex.
wheelchair) Total
Yes Transit Regularly Count 1 1 Column % 100.0% 100.0%
Total Count 1 1 Column % 100.0% 100.0%

CITY OF OTTAWA TSM STRATEGY – TRAVEL DIARY TABULATIONS
A total of744 trips were logged by 82 individuals between July 25th and August 11th, 2010.
www.nanosresearch.com - Page 40
During the autumn, how often do you use the following modes of transportation as a primary means of getting around the city?
Bicycle * Age Crosstabulation
Age Total
18 to 44 45+ bicycle Regularly Count 12 6 18 Column % 31.6% 13.6% 22.0% Occasionally Count 16 19 35 Column % 42.1% 43.2% 42.7% Never Count 10 19 29 Column % 26.3% 43.2% 35.4%
Total Count 38 44 82 Column % 100.0% 100.0% 100.0%
During the autumn, how often do you use the following modes of transportation as a primary means of getting around the city? Bicycle * Automobile driver Crosstabulation
Automobile driver Total
Yes bicycle Regularly Count 6 6 Column % 15.8% 15.8% Occasionally Count 20 20 Column % 52.6% 52.6% Never Count 12 12 Column % 31.6% 31.6%
Total Count 38 38 Column % 100.0% 100.0%

CITY OF OTTAWA TSM STRATEGY – TRAVEL DIARY TABULATIONS
A total of744 trips were logged by 82 individuals between July 25th and August 11th, 2010.
www.nanosresearch.com - Page 41
During the autumn, how often do you use the following modes of transportation as a primary means of getting around the city? Bicycle * Automobile passenger Crosstabulation
Automobile passenger
Total
Yes bicycle Regularly Count 1 1 Column % 25.0% 25.0% Occasionally Count 2 2 Column % 50.0% 50.0% Never Count 1 1 Column % 25.0% 25.0%
Total Count 4 4 Column % 100.0% 100.0%
During the autumn, how often do you use the following modes of transportation as a primary means of getting around the city? Bicycle * Public transit Crosstabulation
Public transit Total
Yes bicycle Regularly Count 3 3 Column % 15.0% 15.0% Occasionally Count 8 8 Column % 40.0% 40.0% Never Count 9 9 Column % 45.0% 45.0%
Total Count 20 20 Column % 100.0% 100.0%
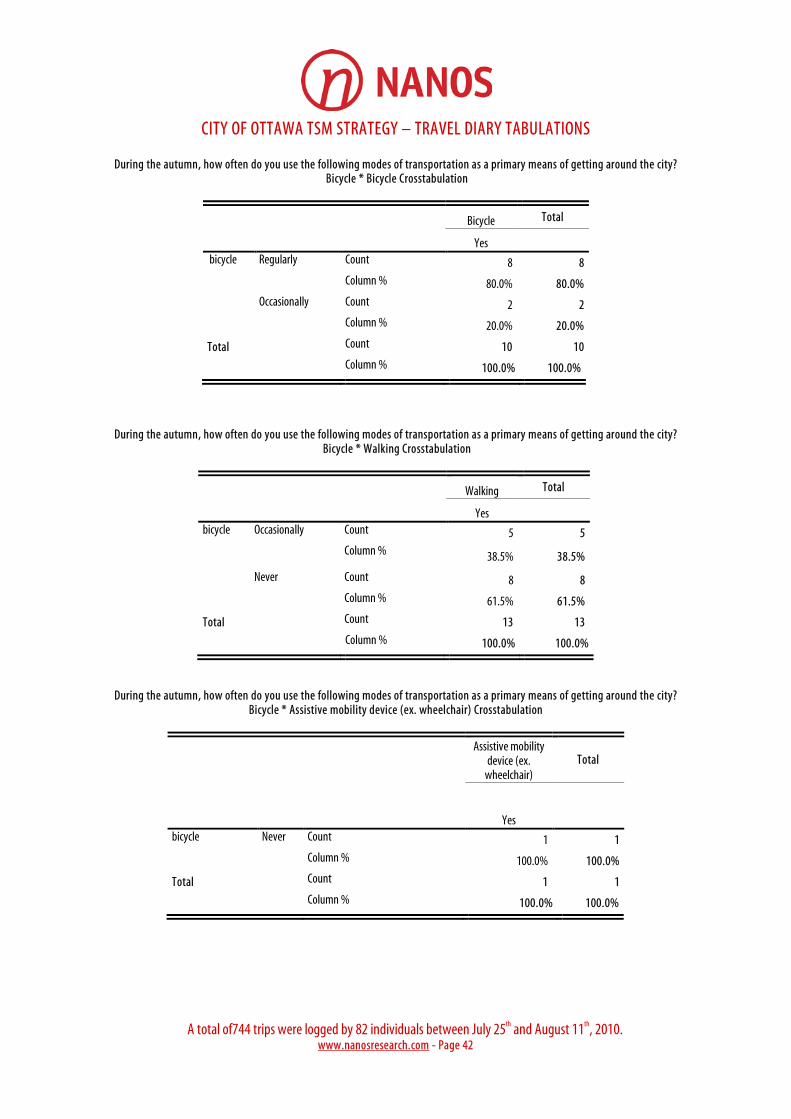
CITY OF OTTAWA TSM STRATEGY – TRAVEL DIARY TABULATIONS
A total of744 trips were logged by 82 individuals between July 25th and August 11th, 2010.
www.nanosresearch.com - Page 42
During the autumn, how often do you use the following modes of transportation as a primary means of getting around the city? Bicycle * Bicycle Crosstabulation
Bicycle Total
Yes bicycle Regularly Count 8 8 Column % 80.0% 80.0% Occasionally Count 2 2 Column % 20.0% 20.0%
Total Count 10 10 Column % 100.0% 100.0%
During the autumn, how often do you use the following modes of transportation as a primary means of getting around the city?
Bicycle * Walking Crosstabulation
Walking Total
Yes bicycle Occasionally Count 5 5 Column % 38.5% 38.5%
Never Count 8 8 Column % 61.5% 61.5%
Total Count 13 13 Column % 100.0% 100.0%
During the autumn, how often do you use the following modes of transportation as a primary means of getting around the city? Bicycle * Assistive mobility device (ex. wheelchair) Crosstabulation
Assistive mobility device (ex.
wheelchair) Total
Yes bicycle Never Count 1 1 Column % 100.0% 100.0%
Total Count 1 1 Column % 100.0% 100.0%
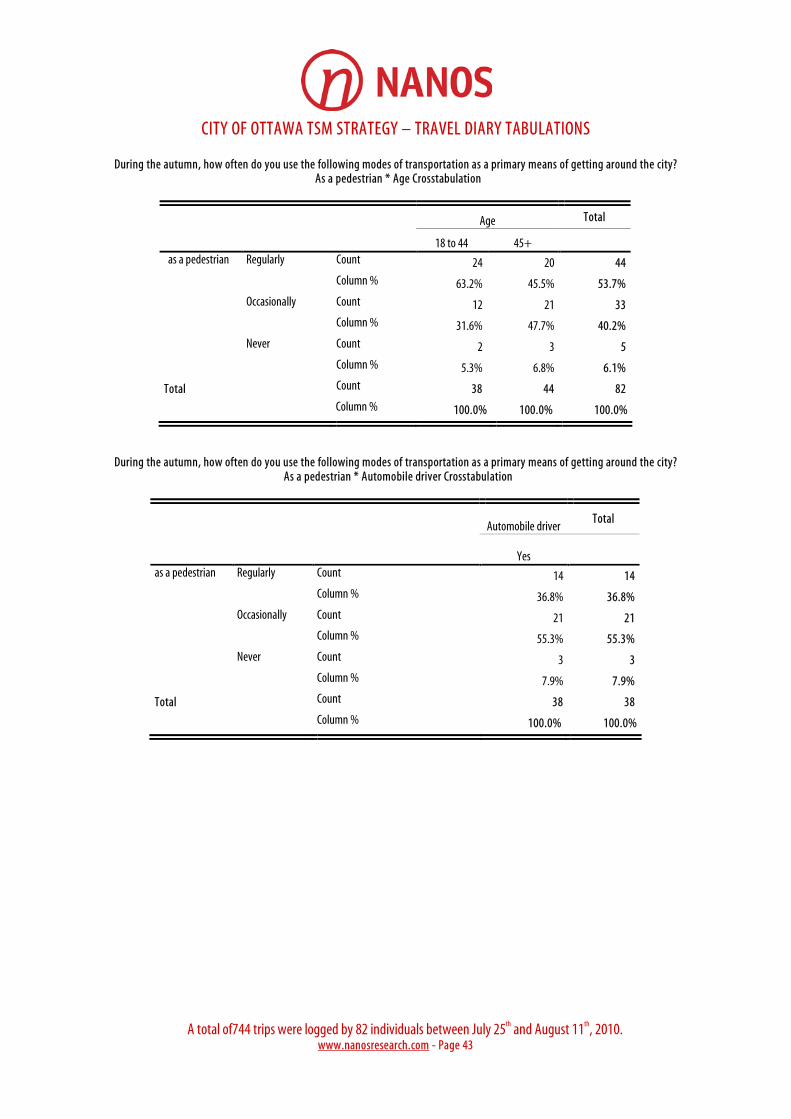
CITY OF OTTAWA TSM STRATEGY – TRAVEL DIARY TABULATIONS
A total of744 trips were logged by 82 individuals between July 25th and August 11th, 2010.
www.nanosresearch.com - Page 43
During the autumn, how often do you use the following modes of transportation as a primary means of getting around the city? As a pedestrian * Age Crosstabulation
Age Total
18 to 44 45+ as a pedestrian Regularly Count 24 20 44 Column % 63.2% 45.5% 53.7% Occasionally Count 12 21 33 Column % 31.6% 47.7% 40.2% Never Count 2 3 5 Column % 5.3% 6.8% 6.1%
Total Count 38 44 82 Column % 100.0% 100.0% 100.0%
During the autumn, how often do you use the following modes of transportation as a primary means of getting around the city? As a pedestrian * Automobile driver Crosstabulation
Automobile driver Total
Yes as a pedestrian Regularly Count 14 14 Column % 36.8% 36.8% Occasionally Count 21 21 Column % 55.3% 55.3% Never Count 3 3 Column % 7.9% 7.9%
Total Count 38 38 Column % 100.0% 100.0%
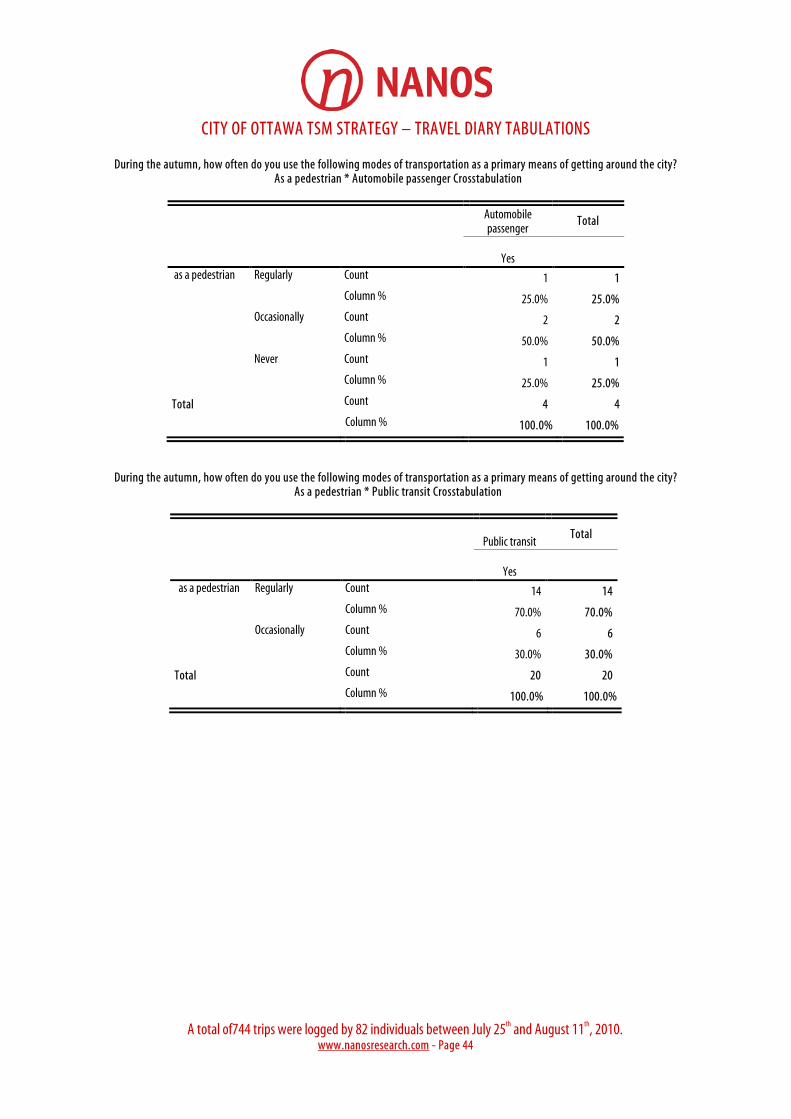
CITY OF OTTAWA TSM STRATEGY – TRAVEL DIARY TABULATIONS
A total of744 trips were logged by 82 individuals between July 25th and August 11th, 2010.
www.nanosresearch.com - Page 44
During the autumn, how often do you use the following modes of transportation as a primary means of getting around the city? As a pedestrian * Automobile passenger Crosstabulation
Automobile passenger
Total
Yes as a pedestrian Regularly Count 1 1 Column % 25.0% 25.0% Occasionally Count 2 2 Column % 50.0% 50.0% Never Count 1 1 Column % 25.0% 25.0%
Total Count 4 4 Column % 100.0% 100.0%
During the autumn, how often do you use the following modes of transportation as a primary means of getting around the city? As a pedestrian * Public transit Crosstabulation
Public transit Total
Yes as a pedestrian Regularly Count 14 14 Column % 70.0% 70.0% Occasionally Count 6 6 Column % 30.0% 30.0%
Total Count 20 20 Column % 100.0% 100.0%
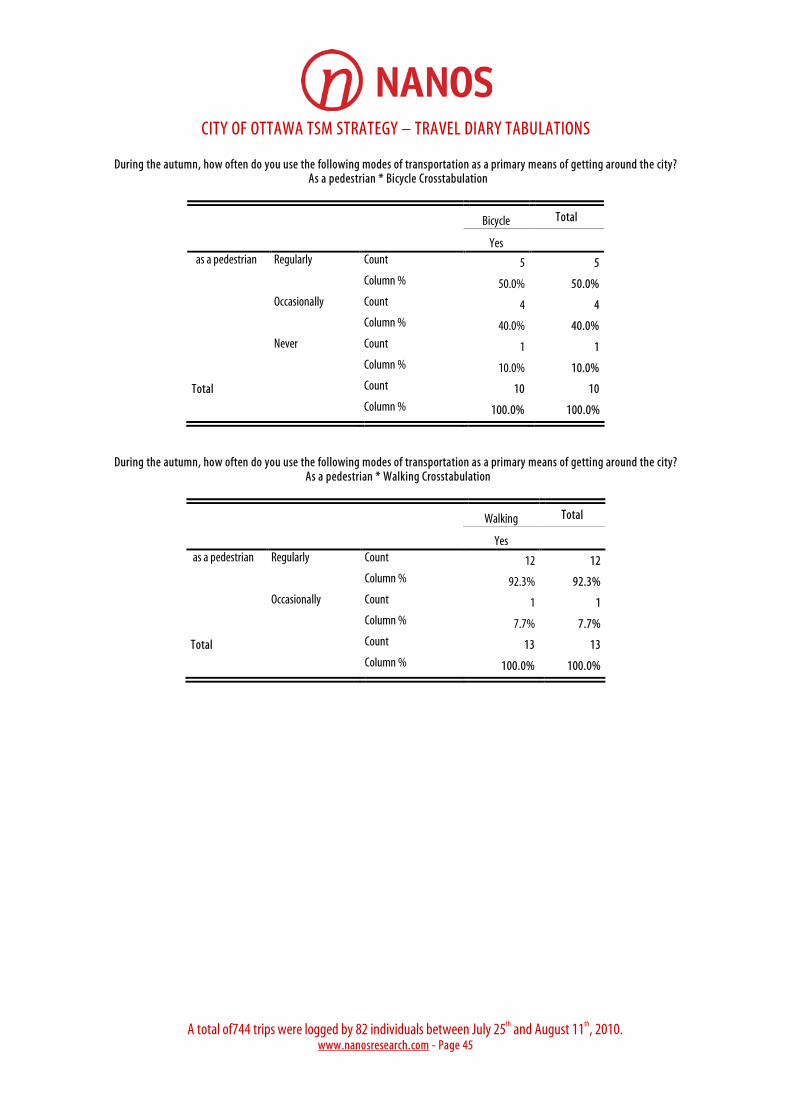
CITY OF OTTAWA TSM STRATEGY – TRAVEL DIARY TABULATIONS
A total of744 trips were logged by 82 individuals between July 25th and August 11th, 2010.
www.nanosresearch.com - Page 45
During the autumn, how often do you use the following modes of transportation as a primary means of getting around the city? As a pedestrian * Bicycle Crosstabulation
Bicycle Total
Yes as a pedestrian Regularly Count 5 5 Column % 50.0% 50.0% Occasionally Count 4 4 Column % 40.0% 40.0% Never Count 1 1 Column % 10.0% 10.0%
Total Count 10 10 Column % 100.0% 100.0%
During the autumn, how often do you use the following modes of transportation as a primary means of getting around the city? As a pedestrian * Walking Crosstabulation
Walking Total
Yes as a pedestrian Regularly Count 12 12 Column % 92.3% 92.3% Occasionally Count 1 1 Column % 7.7% 7.7%
Total Count 13 13 Column % 100.0% 100.0%
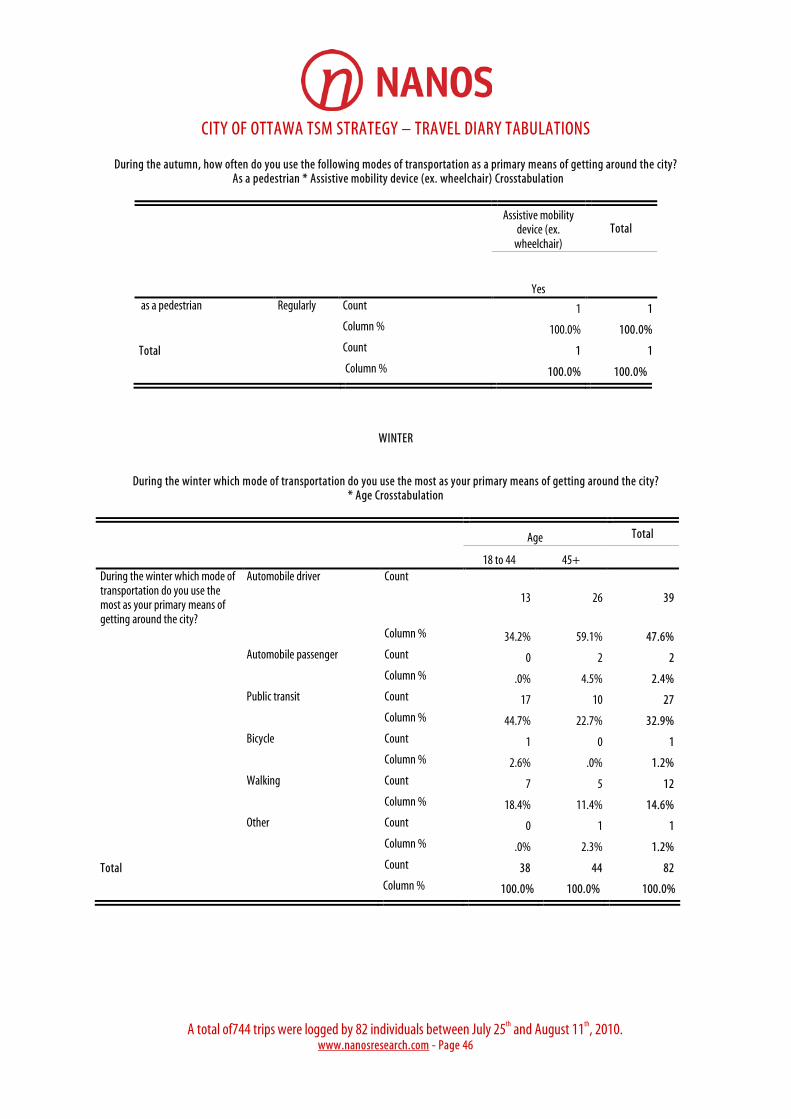
CITY OF OTTAWA TSM STRATEGY – TRAVEL DIARY TABULATIONS
A total of744 trips were logged by 82 individuals between July 25th and August 11th, 2010.
www.nanosresearch.com - Page 46
During the autumn, how often do you use the following modes of transportation as a primary means of getting around the city? As a pedestrian * Assistive mobility device (ex. wheelchair) Crosstabulation
Assistive mobility device (ex.
wheelchair) Total
Yes as a pedestrian Regularly Count 1 1 Column % 100.0% 100.0%
Total Count 1 1 Column % 100.0% 100.0%
WINTER
During the winter which mode of transportation do you use the most as your primary means of getting around the city?
* Age Crosstabulation
Age Total
18 to 44 45+ During the winter which mode of transportation do you use the most as your primary means of getting around the city?
Automobile driver Count
13 26 39
Column % 34.2% 59.1% 47.6% Automobile passenger Count 0 2 2 Column % .0% 4.5% 2.4% Public transit Count 17 10 27 Column % 44.7% 22.7% 32.9% Bicycle Count 1 0 1 Column % 2.6% .0% 1.2% Walking Count 7 5 12 Column % 18.4% 11.4% 14.6% Other Count 0 1 1 Column % .0% 2.3% 1.2%
Total Count 38 44 82 Column % 100.0% 100.0% 100.0%
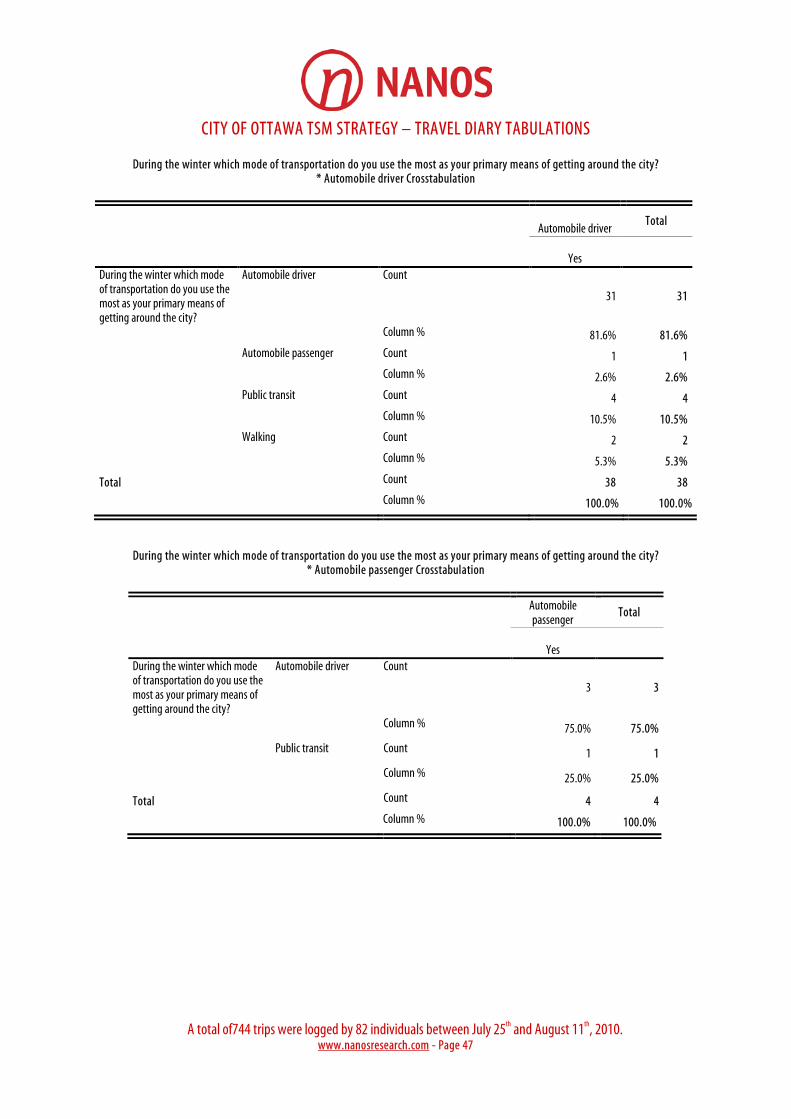
CITY OF OTTAWA TSM STRATEGY – TRAVEL DIARY TABULATIONS
A total of744 trips were logged by 82 individuals between July 25th and August 11th, 2010.
www.nanosresearch.com - Page 47
During the winter which mode of transportation do you use the most as your primary means of getting around the city? * Automobile driver Crosstabulation
Automobile driver Total
Yes During the winter which mode of transportation do you use the most as your primary means of getting around the city?
Automobile driver Count
31 31
Column % 81.6% 81.6% Automobile passenger Count 1 1 Column % 2.6% 2.6% Public transit Count 4 4 Column % 10.5% 10.5% Walking Count 2 2 Column % 5.3% 5.3%
Total Count 38 38 Column % 100.0% 100.0%
During the winter which mode of transportation do you use the most as your primary means of getting around the city? * Automobile passenger Crosstabulation
Automobile passenger
Total
Yes During the winter which mode of transportation do you use the most as your primary means of getting around the city?
Automobile driver Count
3 3
Column % 75.0% 75.0%
Public transit Count 1 1
Column % 25.0% 25.0%
Total Count 4 4 Column % 100.0% 100.0%

CITY OF OTTAWA TSM STRATEGY – TRAVEL DIARY TABULATIONS
A total of744 trips were logged by 82 individuals between July 25th and August 11th, 2010.
www.nanosresearch.com - Page 48
During the winter which mode of transportation do you use the most as your primary means of getting around the city? * Public transit Crosstabulation
Public transit Total
Yes During the winter which mode of transportation do you use the most as your primary means of getting around the city?
Automobile driver Count
1 1
Column % 5.0% 5.0% Public transit Count 17 17 Column % 85.0% 85.0% Walking Count 2 2 Column % 10.0% 10.0%
Total Count 20 20 Column % 100.0% 100.0%
During the winter which mode of transportation do you use the most as your primary means of getting around the city? * Bicycle Crosstabulation
Bicycle Total
Yes During the winter which mode of transportation do you use the most as your primary means of getting around the city?
Automobile driver Count
1 1
Column % 10.0% 10.0% Public transit Count 4 4 Column % 40.0% 40.0% Bicycle Count 1 1 Column % 10.0% 10.0% Walking Count 4 4 Column % 40.0% 40.0%
Total Count 10 10 Column % 100.0% 100.0%
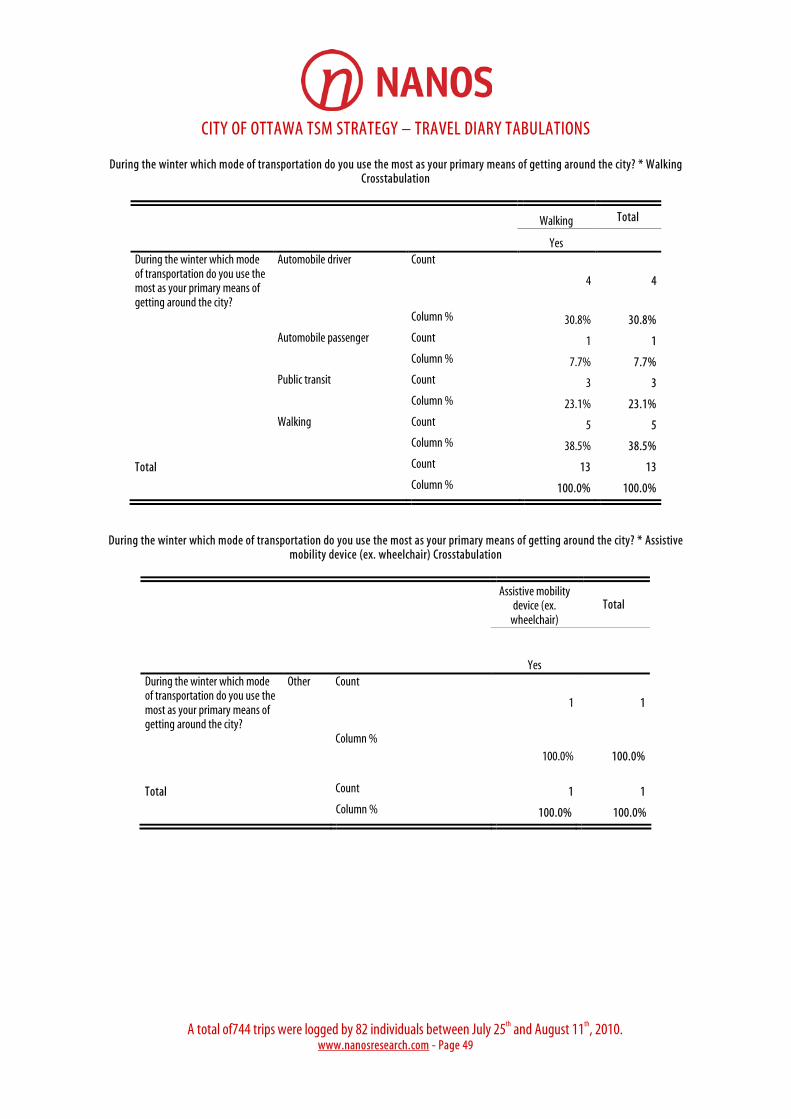
CITY OF OTTAWA TSM STRATEGY – TRAVEL DIARY TABULATIONS
A total of744 trips were logged by 82 individuals between July 25th and August 11th, 2010.
www.nanosresearch.com - Page 49
During the winter which mode of transportation do you use the most as your primary means of getting around the city? * Walking Crosstabulation
Walking Total
Yes During the winter which mode of transportation do you use the most as your primary means of getting around the city?
Automobile driver Count
4 4
Column % 30.8% 30.8% Automobile passenger Count 1 1 Column % 7.7% 7.7% Public transit Count 3 3 Column % 23.1% 23.1% Walking Count 5 5 Column % 38.5% 38.5%
Total Count 13 13 Column % 100.0% 100.0%
During the winter which mode of transportation do you use the most as your primary means of getting around the city? * Assistive mobility device (ex. wheelchair) Crosstabulation
Assistive mobility device (ex.
wheelchair) Total
Yes During the winter which mode of transportation do you use the most as your primary means of getting around the city?
Other Count
1 1
Column % 100.0% 100.0%
Total Count 1 1 Column % 100.0% 100.0%
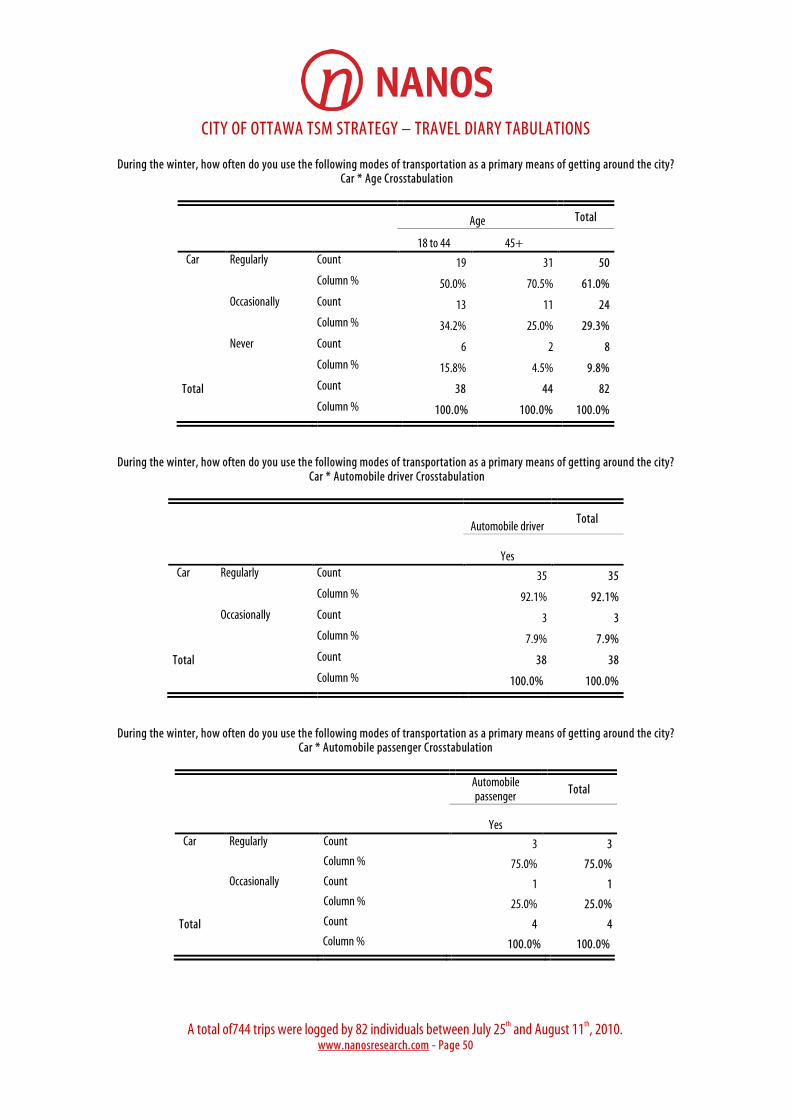
CITY OF OTTAWA TSM STRATEGY – TRAVEL DIARY TABULATIONS
A total of744 trips were logged by 82 individuals between July 25th and August 11th, 2010.
www.nanosresearch.com - Page 50
During the winter, how often do you use the following modes of transportation as a primary means of getting around the city? Car * Age Crosstabulation
Age Total
18 to 44 45+ Car Regularly Count 19 31 50 Column % 50.0% 70.5% 61.0% Occasionally Count 13 11 24 Column % 34.2% 25.0% 29.3% Never Count 6 2 8 Column % 15.8% 4.5% 9.8%
Total Count 38 44 82 Column % 100.0% 100.0% 100.0%
During the winter, how often do you use the following modes of transportation as a primary means of getting around the city? Car * Automobile driver Crosstabulation
Automobile driver Total
Yes Car Regularly Count 35 35 Column % 92.1% 92.1% Occasionally Count 3 3 Column % 7.9% 7.9%
Total Count 38 38 Column % 100.0% 100.0%
During the winter, how often do you use the following modes of transportation as a primary means of getting around the city? Car * Automobile passenger Crosstabulation
Automobile passenger Total
Yes Car Regularly Count 3 3 Column % 75.0% 75.0% Occasionally Count 1 1 Column % 25.0% 25.0%
Total Count 4 4 Column % 100.0% 100.0%

CITY OF OTTAWA TSM STRATEGY – TRAVEL DIARY TABULATIONS
A total of744 trips were logged by 82 individuals between July 25th and August 11th, 2010.
www.nanosresearch.com - Page 51
During the winter, how often do you use the following modes of transportation as a primary means of getting around the city?
Car * Public transit Crosstabulation
Public transit Total
Yes Car Regularly Count 4 4 Column % 20.0% 20.0% Occasionally Count 11 11 Column % 55.0% 55.0% Never Count 5 5 Column % 25.0% 25.0%
Total Count 20 20 Column % 100.0% 100.0%
During the winter, how often do you use the following modes of transportation as a primary means of getting around the city? Car * Bicycle Crosstabulation
Bicycle Total
Yes Car Regularly Count 4 4 Column % 40.0% 40.0% Occasionally Count 5 5 Column % 50.0% 50.0% Never Count 1 1 Column % 10.0% 10.0%
Total Count 10 10 Column % 100.0% 100.0%

CITY OF OTTAWA TSM STRATEGY – TRAVEL DIARY TABULATIONS
A total of744 trips were logged by 82 individuals between July 25th and August 11th, 2010.
www.nanosresearch.com - Page 52
During the winter, how often do you use the following modes of transportation as a primary means of getting around the city? Car * Walking Crosstabulation
Walking Total
Yes Car Regularly Count 7 7 Column % 53.8% 53.8% Occasionally Count 4 4 Column % 30.8% 30.8% Never Count 2 2 Column % 15.4% 15.4%
Total Count 13 13 Column % 100.0% 100.0%
During the winter, how often do you use the following modes of transportation as a primary means of getting around the city? Car * Assistive mobility device (ex. wheelchair) Crosstabulation
Assistive mobility device (ex.
wheelchair) Total
Yes Car Occasionally Count 1 1 Column % 100.0% 100.0%
Total Count 1 1 Column % 100.0% 100.0%

CITY OF OTTAWA TSM STRATEGY – TRAVEL DIARY TABULATIONS
A total of744 trips were logged by 82 individuals between July 25th and August 11th, 2010.
www.nanosresearch.com - Page 53
During the winter, how often do you use the following modes of transportation as a primary means of getting around the city? Transit * Age Crosstabulation
Age Total
18 to 44 45+ Transit Regularly Count 19 12 31 Column % 50.0% 27.3% 37.8% Occasionally Count 8 21 29 Column % 21.1% 47.7% 35.4% Never Count 11 11 22 Column % 28.9% 25.0% 26.8%
Total Count 38 44 82 Column % 100.0% 100.0% 100.0%
During the winter, how often do you use the following modes of transportation as a primary means of getting around the city? Transit * Automobile driver Crosstabulation
Automobile driver Total
Yes Transit Regularly Count 5 5 Column % 13.2% 13.2% Occasionally Count 16 16 Column % 42.1% 42.1% Never Count 17 17 Column % 44.7% 44.7%
Total Count 38 38 Column % 100.0% 100.0%
CITY OF OTTAWA TSM STRATEGY – TRAVEL DIARY TABULATIONS
A total of744 trips were logged by 82 individuals between July 25th and August 11th, 2010.
www.nanosresearch.com - Page 54
During the winter, how often do you use the following modes of transportation as a primary means of getting around the city? Transit * Automobile passenger Crosstabulation
Automobile passenger
Total
Yes Transit Regularly Count 2 2 Column % 50.0% 50.0% Never Count 2 2 Column % 50.0% 50.0%
Total Count 4 4 Column % 100.0% 100.0%
During the winter, how often do you use the following modes of transportation as a primary means of getting around the city? Transit * Public transit Crosstabulation
Public transit Total
Yes Transit Regularly Count 18 18 Column % 90.0% 90.0% Occasionally Count 2 2 Column % 10.0% 10.0%
Total Count 20 20 Column % 100.0% 100.0%
CITY OF OTTAWA TSM STRATEGY – TRAVEL DIARY TABULATIONS
A total of744 trips were logged by 82 individuals between July 25th and August 11th, 2010.
www.nanosresearch.com - Page 55
During the winter, how often do you use the following modes of transportation as a primary means of getting around the city? Transit * Bicycle Crosstabulation
Bicycle Total
Yes Transit Regularly Count 4 4 Column % 40.0% 40.0% Occasionally Count 5 5 Column % 50.0% 50.0% Never Count 1 1 Column % 10.0% 10.0%
Total Count 10 10 Column % 100.0% 100.0%
During the winter, how often do you use the following modes of transportation as a primary means of getting around the city? Transit * Walking Crosstabulation
Walking Total
Yes Transit Regularly Count 3 3 Column % 23.1% 23.1% Occasionally Count 8 8 Column % 61.5% 61.5% Never Count 2 2 Column % 15.4% 15.4%
Total Count 13 13 Column % 100.0% 100.0%

CITY OF OTTAWA TSM STRATEGY – TRAVEL DIARY TABULATIONS
A total of744 trips were logged by 82 individuals between July 25th and August 11th, 2010.
www.nanosresearch.com - Page 56
During the winter, how often do you use the following modes of transportation as a primary means of getting around the city? Transit * Assistive mobility device (ex. wheelchair) Crosstabulation
Assistive mobility device (ex.
wheelchair) Total
Yes Transit Regularly Count 1 1 Column % 100.0% 100.0%
Total Count 1 1 Column % 100.0% 100.0%
During the winter, how often do you use the following modes of transportation as a primary means of getting around the city? Bicycle * Age Crosstabulation
Age Total
18 to 44 45+ bicycle Regularly Count 1 1 2 Column % 2.6% 2.3% 2.4% Occasionally Count 3 2 5 Column % 7.9% 4.5% 6.1% Never Count 34 41 75 Column % 89.5% 93.2% 91.5%
Total Count 38 44 82 Column % 100.0% 100.0% 100.0%
During the winter, how often do you use the following modes of transportation as a primary means of getting around the city? Bicycle * Automobile driver Crosstabulation
Automobile driver Total
Yes bicycle Occasionally Count 1 1 Column % 2.6% 2.6% Never Count 37 37 Column % 97.4% 97.4%
Total Count 38 38 Column % 100.0% 100.0%
CITY OF OTTAWA TSM STRATEGY – TRAVEL DIARY TABULATIONS
A total of744 trips were logged by 82 individuals between July 25th and August 11th, 2010.
www.nanosresearch.com - Page 57
During the winter, how often do you use the following modes of transportation as a primary means of getting around the city? Bicycle * Automobile passenger Crosstabulation
Automobile passenger
Total
Yes bicycle Never Count 4 4 Column % 100.0% 100.0%
Total Count 4 4 Column % 100.0% 100.0%
During the winter, how often do you use the following modes of transportation as a primary means of getting around the city? Bicycle * Public transit Crosstabulation
Public transit Total
Yes bicycle Regularly Count 1 1 Column % 5.0% 5.0% Never Count 19 19 Column % 95.0% 95.0%
Total Count 20 20 Column % 100.0% 100.0%
During the winter, how often do you use the following modes of transportation as a primary means of getting around the city? Bicycle * Bicycle Crosstabulation
Bicycle Total
Yes bicycle Regularly Count 1 1 Column % 10.0% 10.0% Occasionally Count 3 3 Column % 30.0% 30.0% Never Count 6 6 Column % 60.0% 60.0%
Total Count 10 10 Column % 100.0% 100.0%
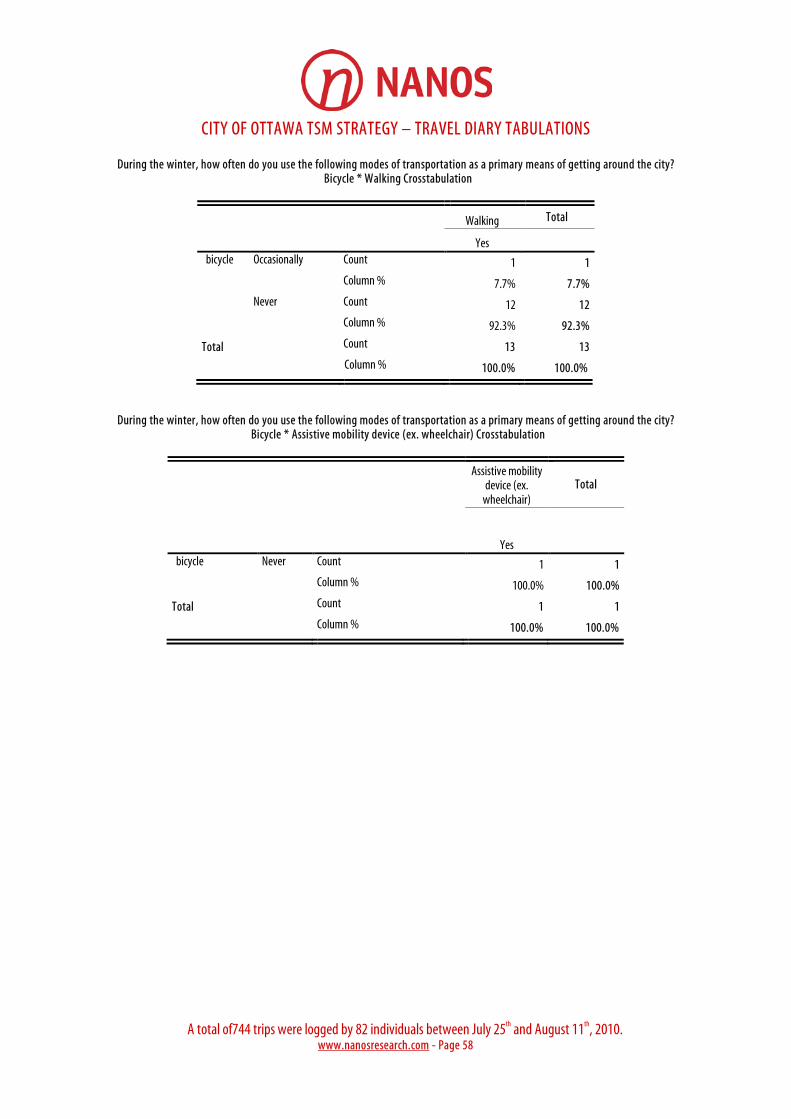
CITY OF OTTAWA TSM STRATEGY – TRAVEL DIARY TABULATIONS
A total of744 trips were logged by 82 individuals between July 25th and August 11th, 2010.
www.nanosresearch.com - Page 58
During the winter, how often do you use the following modes of transportation as a primary means of getting around the city? Bicycle * Walking Crosstabulation
Walking Total
Yes bicycle Occasionally Count 1 1 Column % 7.7% 7.7% Never Count 12 12 Column % 92.3% 92.3%
Total Count 13 13 Column % 100.0% 100.0%
During the winter, how often do you use the following modes of transportation as a primary means of getting around the city? Bicycle * Assistive mobility device (ex. wheelchair) Crosstabulation
Assistive mobility device (ex.
wheelchair) Total
Yes bicycle Never Count 1 1 Column % 100.0% 100.0%
Total Count 1 1 Column % 100.0% 100.0%

CITY OF OTTAWA TSM STRATEGY – TRAVEL DIARY TABULATIONS
A total of744 trips were logged by 82 individuals between July 25th and August 11th, 2010.
www.nanosresearch.com - Page 59
During the winter, how often do you use the following modes of transportation as a primary means of getting around the city?
As a pedestrian * Age Crosstabulation
Age Total
18 to 44 45+ as a pedestrian Regularly Count 17 16 33
Column % 44.7% 36.4% 40.2% Occasionally Count 17 22 39
Column % 44.7% 50.0% 47.6% Never Count 4 6 10
Column % 10.5% 13.6% 12.2%
Total Count 38 44 82 Column % 100.0% 100.0% 100.0%
During the winter, how often do you use the following modes of transportation as a primary means of getting around the city? As a pedestrian * Automobile driver Crosstabulation
Automobile driver Total
Yes as a pedestrian Regularly Count 9 9 Column % 23.7% 23.7% Occasionally Count 22 22 Column % 57.9% 57.9% Never Count 7 7 Column % 18.4% 18.4%
Total Count 38 38 Column % 100.0% 100.0%

CITY OF OTTAWA TSM STRATEGY – TRAVEL DIARY TABULATIONS
A total of744 trips were logged by 82 individuals between July 25th and August 11th, 2010.
www.nanosresearch.com - Page 60
During the winter, how often do you use the following modes of transportation as a primary means of getting around the city? As a pedestrian * Automobile passenger Crosstabulation
Automobile passenger
Total
Yes as a pedestrian Regularly Count 1 1 Column % 25.0% 25.0% Occasionally Count 2 2 Column % 50.0% 50.0% Never Count 1 1 Column % 25.0% 25.0%
Total Count 4 4 Column % 100.0% 100.0%
During the winter, how often do you use the following modes of transportation as a primary means of getting around the city? As a pedestrian * Public transit Crosstabulation
Public transit Total
Yes as a pedestrian Regularly Count 10 10 Column % 50.0% 50.0% Occasionally Count 10 10 Column % 50.0% 50.0%
Total Count 20 20 Column % 100.0% 100.0%
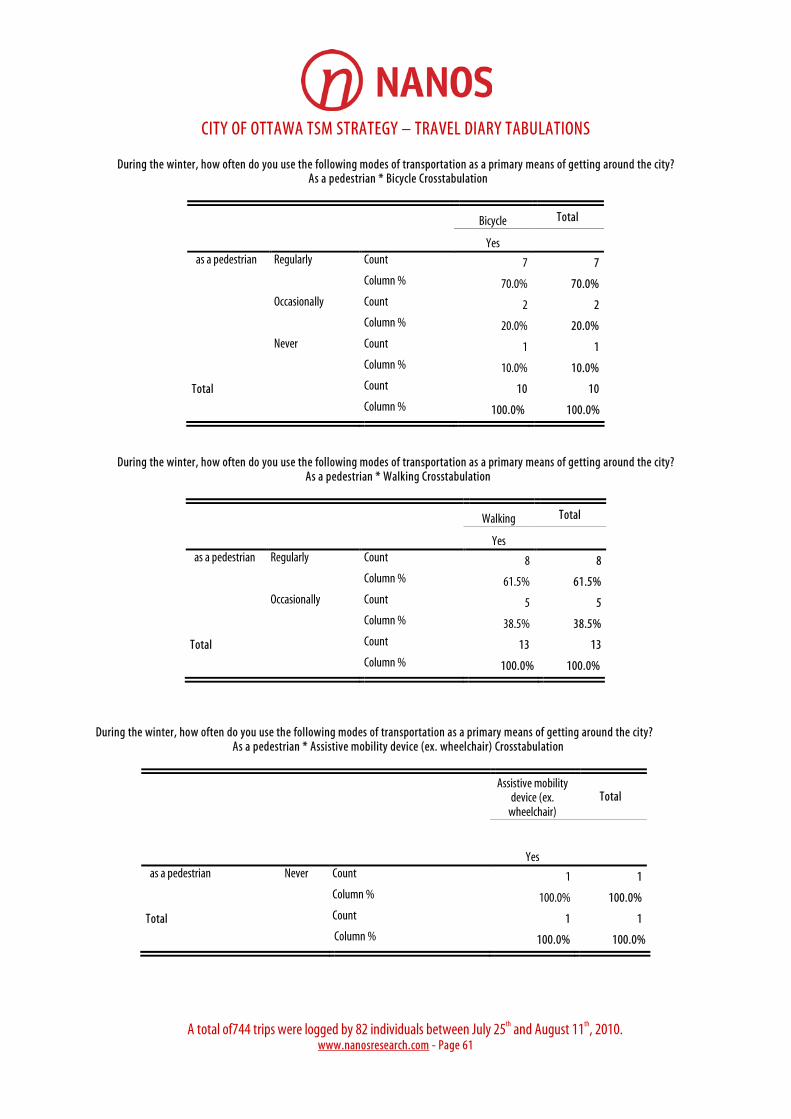
CITY OF OTTAWA TSM STRATEGY – TRAVEL DIARY TABULATIONS
A total of744 trips were logged by 82 individuals between July 25th and August 11th, 2010.
www.nanosresearch.com - Page 61
During the winter, how often do you use the following modes of transportation as a primary means of getting around the city? As a pedestrian * Bicycle Crosstabulation
Bicycle Total
Yes as a pedestrian Regularly Count 7 7 Column % 70.0% 70.0% Occasionally Count 2 2 Column % 20.0% 20.0% Never Count 1 1 Column % 10.0% 10.0%
Total Count 10 10 Column % 100.0% 100.0%
During the winter, how often do you use the following modes of transportation as a primary means of getting around the city? As a pedestrian * Walking Crosstabulation
Walking Total
Yes as a pedestrian Regularly Count 8 8 Column % 61.5% 61.5% Occasionally Count 5 5 Column % 38.5% 38.5%
Total Count 13 13 Column % 100.0% 100.0%
During the winter, how often do you use the following modes of transportation as a primary means of getting around the city?
As a pedestrian * Assistive mobility device (ex. wheelchair) Crosstabulation
Assistive mobility device (ex.
wheelchair) Total
Yes as a pedestrian Never Count 1 1 Column % 100.0% 100.0%
Total Count 1 1 Column % 100.0% 100.0%
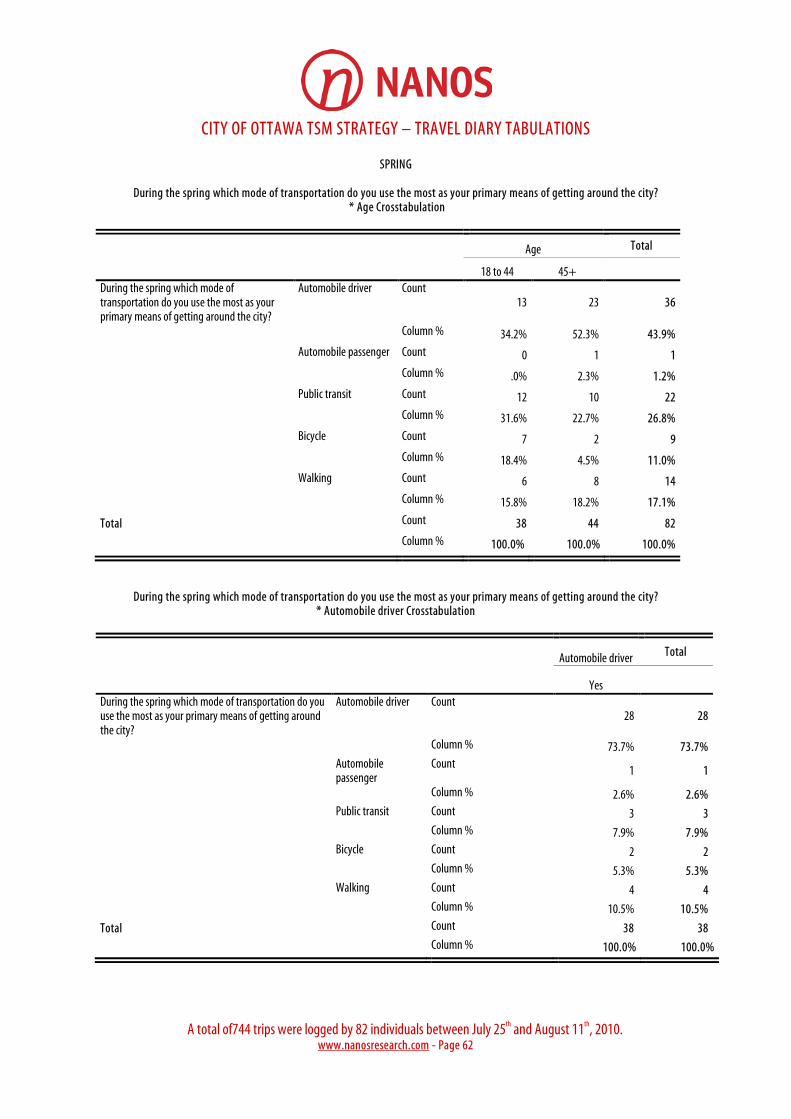
CITY OF OTTAWA TSM STRATEGY – TRAVEL DIARY TABULATIONS
A total of744 trips were logged by 82 individuals between July 25th and August 11th, 2010.
www.nanosresearch.com - Page 62
SPRING
During the spring which mode of transportation do you use the most as your primary means of getting around the city? * Age Crosstabulation
Age Total
18 to 44 45+ During the spring which mode of transportation do you use the most as your primary means of getting around the city?
Automobile driver Count 13 23 36
Column % 34.2% 52.3% 43.9% Automobile passenger Count 0 1 1 Column % .0% 2.3% 1.2% Public transit Count 12 10 22 Column % 31.6% 22.7% 26.8% Bicycle Count 7 2 9 Column % 18.4% 4.5% 11.0% Walking Count 6 8 14 Column % 15.8% 18.2% 17.1%
Total Count 38 44 82 Column % 100.0% 100.0% 100.0%
During the spring which mode of transportation do you use the most as your primary means of getting around the city? * Automobile driver Crosstabulation
Automobile driver Total
Yes During the spring which mode of transportation do you use the most as your primary means of getting around the city?
Automobile driver Count 28 28
Column % 73.7% 73.7% Automobile
passenger Count 1 1
Column % 2.6% 2.6% Public transit Count 3 3 Column % 7.9% 7.9% Bicycle Count 2 2 Column % 5.3% 5.3% Walking Count 4 4 Column % 10.5% 10.5%
Total Count 38 38 Column % 100.0% 100.0%

CITY OF OTTAWA TSM STRATEGY – TRAVEL DIARY TABULATIONS
A total of744 trips were logged by 82 individuals between July 25th and August 11th, 2010.
www.nanosresearch.com - Page 63
During the spring which mode of transportation do you use the most as your primary means of getting around the city? * Automobile passenger Crosstabulation
Automobile passenger
Total
Yes During the spring which mode of transportation do you use the most as your primary means of getting around the city?
Automobile driver Count 3 3
Column % 75.0% 75.0%
Public transit Count 1 1
Column % 25.0% 25.0%
Total Count 4 4 Column % 100.0% 100.0%
During the spring which mode of transportation do you use the most as your primary means of getting around the city? * Public transit Crosstabulation
Public transit Total
Yes During the spring which mode of transportation do you use the most as your primary means of getting around the city?
Automobile driver Count 2 2
Column % 10.0% 10.0% Public transit Count 16 16 Column % 80.0% 80.0% Walking Count 2 2 Column % 10.0% 10.0%
Total Count 20 20 Column % 100.0% 100.0%
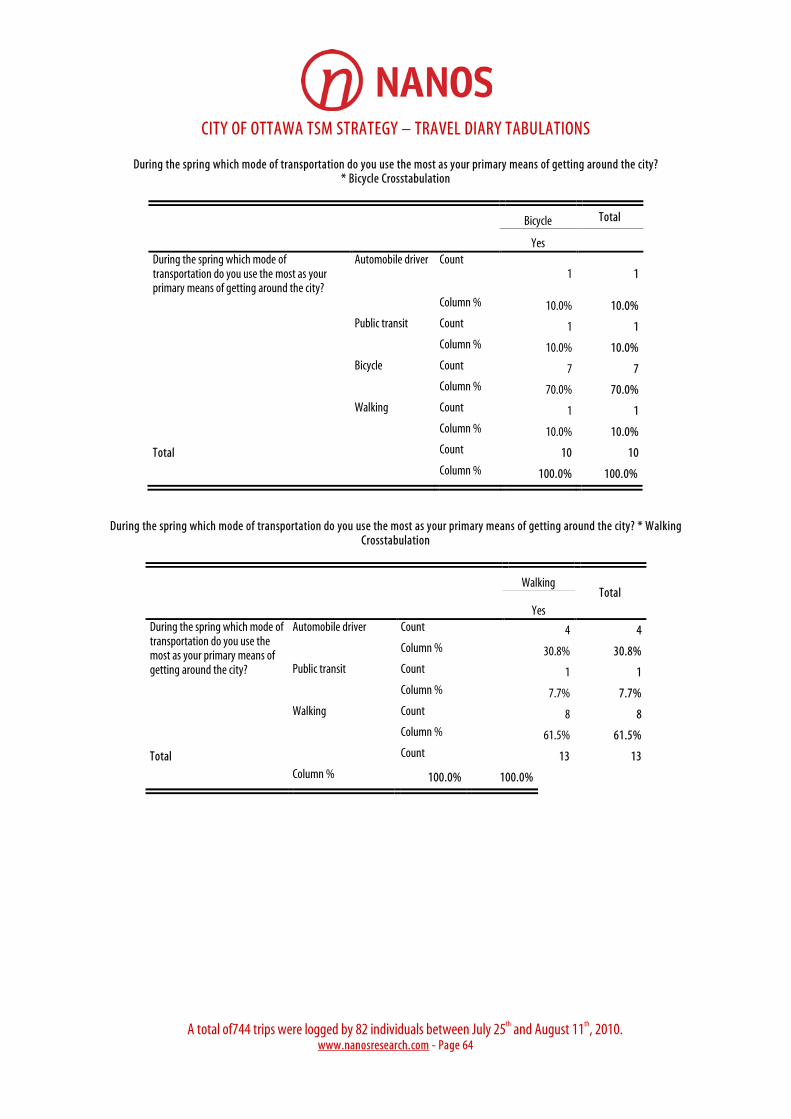
CITY OF OTTAWA TSM STRATEGY – TRAVEL DIARY TABULATIONS
A total of744 trips were logged by 82 individuals between July 25th and August 11th, 2010.
www.nanosresearch.com - Page 64
During the spring which mode of transportation do you use the most as your primary means of getting around the city? * Bicycle Crosstabulation
Bicycle Total
Yes During the spring which mode of transportation do you use the most as your primary means of getting around the city?
Automobile driver Count 1 1
Column % 10.0% 10.0% Public transit Count 1 1 Column % 10.0% 10.0% Bicycle Count 7 7 Column % 70.0% 70.0% Walking Count 1 1 Column % 10.0% 10.0%
Total Count 10 10 Column % 100.0% 100.0%
During the spring which mode of transportation do you use the most as your primary means of getting around the city? * Walking Crosstabulation
Walking Total
Yes During the spring which mode of transportation do you use the most as your primary means of getting around the city?
Automobile driver Count 4 4 Column % 30.8% 30.8%
Public transit Count 1 1 Column % 7.7% 7.7%
Walking Count 8 8 Column % 61.5% 61.5%
Total Count 13 13 Column % 100.0% 100.0%

CITY OF OTTAWA TSM STRATEGY – TRAVEL DIARY TABULATIONS
A total of744 trips were logged by 82 individuals between July 25th and August 11th, 2010.
www.nanosresearch.com - Page 65
During the spring which mode of transportation do you use the most as your primary means of getting around the city?
* Assistive mobility device (ex. wheelchair) Crosstabulation
Assistive mobility device (ex.
wheelchair) Total
Yes During the spring which mode of transportation do you use the most as your primary means of getting around the city?
Public transit Count
1 1
Column % 100.0% 100.0%
Total Count 1 1 Column % 100.0% 100.0%
During the SPRING, how often do you use the following modes of transportation as a primary means of getting around the city?
Car * Automobile driver Crosstabulation
Automobile driver Total
Yes Car Regularly Count 33 33 Column % 86.8% 86.8% Occasionally Count 5 5 Column % 13.2% 13.2%
Total Count 38 38 Column % 100.0% 100.0%
During the SPRING, how often do you use the following modes of transportation as a primary means of getting around the city? Car * Automobile passenger Crosstabulation
Automobile passenger
Total
Yes Car Regularly Count 4 4 Column % 100.0% 100.0%
Total Count 4 4 Column % 100.0% 100.0%
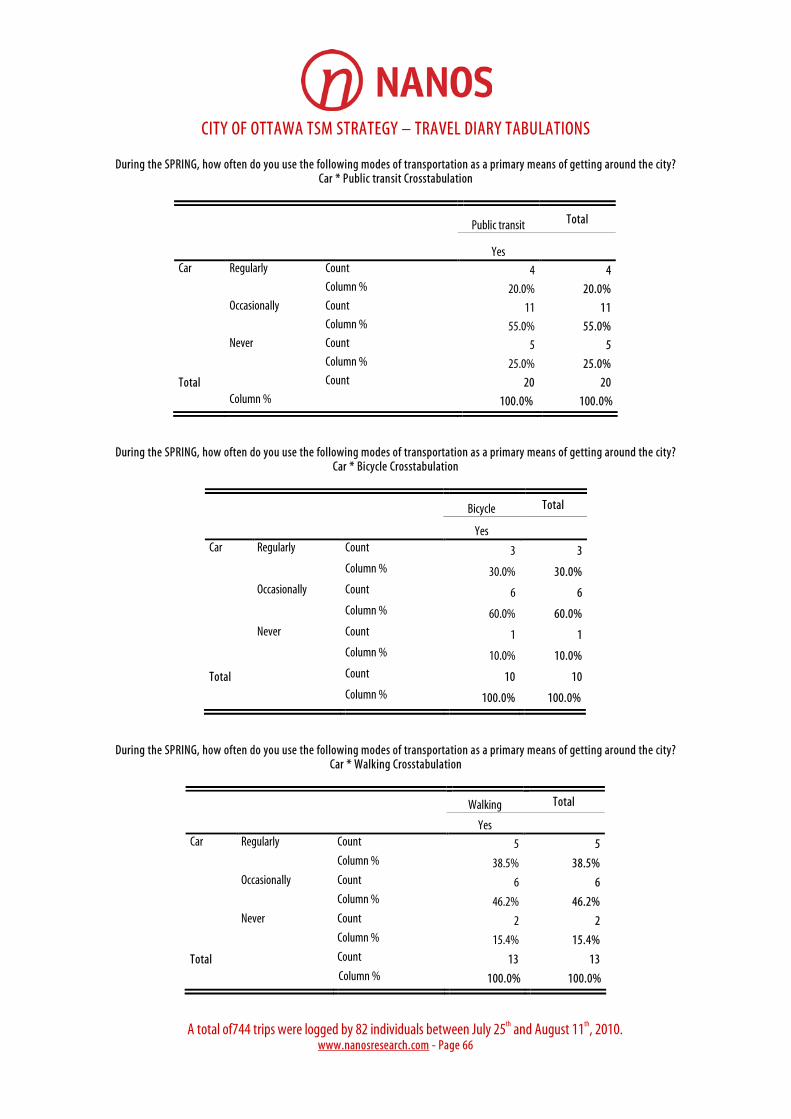
CITY OF OTTAWA TSM STRATEGY – TRAVEL DIARY TABULATIONS
A total of744 trips were logged by 82 individuals between July 25th and August 11th, 2010.
www.nanosresearch.com - Page 66
During the SPRING, how often do you use the following modes of transportation as a primary means of getting around the city? Car * Public transit Crosstabulation
Public transit Total
Yes Car Regularly Count 4 4 Column % 20.0% 20.0% Occasionally Count 11 11 Column % 55.0% 55.0% Never Count 5 5 Column % 25.0% 25.0%
Total Count 20 20 Column % 100.0% 100.0%
During the SPRING, how often do you use the following modes of transportation as a primary means of getting around the city? Car * Bicycle Crosstabulation
Bicycle Total
Yes Car Regularly Count 3 3 Column % 30.0% 30.0% Occasionally Count 6 6 Column % 60.0% 60.0% Never Count 1 1 Column % 10.0% 10.0%
Total Count 10 10 Column % 100.0% 100.0%
During the SPRING, how often do you use the following modes of transportation as a primary means of getting around the city? Car * Walking Crosstabulation
Walking Total
Yes Car Regularly Count 5 5 Column % 38.5% 38.5% Occasionally Count 6 6 Column % 46.2% 46.2% Never Count 2 2 Column % 15.4% 15.4%
Total Count 13 13 Column % 100.0% 100.0%
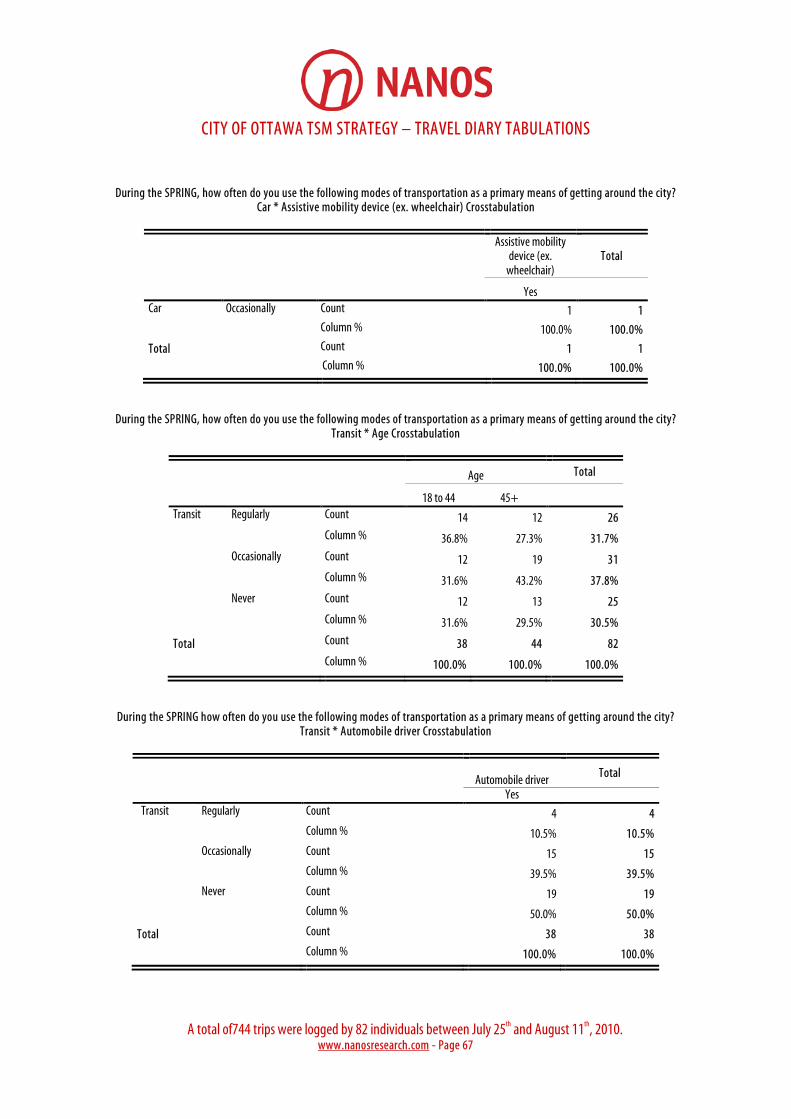
CITY OF OTTAWA TSM STRATEGY – TRAVEL DIARY TABULATIONS
A total of744 trips were logged by 82 individuals between July 25th and August 11th, 2010.
www.nanosresearch.com - Page 67
During the SPRING, how often do you use the following modes of transportation as a primary means of getting around the city? Car * Assistive mobility device (ex. wheelchair) Crosstabulation
Assistive mobility device (ex.
wheelchair) Total
Yes Car Occasionally Count 1 1 Column % 100.0% 100.0%
Total Count 1 1 Column % 100.0% 100.0%
During the SPRING, how often do you use the following modes of transportation as a primary means of getting around the city? Transit * Age Crosstabulation
Age Total
18 to 44 45+ Transit Regularly Count 14 12 26 Column % 36.8% 27.3% 31.7% Occasionally Count 12 19 31 Column % 31.6% 43.2% 37.8% Never Count 12 13 25 Column % 31.6% 29.5% 30.5%
Total Count 38 44 82 Column % 100.0% 100.0% 100.0%
During the SPRING how often do you use the following modes of transportation as a primary means of getting around the city? Transit * Automobile driver Crosstabulation
Automobile driver Total
Yes Transit Regularly Count 4 4 Column % 10.5% 10.5% Occasionally Count 15 15 Column % 39.5% 39.5% Never Count 19 19 Column % 50.0% 50.0%
Total Count 38 38 Column % 100.0% 100.0%
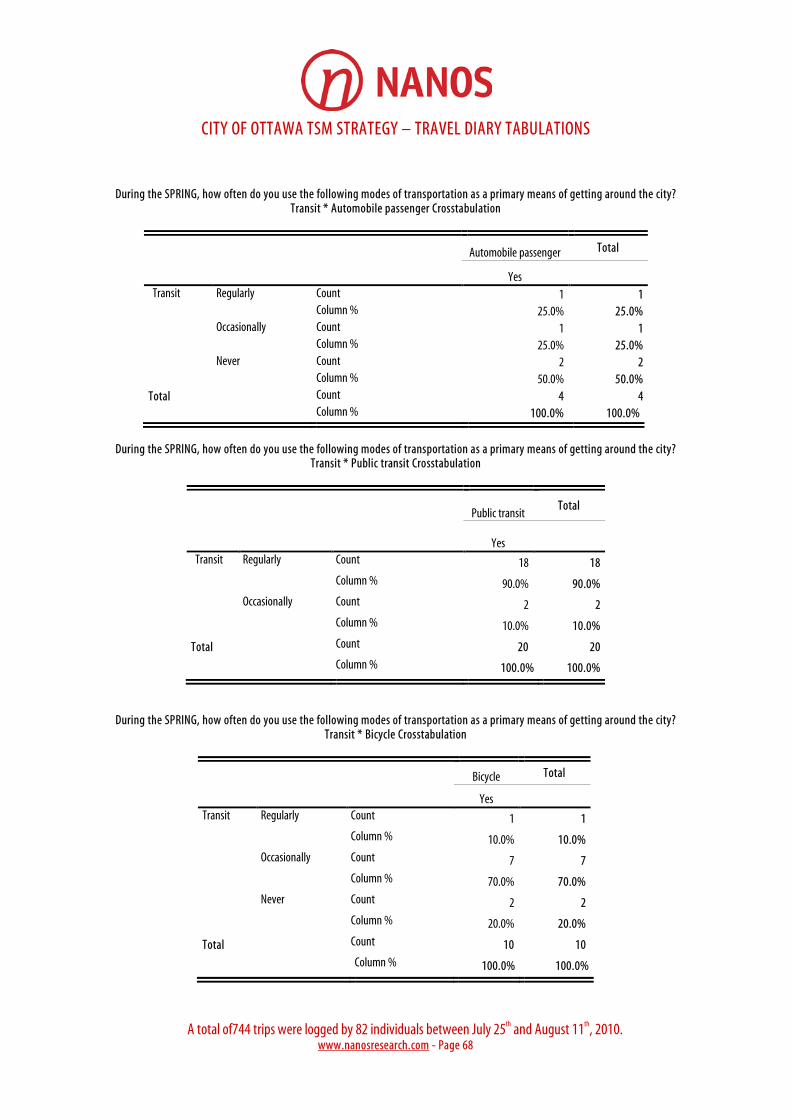
CITY OF OTTAWA TSM STRATEGY – TRAVEL DIARY TABULATIONS
A total of744 trips were logged by 82 individuals between July 25th and August 11th, 2010.
www.nanosresearch.com - Page 68
During the SPRING, how often do you use the following modes of transportation as a primary means of getting around the city? Transit * Automobile passenger Crosstabulation
Automobile passenger Total
Yes Transit Regularly Count 1 1 Column % 25.0% 25.0% Occasionally Count 1 1 Column % 25.0% 25.0% Never Count 2 2 Column % 50.0% 50.0% Total Count 4 4 Column % 100.0% 100.0%
During the SPRING, how often do you use the following modes of transportation as a primary means of getting around the city?
Transit * Public transit Crosstabulation
Public transit Total
Yes Transit Regularly Count 18 18 Column % 90.0% 90.0% Occasionally Count 2 2 Column % 10.0% 10.0%
Total Count 20 20 Column % 100.0% 100.0%
During the SPRING, how often do you use the following modes of transportation as a primary means of getting around the city? Transit * Bicycle Crosstabulation
Bicycle Total
Yes Transit Regularly Count 1 1 Column % 10.0% 10.0% Occasionally Count 7 7 Column % 70.0% 70.0% Never Count 2 2 Column % 20.0% 20.0%
Total Count 10 10 Column % 100.0% 100.0%
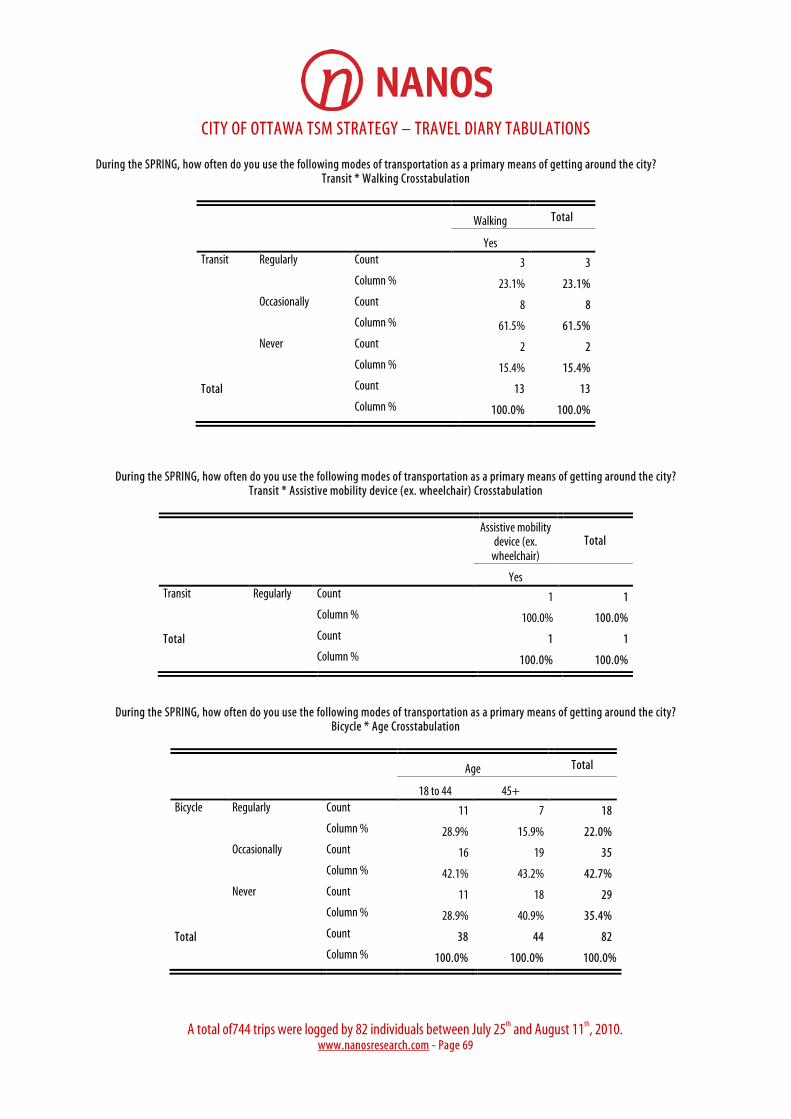
CITY OF OTTAWA TSM STRATEGY – TRAVEL DIARY TABULATIONS
A total of744 trips were logged by 82 individuals between July 25th and August 11th, 2010.
www.nanosresearch.com - Page 69
During the SPRING, how often do you use the following modes of transportation as a primary means of getting around the city? Transit * Walking Crosstabulation
Walking Total
Yes Transit Regularly Count 3 3 Column % 23.1% 23.1% Occasionally Count 8 8 Column % 61.5% 61.5% Never Count 2 2 Column % 15.4% 15.4%
Total Count 13 13 Column % 100.0% 100.0%
During the SPRING, how often do you use the following modes of transportation as a primary means of getting around the city? Transit * Assistive mobility device (ex. wheelchair) Crosstabulation
Assistive mobility device (ex.
wheelchair) Total
Yes Transit Regularly Count 1 1 Column % 100.0% 100.0%
Total Count 1 1 Column % 100.0% 100.0%
During the SPRING, how often do you use the following modes of transportation as a primary means of getting around the city? Bicycle * Age Crosstabulation
Age Total
18 to 44 45+ Bicycle Regularly Count 11 7 18 Column % 28.9% 15.9% 22.0% Occasionally Count 16 19 35 Column % 42.1% 43.2% 42.7% Never Count 11 18 29 Column % 28.9% 40.9% 35.4%
Total Count 38 44 82 Column % 100.0% 100.0% 100.0%

CITY OF OTTAWA TSM STRATEGY – TRAVEL DIARY TABULATIONS
A total of744 trips were logged by 82 individuals between July 25th and August 11th, 2010.
www.nanosresearch.com - Page 70
During the SPRING, how often do you use the following modes of transportation as a primary means of getting around the city? Bicycle * Automobile driver Crosstabulation
Automobile driver Total
Yes Bicycle Regularly Count 7 7 Column % 18.4% 18.4% Occasionally Count 20 20 Column % 52.6% 52.6% Never Count 11 11 Column % 28.9% 28.9%
Total Count 38 38 Column % 100.0% 100.0%
During the SPRING, how often do you use the following modes of transportation as a primary means of getting around the city? Bicycle * Automobile passenger Crosstabulation
Automobile passenger Total
Yes Bicycle Regularly Count 1 1 Column % 25.0% 25.0% Occasionally Count 3 3 Column % 75.0% 75.0%
Total Count 4 4 Column % 100.0% 100.0%
During the spring, how often do you use the following modes of transportation as a primary means of getting around the city? Bicycle * Public transit Crosstabulation
Public transit Total
Yes Bicycle Regularly Count 3 3 Column % 15.0% 15.0% Occasionally Count 6 6 Column % 30.0% 30.0% Never Count 11 11 Column % 55.0% 55.0%
Total Count 20 20 Column % 100.0% 100.0%
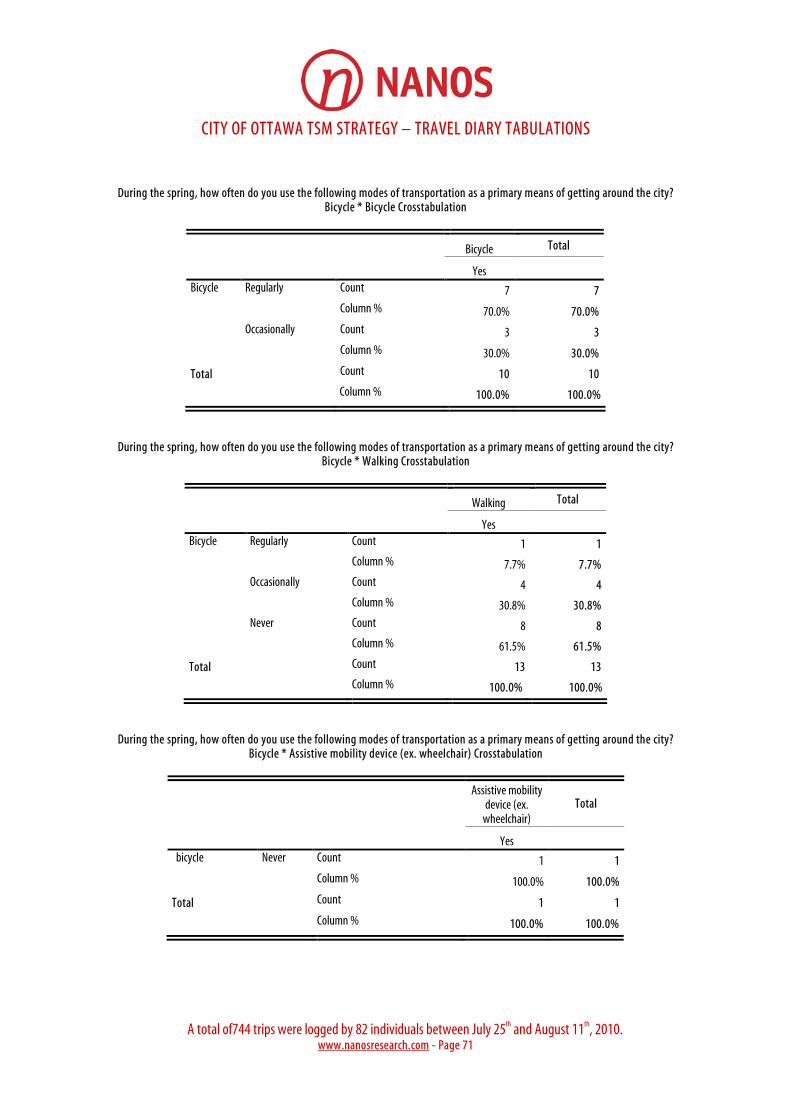
CITY OF OTTAWA TSM STRATEGY – TRAVEL DIARY TABULATIONS
A total of744 trips were logged by 82 individuals between July 25th and August 11th, 2010.
www.nanosresearch.com - Page 71
During the spring, how often do you use the following modes of transportation as a primary means of getting around the city? Bicycle * Bicycle Crosstabulation
Bicycle Total
Yes Bicycle Regularly Count 7 7 Column % 70.0% 70.0% Occasionally Count 3 3 Column % 30.0% 30.0%
Total Count 10 10 Column % 100.0% 100.0%
During the spring, how often do you use the following modes of transportation as a primary means of getting around the city? Bicycle * Walking Crosstabulation
Walking Total
Yes Bicycle Regularly Count 1 1 Column % 7.7% 7.7% Occasionally Count 4 4 Column % 30.8% 30.8% Never Count 8 8 Column % 61.5% 61.5%
Total Count 13 13 Column % 100.0% 100.0%
During the spring, how often do you use the following modes of transportation as a primary means of getting around the city? Bicycle * Assistive mobility device (ex. wheelchair) Crosstabulation
Assistive mobility device (ex.
wheelchair) Total
Yes bicycle Never Count 1 1 Column % 100.0% 100.0%
Total Count 1 1 Column % 100.0% 100.0%

CITY OF OTTAWA TSM STRATEGY – TRAVEL DIARY TABULATIONS
A total of744 trips were logged by 82 individuals between July 25th and August 11th, 2010.
www.nanosresearch.com - Page 72
During the spring, how often do you use the following modes of transportation as a primary means of getting around the city? As a pedestrian * Age Crosstabulation
Age Total
18 to 44 45+ as a pedestrian Regularly Count 22 21 43 Column % 57.9% 47.7% 52.4% Occasionally Count 14 19 33 Column % 36.8% 43.2% 40.2% Never Count 2 4 6 Column % 5.3% 9.1% 7.3%
Total Count 38 44 82 Column % 100.0% 100.0% 100.0%
During the spring, how often do you use the following modes of transportation as a primary means of getting around the city? As a pedestrian * Automobile driver Crosstabulation
Automobile driver Total
Yes as a pedestrian Regularly Count 12 12 Column % 31.6% 31.6% Occasionally Count 21 21 Column % 55.3% 55.3% Never Count 5 5 Column % 13.2% 13.2%
Total Count 38 38 Column % 100.0% 100.0%
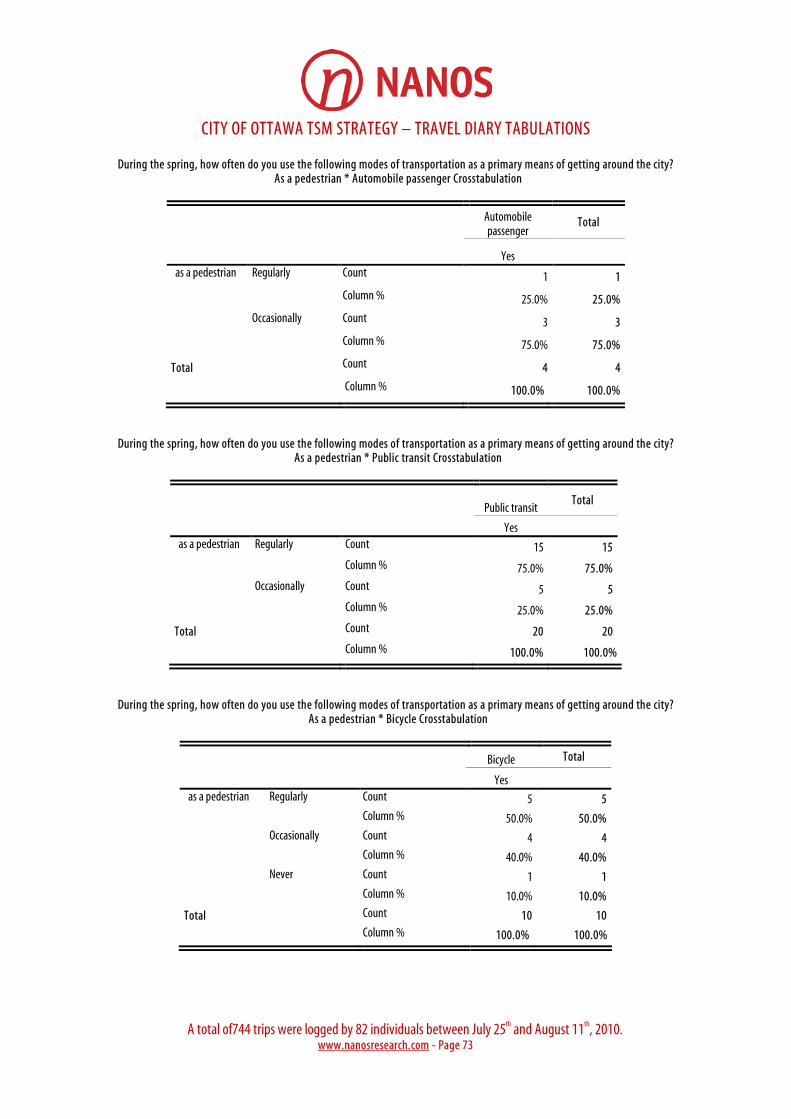
CITY OF OTTAWA TSM STRATEGY – TRAVEL DIARY TABULATIONS
A total of744 trips were logged by 82 individuals between July 25th and August 11th, 2010.
www.nanosresearch.com - Page 73
During the spring, how often do you use the following modes of transportation as a primary means of getting around the city? As a pedestrian * Automobile passenger Crosstabulation
Automobile passenger
Total
Yes as a pedestrian Regularly Count 1 1
Column % 25.0% 25.0%
Occasionally Count 3 3
Column % 75.0% 75.0%
Total Count 4 4
Column % 100.0% 100.0%
During the spring, how often do you use the following modes of transportation as a primary means of getting around the city? As a pedestrian * Public transit Crosstabulation
Public transit Total
Yes as a pedestrian Regularly Count 15 15 Column % 75.0% 75.0% Occasionally Count 5 5 Column % 25.0% 25.0%
Total Count 20 20 Column % 100.0% 100.0%
During the spring, how often do you use the following modes of transportation as a primary means of getting around the city? As a pedestrian * Bicycle Crosstabulation
Bicycle Total
Yes as a pedestrian Regularly Count 5 5 Column % 50.0% 50.0% Occasionally Count 4 4 Column % 40.0% 40.0% Never Count 1 1 Column % 10.0% 10.0%
Total Count 10 10 Column % 100.0% 100.0%
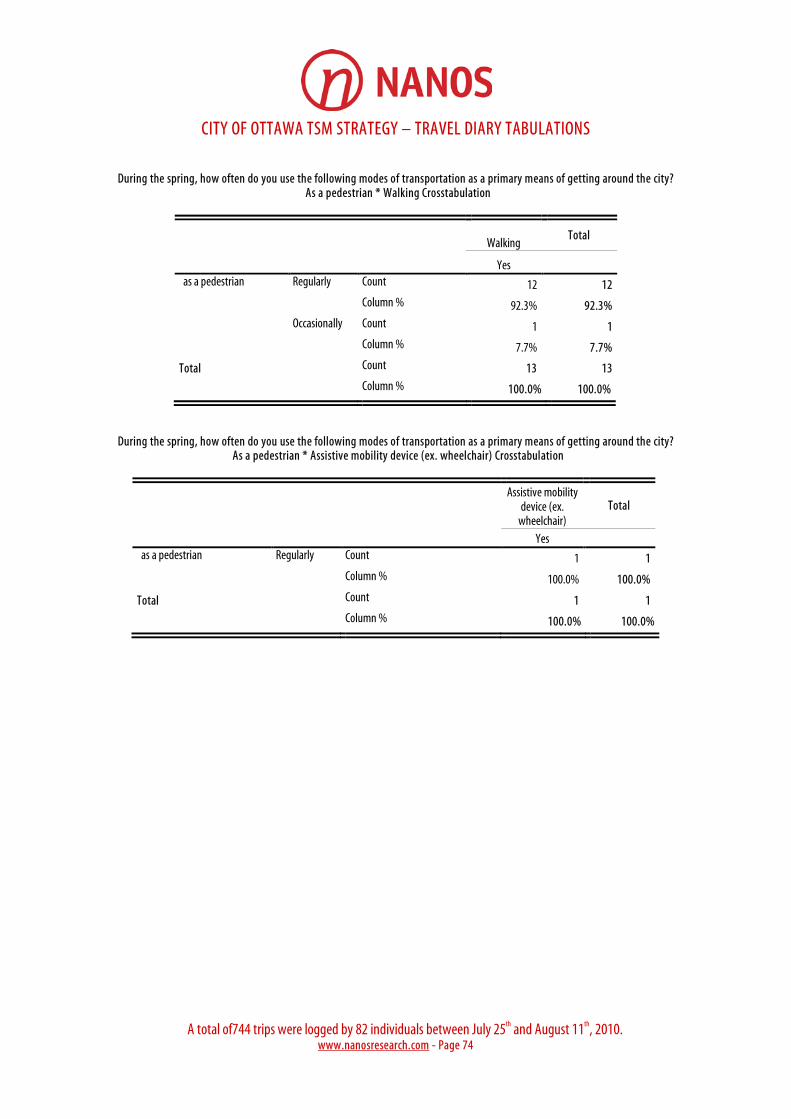
CITY OF OTTAWA TSM STRATEGY – TRAVEL DIARY TABULATIONS
A total of744 trips were logged by 82 individuals between July 25th and August 11th, 2010.
www.nanosresearch.com - Page 74
During the spring, how often do you use the following modes of transportation as a primary means of getting around the city?
As a pedestrian * Walking Crosstabulation
Walking Total
Yes as a pedestrian Regularly Count 12 12 Column % 92.3% 92.3% Occasionally Count 1 1 Column % 7.7% 7.7%
Total Count 13 13 Column % 100.0% 100.0%
During the spring, how often do you use the following modes of transportation as a primary means of getting around the city? As a pedestrian * Assistive mobility device (ex. wheelchair) Crosstabulation
Assistive mobility device (ex.
wheelchair) Total
Yes as a pedestrian Regularly Count 1 1 Column % 100.0% 100.0%
Total Count 1 1 Column % 100.0% 100.0%
Appendix B
Thought-Leader Bios
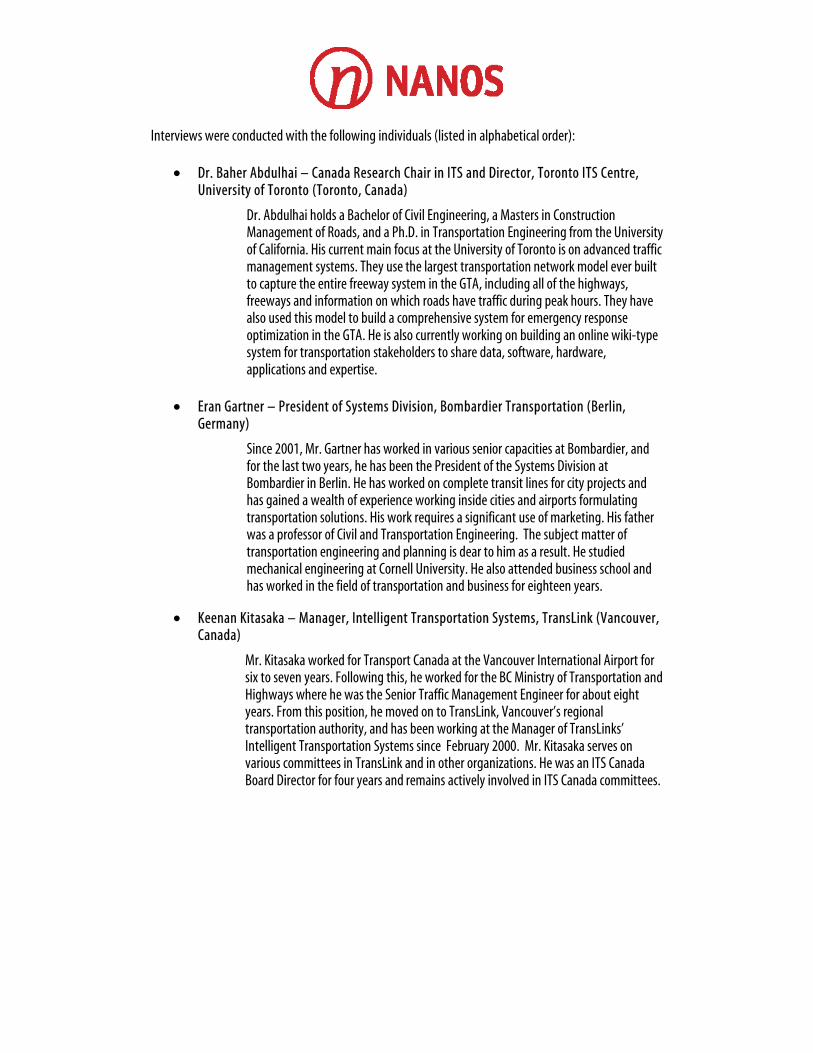
Interviews were conducted with the following individuals (listed in alphabetical order):
• Dr. Baher Abdulhai – Canada Research Chair in ITS and Director, Toronto ITS Centre, University of Toronto (Toronto, Canada)
Dr. Abdulhai holds a Bachelor of Civil Engineering, a Masters in Construction Management of Roads, and a Ph.D. in Transportation Engineering from the University of California. His current main focus at the University of Toronto is on advanced traffic management systems. They use the largest transportation network model ever built to capture the entire freeway system in the GTA, including all of the highways, freeways and information on which roads have traffic during peak hours. They have also used this model to build a comprehensive system for emergency response optimization in the GTA. He is also currently working on building an online wiki-type system for transportation stakeholders to share data, software, hardware, applications and expertise.
• Eran Gartner – President of Systems Division, Bombardier Transportation (Berlin,
Germany)
Since 2001, Mr. Gartner has worked in various senior capacities at Bombardier, and for the last two years, he has been the President of the Systems Division at Bombardier in Berlin. He has worked on complete transit lines for city projects and has gained a wealth of experience working inside cities and airports formulating transportation solutions. His work requires a significant use of marketing. His father was a professor of Civil and Transportation Engineering. The subject matter of transportation engineering and planning is dear to him as a result. He studied mechanical engineering at Cornell University. He also attended business school and has worked in the field of transportation and business for eighteen years.
• Keenan Kitasaka – Manager, Intelligent Transportation Systems, TransLink (Vancouver, Canada)
Mr. Kitasaka worked for Transport Canada at the Vancouver International Airport for six to seven years. Following this, he worked for the BC Ministry of Transportation and Highways where he was the Senior Traffic Management Engineer for about eight years. From this position, he moved on to TransLink, Vancouver’s regional transportation authority, and has been working at the Manager of TransLinks’ Intelligent Transportation Systems since February 2000. Mr. Kitasaka serves on various committees in TransLink and in other organizations. He was an ITS Canada Board Director for four years and remains actively involved in ITS Canada committees.
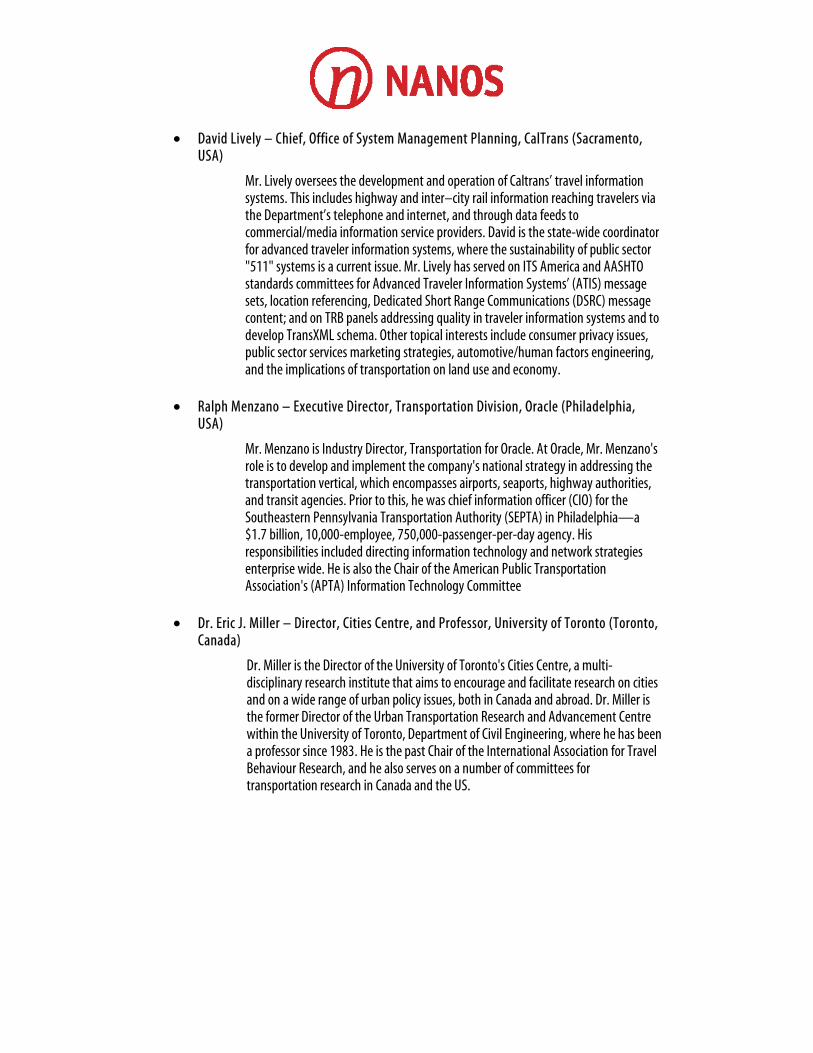
• David Lively – Chief, Office of System Management Planning, CalTrans (Sacramento, USA)
Mr. Lively oversees the development and operation of Caltrans’ travel information systems. This includes highway and inter–city rail information reaching travelers via the Department’s telephone and internet, and through data feeds to commercial/media information service providers. David is the state-wide coordinator for advanced traveler information systems, where the sustainability of public sector "511" systems is a current issue. Mr. Lively has served on ITS America and AASHTO standards committees for Advanced Traveler Information Systems’ (ATIS) message sets, location referencing, Dedicated Short Range Communications (DSRC) message content; and on TRB panels addressing quality in traveler information systems and to develop TransXML schema. Other topical interests include consumer privacy issues, public sector services marketing strategies, automotive/human factors engineering, and the implications of transportation on land use and economy.
• Ralph Menzano – Executive Director, Transportation Division, Oracle (Philadelphia,
USA)
Mr. Menzano is Industry Director, Transportation for Oracle. At Oracle, Mr. Menzano's role is to develop and implement the company's national strategy in addressing the transportation vertical, which encompasses airports, seaports, highway authorities, and transit agencies. Prior to this, he was chief information officer (CIO) for the Southeastern Pennsylvania Transportation Authority (SEPTA) in Philadelphia—a $1.7 billion, 10,000-employee, 750,000-passenger-per-day agency. His responsibilities included directing information technology and network strategies enterprise wide. He is also the Chair of the American Public Transportation Association's (APTA) Information Technology Committee
• Dr. Eric J. Miller – Director, Cities Centre, and Professor, University of Toronto (Toronto,
Canada)
Dr. Miller is the Director of the University of Toronto's Cities Centre, a multi-disciplinary research institute that aims to encourage and facilitate research on cities and on a wide range of urban policy issues, both in Canada and abroad. Dr. Miller is the former Director of the Urban Transportation Research and Advancement Centre within the University of Toronto, Department of Civil Engineering, where he has been a professor since 1983. He is the past Chair of the International Association for Travel Behaviour Research, and he also serves on a number of committees for transportation research in Canada and the US.
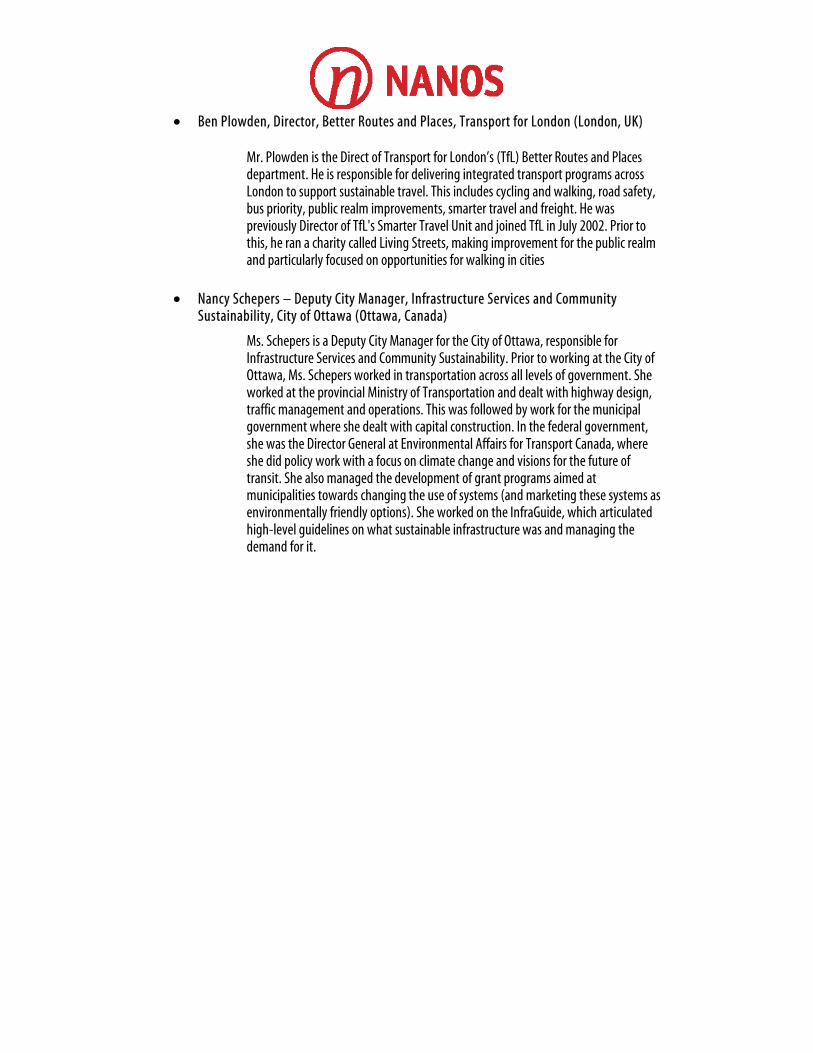
• Ben Plowden, Director, Better Routes and Places, Transport for London (London, UK)
Mr. Plowden is the Direct of Transport for London’s (TfL) Better Routes and Places department. He is responsible for delivering integrated transport programs across London to support sustainable travel. This includes cycling and walking, road safety, bus priority, public realm improvements, smarter travel and freight. He was previously Director of TfL's Smarter Travel Unit and joined TfL in July 2002. Prior to this, he ran a charity called Living Streets, making improvement for the public realm and particularly focused on opportunities for walking in cities
• Nancy Schepers – Deputy City Manager, Infrastructure Services and Community Sustainability, City of Ottawa (Ottawa, Canada)
Ms. Schepers is a Deputy City Manager for the City of Ottawa, responsible for Infrastructure Services and Community Sustainability. Prior to working at the City of Ottawa, Ms. Schepers worked in transportation across all levels of government. She worked at the provincial Ministry of Transportation and dealt with highway design, traffic management and operations. This was followed by work for the municipal government where she dealt with capital construction. In the federal government, she was the Director General at Environmental Affairs for Transport Canada, where she did policy work with a focus on climate change and visions for the future of transit. She also managed the development of grant programs aimed at municipalities towards changing the use of systems (and marketing these systems as environmentally friendly options). She worked on the InfraGuide, which articulated high-level guidelines on what sustainable infrastructure was and managing the demand for it.


