
Optimizing Energy Efficiency
of the Palestra Building London, England
Architectural Renderings compliments of Alsop Architects
Buro Happold

The Palestra BuildingLondon, England ~ Rebecca Allen, Mechanical Option
Project Team•OWNER: Blackfriars Investment and Royal
London Asset Management
•ARCHITECT: Alsop Architects
•MEP ENGINEERS: Buro Happold Ltd.
•GENERAL CONTRACTOR: Skanska UK
•ELECTRICAL CONTRACTOR: Buro Happold Ltd.
•STRUCTURAL CONTRACTOR: Buro Happold Ltd.
Structural
Two-story raked columns at Ground and 7th levels
Steel Construction with Concrete Slab Flooring
9m cantilever achieved through fully fixed Vierendeelgirder from 9th to 12th floors tied to cores.
Lighting/Electrical4 MVA Substation servicing Palestra and surrounding buildings
2 – 1600 amp, 1000 KVA transformers feed Landlord roof plant
4 – 800 amp, 500 KVA transformers feed Tenant Load
415V 3 Phase Service to Tenant areas.
www.arche.psu.edu/thesis/eportfolio/current/portfolios/rsa126/
ArchitectureSize: 37,098 m2
Floors: 12
Cost: £68 million
Features:
- ‘Dancing’ Columns
- 3-9m cantilevers
- 11 degree slant on façade
- Floating Box Effect
Completion Date: June 2006
MechanicalGood BREEAM Rating (equivalent to LEED rating)
Gas-Fired central boiler system
Centralized Chiller Plant
Mechanically Ventilated due to Urban location
4-pipe fan coil system with units placed within structural grids to achieve most versatile open space floor plan available
Construction FeaturesThe proximity to the Jubilee line on the Underground
required all lifts to be under 8.5 tons, resulting in the use of composite steel beams, structurally efficient, lightweight, and easy to assemble on site.
More steel used in the 7th-9th floor than the 3rd-6th levels combined.
Rebecca S. Allen
The Palestra Building London, England
1
Table of Contents Page
Abstract INSERT
I. Executive Summary 2
II. Acknowledgements 3
III. Introduction – Project Background 4
IV. Building Background 5
V. Mechanical Depth 19
a. Existing Conditions 19
b. Chiller Plant Optimization 27
i. Proposed Redesign: IC Engine-driven Chiller Plant
c. Ventilation Optimization 32
i. Proposed Redesign: Dedicated Outdoor Air System with Chilled
Beams
d. Comparison and Results 41
VI. Renewable Resource Breadths 42
a. Solar Energy – Photovoltaic Cells 42
b. Wind Energy – Wind Turbine 45
VII. Acoustical Breadth – Mechanical Noise Impact on Community 48
VIII. Summary of Results and Conclusion 54
IX. References 56
Appendix A – Existing Conditions: Loads Appendix B – Chiller Optimization Data Appendix C – DOAS Data Appendix D – Trace Output Appendix E – Solar Energy Calculations Appendix F – Wind Energy Data

Rebecca S. Allen
The Palestra Building London, England
2
I. Executive Summary
This report studies the energy optimization of The Palestra Office Building in London,
England, by analyzing proposed systems such as an IC engine-driven chiller plant, Dedicated
Outdoor Air System (DOAS) as well as the integration of Solar PV Cells and Wind turbines
and their acoustical impact on the design. This research was carried out while following the
guidelines set forth by The Pennsylvania State University Department of Architectural
Engineering.
A variety of resources, references, and software programs were utilized to complete the study
of the chiller plant, ventilation system, and ‘green’ technology opportunities, including
Trane’s™ Trace® 700 program and RETScreen® International Clean Energy Act Analysis
Software. These materials were used to create the application of the engine driven chiller
plant and Dedicated Outdoor Air System for the Palestra Building. Following the mechanical
analysis of these systems it was found that with the addition of the engine driven chiller plant
produced 22,886,070 kWh savings in annual energy consumption, and an 8.7% reduction in
Life Cycle costs. The analysis of the DOAS design resulted in a 27,776,698 kWh savings in
annual consumption, and a 10.31% reduction in Life Cycle costs. Due to the improvements
that each system had on the overall efficiency of the building, an analysis was completed with
the integration of both designs. This ‘hybrid’ design resulted in a 28,985,950 kWh annual
savings, and a 10.2% reduction in Life Cycle costs. This proves that the proposed designs
provide excellent financial savings, as well as a reduced environmental impact, which is the
prime focus of the newest building regulations in the UK.
In addition, breadth work was completed on secondary topics, including the acoustic levels of
the new chillers, as well as, the addition of green technologies such as Solar PV panels and
Wind Turbines. A Composite Noise Rating analysis was completed for both the existing and
proposed chiller plants, finding that there was not an increase in the noise level dramatic
enough to warrant the installation of additional acoustic barriers at this time.

Rebecca S. Allen
The Palestra Building London, England
3
The study of the Solar and Wind energies provided mixed results. These additions are driven
by the newest tenant for the building, and due to the timing of their request so late in the
construction phase the layout of the equipment on the roof is already confirmed, creating
obstacles for installing equipment that depends so heavily on placement, orientation, and floor
area. Combined with the low average wind speed in London, both systems had a less than
desirable payback period, 9 years for the Solar panels and over 2000 years for the Wind
Turbines. It is strongly recommended that the owner abandon the idea of a wind system and
out the additional roof area and funds into improving the efficiency of the Solar system.

Rebecca S. Allen
The Palestra Building London, England
4
Buro Happold
II. Acknowledgements
This report and all the research required to complete it would not have been made possible
without the support and mentorship from numerous individuals and companies.
First, I would like to thank my parents, Pam and Rick Allen, as well as my sisters, Katie and
Christy. They have been my greatest supporters and the rock I have leaned on from the day I
decided I wanted to be an Architectural Engineer from Penn State.
I would also like to acknowledge the people that made my research possible by providing me
with the resources, materials, and guidance I needed: Pirooz Kani and Robert Okpala, Buro
Happold; Stephen Fox, Skanska; Blackfriars Investments, Building Owner.
*A special thank you to Buro Happold for awarding me with the Happold Trust Scholarship,
and granting me an internship in their London office. The opportunity to experience the
engineering industry from a more worldly perspective was a life-changing experience that has
profoundly impacted my research.
This also would not have been possible without the Architectural Engineering faculty. It is
because of your passion for our industry that I have also come to love building services so
much. The most important lesson you have given me is that learning doesn’t stop at the
classroom door; I will be a life-long learner. And thank you Professor Moses Ling for all of
your encouragement over the years, from my first Honors option with you on Green Design to

Rebecca S. Allen
The Palestra Building London, England
5
study abroad opportunities and advice on real life. Your faith and dedication have truly
inspired me.
In addition I would like to thank the Pennsylvania State University Schreyer Honors College
for their financial support, allowing me to arrange a site visit to London to continue my
research.

Rebecca S. Allen
The Palestra Building London, England
6
III. Introduction – Project Background
The fifth-year curriculum for Architectural Engineering students includes a year-long
design project, where each student selects a recently renovated or constructed building to
study and examine its systems. All design documents and specifications are donated by
the project’s owner, engineers, and contractors. The first half of the year is spent writing
three technical papers on the existing conditions of the design looking at its code
compliance, energy efficiency, utility consumption, and budget. Once a good sense of the
building’s systems has been gained a redesign is proposed to increase the efficiency of the
existing design. This proposal must include a detailed analysis within the student’s area
of specialty (lighting/electrical, mechanical, structural, construction management), as well
as two additional studies into non-option areas. The second half of the year is then spent
implementing the design schemes set forth in the proposal. The year ends with the
completion of the final thesis report and presentation to the jury consisting of
Architectural Engineering faculty.
In addition to the research and analysis, each student is required to create and maintain a
Capstone Project e-portfolio (CPEP) website displaying their progress throughout the
year. This includes all technical reports, proposal and building information. The website
serves as an excellent means of communicating our work with design professionals and
faculty as well as fellow students.
This report is a culmination of a year-long study to optimize the design of the Palestra
Building in London, England with an emphasis on mechanical, solar, wind, and acoustical
systems. The report presents the feasibility the proposed designs and their impact on the
overall scheme of the building. These findings are available only for educational
purposes, and will be shared only with the afore mentioned sponsors.

Rebecca S. Allen
The Palestra Building London, England
7
IV. Building Background
Architecture and General Information
The Palestra development is currently the largest office building currently under construction
in London, England. Located across the street from the Southwark tube station, and just
minutes from the Tate Modern museum as well as Waterloo Station, Palestra was destined to
be a high-profile building. The location only enhances the ‘quirky’ design of the architect,
Will Alsop from Alsop Architects in London.
This twelve story design is not your average office building,
incorporating many dramatic features including two-story
‘dancing’ columns, large cantilevers, and tilted façade. The raked
columns on the 1st and 7th stories were dubbed ‘dancing columns’
for the movement perceived by the observer due to the striking
angles they are erected at. The entire design team finds humor in
the community’s reaction to Palestra. One concerned neighbor
even wrote a letter to the project manager voicing concerns about these columns that were
severely out of plumb, not realizing the intention of the architect.
The average passerby also notices that the building appears to be two large boxes set atop one
another. This effect is achieved at the 9th story where there is a 1.5 meter overhang on three
sides of the building, and then a spectacular 9 meter cantilever overhanging Blackfriars road
on the fourth side. The result is very much a floating effect where there are no visible signs as
to how the top box is held in place with the absence of any diagonal bracing or tensioned
cables.
Accenting these unusual yet inspiring characteristics is the slanted façade present on the lower
‘box’ enhancing the raked columns. All of the floors are horizontal while the façade is at an ll
Figure 3.1 Palestra under Construction

Rebecca S. Allen
The Palestra Building London, England
8
degree slant. This degree is sufficient enough for the façade to touch ground level on the east
side while elevated 2 stories high on the west
side. This creates a very appealing and open
pedestrian walkway while creating an inviting
entrance to those travelers exiting the tube
station. Figure 3.2 North Façade Elevation
Building Envelope
The building is fully glazed, with acoustic glazing on the North and West sides of the bottom
‘box,’ utilizing 5 different types of double glazing. There is an additional colored ceramic frit
pattern across the façade incorporating three colours. These ceramic
frits are 60% solid and 500mm wide.
The façade would allow sufficient daylight to enter the space so that
for a high percentage of the time the electric lighting in the perimeter
areas could be switched off if, resulting to energy savings. Efficient
use of systems and controls and any further energy saving measures
will ensure that the above targets are achieved and the impact of the
building on the environment is minimised.
Construction
Build-ability was a large concern from the beginning of the design process for Palestra
because of the site’s close proximity to roads, the main railway line from Charing Cross, and
the Jubilee line on the underground. Any crane over 8.5 ton is deemed a ‘controlled lift’
requiring special supervision from National Rail, so every effort was made to remain below
this weight. The result was composite steel beams that were structurally efficient as well as
Figure 3.4 Typically Glazing Panel

Rebecca S. Allen
The Palestra Building London, England
9
light-weight and east to assemble on site. The steel frame was also strong enough to hold its
own dead loads, so that the slabs could be poured at a later date.
Because there was a substation located in the basement of the
existing building, a temporary substation also needed to be
erected on the Gambia street side to service the site and
several surrounding buildings during the construction process
and to decommission and remove the old substation as well. Figure 3.5 Steel Erection on Palestra Site
Primary Project Team
Owner: Blackfriars Investments and Royal London Asset Management
Website: www.blackfriars-uk.com, www.rlam.co.uk
Architect: Alsop Architects (Will Alsop)
Website: www.alsoparchitects.com
MEP Engineers: Buro Happold Ltd.
Website: www.burohappold.com
General Contractor: Skanska UK
Website: www.skanska.com
Structural Engineers: Buro Happold Ltd.
Website: www.burohappold.com

Rebecca S. Allen
The Palestra Building London, England
10
Building Systems
ELECTRICAL
A 4MVA substation will be installed in the basement plant room to service Palestra and
surrounding buildings formerly dependent on the substation in Orbit House. The load will be
fed by 4 transformers of 1,000kVA, 1600 amp, each with a capacity of 2 No. 1600 amp,
1000kVA low voltage supplies from this substation would feed landlord plant on the roof. 4
No. 800 amp, 500kVA low voltage supplies service tenant load via busbar risers.
Tenant supplies are based on following electric loadings:
Lighting 15W/m^2
Small Power 30W/m^2
FCU 15W/m^2
Sub-Total 60W/m^2
Office Area 26,000 m^2
Total 1560kW 1835kVA 2780amp
The busbars extend to roof level with a capacity of 4 x 800 amp = 3200 amp, leaving 420
amp, 275 kVA capacity not used by the tenants. This supplies the Landlord’s non-essentials
loads in the basement and at ground level. Then the landlord main distribution board can be
located on the roof adjacent to the main landlord loads.
The main landlord switchboards in the basement feed…
• Boilers and associated pumps
• Sprinkler pumps
• Entrance area lighting and power
• Car Park and plant room lighting and power
• Core Lighting and power on Levels B to 5
• Substation Ventilation
Rebecca S. Allen
The Palestra Building London, England
11
• External Lighting
• Security/Fire control center
• Water tanks and associated pumps
• Loading Dock Lighting and power
The two main landlord LV switchboards at the roof level will be fed by 1600 amp supplies in
XLPE/SWA/LSF cables/busbars from the LE substation, via isolators in the basement, so the
service can be isolated by the landlord’s staff without entering the LE substation.
Each of these main switch panels will have the facility to incorporate power factor correction
equipment to achieve an optimum power factor of 0.95 lagging.
Four tenant distribution boards are provided on each floor serving the area corresponding to
one tenant and fed by metered tap-offs from the busbar risers. These boards feed the lighting,
Fan Coil Units (FCUs), and a small number of ‘cleaners’ sockets on the cores. There will also
be a raised accessible flooring system to provide electrical and data services with maximum
versatility.
Back-up power supplies for Fire Alarm, emergency lighting, voice alarm, BMS head-end,
security systems will be provided by battery power.
LIGHTING
Lighting to the open plan office spaces will be provided using recessed modular fluorescent
luminaries, fitted with high frequency control gear and providing brightness management
complying with the requirements of LG3 category 2. The lighting will be arranged on a
‘checkerboard’ grid with 2.1m between fittings. All luminaries will be plugged into a lighting
relay box mounted in the ceiling. This will allow for local switching to be installed as
partitions are moved around by the tenant, as well as space for additional luminaries to be

Rebecca S. Allen
The Palestra Building London, England
12
installed. These ‘cores’ will also allow for future linking of automatic time-based switching
and daylight control.
When possible in the office areas low energy compact source lamps will be installed for
energy efficiency and ease of maintenance.
The car park and plant room spaces will be fitted with robust fluorescent fittings with lighting
controls designed to minimize lighting of unoccupied spaces.
External lighting will be designed in partnership with the Architect, but will provide adequate
lighting for security and closed-circuit television (CCTV).
Lighting in toilets, stairs, toilet lobbies, and car parks will be controlled by presence detectors.
Lighting in the main lobbies will be BMS time clock controlled to correspond with the tenant
occupancy levels.
Emergency lighting will be battery units with a three hour life at reduced output, and where
possible they will be integrated into the general luminaries.
MECHANICAL
The Palestra building is equipped with a gas-fired central boiler and chiller plant. And due to
the close proximity to surrounding structures as well as the public transport, high quality fresh
air is limited requiring a mechanically ventilated design.
The boiler room is located on the roof, and runs on four boilers, three of which run at 100% to
met the daily demands while the fourth is a backup during times of maintenance or it can be
used as a ‘booster boiler’ to generate the morning warm-up. These boilers service a low

Rebecca S. Allen
The Palestra Building London, England
13
temperature hot water system fed to AHU ventilation systems, fan coil units (FCU), and
heater batteries.
The chiller plant is located on the roof and consists of seven packaged air-cooled chiller units,
six of which run at full load daily, while the seventh serves as a backup unit. These units run
the building’s chilled water system fed to the fan coil units and cooling coils in the air
handling plant. The primary and secondary constant temperature pumps and circuits are
located on the room next to the chiller units. On the office levels the owner required the
design team to achieve a versatile open floor plan layout. Therefore one FCU was placed in
each structural bay. Depending on the desired office layout of the tenant more FCUs can be
added for increase climate control for the employees. This is based on a four-pipe fan coil
system used on each office level, including water-side controls for responsible operation,
room temperature sensors, and variable speed heating and chilled water pumps to conserve
energy.
Because the reception area could be operating 24 hours, it was found to be more efficient to
have an independent system to run separately at off-peak hours. This area is mechanically
heated, cooled and ventilated in the same manner as the rest of the building. However instead
Fig 3.6 Existing Air-Cooled Screw Chillers Fig 3.8 Central Boiler Plant
Fig 3.7 Boiler Pump in Rooftop Plant

Rebecca S. Allen
The Palestra Building London, England
14
of the standard FCU a Direct Expansion FCU was chosen, utilizing heat pumps rather than
LTHW or chilled water.
To meet the minimum fresh air requirements two roof-mounted fresh air ventilation plants
were installed.
All mechanical components are routed through the building’s BMS (Building Management
System) to maximize efficiency.
STRUCTURAL
The structural systems of Palestra are probably one of
its main selling points. As previously mentioned there
are two stories of double height ‘dancing columns’
(raked) on the Ground-First floors as well as the 7th -
8th floors. Each column is paired so that when one is
leaning one way, there is another column leaning the
exact opposite. However, the pairings are spread out so that
this isn’t quickly apparent to an observer. While these loads
balance one another, they also create a strong twisting
moment in the floor slabs that is directed to the stair and lift
cores which use the conventional steel K-braced frames.
There a larger 9m cantilever on the west side of the building
as well. Because the architect placed firm restrictions on the use of diagonal bracing and
more traditional support methods the result is a fully fixed Vierendeel girder from the 9th to
12th floors and tied to the primary cores. This member is made up of very substantial plate
girders with flanges made from 70-80mm plates. There is as much steel on the ninth floor as
the third through sixth floors combined.
Fig 3.9 Steel Framework of Palestra
Fig 3.10 Raked Column Design

Rebecca S. Allen
The Palestra Building London, England
15
Everything between the first and seventh floor is vertical. Then there are two stories of
‘dancing columns,’ and at the ninth floor the steel grid changes from 10m x 7.5m to 12m x
7.5m because of the 1.5m cantilever all around. Due to this transition none of the columns
from the 8th floor meet those on the 9th and the entire grid is offset to the west by 7.5m.
FIRE PROTECTION
Provision has been made for mechanical smoke extract to exit through the current ventilation
extract system, extracting up to 6 air changes per hour. In basement areas the 10 air changes
per hour will be provided. The loading bay will be naturally ventilated with 2.5% of the floor
area open to fresh air.
The upper floors will have sprinkler systems installed, following BS 5306 Part 2 regulations.
Basement and ground floors’ sprinklers will be serviced by the town mains, while the upper
floors will be serviced by a 180 cubic meter water storage tank in the basement. The system
is distributed to the east and west cores and rise throughout the building.
Two fire fighting shafts shall be provided with smoke control within each shaft using the
alternative ‘chimney’ design of smoke shaft following BRE standards. Each shaft will also be
fitted with a dry riser with an outlet at each fire fighting lobby and inlets located at ground
level.
Fig 3.11 Lateral Load Schematic

Rebecca S. Allen
The Palestra Building London, England
16
PLUMBING
There are 2 No 150mm fire supplies from alternate water supplies in Blackfriars Rpad and
Union Street. There are also three water supplies entering the site, one on Blackfriars Road,
one in Union Street, and one in Gambia Street. The Blackfriars supply will service the
building’s domestic water demands because the supply on Gambia is only 100mm diameter
and the 175mm main in Union is already servicing the fire main.
The building’s demand is approximately 4.1L/s with a 4” main.
TELECOMMUNICATIONS
Communication risers will be provided at four locations around the building with two risers
servicing each tenant. Using galvanized cable trays the risers can handle copper, fiber optic
or blown fiber cables as required by the tenant.
Landlord installation will include a structured data cabling scheme servicing the plant rooms,
lift motor rooms, reception, and one outlet per tenant area (4 outlets per floor). A landlord
telephone exchange will be installed to provide for future additions to a building telephone
exchange connection. The BMS and Access Control terminals will also be connected through
the structured data cabling system.
Tenant installation will include the installation and routing of data cabling from wire closets
to user equipment through access flooring provided. Communication links between the
communication risers is limited but can accommodate for fiber optic or multi-pair telephone
cables.
Rebecca S. Allen
The Palestra Building London, England
17
TRANSPORTATION
The central passenger transportation will consist of seven lifts located in the central core.
Each lift will be sized at 1600kg/21 persons each, operate at 1.6 m/s, and meet disabled access
requirements, achieving a waiting time of 30 seconds as recommended by BCO. Each lift
will service all twelve floors, with one serving the basement additionally. The basement
access will be monitored through a card swipe controlled by the BMS. The lift motors will be
located in the roof plant area.
Two 630kg/8person fire fighting lifts have been provided, one in the east core and one in the
west core following BS 5266 and BS 5588. They will have electric traction lift drives and
operate at 1 m/s and will service ground floor through the 11th floor.
An additional goods lift is located in the east core of the building. The good lift is 3000kg/40
persons and will also have the electric traction lift drives and service -1 through 11. The
motor room will be located in the roof plant area, with an additional hoisting system on the
11th floor to lift materials onto the roof.
SPECIAL SYSTEMS
Security
A security system will be installed providing CCTV, access control, entry phone, and intruder
detection. CCTV cameras will be located at all entrances and lobby areas in the building and
will run 24 hours a day. A card access system will allow access into the building and then
between certain areas within the building (i.e. basement lift).
Lightning Protection
A lightning protection scheme will be provided to fully protect the building, its contents and
occupants against possible lightning strikes. Generally an air termination network is installed
Rebecca S. Allen
The Palestra Building London, England
18
across the site, providing an inter-linked grid pattern of high conductivity copper tape located
at roof level. A down conductor network will be provided around the perimeter, leading to
the earth termination network via a test link.
Building Management System (BMS)
The system should have the ability to monitor and or control the following
• Heating, Ventilation and Comfort Cooling Plant and equipment
• AHU plant (fans enable/disable and status<alarm>, filter status <alarm>, flow
<alarm>, damper/valve monitoring)
• Chiller
• Boilers (if appropriate)
• FCUs in tenanted areas to be fitted with controllers and networked for monitoring and
control.
• Pump(s)
• Pressurization Unit
• Toilet Extract Fans
• Gas Valve
• Car Park extract system
• Basement ventilation system
• Cold water booster sets
• Electricity, gas and chilled and low temperature hot water meters
• LV distribution networks
• Fire and Smoke Control System
• Fire Alarm Systems
• Automatic Sprinkler system
• Emergency Generators
• Lifts

Rebecca S. Allen
The Palestra Building London, England
19
V. Mechanical Depth
a. Existing Conditions
Approach and Strategy
The Palestra Building is the result of a
business collaboration between Insignia
Richard Ellis Development and Blackfriars
Investment. The team wanted to create an
iconic landmark office building in southern
London as an effort to spur regeneration in the area. In addition to an exciting and
contemporary design, great efforts were made to develop the most efficient building from
an engineering standpoint as well. With the complex structural systems incorporated
throughout the building with the ‘dancing columns’ and 9 meter cantilever, careful
integration of the building services distribution systems was imperative. Due to the ‘glass
box’ nature of the design, a detailed solar shading study was completed to ensure system
efficiency with minimal impact on the views from the office space.
Key Objectives
• At least 280,000 square feet of office space
• High Asset Value
• Flexible design to meet current and future business needs
• Design should comply with design specification set forth by Insignia Richard Ellis
• Flexible enough to allow for multi-tenant occupiers, up to four per floor
• Minimal impact on Building Services as office layouts are modified
• Cost Effective and Economic design
• Energy Efficient with Low Operating Costs
Figure 5.1 Palestra Under Construction
Rebecca S. Allen
The Palestra Building London, England
20
Occupied Environment
Temperature: The air and radiant temperatures shall meet the occupant’s perception of
their thermal environment comfort zone.
Air Movement: In order to meet the fresh air requirements for comfort while avoiding
draughts the air velocity shall be limited to 0.15m/s in the winter and 0.25 during summer
conditions.
Indoor Air Quality: To maintain appropriate contaminant levels (including C02) from
office equipment and equipment the ventilation system shall be designed for 10-16L/s per
person.
Humidity: Due to the moderate climate found in London, England the only critical season
is winter when the humidity level can fall below 30%.
Acoustics: Too much background noise can be distracting, however a moderate amount
has been proven to enhance concentration and disguise general conversations.
Lighting: Adequate levels of lighting must be provided throughout the building, yet it
must be of the appropriate quality and also coordinate with the day lighting studies.
In addition to these specific strategies it is important to note that when utilizing air as the
predominant means for heating and cooling internal spaces you will be able to satisfy up
to 80% of the occupants. And through the fan coil unit layout chosen for the Palestra
building limits the amount of humidity control the occupants will have, however the
humidity levels should remain between 35-65% most of the year. However individual
user controls will also be provided to account for the psychological aspect of how an
occupant perceives his/her thermal environment.
Rebecca S. Allen
The Palestra Building London, England
21
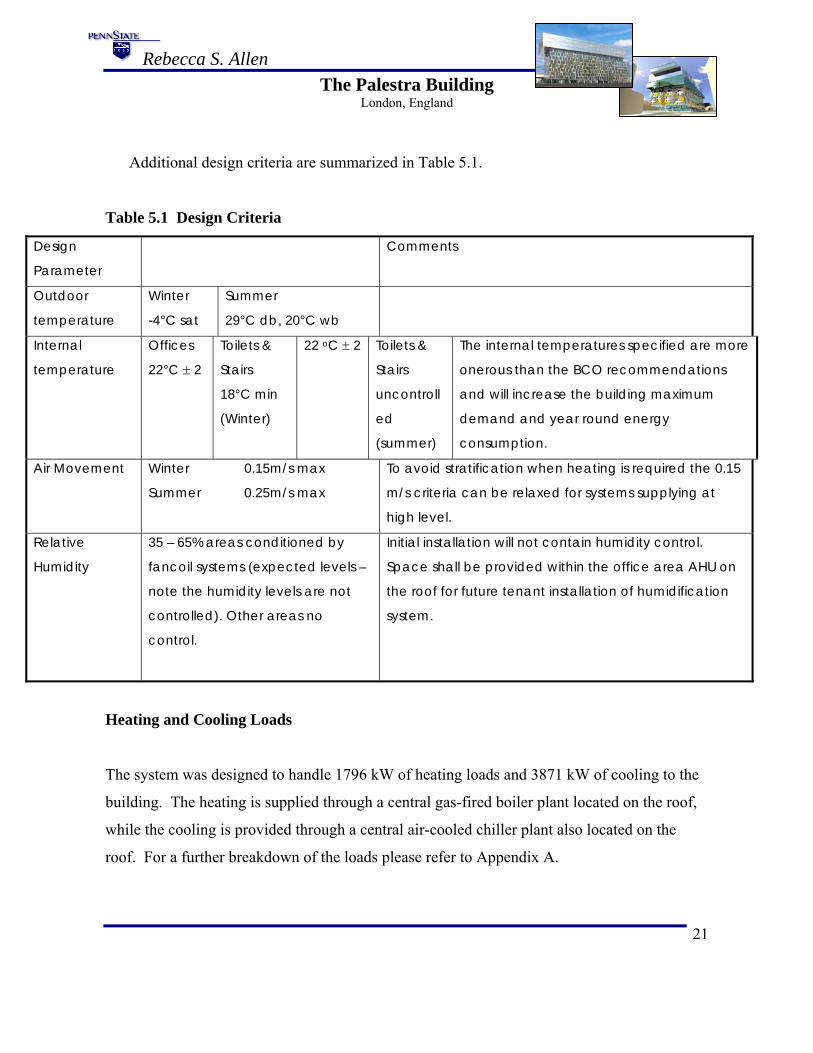
Additional design criteria are summarized in Table 5.1.
Table 5.1 Design Criteria
Design
Parameter
Comments
Outdoor
temperature
Winter
-4°C sat
Summer
29°C db, 20°C wb
Internal
temperature
Offices
22°C ± 2
Toilets &
Stairs
18°C min
(Winter)
22 oC ± 2 Toilets &
Stairs
uncontroll
ed
(summer)
The internal temperatures specified are more
onerous than the BCO recommendations
and will increase the building maximum
demand and year round energy
consumption.
Air Movement Winter 0.15m/s max
Summer 0.25m/s max
To avoid stratification when heating is required the 0.15
m/s criteria can be relaxed for systems supplying at
high level.
Relative
Humidity
35 – 65% areas conditioned by
fancoil systems (expected levels –
note the humidity levels are not
controlled). Other areas no
control.
Initial installation will not contain humidity control.
Space shall be provided within the office area AHU on
the roof for future tenant installation of humidification
system.
Heating and Cooling Loads
The system was designed to handle 1796 kW of heating loads and 3871 kW of cooling to the
building. The heating is supplied through a central gas-fired boiler plant located on the roof,
while the cooling is provided through a central air-cooled chiller plant also located on the
roof. For a further breakdown of the loads please refer to Appendix A.

Rebecca S. Allen
The Palestra Building London, England
22
Air-Side Systems
The air-side ventilation system in the Palestra Building consists of a constant volume system
served by seven different air handling units. Four of the AHUs are located on the roof, two
are located in the basement plant room, and one is located in the level 1 mechanical space.
Air Handling Units 1 and 2 are located on the roof and supply air to 16107m2 of open plan
office space disbursed evenly throughout the twelve levels at a rate of 38,139.84 cfm. Each
AHU maintains a negative pressure of 500 Pa, and includes a heat exchanger in the form of a
heat wheel, a cooling coil, a heating coil, a panel filter of grade G4, and a variable frequency
drive supply and extract fan.
Air Handling Units 3 and 4 service the building’s water closets and are also located in the roof
ventilation plant. Unit 3 supplies air to 498m2 of toilets on the west side of the building, and
Unit 4 supplies ventilation to 627m2 of toilet space on the east side. Each unit is sized to
supply 6,420.21cfm to their respective areas. These are constant volume systems, and each
includes a frost coil, cooling coil, heating coil, as well as supply and extract fans.
Air Handling Units 5 and 6 are located in the basement plant room. Units 5 and 6 are design
to serve as extract systems for the toilets as well as the sprinkler plant and boiler rooms. Each
unit includes a panel filter of grade G4, a cooling coil, and a heating coil. Units 5 and 6 were
designed to provide adequate smoke clearance to these vital mechanical spaces with a flow of
6,356.64 cfm. Approved Document F requires a minimum of 12 m/s face velocity for
ventilation extract in the case of fire.
Air Handling Unit 7 is located in the Ground Floor mechanical room and solely supplies air to
the reception area, 772m2, at a constant volume flow rate of 7,627.97 cfm. This unit contains
a heating coil, cooling coil, a panel filter of grade G4, as well as, supply and extract fans.

Rebecca S. Allen
The Palestra Building London, England
23
Water-Side Systems
The Palestra Building’s water-side systems consist of a centralized boiler and chiller plant.
Cooling is provided through a chiller plant located on the roof and consisting of seven 537
kW packaged air-cooled chiller units, six of which run at full load daily, while the seventh
serves as a backup unit. The total estimated cooling load for the building is 3,291 kW.
Chilled water is provided to the building at 7ºC and returned to the plant at 12ºC. These units
run the building’s chilled water system fed to the fan coil units and cooling coils in the air
handling plant. The primary and secondary constant temperature pumps and circuits are
located on the room next to the chiller units.
Heating is provided through a natural gas-fired central boiler system. The boiler room is
located in the basement, and runs on four 800 kW boilers, three of which run at 100% to meet
the daily demands while the fourth is a backup during times of maintenance or it can be used
as a ‘booster boiler’ to generate the morning warm-up. The estimated heating load for the
building is 2,135 kW. These boilers serve a low temperature hot water system fed to AHU
ventilation systems, fan coil units, and heater batteries and operate with an 11ºC differential.
In addition to these systems there are 314 fan coil units placed on a grid system throughout
the building to maximize thermal comfort. The grid layout reiterates the design goal to create
office spaces that will meet the needs of current and future tenants. Depending on the desired
office layout of the tenant more FCUs can be added for increase climate control for the
employees. This is based on a four-pipe fan coil system used on each office level, including
water-side controls for responsible operation, room temperature sensors, and variable speed
heating and chilled water pumps to conserve energy.

Rebecca S. Allen
The Palestra Building London, England
24
Critique of System
The existing mechanical systems in the Palestra Building were well-designed and efficient,
with the emphasis maintained on the ability of the system to be flexible, catering to its tenants
(current and future), as well as creating a high level of reliability and redundancy.
The centralized boiler and chiller plant will be very useful in the coming years as more
efficient technologies come along. Having all of the systems in one location will make it easy
to replace them at once rather than disrupting locations throughout the building as would be
require with localized heating and cooling systems.
In order to maximize the versatility and flexibility of the rentable office space the design team
created open floor office plans with fan coil units placed on a grid system. This allows the
space to function well with minimal walls and obstructions. However if the tenants desire
more of a closed office layout, or would like to provide their employees with more
personalized control over their environment more fan coil units may be added to this grid,
with additional capacity on AHU-3 and AHU-4 to handle these possible loads.
Accessibility to the main plant rooms was also well-designed with thought put into how future
replacements for all of the equipment will be moved in and out. The fan coil units throughout
the design are located in the suspended ceiling and can be accessed by removing the acoustic
ceiling tiles.
The design team also made a smart choice in selecting the 4 pipe fan coil system, and
providing gas heating versus a 2 pipe unit using electric heating. Not only does Gas provide a
much lower life cycle cost, but it is releases fewer emissions into the environment thus
earning more ‘Green’ points which was a prime objective with the Palestra Building.
With all the benefits of the system and the forward thinking of the design team, there is no set
means to control the humidity levels in the building. It is noted that London, England is a

Rebecca S. Allen
The Palestra Building London, England
25
very moderate climate with minimal humidity issues through the spring, summer and fall
seasons. However, there is a tendency for the humidity level to drop below 35% during the
winter months. Accommodations have been made to allow for future installment of
humidifiers in the Air Handing system as needed. Investigation into the feasibility of a
dedicated outdoor air system could be a possible response to the humidity control issues. A
closer look at what efficiency was compromised in order to maximize the flexibility would
also be valuable, and how much efficiency the Building Management System can compensate
for.
Alternatives Considered
Several schemes for a mechanical redesign of the Palestra Building were contemplated during
the research of existing systems. These included a Combined Heat and Power plant, Day
lighting Aperture Optimization, and possibly reducing the number of air handling units.
Building Combined Heat and Power (BCHP) is becoming increasingly popular as a means to
increase system efficiency and thus decrease emissions by fully burning more of the energy
inputted. With the new emission regulations outlined in Approved Document L and the
increasing rates for electricity this seemed to be an interesting solution. However BCHP
requires a large amount of waste heat and a fairly constant demand load to be most successful.
One possibility was to coordinate a system between Palestra and the surrounding residential
buildings to balance each buildings’ demand peaks, as well as provide the necessary amount
of waste heat. The Palestra already shares an electrical substation in its basement with several
surrounding buildings, so this would have been a continuation of the current setup. This
proposal would require extreme coordination with many stakeholders, and also require a large
amount of floor space in the Palestra Building which is at a premium. The commitment on
behalf of Palestra’s owner would significantly increase, which may not be of interest to them
regardless of the long term gains.
Rebecca S. Allen
The Palestra Building London, England
26
Maximizing the benefits of day lighting can have a large impact on the energy efficiency of a
building, especially within the Palestra Building’s ‘glass box’ design. By increasing the
window efficiency and minimizing the glazing area the overall design could benefit from the
increased insulation. However, due to the extensive research already done in this area by the
design team, there is little probability that a better design could be achieved without
sacrificing the design’s architectural integrity. Therefore the efforts of this research would be
better served investigating other topics.
Reducing the number of air handling units was also a consideration. Currently there are seven
units servicing the building. Two units are dedicated to servicing the toilet areas, two serve as
extracts to the toilets and plant spaces, one supplies the basement and lobby, and two
additional units service all of the office space. It seems a bit imbalanced to have two units
supplying over 80% of the floor area, while five smaller units were included in the design to
serve such little area. However, this design does have excellent redundancy and it has
additional capacity to meet future demands according to the tenant and office layout. In the
end due to the lack of operable windows in the design, and the need for the system to meet
current and future occupant demands to maximize desirability and profit it was decided that
this system is effective as currently designed.

Rebecca S. Allen
The Palestra Building London, England
27
b. Chiller Plant Optimization
i. Proposed Redesign: IC Engine-driven Chiller Plant
Proposed Redesign and Justification
Building design in the United Kingdom is currently undergoing some significant changes with
respect to emissions and energy consumption. Across the country there has been a dramatic
increase in natural gas consumption over the past decade as electric generation has become
more dependent on gas. Compared to other energy resources available gas is still the cheapest
and most efficient option for consumers. Following the publication of the Fuel Poverty
Strategy in 2001 the leaders of the country have been encouraging increased coverage of the
gas network. In a recent publication from the Department of Trade and Industry in the UK,
The Fuel Poverty Strategy reported that the lack of access to gas mains was the main cause of
fuel poverty in 54% of the households included in the study. This is a dramatic example of
the value of gas-driven systems in the UK today. Thus it was deemed beneficial to look into a
natural gas-based system for the Palestra building.
The largest electrically-driven plant in this urban development is the existing chiller plant.
The current design includes seven 535 kW air-cooled screw chillers produced by McQuay.
This report will look at the advantages and disadvantages of replacing the electric chiller plant
with an IC engine-driven plant coupled with the current gas-fired boiler plant.
The current chiller plant in the Palestra Building utilizes electric chillers and provides 18%
additional capacity on the system. While this system functions well in the space, it
accumulates large operating costs in order to meet the peak electric loads during the day. The
current spark gap between peak electric and gas utility costs is over 3 pence per kilowatt-hour.
A gas-based system not only allows for greater efficiency onsite, but the use of current and
future technologies such as thermal storage and other forms of heat recovery. That flexibility

Rebecca S. Allen
The Palestra Building London, England
28
could prove beneficial in the future as the Emission Regulations in the UK become more and
more strict. Flexibility was one of the driving factors throughout the rest of the design, and
should be carried through here.
A hybrid system with IC engines and gas turbines was also considered but due to the low base
load for the building it will not be included in these calculations. Although the building is not
fully operating yet, the calculations have been based on a previous project with a similar
expected load profile. Thus it was deemed more worthy to analyze an IC engine driven
chiller plant.
Calculations
Trace™ 700 was used for all of the energy simulations. Trace™ 700 is a software program
developed and distributed by Trane®, with the ability to model HVAC systems, economic
and utility constraints to easily compare design alternatives.
Table 5.2 Tecogen Gas Engine Driven Chiller
Type Water-Cooled
Series STx Series
Model CH-200x
No. 7
Full Load Rating 200 ton
Fuel Consumption 42.36 m^3/h
Chilled Water Flow 1.81 m^3/min
Physical Data
Length 4.214 m
Width 1.32 m
Height 2.057 m
Weight 9842 kg
Figure 5.2 Tecogen Chiller
Rebecca S. Allen
The Palestra Building London, England
29
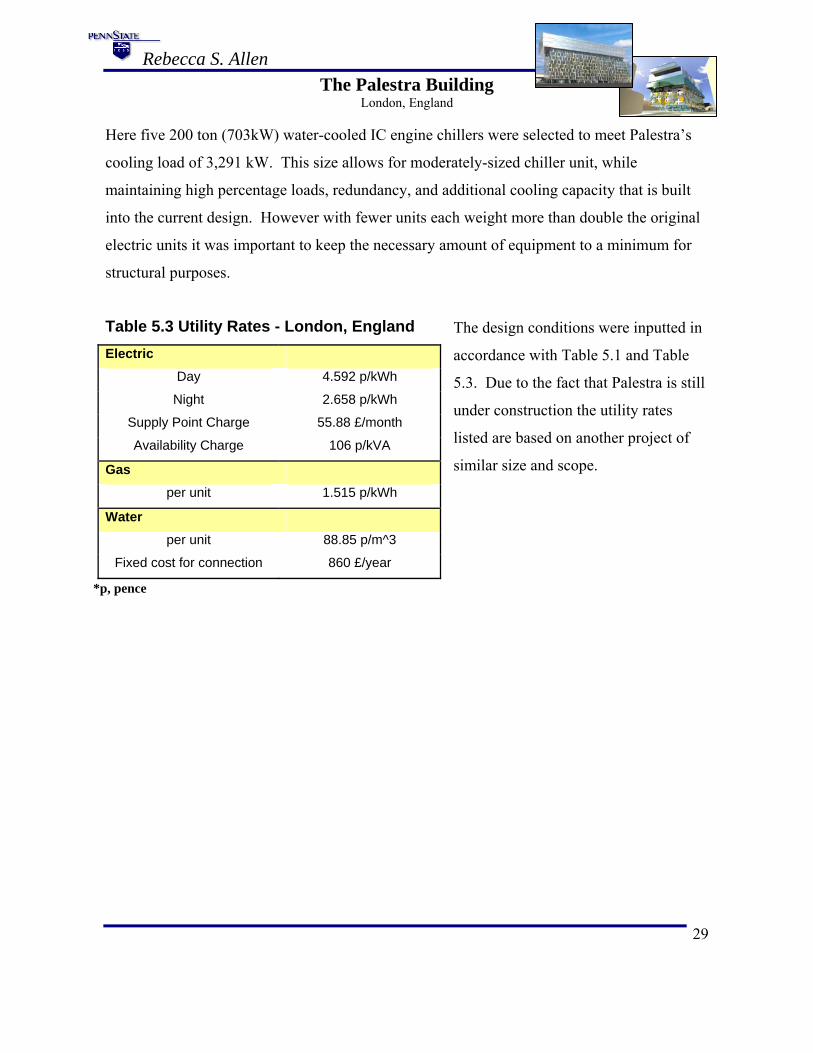
Here five 200 ton (703kW) water-cooled IC engine chillers were selected to meet Palestra’s
cooling load of 3,291 kW. This size allows for moderately-sized chiller unit, while
maintaining high percentage loads, redundancy, and additional cooling capacity that is built
into the current design. However with fewer units each weight more than double the original
electric units it was important to keep the necessary amount of equipment to a minimum for
structural purposes.
The design conditions were inputted in
accordance with Table 5.1 and Table
5.3. Due to the fact that Palestra is still
under construction the utility rates
listed are based on another project of
similar size and scope.
Table 5.3 Utility Rates - London, England Electric
Day 4.592 p/kWh
Night 2.658 p/kWh
Supply Point Charge 55.88 £/month
Availability Charge 106 p/kVA
Gas
per unit 1.515 p/kWh
Water
per unit 88.85 p/m^3
Fixed cost for connection 860 £/year
*p, pence

Rebecca S. Allen
The Palestra Building London, England
30
Results
Table 5.4 Trace™ Energy Consumption Data
Original Electric Scheme Proposed Engine Scheme
Monthly Energy Consumption Energy, kWh Cost, £ Energy, kWh Cost, £
Electric 20,394,152 kWh £937,840.56 12,803,427 kWh £589,274.44
Gas 8,288,669 kWh £14,622.22 8,182,627 kWh £14,435.56
Water -- -- 4,285 kL £11,325.56
Total Monthly Utility Cost £952,462.78 £615,035.56
Total Yearly Consumption 69,913,486 kWh 47,027,416 kWh
Life Cycle Cost £17,704,689.24 £16,163,972.20
The existing heating and airside systems were integrated with the new chiller plant, and the
energy and cost simulation results are summarized in Table 5.4. As compared to the original
electric scheme the gas engine driven plant decreased the yearly energy consumption by 33%.
There are significant savings in electrical usage, reducing monthly consumption by 7,590,725
kWh and £348,566, which could continue to increase as the price of electricity rises relative to
the natural gas rate. On the whole the life cycle costs can be reduced by an additional 8.7%.
Table 5.5 Electric versus IC Engine Chiller Costs
Type
Electric Air-Cooled
Screw
Water-Cooled Engine
Driven
Cost Per Unit £51,320.00 £103,625.00
No. Units 7 5
Total Cost £359,240.00 £518,125.00
Despite the energy savings, it is important to note the difference in first cost for each system
(Table 5.5). While an electric air-cooled screw chiller costs approximately £360,000, an
engine driven chiller is almost £520,000. However, the 44% in capital cost is more than
accounted for by the energy savings as shown in the Life Cycle Cost reductions.

Rebecca S. Allen
The Palestra Building London, England
31
Overall, the gas-engine driven chiller plant could provide significant savings for both
Palestra’s owner and tenants. And with the long term energy crisis in the United Kingdom, a
gas-based system is a smart choice. The other considerations that should be taken into
account are the weight of the new equipment and its structural impact on the building, the
increase in acoustic levels due to the engines, and the actual first costs. Many times the
Utility or government programs will supplement your initial costs when you select an energy
friendly product.

Rebecca S. Allen
The Palestra Building London, England
32
b. Ventilation Optimization
i. Proposed Redesign: Dedicated Outdoor Air System
with Chilled Beams
Proposed Redesign and Justification
The second proposed design is the installation of a dedicated outdoor air system (DOAS)
supplemented with chilled beams throughout the occupied spaces. DOAS not only reduces
the ductwork and equipment sizes, but also increases humidity control and reduces energy and
first costs. This system meets the latent loads by providing dry outdoor air at low
temperatures, while the sensible load is accounted by using the chilled ceiling beams. An
additional benefit of this system is the increased indoor air quality. DOAS could prove to
solve several of the design challenges that faced the Palestra Building regarding its urban
location and lack of humidity controls.
In a 100% outdoor air system such as this the air handling units (AHU) are sized to provide
the minimum amount of fresh air required based on function and occupancy of the space.
These guidelines are set forth in ASHRAE Standard 62, and those values for Palestra are
listed in Table 5.7. In addition an enthalpy wheel is installed in each AHU to maximize heat
recovery while also providing excellent humidity control
where there currently is none. This equipment will meet all
of the building’s latent load, and 38% of the sensible load.
The remainder of the sensible load will be controlled by
chilled beams suspended from the ceiling within the open
office spaces, as shown in Figure 5.3. Figure 5.3 Chilled Beam Diagram

Rebecca S. Allen
The Palestra Building London, England
33
The greatest fault with DOAS is the likelihood for condensation to form if the supply air
temperature would drop below the dew point of the space. Fortunately in the UK where the
weather is quite mild compared to most regions in the United States, the chance of that
happening is greatly decreased.
Calculations
Specifying Set points in Office Air Handling Units
Latent Load:
Occupancy = 1100 people per unit
Q_latent = .0586 kW/person
Q_lat = .0586kW*1100 = 64.46kW (220,000 Btu/h)
Outdoor Air Conditions:
Dry Bulb Temperature = 32ºC
Humidity Ratio = 0.015 kg/kg
Space Air Conditions (Point D):
Dry Bulb Temperature = 26ºC
Humidity Ratio = .0093 kg/kg (65 gr/lbma) moisture content of dry air
Sensible Wheel Latent Wheel
EA
OA C C
A
E
B C
D

Rebecca S. Allen
The Palestra Building London, England
34
Supply Air Temperature: 22ºC
Enthalpy Wheel Selection:
Manufacturer: Novelaire Technologies
Model: ECW1086
Volume Flow Rate = 7644.7 L/s (16200 cfm)
Latent Effectiveness εl = 0.76
Sensible Effectiveness εs = 0.79
Pressure Drop ∆p = 0.74 inches wg
Face Velocity = 520 sfpm = 2.62 m/s
Design Conditions at Point A:
WOA-EW = - εl *(WOA - WEA-SW) + WOA
= -(.76)*(0.15 kg/kg– 0.0093 kg/kg) + 0.015 kg/kg
= 0.0107 kg/kg
DBTOA-EW = - εs *(DBTOA – DBTEW-SW) + DBTOA
= -(.79)*(32ºC – 23.2ºC) + 32ºC
= 25.05ºC
Design Conditions at Point C:
Qlatent = .68*cfm*∆W
WSA = WRA – (Qlatent/(.68*cfm))
= 65 gr/lbma – (220,000Btu/h/(.68*16200cfm))
=45.03 gr/lbma = 0.00643 kg/kg
DBTC = 22ºC
Design Conditions at Point B:
WB = -Qlatent/(.68*cfm) + Wspace
= (-220,000Btu/h)/(.68*16200cfm) + 65 gr/lbma
= 45.03 gr/lbma = 0.00643 kg/kg

Rebecca S. Allen
The Palestra Building London, England
35
[Check: WB = WC, correct]
DBTB = 19.2ºC
Selecting the Number of Chilled Beams Required
The process used to determine the appropriate square footage of chilled beams in the Palestra
Building is described in “Ceiling Radiant Cooling Panels as a Viable Distributed Parallel
Sensible Cooling Technology Integrated with Dedicated Outdoor Air Systems” by Dr. Stanley
A. Mumma and Christopher L. Conroy.
Step 1: Room Design Conditions
Room Dry Bulb Temperature
-Winter: 22°C
-Summer: 26°C
Relative Humidity: 40-60%
Room Dew Point Temperature: 8-17°C
Step 2: Minimum Rate of Heat Removal Required
Figure 5.4 is taken from the afore mentioned published research by Dr. Mumma and
Christopher Conroy and describes the rate of heat removal from the conditioned space
based on the room’s design dry bulb temperature and relative humidity level.
If 60% RH 32 W/m^2
If 40% RH 95 W/m^2

Rebecca S. Allen
The Palestra Building London, England
36
Figure 5.4
Step 3: Calculate Amount of Sensible Cooling Chilled Beams must provide.
Office Area: 31,606m^2
Occupancy: 2202
Combined Sensible Load: 45 W/m^2
Building’s Total Sensible Load:
Q_total = 45 W/m^2 * 31,606m^2 = 142,270 W
Outdoor Air Supply: 16 L/s per person
Ventilation Rate:
m_dot = 16 L/s/person*2202 = 35,232 L/s
Sensible Load Met by DOAS:
Q_DOAS = m_dot*Cp*∆T
Q_DOAS = (35,232L/s)*1.2*(26-13) = 549,619 W
Sensible Load to be met by Chilled Beams:
Q_Beams = Q_total – Q_DOAS = 872,650 W
Step 4: Select Appropriate Chilled Beam
Halton – CLL @ 275 W/m^2 > Minimum Required Rate (32 W/m^2, 95 W/m^2)

Rebecca S. Allen
The Palestra Building London, England
37
Area of Beam Coverage = Q_Beam * Area
= 275 W/m^2 * 31,606 m^2
= 3173.28 m^2
Beam Coverage per Floor = 3173.28 m^2 / 11 = 288.48 m^2
No. Beams per Floor = Floor Beam Area/ Beam Area
= 288.48 m^2 / 4.018 m^2
= 71.80 = 72 Beams per floor
Total Chilled Beams Needed: 718 Beams
Figure 5.5 Halton CLL Chilled Beam
Table 5.6 Chilled Beam Specification Brand Halton
Model CLL/2- 780-4100; AC=CP/CLL-S,BV
Cooling Capacity 275 W/m^2
Length 4100 mm
Width 780 mm
Height 80 mm

Rebecca S. Allen
The Palestra Building London, England
38
Re-sizing the Air Handling Units
As stated previously, each air handling unit was resized to the minimum outdoor air
ventilation required for the type of space each unit serves. That data for each unit is
summarized in Table 5.7.
Table 5.7 AHU Resizing
Original Scheme Proposed DOAS Scheme % Difference AHU -1 18977 L/s 7644.7 L/s -59.78%
AHU -2 18346 L/s 7600.12 L/s -58.57%
AHU -3 2332.7 L/s 237.6 L/s -89.81%
AHU -4 3204 L/s 280.8 L/s -91.24%
AHU -7 1026 L/s 923.5 L/s -9.99%
Note that there is a significant decrease in the sizing of Air Handling Units 3 and 4 serving as
supply and extract for the toilets. These units were intentionally oversized originally to
account for the additional loads that the tenants would install as well. For example, one
tenant is planning to install a data center space, and the additional ventilation needs for that
area will be accounted for by these units. For the purpose of this report the new AHUs were
resized for the existing, permanent load. For actual application, the extra tenant loads should
be accounted for.

Rebecca S. Allen
The Palestra Building London, England
39
Results
Table 5.8 Trace™ Energy Consumption Data
Original Ventilation Scheme Proposed DOAS Scheme
Monthly Energy Consumption Energy, kWh Cost, £ Energy, kWh Cost, £
Electric 20,394,152 kWh £937,840.56 13,608,401 kWh £626,238.89
Gas 8,288,669 kWh £14,622.22 1,242,134 kWh £2,191.11
Water -- -- -- --
Total Monthly Utility Cost £952,462.78 £628,430.00
Total Yearly Consumption 69,913,486 kWh 42,136,788 kWh
Life Cycle Cost £17,704,689.24 £15,878,842.97
The new ventilation system was integrated with the existing chiller and boiler plants. The
data from the Trace™ simulation is summarized in Table 5.8, with the cost values based on
the utility rates noted in Table 5.3. By reducing the size of each air handling unit and
replacing the fan coil units with chilled beams the life cycle cost was reduced by 10.31%,
saving over 2.7 million kWh annually and £3,888,384.
Table 5.9 Fan Coil versus Chilled Beam First Costs
Fan Coil Unit
Chilled
Beam
Type 1 -
Perimeter
Type 2 -
Internal
Type 3 -
Lobby
Cost per Unit £885.00 £743.00 £743.00 £500.00
No. Units 343 394 22 991
Sub Total £303,555.00 £292,742.00 £16,346.00 £495,500.00
Total Cost £612,643.00 £495,500.00 % Savings -19.12%
*Total Cost denotes first cost excluding installation fees

Rebecca S. Allen
The Palestra Building London, England
40
Table 5.10 AHU First Cost Savings
Existing AHUs
AHU 1 AHU 2 AHU 3 AHU 4 AHU 7 Total Costs
Size, L/s 18977 18346 2332.7 3204 1026
Size, cfm 40041 38710 4922 6760 2165
Cost per Unit £85,000.00 £85,000.00 £13,781.00 £13,781.00 £16,700.00 £214,262.00
Proposed AHUs
AHU 1 AHU 2
AHU 3+4
(Combined) AHU 7
Size, L/s 7644.7 7600.12 518.4 923.5
Size, cfm 16130 16036 1094 1949
Cost per Unit £47,880.00 £47,880.00 £10,845.00 £7,965.00 £114,570.00
Tables 5.9 and 5.10 take a look at the savings in First Costs when using reduced Air Handling
Units and Chilled Beams versus the existing AHUs with fan coil units. There is a 19%
reduction in cost when using a Chilled Beam system versus fan coil units. And there are more
significant savings when reducing the Air Handling Units so dramatically, thus reducing the
life cycle costs even further.
The benefits of a Dedicated Outdoor Air system are overwhelming for application in the
Palestra building, and would be an excellent design alternative. The current constant air
volume system with fan coil units isn’t terribly different from a pure DOAS, making a future
renovation quite feasible.

Rebecca S. Allen
The Palestra Building London, England
41
c. Comparison and Results
Both mechanical design alternatives studied in this report had favorable results to improve
both the energy efficiency and economic value of the Palestra Building. The Gas Driven
Chiller plant saved over 7 million kWh and 9.54% in Life Cycle costs, while the DOAS
design with parallel chilled beams reduced the annual energy consumption by 2.7 million
kWh and 9.16% in Life Cycle Costs.
Due to the success of each proposed system, a ‘hybrid’ design was then simulated in Trace™
as well. This integrated a Dedicated Outdoor Air System and chilled beams with a gas engine
driven chiller plant and the existing gas-fired boiler plant. The results of those calculations
are summarized in Table 5.11.
Table 5.11 Trace™ Energy Consumption Data
Original Scheme Proposed DOAS+Engine Chiller Scheme
Monthly Energy Consumption Energy, kWh Cost, £ Energy, kWh Cost, £
Electric 20,394,152 kWh £937,840.56 12,669,017 kWh £583,102.22
Gas 8,288,669 kWh £14,622.22 2,770,855 kWh £4,888.33
Water -- -- 19,061 kL £14,794.44
Total Monthly Utility Cost £952,462.78 £602,785.00
Total Yearly Consumption 69,913,486 kWh 40,927,536 kWh
Life Cycle Cost £17,704,689.24 £15,899.365.13
When combined the owners of the Palestra Building could reduce the Life Cycle cost by
10.2% and save over £349,677 a month in energy costs. Over the life span of a building this
could be an excellent investment. In addition to the economic benefits there should be
improved thermal comfort and humidity control, and opportunities to incorporate new
technologies and forms of heat recovery as needed.

Rebecca S. Allen
The Palestra Building London, England
42
VI. Renewable Resource Breadths
The Palestra Building has been under construction for the past 18 months, with a completion
date for July 2006. However, the London Development Agency (LDA) has recently signed
on as tenants for the fifth and sixth floors. This Agency will be responsible for all of the
planning of the 2012 Summer Olympics in London. One of their primary requests has been to
install both Solar PV cells and Wind Turbines on the roof with the intention of using any
generated power in their office space, and possibly selling any excess energy back to the grid.
London was granted the 2012 Olympics due in great part to their platform of a Zero
Impact/”Green” design scheme, and the Agency wants to prove it is fluent with these
technologies. As of a visit in March of 2006 no one was certain about any details for these
plans: how many/large these technologies would be, their locations, or effectiveness.
Therefore this report will complete a feasibility study for both technologies to better
understand the amount of potential power that can be produced, smart uses for the energy, as
well as cost impact of such decisions.
a. Solar Energy Breadth – Photovoltaic (PV) Cells
The mean solar radiation incident on the mainland of the United Kingdom is at best 5
kWh/m^2. The Palestra Building is tall enough relative to the surrounding structures so that
there is an unobstructed southern exposure
from the roof level, allowing maximum
solar gains, as shown in the image to the
right. However, the placement of the solar
PV cells is crucial to the success of such a
system. And unfortunately due to the Figure 6.1 The Palestra Building super-imposed onto its lot.

Rebecca S. Allen
The Palestra Building London, England
43
timing of this addition to the design, there is little available space on the roof. The total area
of the roof is 1236 m^2. Provisions were made for a 200 m^2 array of PV cells facing south.
Calculations
RETScreen International Clean Energy Project Analysis Software, Photovoltaic Project
Model was used to create an energy simulation of the array of solar PV panels. The following
calculations were based on a solar cell manufactured by BP Solar, BP 5160 S. Physical data
coordinating to this model is summarized in Table 6.1.
Table 6.1 PV Cell Data Model BP 5160 S
Maximum Nominal Output 160 W
Maximum Panel Voltage 1000 V
Dimensions:
Length 1596 mm
Width 790 mm
Height 0 mm
Weight 15 kg
Within the 100 m^2 allotted an array of 155 panels can be assembled, adding a total of
2325kg to the roof structure. The Annual Energy Produced by the modules is listed in Table
6.2. The 63 units can deliver over 8,000 kWh per annum. Currently the annual consumption
for the space to be occupied by the LDA is 12,711,542 kWh. Therefore 0.16% of the demand
can be met by solar energy.
Table 6.2 Estimated Annual Energy Produced Specific Yield 102.4 kWh/m^2
Overall PV System Efficiency 10.20%
Renewable Energy Delivered 19,995 kWh
Rebecca S. Allen
The Palestra Building London, England
44
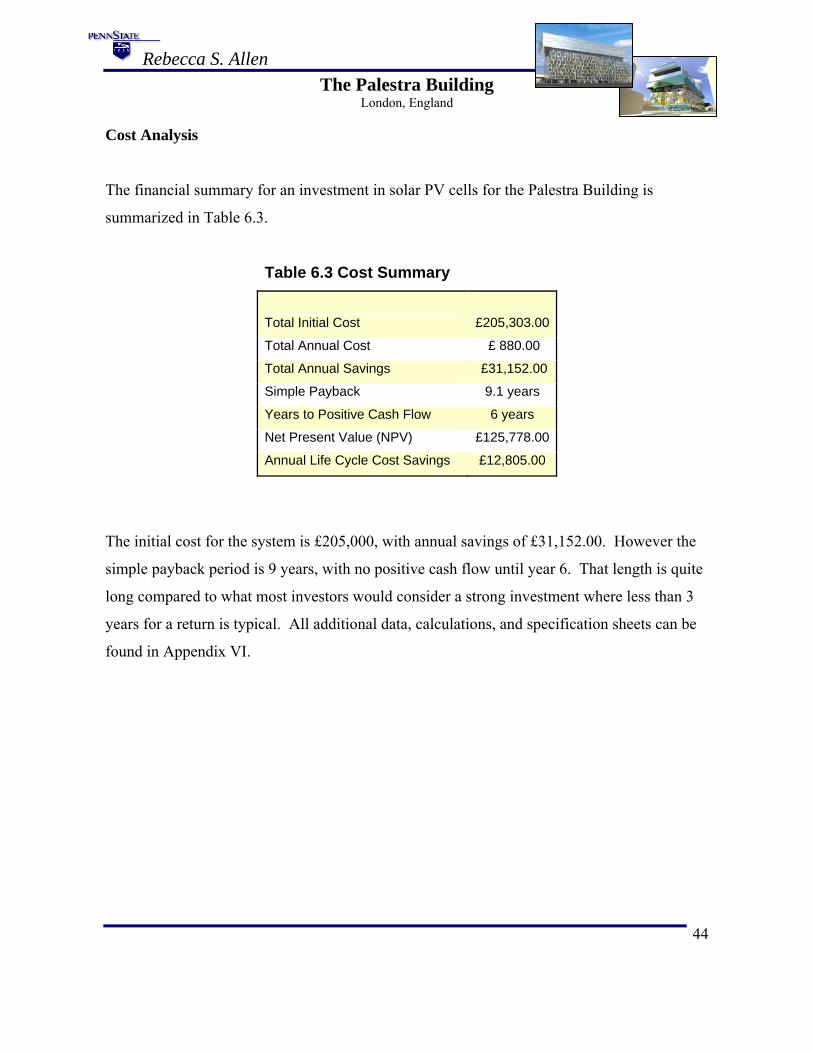
Cost Analysis
The financial summary for an investment in solar PV cells for the Palestra Building is
summarized in Table 6.3.
Table 6.3 Cost Summary
Total Initial Cost
£205,303.00
Total Annual Cost £ 880.00
Total Annual Savings £31,152.00
Simple Payback 9.1 years
Years to Positive Cash Flow 6 years
Net Present Value (NPV) £125,778.00
Annual Life Cycle Cost Savings £12,805.00
The initial cost for the system is £205,000, with annual savings of £31,152.00. However the
simple payback period is 9 years, with no positive cash flow until year 6. That length is quite
long compared to what most investors would consider a strong investment where less than 3
years for a return is typical. All additional data, calculations, and specification sheets can be
found in Appendix VI.
Rebecca S. Allen
The Palestra Building London, England
45
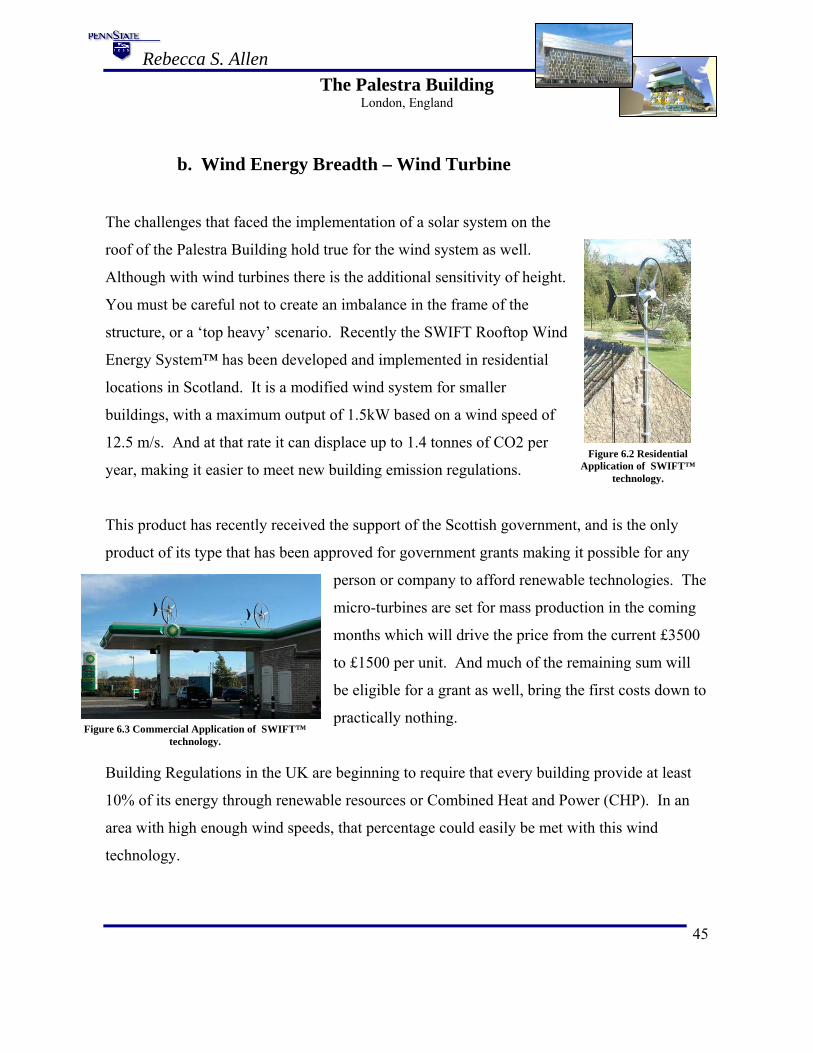
b. Wind Energy Breadth – Wind Turbine
The challenges that faced the implementation of a solar system on the
roof of the Palestra Building hold true for the wind system as well.
Although with wind turbines there is the additional sensitivity of height.
You must be careful not to create an imbalance in the frame of the
structure, or a ‘top heavy’ scenario. Recently the SWIFT Rooftop Wind
Energy System™ has been developed and implemented in residential
locations in Scotland. It is a modified wind system for smaller
buildings, with a maximum output of 1.5kW based on a wind speed of
12.5 m/s. And at that rate it can displace up to 1.4 tonnes of CO2 per
year, making it easier to meet new building emission regulations.
This product has recently received the support of the Scottish government, and is the only
product of its type that has been approved for government grants making it possible for any
person or company to afford renewable technologies. The
micro-turbines are set for mass production in the coming
months which will drive the price from the current £3500
to £1500 per unit. And much of the remaining sum will
be eligible for a grant as well, bring the first costs down to
practically nothing.
Building Regulations in the UK are beginning to require that every building provide at least
10% of its energy through renewable resources or Combined Heat and Power (CHP). In an
area with high enough wind speeds, that percentage could easily be met with this wind
technology.
Figure 6.2 Residential Application of SWIFT™
technology.
Figure 6.3 Commercial Application of SWIFT™ technology.

Rebecca S. Allen
The Palestra Building London, England
46
Table 6.4 contains the technical
data for each micro wind turbine.
Figure 6.4 shows the Power
Curve for the Micro Turbine. As
you can see its power output is highest between 12 and 20 m/s. Unfortunately the average
wind speed in London is 4.6 m/s, resulting in 60W output per unit. Due to the small amount
of power available it is unlikely that wind energy would be an efficient means of energy
production for the Palestra Building. However because the National London Agency, a tenant
in the Palestra Building, is set on installing wind technology regardless of the efficiency, it is
beneficial to complete an analysis to see how the amount of energy gained may be effectively
used.
Table 6.4 Rooftop Wind Turbine Specifications Manufacturer SWIFT™
Rated Output @ 12.5 m/s 1.5 kW
Output @ 4.6 m/s (London) 60 W
CO2 Displacement 1.4 tonnes per year
Turbine 5 blade HAWT wind turbine
Rotor Diameter 2.12 m
Weight 95 kg
Figure 6.4 SWIFT™ Wind Turbine Power Curve
Rebecca S. Allen
The Palestra Building London, England
47
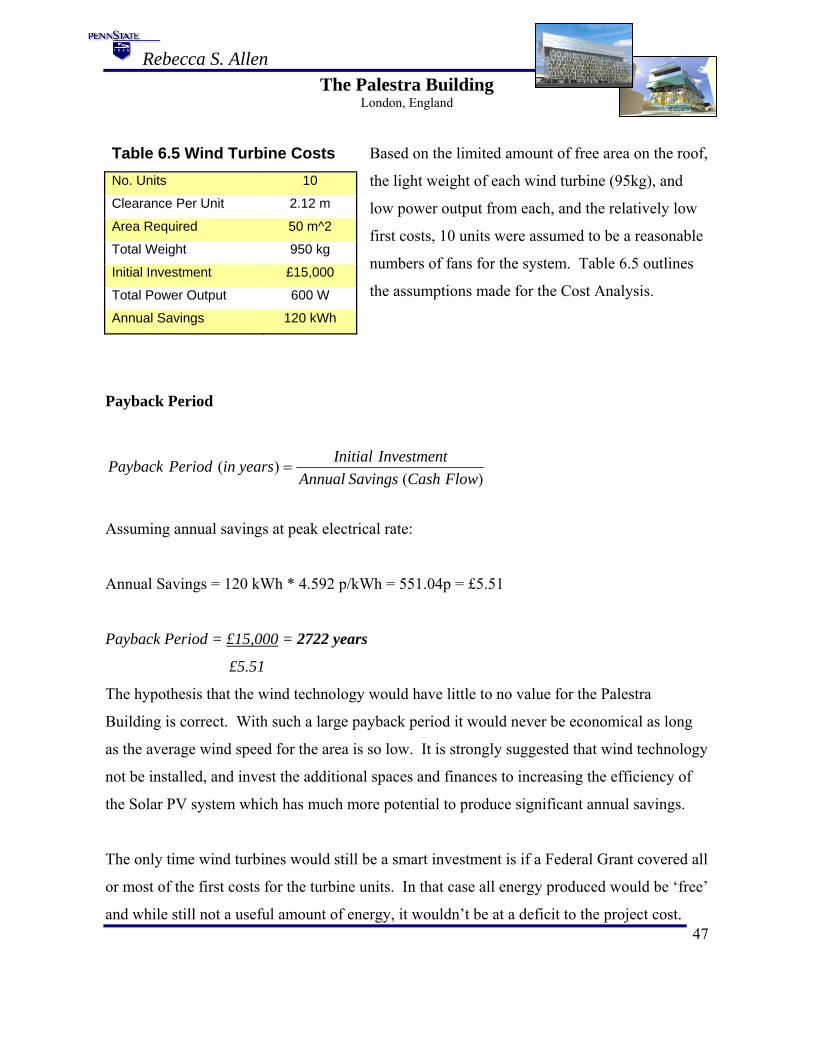
Based on the limited amount of free area on the roof,
the light weight of each wind turbine (95kg), and
low power output from each, and the relatively low
first costs, 10 units were assumed to be a reasonable
numbers of fans for the system. Table 6.5 outlines
the assumptions made for the Cost Analysis.
Payback Period
)()(
FlowCashSavingsAnnualInvestmentInitialyearsinPeriodPayback =
Assuming annual savings at peak electrical rate:
Annual Savings = 120 kWh * 4.592 p/kWh = 551.04p = £5.51
Payback Period = £15,000 = 2722 years
£5.51
The hypothesis that the wind technology would have little to no value for the Palestra
Building is correct. With such a large payback period it would never be economical as long
as the average wind speed for the area is so low. It is strongly suggested that wind technology
not be installed, and invest the additional spaces and finances to increasing the efficiency of
the Solar PV system which has much more potential to produce significant annual savings.
The only time wind turbines would still be a smart investment is if a Federal Grant covered all
or most of the first costs for the turbine units. In that case all energy produced would be ‘free’
and while still not a useful amount of energy, it wouldn’t be at a deficit to the project cost.
Table 6.5 Wind Turbine Costs No. Units 10
Clearance Per Unit 2.12 m
Area Required 50 m^2
Total Weight 950 kg
Initial Investment £15,000
Total Power Output 600 W
Annual Savings 120 kWh

Rebecca S. Allen
The Palestra Building London, England
48
VII. Acoustical Breadth – Mechanical Noise Impact on Community
When altering the mechanical equipment that is place outdoors (i.e. roof level) it is
important to understand the acoustical effects of these changes to ensure that neighboring
buildings are not affected by the additional noise, if any.
An increase in acoustical levels is expected when switching from electric air-cooled
chiller to IC engine driven chillers because of the nature of the machines. However, if
there is a dramatic increase in sound pressure levels then measures will need to be taken to
install acoustical barriers.
The following are the calculations used to determine the community’s reaction to the
existing chiller plant in comparison to the proposed engine driven chiller plant.
Step 1: Plot decibel (dB) levels for the sound emitter on the Composite Noise Rating
(CNR) curve. The CNR rating is the lowest CNR curve not exceeded.
Figure 7.1 Composite Noise Rating Curves

Rebecca S. Allen
The Palestra Building London, England
49
Step 2: Correct for Background Noise
Step 3: Correct for other factors.
Figure 7.2 Correction Values for Possible Background Noise
Figure 7.3 Correction Values for Other Factors

Rebecca S. Allen
The Palestra Building London, England
50
Step 4: Determine probable community reaction.
Figure 7.4 Community Reaction Graph
Rebecca S. Allen
The Palestra Building London, England
51
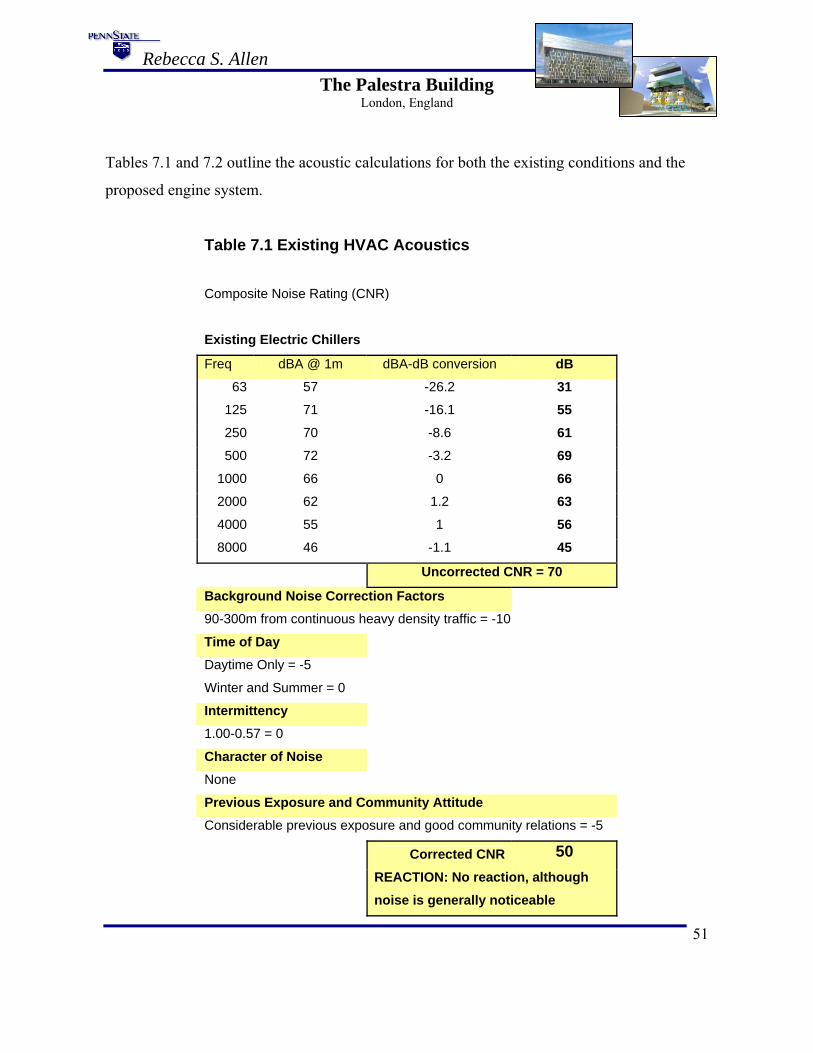
Tables 7.1 and 7.2 outline the acoustic calculations for both the existing conditions and the
proposed engine system.
Table 7.1 Existing HVAC Acoustics
Composite Noise Rating (CNR)
Existing Electric Chillers
Freq dBA @ 1m dBA-dB conversion dB 63 57 -26.2 31
125 71 -16.1 55 250 70 -8.6 61 500 72 -3.2 69
1000 66 0 66 2000 62 1.2 63 4000 55 1 56 8000 46 -1.1 45
Uncorrected CNR = 70
Background Noise Correction Factors
90-300m from continuous heavy density traffic = -10
Time of Day
Daytime Only = -5
Winter and Summer = 0
Intermittency
1.00-0.57 = 0
Character of Noise
None
Previous Exposure and Community Attitude Considerable previous exposure and good community relations = -5
Corrected CNR 50
REACTION: No reaction, although noise is generally noticeable

Rebecca S. Allen
The Palestra Building London, England
52
Table 7.2 Proposed HVAC Acoustics
Composite Noise Rating (CNR)
Proposed Engine Driven Chiller
Freq dB @ 1m 63 72 125 78 250 84 500 89 1000 86 2000 80 4000 72 8000 64
Uncorrected CNR = 85
Background Noise Correction Factors
90-300m from continuous heavy density traffic = -10
Time of Day
Daytime Only = -5
Winter and Summer = 0
Intermittency
1.00-0.57 = 0
Character of Noise
None
Previous Exposure and Community Attitude Considerable previous exposure and good community relations = -5
Corrected CNR 65
REACTION: Sporadic Complaints

Rebecca S. Allen
The Palestra Building London, England
53
Tables 7.1 and 7.2 also summarize the results of the Composite Noise Rating for the electric
chiller scheme as well as the IC engine driven chiller plant. The community’s reaction to the
existing design is “No reaction, although noise is
generally noticeable,” while the new plant has a
reaction of “Sporadic Complaints.” The Palestra
Building has a large advantage because of its location
with respect to noise because it is such a high traffic
area with the Underground Station, the above ground
trains, and a busy intersection. The members of the
community are somewhat desensitized to the additional
noise created. Figure 7.5 View of High Traffic Areas from 7th Floor

Rebecca S. Allen
The Palestra Building London, England
54
VIII. Summary of Results and Conclusion
Studying the impact of a gas driven chiller plant with a Dedicated Outdoor Air System has
proven to be a successful proposal. The seven existing air-cooled electric chillers were
replaced with five gas engine driven chillers to take advantage of additional heat recovery
opportunities as well as the lower cost of natural gas in the UK. Each air handling unit was
also resized to meet only the fresh air requirements for the spaces each serves, and installed
with an enthalpy wheel for latent heat recovery. To meet the entire sensible load through out
the building a parallel chilled beam system was also installed. When both systems are
integrated with the existing boiler plant the Life Cycle costs were found to decrease by over
9%, while also decreasing annual energy consumption by 29 million kWh which is a
significant financial and environmental impact. In addition the acoustic levels of the new
equipment on the roof was analyzed, finding only a slight increase in the community’s
reaction, but nothing great enough to warrant additional acoustical barriers at this time.
The first tenant obtained for the Palestra Building was the London Development Agency,
which is the committee responsible for the planning of the 2012 Olympics in London.
Because they promoted ‘Green’ design in their bid for the Olympics, they want to install
‘Green’ technologies in the form of Solar PV panels and Wind Turbines on the roof
essentially to show that they implement the ideas they promote, but with little regard for the
actual efficiency of these systems. The construction of the Palestra Building is set to be
completed during the summer of 2006, four months from now and the designs for these
systems have yet to be confirmed. After analyzing the possibilities for each design with
respect to the existing roof top configuration it was concluded that more than 100 m^2 of
solar PV panels would be needed to create a system with a payback within 4 years. And due
to the extremely low average wind speed in London at 4.6 m/s, even the most advanced
rooftop wind turbine would be unable to produce more than 60 W of energy per unit. Thus it

Rebecca S. Allen
The Palestra Building London, England
55
is recommended that the plans for installing wind turbines be abandoned, using the funding to
improve the Solar design.
The data collected is very valuable for the engineers, owners, and project managers for insight
into the effects of design alternatives as well as to serve as a reference on future projects.
Hopefully the results of the Solar and Wind energy studies will be taken into account when
finalizing these design schemes.

Rebecca S. Allen
The Palestra Building London, England
56
X. References American Society of Heating, Air Conditioning and Refrigeration. Energy Standard for Buildings Except Low-Rise Residential. By ASHRAE, ANSI, and IESNA. Ed. ASHRAE Standard Standing Committee. American Society of Heating Air Conditioning and Refrigeration, ed. Handbook of Fundamentals. 2001. Apogee. "Compare Operating and Maintenance Costs - Chillers." Cooling System Alternatives. 2 Dec. 2005 <http://tristate.apogee.net/cool/ cmomc.asp>. Architectural Engineering Faculty. Personal interview. Winter 2005. Insignia Richard Ellis Development. "Design Criteria: Palestra Building." Memo to Buro Happold Ltd. 2004. ASHRAE. "Ventilation for Acceptable Indoor Air Quality." Standard 62: Section 6. By American Socity of Heating Air Conditioning and Refrigeration. N.p.: n.p., 2001. Buro Happold Ltd. "Palestra Building." Memo to Skanska. May 2004. Mechanical Drawings and Specifications. Daniels, Stephen H. "Emerging Technologies." Hughes. Solution. Supply. Service. May 2002. Hughes. 9 Dec. 2005 <http://www.thesourcemag.com/Main/ Articles.asp?ArticleID=7>. Department of Trade and Industry. Report of the Working Group on Extending the Gas Network. By DTI and DETR Ministers. 2005. 1 Apr. 2006 <http://www.dti.gov.uk>. Path: Energy. Hanscomb International Construction Consultants. "Proposed Office Development at Southpoint, Blackfriars Road: Stage D Cost Plan." Memo to Buro Happold Ltd. 2004. Meckler, Milton, P.E. "Do the Math: Chiller Plant Optimization Strategies." Engineered System Home. Oct. 2002. 2 Dec. 2005 <http://www.esmagazine.com/CDA/ArticleInformation/features/ BNP__Features__Item/0,2503,86656,00.html>.

Rebecca S. Allen
The Palestra Building London, England
57
Mumma, Stanley A, PhD, P.E. "Dedicated Outdoor Air System (DOAS)." Dedicated Outdoor Air Systems. 1 Apr. 2006 <http://doas-radiant.psu.edu/ doas.html>. Office of the Deputy Prime Minister, ed. Approved Document F: Ventilation. 2006. Approved Document F: Ventilation. Ed. Office of the Deputy Prime Minister. 2006. 1 Apr. 2006 <http://www.odpm.gov.uk/ index.asp?id=1164179>. Office of the Deputy Prime Minister, ed. Approved Document L2A: Conservation of Fuel and Power. 2006. Part L 2006: Building Regulations. Office of the Deputy Prime Minister. 1 Apr. 2006 <http://www.odpm.gov.uk/index.asp?id=1164177>. Penn State Architectural Engineering. Rev. of ePortfolio Archives. Architectural Engineering. Dept. home page. 2005. The Pennsylvania State University. 1 Apr. 2006 <http://www.arche.psu.edu/thesis>. Platts Research and Consulting. "Natural Gas Chillers." BCHydro (Oct. 2004). Rpt. in Power Smart Tips & Practices . Platts, 2004. 2 Dec. 2005 <http://www.bchydro.com/business/investigate/investigate806.html>. Professor Blahnfleth. "Chilled Water System Design Procedure." Unpublished notes, Nov. 2005. AE 557. Professor Bourroghs. "Composite Noise Rating." Unpublished notes, Jan. 2006. AE 458. Renewable Devices. SWIFT Rooftop Wind Energy System. Techincal Information Pack.Renewable Devices. 1 Apr. 2006 <http://www.renewabledevices.com/swift/>. Skanska. "The Palestra Building." Memo to Buro Happold Ltd. Spring 2005. Ventilation Schematics. Southern California Gas Company, and New Buildings Institute. "Gas Engine-Driven Chillers." New Buildings Institute (Nov. 1998). 2 Dec. 2005 <http://www.newbuildings.org/downloads/guidelines/GasEngine.pdf>.

Rebecca S. Allen
The Palestra Building London, England
1
APPENDIX A: Existing Conditions – Internal Loads

Rebecca S. Allen
The Palestra Building London, England
2
Fabric Heating Load Total Fabric insulation 17014 W/K (from Appendix H) External temperature -3 deg.C Internal temperature (Assume identical throughout)
22 deg.C
Total Fabric load 425351 W Infiltration Heating Load Total Façade area 10800 m2 Infiltration rate 2.5 m3/hr/m2 temperature difference (as above)
25 K Indexes
Volume of infiltration 7.5 m3/s Building Floor height 3.6
Thermal capacity of air 1200 J/m3.K Air changes per hour 0.23
Total Infiltration load 225000 W Mechanical Ventilation Heating Load Total floor area 26677 m2 Occupancy 12 m2/occupant Ventilation Flow rate 16 l/s/occupant Air tempered to 22 deg.C External air -3 deg.C Thermal Efficiency of ventilation plant
50 %
Temperature difference 12.5 K Ventilation Flow rate 35.6 m3/s Air thermal Capacity 1200.0 J/m3.K System losses 10% Ventilation heat load 586894 W Total Heating Load Total Heating Load 1,237 kW Indexes Spare capacity 10%
Pre-heat period 32% Building Floor area 26677
Installed Heating Load 1,796 kW Load per m2 (W/m2) 67.3

Rebecca S. Allen
The Palestra Building London, England
3
Breakdown of cooling loads BH proposed Brief Internal Cooling Load persons 10 W/m2 m2/occupant light 15 W/m2 W/m2 equip 30 W/m2 W/m2 Fan Coil units 6 W/m2 W/m2 total - Internal 61 W/m2 W/m2 Environmental Cooling Load
Room Temperature 22 deg.C Outdoor temperature 29 deg.C Difference 7 deg.C Solar cooling load 25 W/m2 (estimate) * Fabric cooling load 5 W/m2 (estimate) * Infiltration cooling load 1.9 W/m2 (estimate) * Total Environmental 32 W/m2 Mechanical Ventilation Cooling Load Total floor area 26677 m2 Occupancy 12 m2/occupant Ventilation Flow rate 16 l/s/occupant Air tempered to 22 deg.C External air 29 deg.C Thermal Efficiency of ventilation plant 50 % (estimate) *
Temperature difference -3.5 K Ventilation Flow rate 35.6 m3/s Air thermal Capacity 1200.0 J/m3.K Ventilation cooling load 149391 W (estimate) * Ventilation cooling load 5.6 W/m2 (estimate) * Total total W/m2 99 W/m2 Area 26416 m2 Total Cooling Load 2602 W Sensible Heat Ratio 15% System Losses 10% Total 3,291 kW Proposed chillers Capacity Spare 6 x 0.553 MW 3,318 kW 0.81% 7 x 0.553 MW 3,871 kW 17.61%

Rebecca S. Allen
The Palestra Building London, England
1
APPENDIX B: Chiller Optimization Data


Rebecca S. Allen
The Palestra Building London, England
1
APPENDIX C: DOAS Data


Rebecca S. Allen
The Palestra Building London, England
1
APPENDIX D: Trace Output

Rebecca S. Allen
The Palestra Building London, England
1
Existing Systems Energy Simulation

EQUIPMENT ENERGY CONSUMPTIONBy ae
Alternative: 1 Palestra Building
Jan Feb Mar Apr May June July Aug Sept Oct Nov Dec TotalEquipment - Utility
------- Monthly Consumption -------
Lights122,510.0 145,343.4 129,495.7 140,401.4 139,379.6 130,517.6 145,343.4 129,495.7 140,401.4 134,437.6 1,623,302.8135,459.5 130,517.6Electric (kWh)
439.7 439.7 439.7 439.7 439.7 439.7 439.7 439.7 439.7 439.7 439.7 439.7 439.7Peak (kW)
MISC LD211,696.4 253,279.4 223,381.2 243,657.1 242,625.8 224,412.1 253,279.4 223,381.3 243,657.1 233,003.5 2,810,820.0234,034.4 224,412.1Electric (kWh)
816.2 816.2 816.2 816.2 816.2 816.2 816.2 816.2 816.2 816.2 816.2 816.2 816.2Peak (kW)
AHU 1Eq4371 - Fan coil supply fan (Main Clg Fan)
254,985.8 306,652.6 263,462.2 336,715.3 345,809.9 404,881.2 433,306.1 344,123.8 313,433.8 266,362.5 3,787,723.3266,006.9 251,983.3Electric (kWh)1,425.0 1,425.0 1,425.0 1,425.0 1,425.0 1,500.0 1,500.0 1,500.0 1,425.0 1,425.0 1,425.0 1,425.0 1,500.0Peak (kW)
AHU 2Eq4371 - Fan coil supply fan (Main Clg Fan)
229,756.5 278,262.3 243,554.5 272,396.3 273,698.9 263,497.0 294,199.0 251,853.8 286,334.8 252,604.0 3,137,747.8251,393.2 240,197.4Electric (kWh)1,425.0 1,425.0 1,425.0 1,425.0 1,425.0 1,425.0 1,425.0 1,425.0 1,425.0 1,425.0 1,425.0 1,425.0 1,425.0Peak (kW)
AHU 3Eq4372 - Unit vent supply fan (Main Clg Fan)
3,898.3 4,612.9 3,854.4 2,920.2 2,904.0 2,902.6 3,037.7 2,695.7 3,074.8 4,348.7 43,727.55,364.1 4,114.1Electric (kWh)55.0 55.0 55.0 55.0 38.5 38.5 40.2 38.5 38.5 38.5 55.0 55.0 55.0Peak (kW)
AHU 4Eq4372 - Unit vent supply fan (Main Clg Fan)
4,274.3 4,922.9 3,904.2 2,929.2 2,912.6 3,419.0 3,066.5 2,727.9 3,182.5 4,816.4 46,666.06,044.0 4,466.5Electric (kWh)55.0 55.0 55.0 55.0 38.5 38.5 55.0 38.5 38.5 38.5 55.0 55.0 55.0Peak (kW)
AHU 7
Project Name: TRACE® 700 v4.1 calculated at 08:02 PM on 03/28/2006Dataset Name: P:\becca's trace\Palestra.TRC Alternative - 1 Equipment Energy Consumption report page 1 of 6

EQUIPMENT ENERGY CONSUMPTIONBy ae
Alternative: 1 Palestra Building
Jan Feb Mar Apr May June July Aug Sept Oct Nov Dec TotalEquipment - Utility
------- Monthly Consumption -------
AHU 7Eq4371 - Fan coil supply fan (Main Clg Fan)
68,780.0 83,260.0 72,400.0 79,640.0 79,640.0 72,400.0 83,260.0 72,400.0 79,640.0 76,020.0 915,860.076,020.0 72,400.0Electric (kWh)400.0 400.0 400.0 400.0 400.0 400.0 400.0 400.0 400.0 400.0 400.0 400.0 400.0Peak (kW)
Cpl 1: CHILLERSChiller 2 (Cooling Equipment)
170.5 223.3 414.3 1,479.8 2,236.1 17,037.9 5,798.3 2,895.4 1,269.4 266.1 32,267.2225.8 250.4Electric (kWh)30.5 30.4 30.3 41.3 41.3 41.3 148.6 118.7 84.1 41.3 34.2 41.3 148.6Peak (kW)
Eq5221 - Condenser fan747.5 944.4 941.5 2,252.7 2,138.4 4,785.9 4,138.8 2,750.6 1,381.3 852.9 22,559.8829.9 796.1Electric (kWh)
17.2 17.2 17.2 17.2 17.2 17.2 17.2 17.2 17.2 17.2 17.2 17.2 17.2Peak (kW)
Eq5001 - Cnst vol chill water pump (Misc Accessory Equipment)5.5 7.3 14.7 132.1 181.6 238.4 232.0 167.8 134.8 11.0 1,144.411.0 8.3Electric (kWh)
0.9 0.9 0.9 0.9 0.9 0.9 0.9 0.9 0.9 0.9 0.9 0.9 0.9Peak (kW)
Eq5011 - Cnst vol cnd water pump (Misc Accessory Equipment)48.4 64.6 129.1 1,161.9 1,597.6 2,097.8 2,041.3 1,476.5 1,186.1 96.8 10,069.496.8 72.6Electric (kWh)
8.1 8.1 8.1 8.1 8.1 8.1 8.1 8.1 8.1 8.1 8.1 8.1 8.1Peak (kW)
Eq5302 - Cntl panel & interlocks (Misc Accessory Equipment)0.6 0.8 1.6 14.4 19.8 26.0 25.3 18.3 14.7 1.2 124.81.2 0.9Electric (kWh)
0.1 0.1 0.1 0.1 0.1 0.1 0.1 0.1 0.1 0.1 0.1 0.1 0.1Peak (kW)
Chiller 3 (Cooling Equipment)0.0 0.0 0.0 0.0 0.0 5,856.1 0.0 0.0 0.0 0.0 5,856.10.0 0.0Electric (kWh)
0.0 0.0 0.0 0.0 0.0 0.0 148.6 118.7 0.0 0.0 0.0 0.0 148.6Peak (kW)
Eq5221 - Condenser fan0.0 0.0 0.0 0.0 0.0 673.1 0.0 0.0 0.0 0.0 673.10.0 0.0Electric (kWh)
0.0 0.0 0.0 0.0 0.0 0.0 16.1 13.7 0.0 0.0 0.0 0.0 16.1Peak (kW)
Eq5001 - Cnst vol chill water pump (Misc Accessory Equipment)0.0 0.0 0.0 0.0 0.0 55.0 0.0 0.0 0.0 0.0 55.00.0 0.0Electric (kWh)
0.0 0.0 0.0 0.0 0.0 0.0 0.9 0.9 0.0 0.0 0.0 0.0 0.9Peak (kW)
Project Name: TRACE® 700 v4.1 calculated at 08:02 PM on 03/28/2006Dataset Name: P:\becca's trace\Palestra.TRC Alternative - 1 Equipment Energy Consumption report page 2 of 6
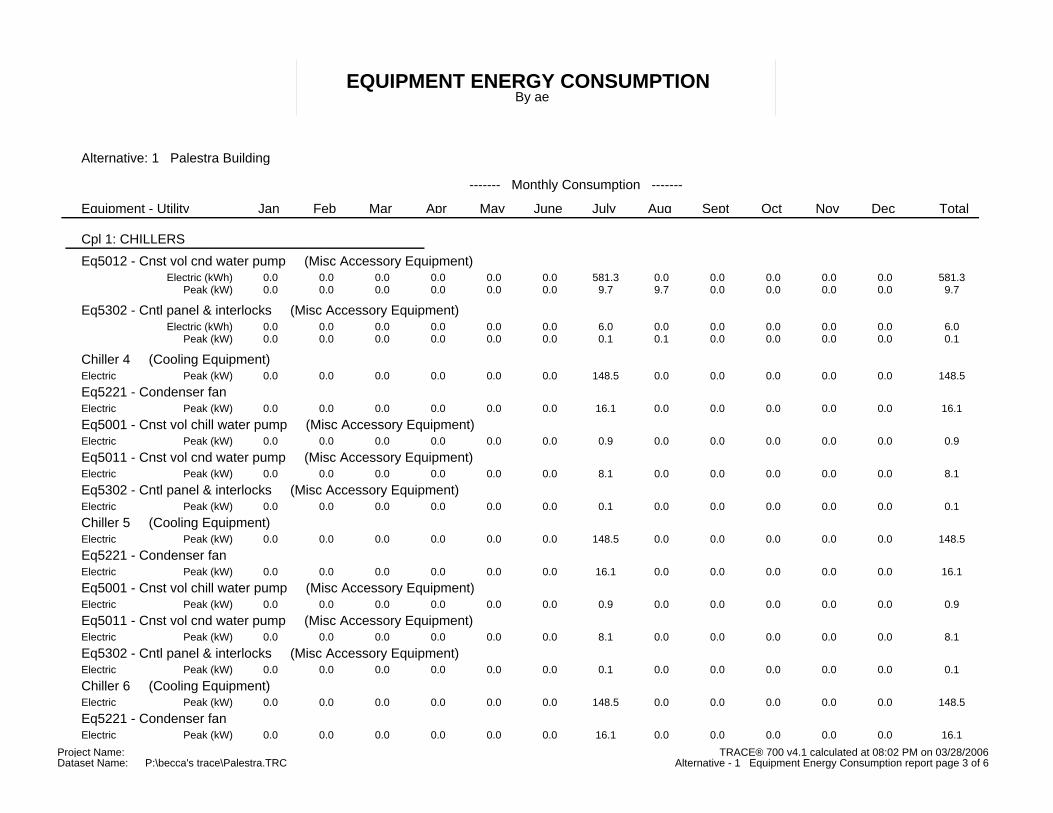
EQUIPMENT ENERGY CONSUMPTIONBy ae
Alternative: 1 Palestra Building
Jan Feb Mar Apr May June July Aug Sept Oct Nov Dec TotalEquipment - Utility
------- Monthly Consumption -------
Cpl 1: CHILLERSEq5012 - Cnst vol cnd water pump (Misc Accessory Equipment)
0.0 0.0 0.0 0.0 0.0 581.3 0.0 0.0 0.0 0.0 581.30.0 0.0Electric (kWh)0.0 0.0 0.0 0.0 0.0 0.0 9.7 9.7 0.0 0.0 0.0 0.0 9.7Peak (kW)
Eq5302 - Cntl panel & interlocks (Misc Accessory Equipment)0.0 0.0 0.0 0.0 0.0 6.0 0.0 0.0 0.0 0.0 6.00.0 0.0Electric (kWh)
0.0 0.0 0.0 0.0 0.0 0.0 0.1 0.1 0.0 0.0 0.0 0.0 0.1Peak (kW)
Chiller 4 (Cooling Equipment)Electric 0.0 0.0 0.0 0.0 0.0 0.0 148.5 0.0 0.0 0.0 0.0 0.0 148.5Peak (kW)Eq5221 - Condenser fanElectric 0.0 0.0 0.0 0.0 0.0 0.0 16.1 0.0 0.0 0.0 0.0 0.0 16.1Peak (kW)Eq5001 - Cnst vol chill water pump (Misc Accessory Equipment)Electric 0.0 0.0 0.0 0.0 0.0 0.0 0.9 0.0 0.0 0.0 0.0 0.0 0.9Peak (kW)Eq5011 - Cnst vol cnd water pump (Misc Accessory Equipment)Electric 0.0 0.0 0.0 0.0 0.0 0.0 8.1 0.0 0.0 0.0 0.0 0.0 8.1Peak (kW)Eq5302 - Cntl panel & interlocks (Misc Accessory Equipment)Electric 0.0 0.0 0.0 0.0 0.0 0.0 0.1 0.0 0.0 0.0 0.0 0.0 0.1Peak (kW)Chiller 5 (Cooling Equipment)Electric 0.0 0.0 0.0 0.0 0.0 0.0 148.5 0.0 0.0 0.0 0.0 0.0 148.5Peak (kW)Eq5221 - Condenser fanElectric 0.0 0.0 0.0 0.0 0.0 0.0 16.1 0.0 0.0 0.0 0.0 0.0 16.1Peak (kW)Eq5001 - Cnst vol chill water pump (Misc Accessory Equipment)Electric 0.0 0.0 0.0 0.0 0.0 0.0 0.9 0.0 0.0 0.0 0.0 0.0 0.9Peak (kW)Eq5011 - Cnst vol cnd water pump (Misc Accessory Equipment)Electric 0.0 0.0 0.0 0.0 0.0 0.0 8.1 0.0 0.0 0.0 0.0 0.0 8.1Peak (kW)Eq5302 - Cntl panel & interlocks (Misc Accessory Equipment)Electric 0.0 0.0 0.0 0.0 0.0 0.0 0.1 0.0 0.0 0.0 0.0 0.0 0.1Peak (kW)Chiller 6 (Cooling Equipment)Electric 0.0 0.0 0.0 0.0 0.0 0.0 148.5 0.0 0.0 0.0 0.0 0.0 148.5Peak (kW)Eq5221 - Condenser fanElectric 0.0 0.0 0.0 0.0 0.0 0.0 16.1 0.0 0.0 0.0 0.0 0.0 16.1Peak (kW)
Project Name: TRACE® 700 v4.1 calculated at 08:02 PM on 03/28/2006Dataset Name: P:\becca's trace\Palestra.TRC Alternative - 1 Equipment Energy Consumption report page 3 of 6

EQUIPMENT ENERGY CONSUMPTIONBy ae
Alternative: 1 Palestra Building
Jan Feb Mar Apr May June July Aug Sept Oct Nov Dec TotalEquipment - Utility
------- Monthly Consumption -------
Cpl 1: CHILLERSEq5001 - Cnst vol chill water pump (Misc Accessory Equipment)Electric 0.0 0.0 0.0 0.0 0.0 0.0 0.9 0.0 0.0 0.0 0.0 0.0 0.9Peak (kW)Eq5302 - Cntl panel & interlocks (Misc Accessory Equipment)Electric 0.0 0.0 0.0 0.0 0.0 0.0 0.1 0.0 0.0 0.0 0.0 0.0 0.1Peak (kW)Chiller 7 (Cooling Equipment)Electric 0.0 0.0 0.0 0.0 0.0 0.0 134.9 0.0 0.0 0.0 0.0 0.0 134.9Peak (kW)Eq5221 - Condenser fanElectric 0.0 0.0 0.0 0.0 0.0 0.0 14.8 0.0 0.0 0.0 0.0 0.0 14.8Peak (kW)Eq5001 - Cnst vol chill water pump (Misc Accessory Equipment)Electric 0.0 0.0 0.0 0.0 0.0 0.0 0.9 0.0 0.0 0.0 0.0 0.0 0.9Peak (kW)Eq5302 - Cntl panel & interlocks (Misc Accessory Equipment)Electric 0.0 0.0 0.0 0.0 0.0 0.0 0.1 0.0 0.0 0.0 0.0 0.0 0.1Peak (kW)Chiller 1 (Cooling Equipment)Electric 0.0 0.0 0.0 0.0 0.0 0.0 135.0 0.0 0.0 0.0 0.0 0.0 135.0Peak (kW)Eq5221 - Condenser fanElectric 0.0 0.0 0.0 0.0 0.0 0.0 14.8 0.0 0.0 0.0 0.0 0.0 14.8Peak (kW)Eq5001 - Cnst vol chill water pump (Misc Accessory Equipment)Electric 0.0 0.0 0.0 0.0 0.0 0.0 0.9 0.0 0.0 0.0 0.0 0.0 0.9Peak (kW)Eq5302 - Cntl panel & interlocks (Misc Accessory Equipment)Electric 0.0 0.0 0.0 0.0 0.0 0.0 0.1 0.0 0.0 0.0 0.0 0.0 0.1Peak (kW)
Hpl 1: BOILERSBoiler 1 (Heating Equipment)
281,241.8 338,255.3 240,878.6 167,499.1 165,143.7 51,019.5 98,907.3 102,842.2 162,823.1 262,783.5 2,392,755.3287,220.4 234,140.6Gas (kWh)975.6 975.6 975.6 975.6 975.6 975.6 975.6 975.6 975.6 975.6 975.6 975.6 975.6Peak (kW)
Eq5020 - Heating water circ pump (Misc Accessory Equipment)268,125.0 340,275.0 253,500.0 196,950.0 193,050.0 63,375.0 123,825.0 122,850.0 214,500.0 286,650.0 2,630,550.0294,450.0 273,000.0Electric (kWh)
975.0 975.0 975.0 975.0 975.0 975.0 975.0 975.0 975.0 975.0 975.0 975.0 975.0Peak (kW)
Project Name: TRACE® 700 v4.1 calculated at 08:02 PM on 03/28/2006Dataset Name: P:\becca's trace\Palestra.TRC Alternative - 1 Equipment Energy Consumption report page 4 of 6

EQUIPMENT ENERGY CONSUMPTIONBy ae
Alternative: 1 Palestra Building
Jan Feb Mar Apr May June July Aug Sept Oct Nov Dec TotalEquipment - Utility
------- Monthly Consumption -------
Hpl 1: BOILERSEq5240 - Boiler forced draft fan (Misc Accessory Equipment)
750.9 952.9 709.9 551.5 540.6 177.5 346.8 344.0 600.7 802.7 7,366.6824.6 764.5Electric (kWh)2.7 2.7 2.7 2.7 2.7 2.7 2.7 2.7 2.7 2.7 2.7 2.7 2.7Peak (kW)
Eq5307 - Boiler cntl panel & inter (Misc Accessory Equipment)137.5 174.5 130.0 101.0 99.0 32.5 63.5 63.0 110.0 147.0 1,349.0151.0 140.0Electric (kWh)
0.5 0.5 0.5 0.5 0.5 0.5 0.5 0.5 0.5 0.5 0.5 0.5 0.5Peak (kW)
Boiler 2 (Heating Equipment)265,365.8 321,951.3 232,376.6 139,441.6 113,490.8 34,944.8 74,469.3 76,375.6 138,526.9 237,073.3 2,132,552.8278,048.9 220,487.8Gas (kWh)
975.6 975.6 975.6 975.6 975.6 975.6 975.6 975.6 975.6 975.6 975.6 975.6 975.6Peak (kW)
Eq5020 - Heating water circ pump (Misc Accessory Equipment)222,300.0 246,675.0 175,500.0 128,700.0 111,150.0 43,875.0 93,600.0 86,775.0 128,700.0 216,450.0 1,904,175.0249,600.0 200,850.0Electric (kWh)
975.0 975.0 975.0 975.0 975.0 975.0 975.0 975.0 975.0 975.0 975.0 975.0 975.0Peak (kW)
Eq5240 - Boiler forced draft fan (Misc Accessory Equipment)622.5 690.8 491.5 360.4 311.3 122.9 262.1 243.0 360.4 606.2 5,332.5699.0 562.5Electric (kWh)
2.7 2.7 2.7 2.7 2.7 2.7 2.7 2.7 2.7 2.7 2.7 2.7 2.7Peak (kW)
Eq5307 - Boiler cntl panel & inter (Misc Accessory Equipment)114.0 126.5 90.0 66.0 57.0 22.5 48.0 44.5 66.0 111.0 976.5128.0 103.0Electric (kWh)
0.5 0.5 0.5 0.5 0.5 0.5 0.5 0.5 0.5 0.5 0.5 0.5 0.5Peak (kW)
Boiler 3 (Heating Equipment)256,255.0 291,909.8 218,536.6 116,359.2 111,219.5 19,512.2 35,386.3 60,698.7 115,316.5 237,073.3 1,951,579.8268,825.0 220,487.8Gas (kWh)
975.6 975.6 975.6 975.6 975.6 975.6 975.6 975.6 975.6 975.6 975.6 975.6 975.6Peak (kW)
Eq5020 - Heating water circ pump (Misc Accessory Equipment)222,300.0 228,150.0 159,900.0 111,150.0 111,150.0 19,500.0 48,750.0 67,275.0 128,700.0 216,450.0 1,763,775.0249,600.0 200,850.0Electric (kWh)
975.0 975.0 975.0 975.0 975.0 975.0 975.0 975.0 975.0 975.0 975.0 975.0 975.0Peak (kW)
Eq5240 - Boiler forced draft fan (Misc Accessory Equipment)622.5 638.9 447.8 311.3 311.3 54.6 136.5 188.4 360.4 606.2 4,939.3699.0 562.5Electric (kWh)
2.7 2.7 2.7 2.7 2.7 2.7 2.7 2.7 2.7 2.7 2.7 2.7 2.7Peak (kW)
Eq5307 - Boiler cntl panel & inter (Misc Accessory Equipment)114.0 117.0 82.0 57.0 57.0 10.0 25.0 34.5 66.0 111.0 904.5128.0 103.0Electric (kWh)
0.5 0.5 0.5 0.5 0.5 0.5 0.5 0.5 0.5 0.5 0.5 0.5 0.5Peak (kW)
Project Name: TRACE® 700 v4.1 calculated at 08:02 PM on 03/28/2006Dataset Name: P:\becca's trace\Palestra.TRC Alternative - 1 Equipment Energy Consumption report page 5 of 6

EQUIPMENT ENERGY CONSUMPTIONBy ae
Alternative: 1 Palestra Building
Jan Feb Mar Apr May June July Aug Sept Oct Nov Dec TotalEquipment - Utility
------- Monthly Consumption -------
Hpl 1: BOILERSBoiler 4 (Heating Equipment)
235,986.4 280,975.7 218,452.8 111,945.3 98,637.2 19,512.2 5,717.9 36,875.7 100,372.3 232,103.8 1,811,781.6257,550.5 213,651.8Gas (kWh)975.6 975.6 975.6 975.6 975.6 975.6 975.6 975.6 975.6 975.6 975.6 975.6 975.6Peak (kW)
Eq5020 - Heating water circ pump (Misc Accessory Equipment)206,700.0 209,625.0 159,900.0 111,150.0 111,150.0 19,500.0 7,800.0 41,925.0 112,125.0 216,450.0 1,630,200.0233,025.0 200,850.0Electric (kWh)
975.0 975.0 975.0 975.0 975.0 975.0 975.0 975.0 975.0 975.0 975.0 975.0 975.0Peak (kW)
Eq5240 - Boiler forced draft fan (Misc Accessory Equipment)578.8 587.0 447.8 311.3 311.3 54.6 21.8 117.4 314.0 606.2 4,565.2652.6 562.5Electric (kWh)
2.7 2.7 2.7 2.7 2.7 2.7 2.7 2.7 2.7 2.7 2.7 2.7 2.7Peak (kW)
Eq5307 - Boiler cntl panel & inter (Misc Accessory Equipment)106.0 107.5 82.0 57.0 57.0 10.0 4.0 21.5 57.5 111.0 836.0119.5 103.0Electric (kWh)
0.5 0.5 0.5 0.5 0.5 0.5 0.5 0.5 0.5 0.5 0.5 0.5 0.5Peak (kW)
Project Name: TRACE® 700 v4.1 calculated at 08:02 PM on 03/28/2006Dataset Name: P:\becca's trace\Palestra.TRC Alternative - 1 Equipment Energy Consumption report page 6 of 6

MONTHLY ENERGY CONSUMPTIONBy ae
Alternative: 1 Palestra Building
Jan Feb Mar Apr May June July Aug Sept Oct Nov Dec TotalUtility
------- Monthly Energy Consumption -------
Electric20,394,1521,807,6701,911,9221,659,6701,353,8671,502,6111,280,1221,621,3891,633,4661,692,8342,105,6941,819,3452,005,564On-Pk Cons. (kWh)
7,6947,6947,4547,3177,3067,3497,3217,3167,3527,4567,6877,6877,543On-Pk Demand (kW)
Gas8,288,669888,768969,033517,039276,792214,481124,989488,491535,245910,2441,233,0921,038,8491,091,644On-Pk Cons. (kWh)
3,9023,9023,9023,9023,9023,9023,9023,9023,9023,9023,9023,9023,902On-Pk Demand (kW)
Building Energy Consumption = Source Energy Consumption = Floor Area =
3,3328,123
m2
MJ/(m2-year)MJ/(m2-year)
30,992
Project Name: TRACE® 700 v4.1 calculated at 08:02 PM on 03/28/2006Dataset Name: P:\becca's trace\Palestra.TRC Alternative - 1 Monthly Energy Consumption report page 1

ENERGY CONSUMPTION SUMMARYBy ae
EnergyEnergy*of Total
Percent Total Source
(kWh/yr)
ElectCons.(kWh)
GasCons.(kwh)
Primary heatingPrimary heating 26,269.6 8,288,669.0 29.0 8,803,731.0%
Primary coolingCooling Compressor 38,123.2 0.1 114,381.1%Tower/Cond Fans 23,232.9 0.1 69,705.7%Condenser Pump 10,650.8 0.0 31,955.5%Other CLG Accessories 130.8 0.0 392.4% Cooling Subtotal.... 72,137.7 0.3 216,434.7%
AuxiliarySupply Fans 7,931,724.5 27.7 23,797,552.0%Circ Pumps 7,929,899.5 27.7 23,792,076.0%Base Utilities 0.0 0.0% Aux Subtotal.... 15,861,624.0 55.3 47,589,628.0%
LightingLighting 1,623,302.6 5.7 4,870,394.5%
ReceptacleReceptacles 2,810,820.3 9.8 8,433,304.0%
Heating plant loadBase Utilities 0.0 0.0%
CogenerationCogeneration 0.0 0.0%
TotalsTotals** 20,394,154.0 8,288,669.0 100.0 69,913,488.0%
Project Name: TRACE® 700 v4.1 calculated at 08:02 PM on 03/28/2006
* Note: Resource Utilization factors are included in the Total Source Energy value.** Note: This report can display a maximum of 6 utilities. If additional utilities are used, they will be included in the total.
Dataset Name: P:\becca's trace\Palestra.TRC Alternative - 1 Energy Consumption Summary report page 1

MONTHLY UTILITY COSTSBy ae
Alternative: 1
Jan Feb Mar Apr May June July Aug Sept Oct Nov Dec TotalUtility------- Monthly Utility Costs -------
Electric1,686,906149,515158,132137,282112,006124,300105,910134,118135,116140,023174,149150,480165,872On-Pk Cons. ($)
1,207101101101101101101101101101101101101Off-Pk Cons. ($)
165,973 150,581 174,249 140,124 135,217 134,219 106,011 124,401 112,106 137,383 158,233 149,616 1,688,113Total ($):
Gas26,3202,8223,0771,6428796813971,5511,7002,8903,9163,2993,466On-Pk Cons. ($)
169,440 153,880 178,165 143,014 136,917 135,770 106,408 125,082 112,985 139,025 161,310 152,438 1,714,433Monthly Total ($):
Project Name: TRACE® 700 v4.1 calculated at 08:02 PM on 03/28/2006Dataset Name: P:\becca's trace\Palestra.TRC Monthly Utility Costs report Page 1 of 1

ELECTRICAL PEAK CHECKSUMSBy ae
Alternative: 1 Palestra Building
Equipment Description Electrical Demand Percent of Total(kw) (%)
Yearly Time of Peak: 14(Hr) 7(Month)
Cooling Equipment0.74 0.01Chiller 2
0.74Sub total 0.01
Heating Equipment978.23 12.72Boiler 1
978.23Sub total 12.72
Fan Equipment1,350.00 17.56SUMMATION OF FAN ELECTRICAL DEMAND1,350.00 17.56SUMMATION OF FAN ELECTRICAL DEMAND
40.00 0.52SUMMATION OF FAN ELECTRICAL DEMAND55.00 0.72SUMMATION OF FAN ELECTRICAL DEMAND55.00 0.72SUMMATION OF FAN ELECTRICAL DEMAND
2,850.00Sub total 37.08
Miscellaneous329.39 4.28Lights
0.00 0.00Base Utilities601.41 7.82Misc Equipment
930.80Sub total 12.10
Total 624,759.77
Project Name: TRACE® 700 v4.1 calculated at 08:02 PM on 03/28/2006Dataset Name: P:\becca's trace\Palestra.TRC Alternative - 1 Elect. Peak Checksums report page 1

By ae
YEARLY CASH FLOW
Alternative: 1Life Cycle Cost:
Year UtilityCost($)
Maint.Cost($)
InterestCost($)
PrincipalCost($)
PropertyTaxes
($)
InsuranceCost($)
RevenuePenalty
($)
Replace.Expenses
($)
Deprec.Tax($)
Cash FlowEffect
($)
PresentValue
($)
31,868,440.64
0 0 0 0 17,826,732 0 0 0 0 17,826,732 17,826,73201 1,714,433 306,000 0 0 0 0 0 891,337 1,438,079 1,250,50402 1,714,433 367,200 0 0 0 0 0 891,337 1,487,039 1,124,41503 1,714,433 440,640 0 0 0 0 0 891,337 1,545,791 1,016,38304 1,714,433 528,768 0 0 0 0 0 891,337 1,616,294 924,12105 1,714,433 634,522 0 0 0 0 0 891,337 1,700,897 845,64606 1,714,433 761,426 0 0 0 0 0 891,337 1,802,420 779,23607 1,714,433 913,711 0 0 0 0 0 891,337 1,924,248 723,39608 1,714,433 1,096,453 0 0 0 0 0 891,337 2,070,442 676,83109 1,714,433 1,315,744 0 0 0 0 0 891,337 2,245,875 638,4180
10 1,714,433 1,578,893 0 0 0 0 0 891,337 2,456,394 607,183011 1,714,433 1,894,671 0 0 0 0 0 891,337 2,709,016 582,285012 1,714,433 2,273,605 0 0 0 0 0 891,337 3,012,164 562,995013 1,714,433 2,728,326 0 0 0 0 0 891,337 3,375,941 548,685014 1,714,433 3,273,992 0 0 0 0 0 891,337 3,812,473 538,812015 1,714,433 3,928,790 0 0 0 0 0 891,337 4,336,311 532,909016 1,714,433 4,714,548 0 0 0 0 0 891,337 4,964,918 530,575017 1,714,433 5,657,457 0 0 0 0 0 891,337 5,719,245 531,466018 1,714,433 6,788,949 0 0 0 0 0 891,337 6,624,439 535,289019 1,714,433 8,146,739 0 0 0 0 0 891,337 7,710,670 541,793020 1,714,433 9,776,086 0 0 0 0 0 891,337 9,014,148 550,7670
Project Name: TRACE® 700 v4.1 calculated at 08:02 PM on 03/28/2006Dataset Name: P:\becca's trace\Palestra.TRC Yearly Cash Flow report Page 1 of 1

TRACE® 700 Economic SummaryBy ae
London, EnglandBalckfriars Investment
Weather file Heathrow, England
UserCompany Penn State UniversityComments
- Palestra Building
Building OwnerLocation
Project InformationProject Name
Alternative 1 -
InstalledCost
First YearUtil.Cost
Final YearUtil. Cost
First YearMaint. Cost
Final YearMaint. Cost
Life CycleCost
AlternativeNumber
1,714,433.42 1,714,433.42 306,000.00 9,776,086.141 31,868,440.6417,826,732.00
Economic Summary
0K
20K
40K
60K
80K
100K
120K
140K
160K
180K
Janu
aryFeb
ruary
March
April
May
June July
Augus
tSep
tembe
rOcto
ber
Novem
ber
Decem
ber
ElectricConsumptionGas
Monthly Utility Costs per Utility(1 alternative)
Project Name: TRACE® 700 v4.1 calculated at 03:13 PM on 04/01/2006File Name: P:\becca's trace\Palestra.TRC Economics Summary Page 1 of 2

Equipment Energy Consumption by Alternative
(kWh/yr)
Total SourcePercentof Total Energy*Energy
GasCons.(kwh)
ElectCons.(kWh)
Alternative: 1 - Palestra BuildingPrimary heating 26,269.6 8,288,669.0 8,803,731.0%29.0Cooling Compressor 38,123.2 114,381.1%0.1Tower/Cond Fans 23,232.9 69,705.7%0.1Condenser Pump 10,650.8 31,955.5%0.0Other CLG Accessories 130.8 392.4%0.0Supply Fans 7,931,724.5 23,797,552.0%27.7Circ Pumps 7,929,899.5 23,792,076.0%27.7Lighting 1,623,302.6 4,870,394.5%5.7
Totals 20,394,154.0 8,288,669.0 %100.0 69,913,488.0
* Note: Resource Utilization factors are included in the Total Source Energy value.
Project Name: TRACE® 700 v4.1 calculated at 03:13 PM on 04/01/2006File Name: P:\becca's trace\Palestra.TRC Economics Summary Page 2 of 2

Rebecca S. Allen
The Palestra Building London, England
1
Natural Gas Engine Driven Chiller Plant Energy Simulation
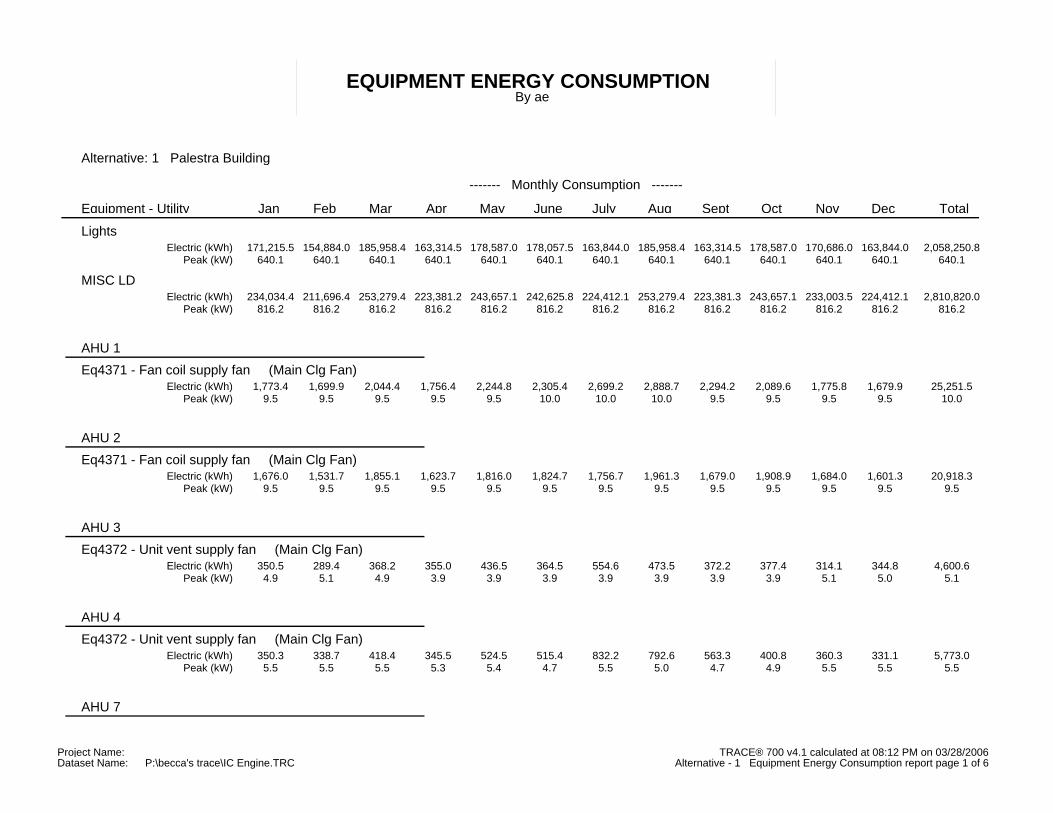
EQUIPMENT ENERGY CONSUMPTIONBy ae
Alternative: 1 Palestra Building
Jan Feb Mar Apr May June July Aug Sept Oct Nov Dec TotalEquipment - Utility
------- Monthly Consumption -------
Lights154,884.0 185,958.4 163,314.5 178,587.0 178,057.5 163,844.0 185,958.4 163,314.5 178,587.0 170,686.0 2,058,250.8171,215.5 163,844.0Electric (kWh)
640.1 640.1 640.1 640.1 640.1 640.1 640.1 640.1 640.1 640.1 640.1 640.1 640.1Peak (kW)
MISC LD211,696.4 253,279.4 223,381.2 243,657.1 242,625.8 224,412.1 253,279.4 223,381.3 243,657.1 233,003.5 2,810,820.0234,034.4 224,412.1Electric (kWh)
816.2 816.2 816.2 816.2 816.2 816.2 816.2 816.2 816.2 816.2 816.2 816.2 816.2Peak (kW)
AHU 1Eq4371 - Fan coil supply fan (Main Clg Fan)
1,699.9 2,044.4 1,756.4 2,244.8 2,305.4 2,699.2 2,888.7 2,294.2 2,089.6 1,775.8 25,251.51,773.4 1,679.9Electric (kWh)9.5 9.5 9.5 9.5 9.5 10.0 10.0 10.0 9.5 9.5 9.5 9.5 10.0Peak (kW)
AHU 2Eq4371 - Fan coil supply fan (Main Clg Fan)
1,531.7 1,855.1 1,623.7 1,816.0 1,824.7 1,756.7 1,961.3 1,679.0 1,908.9 1,684.0 20,918.31,676.0 1,601.3Electric (kWh)9.5 9.5 9.5 9.5 9.5 9.5 9.5 9.5 9.5 9.5 9.5 9.5 9.5Peak (kW)
AHU 3Eq4372 - Unit vent supply fan (Main Clg Fan)
289.4 368.2 355.0 436.5 364.5 554.6 473.5 372.2 377.4 314.1 4,600.6350.5 344.8Electric (kWh)4.9 5.1 4.9 3.9 3.9 3.9 3.9 3.9 3.9 3.9 5.1 5.0 5.1Peak (kW)
AHU 4Eq4372 - Unit vent supply fan (Main Clg Fan)
338.7 418.4 345.5 524.5 515.4 832.2 792.6 563.3 400.8 360.3 5,773.0350.3 331.1Electric (kWh)5.5 5.5 5.5 5.3 5.4 4.7 5.5 5.0 4.7 4.9 5.5 5.5 5.5Peak (kW)
AHU 7
Project Name: TRACE® 700 v4.1 calculated at 08:12 PM on 03/28/2006Dataset Name: P:\becca's trace\IC Engine.TRC Alternative - 1 Equipment Energy Consumption report page 1 of 6

EQUIPMENT ENERGY CONSUMPTIONBy ae
Alternative: 1 Palestra Building
Jan Feb Mar Apr May June July Aug Sept Oct Nov Dec TotalEquipment - Utility
------- Monthly Consumption -------
AHU 7Eq4371 - Fan coil supply fan (Main Clg Fan)
1,719.5 2,081.5 1,810.0 1,991.0 1,991.0 1,810.0 2,081.5 1,810.0 1,991.0 1,900.5 22,896.51,900.5 1,810.0Electric (kWh)10.0 10.0 10.0 10.0 10.0 10.0 10.0 10.0 10.0 10.0 10.0 10.0 10.0Peak (kW)
Cpl 1: IC Engine Chiller PlantIC Chiller 1 (Cooling Equipment)
467.9 621.4 1,056.5 5,550.6 8,379.2 32,928.5 16,273.2 9,352.1 4,416.9 710.3 81,041.5622.7 662.4Gas (kWh)80.3 80.2 80.1 94.5 94.5 94.5 393.7 193.9 141.8 94.5 85.6 94.5 393.7Peak (kW)
Eq5100 - Cooling tower2,026.9 2,450.6 2,311.0 4,401.3 4,531.9 6,880.6 6,962.3 4,951.1 4,005.2 2,342.0 45,375.52,260.9 2,252.0Electric (kWh)
13.6 13.9 14.2 16.8 21.5 21.5 21.5 21.5 21.5 18.1 14.1 15.1 21.5Peak (kW)
Eq5100 - Cooling tower112.1 143.0 145.9 392.4 364.8 1,294.6 708.0 456.7 216.4 128.3 4,205.4124.3 119.0Make Up Water (kL)
3.6 3.8 4.1 4.8 5.5 6.0 11.3 8.0 6.5 4.8 3.7 3.7 11.3Peak (kL/Hr)
Eq5001 - Cnst vol chill water pump (Misc Accessory Equipment)10.9 14.6 29.2 262.7 361.2 474.3 461.5 328.3 268.2 21.9 2,263.714.6 16.4Electric (kWh)
1.8 1.8 1.8 1.8 1.8 1.8 1.8 1.8 1.8 1.8 1.8 1.8 1.8Peak (kW)
Eq5010 - Cnst vol cnd water pump (Misc Accessory Equipment)18.8 25.1 50.1 451.1 620.2 814.4 792.5 563.8 460.5 37.6 3,887.325.1 28.2Electric (kWh)
3.1 3.1 3.1 3.1 3.1 3.1 3.1 3.1 3.1 3.1 3.1 3.1 3.1Peak (kW)
Eq5300 - Cntl panel & interlocks (Misc Accessory Equipment)6.0 8.0 16.0 144.0 198.0 260.0 253.0 180.0 147.0 12.0 1,241.08.0 9.0Electric (kWh)
1.0 1.0 1.0 1.0 1.0 1.0 1.0 1.0 1.0 1.0 1.0 1.0 1.0Peak (kW)
EDC Heater (Misc Accessory Equipment)99.9 110.4 105.6 90.0 78.3 72.6 73.7 81.0 89.6 106.2 1,127.9110.4 110.3Electric (kWh)
0.2 0.2 0.2 0.2 0.2 0.2 0.2 0.2 0.2 0.2 0.2 0.2 0.2Peak (kW)
IC CHiller 2 (Cooling Equipment)0.0 0.0 0.0 0.0 0.0 7,500.0 0.0 0.0 0.0 0.0 7,500.00.0 0.0Gas (kWh)
0.0 0.0 0.0 0.0 0.0 0.0 393.7 193.9 0.0 0.0 0.0 0.0 393.7Peak (kW)
Project Name: TRACE® 700 v4.1 calculated at 08:12 PM on 03/28/2006Dataset Name: P:\becca's trace\IC Engine.TRC Alternative - 1 Equipment Energy Consumption report page 2 of 6

EQUIPMENT ENERGY CONSUMPTIONBy ae
Alternative: 1 Palestra Building
Jan Feb Mar Apr May June July Aug Sept Oct Nov Dec TotalEquipment - Utility
------- Monthly Consumption -------
Cpl 1: IC Engine Chiller PlantEq5100 - Cooling tower
0.0 0.0 0.0 0.0 0.0 965.3 0.0 0.0 0.0 0.0 965.30.0 0.0Electric (kWh)0.0 0.0 0.0 0.0 0.0 0.0 21.5 21.5 0.0 0.0 0.0 0.0 21.5Peak (kW)
Eq5100 - Cooling tower0.0 0.0 0.0 0.0 0.0 79.3 0.0 0.0 0.0 0.0 79.30.0 0.0Make Up Water (kL)
0.0 0.0 0.0 0.0 0.0 0.0 3.3 2.0 0.0 0.0 0.0 0.0 3.3Peak (kL/Hr)
Eq5001 - Cnst vol chill water pump (Misc Accessory Equipment)0.0 0.0 0.0 0.0 0.0 82.1 0.0 0.0 0.0 0.0 82.10.0 0.0Electric (kWh)
0.0 0.0 0.0 0.0 0.0 0.0 1.8 1.8 0.0 0.0 0.0 0.0 1.8Peak (kW)
Eq5010 - Cnst vol cnd water pump (Misc Accessory Equipment)0.0 0.0 0.0 0.0 0.0 141.0 0.0 0.0 0.0 0.0 141.00.0 0.0Electric (kWh)
0.0 0.0 0.0 0.0 0.0 0.0 3.1 3.1 0.0 0.0 0.0 0.0 3.1Peak (kW)
Eq5300 - Cntl panel & interlocks (Misc Accessory Equipment)0.0 0.0 0.0 0.0 0.0 45.0 0.0 0.0 0.0 0.0 45.00.0 0.0Electric (kWh)
0.0 0.0 0.0 0.0 0.0 0.0 1.0 1.0 0.0 0.0 0.0 0.0 1.0Peak (kW)
EDC Heater (Misc Accessory Equipment)100.8 111.6 108.0 111.6 108.0 104.9 111.6 108.0 111.6 108.0 1,307.3111.6 111.6Electric (kWh)
0.2 0.2 0.2 0.2 0.2 0.2 0.2 0.2 0.2 0.2 0.2 0.2 0.2Peak (kW)
IC Chiller 3 (Cooling Equipment)Gas 0.0 0.0 0.0 0.0 0.0 0.0 393.7 0.0 0.0 0.0 0.0 0.0 393.7Peak (kW)Eq5100 - Cooling towerElectric 0.0 0.0 0.0 0.0 0.0 0.0 21.5 0.0 0.0 0.0 0.0 0.0 21.5Peak (kW)Eq5100 - Cooling towerMake Up Water 0.0 0.0 0.0 0.0 0.0 0.0 3.3 0.0 0.0 0.0 0.0 0.0 3.3Peak (kL/Hr)Eq5001 - Cnst vol chill water pump (Misc Accessory Equipment)Electric 0.0 0.0 0.0 0.0 0.0 0.0 1.8 0.0 0.0 0.0 0.0 0.0 1.8Peak (kW)Eq5010 - Cnst vol cnd water pump (Misc Accessory Equipment)Electric 0.0 0.0 0.0 0.0 0.0 0.0 3.1 0.0 0.0 0.0 0.0 0.0 3.1Peak (kW)Eq5300 - Cntl panel & interlocks (Misc Accessory Equipment)Electric 0.0 0.0 0.0 0.0 0.0 0.0 1.0 0.0 0.0 0.0 0.0 0.0 1.0Peak (kW)
Project Name: TRACE® 700 v4.1 calculated at 08:12 PM on 03/28/2006Dataset Name: P:\becca's trace\IC Engine.TRC Alternative - 1 Equipment Energy Consumption report page 3 of 6

EQUIPMENT ENERGY CONSUMPTIONBy ae
Alternative: 1 Palestra Building
Jan Feb Mar Apr May June July Aug Sept Oct Nov Dec TotalEquipment - Utility
------- Monthly Consumption -------
Cpl 1: IC Engine Chiller PlantEDC Heater (Misc Accessory Equipment)
100.8 111.6 108.0 111.6 108.0 111.6 111.6 108.0 111.6 108.0 1,314.0111.6 111.6Electric (kWh)0.2 0.2 0.2 0.2 0.2 0.2 0.2 0.2 0.2 0.2 0.2 0.2 0.2Peak (kW)
IC CHiller 4 (Cooling Equipment)Gas 0.0 0.0 0.0 0.0 0.0 0.0 393.7 0.0 0.0 0.0 0.0 0.0 393.7Peak (kW)Eq5100 - Cooling towerElectric 0.0 0.0 0.0 0.0 0.0 0.0 21.5 0.0 0.0 0.0 0.0 0.0 21.5Peak (kW)Eq5100 - Cooling towerMake Up Water 0.0 0.0 0.0 0.0 0.0 0.0 3.3 0.0 0.0 0.0 0.0 0.0 3.3Peak (kL/Hr)Eq5001 - Cnst vol chill water pump (Misc Accessory Equipment)Electric 0.0 0.0 0.0 0.0 0.0 0.0 1.8 0.0 0.0 0.0 0.0 0.0 1.8Peak (kW)Eq5010 - Cnst vol cnd water pump (Misc Accessory Equipment)Electric 0.0 0.0 0.0 0.0 0.0 0.0 3.1 0.0 0.0 0.0 0.0 0.0 3.1Peak (kW)Eq5300 - Cntl panel & interlocks (Misc Accessory Equipment)Electric 0.0 0.0 0.0 0.0 0.0 0.0 1.0 0.0 0.0 0.0 0.0 0.0 1.0Peak (kW)EDC Heater (Misc Accessory Equipment)
100.8 111.6 108.0 111.6 108.0 111.6 111.6 108.0 111.6 108.0 1,314.0111.6 111.6Electric (kWh)0.2 0.2 0.2 0.2 0.2 0.2 0.2 0.2 0.2 0.2 0.2 0.2 0.2Peak (kW)
IC Chiller 5 (Cooling Equipment)Gas 0.0 0.0 0.0 0.0 0.0 0.0 393.7 0.0 0.0 0.0 0.0 0.0 393.7Peak (kW)Eq5100 - Cooling towerElectric 0.0 0.0 0.0 0.0 0.0 0.0 21.5 0.0 0.0 0.0 0.0 0.0 21.5Peak (kW)Eq5100 - Cooling towerMake Up Water 0.0 0.0 0.0 0.0 0.0 0.0 3.3 0.0 0.0 0.0 0.0 0.0 3.3Peak (kL/Hr)Eq5001 - Cnst vol chill water pump (Misc Accessory Equipment)Electric 0.0 0.0 0.0 0.0 0.0 0.0 1.8 0.0 0.0 0.0 0.0 0.0 1.8Peak (kW)Eq5010 - Cnst vol cnd water pump (Misc Accessory Equipment)Electric 0.0 0.0 0.0 0.0 0.0 0.0 3.1 0.0 0.0 0.0 0.0 0.0 3.1Peak (kW)Eq5300 - Cntl panel & interlocks (Misc Accessory Equipment)Electric 0.0 0.0 0.0 0.0 0.0 0.0 1.0 0.0 0.0 0.0 0.0 0.0 1.0Peak (kW)
Project Name: TRACE® 700 v4.1 calculated at 08:12 PM on 03/28/2006Dataset Name: P:\becca's trace\IC Engine.TRC Alternative - 1 Equipment Energy Consumption report page 4 of 6

EQUIPMENT ENERGY CONSUMPTIONBy ae
Alternative: 1 Palestra Building
Jan Feb Mar Apr May June July Aug Sept Oct Nov Dec TotalEquipment - Utility
------- Monthly Consumption -------
Cpl 1: IC Engine Chiller PlantEDC Heater (Misc Accessory Equipment)
100.8 111.6 108.0 111.6 108.0 111.6 111.6 108.0 111.6 108.0 1,314.0111.6 111.6Electric (kWh)0.2 0.2 0.2 0.2 0.2 0.2 0.2 0.2 0.2 0.2 0.2 0.2 0.2Peak (kW)
Hpl 1: BOILERSBoiler 1 (Heating Equipment)
279,779.7 337,934.0 244,647.7 171,879.6 159,275.1 51,019.5 101,100.0 100,938.4 163,548.8 256,205.4 2,386,237.8287,220.4 232,689.0Gas (kWh)975.6 975.6 975.6 975.6 975.6 975.6 975.6 975.6 975.6 975.6 975.6 975.6 975.6Peak (kW)
Eq5020 - Heating water circ pump (Misc Accessory Equipment)265,200.0 321,750.0 253,500.0 235,950.0 210,600.0 63,375.0 142,350.0 158,925.0 193,050.0 286,650.0 2,698,800.0294,450.0 273,000.0Electric (kWh)
975.0 975.0 975.0 975.0 975.0 975.0 975.0 975.0 975.0 975.0 975.0 975.0 975.0Peak (kW)
Eq5240 - Boiler forced draft fan (Misc Accessory Equipment)742.7 901.0 709.9 660.8 589.8 177.5 398.6 445.1 540.6 802.7 7,557.8824.6 764.5Electric (kWh)
2.7 2.7 2.7 2.7 2.7 2.7 2.7 2.7 2.7 2.7 2.7 2.7 2.7Peak (kW)
Eq5307 - Boiler cntl panel & inter (Misc Accessory Equipment)136.0 165.0 130.0 121.0 108.0 32.5 73.0 81.5 99.0 147.0 1,384.0151.0 140.0Electric (kWh)
0.5 0.5 0.5 0.5 0.5 0.5 0.5 0.5 0.5 0.5 0.5 0.5 0.5Peak (kW)
Boiler 2 (Heating Equipment)255,915.5 304,971.0 228,864.8 131,597.7 114,175.3 33,527.9 74,469.3 76,375.6 131,404.7 235,156.8 2,071,681.4264,735.0 220,487.8Gas (kWh)
975.6 975.6 975.6 975.6 975.6 975.6 975.6 975.6 975.6 975.6 975.6 975.6 975.6Peak (kW)
Eq5020 - Heating water circ pump (Misc Accessory Equipment)225,225.0 273,000.0 175,500.0 132,600.0 115,050.0 43,875.0 93,600.0 86,775.0 128,700.0 179,400.0 1,851,525.0233,025.0 164,775.0Electric (kWh)
975.0 975.0 975.0 975.0 975.0 975.0 975.0 975.0 975.0 975.0 975.0 975.0 975.0Peak (kW)
Eq5240 - Boiler forced draft fan (Misc Accessory Equipment)630.7 764.5 491.5 371.3 322.2 122.9 262.1 243.0 360.4 502.4 5,185.0652.6 461.4Electric (kWh)
2.7 2.7 2.7 2.7 2.7 2.7 2.7 2.7 2.7 2.7 2.7 2.7 2.7Peak (kW)
Eq5307 - Boiler cntl panel & inter (Misc Accessory Equipment)115.5 140.0 90.0 68.0 59.0 22.5 48.0 44.5 66.0 92.0 949.5119.5 84.5Electric (kWh)
0.5 0.5 0.5 0.5 0.5 0.5 0.5 0.5 0.5 0.5 0.5 0.5 0.5Peak (kW)
Project Name: TRACE® 700 v4.1 calculated at 08:12 PM on 03/28/2006Dataset Name: P:\becca's trace\IC Engine.TRC Alternative - 1 Equipment Energy Consumption report page 5 of 6

EQUIPMENT ENERGY CONSUMPTIONBy ae
Alternative: 1 Palestra Building
Jan Feb Mar Apr May June July Aug Sept Oct Nov Dec TotalEquipment - Utility
------- Monthly Consumption -------
Hpl 1: BOILERSBoiler 3 (Heating Equipment)
242,992.9 280,975.7 218,536.6 115,121.9 111,219.5 19,512.2 34,470.0 60,869.8 112,195.1 227,055.0 1,898,839.4257,561.1 218,329.6Gas (kWh)975.6 975.6 975.6 975.6 975.6 975.6 975.6 975.6 975.6 975.6 975.6 975.6 975.6Peak (kW)
Eq5020 - Heating water circ pump (Misc Accessory Equipment)209,625.0 235,950.0 175,500.0 115,050.0 111,150.0 19,500.0 48,750.0 67,275.0 112,125.0 175,500.0 1,651,650.0216,450.0 164,775.0Electric (kWh)
975.0 975.0 975.0 975.0 975.0 975.0 975.0 975.0 975.0 975.0 975.0 975.0 975.0Peak (kW)
Eq5240 - Boiler forced draft fan (Misc Accessory Equipment)587.0 660.8 491.5 322.2 311.3 54.6 136.5 188.4 314.0 491.5 4,625.3606.2 461.4Electric (kWh)
2.7 2.7 2.7 2.7 2.7 2.7 2.7 2.7 2.7 2.7 2.7 2.7 2.7Peak (kW)
Eq5307 - Boiler cntl panel & inter (Misc Accessory Equipment)107.5 121.0 90.0 59.0 57.0 10.0 25.0 34.5 57.5 90.0 847.0111.0 84.5Electric (kWh)
0.5 0.5 0.5 0.5 0.5 0.5 0.5 0.5 0.5 0.5 0.5 0.5 0.5Peak (kW)
Boiler 4 (Heating Equipment)231,219.4 280,975.7 208,181.2 113,339.2 97,531.8 19,512.2 6,035.5 35,733.9 90,007.1 216,585.4 1,737,327.1247,156.2 191,049.7Gas (kWh)
975.6 975.6 975.6 975.6 975.6 975.6 975.6 975.6 975.6 975.6 975.6 975.6 975.6Peak (kW)
Eq5020 - Heating water circ pump (Misc Accessory Equipment)194,025.0 235,950.0 175,500.0 115,050.0 111,150.0 19,500.0 7,800.0 41,925.0 112,125.0 175,500.0 1,566,825.0216,450.0 161,850.0Electric (kWh)
975.0 975.0 975.0 975.0 975.0 975.0 975.0 975.0 975.0 975.0 975.0 975.0 975.0Peak (kW)
Eq5240 - Boiler forced draft fan (Misc Accessory Equipment)543.4 660.8 491.5 322.2 311.3 54.6 21.8 117.4 314.0 491.5 4,387.8606.2 453.3Electric (kWh)
2.7 2.7 2.7 2.7 2.7 2.7 2.7 2.7 2.7 2.7 2.7 2.7 2.7Peak (kW)
Eq5307 - Boiler cntl panel & inter (Misc Accessory Equipment)99.5 121.0 90.0 59.0 57.0 10.0 4.0 21.5 57.5 90.0 803.5111.0 83.0Electric (kWh)
0.5 0.5 0.5 0.5 0.5 0.5 0.5 0.5 0.5 0.5 0.5 0.5 0.5Peak (kW)
Project Name: TRACE® 700 v4.1 calculated at 08:12 PM on 03/28/2006Dataset Name: P:\becca's trace\IC Engine.TRC Alternative - 1 Equipment Energy Consumption report page 6 of 6

MONTHLY ENERGY CONSUMPTIONBy ae
Alternative: 1 Palestra Building
Jan Feb Mar Apr May June July Aug Sept Oct Nov Dec TotalUtility
------- Monthly Energy Consumption -------
Electric12,803,4271,163,8181,232,433982,237756,026749,894552,818983,6711,035,6851,178,1141,519,2451,271,7621,377,723On-Pk Cons. (kWh)
5,4095,3995,3965,4095,3465,3525,2225,4075,4045,3975,3975,3965,395On-Pk Demand (kW)
Gas8,182,627863,219935,713501,573283,270232,348164,000490,581537,489901,2871,205,4771,010,3761,057,295On-Pk Cons. (kWh)
3,9973,9973,9883,9973,9973,9973,9973,9973,9973,9973,9823,9833,983On-Pk Demand (kW)
Water4,2851191282164577081,374365392146143112124Cons. (kL)
Building Energy Consumption = Source Energy Consumption = Floor Area =
2,4385,464
m2
MJ/(m2-year)MJ/(m2-year)
30,992
Project Name: TRACE® 700 v4.1 calculated at 08:12 PM on 03/28/2006Dataset Name: P:\becca's trace\IC Engine.TRC Alternative - 1 Monthly Energy Consumption report page 1

ENERGY CONSUMPTION SUMMARYBy ae
EnergyEnergy*of Total
Percent Total Source
(kWh/yr)
ElectCons.(kWh)
GasCons.(kwh)
WaterCons.(kL)
Primary heatingPrimary heating 25,739.8 8,094,085.5 38.7 8,597,317.0%
Primary coolingCooling Compressor 88,541.5 0.4 93,201.6%Tower/Cond Fans 46,340.8 4,284.7 0.2 139,036.2%Condenser Pump 4,028.2 0.0 12,085.9%Other CLG Accessories 7,663.1 0.0 22,991.6% Cooling Subtotal.... 58,032.1 88,541.5 4,284.7 0.7 267,315.3%
AuxiliarySupply Fans 79,439.9 0.4 238,343.6%Circ Pumps 7,771,146.0 37.0 23,315,768.0%Base Utilities 0.0 0.0% Aux Subtotal.... 7,850,586.0 37.4 23,554,112.0%
LightingLighting 2,058,250.8 9.8 6,175,369.5%
ReceptacleReceptacles 2,810,820.3 13.4 8,433,304.0%
Heating plant loadBase Utilities 0.0 0.0%
CogenerationCogeneration 0.0 0.0%
TotalsTotals** 12,803,429.0 8,182,627.0 4,284.7 100.0 47,027,416.0%
Project Name: TRACE® 700 v4.1 calculated at 08:12 PM on 03/28/2006
* Note: Resource Utilization factors are included in the Total Source Energy value.** Note: This report can display a maximum of 6 utilities. If additional utilities are used, they will be included in the total.
Dataset Name: P:\becca's trace\IC Engine.TRC Alternative - 1 Energy Consumption Summary report page 1
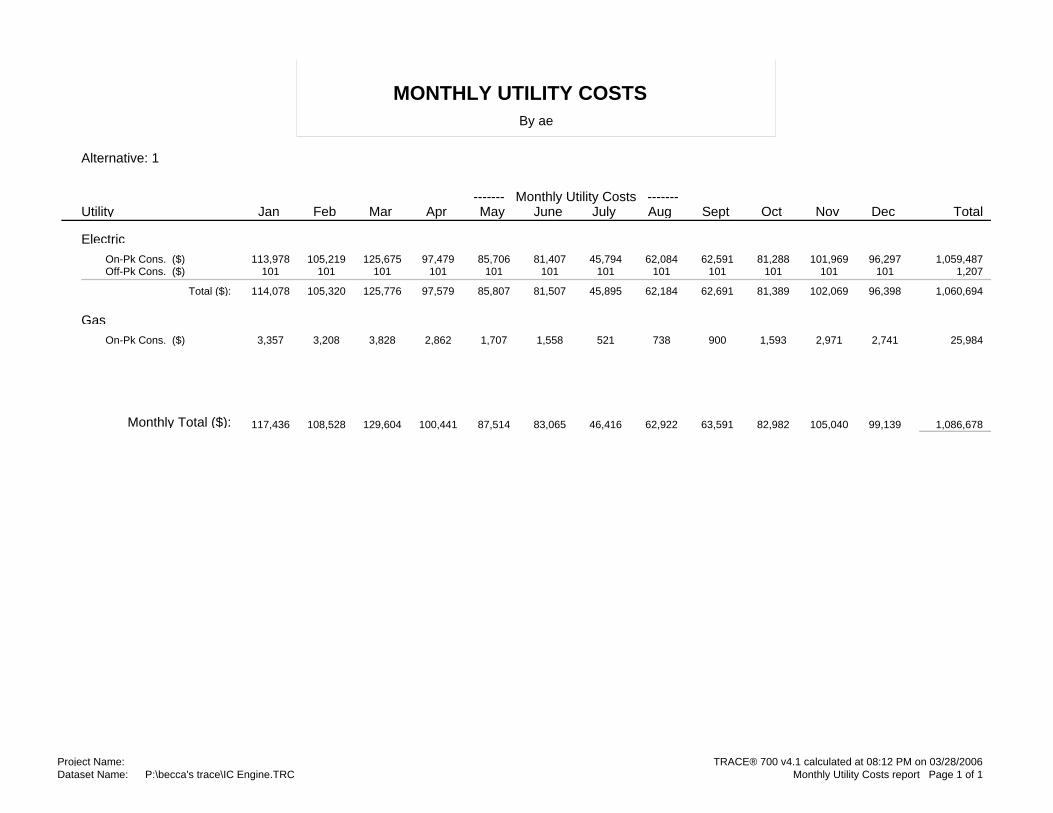
MONTHLY UTILITY COSTSBy ae
Alternative: 1
Jan Feb Mar Apr May June July Aug Sept Oct Nov Dec TotalUtility------- Monthly Utility Costs -------
Electric1,059,48796,297101,96981,28862,59162,08445,79481,40785,70697,479125,675105,219113,978On-Pk Cons. ($)
1,207101101101101101101101101101101101101Off-Pk Cons. ($)
114,078 105,320 125,776 97,579 85,807 81,507 45,895 62,184 62,691 81,389 102,069 96,398 1,060,694Total ($):
Gas25,9842,7412,9711,5939007385211,5581,7072,8623,8283,2083,357On-Pk Cons. ($)
117,436 108,528 129,604 100,441 87,514 83,065 46,416 62,922 63,591 82,982 105,040 99,139 1,086,678Monthly Total ($):
Project Name: TRACE® 700 v4.1 calculated at 08:12 PM on 03/28/2006Dataset Name: P:\becca's trace\IC Engine.TRC Monthly Utility Costs report Page 1 of 1

ELECTRICAL PEAK CHECKSUMSBy ae
Alternative: 1 Palestra Building
Equipment Description Electrical Demand Percent of Total(kw) (%)
Yearly Time of Peak: 17(Hr) 7(Month)
Cooling Equipment15.36 0.28IC Chiller 10.15 0.00IC CHiller 20.15 0.00IC Chiller 30.15 0.00IC CHiller 40.15 0.00IC Chiller 5
15.96Sub total 0.28
Heating Equipment978.23 18.13Boiler 1
978.23Sub total 18.13
Fan Equipment2.04 0.04SUMMATION OF FAN ELECTRICAL DEMAND0.47 0.01SUMMATION OF FAN ELECTRICAL DEMAND
10.00 0.19SUMMATION OF FAN ELECTRICAL DEMAND2.45 0.05SUMMATION OF FAN ELECTRICAL DEMAND0.85 0.02SUMMATION OF FAN ELECTRICAL DEMAND
15.81Sub total 0.31
Miscellaneous640.05 11.86Lights
0.00 0.00Base Utilities816.20 15.12Misc Equipment
1,456.25Sub total 26.98
Total 462,466.25
Project Name: TRACE® 700 v4.1 calculated at 08:12 PM on 03/28/2006Dataset Name: P:\becca's trace\IC Engine.TRC Alternative - 1 Elect. Peak Checksums report page 1

By ae
YEARLY CASH FLOW
Alternative: 1Life Cycle Cost:
Year UtilityCost($)
Maint.Cost($)
InterestCost($)
PrincipalCost($)
PropertyTaxes
($)
InsuranceCost($)
RevenuePenalty
($)
Replace.Expenses
($)
Deprec.Tax($)
Cash FlowEffect
($)
PresentValue
($)
28,724,974.84
0 0 0 0 17,826,732 0 0 0 0 17,826,732 17,826,73201 1,086,678 306,000 0 0 0 0 0 891,337 935,875 813,80402 1,086,678 367,200 0 0 0 0 0 891,337 984,835 744,67703 1,086,678 440,640 0 0 0 0 0 891,337 1,043,587 686,17504 1,086,678 528,768 0 0 0 0 0 891,337 1,114,089 636,98405 1,086,678 634,522 0 0 0 0 0 891,337 1,198,692 595,96206 1,086,678 761,426 0 0 0 0 0 891,337 1,300,215 562,11907 1,086,678 913,711 0 0 0 0 0 891,337 1,422,044 534,59908 1,086,678 1,096,453 0 0 0 0 0 891,337 1,568,237 512,66009 1,086,678 1,315,744 0 0 0 0 0 891,337 1,743,670 495,6600
10 1,086,678 1,578,893 0 0 0 0 0 891,337 1,954,189 483,046011 1,086,678 1,894,671 0 0 0 0 0 891,337 2,206,812 474,339012 1,086,678 2,273,605 0 0 0 0 0 891,337 2,509,959 469,129013 1,086,678 2,728,326 0 0 0 0 0 891,337 2,873,736 467,062014 1,086,678 3,273,992 0 0 0 0 0 891,337 3,310,268 467,836015 1,086,678 3,928,790 0 0 0 0 0 891,337 3,834,107 471,191016 1,086,678 4,714,548 0 0 0 0 0 891,337 4,462,713 476,907017 1,086,678 5,657,457 0 0 0 0 0 891,337 5,217,041 484,798018 1,086,678 6,788,949 0 0 0 0 0 891,337 6,122,234 494,708019 1,086,678 8,146,739 0 0 0 0 0 891,337 7,208,466 506,505020 1,086,678 9,776,086 0 0 0 0 0 891,337 8,511,944 520,0820
Project Name: TRACE® 700 v4.1 calculated at 08:12 PM on 03/28/2006Dataset Name: P:\becca's trace\IC Engine.TRC Yearly Cash Flow report Page 1 of 1

TRACE® 700 Economic SummaryBy ae
London, EnglandBalckfriars Investment
Weather file Heathrow, England
UserCompany Penn State UniversityComments
- Palestra Building
Building OwnerLocation
Project InformationProject Name
Alternative 1 -
InstalledCost
First YearUtil.Cost
Final YearUtil. Cost
First YearMaint. Cost
Final YearMaint. Cost
Life CycleCost
AlternativeNumber
1,107,063.98 1,107,063.98 306,000.00 9,776,086.141 29,095,149.9618,112,724.00
Economic Summary
0K
20K
40K
60K
80K
100K
120K
140K
Janu
aryFeb
ruary
March
April
May
June July
Augus
tSep
tembe
rOcto
ber
Novem
ber
Decem
ber
ElectricConsumptionGasWater
Monthly Utility Costs per Utility(1 alternative)
Project Name: TRACE® 700 v4.1 calculated at 03:08 PM on 04/01/2006File Name: P:\becca's trace\IC Engine.TRC Economics Summary Page 1 of 2

Equipment Energy Consumption by Alternative
(kWh/yr)
Total SourcePercentof Total Energy*Energy
WaterCons.(liters)
GasCons.(kwh)
ElectCons.(kWh)
Alternative: 1 - Palestra BuildingPrimary heating 25,739.8 8,094,085.5 8,597,317.0%38.7Cooling Compressor 88,541.5 93,201.6%0.4Tower/Cond Fans 46,340.8 4,284.7 139,036.2%0.2Condenser Pump 4,028.2 12,085.9%0.0Other CLG Accessories 7,663.1 22,991.6%0.0Supply Fans 79,439.9 238,343.6%0.4Circ Pumps 7,771,146.0 23,315,768.0%37.0Lighting 2,058,250.8 6,175,369.5%9.8
Totals 12,803,429.0 8,182,627.0 4,284.7 %100.0 47,027,416.0
* Note: Resource Utilization factors are included in the Total Source Energy value.
Project Name: TRACE® 700 v4.1 calculated at 03:08 PM on 04/01/2006File Name: P:\becca's trace\IC Engine.TRC Economics Summary Page 2 of 2

Rebecca S. Allen
The Palestra Building London, England
1
Dedicated Outdoor Air System Energy Simulation

EQUIPMENT ENERGY CONSUMPTIONBy ae
Alternative: 1 Palestra Building
Jan Feb Mar Apr May June July Aug Sept Oct Nov Dec TotalEquipment - Utility
------- Monthly Consumption -------
Lights24,305.9 29,140.7 25,636.5 28,005.2 27,907.7 25,733.9 29,140.7 25,636.5 28,005.1 26,772.1 322,887.826,869.5 25,733.9Electric (kWh)
97.7 97.7 97.7 97.7 97.7 97.7 97.7 97.7 97.7 97.7 97.7 97.7 97.7Peak (kW)
MISC LD38,494.9 46,056.4 40,619.6 44,306.7 44,119.2 40,807.1 46,056.4 40,619.7 44,306.7 42,369.4 511,119.942,556.8 40,807.1Electric (kWh)
148.4 148.4 148.4 148.4 148.4 148.4 148.4 148.4 148.4 148.4 148.4 148.4 148.4Peak (kW)
AHU 3 DOASEq4372 - Unit vent supply fan (Main Clg Fan)
9,244.8 10,208.7 6,768.3 3,557.9 3,255.1 5,253.7 3,083.8 3,823.7 7,507.6 10,277.8 82,719.29,933.0 9,804.8Electric (kWh)55.0 55.0 55.0 55.0 55.0 55.0 54.9 51.4 55.0 55.0 55.0 55.0 55.0Peak (kW)
AHU 4 DOASEq4372 - Unit vent supply fan (Main Clg Fan)
9,358.5 10,454.2 6,422.3 3,255.6 3,075.7 5,880.5 3,224.1 3,071.8 7,064.3 10,282.4 81,560.29,933.0 9,537.8Electric (kWh)55.0 55.0 55.0 55.0 55.0 53.4 55.0 43.6 55.0 55.0 55.0 55.0 55.0Peak (kW)
AHU DOAS 1Eq4371 - Fan coil supply fan (Main Clg Fan)
258,752.1 316,639.5 288,376.0 353,275.5 366,008.5 354,184.3 403,746.6 333,903.9 332,078.9 289,910.3 3,858,819.8285,833.6 276,110.4Electric (kWh)1,425.0 1,425.0 1,425.0 1,425.0 1,425.0 1,425.0 1,425.0 1,425.0 1,425.0 1,425.0 1,425.0 1,425.0 1,425.0Peak (kW)
AHU DOAS 2Eq4371 - Fan coil supply fan (Main Clg Fan)
257,552.2 311,965.2 281,604.2 327,899.3 332,123.8 349,410.6 385,116.4 313,078.7 316,818.9 280,214.3 3,713,359.0285,021.1 272,554.4Electric (kWh)1,425.0 1,425.0 1,425.0 1,425.0 1,425.0 1,425.0 1,425.0 1,425.0 1,425.0 1,425.0 1,425.0 1,425.0 1,425.0Peak (kW)
AHU DOAS 7
Project Name: TRACE® 700 v4.1 calculated at 08:15 PM on 03/28/2006Dataset Name: P:\becca's trace\DOAS full.TRC Alternative - 1 Equipment Energy Consumption report page 1 of 5

EQUIPMENT ENERGY CONSUMPTIONBy ae
Alternative: 1 Palestra Building
Jan Feb Mar Apr May June July Aug Sept Oct Nov Dec TotalEquipment - Utility
------- Monthly Consumption -------
AHU DOAS 7Eq4371 - Fan coil supply fan (Main Clg Fan)
68,780.0 83,260.0 72,400.0 79,640.0 79,640.0 72,400.0 83,260.0 72,400.0 79,640.0 76,020.0 915,860.076,020.0 72,400.0Electric (kWh)400.0 400.0 400.0 400.0 400.0 400.0 400.0 400.0 400.0 400.0 400.0 400.0 400.0Peak (kW)
Cpl 1: CHILLERSChiller 2 (Cooling Equipment)
67,254.1 74,462.5 72,071.4 74,708.3 72,858.9 75,280.6 77,756.5 73,316.3 74,553.4 72,061.5 883,248.274,462.7 74,462.0Electric (kWh)104.1 104.1 104.1 104.6 121.0 128.2 133.3 133.2 137.9 122.0 104.2 104.4 137.9Peak (kW)
Eq5221 - Condenser fan9,017.1 10,065.8 9,674.0 10,207.6 9,876.1 9,503.0 10,756.8 10,166.6 10,119.5 9,705.8 118,984.99,929.7 9,963.0Electric (kWh)
17.2 17.2 17.2 17.2 17.2 17.2 17.2 17.2 17.2 17.2 17.2 17.2 17.2Peak (kW)
Eq5001 - Cnst vol chill water pump (Misc Accessory Equipment)616.2 682.2 660.2 682.2 660.2 682.2 682.2 660.2 682.2 660.2 8,032.8682.2 682.2Electric (kWh)
0.9 0.9 0.9 0.9 0.9 0.9 0.9 0.9 0.9 0.9 0.9 0.9 0.9Peak (kW)
Eq5011 - Cnst vol cnd water pump (Misc Accessory Equipment)5,422.0 6,002.9 5,809.3 6,002.9 5,809.3 6,002.9 6,002.9 5,809.3 6,002.9 5,809.3 70,679.66,002.9 6,002.9Electric (kWh)
8.1 8.1 8.1 8.1 8.1 8.1 8.1 8.1 8.1 8.1 8.1 8.1 8.1Peak (kW)
Eq5302 - Cntl panel & interlocks (Misc Accessory Equipment)67.2 74.4 72.0 74.4 72.0 74.4 74.4 72.0 74.4 72.0 876.074.4 74.4Electric (kWh)
0.1 0.1 0.1 0.1 0.1 0.1 0.1 0.1 0.1 0.1 0.1 0.1 0.1Peak (kW)
Chiller 3 (Cooling Equipment)312.3 416.3 418.3 419.5 420.2 18,143.0 1,959.1 315.2 523.8 416.8 24,074.2416.4 313.3Electric (kWh)
104.1 104.1 104.1 104.6 104.9 105.1 131.8 118.2 105.1 104.8 104.2 104.4 131.8Peak (kW)
Eq5221 - Condenser fan38.8 51.7 52.0 52.2 52.3 2,141.0 245.5 39.2 65.1 51.8 2,880.251.8 38.9Electric (kWh)
12.9 12.9 12.9 13.0 13.0 13.1 14.8 13.6 13.1 13.0 13.0 13.0 14.8Peak (kW)
Eq5001 - Cnst vol chill water pump (Misc Accessory Equipment)2.8 3.7 3.7 3.7 3.7 183.4 21.1 2.8 4.6 3.7 239.33.7 2.8Electric (kWh)
0.9 0.9 0.9 0.9 0.9 0.9 0.9 0.9 0.9 0.9 0.9 0.9 0.9Peak (kW)
Project Name: TRACE® 700 v4.1 calculated at 08:15 PM on 03/28/2006Dataset Name: P:\becca's trace\DOAS full.TRC Alternative - 1 Equipment Energy Consumption report page 2 of 5

EQUIPMENT ENERGY CONSUMPTIONBy ae
Alternative: 1 Palestra Building
Jan Feb Mar Apr May June July Aug Sept Oct Nov Dec TotalEquipment - Utility
------- Monthly Consumption -------
Cpl 1: CHILLERSEq5012 - Cnst vol cnd water pump (Misc Accessory Equipment)
29.1 38.8 38.8 38.8 38.8 1,937.8 222.9 29.1 48.4 38.8 2,528.838.8 29.1Electric (kWh)9.7 9.7 9.7 9.7 9.7 9.7 9.7 9.7 9.7 9.7 9.7 9.7 9.7Peak (kW)
Eq5302 - Cntl panel & interlocks (Misc Accessory Equipment)0.3 0.4 0.4 0.4 0.4 20.0 2.3 0.3 0.5 0.4 26.10.4 0.3Electric (kWh)
0.1 0.1 0.1 0.1 0.1 0.1 0.1 0.1 0.1 0.1 0.1 0.1 0.1Peak (kW)
Chiller 4 (Cooling Equipment)312.2 416.1 418.1 419.2 420.0 2,480.4 421.5 315.0 523.5 416.6 6,871.8416.2 313.1Electric (kWh)
104.1 104.1 104.0 104.5 104.8 105.0 131.7 105.4 105.0 104.7 104.2 104.4 131.7Peak (kW)
Eq5221 - Condenser fan38.8 51.7 52.0 52.1 52.2 290.4 52.4 39.2 65.1 51.8 836.551.7 38.9Electric (kWh)
12.9 12.9 12.9 13.0 13.0 13.1 14.5 13.1 13.1 13.0 13.0 13.0 14.5Peak (kW)
Eq5001 - Cnst vol chill water pump (Misc Accessory Equipment)2.8 3.7 3.7 3.7 3.7 22.9 3.7 2.8 4.6 3.7 61.43.7 2.8Electric (kWh)
0.9 0.9 0.9 0.9 0.9 0.9 0.9 0.9 0.9 0.9 0.9 0.9 0.9Peak (kW)
Eq5011 - Cnst vol cnd water pump (Misc Accessory Equipment)24.2 32.3 32.3 32.3 32.3 201.7 32.3 24.2 40.3 32.3 540.632.3 24.2Electric (kWh)
8.1 8.1 8.1 8.1 8.1 8.1 8.1 8.1 8.1 8.1 8.1 8.1 8.1Peak (kW)
Eq5302 - Cntl panel & interlocks (Misc Accessory Equipment)0.3 0.4 0.4 0.4 0.4 2.5 0.4 0.3 0.5 0.4 6.70.4 0.3Electric (kWh)
0.1 0.1 0.1 0.1 0.1 0.1 0.1 0.1 0.1 0.1 0.1 0.1 0.1Peak (kW)
Chiller 5 (Cooling Equipment)Electric 0.0 0.0 0.0 0.0 0.0 0.0 113.9 0.0 0.0 0.0 0.0 0.0 113.9Peak (kW)Eq5221 - Condenser fanElectric 0.0 0.0 0.0 0.0 0.0 0.0 12.4 0.0 0.0 0.0 0.0 0.0 12.4Peak (kW)Eq5001 - Cnst vol chill water pump (Misc Accessory Equipment)Electric 0.0 0.0 0.0 0.0 0.0 0.0 0.9 0.0 0.0 0.0 0.0 0.0 0.9Peak (kW)Eq5011 - Cnst vol cnd water pump (Misc Accessory Equipment)Electric 0.0 0.0 0.0 0.0 0.0 0.0 8.1 0.0 0.0 0.0 0.0 0.0 8.1Peak (kW)
Project Name: TRACE® 700 v4.1 calculated at 08:15 PM on 03/28/2006Dataset Name: P:\becca's trace\DOAS full.TRC Alternative - 1 Equipment Energy Consumption report page 3 of 5
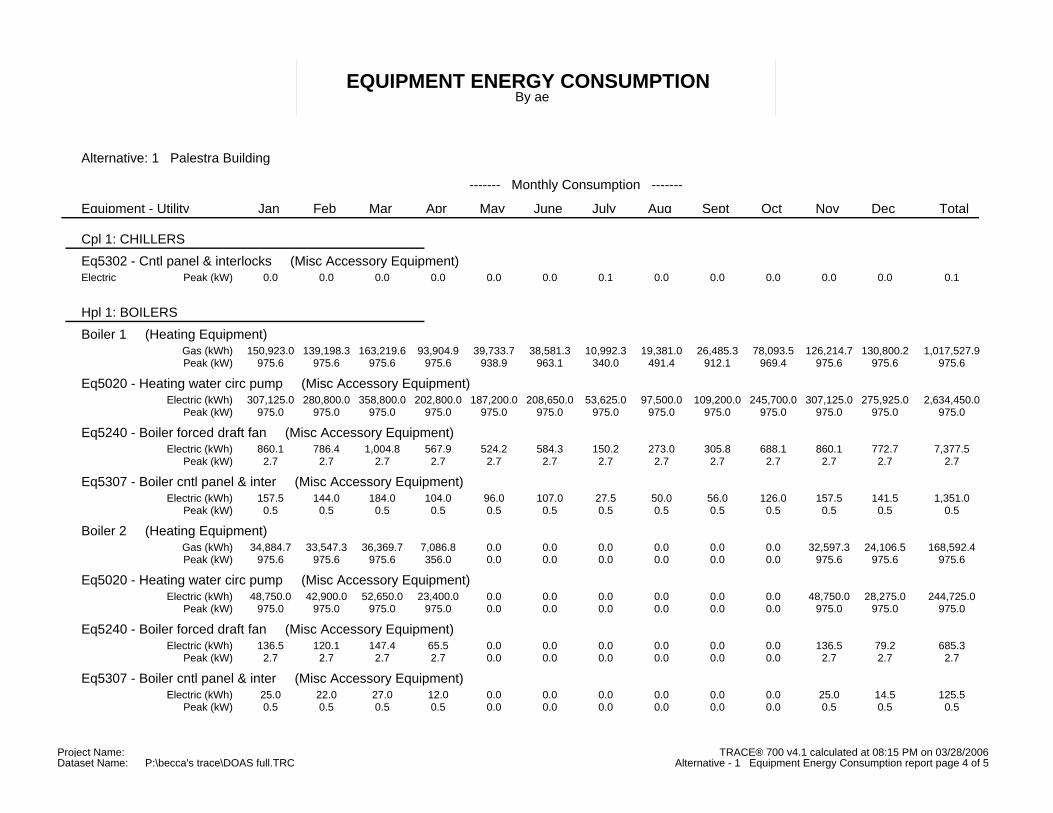
EQUIPMENT ENERGY CONSUMPTIONBy ae
Alternative: 1 Palestra Building
Jan Feb Mar Apr May June July Aug Sept Oct Nov Dec TotalEquipment - Utility
------- Monthly Consumption -------
Cpl 1: CHILLERSEq5302 - Cntl panel & interlocks (Misc Accessory Equipment)Electric 0.0 0.0 0.0 0.0 0.0 0.0 0.1 0.0 0.0 0.0 0.0 0.0 0.1Peak (kW)
Hpl 1: BOILERSBoiler 1 (Heating Equipment)
139,198.3 163,219.6 93,904.9 39,733.7 38,581.3 10,992.3 19,381.0 26,485.3 78,093.5 126,214.7 1,017,527.9150,923.0 130,800.2Gas (kWh)975.6 975.6 975.6 975.6 938.9 963.1 340.0 491.4 912.1 969.4 975.6 975.6 975.6Peak (kW)
Eq5020 - Heating water circ pump (Misc Accessory Equipment)280,800.0 358,800.0 202,800.0 187,200.0 208,650.0 53,625.0 97,500.0 109,200.0 245,700.0 307,125.0 2,634,450.0307,125.0 275,925.0Electric (kWh)
975.0 975.0 975.0 975.0 975.0 975.0 975.0 975.0 975.0 975.0 975.0 975.0 975.0Peak (kW)
Eq5240 - Boiler forced draft fan (Misc Accessory Equipment)786.4 1,004.8 567.9 524.2 584.3 150.2 273.0 305.8 688.1 860.1 7,377.5860.1 772.7Electric (kWh)
2.7 2.7 2.7 2.7 2.7 2.7 2.7 2.7 2.7 2.7 2.7 2.7 2.7Peak (kW)
Eq5307 - Boiler cntl panel & inter (Misc Accessory Equipment)144.0 184.0 104.0 96.0 107.0 27.5 50.0 56.0 126.0 157.5 1,351.0157.5 141.5Electric (kWh)
0.5 0.5 0.5 0.5 0.5 0.5 0.5 0.5 0.5 0.5 0.5 0.5 0.5Peak (kW)
Boiler 2 (Heating Equipment)33,547.3 36,369.7 7,086.8 0.0 0.0 0.0 0.0 0.0 0.0 32,597.3 168,592.434,884.7 24,106.5Gas (kWh)
975.6 975.6 975.6 356.0 0.0 0.0 0.0 0.0 0.0 0.0 975.6 975.6 975.6Peak (kW)
Eq5020 - Heating water circ pump (Misc Accessory Equipment)42,900.0 52,650.0 23,400.0 0.0 0.0 0.0 0.0 0.0 0.0 48,750.0 244,725.048,750.0 28,275.0Electric (kWh)
975.0 975.0 975.0 975.0 0.0 0.0 0.0 0.0 0.0 0.0 975.0 975.0 975.0Peak (kW)
Eq5240 - Boiler forced draft fan (Misc Accessory Equipment)120.1 147.4 65.5 0.0 0.0 0.0 0.0 0.0 0.0 136.5 685.3136.5 79.2Electric (kWh)
2.7 2.7 2.7 2.7 0.0 0.0 0.0 0.0 0.0 0.0 2.7 2.7 2.7Peak (kW)
Eq5307 - Boiler cntl panel & inter (Misc Accessory Equipment)22.0 27.0 12.0 0.0 0.0 0.0 0.0 0.0 0.0 25.0 125.525.0 14.5Electric (kWh)
0.5 0.5 0.5 0.5 0.0 0.0 0.0 0.0 0.0 0.0 0.5 0.5 0.5Peak (kW)
Project Name: TRACE® 700 v4.1 calculated at 08:15 PM on 03/28/2006Dataset Name: P:\becca's trace\DOAS full.TRC Alternative - 1 Equipment Energy Consumption report page 4 of 5

EQUIPMENT ENERGY CONSUMPTIONBy ae
Alternative: 1 Palestra Building
Jan Feb Mar Apr May June July Aug Sept Oct Nov Dec TotalEquipment - Utility
------- Monthly Consumption -------
Hpl 1: BOILERSBoiler 3 (Heating Equipment)
14,530.4 13,203.2 0.0 0.0 0.0 0.0 0.0 0.0 0.0 4,037.2 50,941.614,936.6 4,234.1Gas (kWh)975.6 975.6 502.7 0.0 0.0 0.0 0.0 0.0 0.0 0.0 975.6 586.3 975.6Peak (kW)
Eq5020 - Heating water circ pump (Misc Accessory Equipment)21,450.0 26,325.0 0.0 0.0 0.0 0.0 0.0 0.0 0.0 7,800.0 102,375.024,375.0 22,425.0Electric (kWh)
975.0 975.0 975.0 0.0 0.0 0.0 0.0 0.0 0.0 0.0 975.0 975.0 975.0Peak (kW)
Eq5240 - Boiler forced draft fan (Misc Accessory Equipment)60.1 73.7 0.0 0.0 0.0 0.0 0.0 0.0 0.0 21.8 286.768.3 62.8Electric (kWh)
2.7 2.7 2.7 0.0 0.0 0.0 0.0 0.0 0.0 0.0 2.7 2.7 2.7Peak (kW)
Eq5307 - Boiler cntl panel & inter (Misc Accessory Equipment)11.0 13.5 0.0 0.0 0.0 0.0 0.0 0.0 0.0 4.0 52.512.5 11.5Electric (kWh)
0.5 0.5 0.5 0.0 0.0 0.0 0.0 0.0 0.0 0.0 0.5 0.5 0.5Peak (kW)
Boiler 4 (Heating Equipment)219.3 0.0 0.0 0.0 0.0 0.0 0.0 0.0 0.0 950.5 5,072.23,902.4 0.0Gas (kWh)
975.6 73.1 0.0 0.0 0.0 0.0 0.0 0.0 0.0 0.0 237.6 0.0 975.6Peak (kW)
Eq5020 - Heating water circ pump (Misc Accessory Equipment)2,925.0 0.0 0.0 0.0 0.0 0.0 0.0 0.0 0.0 3,900.0 10,725.03,900.0 0.0Electric (kWh)
975.0 975.0 0.0 0.0 0.0 0.0 0.0 0.0 0.0 0.0 975.0 0.0 975.0Peak (kW)
Eq5240 - Boiler forced draft fan (Misc Accessory Equipment)8.2 0.0 0.0 0.0 0.0 0.0 0.0 0.0 0.0 10.9 30.010.9 0.0Electric (kWh)
2.7 2.7 0.0 0.0 0.0 0.0 0.0 0.0 0.0 0.0 2.7 0.0 2.7Peak (kW)
Eq5307 - Boiler cntl panel & inter (Misc Accessory Equipment)1.5 0.0 0.0 0.0 0.0 0.0 0.0 0.0 0.0 2.0 5.52.0 0.0Electric (kWh)
0.5 0.5 0.0 0.0 0.0 0.0 0.0 0.0 0.0 0.0 0.5 0.0 0.5Peak (kW)
Project Name: TRACE® 700 v4.1 calculated at 08:15 PM on 03/28/2006Dataset Name: P:\becca's trace\DOAS full.TRC Alternative - 1 Equipment Energy Consumption report page 5 of 5
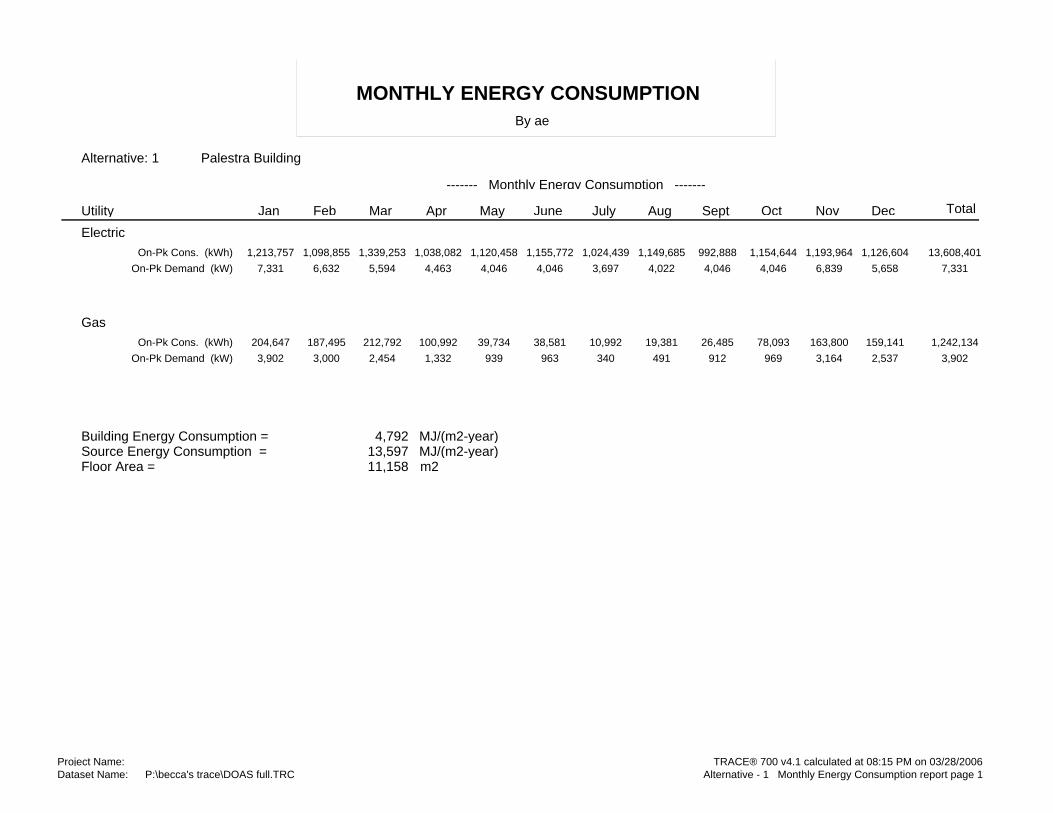
MONTHLY ENERGY CONSUMPTIONBy ae
Alternative: 1 Palestra Building
Jan Feb Mar Apr May June July Aug Sept Oct Nov Dec TotalUtility
------- Monthly Energy Consumption -------
Electric13,608,4011,126,6041,193,9641,154,644992,8881,149,6851,024,4391,155,7721,120,4581,038,0821,339,2531,098,8551,213,757On-Pk Cons. (kWh)
7,3315,6586,8394,0464,0464,0223,6974,0464,0464,4635,5946,6327,331On-Pk Demand (kW)
Gas1,242,134159,141163,80078,09326,48519,38110,99238,58139,734100,992212,792187,495204,647On-Pk Cons. (kWh)
3,9022,5373,1649699124913409639391,3322,4543,0003,902On-Pk Demand (kW)
Building Energy Consumption = Source Energy Consumption = Floor Area =
4,79213,597
m2
MJ/(m2-year)MJ/(m2-year)
11,158
Project Name: TRACE® 700 v4.1 calculated at 08:15 PM on 03/28/2006Dataset Name: P:\becca's trace\DOAS full.TRC Alternative - 1 Monthly Energy Consumption report page 1
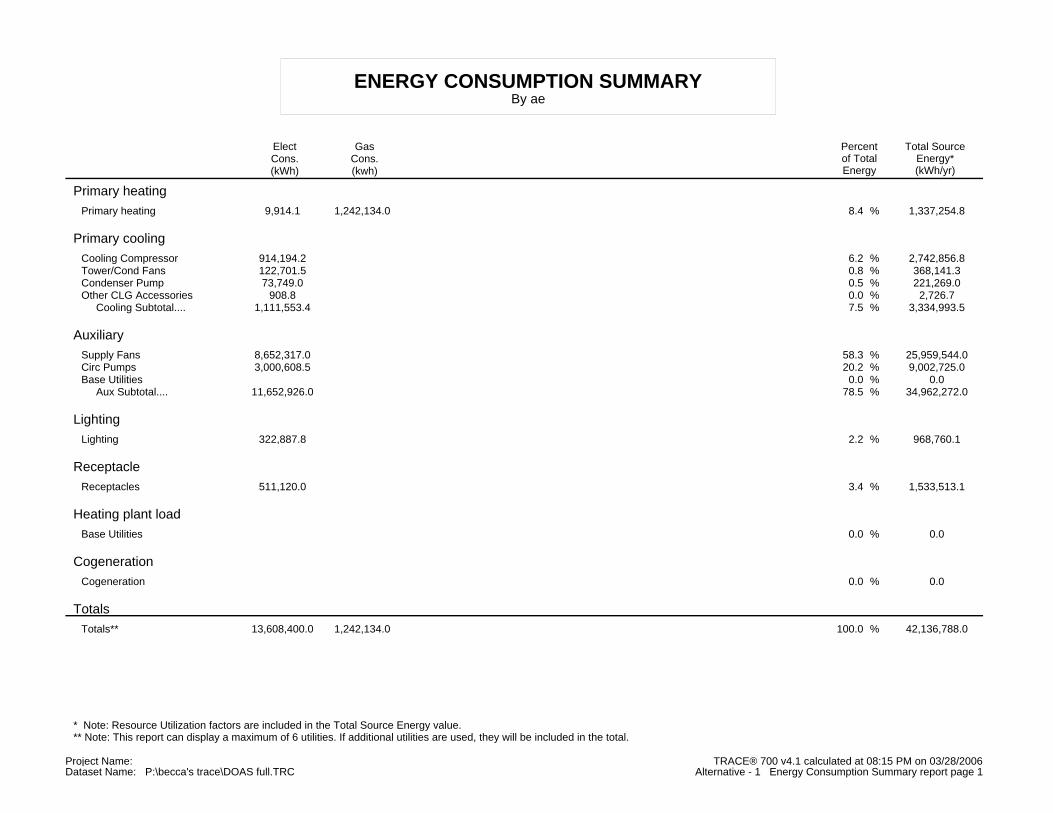
ENERGY CONSUMPTION SUMMARYBy ae
EnergyEnergy*of Total
Percent Total Source
(kWh/yr)
ElectCons.(kWh)
GasCons.(kwh)
Primary heatingPrimary heating 9,914.1 1,242,134.0 8.4 1,337,254.8%
Primary coolingCooling Compressor 914,194.2 6.2 2,742,856.8%Tower/Cond Fans 122,701.5 0.8 368,141.3%Condenser Pump 73,749.0 0.5 221,269.0%Other CLG Accessories 908.8 0.0 2,726.7% Cooling Subtotal.... 1,111,553.4 7.5 3,334,993.5%
AuxiliarySupply Fans 8,652,317.0 58.3 25,959,544.0%Circ Pumps 3,000,608.5 20.2 9,002,725.0%Base Utilities 0.0 0.0% Aux Subtotal.... 11,652,926.0 78.5 34,962,272.0%
LightingLighting 322,887.8 2.2 968,760.1%
ReceptacleReceptacles 511,120.0 3.4 1,533,513.1%
Heating plant loadBase Utilities 0.0 0.0%
CogenerationCogeneration 0.0 0.0%
TotalsTotals** 13,608,400.0 1,242,134.0 100.0 42,136,788.0%
Project Name: TRACE® 700 v4.1 calculated at 08:15 PM on 03/28/2006
* Note: Resource Utilization factors are included in the Total Source Energy value.** Note: This report can display a maximum of 6 utilities. If additional utilities are used, they will be included in the total.
Dataset Name: P:\becca's trace\DOAS full.TRC Alternative - 1 Energy Consumption Summary report page 1

MONTHLY UTILITY COSTSBy ae
Alternative: 1
Jan Feb Mar Apr May June July Aug Sept Oct Nov Dec TotalUtility------- Monthly Utility Costs -------
Electric1,126,02393,22198,78995,53982,16995,12984,77795,63292,71385,904110,79890,928100,425On-Pk Cons. ($)
1,207101101101101101101101101101101101101Off-Pk Cons. ($)
100,525 91,028 110,898 86,005 92,814 95,733 84,877 95,230 82,269 95,639 98,889 93,322 1,127,230Total ($):
Gas3,944505520248846235123126321676595650On-Pk Cons. ($)
101,175 91,623 111,574 86,326 92,940 95,855 84,912 95,291 82,353 95,887 99,410 93,827 1,131,174Monthly Total ($):
Project Name: TRACE® 700 v4.1 calculated at 08:15 PM on 03/28/2006Dataset Name: P:\becca's trace\DOAS full.TRC Monthly Utility Costs report Page 1 of 1

ELECTRICAL PEAK CHECKSUMSBy ae
Alternative: 1 Palestra Building
Equipment Description Electrical Demand Percent of Total(kw) (%)
Yearly Time of Peak: 9(Hr) 1(Month)
Cooling Equipment123.28 2.34Chiller 2
123.28Sub total 2.34
Heating Equipment978.23 18.56Boiler 1978.23 18.56Boiler 2978.23 18.56Boiler 3978.23 18.56Boiler 4
3,912.92Sub total 74.24
Fan Equipment1,225.63 23.25SUMMATION OF FAN ELECTRICAL DEMAND1,325.00 25.14SUMMATION OF FAN ELECTRICAL DEMAND400.00 7.59SUMMATION OF FAN ELECTRICAL DEMAND55.00 1.04SUMMATION OF FAN ELECTRICAL DEMAND55.00 1.04SUMMATION OF FAN ELECTRICAL DEMAND
3,060.63Sub total 58.06
Miscellaneous93.63 1.78Lights0.00 0.00Base Utilities
140.61 2.67Misc Equipment
234.24Sub total 4.45
Total 1397,331.07
Project Name: TRACE® 700 v4.1 calculated at 08:15 PM on 03/28/2006Dataset Name: P:\becca's trace\DOAS full.TRC Alternative - 1 Elect. Peak Checksums report page 1

By ae
YEARLY CASH FLOW
Alternative: 1Life Cycle Cost:
Year UtilityCost($)
Maint.Cost($)
InterestCost($)
PrincipalCost($)
PropertyTaxes
($)
InsuranceCost($)
RevenuePenalty
($)
Replace.Expenses
($)
Deprec.Tax($)
Cash FlowEffect
($)
PresentValue
($)
28,947,790.94
0 0 0 0 17,826,732 0 0 0 0 17,826,732 17,826,73201 1,131,174 306,000 0 0 0 0 0 891,337 971,472 844,75802 1,131,174 367,200 0 0 0 0 0 891,337 1,020,432 771,59303 1,131,174 440,640 0 0 0 0 0 891,337 1,079,184 709,58104 1,131,174 528,768 0 0 0 0 0 891,337 1,149,687 657,33705 1,131,174 634,522 0 0 0 0 0 891,337 1,234,289 613,66006 1,131,174 761,426 0 0 0 0 0 891,337 1,335,813 577,50907 1,131,174 913,711 0 0 0 0 0 891,337 1,457,641 547,98108 1,131,174 1,096,453 0 0 0 0 0 891,337 1,603,835 524,29609 1,131,174 1,315,744 0 0 0 0 0 891,337 1,779,267 505,7790
10 1,131,174 1,578,893 0 0 0 0 0 891,337 1,989,786 491,845011 1,131,174 1,894,671 0 0 0 0 0 891,337 2,242,409 481,991012 1,131,174 2,273,605 0 0 0 0 0 891,337 2,545,556 475,783013 1,131,174 2,728,326 0 0 0 0 0 891,337 2,909,333 472,848014 1,131,174 3,273,992 0 0 0 0 0 891,337 3,345,866 472,867015 1,131,174 3,928,790 0 0 0 0 0 891,337 3,869,704 475,565016 1,131,174 4,714,548 0 0 0 0 0 891,337 4,498,311 480,711017 1,131,174 5,657,457 0 0 0 0 0 891,337 5,252,638 488,106018 1,131,174 6,788,949 0 0 0 0 0 891,337 6,157,831 497,584019 1,131,174 8,146,739 0 0 0 0 0 891,337 7,244,063 509,006020 1,131,174 9,776,086 0 0 0 0 0 891,337 8,547,541 522,2570
Project Name: TRACE® 700 v4.1 calculated at 08:15 PM on 03/28/2006Dataset Name: P:\becca's trace\DOAS full.TRC Yearly Cash Flow report Page 1 of 1

TRACE® 700 Economic SummaryBy ae
London, EnglandBalckfriars Investment
Weather file Heathrow, England
UserCompany Penn State UniversityComments
- Palestra Building
Building OwnerLocation
Project InformationProject Name
Alternative 1 -
InstalledCost
First YearUtil.Cost
Final YearUtil. Cost
First YearMaint. Cost
Final YearMaint. Cost
Life CycleCost
AlternativeNumber
1,131,174.34 1,131,174.34 306,000.00 9,776,086.141 28,581,917.3617,436,428.00
Economic Summary
0K
20K
40K
60K
80K
100K
120K
Janu
aryFeb
ruary
March
April
May
June July
Augus
tSep
tembe
rOcto
ber
Novem
ber
Decem
ber
ElectricConsumptionGas
Monthly Utility Costs per Utility(1 alternative)
Project Name: TRACE® 700 v4.1 calculated at 03:15 PM on 04/01/2006File Name: P:\becca's trace\DOAS full.TRC Economics Summary Page 1 of 2

Equipment Energy Consumption by Alternative
(kWh/yr)
Total SourcePercentof Total Energy*Energy
GasCons.(kwh)
ElectCons.(kWh)
Alternative: 1 - Palestra BuildingPrimary heating 9,914.1 1,242,134.0 1,337,254.8%8.4Cooling Compressor 914,194.2 2,742,856.8%6.2Tower/Cond Fans 122,701.5 368,141.3%0.8Condenser Pump 73,749.0 221,269.0%0.5Other CLG Accessories 908.8 2,726.7%0.0Supply Fans 8,652,317.0 25,959,544.0%58.3Circ Pumps 3,000,608.5 9,002,725.0%20.2Lighting 322,887.8 968,760.1%2.2
Totals 13,608,400.0 1,242,134.0 %100.0 42,136,788.0
* Note: Resource Utilization factors are included in the Total Source Energy value.
Project Name: TRACE® 700 v4.1 calculated at 03:15 PM on 04/01/2006File Name: P:\becca's trace\DOAS full.TRC Economics Summary Page 2 of 2

Rebecca S. Allen
The Palestra Building London, England
1
DOAS and Gas Engine Driven Chiller Plant Energy Simulation

MONTHLY ENERGY CONSUMPTIONBy ae
Alternative: 1 Palestra Building
Jan Feb Mar Apr May June July Aug Sept Oct Nov Dec TotalUtility
------- Monthly Energy Consumption -------
Electric12,669,0171,048,0641,117,4771,077,373918,7401,070,529928,9841,080,9251,043,115961,8791,259,9271,027,3921,134,612On-Pk Cons. (kWh)
7,2255,5536,7343,9433,9463,9233,5923,9433,9434,3605,2506,5267,225On-Pk Demand (kW)
Gas2,770,855283,721284,854203,775148,989156,263177,088161,187165,275222,079337,815300,139329,670On-Pk Cons. (kWh)
4,0682,7053,3301,5221,0926717521,1431,1141,6752,9983,1664,068On-Pk Demand (kW)
Water19,0611,5161,4781,5851,6141,7922,0031,5641,6101,4861,5371,3671,508Cons. (kL)
Building Energy Consumption = Source Energy Consumption = Floor Area =
4,98213,207
m2
MJ/(m2-year)MJ/(m2-year)
11,158
Project Name: TRACE® 700 v4.1 calculated at 09:53 AM on 03/28/2006Dataset Name: P:\becca's trace\DOAS and Engine.TRC Alternative - 1 Monthly Energy Consumption report page 1

ENERGY CONSUMPTION SUMMARYBy ae
EnergyEnergy*of Total
Percent Total Source
(kWh/yr)
ElectCons.(kWh)
GasCons.(kwh)
WaterCons.(kL)
Primary heatingPrimary heating 9,914.1 1,242,134.0 8.1 1,337,254.8%
Primary coolingCooling Compressor 1,528,721.5 9.9 1,609,180.4%Tower/Cond Fans 122,329.8 19,060.7 0.8 367,026.2%Condenser Pump 27,837.3 0.2 83,520.2%Other CLG Accessories 14,124.0 0.1 42,376.1% Cooling Subtotal.... 164,291.1 1,528,721.5 19,060.7 11.0 2,102,103.0%
AuxiliarySupply Fans 8,652,317.0 56.0 25,959,544.0%Circ Pumps 3,008,486.0 19.5 9,026,360.0%Base Utilities 0.0 0.0% Aux Subtotal.... 11,660,803.0 75.5 34,985,904.0%
LightingLighting 322,887.8 2.1 968,760.1%
ReceptacleReceptacles 511,120.0 3.3 1,533,513.1%
Heating plant loadBase Utilities 0.0 0.0%
CogenerationCogeneration 0.0 0.0%
TotalsTotals** 12,669,016.0 2,770,855.5 19,060.7 100.0 40,927,536.0%
Project Name: TRACE® 700 v4.1 calculated at 09:53 AM on 03/28/2006
* Note: Resource Utilization factors are included in the Total Source Energy value.** Note: This report can display a maximum of 6 utilities. If additional utilities are used, they will be included in the total.
Dataset Name: P:\becca's trace\DOAS and Engine.TRC Alternative - 1 Energy Consumption Summary report page 1

MONTHLY UTILITY COSTSBy ae
Alternative: 1
Jan Feb Mar Apr May June July Aug Sept Oct Nov Dec TotalUtility------- Monthly Utility Costs -------
Electric1,048,37786,72992,46789,15276,04088,58676,88789,44686,32079,606104,24185,02193,883On-Pk Cons. ($)
1,207101101101101101101101101101101101101Off-Pk Cons. ($)
93,984 85,121 104,342 79,706 86,421 89,546 76,987 88,687 76,141 89,252 92,567 86,830 1,049,584Total ($):
Gas8,7999019056474734965625125257051,0739531,047On-Pk Cons. ($)
Water26,6302,1892,1722,2182,2302,3052,3942,2092,2282,1762,1972,1262,185On-Pk Cons. ($)
97,216 88,200 107,612 82,588 89,174 92,267 79,944 91,488 78,844 92,117 95,644 89,920 1,085,013Monthly Total ($):
Project Name: TRACE® 700 v4.1 calculated at 09:53 AM on 03/28/2006Dataset Name: P:\becca's trace\DOAS and Engine.TRC Monthly Utility Costs report Page 1 of 1
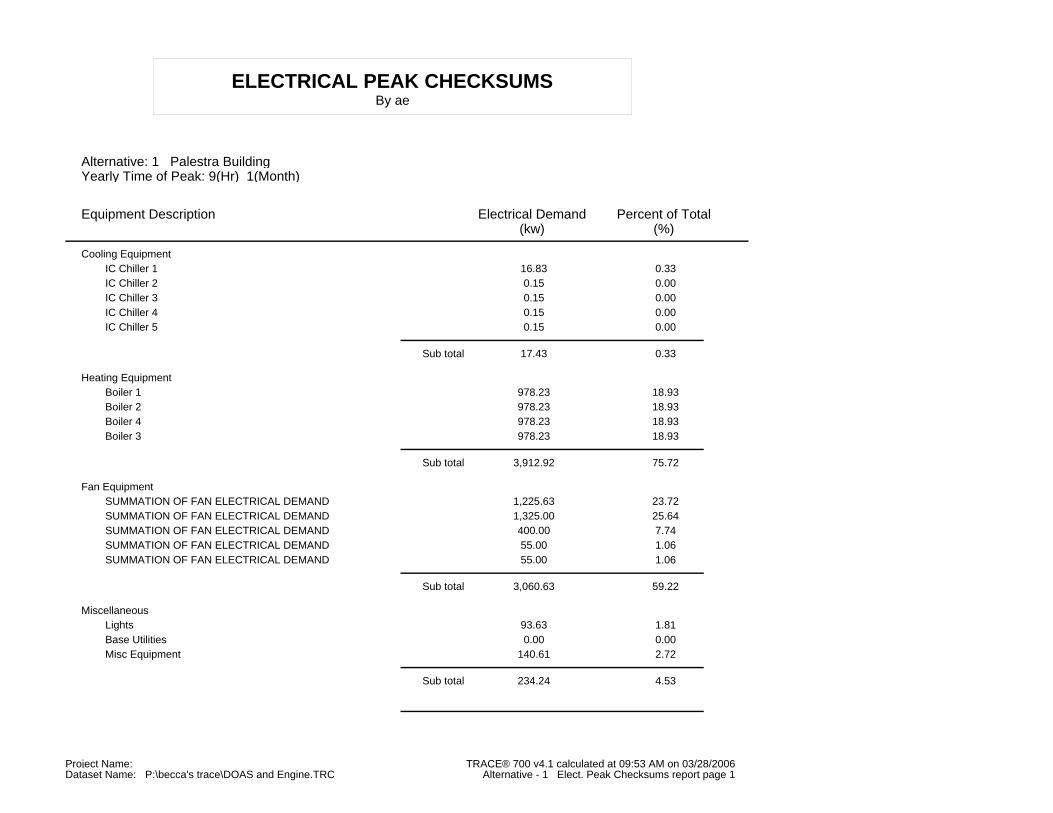
ELECTRICAL PEAK CHECKSUMSBy ae
Alternative: 1 Palestra Building
Equipment Description Electrical Demand Percent of Total(kw) (%)
Yearly Time of Peak: 9(Hr) 1(Month)
Cooling Equipment16.83 0.33IC Chiller 10.15 0.00IC Chiller 20.15 0.00IC Chiller 30.15 0.00IC Chiller 40.15 0.00IC Chiller 5
17.43Sub total 0.33
Heating Equipment978.23 18.93Boiler 1978.23 18.93Boiler 2978.23 18.93Boiler 4978.23 18.93Boiler 3
3,912.92Sub total 75.72
Fan Equipment1,225.63 23.72SUMMATION OF FAN ELECTRICAL DEMAND1,325.00 25.64SUMMATION OF FAN ELECTRICAL DEMAND400.00 7.74SUMMATION OF FAN ELECTRICAL DEMAND55.00 1.06SUMMATION OF FAN ELECTRICAL DEMAND55.00 1.06SUMMATION OF FAN ELECTRICAL DEMAND
3,060.63Sub total 59.22
Miscellaneous93.63 1.81Lights0.00 0.00Base Utilities
140.61 2.72Misc Equipment
234.24Sub total 4.53
Project Name: TRACE® 700 v4.1 calculated at 09:53 AM on 03/28/2006Dataset Name: P:\becca's trace\DOAS and Engine.TRC Alternative - 1 Elect. Peak Checksums report page 1

ELECTRICAL PEAK CHECKSUMSBy ae
Alternative: 1 Palestra Building
Equipment Description Electrical Demand Percent of Total(kw) (%)
Yearly Time of Peak: 9(Hr) 1(Month)
Total 1407,225.22
Project Name: TRACE® 700 v4.1 calculated at 09:53 AM on 03/28/2006Dataset Name: P:\becca's trace\DOAS and Engine.TRC Alternative - 1 Elect. Peak Checksums report page 2

By ae
YEARLY CASH FLOW
Alternative: 1Life Cycle Cost:
Year UtilityCost($)
Maint.Cost($)
InterestCost($)
PrincipalCost($)
PropertyTaxes
($)
InsuranceCost($)
RevenuePenalty
($)
Replace.Expenses
($)
Deprec.Tax($)
Cash FlowEffect
($)
PresentValue
($)
28,716,638.12
0 0 0 0 17,826,732 0 0 0 0 17,826,732 17,826,73201 1,085,013 306,000 0 0 0 0 0 891,337 934,543 812,64602 1,085,013 367,200 0 0 0 0 0 891,337 983,503 743,66903 1,085,013 440,640 0 0 0 0 0 891,337 1,042,255 685,30004 1,085,013 528,768 0 0 0 0 0 891,337 1,112,757 636,22305 1,085,013 634,522 0 0 0 0 0 891,337 1,197,360 595,30006 1,085,013 761,426 0 0 0 0 0 891,337 1,298,884 561,54307 1,085,013 913,711 0 0 0 0 0 891,337 1,420,712 534,09808 1,085,013 1,096,453 0 0 0 0 0 891,337 1,566,905 512,22409 1,085,013 1,315,744 0 0 0 0 0 891,337 1,742,338 495,2810
10 1,085,013 1,578,893 0 0 0 0 0 891,337 1,952,857 482,716011 1,085,013 1,894,671 0 0 0 0 0 891,337 2,205,480 474,053012 1,085,013 2,273,605 0 0 0 0 0 891,337 2,508,627 468,880013 1,085,013 2,728,326 0 0 0 0 0 891,337 2,872,404 466,846014 1,085,013 3,273,992 0 0 0 0 0 891,337 3,308,936 467,648015 1,085,013 3,928,790 0 0 0 0 0 891,337 3,832,775 471,027016 1,085,013 4,714,548 0 0 0 0 0 891,337 4,461,381 476,765017 1,085,013 5,657,457 0 0 0 0 0 891,337 5,215,709 484,674018 1,085,013 6,788,949 0 0 0 0 0 891,337 6,120,902 494,600019 1,085,013 8,146,739 0 0 0 0 0 891,337 7,207,134 506,412020 1,085,013 9,776,086 0 0 0 0 0 891,337 8,510,612 520,0010
Project Name: TRACE® 700 v4.1 calculated at 09:53 AM on 03/28/2006Dataset Name: P:\becca's trace\DOAS and Engine.TRC Yearly Cash Flow report Page 1 of 1

TRACE® 700 Economic SummaryBy ae
London, EnglandBalckfriars Investment
Weather file Heathrow, England
UserCompany Penn State UniversityComments
- Palestra Building
Building OwnerLocation
Project InformationProject Name
Alternative 1 -
InstalledCost
First YearUtil.Cost
Final YearUtil. Cost
First YearMaint. Cost
Final YearMaint. Cost
Life CycleCost
AlternativeNumber
1,085,012.70 1,085,012.70 306,000.00 9,776,086.141 28,618,857.2317,722,422.00
Economic Summary
0K
20K
40K
60K
80K
100K
120K
Janu
aryFeb
ruary
March
April
May
June July
Augus
tSep
tembe
rOcto
ber
Novem
ber
Decem
ber
ElectricConsumptionGasWater
Monthly Utility Costs per Utility(1 alternative)
Project Name: TRACE® 700 v4.1 calculated at 03:18 PM on 04/01/2006File Name: P:\becca's trace\DOAS and Engine.TRC Economics Summary Page 1 of 2

Equipment Energy Consumption by Alternative
(kWh/yr)
Total SourcePercentof Total Energy*Energy
WaterCons.(liters)
GasCons.(kwh)
ElectCons.(kWh)
Alternative: 1 - Palestra BuildingPrimary heating 9,914.1 1,242,134.0 1,337,254.8%8.1Cooling Compressor 1,528,721.5 1,609,180.4%9.9Tower/Cond Fans 122,329.8 19,060.7 367,026.2%0.8Condenser Pump 27,837.3 83,520.2%0.2Other CLG Accessories 14,124.0 42,376.1%0.1Supply Fans 8,652,317.0 25,959,544.0%56.0Circ Pumps 3,008,486.0 9,026,360.0%19.5Lighting 322,887.8 968,760.1%2.1
Totals 12,669,016.0 2,770,855.5 19,060.7 %100.0 40,927,536.0
* Note: Resource Utilization factors are included in the Total Source Energy value.
Project Name: TRACE® 700 v4.1 calculated at 03:18 PM on 04/01/2006File Name: P:\becca's trace\DOAS and Engine.TRC Economics Summary Page 2 of 2

Rebecca S. Allen
The Palestra Building London, England
1
APPENDIX E: Solar Energy Calculations

RETScreen® Solar Resource and System Load Calculation - Photovoltaic Project
Site Latitude and PV Array Orientation EstimateNearest location for weather data LondonLatitude of project location 51.5PV array tracking mode FixedSlope of PV array 30.0Azimuth of PV array 0.0
Monthly Inputs
Month
Monthly average
temperature
(°C)January 3.9
February 3.9March 6.1
April 7.8May 11.1
June 14.4July 16.7
August 16.7September 13.9
October 10.6November 6.7December 5.6
AnnualSolar radiation (horizontal) 0.90Solar radiation (tilted surface) 1.00Average temperature 9.8
Load Characteristics EstimateApplication type On-grid
Version 3.2 © Minister of Natural Resources Canada 1997 - 2005. NRCan/CETC - Varennes
Return to Energy Model sheet
--
Notes/Range
----
----
Notes/Range
-90.0 to 90.0
0.0 to 90.0
-
0.0 to 180.0
Monthlysolar
fraction
(%)-
See Weather Database
Monthly averagedaily radiation
in plane of PV array
(kWh/m²/d)
1.009.8
1.240.89
Season of use0.90
0.981.502.48
2.11
2.073.04
3.823.18
3.284.174.904.354.38
3.622.711.560.810.47
MWh/m²MWh/m²
°C
-
4.124.99
Monthly averagedaily radiationon horizontal
surface(kWh/m²/d)
0.561.10
°N
°°
-
1.00
1.001.00
1.001.001.001.001.001.00
Fraction ofmonthused
(0 - 1)1.001.001.00
3/29/2006; Palestra PV

RETScreen® Cost Analysis - Photovoltaic Project
Type of analysis: Pre-feasibility Currency: £ £ Cost references: NoneSecond currency: USA USD Rate: £/USD 1.47700
Initial Costs (Credits) Unit Quantity Unit Cost Amount Relative Costs Quantity Range Unit Cost RangeFeasibility Study
Other - Feasibility study Cost 0 10,000£ -£ - -Sub-total : -£ 0.0%
Development Other - Development Cost 0 15,000£ -£ - -
Sub-total : -£ 0.0%Engineering
Other - Engineering Cost 0 55,000£ -£ - -Sub-total : -£ 0.0%
Energy EquipmentPV module(s) kWp 24.80 5,750£ 142,600£ - -Transportation project 0 -£ -£ - -Other - Energy equipment Cost 0 -£ -£ - -Credit - Energy equipment Credit 0 -£ -£ - -
Sub-total : 142,600£ 50.0%Balance of Equipment
Module support structure m2 195.3 100£ 19,528£ - -Inverter kW AC 72.0 1,000£ 72,000£ - -Other electrical equipment kWp 24.80 -£ -£ - -System installation kWp 24.80 1,500£ 37,200£ - -Transportation project 0 -£ -£ - -Other - Balance of equipment Cost 0 -£ -£ - -Credit - Balance of equipment Credit 0 -£ -£ - -
Sub-total : 128,728£ 45.1%Miscellaneous
Training p-h 6 65£ 390£ - -Contingencies % 5% 271,718£ 13,586£ - -
Sub-total : 13,976£ 4.9%Initial Costs - Total 285,303£ 100.0%
Annual Costs (Credits) Unit Quantity Unit Cost Amount Relative Costs Quantity Range Unit Cost RangeO&M
Property taxes/Insurance project 0 -£ -£ - -O&M labour p-h 16 55£ 880£ - -Other - O&M Cost 0 -£ -£ - -Credit - O&M Credit 0 -£ -£ - -Contingencies % 0% 880£ -£ - -
Sub-total : 880£ 100.0%Annual Costs - Total 880£ 100.0%
Periodic Costs (Credits) Period Unit Cost Amount Interval Range Unit Cost RangeInverter Repair/Replacement Cost 12 yr 50,000£ 50,000£ - -
-£ -£ - --£ -£ - -
End of project life - -£ -£
Version 3.2 © Minister of Natural Resources Canada 1997 - 2005. NRCan/CETC - Varennes
Go to GHG Analysis sheet
3/29/2006; Palestra PV
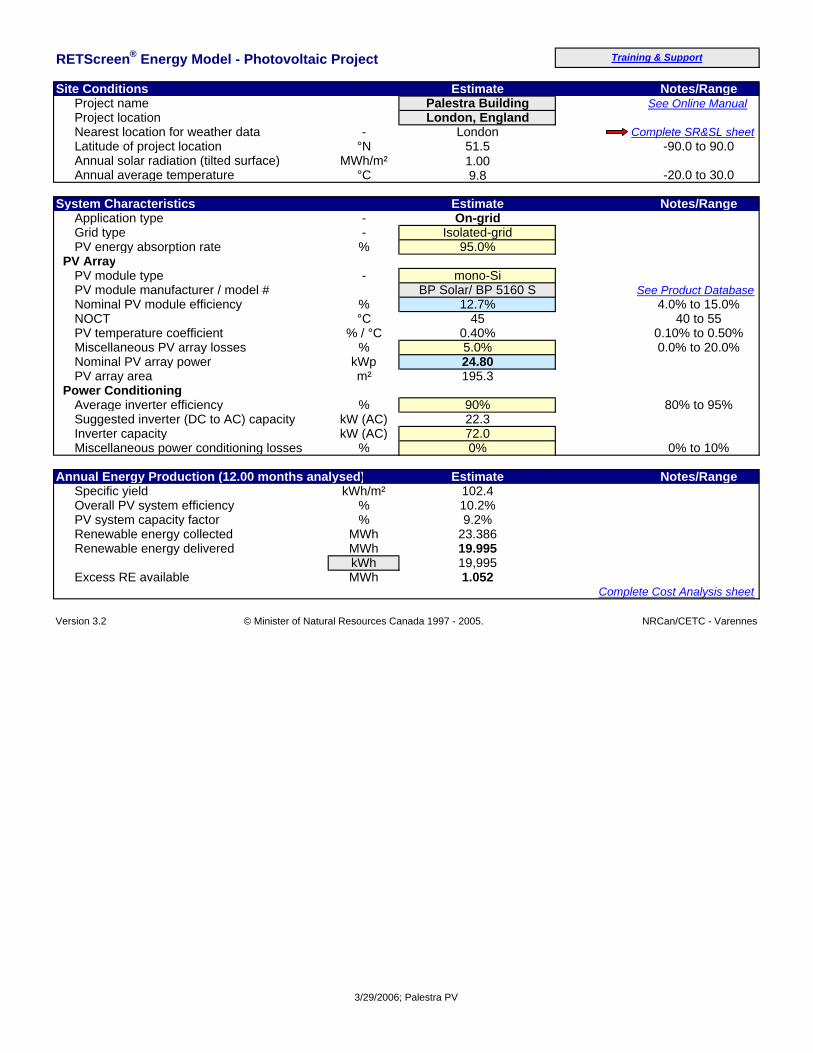
Site Conditions Estimate Notes/RangeProject name Palestra Building See Online ManualProject location London, EnglandNearest location for weather data - LondonLatitude of project location °N 51.5 -90.0 to 90.0Annual solar radiation (tilted surface) MWh/m² 1.00Annual average temperature °C 9.8 -20.0 to 30.0
System Characteristics Estimate Notes/RangeApplication type - On-gridGrid type - Isolated-gridPV energy absorption rate % 95.0%
PV ArrayPV module type - mono-SiPV module manufacturer / model # BP Solar/ BP 5160 S See Product DatabaseNominal PV module efficiency % 12.7% 4.0% to 15.0%NOCT °C 45 40 to 55PV temperature coefficient % / °C 0.40% 0.10% to 0.50%Miscellaneous PV array losses % 5.0% 0.0% to 20.0%Nominal PV array power kWp 24.80PV array area m² 195.3
Power ConditioningAverage inverter efficiency % 90% 80% to 95%Suggested inverter (DC to AC) capacity kW (AC) 22.3Inverter capacity kW (AC) 72.0Miscellaneous power conditioning losses % 0% 0% to 10%
Annual Energy Production (12.00 months analysed) Estimate Notes/RangeSpecific yield kWh/m² 102.4Overall PV system efficiency % 10.2%PV system capacity factor % 9.2%Renewable energy collected MWh 23.386Renewable energy delivered MWh 19.995
kWh 19,995Excess RE available MWh 1.052
Version 3.2 © Minister of Natural Resources Canada 1997 - 2005. NRCan/CETC - Varennes
Complete SR&SL sheet
Complete Cost Analysis sheet
RETScreen® Energy Model - Photovoltaic Project Training & Support
3/29/2006; Palestra PV

RETScreen® Financial Summary - Photovoltaic Project
Annual Energy Balance Yearly Cash FlowsProject name Palestra Building Genset capacity kW 7.5 Year Pre-tax After-tax CumulativeProject location London, England Nominal PV array power kWp 24.80 # £ £ £Energy from genset MWh 0.004 Equivalent pumping energy demand MWh 1.7 0 (114,121) (114,121) (114,121) Renewable energy delivered MWh 19.995 Net GHG reduction tCO2/yr 9.43 1 15,681 15,681 (98,440) Excess RE available MWh 1.052 Net GHG emission reduction - 10 yrs tCO2 94.26 2 16,865 16,865 (81,575) Firm RE capacity kW - Net GHG emission reduction - 25 yrs tCO2 235.66 3 18,100 18,100 (63,475) Application type On-grid Type of fuel displaced Propane 4 19,388 19,388 (44,087)
5 20,731 20,731 (23,357) Financial Parameters 6 22,132 22,132 (1,225)
7 23,593 23,593 22,368 Avoided cost of energy £/kWh 0.858 Debt ratio % 60.0% 8 25,119 25,119 47,487 RE production credit £/kWh 0.750 Debt interest rate % 8.5% 9 26,711 26,711 74,198 RE production credit duration yr 25 Debt term yr 25 10 28,372 28,372 102,570 RE credit escalation rate % 2.0% 11 30,107 30,107 132,677 GHG emission reduction credit £/tCO2 - Income tax analysis? yes/no No 12 (35,326) (35,326) 97,351 GHG reduction credit duration yr 10 Effective income tax rate % 35.0% 13 33,809 33,809 131,160 GHG credit escalation rate % 2.0% Loss carryforward? - Yes 14 35,785 35,785 166,945 Avoided cost of excess energy £/kWh - Depreciation method - Declining balance 15 37,848 37,848 204,792 Avoided cost of capacity £/kW-yr 120 Depreciation tax basis % 80.0% 16 40,003 40,003 244,795 Energy cost escalation rate % 5.0% Depreciation rate % 30.0% 17 42,254 42,254 287,049 Inflation % 2.5% Depreciation period yr 15 18 44,607 44,607 331,656 Discount rate % 9.0% Tax holiday available? yes/no No 19 47,065 47,065 378,721 Project life yr 25 Tax holiday duration yr 5 20 49,635 49,635 428,356
21 52,320 52,320 480,676 Project Costs and Savings 22 55,128 55,128 535,803
23 58,063 58,063 593,866 Initial Costs Annual Costs and Debt 24 (29,305) (29,305) 564,561
Feasibility study 0.0% £ - O&M £ 880 25 64,340 64,340 628,902 Development 0.0% £ - Fuel £ - 26 - - 628,902 Engineering 0.0% £ - Debt payments - 25 yrs £ 16,726 27 - - 628,902 Energy equipment 50.0% £ 142,600 Annual Costs and Debt - Total £ 17,606 28 - - 628,902 Balance of equipment 45.1% £ 128,728 29 - - 628,902 Miscellaneous 4.9% £ 13,976 Annual Savings or Income 30 - - 628,902
Initial Costs - Total 100.0% £ 285,303 Energy savings/income £ 17,156 31 - - 628,902 Capacity savings/income £ - 32 - - 628,902
Incentives/Grants £ - RE production credit income - 25 yr £ 14,996 33 - - 628,902 GHG reduction income - 10 yrs £ - 34 - - 628,902
Annual Savings - Total £ 32,152 35 - - 628,902 Periodic Costs (Credits) 36 - - 628,902 # Inverter Repair/Replacement £ 50,000 Schedule yr # 12,24 37 - - 628,902 # £ - Schedule yr # 0,0,0,0,0,0,0,0,0,0,0,0,0,0,0,0,0,0,0,0,0,0,0,0,0 38 - - 628,902 # £ - Schedule yr # 0,0,0,0,0,0,0,0,0,0,0,0,0,0,0,0,0,0,0,0,0,0,0,0,0 39 - - 628,902
End of project life - £ - Schedule yr # 25 40 - - 628,902 41 - - 628,902
Financial Feasibility 42 - - 628,902 Calculate energy production cost? yes/no No 43 - - 628,902
Pre-tax IRR and ROI % 18.3% Energy production cost £/kWh 17.33 44 - - 628,902 After-tax IRR and ROI % 18.3% Calculate GHG reduction cost? yes/no No 45 - - 628,902 Simple Payback yr 9.1 GHG emission reduction cost £/tCO2 Not calculated 46 - - 628,902 Year-to-positive cash flow yr 6.1 Project equity £ 114,121 47 - - 628,902 Net Present Value - NPV £ 125,778 Project debt £ 171,182 48 - - 628,902 Annual Life Cycle Savings £ 12,805 Debt payments £/yr 16,726 49 - - 628,902 Benefit-Cost (B-C) ratio - 2.10 Debt service coverage - 1.94 50 - - 628,902
Version 3.2 © Minister of Natural Resources Canada 1997 - 2005. NRCan/CETC - Varennes
3/29/2006; Palestra PV
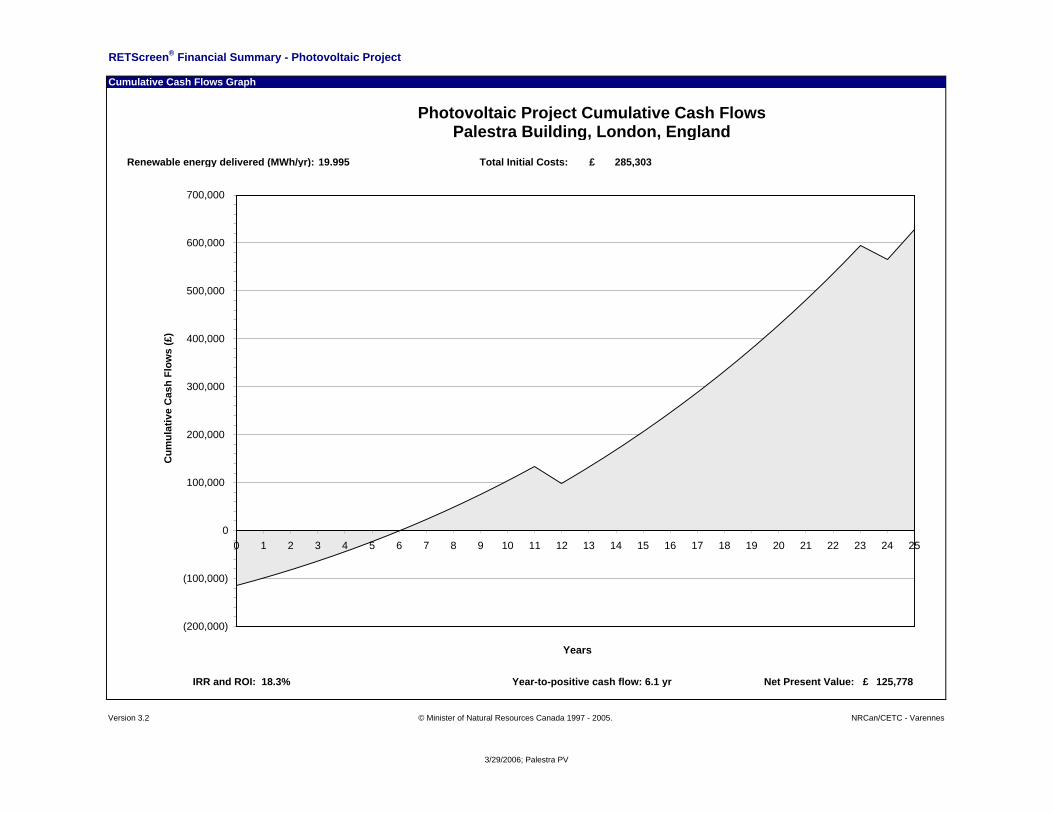
RETScreen® Financial Summary - Photovoltaic Project
Cumulative Cash Flows Graph
Photovoltaic Project Cumulative Cash FlowsPalestra Building, London, England
Renewable energy delivered (MWh/yr): 19.995 Total Initial Costs: £ 285,303 Net average GHG reduction (tCO2/yr): 9.43
IRR and ROI: 18.3% Year-to-positive cash flow: 6.1 yr Net Present Value: £ 125,778
Version 3.2 © Minister of Natural Resources Canada 1997 - 2005. NRCan/CETC - Varennes
Cum
ulat
ive
Cas
h Fl
ows
(£)
(200,000)
(100,000)
0
100,000
200,000
300,000
400,000
500,000
600,000
700,000
0 1 2 3 4 5 6 7 8 9 10 11 12 13 14 15 16 17 18 19 20 21 22 23 24 25
Years
3/29/2006; Palestra PV

Rebecca S. Allen
The Palestra Building London, England
Solar PV Panel Specifications
1

Rebecca S. Allen
The Palestra Building London, England
1
APPENDIX F: Wind Energy Data

Technical Information Pack
Rooftop Wind Energy SystemSWIFT
™

Document Number: Tech Info Pack – Rev. F5 Page 2 of 15
Contents
Contents ........................................................................................................................................ 1
Contents ........................................................................................................................................ 2
1. SWIFT Rooftop Wind Energy System™................................................................................. 3
1.1 Introduction .................................................................................................................... 3
1.2 Product Description ....................................................................................................... 3
2. Planning Policy ...................................................................................................................... 5
2.1 Policy and legislative context ....................................................................................... 5
2.2 Technology Overview.................................................................................................... 5
2.3 Visual impact .................................................................................................................. 5
2.4 Noise ................................................................................................................................ 6
2.5 Reflectivity and Reflection ............................................................................................ 6
2.6 Electromagnetic Interference ...................................................................................... 6
2.7 Bird Strike ......................................................................................................................... 7
2.8 Safety............................................................................................................................... 7
2.9 Versatility ......................................................................................................................... 8
3. Installation summary ............................................................................................................. 9
3.1 Flat Roof Installation ..................................................................................................... 11
3.2 Loadings ........................................................................................................................ 11
4. Electrical & electronic controller connections ................................................................ 12
5. Performance ....................................................................................................................... 13
6. Compliance ........................................................................................................................ 13
7. Technical Specification...................................................................................................... 15
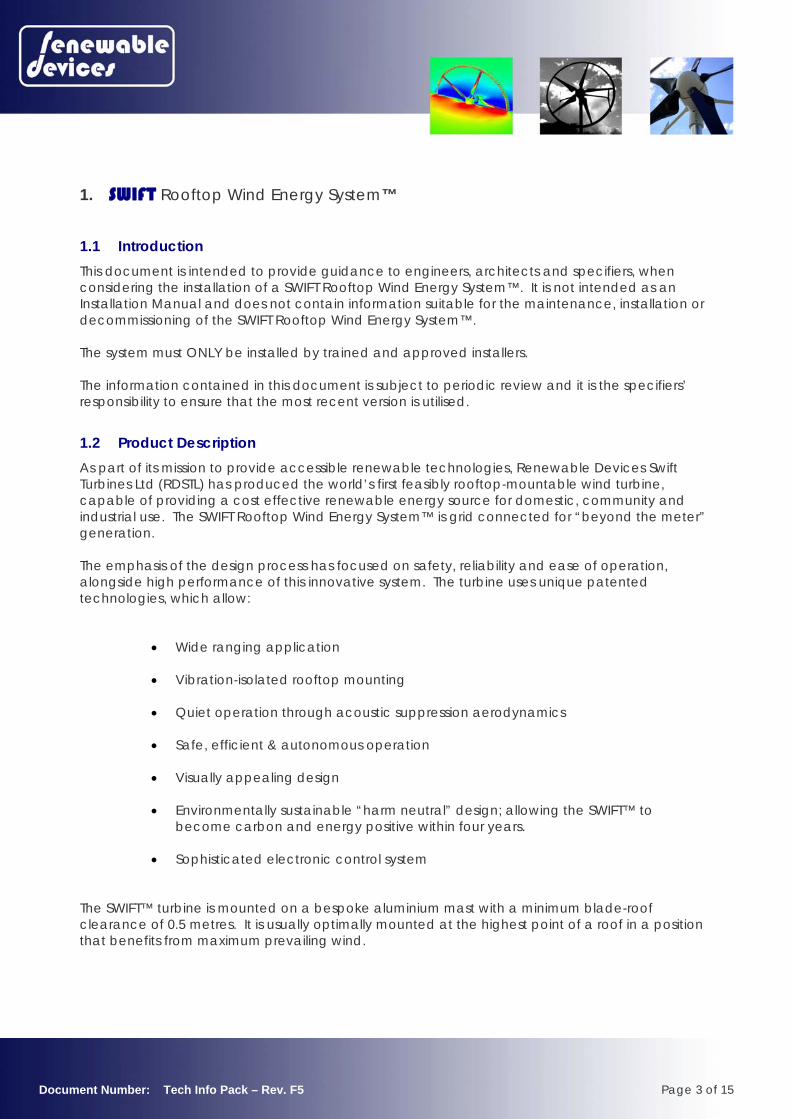
Document Number: Tech Info Pack – Rev. F5 Page 3 of 15
1. SWIFT Rooftop Wind Energy System™
1.1 Introduction This document is intended to provide guidance to engineers, architects and specifiers, when considering the installation of a SWIFT Rooftop Wind Energy System™. It is not intended as an Installation Manual and does not contain information suitable for the maintenance, installation or decommissioning of the SWIFT Rooftop Wind Energy System™. The system must ONLY be installed by trained and approved installers. The information contained in this document is subject to periodic review and it is the specifiers’ responsibility to ensure that the most recent version is utilised.
1.2 Product Description As part of its mission to provide accessible renewable technologies, Renewable Devices Swift Turbines Ltd (RDSTL) has produced the world’s first feasibly rooftop-mountable wind turbine, capable of providing a cost effective renewable energy source for domestic, community and industrial use. The SWIFT Rooftop Wind Energy System™ is grid connected for “beyond the meter” generation. The emphasis of the design process has focused on safety, reliability and ease of operation, alongside high performance of this innovative system. The turbine uses unique patented technologies, which allow:
• Wide ranging application • Vibration-isolated rooftop mounting
• Quiet operation through acoustic suppression aerodynamics
• Safe, efficient & autonomous operation
• Visually appealing design
• Environmentally sustainable “harm neutral” design; allowing the SWIFT™ to
become carbon and energy positive within four years.
• Sophisticated electronic control system The SWIFT™ turbine is mounted on a bespoke aluminium mast with a minimum blade-roof clearance of 0.5 metres. It is usually optimally mounted at the highest point of a roof in a position that benefits from maximum prevailing wind.

Document Number: Tech Info Pack – Rev. F5 Page 4 of 15
Figure 1 - Installed SWIFT Rooftop Wind Energy System™
To ensure minimal transmission of oscillations from turbine to building, the mounting brackets incorporate damping systems, designed to isolate at a wide range of frequencies. The patented ring diffuser around the rotor blades is designed to minimise turbine noise by preventing the creation of violent vortices at the blade tip. In addition the five-bladed design allows for a slower speed of rotation further reducing noise, making the SWIFT Rooftop Wind Energy System™ the quietest wind system currently available. The SWIFT™ turbine has a unique over-power regulation mechanism to control rotation speed and maintain system integrity/safety in high winds. This consists of an innovative twin-vane progressive mechanical furling mechanism, coupled with a sophisticated electronic control system. This allows the optimum amount of power to be extracted from the turbine under varying wind and loading conditions, representing a step change in the accurate and safe control of small wind turbines. In environmental terms, each unit of electricity generated from a SWIFT Rooftop Wind Energy System™ displaces one unit generated from fossil fuels, with the added benefit that the electricity is consumed on-site, thus negating losses from transmission. This can amount to a displacement of up to 1.4 tonnes of CO2
per year – a significant environmental contribution.

Document Number: Tech Info Pack – Rev. F5 Page 5 of 15
2. Planning Policy
2.1 Policy and legislative context
The Scottish Executive’s policy for renewable energy is described in PAN 45 and is set out in “NPPG6, Renewable Energy Developments”. UK policy encourages the uptake of widespread micro generation including rooftop wind turbines such as the SWIFT Rooftop Wind Energy System™ on domestic, educational and industrial premises. Indeed the Energy Minister Malcolm Wicks expressed his support during a speech at a Green Conference in his constituency in October 2005: “Imagine one day, every school with its own micro wind turbine and/or state of the art solar paneling. Imagine a clear display panel on such a school detailing how much carbon dioxide has been saved. Imagine how the science teacher, or those teaching citizenship responsibilities, could use such technology in their teaching…”
2.2 Technology Overview The need for increased use of renewable energy is well established. Opportunities to generate ‘bulk’ electricity from renewable resources are currently being exploited throughout Europe, including the development of wind, hydro and other technologies. It is recognised however, that in order to both meet objectives for CO2 reductions and decrease our dependency on fossil fuels, domestic and commercial application of renewable technologies must be increased. Small-scale wind turbines have the potential to contribute towards this, providing electricity or hot water heating in both domestic and commercial applications. The associated CO2 savings per turbine contribute to the UK’s CO2 emissions reduction targets and longer term cost savings per household or business can be significant. In addition wide deployment of turbines will lead to significant CO2 savings in the longer term and will increase levels of ‘embedded’ generation.
2.3 Visual impact Rooftop-mounted small wind turbines will be installed in a position to take advantage of higher wind speeds on the top of building structures (with the exception of ‘building integrated’ designs) and will be comparable in height to a large television aerial or chimney stack. The SWIFT™ has been designed to comply with planning requirements and to complement the aesthetics of a building. As with satellite dishes, rooftop wind turbines are now becoming more widely accepted with increasing familiarity. Applications should be assessed on a case-by-case basis, taking account of the existing building/structures, relative scale, nature of the setting and benefits of renewable energy generation. Computer generated photo montages of buildings with superimposed in-situ turbines can be used to assist the planning process. The colour and finish of the SWIFT Rooftop Wind Energy System™ is designed to minimise visual impact and reflection of light. Due to the fact that SWIFT™ turbines will be located on or near existing commercial/domestic buildings, they will not add a significant new visual element to the local landscape. Unlike large wind farm installations, a full landscape and visual impact assessment is not required. Free standing SWIFTs™ mounted on masts (as opposed to being building mounted) should also be assessed on a case-by-case basis, in accordance with guidance contained in the main planning annex on wind energy and any additional structural/engineering issues.

Document Number: Tech Info Pack – Rev. F5 Page 6 of 15
2.4 Noise The need to control noise emissions from a small-scale wind turbine is critical in domestic settings. In commercial/light industrial settings, where there are no residential properties in the immediate vicinity, the control of noise is important, but less critical. Detailed discussion of noise from wind turbines is contained in the main wind energy appendix to “PAN 45 (revised 2002): Renewable Energy Technologies”, and wider discussion of planning and noise can be found in PAN 56. In the absence of specific guidance on noise for small-scale wind turbines, they should meet the criteria identified by the DTI/ETSU report: ‘The Assessment and Rating of noise from wind farms.’1. As a general rule, noise emitted from the turbine should not exceed 5dB(a) above background noise, with a fixed limit of 43dB(A) recommended for night time. Both day and night time noise limits can be increased to 45dB(A) where the owner of the property benefits directly from the operation of the turbine. The SWIFT Rooftop Wind Energy System™ always emits less than 35dB(A,) across all wind speeds and therefore meets all legislative criteria. The SWIFT™ has been designed to comply with these regulations and there is no evidence to suggest that SWIFT Rooftop Wind Energy Systems™ have any detrimental effect on wildlife.
2.5 Reflectivity and Reflection To minimise the occurrence of ‘flash’ the SWIFT’s™ rotor is comprised of moulded carbon fibre, with a matt black surface. Matt is specifically chosen to avoid highlights or bright reflections from rotor surfaces during rotation, in either natural or artificial light. The black colour allows for minimal reflectivity (the ratio of the total amount of white light diffusely reflected by the surface to the amount falling on the surface) as it is extremely absorptive over a wide range of wavelengths. In addition, the small diameter and likely location of the turbine ensures that reflection and reflectivity are not considered to be issues for the SWIFT Rooftop Wind Energy System™.
2.6 Electromagnetic Interference
Aircraft, Military Low Flying, Aerodromes and technical sites:
Unlike large wind turbines and wind farms, small SWIFT™ rooftop wind turbines are extremely unlikely to cause any detrimental effects on aviation and associated radar/navigation systems. They have been successfully installed near major airports without any negative effects on aviation.
Television / radio reception:
The SWIFT Rooftop Wind Energy System™ meets all of the mandatory UK and EU Electro-Magnetic Compatibility (EMC) standards and does not affect television or radio reception.
Effect on mobile phone and telecommunications links:
The SWIFT Rooftop Wind Energy System™ meets all of the requisite UK and EU Electro-Magnetic Compatibility (EMC) standards and does not effect mobile phone reception or fixed radio/microwave communications links.
1 ETSU (1996) ‘The Assessment and Rating of noise from wind farms.’ DTI Noise Working Group, Energy Technology Support Unit.

Document Number: Tech Info Pack – Rev. F5 Page 7 of 15
Emission of electromagnetic radiation:
The SWIFT Rooftop Wind Energy System™ has been fully EMC tested for electro-magnetic compatibility and exceeds all of the relevant UK and European standards (BS EN 61000-6-3: 2001 EMC Emissions and BS EN 61000-6-1: 2001 EMC Immunity, both of which are relevant for residential, commercial and light industry).
2.7 Bird Strike The transparency of the SWIFT’s™ five rotating blades is much less than that of a window and this combined with the solid diffuser ensures that the turbine remains a clearly defined unit at all times. The small diameter of the SWIFT™ rotor (~2m) makes it comparable as an obstacle to a rooftop television aerial, satellite dish or chimney stack. It is extremely unlikely therefore, that the location of a rooftop turbine will cause a significant increase in bird strike, beyond the rates already caused by existing buildings, windows and other such obstacles. During a twelve month in situ testing program on a single storey structure, not a single bird collision was recorded, neither have any been reported from turbines installed throughout the UK to date. All accredited installers are advised to enquire as to the location of localised nesting areas and carry out subsequent installations with the minimum of disturbance, in line with regulations of the Wildlife and Countryside Act 1981 (WCA) and Countryside and Rights of Way Act 2000 (CROW Act - specifically in England and Wales). The sixteen species of bats in the United Kingdom are virtually all classified as rare, vulnerable or endangered and as such both bats and their roosts are also protected by the afore mentioned WCA 1981 and CROW Act 2000; the regulations of which SWIFT™ installations strictly adhere to. The RSPB views climate change as the most serious long-term threat to wildlife, both globally and in the UK. They subsequently support the deployment of wind turbines, both large and small, provided they are positioned sensitively with care and consideration shown for the local flora, fauna and wildlife.
2.8 Safety Structural safety: The SWIFT™ has been designed and independently tested to ensure compliance with all mandatory product standards of the IEC 61400 and in particular, BS EN 61400-2: 1995 "Wind turbine generator systems - safety requirements". The SWIFT Rooftop Wind Energy System™ is designed to withstand extremely high winds and will typically shut down or ‘furl out’ in high wind speeds to protect the turbine from damage. The SWIFT™ is designed (and has been independently verified) to meet and exceed all of the structural and safety constraints required by BS EN 61400-2 and all other UK safety standards for machines of this type. Electrical connections and/or an associated hot water system should be installed in accordance with appropriate building standards. Electro-magnetic compatibility: The SWIFT™ complies with BS EN 61000-6-3: 2001and BS EN 61000-6-1: 2001 for domestic, commercial & industrial premises (power quality) effects including flicker and harmonic distortion.

Document Number: Tech Info Pack – Rev. F5 Page 8 of 15
Electrical safety:The SWIFT Rooftop Wind Energy System™ meets all of the electrical safety criteria set out in EN 50178 and the 16th Edition of the UK Wiring Regulations. Grid monitoring: The SWIFT Rooftop Wind Energy System™ meets all of the grid-monitoring criteria set out in VDE 126, including Anti-Islanding Protection. G83 compliance The SWIFT Rooftop Wind Energy System™ has been independently verified to ensure that it meets the G83 standard for the grid-connection of small-scale generators. CE Marking The SWIFT™ Rooftop Wind Energy System™ meets all appropriate European Directive legislation and is certified as CE compliant.
2.9 Versatility The SWIFT Rooftop Wind Energy System™ can be installed safely and simply into almost any building design. Single or multiple installations are both equally possible, as are installations on both residential and commercial properties.
Figure 2 – SWIFT™ installations

Document Number: Tech Info Pack – Rev. F5 Page 9 of 15
3. Installation summary For information only, below are the steps required to achieve a safe and effective installation of the SWIFT Rooftop Wind Energy System™: The system must ONLY be installed by trained and approved installers.
• Transportation and receipt of SWIFT Rooftop Wind Energy System™.
• Preparation of walls and installation of mounting brackets.
• Installation of turbine mounting mast.
• Installation of electronic control system and grid-tie inverter.
• Installation of SWIFT™ turbine.
• Electrical connection of system.
• Testing.
• Commissioning.
• Completion of test certificates and commissioning documentation.
The SWIFT™ turbine is typically wall-mounted at the gable end of a building using the bespoke brackets supplied (figure 3). For information, the bracket spacing is as shown in figure 4, below.
Figure 3 - Correctly assembled & installed mast mounting brackets
The pitch of the holes required to mount there brackets to the wall or any reinforcing structure is 254.0mm.

Document Number: Tech Info Pack – Rev. F5 Page 10 of 15
Figure 4 - SWIFT™ wind turbine assembly showing bracket spacings
In some circumstances it may be necessary to mount the SWIFT™ wind turbine mounting mast onto the exterior, and through the overhanging eaves of a building. In this instance, sealing roof glands will be required. The mounting mast is located by sliding it up through these rubber glands.
Figure 5 - Typical installation of rubber roof gland seal.

Document Number: Tech Info Pack – Rev. F5 Page 11 of 15
3.1 Flat Roof Installation The SWIFT Rooftop Wind Energy System™ can also be installed on a flat roof. In this type of installation, the mounting mast described above is replaced with a bespoke mounting stand. The installation of this stand is site-specific and may require additional engineering work to be carried out in order to assess/ensure the structural suitability of the building. The most common type of flat roof installation uses a bespoke stand, as shown in Figure 6.
Figure 6 - A typical flat roof installation configuration
The height of the flat roof mounting mast will vary as some sites may have a parapet. The flat roof mounting mast will be between 1.5m and 3.5m in height (from the base plate to the turbine hub height) and will typically be 2.0m. For reference, the approximate mass of the SWIFT™ turbine components are as follows:
Mass of SWIFT™ turbine: 50 kg Mass of mounting mast: 40 kg
3.2 Loadings In all installation configurations, the wall mounting anchors or the flat roof stand will transmit the aerodynamic thrust from the rotor to the mounting structure. The amount of mechanical stress imposed on the anchors will depend on the height of the mounting mast – each installation is different. As a guide, when designing the mounting structure, the stress at the anchor points should be considered to be induced by an axial thrust (acting horizontally at the rotor hub height) of 7kN, plus the loads due to the mass of the turbine and mounting masts.

Document Number: Tech Info Pack – Rev. F5 Page 12 of 15
4. Electrical & electronic controller connections The SWIFT Rooftop Wind Energy System™ will be supplied with two electronic components: an electronic control system and a grid-tie inverter. The electronic control system provides sophisticated electronic control of the turbine and includes a manual brake to allow for safe access near the installation etc. The grid-tie inverter is used to synchronise the power output to that of the consumers’ electricity supply.
Figure 7 - Installed SWIFT™ Electronic Control System
Figure 8 - Electrical Schematic of a typical installation

Document Number: Tech Info Pack – Rev. F5 Page 13 of 15
5. Performance The power curve for the SWIFT Rooftop Wind Energy System™ is shown in figure 9, below.
Pow
er (W
)
Wind Speed (m/s) Figure 9 - SWIFT™ power curve
6. Compliance The SWIFT Rooftop Wind Energy System™ has been independently tested and certified to comply with the following standards and directives: EN 61400-2: 1996 This standard relates to the safety of wind turbine generator systems and is applied as the SWIFT Rooftop Wind Energy System™ has a swept rotor area of less than 40m2 and generates at a voltage below 1,000 V, a.c. or 1,500 V, d.c. Mechanical components are designed and specified to meet this standard. Apart from EMC, described below, the specific electrical standard applied to satisfy EN 61400-2 is EN 60950. EN 61400-24: 1996 Lightening protection of wind turbines. EN 60950: 2000 The SWIFT™ turbine operates at safety extra low voltage (SELV), below the threshold voltage at which the low-voltage directive is normally applicable. However, EN 60950 is applied as a standard for safety aspects other than the risk of electric shock. These include flammability of component parts, temperature rise of user-accessible components, labelling and accompanying documents.

Document Number: Tech Info Pack – Rev. F5 Page 14 of 15
BS 5760-0:1986 Although BS 7671 deals with electrical installations, component parts of the SWIFT Rooftop Wind Energy System™ are designed to facilitate its installation in accordance with this standard. BS EN 61000-3-2 and BS EN 61000-3-3 Electro-magnetic compatibility limits for harmonic distortion & voltage fluctuation. EN 50081-1 Electro-magnetic compatibility - domestic, commercial and light industrial premises. EN 50081-2 Electro-magnetic compatibility - industrial premises. EN 61000 Mains frequency (power quality) effects including flicker and harmonic distortion. VDE 126 For the safety of Grid Monitoring (Including Anti-Islanding Protection). IEE 16th Edition Wiring Regulations BS7671 For the safety of domestic electrical installations. Electricity Association, Engineering Recommendation G59 Electricity Association (since 1 October 2003 superseded by Energy Networks Association). Grid connection of embedded generators at <5MW and <20kV. Electricity Association, Engineering Recommendation G83/1 Electricity Association (since 1 October 2003 superseded by Energy Networks Association). Grid connection of embedded generators up to 16A per phase (supersedes G77). BS 5080-1: 1993 The structural fixings used to attach the SWIFT™ system to a concrete substrate are tested in compliance with BS 5080-1: 1993.

Document Number: Tech Info Pack – Rev. F5 Page 15 of 15
7. Technical Specification Rated power output: 1.5kW * 5-blade HAWT wind turbine Approx. annual power supplied: 2000-3000kWh ** Rotor diameter 2.12m (6.5 feet) 1.4 Tonnes of CO2 reduction/annum *** Product Life: 20 years Planning Compliant Design Mounting mast (BS1387, ISO65) Acoustic emission < 35dB(A) EMC directive compliant Moulded carbon-fibre rotor (fail safe) LVD directive complaint EMI suppression technology CE marked Embedded electrical connection Low maintenance Direct Water Heating Single or multiple installation Compact design Safety systems comply with International Standard IEC 1400-1 & BS EN 61400-2 Electricity Association Requirement G59, G77and G83 compliant BS 7671 :16th Edition of the IEE Wiring Regulations BS 5760-7: Reliability of Systems, Equipment and Components The SWIFT Rooftop Wind Energy System™ is mounted on a bespoke mast with a minimum blade-roof clearance of approximately 0.5 metres. It has a novel over-power regulation mechanism, which is totally passive and maintains its tip speed ratio across its entire operating envelope. The turbine has a novel twin-vane progressive furling mechanism which maintains the systems integrity and safety in high winds. It will operate automatically around the clock.
* Rated wind speed: 12.5m/s ** Dependant on siting of turbine *** Substituting end-user electricity with a single 1.5kW rooftop turbine at 30% utilization by CEDRL
RETScreen® International).
Renewable Devices Swift Turbines ltd Bush Estate Edinburgh EH26 0PH Tel: 44 (0) 131 535 3301 Fax: 44 (0) 131 535 3303
[email protected] www.renewabledevices.com Private Limited Company No. 231922


