Optimized Unsupervised Image Classification
Based on Neutrosophic Set Theory
A.
E.
Amin
Department of Computer Science
Mansoura University,
Mansoura 35516,
Egypt
Abstract: In this paper, a new technique is used to an
unsupervised learning image classification based on
integration between neutrosophic sets and optimization linear
programming. Neutrosophic sets are used to segment the
image into three main components namely objects (O), edges
(E), and Background (B). The neutrosophic image
components BEO ,, are corresponding to the
neutrosophic sets components FIT ,, . The components of
neutrosophic image valued in 1,0 are representing the
association intensities degree of pixel for each image
components. Netrosophic image components are contributed
to solving one of the important problems in image
classification known as "overlapping" within cluster. While,
the problem of overlapping between clusters is solved by using
optimization linear programming.
Key words: Neutrosophic set, image classification, linear
programming optimization
I. INTRODUCTION
Since several decades, the world is witnessing a remarkable
development in the science of computer vision. The
principle of computer vision is based on deal with the
images and methods of treatment. Hence the interest of
researchers in the computer vision with image processing,
which is concerned, in essence, on the methods and many
different algorithms. Among these algorithms are image
classification algorithms.
Classification is the field devoted to the study of methods
designed to categorize data into distinct classes. This
categorization can be divided to distinct labeling of the data
(supervised learning [1]), division of the data into classes
(unsupervised learning [2]), selection of the most
significant features of the data (feature selection [3]), or a
combination of more than one of these tasks [4].
Unsupervised image classification (UIC) starts by
partitioning the image data into groups (or clusters). The
classes in UIC are unknown, according to similarity
measure, groups of image data can be compared with
reference to data by an analyst [5]. UIC can be categorized
into two main groups namely Hierarchical [6] and
Partitional [7] algorithms.
In hierarchical clustering algorithms (HCA) a sequence of
clustering with each clustering being a partition of the data
set are showing as a tree [8]. HCA is characterized by two
advantages, first the number of classes does not need be
specified a priori and the others they are independent of the
initial condition. However, HCA is suffers from be a static
algorithm and its inability to solve the overlapping clusters
problem [9]. HCA are divided according to the clusters
construction methods or according to the similarity
measure. For methods construct the clusters by recursively
partitioning the instances in either a top-down or bottom-up
fashion. These methods can be subdivided as
agglomerative [10] and divisive [11] methods. Whereas,
the merging or division of clusters is performed according
to some similarity measure, chosen so as to optimize some
criterion (such as a sum of squares). The hierarchical
clustering methods could be further divided according to
the manner that the similarity measure is calculated [12].
On the other hand, partitional clustering algorithms (PCA)
are based on image data set segmentation into a specified
number of clusters. PCA can be treated as an optimization
problem as a result of reliance on the square error function
to minimize certain criteria. Both HCA and PCA
algorithms are participate in advantages and drawbacks.
There are two categories from PCA namely Iterative [13]
and non-iterative [14] algorithms. K-means algorithm [15]
is the most widely used in iterative partitional algorithms.
The basic idea for k-means algorithm is to find a clustering
structure that minimizes a certain error criterion which
measures the distance of each instance to its representative
value. The most well-known criterion is the Sum of
Squared Error (SSE) [16], may be globally optimized by
exhaustively enumerating all partitions, which is very time-
consuming, or by giving an approximate solution using
heuristics. Another partitioning algorithm, which attempts
to minimize the SSE is the K-medoids [17] or partition
around medoids (PAM) [18].
Lillesand and Kiefer [19] presented a non-iterative
approach to unsupervised clustering with a strong
dependence on the image texture. Researches [20-21] have
shown that the iterative algorithms are more efficient than
its counterpart non-iterative, where it does not rely too
much on data points order.
There are other unsupervised classifications methods are
used recently represented in Density-based Methods [22]
which assume that the points that belong to each cluster are
drawn from a specific probability distribution. Model-
based Clustering Methods [23], these methods attempt to
optimize the fit between the given data and some
mathematical models. Unlike conventional clustering,
which identifies groups of objects; model-based clustering
International Journal of Engineering Research & Technology (IJERT)
IJERT
IJERT
ISSN: 2278-0181
www.ijert.orgIJERTV3IS120519
(This work is licensed under a Creative Commons Attribution 4.0 International License.)
Vol. 3 Issue12, December-2014
513
methods also find characteristic descriptions for each
group, where each group represents a concept or class. The
most frequently used induction methods are decision trees
[24] and neural networks [25]. Grid-based Methods [26],
these methods partition the space into a finite number of
cells that form a grid structure on which all of the
operations for clustering are performed. The main
advantage of the approach is its fast processing time [27].
Soft-computing Methods, In addition to neural networks,
there are some methods that belong to soft computing
methods such as Fuzzy Clustering [28], Evolutionary
Approaches for Clustering [29] and Simulated Annealing
for Clustering [30].
In this paper, a new an unsupervised image classification
technique is used based on neutrosophic sets [31] and
optimization linear programming [32]. Neutrosophic set
SN s considered a part from neutrosophy theory which
interested by studies the origin, nature and scope of
neutralities, as well as their interactions with different
ideational spectra. The idea of neutrosophy theory depends
on event or entity, where between an idea A and its
opposite AAnti , there is a continuum power
spectrum of neutralities ANeut . Truth value (T),
indeterminacy value (I) and falsehood value (F) are
represented neutrosophic components referring to
neutrosophy, neutrosophic logic, neutrosophic set,
neutrosophic probability, neutrosophic statistics [33]. In
neutrosophic set, the indeterminacy is quantified explicitly
and the truth-membership, indeterminacy-membership and
falsity-membership are independent. The neutrosophic set
is a generalization of an intuitionistic set [34], classical set
[35], fuzzy set [36], paraconsistent set [37], dialetheist set
[38], paradoxist set [39], and tautological set [40].
Linear programming is constrained optimization, where the
constraints and the objective function are all linear. It is
called "programming" because the goal of the calculations
help you choose a "program" of action [41]. The linear
programming model, for neutrosophic image classification
problem, involves on two main parts called constraints and
objective function. Constraints are describing the query
images as lower and upper weights for neutrosophic query
image components. On neutrosophic image clustering
classification to be maximized a linear objective function
means that categorization of similar images in clusters with
out overlapping within or between clusters.
The rest of the paper is organized as follows: section 2
presents general framework for proposed technique.
neutrosophic image processing is given in section 3. feature
extraction for neutrosophic image is presented in section 4.
Neutrosophic image cluster is illustrates in section 5.
Section 6 illustrates accuracy evaluation for the technique.
Section 7 presents experimental results to illustrate the
efficiency of the algorithm. Section 8 concludes the paper,
and outlines future research.
II. GENERAL FRAMEWORK
This paper presents a novel system to image clustering
namely Optimization neutrosophic image classification
system (ONsICS). As shown in figure 1, ONsICS consists
of two techniques are neutrosophic image processing and
optimization image clustering. Neutrosophic image
processing is used to convert gray image to enhanced
binary image (EBI) based on object, edge and background
of image components. Each image can be represented as
neutrosophic components (T, I, F) and stored the extracted
image components feature as a vector in database. All
similar image features are gathered together in a one
category by using neutrosophic image clustering (NsIC)
technique. Image clusters are optimized by using linear
programming to solve image overlapping problem as
shown in figure 1.
III. NEUTROSOPHIC IMAGE PROCESSING:
Let imgI be a Universe of discourse represents image and compI is a
set of imgI represents image components (as object, edge,
background) which is composed by bright pixels. Aim of
the neutrosophic image domain DNS is transferring
image imgI to neutrosophic domain by describing the pixel
by three membership sets FandIT , as
),,( FITPNs [43]. The pixel can represents as:
,,,,,,, wherejiFjiIjiTjiPNs
jiT , is the probability belonging to white pixels set. It is
defined as:
minmax
min,,
gg
gjigjiT
2
2
2
2
,1
,
wi
wim
wj
wjn
nmgww
jig
Where, jig , is the local mean value of pixels of the
window.
jiI , is indeterminate set. It is defined as:
minmax
min,,
jijiI
jigjigabsji ,,,
Where, ji, is the absolute value of difference between
intensity jig , and its local mean value jig , .
jiF , is non white pixels set. It is defined as:
jiTjiF ,1,
International Journal of Engineering Research & Technology (IJERT)
IJERT
IJERT
ISSN: 2278-0181
www.ijert.orgIJERTV3IS120519
(This work is licensed under a Creative Commons Attribution 4.0 International License.)
Vol. 3 Issue12, December-2014
514

A. Neutrosophic Image Entropy:
Neutrosophic image entropy [44] is defined as the
summation of the entropies of three sets FandIT ,, ,
which is employed to evaluate the distribution of the
elements in the neutrosophic domain:
FITNs EnEnEnEn
T
Ti
TTT ipipEnmax
min
ln
Fig. 1: Optimization image clustering flowchart.
I
Ii
III ipipEnmax
min
ln
F
Fi
FFF ipipEnmax
min
ln
where FIT EnandEnEn ,, are the entropies of the sets T
, I and F , respectively. ipandipip FIT ,, are the
probabilities of elements in T , I and F, respectively, whose
values equal to i .
IV. NEUTROSOPHIC IMAGE FEATURE
EXTRACTION:
Image feature Extraction is the first step to image retrieval
system. Neutrosophic image ImSN is divided into three
matrices are represented as images called object, edge and
background. Each image is consisting of matrix
representing the probability white pixel values for object
component and probability of non white pixel values for
background component while the intermediate matrix
expresses the probability of the boundary between the
white and non-white pixels. The combinations of pixel
brightness value in ImSN components are calculated by
using a widely method namely Gray Level Co-occurrence
Matrix (GLCM) []. The spatially related in various
directions with reference to distance and angular
relationships for co-occurring pairs of pixels is one of the
most important advantages for GLCM calculations.
International Journal of Engineering Research & Technology (IJERT)
IJERT
IJERT
ISSN: 2278-0181
www.ijert.orgIJERTV3IS120519
(This work is licensed under a Creative Commons Attribution 4.0 International License.)
Vol. 3 Issue12, December-2014
515

The feature extraction for ImSN components by GLCM
is based on pixel and its next neighbor pixel. The Contrast,
Energy, Homogeneity and Correlation are the parameters
of GLCM which calculated by:
entionsimageisnm
njmi
wherejiIjiContrastm
i
n
j
comp
dim),(
0,0
,,1 1
2
m
i
n
j
comp jiIEnergy1 1
2,
m
i
n
j
comp
ji
jiIyHomogeneit
1 1 1
,
.tan,
.,
,,
1 1
matrixyprobabilitofdeviationsdardsare
matrixyprobabilitofmeanare
wherejiIji
nCorrelatio
yx
yx
m
i
n
j yx
yxcomp
V. NEUTROSOPHIC IMAGE CLUSTERING:
Image clustering can classify similar images into the same
group. Let image data set be niI i
comp ,...,2,1,Im ,
and i
compI be an image in a d-dimensional space. Image
clustering problem is to find image
category nimimimim ClClClCl ,...,,
21 , which satisfies:
jimjiforClCl
miforCl
Cl
ji
i
i
imim
im
m
i
im
,,...,2,1,
,...,2,1
Im1
Among clustering methods, the fuzzy c-means algorithm is
widely used. An objective function for a clustering method
is important to define. The objective function of fuzzy c-
means is defined as:
n
k
c
k
ik
m
ikm exEUJ1 1
2,
Where m is constant, and 1m . Cluster i is expressed
as ciei ,...,2,1 . The membership between sample k
and cluster is expressed as;
nk
ciik
,...,2,1
,,...,2,1 , where,
c
i
ikik kki1
,1;,,1,0
can be computed by:
c
j
m
jk
ik
ik
ex
exc
c
1
1
1
where ie is the cluster center and can be computed by:
ci
x
en
k
m
ik
n
k
k
m
ik
i
1,
1
1
The mean and the variance of ik for the cluster are
computed as:
i
n
k
iik
i
i
n
k
ik
inn
ii
1
2
21 ,
Where, the fuzzy partition matrix
is iiniii ,...,, 21 .
As shown in figure 2, ImSN clustering method based on
fuzzy c-means is used.
A. Neutrosophic image clusters enhancement:
The indeterminacy of image pixel jiIcomp , is
determined by its intensity value jiI , . Strength of the
correlation between neutosophic image components T and
F with I are influenced by the distribution of the pixels and
the entorpy of I.
The set 1,0Im I may represent not only indeterminacy
but also vagueness, uncertainty, imprecision, error, etc. So,
the overlapping problem will appear within and between
neutrosophic image cluster as shown in figure 3.
Threshold processing will solve the overlapping problem
within and between neutrosophic image clusters by
determine the mysterious region between background and
objects. In gray level domain, mean operation for
image GLIm is defined as:
2
2
2
2
mod ,Im1
,Im
wi
wim
wj
wjn
GLGL nmww
ji
Where w is the size of the window, nm, is the location
of the pixel centered the window. A mean operation
for
NsNs PP , is defined as:
International Journal of Engineering Research & Technology (IJERT)
IJERT
IJERT
ISSN: 2278-0181
www.ijert.orgIJERTV3IS120519
(This work is licensed under a Creative Commons Attribution 4.0 International License.)
Vol. 3 Issue12, December-2014
516

2
2
2
2
,1
,
,,
wi
wim
wj
wjn
Ns
nmTww
jiT
IT
ITT
FITPP
2
2
2
2
,1
,
wi
wim
wj
wjn
nmFww
jiF
IF
IFF
Fig. 2: flowchart of neutrosophic image clustering.
International Journal of Engineering Research & Technology (IJERT)
IJERT
IJERT
ISSN: 2278-0181
www.ijert.orgIJERTV3IS120519
(This work is licensed under a Creative Commons Attribution 4.0 International License.)
Vol. 3 Issue12, December-2014
517

Fig. 3: Overlapping within and between neutrosophic image cluster.
minmax
min,1,
HH
HjiHjiI
Where jiH , is the homogeneity value of T at (i, j) .
w is the local window size.
After mean operation subset T became more
homogeneous after removing the noise. By using a simple
threshold method can be segnent the subset T accurately.
B. Optimization neutrosophic image clustering:
Optimization ImSN Classification (ONsIC) method
presents a new method to determine the best category to
include the query images, where the characteristics of
clusters are represented by neutrosophic sets. Suppose that
a set of clusters mClClClCl ,...,, 21 which consists
of m neutronsophic image clusters (NsIC) from which the
most preferred cluster is to be selected to including the
query image. Each NsIC is assessed on n different
components as comp
n
compcomp imimim ,...,, 21 . The
evaluation of the cluster iCl with respect to the component
of comp
jim is a neutrosophic set. The neutrosophic
index ijI is such that the larger ijI the higher a hesitation
margin of NsIC iCl with respect to the components of
comp
jim whose intensity is given by ijT . The NsIC matrix is
given in the following form:
ICNS
1
compI 2
compI n
compI
1Cl 111111 ,, FIT 121212 ,, FIT nnn FIT 111 ,,
2Cl 212121 ,, FIT 222222 ,, FIT nnn FIT 222 ,,
mCl 111 ,, mmm FIT 222 ,, mmm FIT mnmnmn FIT ,,
Where the characteristics of NsIC iCl are given by:
miwhereFIT
I
FIT
I
FIT
ICl
ininin
comp
iii
comp
iii
comp
i
1,,,,
,....,,,
,,,
3
222
2
111
1
)( iS ClICN can present by another form as:
whereKKClKKClKKClCl u
in
l
inn
u
i
l
i
u
i
l
ii ,,,,...,,,,,, 222111
u
ij
l
ij KK , is closed NsIC interval computed by:
2
1,
2max,
2
1,
2min,
ijijijijijijijiju
ij
l
ij
IFITIFITKK
Obviously, 20 u
ij
l
ij KK for all ClCli and
imim comp
j . The degrees to the alternative
NsIC iCl satisfies and does not satisfy the can be measured
by the evaluation function (E). The evaluation function
iClE of alternative NsIC iCl can be expressed as:
International Journal of Engineering Research & Technology (IJERT)
IJERT
IJERT
ISSN: 2278-0181
www.ijert.orgIJERTV3IS120519
(This work is licensed under a Creative Commons Attribution 4.0 International License.)
Vol. 3 Issue12, December-2014
518

u
Cl
l
Cl
u
iQ
u
ip
u
ik
u
ij
l
iQ
l
ip
l
ik
l
ij
u
iQ
l
iQ
u
ip
u
ik
u
ij
l
ip
l
ik
l
ij
u
iQ
l
iQ
u
ip
l
ip
u
ik
l
ik
u
ij
l
iji
iiKK
KKKKKKKK
KKKKKKKK
KKKKKKKKClE
,
,,...,,minmax,,,...,,minmax
,,...,,min,,...,,min
,,....,,
miwhere 1, , and and denote the minimum
and maximum operator of neutrosophic set respectively.
The score of alternative NsIC ic ClS can be evaluated
by:
2
1,
2min
2
1,
2max2
2
iiiiiiii
ii
ClClClClClClClCl
l
Cl
u
Clic
IFITIFIT
TTClS
An accuracy function cA is used to evaluate the degree of
accuracy of neutrosophic elements as follows:
2
1,
2max
2
1,
2min
2
1
2
1
iiiiiiii
ii
ClClClClClClClCl
u
Cl
l
Clic
IFITIFIT
TTClA
The larger value of ic ClA represents the more degree of
accuracy of an element iCl in the neutrosophic set. Based
on the score function cS and the accuracy function cA the
degree of suitability that the corresponding cluster iCl
satisfies the query images component can be measured by:
2
12 ic
ici
ClEAClESClEW
The coefficients in iClEW have been chosen so
that 1,0iClEW . The larger value of iClEW ,
the more suitability to which the alternative NsIC
iCl satisfies to query image components, where
.1 mi
Assume that there is a query images wants to choose an
alternative NsIC which satisfies the components
of njwhereQI j 1,, , each jQI have a different
degree of components FIT ˆ,ˆ,ˆ . Where,
3ˆˆˆ0
,1ˆ0
,1ˆ0
,1ˆ0
FITand
F
I
T
FandIT ˆ,ˆ,.ˆ are the degrees of membership (object),
indeterminacy (edge) and non-membership (background) of
the images compcomp
j imim to the vague concept
importance of criterion respectively.
The weight of query image components lies in closed
interval u
j
l
j ww , where,
2
ˆˆ1,
2
ˆˆmax,
2
ˆˆ1,
2
ˆˆmin,
jjjjjjjju
j
l
j
IFITIFITww
Where, for each query images are 10 u
j
l
j ww .
Then the suitability degree of alternative NsIC iCl
satisfies the query images components can be measured by:
2
ˆ,ˆ1ˆ,ˆ,
2
1max
22
u
iq
l
iqcu
iq
l
iqc
i
ii
TTATTS
ClTClWClR
The optimal weights value can be computed via the
following programming:
j
m
j
u
ij
l
ij
l
ij
u
iji w
KK
KKClR *
1
2
2
21
2
Subject to the conditions:
njwhere
www u
j
jl
j
,...,2,1,
*
VI. Accuracy assessment:
A neutrosophic image is a combination of various
components built on the intensity of pixels. The
unsupervised classification applied to neutrosophic image
sets result in clusters. The comparison between
neutrosophic image components and clusters indicates the
accuracy of the classification. Confusion matrices are used
to assess this accuracy as they compare the relationship
between the neutrosophic image components as the
reference images and the corresponding results of the
unsupervised classification technique.
A resulting cluster by unsupervised classification is not
automatically labeled nor identified as corresponding to
specific image. So, image is investigated with respect to all
clusters, and the cluster containing most of image
components closest to the mean of that image is considered
as its corresponding to a specific cluster. Based on
confusion matrix, the accuracy is then expressed in terms
of the kappa statistic (k) where the difference between the
clustering accuracy and the chance agreement between the
images and the clusters is calculated [45].
It results in a value between 0 and 1 for each classification,
where 0 indicates that the clustering is no better than
grouping the image by chance:
c
i
ji
c
i
c
i
jiij
yyN
yyyN
k
1
2
1 1
Where: :c is the number of clusters ci 1
:N is the total number of images in the image database
classified
:i refers to the images corresponding to cluster i
:ijy is the number of images in row i and column j in
the confusion matrix
:iy is the number of images in row i in the confusion
matrix
:jy is the number of images in column j in the
confusion matrix
International Journal of Engineering Research & Technology (IJERT)
IJERT
IJERT
ISSN: 2278-0181
www.ijert.orgIJERTV3IS120519
(This work is licensed under a Creative Commons Attribution 4.0 International License.)
Vol. 3 Issue12, December-2014
519

VII. EXPERIMENTAL AND RESULTS:
The WBIIS image database [46] is used to evaluate the
ONsIC system. WBIIS image database consists of 10,000
generic images with variety size distributed on 10
categories of Africa, Beaches, Building, Buses, Dinosaurs,
Elephants, Flowers, Foods, Horses and Natural. Several
test images were used during experimentation and result as
shown in figure (4).
Fig. 4: Database categories
The experimental results are discussed under 4 heading:
A. Transform image to neutrosophic image.
Figure 5 illustrates three steps to transformation from RGB
images to neutrosophic images. First step convert the RGB
image to Gray image. A gray image is a simple kind of
image that contains one domain, and each pixel in the
image can be represented by an integer. Second step, an
input image is mapped to T and F by the S-function [47]
and indeterminacy domain I by homogeneity [48]. There
are 12 features (4 parameter of GLCM 3 image
component (T, I and F)) stored in features vectors database
for the further processes.
Fig. 5: Neutrosophic image transform steps.
B. Neutrosophic image clustering.
The major advantage of neutrosophic image clustering
(NsIC) method based on fuzzy c-means can deal with
indeterminate intensity regions effectively and accurately.
Another advantage of NsIC is that it can smooth the
complex background; therefore, it can prevent the object
region from connecting with the false foregrounds. Besides
the above two major advantages, NsIC finds more accurate
object boundaries. Table 1 illustrate example of image
clusters.
International Journal of Engineering Research & Technology (IJERT)
IJERT
IJERT
ISSN: 2278-0181
www.ijert.orgIJERTV3IS120519
(This work is licensed under a Creative Commons Attribution 4.0 International License.)
Vol. 3 Issue12, December-2014
520

Table 1: Example of image clusters.
Fig. 6: Enhanced within neutrosophic image.
C. Neutrosophic image cluster enhanced.
The window size 55 is used for computing the
standard deviation and discontinuity of pixels intensity.
Figure 6 illustrates the homogeneity image in domain I.
Otsu's method [49] is utilized a simple thresholding
method. The global t optimum threshold is finds that
minimizes the overlap variance of the background and
objects within cluster and the overlap variance between
images between clusters by the following equation:
ttcttct 2211
Where, t is the sum of variances of the two clusters as
a t threshold function. ti and tci are the variance
and probability of class i , i=1,2 respectively. Threshold t
that results in the minimization of σ (t) separates the two
classes as the foreground and background, respectively.
D. Optimization neutrosophic image clustering.
ONsIC technique is applied on neutrosophic set of image
clusters (NsIC) miCl i
FIT iii,...,2,1,,, with
evaluations as neutrosophic components. For example,
there are two clusters each cluster including four images
components (T, I, F) are represent as:
9.0.6.0,5.01,5.0,105.0,9.0,75.045.0,8.0,4.0
8.0,4.0,5.05.0,1.0,45.02.0,46.0,68.0015,6.0,8.0
2
1
4321
Cl
Cl
IIII
CN
compcompcompcomp
S
Evaluation of neutrosophic component for NsC
u
ij
l
ijij KKNsCE , is computed by from:
2
1,
2max,
2
1,
2min,
ijijijijijijijiju
Cl
l
Cl
IFITIFITKK
ijij
The result is:
75.0,35.075.0,25.0925.0,825.0675.0,6.0
6.0,3.03.0,275.063.0,57.0725.0,7.0, U
Cl
L
Cl ijij
Scoring and accuracy evaluation matrices cc AS , are
computed by:
L
Cl
U
Clc ijijS 2 , U
Cl
L
Clc ijijA 5.0
The result is:
55.05.0875.06375.0
45.02875.06.07125.0,
8.012.015.0
6.005.012.005.0cc AS
Weights of NsC ijNsClW are computed by:
2
12 ijc
ijcij
NscANsCSNsClW
The result is:
415.075.0022.0159.0
085.0354.0186.0141.0ijSClNW
The coefficients of the linear programming problem are
computed by sum each column in ijNsCW :
5.0396.0208.03.0 ijNsClW
Four neutrosophic query images
njQI j
FIT jjj
,...,2,1,ˆ,ˆ,ˆ are given as:
International Journal of Engineering Research & Technology (IJERT)
IJERT
IJERT
ISSN: 2278-0181
www.ijert.orgIJERTV3IS120519
(This work is licensed under a Creative Commons Attribution 4.0 International License.)
Vol. 3 Issue12, December-2014
521

57.0,98.0,64.0
,67.0,55.0,32.0
,41.0,6.0,35.0
,25.0,3.0,25.0
43214ˆ,ˆ,ˆ
comp
Q
comp
Q
comp
Q
comp
Q
FIT
imimimimQI
For simplifying computation, the neutrosophic set may be
written as:
57.067.041.025.0
98.055.06.03.0
64.032.035.025.0141321
F
I
T
imimimim comp
Q
comp
Q
comp
Q
comp
Q
Weights of query image are computed by formula:
2
ˆˆ1,
2
ˆˆmax,
2
ˆˆ1,
2
ˆˆmin,
jjjjjjjju
j
l
j
IFITIFITww
The result is:
81.0,705.044.0,435.0595.0,475.0525.0,275.0, u
j
i
j ww
Thus the linear programming now can be set as:
n
j
n
i
ijAw1 1
max
Subject to: u
j
jl
j www
The result is:
81.0705.0
44.0435.0
595.0475.0
525.0275.0:
5.0396.0208.03.0:
4
3
2
1
4321
w
w
w
wtosubject
wwwwMaximize
The linear programming can easily solve to getjw* :
81.0
44.0
475.0
275.0
4
*
3
*
2
*
1
*
w
w
w
w
Then the degree of suitability that the corresponding cluster
iCl satisfies the query images can be measured by the
following function:
j
m
j
u
ij
l
ij
l
ij
u
iji w
KK
KKClR *
1
2
22
12
The result is:
21380375.081.02
45.016.044.0
2
5.0105.0
475.02
6.0112.0275.0
2
7125.0105.0
22
22
1
ClR
61180625.081.02
55.018.044.0
2
5.011
475.02
875.012.0275.0
2
6375.0115.0
22
22
2
ClR
Therefore we can see that the alternative cluster 2Cl is the
best choice. And the optimal ranking order of the
alternatives is given by 12 ClCl .
VIII. Performance results
Table 2 is show the confusion matrix for NsIC technique,
the ten clusters found that represent a good approximation
of the ten categories of database image.
Table 2: Confusion matrix for NsIC.
The experiment results have proved beyond any doubt that
NsIcC technique can be of high-accuracy techniques.
Where, the accuracy of similar images was gathered in
different clusters exceeded 90%, as shown in figure 7.
International Journal of Engineering Research & Technology (IJERT)
IJERT
IJERT
ISSN: 2278-0181
www.ijert.orgIJERTV3IS120519
(This work is licensed under a Creative Commons Attribution 4.0 International License.)
Vol. 3 Issue12, December-2014
522

1 2 3 4 5 6 7 8 9 100.1
0.2
0.3
0.4
0.5
0.6
0.7
0.8
0.9
1
1.1
No. of clusters
Ka
pp
a s
tati
sti
c (
k)
Fig. 7. The accuracy assessment (k) versus different clusters.
1 2 3 4 5 6 7 8 9 100.78
0.8
0.82
0.84
0.86
0.88
0.9
0.92
0.94
0.96
0.98
Cluster number
Me
as
urs
Recall
Precision
Fig. 8. The recall and precision measures versus different clusters.
The retrieval performance is defined by the precision and
recall of the retrieved images [50]. As shown in figure 8 the
beach category has been identified with high recall 98%.
That is mean in this category the high number of similar
images are gathered with very few errors. Whereas the low
recall 80.8318% has been identified for house category.
That is meaning there are misclassified for some images
in this category as a result of the weakness of I set that is
working to determine the threshold used in image
enhanced. The precision value ranging from 86.9195% to
97.9798% where the highest value belonging to the cluster
8 and lowest for the cluster 9. This means there is a cluster
8 has more than an image that dos not belong to texture
category and vice versa in cluster 5.
The experiments were carried out on a large-scale over the
WBIIS image database to measure the effectiveness of
NSIC. The results focused on recall and precision measures
and accuracy assessment as a criterion for comparison
between NsIC technique and other technique namely G.
Ciocca et al (2013).
G. Ciocca et al [51] proposed a new technique for
unsupervised image classification based on purely semantic
representation not on statistical method. This technique is
composed of two parts namely supervised feature [52] and
unsupervised classification. The idea of supervised features
part is based on the hypothesis in the semantic realm
regarding categories. That an image d belongs to category
ic with certain probability will not determine whether the
same image belongs to a category jc , but it will modify the
probability that it be so. There are supervised feature
descriptions are used to classify image regions into
semantic concept classes such as Classemes [53],
Prosemantic features [54], Object bank [55], CCA-based
features [56], and Primitive features [57]. The second part
unsupervised classification algorithm such as k-means
based on the output of a limited number of classifiers can
be embedded into a feature space by a clustering algorithm.
G. Ciocca et al is used prosemantic features as supervised
feature and k-means algorithm as unsupervised classifier
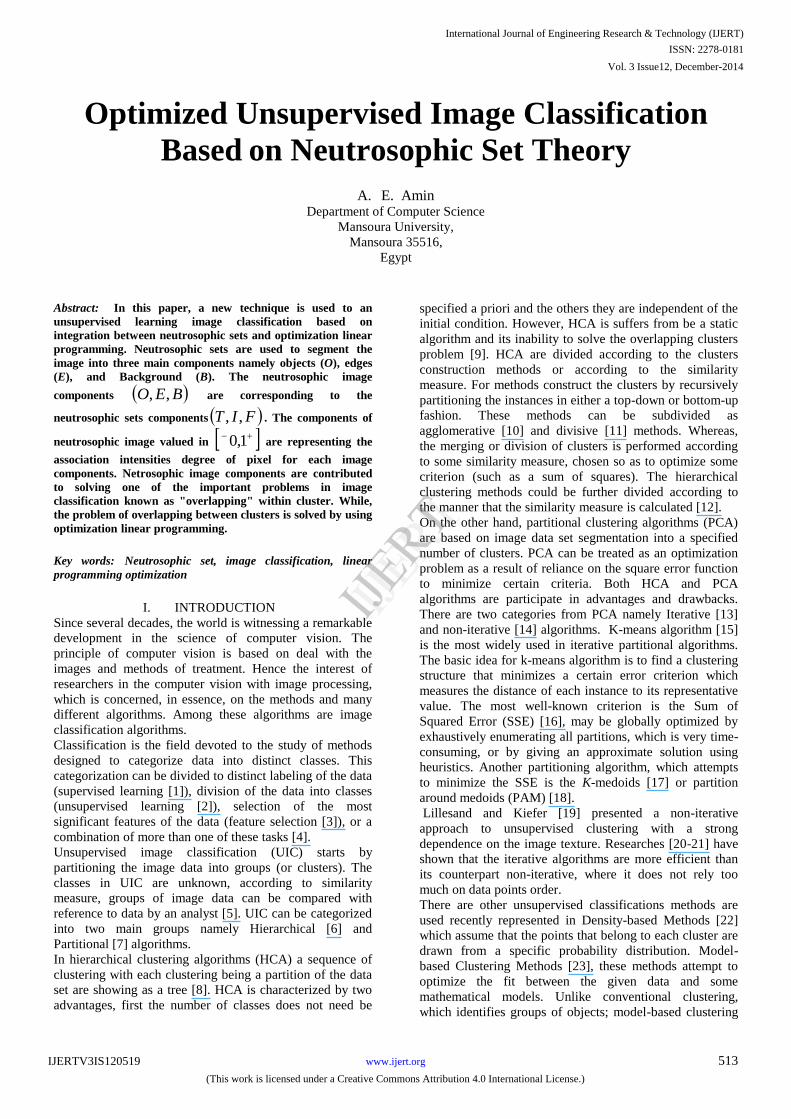
and applied on image database. The results of recall,
precision and accuracy assessment indicates that the NsIC
technique achieved a high performance compared with the
other technique as shown in figures 9, 10 and 11.
International Journal of Engineering Research & Technology (IJERT)
IJERT
IJERT
ISSN: 2278-0181
www.ijert.orgIJERTV3IS120519
(This work is licensed under a Creative Commons Attribution 4.0 International License.)
Vol. 3 Issue12, December-2014
523
1 2 3 4 5 6 7 8 9 100.1
0.2
0.3
0.4
0.5
0.6
0.7
0.8
0.9
1
1.1
No. of clusters
Re
ca
llNsIC
Other
Fig. 9. The recall for compared two techniques.
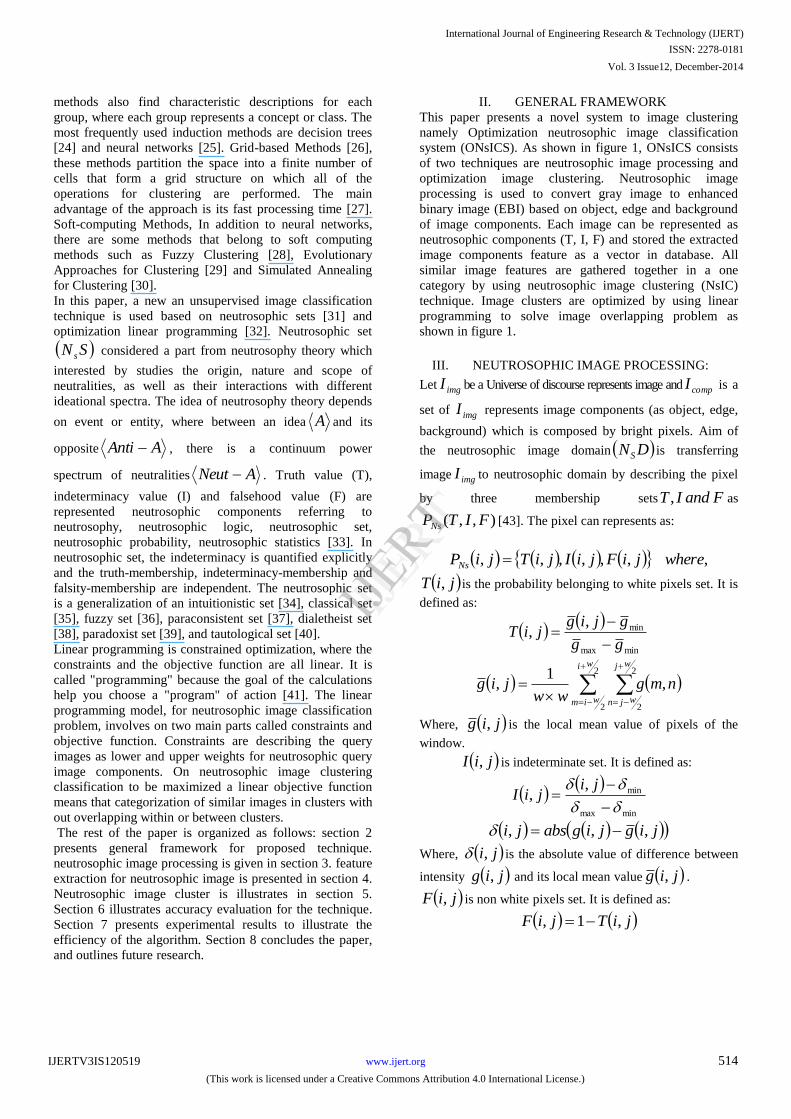
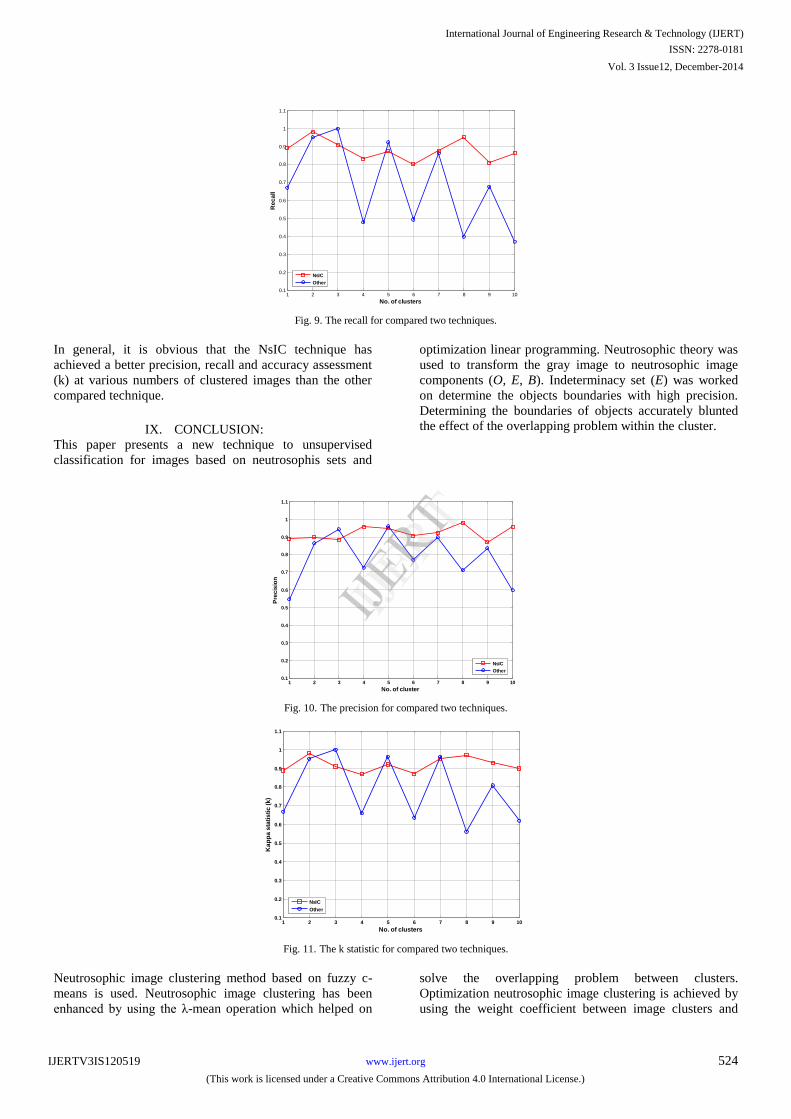
In general, it is obvious that the NsIC technique has
achieved a better precision, recall and accuracy assessment
(k) at various numbers of clustered images than the other
compared technique.
IX. CONCLUSION:
This paper presents a new technique to unsupervised
classification for images based on neutrosophis sets and
optimization linear programming. Neutrosophic theory was
used to transform the gray image to neutrosophic image
components (O, E, B). Indeterminacy set (E) was worked
on determine the objects boundaries with high precision.
Determining the boundaries of objects accurately blunted
the effect of the overlapping problem within the cluster.
1 2 3 4 5 6 7 8 9 100.1
0.2
0.3
0.4
0.5
0.6
0.7
0.8
0.9
1
1.1
No. of cluster
Pre
cis
ion
NsIC
Other
Fig. 10. The precision for compared two techniques.
1 2 3 4 5 6 7 8 9 100.1
0.2
0.3
0.4
0.5
0.6
0.7
0.8
0.9
1
1.1
No. of clusters
Ka
pp
a s
tati
sti
c (
k)
NsIC
Other
Fig. 11. The k statistic for compared two techniques.
Neutrosophic image clustering method based on fuzzy c-
means is used. Neutrosophic image clustering has been
enhanced by using the λ-mean operation which helped on
solve the overlapping problem between clusters.
Optimization neutrosophic image clustering is achieved by
using the weight coefficient between image clusters and
International Journal of Engineering Research & Technology (IJERT)
IJERT
IJERT
ISSN: 2278-0181
www.ijert.orgIJERTV3IS120519
(This work is licensed under a Creative Commons Attribution 4.0 International License.)
Vol. 3 Issue12, December-2014
524

images category as an object function in linear
programming problem. Whereas, the constraints of linear
programming problem are the weight limits for query
images.
Practical results conducted on neutrosophic image
clustering technique has proved its efficiency where it was
to obtain the high performance rate in the accuracy of the
resulting clusters as well as high values of recall and
precision measures.
REFERENCE:
[1] Lu, Dengsheng, and Qihao Weng. "A survey of image classification methods and techniques for improving classification performance.", International journal of Remote sensing 28.5 (2007): 823-870.
[2] Lee, Te-Won, and Michael S. Lewicki. "Unsupervised image classification, segmentation, and enhancement using ICA mixture models." Image Processing, IEEE Transactions on 11, no. 3 (2002): 270-279.
[3] Guyon, Isabelle, and André Elisseeff. "An introduction to variable and feature selection." The Journal of Machine Learning Research 3 (2003): 1157-1182.
[4] Saeys, Yvan, Iñaki Inza, and Pedro Larrañaga. "A review of feature selection techniques in bioinformatics." bioinformatics 23.19 (2007): 2507-2517.
[5] Omran, Mahamed GH, Andries Petrus Engelbrecht, and Ayed Salman. "Differential evolution methods for unsupervised image classification." Evolutionary Computation, 2005. The 2005 IEEE Congress on. Vol. 2. IEEE, 2005.
[6] Deng, Jia, Alexander C. Berg, Kai Li, and Li Fei-Fei. "What does classifying more than 10,000 image categories tell us?" In Computer Vision–ECCV 2010, pp. 71-84. Springer Berlin Heidelberg, 2010.
[7] Yang, Shulin, Liefeng Bo, Jue Wang, and Linda G. Shapiro. "Unsupervised Template Learning for Fine-Grained Object Recognition." In NIPS, pp. 3131-3139. 2012.
[8] Murtagh, Fionn, and Pedro Contreras. "Algorithms for hierarchical clustering: an overview." Wiley Interdisciplinary Reviews: Data Mining and Knowledge Discovery 2.1 (2012): 86-97.
[9] Elavarasi, S. Anitha, J. Akilandeswari, and B. Sathiyabhama. "A survey on partition clustering algorithms." learning 1.1 (2011).
[10] Meila, Marina, and David Heckerman. "An experimental comparison of several clustering and initialization methods." arXiv preprint arXiv:1301.7401 (2013).
[11] Gaidon, Adrien, Zaid Harchaoui, and Cordelia Schmid. "Recognizing activities with cluster-trees of tracklets." BMVC. 2012.
[12] Jain, A.K. Murty, M.N. and Flynn, P.J. Data Clustering: A Survey. ACM Computing Surveys, Vol. 31, No. 3, September 1999.
[13] Dong, Weisheng, et al. "Sparsity-based image denoising via dictionary learning and structural clustering." Computer Vision and Pattern Recognition (CVPR), 2011 IEEE Conference on. IEEE, 2011.
[14] Hanauer, Matthias, and Andreas Koehn. "Perturbative treatment of triple excitations in internally contracted multireference coupled cluster theory." The Journal of chemical physics 136.20 (2012): 204107.
[15] Zhao, Z. L., Bo Liu, and Wei Li. "Image clustering based on extreme K-means algorithm." IEIT Journal of Adaptive & Dynamic Computing 2012.1 (2012): 12-16.
[16] Celebi, M. Emre, Hassan A. Kingravi, and Patricio A. Vela. "A comparative study of efficient initialization methods for the k-means clustering algorithm." Expert Systems with Applications 40.1 (2013): 200-210.
[17] Singh, Shalini S., and N. C. Chauhan. "K-means v/s K-medoids: A Comparative Study." National Conference on Recent Trends in Engineering & Technology. 2011.
[18] Kaufman, L. and Rousseeuw, P.J., 1987, Clustering by Means of Medoids, InY. Dodge, editor, Statistical Data Analysis, based on the L1 Norm, pp. 405-416, Elsevier/North Holland, Amsterdam.
[19] Mirik, Mustafa, and R. James Ansley. "Comparison of ground-measured and image-classified mesquite (Prosopis glandulosa)
canopy cover." Rangeland Ecology & Management 65.1 (2012): 85-95.
[20] Bringmann, Björn, Siegfried Nijssen, and Albrecht Zimmermann. "Pattern-based classification: a unifying perspective." arXiv preprint arXiv:1111.6191 (2011).
[21] Voisin, Aurélie, et al. "Classification of very high resolution SAR images of urban areas." (2011).
[22] Kriegel, Hans‐Peter, et al. "Density‐based clustering." Wiley Interdisciplinary Reviews: Data Mining and Knowledge Discovery 1.3 (2011): 231-240.
[23] Bouveyron, Charles, and Camille Brunet. "Simultaneous model-based clustering and visualization in the Fisher discriminative subspace." Statistics and Computing 22.1 (2012): 301-324.
[24] Barros, Rodrigo Coelho, et al. "A survey of evolutionary algorithms for decision-tree induction." Systems, Man, and Cybernetics, Part C: Applications and Reviews, IEEE Transactions on 42.3 (2012): 291-312.
[25] Krizhevsky, Alex, Ilya Sutskever, and Geoffrey E. Hinton. "ImageNet Classification with Deep Convolutional Neural Networks." NIPS. Vol. 1. No. 2. 2012.
[26] Willems, Thomas F., et al. "Algorithms and tools for high-throughput geometry-based analysis of crystalline porous materials." Microporous and Mesoporous Materials 149.1 (2012): 134-141.
[27] Han, J. and Kamber, M. Data Mining: Concepts and Techniques. Morgan Kaufmann Publishers, 2001.
[28] Izakian, Hesam, and Ajith Abraham. "Fuzzy C-means and fuzzy swarm for fuzzy clustering problem." Expert Systems with Applications 38.3 (2011): 1835-1838.
[29] Zhou, Aimin, et al. "Multiobjective evolutionary algorithms: A survey of the state of the art." Swarm and Evolutionary Computation 1.1 (2011): 32-49.
[30] Dowsland, Kathryn A., and Jonathan M. Thompson. "Simulated annealing." Handbook of Natural Computing. Springer Berlin Heidelberg, 2012. 1623-1655.
[31] Maji, Pabitra Kumar. "Neutrosophic soft set." Annals of Fuzzy Mathematics and Informatics 5.1 (2013): 2287-623.
[32] Hromkovic, Juraj. Algorithmics for hard problems: introduction to combinatorial optimization, randomization, approximation, and heuristics. Springer-Verlag, 2010.
[33] Smarandache, Florentin. Introduction to Neutrosophic Measure, Neutrosophic Integral, and Neutrosophic Probability. 2013.
[34] Jiang, Yuncheng, Yong Tang, and Qimai Chen. "An adjustable approach to intuitionistic fuzzy soft sets based decision making." Applied Mathematical Modelling 35.2 (2011): 824-836.
[35] Temme, Nico M. Special functions: An introduction to the classical functions of mathematical physics. John Wiley & Sons, 2011.
[36] Fiss, Peer C. "Building better causal theories: A fuzzy set approach to typologies in organization research." Academy of Management Journal 54.2 (2011): 393-420.
[37] Weber, Zach. "Transfinite numbers in paraconsistent set theory." The Review of Symbolic Logic 3.01 (2010): 71-92.
[38] Smarandache, Florentin. "Neutrosophic Logic-A Generalization of the Intuitionistic Fuzzy Logic." Multispace & Multistructure. Neutrosophic Transdisciplinarity (100 Collected Papers of Science) 4 (2010): 396.
[39] Mohan, J., V. Krishnaveni, and Yanhui Guo. "A neutrosophic approach of MRI denoising." Image Information Processing (ICIIP), 2011 International Conference on. IEEE, 2011.
[40] Faber, Carel, and Rahul Pandharipande. "Tautological and non-tautological cohomology of the moduli space of curves." arXiv preprint arXiv:1101.5489 (2011).
[41] Kumar, Amit, Jagdeep Kaur, and Pushpinder Singh. "A new method for solving fully fuzzy linear programming problems." Applied Mathematical Modelling 35.2 (2011): 817-823.
[42] Maji, Pabitra Kumar. "Neutrosophic soft set." Annals of Fuzzy Mathematics and Informatics 5.1 (2013): 2287-623.
[43] Zhang, Ming, Ling Zhang, and H. D. Cheng. "A neutrosophic approach to image segmentation based on watershed method." Signal Processing 90.5 (2010): 1510-1517.
International Journal of Engineering Research & Technology (IJERT)
IJERT
IJERT
ISSN: 2278-0181
www.ijert.orgIJERTV3IS120519
(This work is licensed under a Creative Commons Attribution 4.0 International License.)
Vol. 3 Issue12, December-2014
525

[44] Majumdar, Pinaki, and Syamal Kumar Samant. "On similarity and entropy of neutrosophic sets." Journal of Intelligent and Fuzzy Systems (2013).
[45] Lillesand, T.M. and Kiefer, R.W. 2000. Remote sensing and image interpretation. John Wiley & Sons, Inc., New York, NY, USA.
[46] Jia Li and James Z. Wang, ``Real-time Computerized Annotation of Pictures,'' IEEE Transactions on Pattern Analysis and Machine Intelligence, vol. 30, no. 6, pp. 985-1002, 2008.
[47] Zhang, Ming, Ling Zhang, and H. D. Cheng. "A neutrosophic approach to image segmentation based on watershed method." Signal Processing 90.5 (2010): 1510-1517.
[48] Truc, Phan Tran Ho, et al. "Homogeneity-and density distance-driven active contours for medical image segmentation." Computers in biology and medicine 41.5 (2011): 292-301.
[49] Farrahi Moghaddam, Reza, and Mohamed Cheriet. "AdOtsu: An adaptive and parameterless generalization of Otsu's method for document image binarization." Pattern Recognition 45.6 (2012): 2419-2431.
[50] Viitaniemi, Ville, & Laaksonen, Jorma (2007). Evaluating the performance in automatic image annotation: Example case by adaptive fusion of global image features. Signal Processing: Image Communication, 22(6), 557–568.
[51] G. Ciocca et al., On the use of supervised features for unsupervised image categorization: An evaluation, Comput. Vis. Image Understand. (2014), http://dx.doi.org/10.1016/j.cviu.2014.01.010
[52] Martínez Sotoca, José, and Filiberto Pla. "Supervised feature selection by clustering using conditional mutual information-based distances." Pattern Recognition 43.6 (2010): 2068-2081.
[53] Torresani, Lorenzo, Martin Szummer, and Andrew Fitzgibbon. "Efficient object category recognition using classemes." Computer Vision–ECCV 2010. Springer Berlin Heidelberg, 2010. 776-789.
[54] Ciocca, Gianluigi, et al. "Halfway through the semantic gap: prosemantic features for image retrieval." Information Sciences 181.22 (2011): 4943-4958.
[55] Li, Li-Jia, et al. "Object Bank: A High-Level Image Representation for Scene Classification & Semantic Feature Sparsification." NIPS. Vol. 2. No. 3. 2010.
[56] Golugula, Abhishek, et al. "Supervised Regularized Canonical Correlation Analysis: integrating histologic and proteomic measurements for predicting biochemical recurrence following prostate surgery." BMC bioinformatics 12.1 (2011): 483.
[57] Rizoiu, Marian-Andrei, Julien Velcin, and Stéphane Lallich. "Unsupervised feature construction for improving data representation and semantics." Journal of Intelligent Information Systems 40.3 (2013): 501-527
International Journal of Engineering Research & Technology (IJERT)
IJERT
IJERT
ISSN: 2278-0181
www.ijert.orgIJERTV3IS120519
(This work is licensed under a Creative Commons Attribution 4.0 International License.)
Vol. 3 Issue12, December-2014
526


