
Opening Statistics and Match Play for Backgammon Games
Nikolaos Papahristou and Ioannis Refanidis
Dept. of Applied Informatics, University of Macedonia
Egnatia 156, Thessaloniki, 54006, Greece
[email protected] and [email protected]
Abstract. Players of complex board games like backgammon, chess and go,
were always wondering what the best opening moves for their favourite game
are. In the last decade, computer analysis has offered more insight to many
opening variations. This is especially true for backgammon, where computer
rollouts have radically changed the way human experts play the opening. In this
paper we use Palamedes, the winner of the latest computer backgammon Olym-
piad, to make the first ever computer assisted analysis of the opening rolls for
the backgammon variants Portes, Plakoto and Fevga (collectively called Tavli
in Greece). We then use these results to build effective match strategies for each
game variant.
Keywords: Monte Carlo, Game Statistics, Match play, Backgammon, Plakoto,
Fevga
1 Introduction
Backgammon is a perfect information, turn-taking game of two players, where the
outcome is influenced both from skill and the roll of the dice. At each turn, the avail-
able candidate moves are computed according to the roll of two six-sided dice, result-
ing in 21 possible rolls. Standard backgammon opening rolls have been thoroughly
analyzed in [6]. To the best of our knowledge, this kind of analysis has not been made
in other backgammon variants. In this paper we attempt to computationally analyze
the opening rolls of the backgammon variants Portes, Plakoto and Fevga, using our
Palamedes bot1. We then use these results to extract useful statistical information
about the games.
Our methodology is similar to the one used in [6]: The most promising continua-
tions after each roll are analyzed using rollout analysis, a Monte Carlo method that is
commonly used in backgammon. Starting from the resulting position after each can-
didate move, a fixed number of games is played until a terminal position is reached.
Counting the results of these games we can finally get the probabilities of single wins
1 Palamedes can be freely downloaded from http://ai.uom.gr/nikpapa/Palamedes

(WS), double wins (WD), single losses (LS) and double losses (LD). Bases on these
probabilities, we can then compute the estimated equity of each position using the
following equation:
E = WS – LS + 2 * (WD – LD) (1)
This kind of evaluation is considered to offer accurate results in backgammon, de-
spite the fact that the move selection algorithm of the rollout phase is not so strong in
terms of performance [12]. Rollouts can also be truncated, which means that they
could stop after a fixed amount of plies (instead of going till the end of the game) and
average together the estimates of the resulting positions, with a negligible change in
their estimates.
The rest of the paper is structured as follows: First we briefly discuss the related
work and the three backgammon variants, then we present our experimental results,
we discuss them and, finally, we conclude the paper and identify some challenges for
future research.
2 Background
2.1 Related work
Monte Carlo methods have recently gained increased interest by game AI researchers
due to the success of the MCTS algorithm in the game of Go [3, 5], as well as in other
games [4, 7, 14]. In MCTS and it‟s most popular variant UCT, rollouts (usually called
playouts) are used to simulate a trajectory, whereas its outcome is used to build and
update a tree from the starting position. The rollouts can be random or based on heu-
ristics. Recent advances in computer Go indicate that adding domain knowledge in
the rollouts is critical for producing state of the art performance.
More relevant to our setup are the MCTS variants that attempt to solve the game-
theoritic value of positions. MCTS-Solver [13] and Monte Carlo Proof-Number
Search (MC-PNS) [10] are two such algorithms that are based on Proof Number
Search [1]. Score bounded MCTS [2] is another technique for proving the game theo-
retic value of games of multiple outcomes. However, all three algorithms are suitable
for determinist games only. To the best of our knowledge we are not aware of similar
enhancements for non-deterministic, perfect information games with chance nodes
such as backgammon.
2.2 Rules of backgammon variants examined
Most backgammon variants are usually conducted in a board containing 24 points
divided in 4 quadrants of 6 points each. Each player starts the game with a number of
checkers or stones at his disposal (usually 15) placed in a fixed starting position. The
players take turns playing their checkers forward using an element of chance in the
form of two six-sided dice. The checkers can be moved only to an open point accord-
ing to the game rules. When all checkers of a player are inside his last quadrant of the
board (called his home board), he can start taking them out of the board; this is called
bearing off. The player that clears all his checkers first is the winner of the game.
At the end of the game, if the losing player has borne off at least one checker, he
loses only one point. However, if the loser has not borne off any of his checkers, he
loses a double game or gammon and two points. In standard backgammon, if the loser
has not borne off any of his checkers and still has a checker in the winner's home
board, he loses a triple game or backgammon and three points.
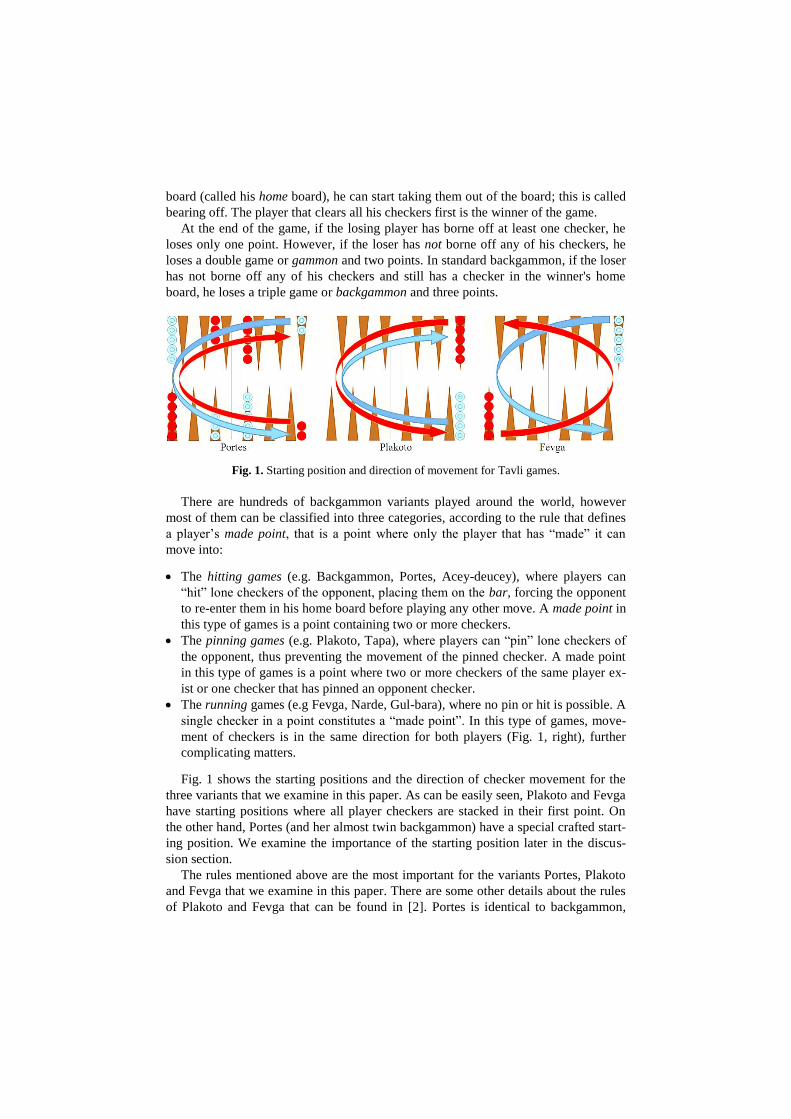
Fig. 1. Starting position and direction of movement for Tavli games.
There are hundreds of backgammon variants played around the world, however
most of them can be classified into three categories, according to the rule that defines
a player‟s made point, that is a point where only the player that has “made” it can
move into:
The hitting games (e.g. Backgammon, Portes, Acey-deucey), where players can
“hit” lone checkers of the opponent, placing them on the bar, forcing the opponent
to re-enter them in his home board before playing any other move. A made point in
this type of games is a point containing two or more checkers.
The pinning games (e.g. Plakoto, Tapa), where players can “pin” lone checkers of
the opponent, thus preventing the movement of the pinned checker. A made point
in this type of games is a point where two or more checkers of the same player ex-
ist or one checker that has pinned an opponent checker.
The running games (e.g Fevga, Narde, Gul-bara), where no pin or hit is possible. A
single checker in a point constitutes a “made point”. In this type of games, move-
ment of checkers is in the same direction for both players (Fig. 1, right), further
complicating matters.
Fig. 1 shows the starting positions and the direction of checker movement for the
three variants that we examine in this paper. As can be easily seen, Plakoto and Fevga
have starting positions where all player checkers are stacked in their first point. On
the other hand, Portes (and her almost twin backgammon) have a special crafted start-
ing position. We examine the importance of the starting position later in the discus-
sion section.
The rules mentioned above are the most important for the variants Portes, Plakoto
and Fevga that we examine in this paper. There are some other details about the rules
of Plakoto and Fevga that can be found in [2]. Portes is identical to backgammon,

with the following changes: a) No cube2 is used; b) no triple wins (backgammons);
and c) a double roll is allowed in the first move.
2.3 Match play and Tavli
Backgammon games can be played individually, in which case they are called money
games; however, more often they are played in a match, where each player accumu-
lates points (one point for single wins, two points for double wins) until a player
reaches a predefined number of points. In Greece, the most popular way of playing
backgammon games is a Tavli match (Fig. 2), where Portes, Plakoto and Fevga are
played one after the other, until a player reaches five or seven points.
Fig. 2. Flow of a Tavli match. (Source: http://www.bkgm.com/variants/Tavli.html)
2.4 Palamedes
All the experiments in this paper are made using our latest Palamedes bot. Palamedes,
originally started as a project aimed at developing expert-playing bots at Tavli games,
currently supports Portes, Plakoto, Fevga, Narde, Hypergammon, Nackgammon,
Takhteh, with more variants planned for the future. At the core of the evaluation
function of each game is a Neural Network trained by TD(λ) [11] and millions of self-
play games. The training procedure that we used [8, 9] is inspired by the early suc-
cesses of TD-Gammon in backgammon [12]. Palamedes is the current world champi-
on in computer backgammon, after taking the first place at the latest Backgammon
Computer Olympiad held in Tilburg, Netherlands, 2011.
3 Experimental setup and results
We used our latest and best Neural Networks (NN) game evaluation functions for
selecting each move on the rollouts. For Portes we used Portes_ACG13 NN, for Pla-
koto we used Plakoto5, and for Fevga we used Fevga6 [8]. The rollouts were per-
formed using 1-ply playing mode, which means that Palamedes looked ahead only at
the current roll for each play during the rollouts, selecting the best play of each trial.
After the opening roll we rolled out the five most promising candidate moves (select-
ed using 2-ply evaluation), using 100,000 games per position. The standard error of
2 When the doubling cube is used the stakes of the game can be increased by the players. Using
the cube speeds up match play and provides an added dimension for strategy.

the estimated equity E (1) when performing this number of trials is less than 0.02.
Rollouts were performed using cubeless untruncated money play. Cubeless means
that games are played without a doubling cube. Untruncated means that rollouts were
played out until the end of the game. Money play means that each game is played
individually and not as a part of a match.
Opening rolls were split in two groups, single and double, in order to shed more
light into the effect of rolling a double at the start of the game. This is most useful in
standard backgammon, which does not allow a double opening roll like the Portes
variant does. The move selected for each roll was picked as the best after rolling out
the most promising candidate moves available. These figures were constructed by
singling out the move with best equity after each roll. The actual moves selected can
be seen in Appendix B.
Figs. 3-5 summarize the results for each roll and game variant and compares the
games. All numbers shown are with regard to the first player making the move. Aver-
ages of all single rolls are marked with the word „SINGLE‟. Averages of all double
rolls are marked with the word „DOUBLE‟. Finally the word „ALL‟ is the weighted
(according to the probability of each roll) average of all 21 rolls.
Fig. 3. Comparison of estimated equity of all opening rolls
In Fig. 3 the estimated equity of all opening moves for all games is presented. The
starting roll with the greatest equity is by far the 55 in Fevga, while the least useful
roll is the 21 in Fevga.
-0,1
0,0
0,1
0,2
0,3
0,4
0,5
0,6
0,7
0,8
0,9
Portes Plakoto Fevga

Fig. 4. Expected outcome (%) of the first player
Fig. 4 summarizes the outcome of all rolls to produce the expected result of the
first player. From this figure we can derive the percentage of games that result in
doubles, also called “gammon rate”, by adding WD and LD (Table 1).
Table 1. Gammon rates of Tavli variants
Variant Gammon Rate
Portes 26.85%
Plakoto 40.48%
Fevga 14.27%
Fig. 5. Total estimated equity of the first player
37,45%
41,84%
38,18%
30,31%
27,85%
29,90%
47,30%
47,39%
47,31%
14,03%
17,57%
14,62%
21,55%
28,91%
22,77%
9,69%
12,89%
10,22%
35,70%
30,68%
34,87%
30,09%
27,30%
29,62%
38,89%
36,06%
38,42%
12,82%
9,73%
12,31%
18,06%
15,95%
17,71%
4,12%
3,66%
4,05%
0% 100%
Portes Single Rolls
Portes Double Rolls
Portes All Rolls
Plakoto Single Rolls
Plakoto Double Rolls
Plakoto All Rolls
Fevga Single Rolls
Fevga Double Rolls
Fevga All Rolls
Single Wins (WS) Double Wins (WD) Single Losses (LS) Double Losses (LD)
0,042
0,267
0,079
0,072
0,265
0,104
0,195
0,298
0,213
0,00 0,05 0,10 0,15 0,20 0,25 0,30 0,35
SINGLE ROLLS
DOUBLE ROLLS
ALL ROLLS
Portes
Plakoto
Fevga

Perhaps the most interesting result of this study is the total estimated equity of the
first player shown in Fig. 5. Ideally, a perfectly designed backgammon game would
give zero equity to the first player. This would mean that the opening roll does not
favor one player over the other. Our study shows that the “best” variant in that regard
is Portes, closely followed by Plakoto. On the other hand, Fevga gives a significant
advantage to the first player.
4 Discussion
This section discusses and compares the results of the three games to each other, as
well as to previous similar studies. We also attempt to explain some of the results
found from a strategic point of view.
4.1 Portes
The results for the single rolls of the Portes variant are very similar to a previous
study on standard backgammon openings [6]. In that study, the rollouts were per-
formed by GnuBG3, a very strong open source backgammon program at a 2-ply
depth. The estimated equity of all single rolls in [6] is 0.039, ours is 0.042. Almost all
best opening moves coincide with our best selected moves. The gammon rate is esti-
mated in [6] at 27.6%. If we count the backgammons, which according to Portes rules
are counted as gammons, this rate is increased to 28.8%. Our results estimate this at a
more modest 26.9%, almost a 2% difference. We give two possible explanations for
this behavior: a) 1-ply rollouts are not accurate enough, and b) the playing style of
Palamedes is more conservative compared to that of GnuBG, resulting in somewhat
fewer gammons.
Since the analysis of the single opening rolls is nothing new, we concentrate the
discussion around the effect of the double rolls. The inclusion of doubles in the open-
ing roll gives more advantage to the first player. The average equity of all double rolls
is 0.267 (Fig. 5), six times larger than the equity of the single rolls. This was ex-
pected, since a) doubles usually result in more distance travelled than the average
single roll, and b) even small doubles like 11 give the opportunity to construct strate-
gically made points without risking getting hit by the opponent. The best double roll
is 66 with 0.41 equity; even the worst double roll (11, E=0.22) is better than the best
single roll (31, E=0.16). The effect of doubles can be seen in the weighted average of
all rolls (Fig. 5, E=0.079), which is almost twice that of the single rolls.
4.2 Plakoto
Plakoto results, compared to the other games, demonstrate an increased gammon rate.
41% of Plakoto games are won as doubles, 14% more than the rate we calculated in
Portes. This rate can be explained by the strategic strength of pinning an opponent
checker inside his home board. It is well known that this kind of pin can result in
3 http://www.gnubg.org

double games because if the pinning player manages not to get pinned himself, he can
place his checkers in such a way that during bear off most of his pieces will be borne
off before the pinning checker is unpinned. This places the pinned player at a great
disadvantage, because usually he does not have enough time to return the last checker
to his home board and avoid the double loss. Of course, one can play a very conserva-
tive game and avoid leaving lone checkers in his home board at all costs. However,
this can lead to other problems: building large stacks of checkers, that are extremely
inflexible and also minimize the chances of hitting lone checkers of the opponent. For
this reason, Palamedes and most expert players prefer a “restrained aggressive ap-
proach” during the opening, leaving some lone checkers open when there is a small
chance that the opponent can pin them. This strategy however, inevitably falls victim
to a lucky pinning roll by the opponent, which may be enough to result in a double
loss. This reasoning strongly suggests that the starting position of Plakoto (Fig. 1,
middle) greatly influences the gammon rate and the equity of the first player.
In order to test the hypothesis above, we made another experiment changing the
starting position: Instead of having all 15 checkers at the starting point, the checkers
are distributed evenly in the first three points. This variant is known in some regions
as the Tapa variant and we will use this naming also in this paper. The starting posi-
tion of Tapa makes the pinning of checkers inside the home board during the opening
more difficult, because the players can construct made points more easily during the
start of the game. We used the same methodology and the same Neural Network (Pla-
koto-5) for the rollouts. Even if this NN was not trained for this specific variant, we
believe that it is sufficient to produce strong play, because the type of positions result-
ing from a Tapa game are well within the range of positions the NN has seen during
self-play training4.
Table 2. Comparison of Tapa and Plakoto estimated results for the first player
Variant WS (%) WD (%) LS (%) LD (%) EQUITY GAMMON
RATE (%)
Plakoto 29.89 22.77 29.62 17.71 0.104 40.48
Tapa 37.40 13.12 37.91 11.55 0.026 24.67
The results of the Tapa experiment (Table 2) confirm our hypothesis. The gammon
rate is reduced from 40.48 to 24.67%. Also the equity of the first player is reduced to
0.026, which is even lower than the equity of the single rolls in the Portes variant
(Fig. 5).
Another notable point that can be seen in Table 2 is that the first player wins about
the same amount of single games as the second player (29.9% vs 29.6%). Conse-
4 The opposite situation could be problematic: a Tapa trained NN may not evaluate correctly
Plakoto‟s opening positions with early home board pins in points 2 and 3, because this kind
of experience would have been extremely rare in its self-play training.

quently all the advantage that the first player has can be attributed to the difference in
double games won which is 22.77% compared to 17.71% of the second player.
4.3 Fevga
The first interesting result in the Fevga experiments is that the expected equity of the
first player (0.213) is the highest amongst all games examined, more than twice that
of the Plakoto (0.104). Winning 57.5% of the games gives the player who plays first a
distinctive advantage. Fevga also has the roll with the most gained equity in all
games, the 55 roll at 0.84 equity. We also observe that all high sum rolls (e.g. 63, 64,
65) give very high equity for the first player, with 65 (E=0.44), even surpassing the
best Portes roll (66, E=0.41). However, unlike the two other variants, doubles do not
increase the equity of the single rolls that much (from 0.19 to 0.21). This can be at-
tributed to the fact that apart form 55, the other two large doubles (44 and 66) that
typically have increased equity, have a reduced effect because of Fevga‟s starting rule
[2]. Overall, we note that the further the starting checker is able to move during the
first roll, the better the chances are for the first player. This observation fully justifies
the name of the game („Fevga‟ means „run‟ in Greek).
Another surprising observation is that the gammon rate (14.27%) is very low com-
pared to the other variants. The greatest factor that affects this statistic is the very
small chance of the second player winning a double game. With 4.05% the second
player wins less than half doubles that the first player does (10.22%).
5 Match Play
In this section we show how we can use the statistics from Table 1 to construct effec-
tive match strategies for Tavli variants. When playing a match, the goal of the players
is to win the match and not to maximize their expected reward at the individual
games. For this reason all strong backgammon programs select the best move by ap-
proximating the Match Winning Chance (MWC) at each move selection. We present
a simple method, similar to the one used in backgammon, for approximating MWC,
using the estimates of the NN evaluations and the gammon rate computed in Table 1.
For simplicity, we examine only matches of the same game type where the player that
starts each game is determined randomly.
First, we build a table estimating MWC before the start of the game for all possible
score differences during the course of the match. In the most simple case, that is,
when the score is tied, the players have the same chance of winning the match. The
table is calculated using the following recursive definition:
mwc(Α,Β) = S * mwc(A-1, B) + D * mwc(A-2, B) + S * mwc(A, B-1) + D * mwc(A, B-2) (2)
where A is the remaining points left for player A to win the match, B is the remaining
points left for player B to win the match, mwc(A,B) is the table entry specifying the
probability of winning the match for the A player when the current score is A points
away – B points away, S is the probability each player has of winning a single game

(= (1 - gammon rate) / 2), D is the probability each player has of winning a double
game (=gammon rate / 2). Appendix A show the tables computed with this method for
the games Portes, Plakoto, Fevga and match away scores up to 9.
Finally, for move selection, a similar equation is used for determining the MWC of
each move:
MWC = WS * mwc(A-1, B) + WD * mwc(A-2, B) + LS * mwc(A, B-1) + LD * mwc(A, B-2) (3)
where WS, WD, LS and LD are the output estimations of our neural network evalua-
tion function.
5.1 Experiments in Match Play
In order to test the above method, we made an experiment playing 10000 5-point
matches in the three variants examined where one player uses the “match” strategy
and the other player uses the “money play” strategy that tries to maximize the value of
each individual games. The match started half the time by the “match” player and the
other half by the “money” player. The results along with some useful statistics that we
stored during the course of the matches are shown in Table 3. All results are from the
point of the match player.
Table 3. Performance of match strategy vs money play strategy in 10000 5-point matches
Variant Match
Wins
Diff.
moves
Games
WS
Games
WD
Games
LS
Games
LD
Total
game
points
Portes 5144±98 7.1% 22937 7094 19558 9066 -565
Plakoto 5103±98 4.6% 15994 10627 15238 11007 -4
Fevga 5067±98 5.3% 28395 4453 27358 5401 -635
The performance of the match strategy is better than the money-play strategy in all
games, in terms of matches won by the match player, although the total points won by
the match player is less than the points won by the money player. In other words, the
match player is able to win the points when they are more important in order to win
the current match. This observation is clearer in Portes and Plakoto, and less signifi-
cant in Fevga, due to the low gammon rate of Fevga that does not give many opportu-
nities for the players to take justified risks for a gammon. We also kept counters
whether the money player would play the same move with the match strategy in a non
trivial decision (number of possible moves > 1) when it was the turn of the match
player (column Diff. moves). As it can be seen in this column the two strategies differ
very slightly and this can be an explanation why the match strategy is only better by a
small margin.
Finally, we also measured the result of each game (columns: WS, WD, LS, LD)
and the total game points from the point of the match player. Interestingly, the match
player wins more single games and less double games in all three variants. This can
be explained with the following reasoning: when the match player is ahead on the
score, it will play more conservatively trying to keep its lead and not take unnecessary
chances to win a gammon that could give also winning chances to the opponent. On
the other hand, when he is behind he will go more aggressively for a gammon in order
to try to close the gap before it is too late. This risky strategy some times will be suc-
cessful, but most of the times it will result in gammons for the opponent.
6 Conclusions and future work
In this paper we used Palamedes bot to conduct rollout experiments on the opening
moves of the first player for three popular backgammon games: Portes, Plakoto and
Fevga. Our findings for Portes without the double rolls are very close to those found
in the literature. To the best of our knowledge, this is the first time that an analysis of
the opening moves was conducted for the other two variants, Plakoto and Fevga.
Our results show that the advantage of the first player is significant in the Fevga
variant, small in Plakoto and very small in Portes. The superiority of the Portes vari-
ant in this statistic was expected because Portes (and backgammon) has the advantage
of a specially crafted starting position which is not present in the other variants. An-
other interesting result is that the gammon rates of the three games fall in completely
different ranges. The smallest gammon rate is for the Fevga variant (14.27%), fol-
lowed by Portes/Backgammon (26.9%), whereas Plakoto has the largest rate (at 41%).
We also showed the effect of the starting position on the statistics examined in the
Plakoto variant. Changing only slightly the starting position (Tapa variant), we man-
aged to lower significantly the gammon rate and the advantage of the first player,
making Tapa the most “fair” backgammon variant examined so far. It would be inter-
esting to try the opposite procedure in the backgammon/Portes variant: what would be
the gammon rate and equity of a variant with the same rules as backgammon but a
starting position where all starting checkers are placed in the player‟s first point? If
the results of our Plakoto/Tapa experiments are any indication, we suspect that we
would see an increase in both of these measurements. We could have tried out an
experiment using the Portes NN in this variant. However, unlike the Plakoto/Tapa
case, here the change of the starting position is significant, so we feel that the Portes
NN will not generalize well. A new NN-based evaluation function should be self-
trained, but as this is not trivial, we leave it for future work.
Finally, as a practical application, we used the computed gammon rates to con-
struct a match strategy that outperformed our previous money play strategy when
playing 5-point matches in Portes and Plakoto. In the future we plan to extend this
method in matches where the starting player of the game is the one that wins the pre-
vious game, and in matches that consist of different game types like a Tavli match.

Acknowledgements
The first author was partially supported by a Hellenic Artificial Intelligence Socie-
ty (EETN) scholarship.
References
1. Allis, L.V., M. van der Meulen, and H.J. van den Herik: Proof-Number Search. Artificial
Intelligence, Vol. 66, ISSN 0004-3702, 91–124 (1994)
2. Cazenave, T., Saffidine, A.: Score Bounded Monte-Carlo Tree Search. In: van den Herik,
H.J., Iida, H., Plaat, A. (eds.) CG 2010. LNCS, vol. 6515, pp. 93–104. Springer, Heidel-
berg (2011)
3. Coulom, R.: Efficient selectivity and backup operators in Monte-Carlo tree search. In: van
den Herik, H.J., Ciancarini, P., Donkers, H.H.L.M. (eds.) CG 2006. LNCS, vol. 4630, pp.
72–83. Springer, Heidelberg (2007)
4. Finnsson, H., Björnsson, Y.: Simulation-based approach to general game playing. In: Fox,
D., Gomes, C.P. (eds.) Proceedings of the Twenty-Third AAAI Conference on Artificial
Intelligence, AAAI 2008, pp. 259–264 (2008)
5. Gelly, S., Silver, D.: Achieving master level play in 9 x 9 computer Go. In: Fox, D.,
Gomes, C.P. (eds.) Proceedings of the Twenty-Third AAAI Conference on Artificial Intel-
ligence, AAAI 2008, pp. 1537–1540. AAAI Press, (2008)
6. Keith, T. (2006), Backgammon openings. Rollouts of opening moves.
http://www.bkgm.com/openings/rollouts.html accessed 26 Aug 2013
7. Lorentz, R.J.: Amazons discover monte-carlo. In: van den Herik, H.J., Xu, X., Ma, Z.,
Winands, M.H.M. (eds.) CG 2008. LNCS, vol. 5131, pp. 13–24. Springer, Heidelberg
(2008)
8. Papahristou, N., Refanidis, I.: On the Design and Training of Bots to Play Backgammon
Variants. In: Iliadis L., Maglogiannis I., Papadopoulos H. (eds) 8th IFIP WG 12.5 Artifi-
cial Intelligence Applications and Innovations (AIAI 2012), IFIP AICT, vol. 381, pp. 78--
87, (2012)
9. Papahristou, N., Refanidis, I.: Training Neural Networks to Play Backgammon Variants
Using Reinforcement Learning. In: Cecilia Di Chio et al. (eEds.) EvoApplications 2011.
LNCS, vol 6624, pp. 113--122, Springer, Heidelberg (2011)
10. Saito, J.-T., Chaslot, G., Uiterwijk, J.W.H.M., van den Herik, H.J.: Monte-carlo proof-
number search for computer Go. In: van den Herik, H.J., Ciancarini, P., Donkers,
H.H.L.M(J.) (eds.) CG 2006. LNCS, vol. 4630, pp. 50–61. Springer, Heidelberg (2007)
11. Sutton, R.S., Barto, A.G.: Reinforcement Learning: An Indroduction. MIT Press, (1998)
12. Tesauro, G.: Programming backgammon using self-teaching neural nets. Artificial Intelli-
gence, 134, pp. 181-199, (2002)
13. Winands, M.H.M., Björnsson, Y., Saito, J.-T.: Monte-carlo tree search solver. In: van den
Herik, H.J., Xu, X., Ma, Z., Winands, M.H.M. (eds.) CG 2008. LNCS, vol. 5131, pp. 25–
36. Springer, Heidelberg (2008)
14. Winands, M.H.M., Björnsson, Y.: Evaluation Function Based Monte-Carlo LOA. In: van
den Herik, H.J., Spronck, P. (eds.) ACG 2009. LNCS, vol. 6048, pp. 33–44. Springer,
Heidelberg (2010)

APPENDIX A: Precomputed Match Winning Chance (MWC)
tables for Tavli games
The following tables are calculated according to Section 5 and equation (2).
Table 4. MWC (%) for player A on Portes variant
A
away
MATCH WINNING CHANCE (MWC)
B
away 1 2 3 4 5 6 7 8 9
1 50.00 68.28 81.68 89.04 93.53 96.16 97.73 98.65 99.20 2 31.73 50.00 65.85 76.78 84.56 89.83 93.37 95.72 97.25 3 18.32 34.15 50.00 62.91 73.20 80.98 86.72 90.84 93.75 4 10.96 23.22 37.09 50.00 61.39 70.85 78.41 84.26 88.69 5 6.47 15.44 26.80 38.61 50.00 60.25 69.07 76.36 82.23 6 3.84 10.17 19.02 29.15 39.75 50.00 59.41 67.68 74.71 7 2.27 6.63 13.28 21.59 30.93 40.59 50.00 58.74 66.56 8 1.35 4.28 9.16 15.74 23.64 32.32 41.26 50.00 58.20 9 0.80 2.75 6.25 11.31 17.77 25.29 33.44 41.80 50.00
Table 5. MWC (%) for player A on Plakoto variant
A
away
MATCH WINNING CHANCE (MWC)
B
away 1 2 3 4 5 6 7 8 9
1 50.00 64.88 79.43 86.77 91.90 94.91 96.85 98.03 98.78 2 35.12 50.00 65.87 75.78 83.47 88.67 92.34 94.84 96.55 3 20.57 34.13 50.00 61.90 71.98 79.55 85.33 89.56 92.65 4 13.23 24.22 38.10 50.00 60.91 69.87 77.20 82.97 87.43 5 8.10 16.53 28.02 39.09 50.00 59.69 68.13 75.17 80.93 6 5.09 11.33 20.45 30.13 40.31 50.00 58.94 66.82 73.60 7 3.15 7.66 14.67 22.80 31.87 41.06 50.00 58.29 65.75 8 1.97 5.16 10.44 17.03 24.83 33.18 41.71 50.00 57.79 9 1.22 3.45 7.35 12.57 19.07 26.40 34.25 42.21 50.00
Table 6. MWC (%) for player A on Fevga variant
A
away
MATCH WINNING CHANCE (MWC)
B
away 1 2 3 4 5 6 7 8 9
1 50.00 71.43 84.18 91.18 95.09 97.27 98.48 99.15 99.53 2 28.57 50.00 66.69 78.37 86.25 91.39 94.68 96.74 98.02 3 15.82 33.31 50.00 63.91 74.72 82.70 88.39 92.33 95.00 4 8.82 21.63 36.09 50.00 62.19 72.20 80.03 85.93 90.26 5 4.91 13.75 25.28 37.81 50.00 60.98 70.32 77.92 83.88 6 2.73 8.61 17.30 27.80 39.02 50.00 60.07 68.85 76.19 7 1.52 5.32 11.61 19.97 29.68 39.93 50.00 59.35 67.65 8 0.85 3.26 7.67 14.07 22.08 31.15 40.65 50.00 58.77 9 0.47 1.98 5.00 9.74 16.12 23.81 32.35 41.23 50.00

APPENDIX B: Best move of all opening rolls per variant examined
PORTES PLAKOTO FEVGA ROLL BEST MOVE EQ BEST MOVE EQ BEST MOVE EQ
SINGLE ROLLS
21 24/23 13/11 0.006 24/22 24/23 0.042 24/21 -0.030
31 8/5 6/5 0.155 24/21 24/23 0.037 24/20 0.012
41 24/23 13/9 0.002 24/20 24/23 0.070 24/19 0.086
51 24/23 13/8 0.011 24/19 24/23 0.043 24/18 0.090
61 13/7 8/7 0.108 24/18 24/23 0.097 24/17 0.194
32 24/21 13/11 0.017 24/21 24/22 0.050 24/19 0.086
42 8/4 6/4 0.110 24/20 24/22 0.065 24/18 0.090
52 24/22 13/8 0.015 24/19 24/22 0.066 24/17 0.194
62 24/18 13/11 0.017 24/18 24/22 0.106 24/16 0.259
43 24/20 13/10 0.015 24/20 24/21 0.056 24/17 0.194
53 8/3 6/3 0.059 24/19 24/21 0.039 24/16 0.259
63 24/18 13/10 0.018 24/18 24/21 0.096 24/15 0.336
54 24/20 13/8 0.029 24/19 24/20 0.073 24/15 0.336
64 8/2 6/2 0.016 24/18 24/20 0.121 24/14 0.385
65 24/18 18/13 0.072 24/18 24/19 0.117 24/13 0.440
DOUBLE ROLLS
11 8/7 (2) 6/5(2) 0.213 24/23 (4) 0.129 24/20 0.012
22 13/11(2) 6/4(2) 0.240 24/20 24/22 (2) 0.137 24/16 0.259
33 8/5 (2) 6/3 (2) 0.259 24/18 24/21 (2) 0.187 24/15 0.336
44 24/20(2) 13/9(2) 0.348 24/16 (2) 0.247 24/16 0.259
55 13/8 (2) 8/3 (2) 0.160 24/14 24/19 (2) 0.361 24/9 24/19 0.831
66 24/18(2) 13/7(2) 0.398 24/12 (2) 0.521 24/18 0.090


