
Annual ReportOFFICE OF FOREIGN LABOR CERTIFICATION
EMPLOYMENT AND TRAINING ADMINISTRATIONUNITED STATES DEPARTMENT OF LABOR

“We help U.S. employers fill jobs while protecting U.S. and foreign workers”
–Office of Foreign Labor Certification’s Mission Statement

OFFICE OF FOREIGN LABOR CERTIFICATION
Table of Contents FOREWORD FROM THE ASSISTANT SECRETARY 1
INTRODUCTION 2
SUMMARY OF ALL OFLC PROGRAMS FY 2012 - 2015 4
PREVAILING WAGE DETERMINATION PROCESS 5
Prevailing Wage Process – Overview 6
Top 10 States for Prevailing Wage Determinations 8
Top 10 Occupations for Prevailing Wage Determinations 9
Top Occupations and Employers for Prevailing Wages 10
PERMANENT LABOR CERTIFICATION 11
Atlanta National Processing Center 12
Summary of the Permanent Labor Certification Program 13
Permanent Labor Certifications by Top Five NAICS Industry Codes 15
Occupations with More Than 1,000 Certifications 17
Top Five Occupations for Top Five Countries 18
Permanent Labor Certification By State and U.S. Territory 19
States with Most Certifications 20
Countries with over 1,000 Certifications 22
Twenty Five Employers with the Highest Number of Certifications 23
Education in the Permanent Labor Certification Program 25
TEMPORARY PROGRAMS 27
Chicago National Processing Center 28
Ombudsman Program 29
Summary of Temporary Labor Certification Programs 30
H-1B Temporary Specialty Worker Program- Overview 31
Top Three H-1B Occupations 32
Top 10 Employers for H-1B and the Top Occupations and Work States 33
States with More Than 5,000 Certified H-1B LCAs 34
E-3 Australian Temporary Specialty Worker Program 36
H-1B1 Temporary Specialty Worker Program 37
Education in H-1B - Overview 39
H-2A Temporary Labor Certification for Agricultural Workers 42
States with More Than 2,000 H-2A Certifications 43
Top 10 Employers with Most H-2A Certified Workers 44
H-2B Temporary Labor Certification for Non-Agricultural Workers 46
Employers with the Most H-2B Certifications 47
States with More than 2,500 H-2B Certified Positions 48
Top 10 H-2B Occupations 49
APPENDICES 50
Appendix A State Employment-Based Immigration Profiles 51
Appendix B Agricultural Certification Statistics 107
Appendix C Top Five Employment-Based Permanent Immigration Country Profiles 113


1 • OFFICE OF FOREIGN LABOR CERTIFICATION
Foreword from the Assistant Secretary Communities throughout the country are both realizing the benefits and facing the demands of the global economy. One of the constant challenges is identifying, educating, or attracting human talent, which is perhaps the most important element in remaining competitive. Big cities and small towns alike are looking for hard-working, talented individuals who will make their respective regions home. When able, willing, and qualified U.S. workers are not available locally, employers begin looking abroad.
The Office of Foreign Labor Certification (OFLC), which is located within Employment and Training Administration (ETA) at the Department of Labor (Department), has been delegated the responsibility outlined in the Immigration and Nationality Act (INA) for the Secretary of Labor to protect U.S. workers against adverse impact on their wages or working conditions by ensuring U.S. employer compliance with statutory requirements when they hire foreign workers to fill workforce shortages. The Department’s focus in these immigrant and nonimmigrant employment-based programs is to ensure the integrity of the process in order to protect U.S. workers and their ability to access jobs.
The INA sets the framework for the Secretary of Labor to follow in adjudicating employer labor certification and labor condition applications used in the D-1, E-3, H-1B, H-1B1, H-2A, H-2B and Permanent Labor Certification programs. The Secretary has delegated this responsibility to ETA. ETA, in coordination with the Department’s Office of the Assistant Secretary for Policy, the Office of the Solicitor, and the Wage and Hour Division, which oversees the INA’s corresponding enforcement provisions, develops the policies and procedures in the foreign labor certification programs that are then implemented by OFLC.
This report provides a glimpse at the Department’s role in supporting the dynamic U.S. economy through OFLC. This report presents employment-based foreign labor certification program data drawn from applications submitted to and adjudicated by the Department from employers who sought labor certifications in fiscal year 2015. An approved labor certification or labor condition application is often the first step in the process for many of the employment-based visa programs, both temporary and permanent, that enable employers to hire foreign workers where workforce needs cannot be fulfilled through the U.S. workforce. In FY 2015, OFLC processed 711,820 employer applications for 1,580,778 positions for temporary and permanent labor certifications. This represents almost a 20 percent increase in the overall number of processed applications from the previous year and a 23 percent increase in job opportunities.
Information found in this report can be utilized by employers, educators, and the public workforce system to learn about occupations and careers for which employers are seeking foreign talent. ETA remains committed to fulfilling the Department’s statutory mandate by protecting U.S. workers, while at the same time helping employers access needed talent.
Portia Wu Assistant Secretary Employment and Training Administration
Portia Wu

2 • 2015 ANNUAL REPORT
Introduction The Immigration and Nationality Act (INA) permits foreign workers to come to the United States to work on either a temporary or permanent basis. The Secretary of Labor (Secretary) plays a crucial role in the administration of certain employment-based visa programs in the INA. In recent years, employment-based immigration has represented approximately 16 percent of our Nation’s total documented permanent immigration and about 5 percent of the nonimmigrant entries.
Many of the employment-based nonimmigrant visa categories, as well as two of the employment-based immigrant visa preferences, require a labor certification, labor condition application, or attestation to be filed and approved by the Department of Labor (Department) before an employer may petition the Department of Homeland Security (DHS) for approval under a designated visa program and the would-be employee may then apply to the Department of State (DOS) for a visa.
The Secretary has two fundamental responsibilities outlined in the INA for virtually all of the nonimmigrant and immigrant visa programs administered by the Department. First, he must determine if there are any available, able, willing, and qualified U.S. workers in the area of intended employment. This is accomplished through a test of the labor market. Second, he must ensure that the admission of a foreign worker in the requested position will not have an adverse effect on the wages and working conditions of similarly employed U.S. workers.
The Secretary has delegated labor certification authority to the Employment and Training Administration’s Office of Foreign Labor Certification (OFLC). OFLC receives and adjudicates applications from employers seeking to hire and bring foreign workers as immigrants to the U.S. in permanent positions in visa preference categories that require labor certifications. OFLC also adjudicates applications in temporary nonimmigrant employment-based visa categories of H-1B, H-1B1 (Chile/Singapore), and E-3 (Australia) for professional and specialty occupations, H-2A for seasonal agricultural workers, H-2B for nonagricultural temporary workers, and D-1 for foreign longshore workers.
Employers must comply with all applicable laws and regulations relevant to the particular employment-based visa program under which they are applying. In most of the Department’s employment-based programs, employers must demonstrate that they have made efforts to recruit U.S. workers for the positions for which they are seeking foreign workers and guarantee that they will at least pay the required prevailing wage for the occupation in the area of intended employment.
Receiving a labor certification is only the beginning of the employment-based process to access an immigrant or nonimmigrant. The employer must then submit a petition to DHS’s U.S. Citizenship and Immigration Services, and the employee may need to apply to DOS for the issuance of a visa by which the worker enters the U.S. Each individual worker must meet admission standards and requirements listed in the INA. However, some visa categories have numerical limitations or caps set by Congress, which may restrict worker availability during certain times or seasons.
OFLC’s National Office is responsible for policy and program oversight of the non-enforcement responsibilities delegated to the Secretary under the INA. OFLC operates three National Processing Centers (NPCs) for the adjudication of applications. The one in Chicago, IL is responsible for adjudicating temporary nonimmigrant labor certification applications. The center in Atlanta, GA adjudicates permanent immigrant labor certification applications. The third center in Washington, DC processes requests for prevailing wage determinations (PWDs), which are required for applications in most OFLC programs.
The three NPCs are responsible for carrying out both operational and certain prescribed administrative functions. The administrative functions include providing help desk assistance from which employers and stakeholders can obtain specific case updates and general application information. Program operations are handled by directors, certifying officers, and analysts who together review and adjudicate applications submitted by employers, ensuring compliance with all applicable statutes, regulations and relevant case law. The administrative staff also handles Freedom of Information Act (FOIA) requests, data entry, case initiation, and IT functions.

3 • OFFICE OF FOREIGN LABOR CERTIFICATION
Most of OFLC’s application and determination processes are fully electronic in either the Department’s web-based ICERT Visa Portal System or the Permanent Electronic Review Management System (PERM) portal. The ICERT system contains the Prevailing Wage, Labor Condition Application (LCA; H-1B1/E-3), H-2A, and H-2B Modules, which allow employers to electronically prepare, submit, track, save, reuse, and/or withdraw H-2A, H-2B, and LCA applications or PWD requests, and request PWD redeterminations, through an accessible on-line account. These electronic submission systems are in compliance with the Government Paperwork Elimination Act and are part of the President’s e-Government initiative
OFLC Adjudications: 2015 In FY 2015, OFLC processed 711,820 employer applications for 1,580,778 positions for temporary and permanent labor certifications. All programs saw an increase in the number of applications adjudicated from FY 2014.
The National Prevailing Wage Center processed 152,702 PWD requests for use in the PERM, H-1B, H-1B1, E-3, and H-2B programs. This was an increase of 20,658 applications over the previous fiscal year, or 15.6 percent.
The Chicago NPC processed 10,339 applications for H-2A labor certification representing an increase of over 9 percent from the previous fiscal year for a total of 145,874 requested positions and 139,832 certified positions. The H-2B labor certification application adjudications in FY 2015, in which 6,521 applications were processed for 126,138 requested positions, were over 17 percent higher than for the previous fiscal year. H-1B applications saw a 19 percent increase in the number of determinations issued in FY 2015 over FY 2014. The Department processed 605,809 applications, certifying 1,173,149 positions.
In FY 2015, 89,151 permanent labor certification applications were adjudicated, a 25 percent increase from FY 2014, in which 70,998 applications were adjudicated.

4 • 2015 ANNUAL REPORT
Summary of All OFLCPrograms FY 2012 - 2015 Summary of Prevailing Wage Determinations FY 2012 thru 2015
VISA TYPE FY 2012 FY 2013 FY 2014 FY 2015
PERM 114,802 103,274 109,463 113,525
H-1B 12,606 8,225 6,967 6,091
H-2B 8,370 6,894 9,377 11,421
Total 135,778 118,393 125,807 131,037
Summary of All Labor Certification Programs FY 2012 thru 2015
VISA TYPE ACTIONS FY 2012 FY 2013 FY 2014 FY 2015
PERM
Determinations 66,488 44,149 70,998 89,151
Applications Certified 54,581 35,202 62,633 78,938
Positions Requested 66,488 44,149 70,998 89,151
Positions Certified 54,581 35,202 62,633 78,938
H-1B*
Determinations 408,038 433,586 508,674 605,809
Labor Condition Applications Certified 377,477 410,834 462,972 556,175
Positions Requested 940,812 984,184 978,608 1,219,615
Positions Certified 847,959 944,842 933,931 1,173,149
H-2A
Determinations 8,047 8,388 9,405 10,339
Applications Certified 7,845 8,118 9,152 9,962
Positions Requested 90,362 105,735 123,528 145,874
Positions Certified 85,248 98,821 116,689 139,832
H-2B
Determinations 4,211 4,710 5,464 6,521
Applications Certified 3,563 3,990 4,638 5,112
Positions Requested 94,538 98,402 107,719 126,138
Positions Certified 75,458 82,307 93,649 101,765
Total
Determinations 486,784 490,833 594,541 711,820
Applications Certified 443,466 458,144 539,395 650,187
Positions Requested 1,192,200 1,232,470 1,280,853 1,580,778
Positions Certified 1,063,246 1,161,172 1,206,902 1,493,684
*Does not Include data for E-3 and H-1B1.

1 Prevailing WageDetermination Process

6 • 2015 ANNUAL REPORT
Prevailing Wage Process – Overview The National Prevailing Wage Center (NPWC), in Washington, D.C., is responsible for determining prevailing wages for applications received in the temporary and permanent, non-agricultural foreign labor certification programs, including the PERM, H-1B, H-1B1, E-3, and H-2B programs. The purpose of the prevailing wage determination (PWD) process is to ensure job opportunities are offered to workers at a wage that will not adversely affect the wages or working conditions of similarly-employed U.S. workers. PERM and H-2B program applicants are required to obtain a PWD prior to filing their labor certification applications, while H-1B, H-1B1, and E-3 applicants may provide their own wage for their job opportunities, though they are strongly encouraged to take advantage of the “safe harbor” provided by reliance on a PWD issued by the NPWC. The PWD request process is almost entirely electronic, with nearly all applicants submitting their requests through the ICERT Visa Portal System (ICERT). Depending on the program, the PWD the NPWC issues may reflect the average wage of all similarly-employed workers in the occupation, the average wage of workers at the same skill level in the occupation, an agreed-upon collective bargaining wage, or the wage required by the McNamara-O’Hara Service Contract Act or the Davis-Bacon Act.
Prevailing Wage Determinations Issued The number of PWDs the NPWC issues does not reflect the actual number of labor certification or labor condition applications filed in the various foreign labor visa programs because a single PWD may be used once, more than once, or not at all. However, the number provides an indicator of interest in the programs for which the NPWC issues PWDs. In fiscal year (FY) 2015, the NPWC received a total of 152,884 PWD requests. Of those requests, the NPWC issued a total of 131,037 PWDs, a 4 percent increase over FY 2014. PWD requests in the PERM program accounted for the overwhelming bulk of applications, with the NPWC receiving 132,434 requests, which constitutes 87 percent of all requests. Of those requests, the NPWC issued a PWD for 113,728, which accounted for approximately 87 percent of all issued PWDs. The 13,757 requests in the H-2B temporary nonagricultural certification program made up the second largest share of applications. Of the 13,757 H-2B requests, the NPWC issued a PWD for 11,421, which constituted 8.7 percent of total determinations. The third largest share of determination requests was in the H-1B skilled, professional temporary worker program, for which the NPWC received 6,693 requests. Of these requests, the NPWC issued a PWD for 6,091, which made up roughly 4.6 percent of all determinations. In addition, the NPWC responded to 12,220 help desk inquiries in FY 2015.
Prevailing Wage Determinations Issued by Status CASE STATUS H-1B H-2B PERM
Determination Issued 6,005 11,206 111,758
Redetermination Review - Affirmed 52 168 882
Redetermination Review - Overturned - Modified 34 47 885
Total 6,091 11,421 113,525
Prevailing Wage Determination Issued by Quarter and Major Visa QUARTER H-1B H-2B PERM TOTAL
First Quarter 1,204 6,632 24,231 32,067
Second Quarter 1,685 2,279 29,617 33,581
Third Quarter 1,894 1,283 26,955 30,132
Fourth Quarter 1,308 1,227 32,722 35,257
Total 6,091 11,421 113,525 131,037

7 • OFFICE OF FOREIGN LABOR CERTIFICATION
Prevailing Wage Determinations Issued Based on Area of Intended Employment by State and U.S. Territory
STATE TOTAL ISSUED H-1B H-2B PERM
Alabama 643 58 122 463
Alaska 139 3 97 39
Arizona 1,318 48 205 1,065
Arkansas 399 16 130 253
California 29,299 415 234 28,650
Colorado 1,440 33 459 948
Connecticut 1,146 20 52 1,074
Delaware 515 37 54 424
District of Columbia 590 22 7 561
Florida 5,202 459 711 4,032
Georgia 3,156 186 231 2,739
Guam 112 - - 112
Hawaii 130 12 2 116
Idaho 250 5 64 181
Illinois 5,260 453 156 4,651
Indiana 1,009 217 71 721
Iowa 507 32 55 420
Kansas 558 169 78 311
Kentucky 472 89 78 305
Louisiana 735 28 391 316
Maine 534 16 423 95
Maryland 2,069 239 285 1,545
Massachusetts 5,109 230 1,009 3,870
Michigan 3,293 161 225 2,907
Minnesota 1,089 34 173 882
Mississippi 317 84 94 139
Missouri 1,128 41 239 848
Montana 150 13 95 42
STATE TOTAL ISSUED H-1B H-2B PERM
Nebraska 307 14 60 233
Nevada 296 10 43 243
New Hampshire 296 4 51 241
New Jersey 7,120 142 257 6,721
New Mexico 213 8 9 196
New York 10,069 250 465 9,354
North Carolina 2,529 355 275 1,899
North Dakota 408 45 243 120
Northern Mariana Islands 43 17 - 26
Ohio 2,130 198 372 1,560
Oklahoma 560 16 208 336
Oregon 897 17 38 842
Pennsylvania 3,032 99 575 2,358
Puerto Rico 96 14 3 79
Rhode Island 222 1 36 185
South Carolina 655 86 170 399
South Dakota 318 37 214 67
Tennessee 658 59 80 519
Texas 12,256 809 1,333 10,114
Utah 537 14 116 407
Vermont 212 1 82 129
Virgin Islands 3 - - 3
Virginia 3,868 93 376 3,399
Washington 4,999 167 105 4,727
West Virginia 152 61 14 77
Wisconsin 736 83 35 618
Wyoming 81 4 51 26

8 • 2015 ANNUAL REPORT
California
Texas
New York
New Jersey
Illinois
Florida
Massachusetts
Washington
Virginia
Michigan
H-1B
H-2B
PERM
0 5,000 10,000 15,000 20,000 25,000 30,000
Top 10 States for Prevailing Wage Determinations California, Texas, and New York were the three States with the most PWDs issued. The NPWC also issued the greatest number of PERM determinations to employers in these three states. Employers in California received 29,299 total PWDs in FY 2015, more than any other state, followed by Texas, for which the NPWC issued 12,256 PWDs, and New York, for which the NPWC issued 10,069.
Among employers intending to pursue temporary H-1B specialty worker visas, the greatest demand for PWDs appeared in Texas, Florida, California, and Illinois, with the NPWC issuing 809 PWDs for Texas employers, 459 in Florida, 453 in Illinois, and 415 in California. Texas, Massachusetts, Florida, and Pennsylvania employers topped the list of H-2B PWD recipients, with each state accounting for 1,333, 1,009, 711, and 575 PWDs, respectively.
Top 10 States for Wage Determinations by Major Visa Classifications STATE DETERMINATIONS H-1B H-2B PERM
California 29,299 415 234 28,650
Texas 12,256 809 1,333 10,114
New York 10,069 250 465 9,354
New Jersey 7,120 142 257 6,721
Illinois 5,260 453 156 4,651
Florida 5,202 459 711 4,032
Massachusetts 5,109 230 1,009 3,870
Washington 4,999 167 105 4,727
Virginia 3,868 93 376 3,399
Michigan 3,293 161 225 2,907

9 • OFFICE OF FOREIGN LABOR CERTIFICATION
Top 10 Occupations for PrevailingWage Determinations In FY 2015, as is typical, the most requested occupations were in computer-related occupations like Software Developers, Computer Systems Analysts, and Computer and Information Systems Managers.
Total Wage Determinations for the Top 10 Occupations OCCUPATION DETERMINATIONS AVERAGE HOURLY WAGE
Software Developers, Applications 30,599 $47.67
Computer Systems Analysts 8,224 $43.87
Software Developers, Systems Software 8,085 $53.55
Computer and Information Systems Managers 5,625 $71.20
Landscaping and Groundskeeping Workers 4,181 $12.29
Electronics Engineers, Except Computer 4,065 $48.80
Marketing Managers 3,272 $69.13
Accountants and Auditors 2,510 $34.87
Network and Computer Systems Administrators 2,012 $40.31
Financial Managers 1,934 $70.92
Average Wage for the Top 10 Occupations Computer and Information System Managers received the highest average hourly wage of the top 10 occupations at $71.20, an increase of $1.19 over FY 2014, while Financial Managers earned a similarly high average wage of $70.92 per hour. Landscaping and Groundskeeping Workers received the lowest average hourly wage of the top 10 occupations at $12.29, an increase of $1.01 over FY 2014.

10 • 2015 ANNUAL REPORT
Top Occupations and Employersfor Prevailing Wages The following computer-related occupations constituted over 40 percent of the total PWDs issued: Software Developers (Applications), with 30,599 PWDs issued at an average hourly wage of $47.67; Computer Systems Analysts, with 8,224 PWDs issued at an average hourly wage of $43.87; Software Developers (Systems Software), with 8,085 PWDs issued at an average hourly wage of $53.55; and Computer and Information Systems Managers, with 5,625 PWDs issued at an average hourly wage of $71.20. Of these occupations, Software Developers (Applications) was by far the most requested, accounting for just over 23 percent of all PWDs.
Among employers requesting workers in the PERM Program, the Microsoft Corporation; Deloitte Consulting, LLP; and Google, Inc. received the most PWDs in FY 2015. Each of these employers was among the top five employers for three of the top four occupations in FY 2015.
Top Five Employers in the Top Four Occupations Top 10 Occupations for Prevailing Wages TOP 4 OCCUPATIONS EMPLOYER
Microsoft Corporation
Software Developers, Applications
Deloitte Consulting LLP
Yahoo! Inc.
Google Inc.
Symantec Corporation
Deloitte Consulting LLP
Computer Systems Analysts
Google Inc.
Microsoft Corporation
Deloitte Touche LLP
Ernst Young U.S. LLP
Yahoo! Inc.
Software Developers, Systems Software
Oracle America Inc.
Intel Corporation
Qualcomm Technologies Inc.
Cisco Systems Inc.
Deloitte Consulting LLP
Computer and Information Systems
Google Inc.
Deloitte Touche LLP
Manages Microsoft Corporation
Cisco Systems Inc.
OCCUPATIONS DETERMINATIONS
Software Developers, Applications 30,599
Computer Systems Analysts 8,224
Software Developers, Systems Software 8,085
Computer and Information Systems Managers
5,625
Landscaping and Groundskeeping Workers 4,181
Electronics Engineers, Except Computer 4,065
Marketing Managers 3,272
Accountants and Auditors 2,510
Network and Computer Systems Administrators 2,012
Financial Managers 1,934

2 Permanent Labor Certification

12 • 2015 ANNUAL REPORT
Atlanta National Processing Center The National Processing Center in Atlanta, Georgia (Atlanta NPC) is responsible for processing applications received by OFLC for permanent labor certifications under the INA. The Atlanta NPC adjudicates applications for permanent employment-based immigration filed primarily through the Permanent Electronic Review Management (PERM) online submission system, which employers are encouraged, but not required, to use.
In addition to its adjudication of applications, the Atlanta NPC oversees supervised recruitment for those employers who are required to submit their recruitment plans and results to the Atlanta NPC. The Atlanta NPC staff also oversees PERM audits of employers as part of OFLC’s integrity measures and is responsible for preparing files for appeal to the Board of Alien Labor Certification Appeals.
In FY 2015, the Atlanta NPC processed an average of 1,714 applications per week, 7,429 applications per month, and 22,288 applications per quarter. In total, the Atlanta NPC certified 78,938 applications and denied 5,851 applications, and 4,362 applications were withdrawn, for a total of 89,151 applications processed during FY 2015. From the total number of applications processed at the Atlanta NPC in FY 2015, the Appeals unit received 3,209 appeals and processed 1,348 appeals.
The Atlanta NPC had 54,523 pending cases on October 1, 2014 and ended FY 2015 with 54,559 pending cases – only a .07 percent increase in pending caseload.

13 • OFFICE OF FOREIGN LABOR CERTIFICATION
Summary of the Permanent Labor Certification Program Under the permanent labor certification program, an employer seeking to hire a foreign worker to work as an immigrant in the U.S. submits an application for labor certification that, if granted, would certify to the Secretary of the Department of Homeland Security (DHS) that there are not sufficient U.S. workers who are able, willing, qualified, and available to perform the services sought, and that the employment of the foreign worker will not have an adverse impact on the wages and working conditions of similarly employed workers in the United States. An employer must obtain a labor certification from DOL before it can submit most types of immigrant visa petitions to the U.S. Citizenship and Immigration Services (USCIS), part of the DHS. The PERM labor certification process utilizes an electronic fillable application.
Prior to submitting an application to initiate the employment-based process in PERM (unless the employer has been placed in supervised recruitment) the employer must test of the labor market to determine whether U.S. workers are able, willing, qualified, and available for the job opportunity in the area where the job will be performed. The test involves mandatory and discretionary advertising at several levels. If there are no such U.S. workers, the employer may file an Application for Permanent Employment Certification with OFLC evidencing the recruitment efforts undertaken and other program information. These and other program-related conditions must be met prior to OFLC granting a permanent labor certification.
In FY 2015, employers filed 87,644 applications, a 17 percent increase from FY 2014 in which 74,936 applications were filed, and a 20 percent increase from FY 2013 in which 72,462 applications were filed.
Twenty-four States each had more than 500 permanent labor certifications in FY 2014. California, Texas, New Jersey, New York, and Illinois were the States with the greatest numbers of permanent labor certifications.

14 • 2015 ANNUAL REPORT
Permanent Labor Certifications by U.S. State and Territory
WORK STATE POSITIONS CERTIFIED
California 18,675
Texas 13,008
New Jersey 6,257
New York 6,098
Illinois 3,295
Washington 2,846
Massachusetts 2,656
Michigan 2,325
Virginia 2,264
Florida 2,161
Georgia 2,145
Pennsylvania 1,799
North Carolina 1,666
Ohio 1,414
Maryland 1,140
Oregon 1,023
Arizona 806
South Carolina 714
Connecticut 686
Minnesota 621
Colorado 615
Alabama 583
Missouri 568
Wisconsin 547
Indiana 471
District of Columbia 405
Tennessee 359
Kentucky 332
Delaware 308
WORK STATE POSITIONS CERTIFIED
Kansas 306
Iowa 303
Utah 299
Louisiana 282
Nebraska 249
New Hampshire 179
Oklahoma 170
Arkansas 154
New Mexico 152
Nevada 145
Rhode Island 128
Maine 103
Vermont 98
Idaho 90
Mississippi 89
Hawaii 74
North Dakota 71
South Dakota 52
Guam 51
West Virginia 46
Puerto Rico 31
Alaska 31
Montana 20
Wyoming 13
Virgin Islands 6
Marshall Islands 5
Northern Mariana Islands 3
Federated States of Micronesia 1
Total Positions Certified 78,938

15 • OFFICE OF FOREIGN LABOR CERTIFICATION
Permanent Labor Certifications by Top Five NAICS Industry Codes Most industries, as classified by the North American Industry Classification System (NAICS), experienced significant increases in the number of certifications sought in FY 2015. Together, the top five industries by NAICS code accounted for 82 percent of the total number of permanent labor certifications in FY 2015. The number of permanent labor certifications for occupations listed under the Professional, Scientific, and Technical Services industry accounted for 48 percent of all permanent labor certifications. This industry accounts for the largest number of certifications in the PERM program. The other industries rounding out the top five were Manufacturing (16.78%), Information (7.03%), Finance and Insurance (5.75%), and Educational Services (4.88%).
Top Five Industries by NAICS NAICS SECTOR INDUSTRY TITLE POSITIONS CERTIFIED PERCENT OF TOTAL CERTIFIED
54 Professional, Scientific, and Technical Services 37,669 47.72%
31-33 Manufacturing 13,245 16.78%
51 Information 5,549 7.03%
52 Finance and Insurance 4,539 5.75%
61 Educational Services 3,849 4.88%

16 • 2015 ANNUAL REPORT
Permanent Labor Certification by NAICS Code NAICS SECTOR INDUSTRY TITLE POSITIONS
CERTIFIED PERCENT OF TOTAL CERTIFIED
54 Professional, Scientific, and Technical Services 37,669 47.72%
31-33 Manufacturing 13,245 16.78%
51 Information 5,549 7.03%
52 Finance and Insurance 4,539 5.75%
61 Educational Services 3,849 4.88%
62 Health Care and Social Assistance 3,167 4.01%
44-45 Retail and Trade 2,987 3.78%
42 Wholesale Trade 1,669 2.11%
72 Accommodation and Food Service 1,416 1.79%
56 Administrative and Support and Waste Management and Remediation Services 1,074 1.36%
81 Other Services (Except Public Administration) 896 1.14%
23 Construction 609 0.77%
48-49 Transportation and Warehousing 468 0.59%
21 Mining 383 0.49%
55 Management of Companies and Enterprises 331 0.42%
53 Real Estate Rental and Leasing 273 0.35%
22 Utilities 268 0.34%
11 Agriculture, Forestry, Fishing and Hunting 218 0.28%
71 Arts, Entertainment, and Recreation 163 0.21%
92 Public Administration 122 0.15%
No classification 43 0.05%
Total Certified 78,938 100.00%

17 • OFFICE OF FOREIGN LABOR CERTIFICATION
Occupations with MoreThan 1,000 Certifications Employers apply for permanent labor certification in almost every occupational classification. The Department uses the Standard Occupational Classification (SOC) system developed for use by Federal statistical agencies. The occupations in the table below represent those in which more than 1,000 applications were certified in FY 2015. These occupations constitute approximately 59 percent of all permanent labor certifications granted in FY 2015. Of the occupations for which more than 1,000 positions were certified in FY 2015, Software Developers, Applications was the most requested occupation at 33.5 percent of the total positions certified.
Occupations with More Than 1,000 Permanent Labor Certifications SOC JOB TITLE TOTAL POSITIONS CERTIFIED AVERAGE WAGE OFFER
15-1132 Software Developers, Applications 26,465 $46.13
15-1121 Computer Systems Analysts 9,800 $40.18
15-1133 Software Developers, Systems Software 5,218 $52.76
17-2072 Electronics Engineers, Except Computer 3,024 $48.64
11-3021 Computer and Information Systems Managers 1,862 $65.03

18 • 2015 ANNUAL REPORT
Top Five Occupations for Top Five Countries The largest number of permanent labor certifications in FY 2015 was filed for foreign workers originating from India, China, South Korea, Canada, and the Philippines. Software Developers, Applications; Computer Systems Analysts; Software Developers, Systems Software, and Electronics Engineers comprised the majority of job opportunities certified by employers with foreign workers from India, China, and Canada. The most common occupations for foreign workers from Canada included Meat, Poultry, and Fish Cutters and Trimmers, Accountants and Auditors, and Market Research Analysts/Marketing Specialists. The most common occupations for foreign workers from the Philippines included Medical and Clinical Laboratory Technologists, Home Health Aides, and Occupational Therapists.
Top Five Occupations for the Top Five Countries of Origin
COUNTRY OCCUPATION POSITIONS CERTIFIED
TOTAL POSITIONS CERTIFIED IN COUNTRY
India
Software Developers, Applications 21,231
45,670 Computer Systems Analysts 8,732
Software Developers, Systems Software 3,615
Electronics Engineers, Except Computer 1,738
Computer and Information Systems Managers 1,360
China
Software Developers, Applications 1,624
6,411 Software Developers, Systems Software 639
Electronics Engineers, Except Computer 486
Statisticians 283
Accountants and Auditors 282
South Korea
Software Developers, Applications 580
4,895 Software Developers, Systems Software 181
Electronics Engineers, Except Computer 154
Computer Systems Analysts 114
Mechanical Engineers 100
Canada
Meat, Poultry, and Fish Cutters and Trimmers 643
2,962 Accountants and Auditors 204
Market Research Analysts and Marketing Specialists 170
Chefs and Head Cooks 159
Electronics Engineers, Except Computer 154
Philippines
Medical and Clinical Laboratory Technologists 161
1,509 Home Health Aides 138
Occupational Therapists 111
Software Developers, Applications 89
Accountants and Auditors 71

19 • OFFICE OF FOREIGN LABOR CERTIFICATION
Permanent Labor Certification By State and U.S. Territory In FY 2015, 16 states represented the primary work locations for more than 1,000 permanent labor certifications each. Texas, New Jersey, and New York each had more than 4,000 permanent labor certifications, and California had 18,675 permanent labor certifications.
States with More Than 1,000 Positions Certified
JOB INFO WORK STATE POSITIONS CERTIFIED
California 18,675
Texas 13,008
New Jersey 6,257
New York 6,098
Illinois 3,295
Washington 2,846
Massachusetts 2,656
Michigan 2,325
JOB INFO WORK STATE POSITIONS CERTIFIED
Virginia 2,264
Florida 2,161
Georgia 2,145
Pennsylvania 1,799
North Carolina 1,666
Ohio 1,414
Maryland 1,140
Oregon 1,023
FL
NC
GA
WA
CACA
NY
VA
MDOH
TX
PA
MI
NJ
IL
MA
OR

20 • 2015 ANNUAL REPORT
States with Most Certifications California, Texas, New Jersey, New York, and Illinois were the five states with the largest numbers of permanent labor certifications in FY 2015. Within the five states, the occupations with the highest demand in FY 2015 were all in Technology. California, with 18,675 certifications, received almost 24 percent of the total number of permanent labor certifications issued in FY 2015. California’s driving industry that received the most permanent labor certifications was Information Technology.
Five States with the Most Permanent Labor Certifications STATES TOTAL POSITIONS CERTIFIED PERCENT OF TOTAL CERTIFIED
California 18,675 23.66%
Texas 13,008 16.48%
New Jersey 6,257 7.93%
New York 6,098 7.73%
Illinois 3,295 4.17%
Total Certified 78,938
Top Occupations for the Top Five States
WORK STATE INDUSTRY PERM CERTIFIED APPLICATIONS
California Software Developers, Applications 5,643
Software Developers, Systems Software 3,446
Texas Software Developers, Applications 4,812
Computer Systems Analysts 4,072
New Jersey Software Developers, Applications 2,875
Computer Systems Analysts 1,357
New York Software Developers, Applications 1,454
Computer Systems Analysts 532
Illinois Software Developers, Applications 1,225
Computer Systems Analysts 363

21 • OFFICE OF FOREIGN LABOR CERTIFICATION
Top 10 Cities for Permanent Labor Certifications
STATE CITY TOTAL POSITIONS CERTIFIED
TOP EMPLOYERS TOTAL POSITIONS CERTIFIED
TOP OCCUPATION FOR THE TOP EMPLOYER IN CITY
TOTAL POSITIONS CERTIFIED
TX College Station 6435 Cognizant Technology Solutions U.S. Corporation 6,435 Computer Systems Analysts 3,408
NY New York 3971 Goldman Sachs & Co. 197 Software Developers, Applications 75
CA San Jose 2336 Cisco Systems Inc. 899 Software Developers, Systems Software 724
CA Mountain View 1750 Google Inc. 1,122 Software Developers, Applications 781
TX Houston 1731 Technip USA Inc. 56 Chemical or Mechanical Engineers 12
CA San Francisco 1511 Salesforcecom 137 Software Developers, Applications 86
CA Santa Clara 1390 Intel Corporation 249 Software Developers, Systems Software 128
CA San Diego 1242 Qualcomm Technologies Inc. 699 Electronics Engineers, Except Computer 360
CA Sunnyvale 1135 Yahoo! Inc. 198 Software Developers, Applications 89
WA Seattle 1121 Amazon Corporate LLC 752 Software Developers, Applications 501
College Station
New York
San Jose
Houston
Seattle
San Diego
San Francisco
Santa Clara Sunnyvale
Mountain View

Countries with over 1,000 Certifications In FY 2015, India remained the country of origin with the most certifications for foreign workers in the permanent labor certification program, and China remained the country of origin with the second highest number of permanent labor certifications. South Korea rounded out the top three countries with the greatest number of certified positions.
Workers from India represented approximately 58 percent of permanent labor certifications approved, while each of the other countries represented approximately 8 percent or less of certifications. The top five countries represented 78 percent of the total number of certifications in FY 2015.
Countries of Immigrant Origin (Citizenship) with More Than 1,000 Certified Positions PERCENT OF TOTAL POSITIONS COUNTRY OF CITIZENSHIP POSITIONS CERTIFIED CERTIFIED AVERAGE WAGE OFFER
INDIA 45,670 57.86% $46.29
CHINA 6,411 8.12% $41.40
SOUTH KOREA 4,895 6.20% $26.41
CANADA 2,962 3.75% $54.88
PHILIPPINES 1,509 1.91% $33.72
Total Certified 78,938
22 • 2015 ANNUAL REPORT

23 • OFFICE OF FOREIGN LABOR CERTIFICATION
Twenty Five Employers with theHighest Number of Certifications Cognizant Technology Solutions U.S. Corporation was the employer with the highest number of applications certified during FY 2015, with 7,079 applications. Cognizant Technology Solutions U.S. Corporation filed 37 percent of all applications filed by the top 25 employers. Many of the top 25 employers were technology or computer-related companies. The top three occupations for FY 2015 were Software Developers, Applications; Computer Systems Analysts; and Software Developers, Systems Software. Some of the other occupations certified for the top 25 employers were Electronics Engineers, Marketing Managers, and Accountants and Auditors.
Occupations Certified Most Often for the 25 Employers with the Highest Number of Certified Applications
EMPLOYER TOTAL POSITIONS CERTIFIED
TOP TWO OCCUPATIONS FOR EMPLOYER TOTAL POSITIONS CERTIFIED BY OCCUPATION FOR EACH EMPLOYER
Cognizant Technology Solutions U.S. Corporation 7,079
Computer Systems Analysts 3,997
Software Developers, Applications 2,977
Google Inc. 1,450 Software Developers, Applications 1,003
Software Developers, Systems Software 181
Intel Corporation 1,446 Electronics Engineers, Except Computer 573
Software Developers, Systems Software 433
Cisco Systems Inc. 1,028 Software Developers, Systems Software 779
Network and Computer Systems Administrators 55
Microsoft Corporation 923 Software Developers, Applications 714
Computer Systems Analysts 51
Qualcomm Technologies Inc. 876 Electronics Engineers, Except Computer 471
Software Developers, Systems Software 390
Amazon Corporate LLC 798 Software Developers, Applications 541
Marketing Managers 71
Oracle America Inc. 585 Software Developers, Systems Software 235
Software Developers, Applications 164
Apple Inc. 494
Software Developers, Applications 134
Electronics Engineers, Except Computer 100
Software Developers, Systems Software 100
Ernst Young U.S. LLP 416 Accountants and Auditors 135
Computer Systems Analysts 133
Facebook Inc. 389 Software Developers, Applications 287
Software Developers, Systems Software 20
House of Raeford Farms Inc. 327 Meat, Poultry, and Fish Cutters and Trimmers 325
Slaughterers and Meat Packers 2
Hcl America Inc. 307 Computer Systems Analysts 139
Software Developers, Applications 109
Deloitte Consulting LLP 285 Software Developers, Applications 114
Computer Systems Analysts 79

24 • 2015 ANNUAL REPORT
EMPLOYER
TOTAL POSITIONS CERTIFIED
TOP TWO OCCUPATIONS FOR EMPLOYER TOTAL POSITIONS CERTIFIED BY OCCUPATION FOR EACH EMPLOYER
Defender Services Inc. 267 Janitors and Cleaners, Except Maids and Housekeeping Cleaners 267
Koch Foods of Alabama LLC 261 Meat, Poultry, and Fish Cutters and Trimmers 261
Goldman Sachs Co. 253 Software Developers, Applications 253
Financial Analysts 50
JP Morgan Chase Co. 252 Software Developers, Applications 104
Computer Systems Analysts 31
Capgemini Financial Services USA Inc. 233 Software Developers, Applications 153
Computer and Information Systems Managers 61
Yahoo! Inc. 232 Software Developers, Applications 108
Software Developers, Systems Software 84
Igate Technologies Inc. 230 Software Developers, Applications 142
Software Developers, Systems Software 35
IBM Corporation 219 Software Developers, Applications 84
Computer Systems Analysts 76
Infosys Ltd. 216 Computer Systems Analysts 96
Software Developers, Applications 94
Case Farms Processing Inc. 208 Slaughterers and Meat Packers 168
Meat, Poultry, and Fish Cutters and Trimmers 40
Ericsson Inc. 198 Software Developers, Systems Software 51
Software Developers, Applications 23
Total 18,972

25 • OFFICE OF FOREIGN LABOR CERTIFICATION
Education in the Permanent Labor Certification Program Permanent labor certification applications from educational employers accounted for approximately 4.3 percent of the total positions certified in FY 2015, or 3,384 certifications granted. Education, Training, and Library occupations were the most sought positions by Educational employers, with these occupations constituting of 71.47 percent of the educational positions certified, or 2,683 permanent labor certifications. This wide occupational category includes occupations from pre-school, kindergarten, elementary school, middle school, secondary school, and special education teachers, to post-secondary teachers in their various specialty areas. It also includes teaching assistants, self-enrichment education teachers, librarians, curators, archivists, audio-visual and multimedia collections specialists, and instructional designers and coordinators.
In the occupational category with the next highest number of positions certified for educational employers, Computer and Mathematical Occupations, 219 positions were certified, constituting 5.83 percent of the total educational positions certified. Healthcare Practitioners and Technical Occupations constituted 5.67 percent; Management Occupations constituted 3.09 percent and Life, Physical, and Social Science Occupations constituted 1.89 percent, with all other occupations individually accounting for less than 1 percent of the positions certified for educational employers.
Top 10 Permanent Labor Education Certification by SOC Occupation Code
SOC CODE SOC OCCUPATION TOTAL POSITIONS CERTIFIED
PERCENT OF TOTAL EDUCATION POSITIONS CERTIFIED
25-0000 Education, Training, and Library Occupations 2,683 71.47%
15-0000 Computer and Mathematical Occupations 219 5.83%
29-0000 Healthcare Practitioners and Technical Occupations 213 5.67%
11-0000 Management Occupations 116 3.09%
19-0000 Life, Physical, and Social Science occupation 71 1.89%
17-0000 Community and Social Service Occupations 27 0.72%
13-0000 Architecture and Engineering Occupations 20 0.53%
27-0000 Arts Design, Entertainments, Sports, and Media 15 0.40%
21-0000 Business and Financial Operation Occupations 14 0.37%
43-0000 Office and Administrative Support 3 0.08%
Total Permanent Labor Education Positions Certified 3,384 4.29%
Total Permanent Labor Certification Positions Certified 78,938
In FY 2015, the states with the highest demand from educational employers each had over 100 certified positions. Texas, California, and New York were among those states experiencing the highest demand among educational employers in PERM in FY 2015, with 353 positions certified for Texas, 299 positions certified for California, and 280 positions certified for New York.

26 • 2015 ANNUAL REPORT
Top 10 States for Permanent Labor Education Certifications and Top Three Employers for Each State
STATE TOTAL POSITIONS CERTIFIED
EMPLOYER TOTAL POSITIONS CERTIFIED FOR THE EMPLOYER
Texas 353
Dallas Independent School District 89
Texas Tech University 27
Houston Independent School District 16
California 299
California State University 25
U.S. Army Defense Language Institute Foreign Language Center 21
Los Angeles Unified School District 20
New York 280
State University of New York 65
Borough of Manhattan Community College CUNY 51
Baruch College 14
Maryland 153
Baltimore City Public School System 96
University of Maryland 17
The Johns Hopkins University 13
Arizona 143
Apollo Education Group Inc. 32
The University of Arizona 19
Arizona State University 17
Pennsylvania 135
The Pennsylvania State University 24
University of Pennsylvania 14
Temple University 9
Illinois 133
University of Illinois 43
The University of Chicago 10
Illinois State University 8
Florida 127
University of Florida 22
University of Miami 15
Florida State University* 12
Ohio 121
The Ohio State University 21
The Ohio University 11
Kent State University* 8
Michigan 117
University Of Michigan 38
Michigan State University 26
Wayne State University 12
*Tied with another Employer.

Temporary Programs3

28 • 2015 ANNUAL REPORT
Chicago National Processing Center OFLC has two centers exclusively devoted to adjudicating applications for the Secretary of Labor under the INA and one center devoted to determining prevailing wages for employers wishing to hire foreign workers. The National Processing Center (Chicago NPC) in Chicago, Illinois is responsible for processing applications received by ETA from employers throughout the United States that seek temporary workers under the H-2A Agricultural Program, H-2B Non-agricultural Program, H-1B Specialty (Professional) Worker Program (including H-1B1 for Chile and Singapore and E-3 for Australia), and D-1 Crewmember (Longshore) Program.
On average in FY 2015, the Chicago NPC processed 2,146 applications per day, 10,276 applications per week, and 44,531 applications per month for H-2A, H-2B, H-1B, H-1B1, and E-3 programs combined. The Chicago NPC received on average 181 applications per week for the H-2A program, 105 applications per week for the H-2B program, and 9,990 applications per week for the H-1B, H-1B1, and E-3 programs. The Chicago NPC processed two D-1 applications in FY 2015.
Cross-trained analysts enable the Chicago NPC to be more flexible and meet processing goals, as does expanded use of electronic communication and filing capabilities. Direct electronic communications with employers are decreasing mailing costs and increasing efficiency. The help desk e-mail boxes received approximately 58,994 emails in FY 2015, which is higher than the previous year when the Center received over 28,127 help desk inquiries.

29 • OFFICE OF FOREIGN LABOR CERTIFICATION
Ombudsman Program The OFLC Ombudsman Program was created in February of 2012 to improve customer service and strengthen stakeholder confidence in OFLC case processing. The Ombudsman Program provides accessible and consistent service to OFLC stakeholders by conducting independent and impartial inquiries into issues related to the administration of the H-2A and H-2B temporary visa programs. The Ombudsman Program answers inquiries on a variety of topics. These include questions from agents and employers regarding case delays, procedural questions on issues such as wages, designation by the Wage and Hour Division as a foreign labor contractor, and inquiries about workers’ compensation and surety bonds. The Program also receives inquiries from advocate groups concerned with terms in job orders, alleged nonexistent corporations, recruitment practices, and the temporary nature of the work in an application. The Ombudsman Program also identifies areas in which employers and worker advocate organizations have concerns in dealing with the OFLC and proposes internal recommendations designed to continuously improve the quality of services provided by the OFLC. There is no fee for using the Ombudsman Program.
The Program receives most inquiries by e-mail; however stakeholders also contact the program by mail or fax. Complex issues were sometimes discussed by phone or in person. The Ombudsman Team initially responds to inquiries within one business day and has as its goal to resolve inquires within 15 days. The Program also conducts outreach regarding program or policy changes, such as website postings and e-mail updates to stakeholders.
The Ombudsman Team tracks all inquiries and follows the resolution of each question or concern, looking for patterns or notable problems to be overcome on a programmatic (rather than case-specific) basis.
Recommendations suggesting a program-wide process or policy change may also result from these inquiries and resulting review.
The Ombudsman’s services were most utilized by users of the H-2A program. The number of requests regarding the H-2A program was double those for the H-2B program. Inquiries from agents and attorneys comprised the majority of inquiries. The Ombudsman team’s time to resolve inquiries averaged three business days.

30 • 2015 ANNUAL REPORT
Summary of Temporary Labor Certification Programs The Department issues labor certifications for temporary employment under several nonimmigrant programs in which nonimmigrant workers cannot be admitted to work in the United States unless the employer possesses a valid labor certification or labor condition application. A valid labor certification indicates that the employment of a foreign worker will not adversely affect the wages and working conditions of workers in the United States who are similarly employed and that there are not sufficient U.S. workers to perform the work. OFLC’s nonimmigrant programs are H-1B Specialty (Professional) Worker Program; H-1B1 Specialty Worker Program (Chile and Singapore); E-3 Specialty Worker Program (Australia); H-2A (Agricultural) Program; H-2B (Non-Agricultural) Program; and the D-1 Crewmember (Longshore) Program.
OFLC data for FY 2015 shows a 19 percent increase in the number of H-1B applications (not including H-1B1 and E-3) adjudicated and a 20 percent increase in the number of applications certified. The number of positions requested increased by almost 20 percent and so did the number of H-1B positions certified, by 30 percent, in FY 2015.
In the H-2A program, there was more than 9 percent increase in the number of H-2A applications adjudicated and an almost 9 percent increase in the number of applications certified. The number of positions requested increased by 18 percent from FY 2014 to 145,874 positions. In the H-2B program, there were marked increases for the number of applications adjudicated and certified, by 19 and 10 percent, respectively. The number of positions certified for the H-2B program increased by almost 9 percent from FY 2014, to a total of 101,765.

31 • OFFICE OF FOREIGN LABOR CERTIFICATION
H-1B Temporary Specialty WorkerProgram- Overview By law, the H-1B program allows an employer to temporarily employ a foreign worker in the United States in a specialty occupation or as a fashion model of distinguished merit and ability. A specialty occupation requires the theoretical and practical application of a body of specialized knowledge and a bachelor’s degree or its equivalent in education and/or experience in the specialized discipline (e.g., Science, Medicine and Healthcare, Education, Biotechnology, and Business Specialties). Current law limits the number of foreign workers who may be issued a new H-1B visa to 65,000 each fiscal year, with certain exceptions, with an additional 20,000 visas designated for those possessing advanced degrees earned at U.S. institutions. A Labor Condition Application (LCA) is filed with OFLC for processing; OFLC reviews the document, which contains the employer’s attestations to its obligations in the H-1B program, for obvious errors and omissions and certifies the Department’s acceptance of the attestations.

32 • 2015 ANNUAL REPORT
Top Three H-1B Occupations FY 2015 data for OFLC indicated an increase in demand for job opportunities for H-1B workers who are educated and skilled in specialized occupations compared to 2014. There was a 20 percent increase in the number of H-1B positions requested and a 24.6 percent increase in the number of positions certified compared to FY 2014. As has been the case in previous years, the top three occupations for positions certified were all computer-related occupations, with Computer Systems Analysts representing over 28 percent of the total H-1B positions certified (332,229 positions) in FY 2015, which is more than twice as much as the next two combined.
Top Three Occupations for H-1B Certified Positions
TOP THREE OCCUPATIONS TOTAL H-1B APPLICATIONS CERTIFIED
TOTAL H-1B POSITIONS CERTIFIED
CERTIFIED APPLICATIONS AS % OF ALL H-1B APPLICATIONS
CERTIFIED POSITIONS AS % OF ALL CERTIFIED H-1B POSITIONS
Computer Systems Analysts 109,803 332,229 19.74% 27.24%
Software Developers, Applications 91,575 144,120 16.47% 11.82%
Computer Programmers 83,822 141,472 15.07% 11.60%
Total of Top Three Occupations 285,200 617,821 51.28% 50.66%
All Other Occupations 270,975 601,794 48.72% 49.34%
Total Overall Certifications 556,175 1,219,615
33 • OFFICE OF FOREIGN LABOR CERTIFICATION
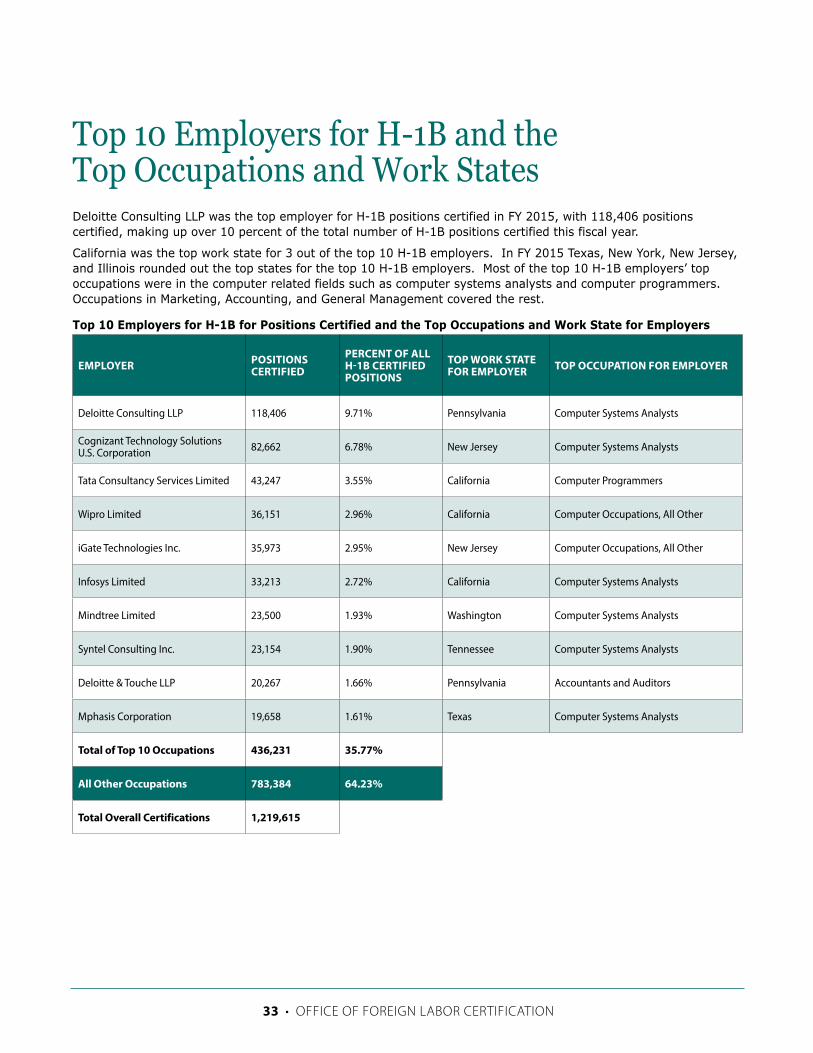
Top 10 Employers for H-1B and the Top Occupations and Work StatesDeloitte Consulting LLP was the top employer for H-1B positions certified in FY 2015, with 118,406 positions certified, making up over 10 percent of the total number of H-1B positions certified this fiscal year.
California was the top work state for 3 out of the top 10 H-1B employers. In FY 2015 Texas, New York, New Jersey, and Illinois rounded out the top states for the top 10 H-1B employers. Most of the top 10 H-1B employers’ top occupations were in the computer related fields such as computer systems analysts and computer programmers. Occupations in Marketing, Accounting, and General Management covered the rest.
Top 10 Employers for H-1B for Positions Certified and the Top Occupations and Work State for Employers
EMPLOYER POSITIONS CERTIFIED
PERCENT OF ALL H-1B CERTIFIED POSITIONS
TOP WORK STATE FOR EMPLOYER TOP OCCUPATION FOR EMPLOYER
Deloitte Consulting LLP 118,406 9.71% Pennsylvania Computer Systems Analysts
Cognizant Technology Solutions U.S. Corporation 82,662 6.78% New Jersey Computer Systems Analysts
Tata Consultancy Services Limited 43,247 3.55% California Computer Programmers
Wipro Limited 36,151 2.96% California Computer Occupations, All Other
iGate Technologies Inc. 35,973 2.95% New Jersey Computer Occupations, All Other
Infosys Limited 33,213 2.72% California Computer Systems Analysts
Mindtree Limited 23,500 1.93% Washington Computer Systems Analysts
Syntel Consulting Inc. 23,154 1.90% Tennessee Computer Systems Analysts
Deloitte & Touche LLP 20,267 1.66% Pennsylvania Accountants and Auditors
Mphasis Corporation 19,658 1.61% Texas Computer Systems Analysts
Total of Top 10 Occupations 436,231 35.77%
All Other Occupations 783,384 64.23%
Total Overall Certifications 1,219,615

34 • 2015 ANNUAL REPORT
States with More Than 5,000 Certified H-1B LCAs There were 21 States in which at least 5,000 certified Labor Conditions Applications (LCAs) were issued. California led the country in the most certified LCAs with over 18 percent of the total certified or 102,100. Colorado was 21st with 5,016. In addition to California, Texas, New York, New Jersey, and Illinois rounded out the top five and had just over 50 percent of the total certified LCAs. California increased its certified LCAs by 15,538 in FY 2015 over FY 2014; New Jersey increased by 10,330; Texas by 10,080; New York by 5,538; and Illinois by 5,254.
Trend of FY 2013 Top Five State Over the Fiscal Years 2012, 2013, 2014 & 2015 STATE FISCAL YEAR APPLICATIONS CERTIFIED POSITIONS CERTIFIED
California
FY 2012 68,927 144,823
FY 2013 77,633 172,393
FY 2014 86,562 172,318
FY 2015 102,100 208,689
Texas
FY2012 34,600 70,717
FY2013 39,569 75,563
FY 2014 46,342 84,612
FY 2015 56,422 106,745
New York
FY2012 38,464 80,058
FY2013 37,407 73,647
FY 2014 40,978 76,105
FY 2015 46,561 93,560
New Jersey
FY2012 25,870 56476
FY2013 28,142 62,008
FY 2014 34,036 65,505
FY 2015 44,366 85,602
Illinois
FY2012 20,740 47,913
FY2013 23,062 53,617
FY 2014 24,858 50,551
FY 2015 30,112 67,619
Total Top 5 States FY 2015 279,561 562,215
Total Overall FY 2015 556,175 1,219,615
Percent of Total FY 2015 50.26% 46.10%
35 • OFFICE OF FOREIGN LABOR CERTIFICATION
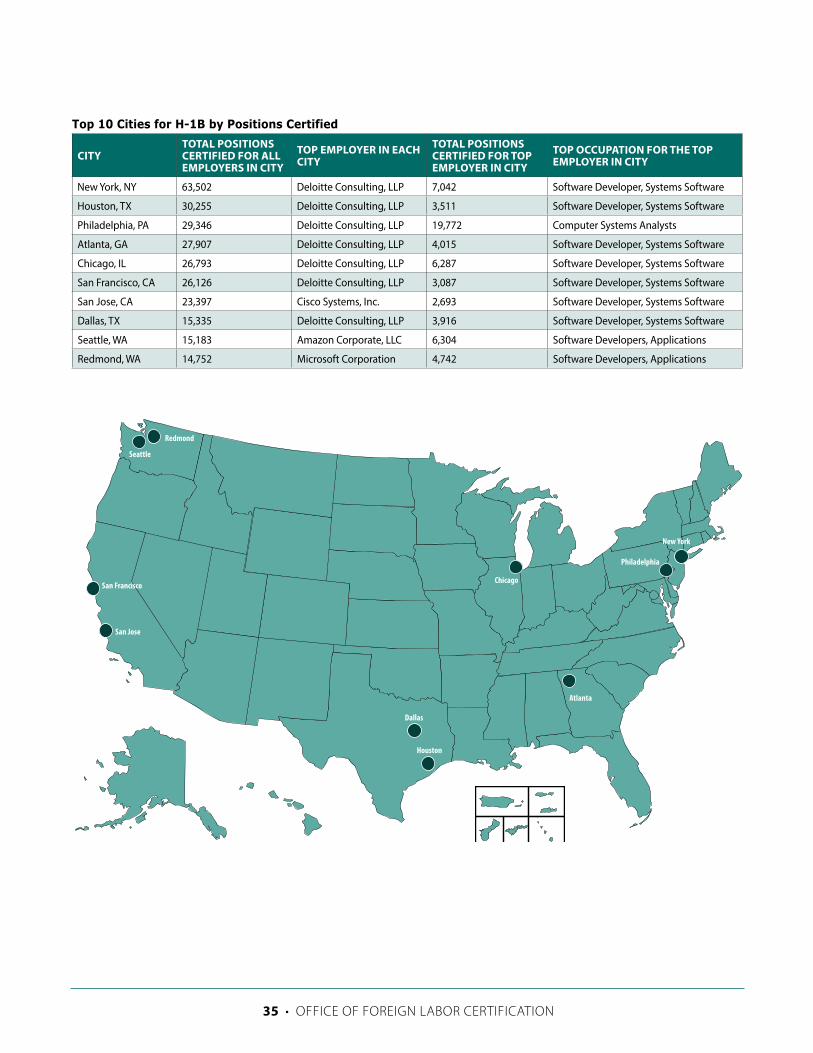
Top 10 Cities for H-1B by Positions Certified
CITY TOTAL POSITIONS CERTIFIED FOR ALL EMPLOYERS IN CITY
TOP EMPLOYER IN EACH CITY
TOTAL POSITIONS CERTIFIED FOR TOP EMPLOYER IN CITY
TOP OCCUPATION FOR THE TOP EMPLOYER IN CITY
New York, NY 63,502 Deloitte Consulting, LLP 7,042 Software Developer, Systems Software
Houston, TX 30,255 Deloitte Consulting, LLP 3,511 Software Developer, Systems Software
Philadelphia, PA 29,346 Deloitte Consulting, LLP 19,772 Computer Systems Analysts
Atlanta, GA 27,907 Deloitte Consulting, LLP 4,015 Software Developer, Systems Software
Chicago, IL 26,793 Deloitte Consulting, LLP 6,287 Software Developer, Systems Software
San Francisco, CA 26,126 Deloitte Consulting, LLP 3,087 Software Developer, Systems Software
San Jose, CA 23,397 Cisco Systems, Inc. 2,693 Software Developer, Systems Software
Dallas, TX 15,335 Deloitte Consulting, LLP 3,916 Software Developer, Systems Software
Seattle, WA 15,183 Amazon Corporate, LLC 6,304 Software Developers, Applications
Redmond, WA 14,752 Microsoft Corporation 4,742 Software Developers, Applications
New York
Seattle
Houston
Philadelphia
Atlanta
Chicago
San Jose
San Francisco
Dallas
Redmond

36 • 2015 ANNUAL REPORT
E-3 Australian Temporary SpecialtyWorker Program The Emergency Supplemental Appropriations Act for Defense, the Global War on Terror, and Tsunami Relief, 2005, P.L. 109-13, produced the E-3 Australia Specialty Worker Program. This program allows employers to temporarily employ foreign professionals from Australia to work in the United States.
Current law provides for 10,500 new visas each fiscal year for Australian nationals seeking temporary work in specialty occupations that require, at a minimum, a bachelor’s degree in the field of specialization. As with the H-1B and H-1B1 programs, an LCA is filed with OFLC. E-3 certification is valid for the period of employment indicated on the LCA, which may be up to two years. In FY 2015, 10,697 E-3 positions were certified from 9,328 applications. New York and California were the top work States for E-3 positions, each with well over 2,000 positions certified and together accounting for over 50 percent of the total E-3 positions certified in FY 2015. The top 10 occupations reflected on certified E-3 LCAs were Computer related occupations, business, management, and financial occupations.
Top Five States for E-3 Australia Positions Certified
STATE POSITIONS CERTIFIED PERCENTAGE OF ALL POSITIONS CERTIFIED FOR E-3
New York 3,372 31.52%
California 2,584 24.16%
Texas 715 6.68%
Washington 548 5.12%
Massachusetts 305 2.85%
Illinois 305 2.85%
Top 10 Occupations for E-3 Australia OCCUPATION APPLICATIONS CERTIFIED POSITIONS CERTIFIED
Software Developers, Applications 853 856
Financial Analysts Computer Systems Analysts 373 597
Accountants and Auditors 290 585
Computer Systems Analysts 500 569
Management Analysts 288 522
Market Research Analysts and Marketing Specialists 436 438
General and Operations Managers 361 364
Computer and Information Systems Managers 338 339
Computer Occupations, All Other 251 326
Computer Programmers 286 324
Total Top 10 E-3 Occupations 3,976 4,920
Total Overall E-3 9,328 10,697

37 • OFFICE OF FOREIGN LABOR CERTIFICATION
H-1B1 Temporary Specialty Worker Program On January 1, 2004, the H-1B1 Specialty Worker Program was implemented, allowing employers to temporarily employ foreign professionals from Chile and Singapore in the United States in specialty occupations. This program was established by the United States-Chile Free Trade Agreement Implementation Act (Public Law 108-77) and the United States-Singapore Free Trade Agreement Implementation Act (Public Law 108-78).
Current law provides for 1,400 new visas for foreign workers from Chile and 5,400 for foreign workers from Singapore each fiscal year. Similar to the H-1B and E-3 programs, an LCA is filed with OFLC. Like the H-1B certification, the H-1B1 certification is valid for the period of employment indicated on the LCA, which may be up to three years.
As defined by statute, a specialty occupation requires the theoretical and practical application of a body of specialized knowledge and a bachelor’s degree or the equivalent in the specific specialty (e.g., Science, Medicine and Healthcare, Education, Biotechnology, and Business Specialties). Both H-1B1 Chile and H-1B1 Singapore allow for alternative credentials for certain professions, including Disaster Relief Claims Adjuster and Management Consultant professionals from both countries. For Chilean nationals only, Agricultural Managers and Physical Therapists can also qualify with alternative requirements.
In FY 2015, OFLC certified 614 H-1B1 Chile applications. The top work States for H-1B1 Chile positions certified were California and Florida, each with more than 140 positions certified out of 641 positions certified. These two States accounted for almost 44 percent of the positions certified for the H-1B1 Chile program.
The top 10 occupations for the H-1B1 Chile program in FY 2015 varied widely and included computer related occupations, which made up more than 18 percent of all positions certified for the H-1B1 Chile program. Other non-computer related occupations included marketing, financial, and architectural occupations.
Top Five States for H-1B1 Chile Positions Certified
STATE POSITIONS CERTIFIED PERCENTAGE OF ALL POSITIONS CERTIFIED FOR H-1B1 CHILE
California 142 22.15%
Florida 141 22.00%
Washington 60 9.36%
New York 53 8.27%
New Jersey 42 6.55%
Top 10 Occupations for H-1B1 Chile OCCUPATION APPLICATIONS CERTIFIED POSITIONS CERTIFIED
Software Developers, Applications 92 92
Agricultural Inspectors 41 51
Market Research Analysts and Marketing Specialists 29 29
Financial Analysts 28 28
Management Analysts 19 19
Farmers, Ranchers, and Other Agricultural Managers 17 17
Food Scientists and Technologists 15 15
Marketing Managers 13 13
General and Operations Manager 13 13
Computer Programmers 13 13
Software Developers, Systems Software 13 13
Total Top 10 H-1B1 Chile Occupations 293 303
Total Overall H-1B1 Chile 614 641

38 • 2015 ANNUAL REPORT
In FY 2015, OFLC certified 938 H-1B1 Singapore applications. California and New York had the largest number of positions certified in the H-1B1 Singapore program, each with over 300 certified positions representing about 54 percent of the 1,199 H-1B1 Singapore positions certified in FY 2015.
In FY 2015, the most common occupations for certified H-1B1 Singapore positions were computer-related, followed by Accountants and Auditors, management, marketing, financial, and engineering occupations.
Top Five States for H-1B1 Singapore Positions Certified
STATE POSITIONS CERTIFIED PERCENTAGE OF ALL POSITIONS CERTIFIED FOR H-1B1 SINGAPORE
California 347 28.94%
New York 305 25.44%
Texas 96 8.01%
Washington 65 5.42%
Illinois 65 5.42%
Top 10 Occupations for H-1B1 Singapore OCCUPATION APPLICATIONS CERTIFIED POSITIONS CERTIFIED
Accountants and Auditors 90 213
Financial Analysts 66 136
Software Developers, Applications 112 112
Computer Systems Analysts 64 78
Management Analysts 58 72
Market Research Analysts and Marketing Specialists 56 56
Computer Occupations, All Other 26 26
Electronics Engineers, Except Computer 10 24
Marketing Managers 22 22
Mechanical Engineers 21 21
Industrial Engineers 9 21
Operations Research Analysts 21 21
Total Top 10 H-1B1 Singapore Occupations 555 802
Total Overall H-1B1 Singapore 938 1,199

39 • OFFICE OF FOREIGN LABOR CERTIFICATION
Education in H-1B - OverviewIn FY 2015, H-1B labor condition applications from educational employers accounted for 2.6 percent of the total positions certified. Over 75 percent of the positions certified for educational employers in FY 2015 were requested by colleges and universities, almost 18 percent were requested by elementary and secondary schools and more than half of one percent by junior colleges.
Educational employers continued to primarily seek positions in Education, Training, and Library occupations, with this occupational category constituting almost 47 percent of the positions certified, which was slightly lower than last year. This occupational category includes pre-school, kindergarten, elementary school, middle school, secondary school, and special education teachers, post-secondary teachers in their various specialty areas, teaching assistants, self-enrichment education teachers, librarians, curators, archivists, audio-visual and multimedia collections specialists, and instructional designers and coordinators.
Life, Physical, and Social Science continued to be the next most sought occupational category, maintaining just fewer than 29 percent average of the positions certified for educational employers. Healthcare Practitioners and Technical occupations, Computer and Mathematical Operations occupations, and Architecture and Engineering occupations each maintained 3 to 7 percent of the other positions certified for educational employers. The remaining occupations individually accounted for 2 percent or less each for the positions certified for educational employers.
H-1B Education Certifications, by Type and Institution
254
5,352 Junior Colleges
Elementary and Secondary Schools
22,795 Colleges, Universities and Professional Schools
Total H-1B Education Position Certi�ed: 30,292

40 • 2015 ANNUAL REPORT
1,000,000
80,0000
600,000
400,000
1,142,857 1,173,149
30,292
Thou
sand
s 200,000
0
Total H1-B Education Total Non-Education Total H-1B Position Certified Certifications Positions Certified
1,200,000
In FY 2015, the States with the highest demand from educational employers each had at least 3000 certified positions. New York, Texas, and California saw the highest demand from educational employers in FY 2015. Even though New York has had the most positions certified with 3,917, still showed another steep decrease in annual positions certified for the State since its peak in FY 2012 when it had 10,933 positions certified. The New York City Department of Education, which seems to account for most of the fluctuations in the numbers, was responsible for more than 34 percent of all the positions certified. In New York, Maryland, and Michigan the top three educational employers in each State received over half of the total positions certified for educational employers in that State.
H-1B Education Certifications Compared to All H-1B Certifications
H-1B Education Certifications by SOC Occupation Code
SOC CODE SOC CODE OCCUPATION WITH EDUCATION OCCUPATIONS
TOTAL POSITIONS CERTIFIED
PERCENT OF TOTAL EDUCATION POSITIONS CERTIFIED
25-0000 Education, Training, and Library Occupations 14,191 46.85%
19-0000 Life, Physical, and Social Science occupation 8,628 28.48%
15-0000 Computer and Mathematical Occupations 2,076 6.85%
29-0000 Healthcare Practitioners and Technical Occupations 2,212 7.30%
17-0000 Architecture and Engineering Occupations 1,007 3.32%
11-0000 Management Occupations 670 2.21%
13-0000 Business and Financial Operation Occupations 631 2.08%
27-0000 Arts Design, Entertainments, Sports, and Media 414 1.37%
21-0000 Community and Social Service Occupations 314 1.04%
39-0000 Personal Care and Service Occupations 35 0.12%
43-0000 Office and administrative Support 73 0.24%
23-0000 Legal 20 0.07%
31-0000 Health Care Support 13 0.04%
41-0000 Sales and Related 4 0.01%
49-0000 Transportation and Warehousing 2 0.01%
51-0000 Information 1 0.00%
53-0000 Real Estate and Rental and Leasing 1 0.00%
Total H-1B Education Position Certified 30,292
Total H-1B Positions Certified 1,173,149
Percent of H-1B Education Positions Certified 2.6%

41 • OFFICE OF FOREIGN LABOR CERTIFICATION
Top 10 States for H-1B Education Certifications and Top Three Employers for Each State
STATE POSITIONS CERTIFIED BY STATE
TOP THREE STATE EMPLOYERS TOTAL POSITIONS CERTIFIED BY EMPLOYER IN CORRESPONDING STATE
New York 3,917
New York City Department of Education 1,347
Columbia University 203
New York University 176
Texas 3,359
Dallas Independent School District 262
Baylor College of Medicine 262
The University of Texas MD Anderson Cancer Center 174
California 3,237
The Board of Trustees of the Leland Stanford Junior University 284
University of California, San Francisco 192
University of California, Los Angeles 177
Pennsylvania 1,310
Trustees of the University of Pennsylvania 240
University of Pittsburgh 200
The Pennsylvania State University 145
Massachusetts 1,195
Harvard University 244
Massachusetts Institute of Technology 162
Trustees of Boston University 90
Illinois 1,062
The University of Chicago 188
Northwestern University 177
University of Illinois at Chicago 166
Maryland 1,003
John Hopkins University 344
Baltimore City Public Schools 204
University of Maryland College Park 148
Georgia 940
Emory University 210
The University of Georgia 93
Georgia Institute of Technology 85
Florida 934
University of Florida 202
University of Miami-Miller School of Medicine 78
The Florida State University 72
Michigan 889
University of Michigan 424
Michigan State University 140
Wayne State University 71

42 • 2015 ANNUAL REPORT
H-2A Temporary Labor Certification for Agricultural Workers The H-2A nonimmigrant program is designed to provide our Nation’s farms with short-term agricultural labor when the number of available domestic workers is insufficient. H-2A labor certification is generally granted for activities lasting 10 months or less. Most occupations (e.g., field hand) require unskilled or low-skilled labor, while a few (e.g., combine operators) require specialized skills. There is no yearly limit (cap) on the number of foreign workers who may be issued H-2A visas. An employer seeking to employ agricultural workers under the H-2A program files an H-2A Application for Temporary Employment Certification with OFLC and performs recruitment activities to conduct a test of the labor market for U.S. workers subsequent to the filing of the application.
In FY 2015, OFLC certified 139,832 positions. There was an increase of 18 percent in the number of positions requested for H-2A job opportunities and an increase of almost 9 percent in the number of H-2A temporary employment certification applications certified in FY 2015 over FY 2014.
Summary of H-2A Specialty Occupations Program VISA TYPE ACTIONS FY 2012 FY 2013 FY 2014 FY 2015 % CHANGE
H-2A
Determinations 8,047 8,388 9,405 10,339 9.93%
Labor Certification Applications Certified 7,845 8,118 9,152 9,962 8.85%
Positions Requested 90,362 105,735 123,528 145,874 18.09%
Positions Certified 85,248 98,821 116,689 139,832 19.83%

43 • OFFICE OF FOREIGN LABOR CERTIFICATION
States with More Than 2,000 H-2A Certifications In FY 2015, employers applied for 145,874 agricultural labor positions, and OFLC certified 139,832. This represented an 18 percent increase in requested positions and an almost 20 percent increase in positions certified in FY 2015 over the previous fiscal year.
OFLC certified over 2,000 positions for work in 17 States. Of these States, Florida, North Carolina, Georgia, Washington, California, Louisiana, Kentucky, and New York had the greatest demand, with over 5,000 positions certified for each State. After eight consecutive years, North Carolina is no longer the top state for H-2A positions certified. This year, Florida is the new top state for H-2A positions certified with 17,942 certified positions.
Top 25 H-2A Crops and Occupations Certified States with More Than 2,000 Positions Certified PRIMARY CROPS/OCCUPATIONS POSITIONS CERTIFIED
Tobacco 14,544
Berries 12,520
Apples 7,507
Hay and Straw 6,989
Oranges 5,882
Melons 5,843
Nursery and Greenhouse Workers 5,109
Agricultural Equipment Operators 4,974
Fruits and Vegetables 4,639
Onions 4,610
Sweet Potatoes 4,398
Lettuce 4,300
Livestock 3,738
Cucumbers 3,696
Squash 3,468
Corn 3,426
Sugarcane 3,403
General Farm Workers 3,393
Tomatoes 2,894
Trees 2,783
Pears 2,735
Grains 2,579
Peaches 2,493
Peppers 2,193
Construction of Livestock Buildings 1,969
All Others 19,747
EMPLOYER LOCATIONS POSITIONS CERTIFIED
Florida 17,942
North Carolina 17,696
Georgia 14,393
Washington 11,844
California 8,591
Louisiana 7,787
Kentucky 6,722
New York 5,039
Arizona 3,763
South Carolina 3,594
Virginia 3,347
Mississippi 3,325
Tennessee 2,983
Texas 2,856
Arkansas 2,552
Idaho 2,356
Michigan 2,226

44 • 2015 ANNUAL REPORT
Top 10 Employers with MostH-2A Certified Workers In FY 2015, the North Carolina Growers Association, Inc. was the largest requestor of H-2A workers, having 11,767 certified positions and accounting for 66 percent of North Carolina’s H-2A positions. The next largest petitioner was the Washington Farm Labor Association with 7,895 certified positions and accounting for almost 67 percent of Washington’s H-2A positions. Fresh Harvest, Inc. is the third largest petitioner with 3,176 certified positions and accounting for nearly 37 percent of Washington’s H-2A positions.
Top 10 Employers with the Most H-2A Certified Workers EMPLOYERS POSITIONS CERTIFIED
North Carolina Growers Association 11,767
Washington Farm Labor Association 7,895
Fresh Harvest, Inc. 3,176
Zirkle Fruit Company 2,889
Rodrigo Gutierrez-Tapia 2,308
Virginia Agricultural Growers Associations 1,626
R & R Harvesting, Inc. 1,578
Peri & Sons Farms, Inc. 1,565
H2A Complete II, Inc. 1,533
Sierra Cascade Nursery, Inc. 1,305
Top 10 Cities for H-2A
CITY TOTAL POSITIONS CERTIFIED FOR ALL EMPLOYERS IN CITY TOP EMPLOYER IN EACH CITY TOTAL POSITIONS CERTIFIED
FOR TOP EMPLOYER IN CITY
Vass, NC 11,733 North Carolina Growers Association 11,733
Arcadia, FL 2,410 H2A Complete II, Inc. 468
Prosser, WA 2,264 Zirkle Fruit Company 2,264
Yuma, AZ 2,255 Foothills Packing, Inc. 853
Brewster, WA 1,868 Washington Farm Labor Association 1,868
Yerington, NV 1,835 Peri & Sons Farms, Inc. 1,565
Plant City, FL 1,730 Temp Labor, LLC 649
Lyons, GA 1,686 Joel A. Salgado 368
Lake Park, GA 1,486 Tycor Farms, LLC 410
Winter Haven, FL 836 Overlook Harvesting Company 725

45 • OFFICE OF FOREIGN LABOR CERTIFICATION
All States Ranked by Number of H-2A Positions Certified
STATE POSITIONS CERTIFIED
Florida 17,942
North Carolina 17,696
Georgia 14,393
Washington 11,844
California 8,591
Louisiana 7,787
Kentucky 6,722
New York 5,039
Arizona 3,763
South Carolina 3,594
Virginia 3,347
Mississippi 3,325
Tennessee 2,983
Texas 2,856
Arkansas 2,552
Idaho 2,356
Michigan 2,226
Nevada 1,940
Colorado 1,717
Iowa 1,361
North Dakota 1,340
Indiana 1,266
Minnesota 1,177
Ohio 1,027
Missouri 839
STATE POSITIONS CERTIFIED
Illinois 809
New Jersey 806
Utah 790
Pennsylvania 777
Kansas 773
South Dakota 751
Alabama 735
Nebraska 703
Maine 666
Maryland 657
Montana 614
Oregon 575
Vermont 507
Oklahoma 501
Connecticut 478
Massachusetts 459
Wisconsin 448
Wyoming 326
New Mexico 244
Delaware 231
New Hampshire 166
West Virginia 72
Hawaii 40
Alaska 15
Rhode Island 6

46 • 2015 ANNUAL REPORT
H-2B Temporary Labor Certification for Non-Agricultural Workers The H-2B nonimmigrant program provides an avenue for employers to hire foreign workers to perform temporary, nonagricultural services or labor on a one-time, seasonal, peakload, or intermittent basis. Under the regulations applicable in the first two quarters of 2015, the employer’s seasonable, peakload, or intermittent labor need must have been 10 months or less. Under the 2015 Interim Final Rule, applicable in the third and fourth quarters of FY 2015, the employer’s seasonal, peakload, or intermittent labor need must have been nine months or less. Under both rules, an employer’s need for labor resulting from a one-time occurrence could equal three years or less. H-2B occupations range across industries, including landscaping services, seafood processors, mobile carnivals, construction, housekeeping, hospitality, and forestry.
In FY 2015, OFLC rendered 6,521 total application determinations, which constitutes a 19.3 percent increase over FY 2014. Of those determinations, 5,112 were decisions to certify the application, an increase of 10.22 percent over FY 2014. Applicants requested OFLC certify a total of 126,138 positions, a 17.10 percent increase over FY 2014. Of those requested positions, OFLC certified 101,765, an 8.67 percent increase over FY 2014. OFLC’s final certification rate for requested positions was approximately 81 percent.
Summary of H-2B Temporary Labor Certification Program
VISA TYPE ACTIONS FY 2012 FY 2013 FY 2014 FY 2015 % CHANGE
H-2B
Determinations 4,211 4,710 5,464 6,521 19.34%
Labor Certification Applications Certified 3,563 3,990 4,638 5,112 10.22%
Positions Requested 94,538 98,402 107,719 126,138 17.10%
Positions Certified 75,458 82,307 93,649 101,765 8.67%

47 • OFFICE OF FOREIGN LABOR CERTIFICATION
Employers with the Most H-2B Certifications The employer with the most certified positions was TruGreen Landcare, which had 1,319 Landscaping and Groundskeeping Worker positions certified. Rounding out the top five employers by number of positions certified were Silver Bay Seafoods, LLC; Superior Forestry Service, Inc.; Alpha Services, LLC; and The Brickman Group, Ltd., LLC For these employers, OFLC certified 959 Seafood Cutters and Trimmers, 947 Forest and Conservation Workers, 883 Forest and Conservation Workers, and 872 Landscaping and Groundskeeping Workers, respectively.
Employers with the Most H-2B Certified Workers
EMPLOYER NAME POSITIONS CERTIFIED BY EMPLOYER TOP OCCUPATIONS POSITIONS CERTIFIED IN
OCCUPATION BY EMPLOYER
TruGreen Landcare 1,319 Landscaping and Groundskeeping Worker 1,319
Silver Bay Seafoods, LLC 959 Cutters and Trimmers, Hand 959
Superior Forestry Service, Inc. 947 Forest and Conservation Workers 947
Alpha Services, LLC 883 Forest and Conservation Workers 883
The Brickman Group, Ltd., LLC 872 Landscaping and Groundskeeping Worker 872

48 • 2015 ANNUAL REPORT
States with More than 2,500 H-2B Certified Positions Fifteen States had over 2,500 positions certified during the fiscal year. For the fourth consecutive year, the highest number of applications and positions certified originated in Texas, most commonly for Landscaping and Groundskeeping Workers in cities like Austin, Houston, San Antonio, and Dallas. Florida, Colorado, Louisiana, and Maryland constituted the remainder of the top five, with 301, 214, 213, and 188 applications certified, respectively. OFLC certified a total of 6,847 positions for Florida; 4,861 for Colorado; 4,660 for Louisiana; and 4,586 for Maryland.
States with More Than 2,500 H-2B Certified Positions
STATE
FY 2012 FY 2013 FY 2014 FY 2015
Applications Certified
Positions Certified
Applications Certified
Positions Certified
Applications Certified
Positions Certified
Applications Certified
Positions Certified
Texas 392 10,638 445 11,416 529 14,517 593 15,075
Florida 198 4,837 236 5,792 275 6,512 301 6,847
Colorado 204 3,226 222 3,359 182 3,701 214 4,861
Louisiana 176 4,757 172 3,862 209 4,888 213 4,660
Maryland 133 3,674 142 3,348 156 3,828 188 4,586
Pennsylvania 144 3,075 142 2,992 239 3,722 251 3,659
Virginia 293 3,233 296 3,159 156 3,417 159 3,484
North Carolina 127 3,539 164 4,490 114 3,245 123 3,412
New York 245 2,592 251 2,506 328 3,218 332 3,263
Arkansas 37 2,157 40 1,698 50 2,684 54 2,810
New Jersey 151 2,319 177 2,517 182 2,604 176 2,764
Massachusetts 87 2,188 98 2,714 285 2,798 309 2,761
California 79 1,573 110 2,411 129 2,709 136 2,754
Georgia 38 1,085 43 1,818 49 1,779 71 2,737
Missouri 91 1,783 124 2,246 135 2,397 149 2,671

49 • OFFICE OF FOREIGN LABOR CERTIFICATION
Top 10 H-2B Occupations The most frequently requested H-2B occupation in FY 2015, as in FY 2014, was Landscaping and Groundskeeping Worker, representing 41 percent of all H-2B positions certified in FY 2015. The next occupation with the greatest number of certified positions, Forest and Conservation Workers, accounted for eight percent of certified positions.
Top 10 H-2B Certified Occupations
OCCUPATIONAL TITLE APPLICATIONS CERTIFIED POSITIONS CERTIFIED AVERAGE ANNUAL
WAGE
Landscaping and Groundskeeping Workers 2,084 42,104 $25,585.07
Forest and Conservation Workers 120 8,409 $23,518.86
Amusement and Recreation Attendants 228 6,906 $18,689.16
Maids and Housekeeping Cleaners 374 6,667 $21,858.80
Construction Laborers 182 3,619 $27,043.54
Meat, Poultry, and Fish Cutters and Trimmers 81 2,822 $20,441.40
Waiters and Waitresses 127 2,062 $22,448.44
Packers and Packagers, Hand 45 1,659 $20,718.73
Cooks, Restaurant 154 1,539 $25,132.34
Nonfarm Animal Caretakers 169 1,513 $24,557.54
Top 10 Employer Cities for H-2B By Positions Certified
CITY
TOTAL POSITIONS CERTIFIED FOR ALL EMPLOYERS IN CITY
TOP EMPLOYER IN EACH CITY
TOTAL POSITIONS CERTIFIED FOR TOP EMPLOYER IN CITY
TOP OCCUPATION FOR THE TOP EMPLOYER IN CITY
Austin, TX 1,920 Benchmark Landscapes, Inc. 446 Landscaping and Groundskeeping Workers
Houston, TX 1,412 Bio Landscape and Maintenance, Inc. 320 Landscaping and Groundskeeping Workers
Mackinac Island, MI 975 Grand Hotel, LLC 522 Food Preparation Workers
Sitka, AK 960 Silver Bay Seafoods, LLC 959 Cutters and Trimmers, Hand
San Antonio, TX 957 Maldonado Nursery & Landscaping, Inc. 235 Landscaping and Groundskeeping Workers
Tilly, AR 947 Superior Forestry Service, Inc. 947 Forest and Conservation Workers
Dallas, TX 929 Precision Landscape Management, LP 201 Landscaping and Groundskeeping Workers
Phoenix, AZ 906 ELS Maintenance, Inc. 115 Landscaping and Groundskeeping Workers
Rockville, MD 897 The Brickman Group, Ltd., LLC 872 Landscaping and Groundskeeping Workers
Lincoln, NE 845 Landscaping and Groundkeeping Workers 745 Landscaping and Groundskeeping Workers

4 Appendices

APPENDIX A State Employment-Based
Immigration Profiles

52 • APPENDIX A: STATE EMPLOYMENT-BASED IMMIGRATION PROFILES
Alabama State Summary
VISA CATEGORY
TOTAL APPLICATIONS PROCESSED
TOTAL APPLICATIONS CERTIFIED
TOTAL POSITIONS REQUESTED
TOTAL POSITIONS CERTIFIED
% OF TOTAL CERTIFIED APPLICATIONS
% OF TOTAL CERTIFIED POSITIONS
AVERAGE WAGE OFFER/AEWR
PERM 671 583 671 583 0.74% 0.74% $25.77
H-1B 1,859 1,653 2,604 2,444 0.31% 0.21% $79,097.69
H-2B 82 54 1,870 1,442 1.06% 1.42% $22,012.95
H-2A 40 35 807 735 0.35% 0.53% $10.00
Top Three Cities PERMANENT LABOR (BY POSITIONS CERTIFIED) H-1B (BY POSITIONS CERTIFIED )
City Name Positions Certified Average Wage Offer
Montgomery 313 $14.03
Birmingham 58 $39.82
Huntsville 19 $57.13
City Name Positions Certified Average Wage Offer
Birmingham 713 $75,087.08
Montgomery 588 $73,162.15
Huntsville 206 $93,983.38
H-2B (BY POSITIONS CERTIFIED ) H-2A (BY POSITIONS CERTIFIED ) City Name Positions Certified Average Wage Offer
Sweet Water 292 $24,200.80
Birmingham 206 $20,909.20
Demopolis 179 $22,349.60
City Name Positions Certified AEWR
Daphne 170 $10.00
Clanton 101 $10.00
Union Spring 80 $10.00
Top Five Occupations/Agricultural Commodities PERMANENT LABOR H-1B
Occupation Positions Certified
Average Wage Offer
Meat, Poultry, and Fish Cutters and Trimmers 261 $9.72
Internists, General 17 $96.02
Mechanical Engineering Technicians 14 $24.52
Industrial Engineers 14 $36.52
Electrical and Electronics Engineering Technicians 14 $29.14
Occupation Positions Certified
Average Wage Offer
Computer Systems Analysts 448 $70,658.08
Computer Occupations, All Other 226 $70,933.80
Computer Programmers 209 $60,580.08
Software Developers, Applications 163 $78,564.72
Software Developers, Systems Software 108 $90,461.34
H-2B H-2A
Occupation Positions Certified
Average Wage Offer
Landscaping and Groundskeeping Workers 494 $21,467.49
Forest and Conservation Workers 448 $22,464.00
Meat, Poultry, and Fish Cutters and Trimmers 206 $22,946.56
Construction Laborers 98 $21,642.40
Packers and Packagers, Hand 57 $19,219.20
Occupation Positions Certified AEWR
Nursery and Greenhouse Workers 364 $10.00
Sweet Potatoes 170 $10.00
Melons 60 $10.00
Okra 41 $10.00
Cotton 30 $10.00

53 • OFFICE OF FOREIGN LABOR CERTIFICATION
Alaska State Summary
VISA CATEGORY
TOTAL APPLICATIONS PROCESSED
TOTAL APPLICATIONS CERTIFIED
TOTAL POSITIONS REQUESTED
TOTAL POSITIONS CERTIFIED
% OF TOTAL CERTIFIED APPLICATIONS
% OF TOTAL CERTIFIED POSITIONS
AVERAGE WAGE OFFER/AEWR
PERM 36 31 36 31 0.04% 0.04% $39.04
H-1B 183 150 245 219 0.03% 0.02% $86,542.85
H-2B 45 31 1,363 1,269 0.61% 1.25% $33,164.59
H-2A 1 1 15 15 0.01% 0.01% —
Top Three Cities PERMANENT LABOR (BY POSITIONS CERTIFIED) H-1B (BY POSITIONS CERTIFIED )
City Name Positions Certified Average Wage Offer
Anchorage 24 $38.64
Fairbanks 3 $43.62
Ketchiken 1 $42.07
City Name Positions Certified Average Wage Offer
Anchorage 168 $91,034.80
Fairbanks 27 $89,004.48
Juneau 13 $63,165.56
H-2B (BY POSITIONS CERTIFIED ) H-2A (BY POSITIONS CERTIFIED ) City Name Positions Certified Average Wage Offer
Sitka 960 $22,692.80
Ketchikan 97 $34,590.40
Juneau 91 $26,395.20
City Name Positions Certified AEWR
Anchorage 15 $10.00
— — —
— — —
Top Five Occupations/Agricultural Commodities PERMANENT LABOR H-1B
Occupation Positions Certified
Average Wage Offer
Engineering Teachers, Postsecondary 3 $43.62
Art, Drama, and Music Teachers, Postsecondary 2 $28.13
Software Developers, Applications 2 $32.04
Medical and Clinical Laboratory Technologists 2 $30.84
Marketing Managers 2 $41.47
Occupation Positions Certified
Average Wage Offer
Computer Occupations, All Other 37 $70,892.88
Software Developers, Systems Software 20 $68,500.00
Computer Systems Analysts 20 $69,898.67
Management Analysts 17 $101,333.33
Computer Programmers 7 $65,239.20
H-2B H-2A
Occupation Positions Certified
Average Wage Offer
Cutters and Trimmers, Hand 959 $20,800.00
Meat, Poultry, and Fish Cutters and Trimmers 117 $22,058.40
Retail Salespersons 102 $27,809.60
Food Batchmakers 28 $22,871.68
Landscaping and Groundskeeping Workers 20 $29,265.60
Occupation Positions Certified AEWR
Tomatoes 15 $10.00
— — —
— — —
— — —
— — —

54 • APPENDIX A: STATE EMPLOYMENT-BASED IMMIGRATION PROFILES
Arizona State Summary
VISA CATEGORY
TOTAL APPLICATIONS PROCESSED
TOTAL APPLICATIONS CERTIFIED
TOTAL POSITIONS REQUESTED
TOTAL POSITIONS CERTIFIED
% OF TOTAL CERTIFIED APPLICATIONS
% OF TOTAL CERTIFIED POSITIONS
AVERAGE WAGE OFFER/AEWR
PERM 938 806 938 806 1.02% 1.02% $41.94
H-1B 8,654 8,076 20,472 19,799 1.43% 1.69% $77,176.44
H-2B 101 68 2,868 2,284 1.33% 2.24% $22,024.45
H-2A 51 50 3,788 3,763 0.50% 2.69% $10.54
Top Three Cities PERMANENT LABOR (BY POSITIONS CERTIFIED) H-1B (BY POSITIONS CERTIFIED )
City Name Positions Certified Average Wage Offer
Chandler 256 $39.19
Phoenix 227 $46.07
Tucson 68 $46.45
City Name Positions Certified Average Wage Offer
Phoenix 13,663 $75,070.97
Scottsdale 1,839 $76,428.57
Tempe 1,450 $74,201.25
H-2B (BY POSITIONS CERTIFIED ) H-2A (BY POSITIONS CERTIFIED )
City Name Positions Certified Average Wage Offer
Phoenix 906 $22,003.69
Laveen 375 $18,137.60
Chandler 197 $25,933.44
City Name Positions Certified AEWR
Yuma 2,255 $10.54
Tonopah 512 $10.54
Casa Grande 504 $10.54
Top Five Occupations/Agricultural Commodities PERMANENT LABOR H-1B
Occupation Positions Certified
Average Wage Offer
Software Developers, Applications 214 $41.90
Electronics Engineers, Except Computer 114 $40.40
Software Developers, Systems Software 56 $42.68
Computer Systems Analysts 45 $42.16
Materials Engineers 30 $42.69
Occupation Positions Certified
Average Wage Offer
Computer Systems Analysts 9,011 $73,035.42
Software Developers, Applications 2,064 $83,527.17
Computer Occupations, All Other 1,920 $71,341.70
Computer Programmers 1,779 $63,980.96
Computer And Information Systems Managers 1,041 $101,801.20
H-2B H-2A
Occupation Positions Certified
Average Wage Offer
Landscaping and Groundskeeping Workers 662 $23,252.80
Amusement and Recreation Attendants 603 $18,112.00
Construction Laborers 492 $24,147.41
Farmworkers and Laborers, Crop, Nursery, and 194 $19,131.84
Maids and Housekeeping Cleaners 93 $19,662.93
Occupation Positions Certified AEWR
Lettuce 2,066 $10.54
Melons 552 $10.54
Livestock 491 $10.54
Spinach 200 $10.54
Celery 140 $10.54

55 • OFFICE OF FOREIGN LABOR CERTIFICATION
Arkansas State Summary
VISA CATEGORY
TOTAL APPLICATIONS PROCESSED
TOTAL APPLICATIONS CERTIFIED
TOTAL POSITIONS REQUESTED
TOTAL POSITIONS CERTIFIED
% OF TOTAL CERTIFIED APPLICATIONS
% OF TOTAL CERTIFIED POSITIONS
AVERAGE WAGE OFFER/AEWR
PERM 183 154 183 154 0.20% 0.20% $51.82
H-1B 3,004 2,804 7,190 6,895 0.50% 0.59% $74,475.16
H-2B 61 54 2,916 2,810 1.06% 2.76% $23,298.31
H-2A 175 168 2,604 2,552 1.69% 1.83% $10.18
Top Three Cities PERMANENT LABOR (BY POSITIONS CERTIFIED) H-1B (BY POSITIONS CERTIFIED )
City Name Positions Certified Average Wage Offer
Little Rock 49 $67.51
Bentonville 37 $43.28
Fort Smith 11 $78.68
City Name Positions Certified Average Wage Offer
Bentonville 4,854 $70,399.56
Little Rock 923 $74,252.01
Van Buren 303 $63,724.87
H-2B (BY POSITIONS CERTIFIED ) H-2A (BY POSITIONS CERTIFIED ) City Name Positions Certified Average Wage Offer
Tilly 947 $21,049.60
Marshall 772 $28,142.40
Hermitage 328 $27,268.80
City Name Positions Certified AEWR
Hermitage 572 $10.18
Wynne 236 $10.18
Hamburg 160 $10.18
Top Five Occupations/Agricultural Commodities PERMANENT LABOR H-1B
Occupation Positions Certified
Average Wage Offer
Software Developers, Applications 32 $35.55
Physicians and Surgeons, All Other 12 $35.42
Computer Systems Analysts 12 $129.75
Internists, General 10 $98.37
Family and General Practitioners 7 $82.76
Occupation Positions Certified
Average Wage Offer
Computer Systems Analysts 3,476 $69,517.39
Computer Programmers 731 $62,211.77
Computer Occupations, All Other 647 $69,679.33
Web Developers 436 $61,833.16
Software Developers, Applications 384 $76,111.94
H-2B H-2A
Occupation Positions Certified
Average Wage Offer
Forest and Conservation Workers 1,615 $22,346.13
Landscaping and Groundskeeping Workers 947 $22,054.50
First-Line Supervisors of Landscaping, Lawn 51 $33,404.80
Construction Laborers 45 $24,637.60
Amusement and Recreation Attendants 40 $16,983.20
Occupation Positions Certified AEWR
Tomatoes 683 $10.18
Fruits and Vegetables 287 $10.18
Grains 269 $10.18
Agricultural Equipment Operators 253 $10.18
Rice 215 $10.18

56 • APPENDIX A: STATE EMPLOYMENT-BASED IMMIGRATION PROFILES
California State Summary
VISA CATEGORY
TOTAL APPLICATIONS PROCESSED
TOTAL APPLICATIONS CERTIFIED
TOTAL POSITIONS REQUESTED
TOTAL POSITIONS CERTIFIED
% OF TOTAL CERTIFIED APPLICATIONS
% OF TOTAL CERTIFIED POSITIONS
AVERAGE WAGE OFFER/AEWR
PERM 21,080 18,675 21,080 18,675 23.66% 23.66% $51.13
H-1B 112,277 102,100 217,456 208,689 18.53% 17.79% $89,439.58
H-2B 191 136 3,255 2,754 2.66% 2.71% $28,502.44
H-2A 179 155 9,023 8,591 1.56% 6.14% $11.33
Top Three Cities PERMANENT LABOR (BY POSITIONS CERTIFIED) H-1B (BY POSITIONS CERTIFIED )
City Name Positions Certified Average Wage Offer
San Jose 2,336 $55.52
Mountain View 1,511 $57.19
Santa Clara $57.29
City Name Positions Certified Average Wage Offer
San Francisco 26,126 $98,817.51
San Jose 23,397 $95,308.23
Sunnyvale 14,124 $93,196.56
H-2B (BY POSITIONS CERTIFIED ) H-2A (BY POSITIONS CERTIFIED ) City Name Positions Certified Average Wage Offer
Calabassas 689 $25,344.30
Redlands 538 $42,491.43
Yreka 158 $28,069.60
City Name Positions Certified AEWR
Santa Maria 1,266 $11.33
Watsonville 916 $11.33
Bard 750 $11.33
Top Five Occupations/Agricultural Commodities PERMANENT LABOR H-1B
Occupation Positions Certified
Average Wage Offer
Software Developers, Applications 5643 $55.67
Software Developers, Systems Software 3446 $55.51
Electronics Engineers, Except Computer 1794 $52.51
Computer Systems Analysts 1178 $48.40
Computer and Information Systems Managers 433 $73.08
Occupation Positions Certified
Average Wage Offer
Computer Systems Analysts 44,013 $80,004.31
Software Developers, Applications 35,114 $109,137.00
Computer Occupations, All Other 21,988 $79.143.94
Software Developers, Systems Software 18,644 $115,361.91
Computer Programmers 17,985 $68,643.83
H-2B H-2A
Occupation Positions Certified
Average Wage Offer
Landscaping and Groundskeeping Workers 913 $26,389.35
Amusement and Recreation Attendants 668 $19,253.00
Coaches and Scouts 602 $41,159.73
Forest and Conservation Workers 240 $25,001.60
Nonfarm Animal Caretakers 142 $29,631.09
Occupation Positions Certified AEWR
Berries 4,334 $11.33
Lettuce 1,221 $11.33
Livestock 822 $11.33
General Farm Workers 319 $11.33
Grapes 222 $11.33

57 • OFFICE OF FOREIGN LABOR CERTIFICATION
Colorado State Summary
VISA CATEGORY
TOTAL APPLICATIONS PROCESSED
TOTAL APPLICATIONS CERTIFIED
TOTAL POSITIONS REQUESTED
TOTAL POSITIONS CERTIFIED
% OF TOTAL CERTIFIED APPLICATIONS
% OF TOTAL CERTIFIED POSITIONS
AVERAGE WAGE OFFER/AEWR
PERM 718 615 718 615 0.78% 0.78% $43.46
H-1B 6,594 5,896 15,734 15,124 1.09% 1.29% $76,062.54
H-2B 251 214 5,359 4,861 4.19% 4.78% $28,207.62
H-2A 197 194 1,755 1,717 1.95% 1.23% $11.37
Top Three Cities PERMANENT LABOR (BY POSITIONS CERTIFIED) H-1B (BY POSITIONS CERTIFIED )
City Name Positions Certified Average Wage Offer
Denver 117 $43.96
Greenwood Village 86 $45.93
Englewood 78 $46.49
City Name Positions Certified Average Wage Offer
Denver 4,808 $75,658.74
Englewood 2,956 $76,832.56
Colorado Springs 1,279 $77,147.98
H-2B (BY POSITIONS CERTIFIED ) H-2A (BY POSITIONS CERTIFIED ) City Name Positions Certified Average Wage Offer
Aurora 632 $27,878.93
Colorado Springs 527 $24,008.63
Denver 482 $29,768.27
City Name Positions Certified AEWR
Palisade 296 $11.37
Brighton 269 $11.37
Olathe 157 $11.37
Top Five Occupations/Agricultural Commodities PERMANENT LABOR H-1B
Occupation Positions Certified
Average Wage Offer
Software Developers, Applications 185 $46.64
Software Developers, Systems Software 55 $47.96
Computer Systems Analysts 51 $46.56
Electronics Engineers, Except Computer 26 $45.93
Cooks, Restaurant 26 $12.90
Occupation Positions Certified
Average Wage Offer
Computer Systems Analysts 5,172 $75,798.86
Computer Occupations, All Other 1,863 $73,767.70
Computer Programmers 1,707 $68,361.31
Software Developers, Applications 1,564 $84,848.02
Software Developers, Systems Software 1,024 $94,952.02
H-2B H-2A
Occupation Positions Certified
Average Wage Offer
Landscaping and Groundskeeping Workers 3,269 $28,127.59
Maids and Housekeeping Cleaners 483 $24,943.10
Helpers-Pipelayers, Plumbers, Pipefitters 129 $26,540.80
Rock Splitters, Quarry 118 $32,520.80
Amusement and Recreation Attendants 96 $18,839.60
Occupation Positions Certified AEWR
Livestock 358 $11.37
Fruits and Vegetables 305 $11.37
Peaches 274 $11.37
Corn 160 $11.37
Nursery and Greenhouse Workers 122 $11.37

58 • APPENDIX A: STATE EMPLOYMENT-BASED IMMIGRATION PROFILES
Connecticut State Summary
VISA CATEGORY
TOTAL APPLICATIONS PROCESSED
TOTAL APPLICATIONS CERTIFIED
TOTAL POSITIONS REQUESTED
TOTAL POSITIONS CERTIFIED
% OF TOTAL CERTIFIED APPLICATIONS
% OF TOTAL CERTIFIED POSITIONS
AVERAGE WAGE OFFER/AEWR
PERM 779 686 779 686 0.87% 0.87% $45.98
H-1B 10,044 9,419 25,242 24,399 1.66% 2.08% $79,464.02
H-2B 35 28 503 370 0.55% 0.36% $29,328.74
H-2A 53 53 457 478 0.53% 0.34% $11.26
Top Three Cities PERMANENT LABOR (BY POSITIONS CERTIFIED) H-1B (BY POSITIONS CERTIFIED )
City Name Positions Certified Average Wage Offer
Stamford 96 $55.11
Hartford 54 $48.27
Glastonbury 41 $43.36
City Name Positions Certified Average Wage Offer
Hartford 6,418 $77,341.82
Stamford 5,768 $84,532.01
Windsor 1,364 $76,791.32
H-2B (BY POSITIONS CERTIFIED ) H-2A (BY POSITIONS CERTIFIED ) City Name Positions Certified Average Wage Offer
Stamford 94 $26,634.40
Wolcott 74 $31,116.80
Glastonburry 25 $31,865.60
City Name Positions Certified AEWR
Windsor 146 $11.26
Lebanon 90 $11.26
Southington 26 $11.26
Top Five Occupations/Agricultural Commodities PERMANENT LABOR H-1B
Occupation Positions Certified
Average Wage Offer
Software Developers, Applications 211 $44.19
Computer Systems Analysts 53 $43.16
Financial Analysts 30 $62.41
Statisticians 21 $42.61
Internists, General 17 $80.01
Occupation Positions Certified
Average Wage Offer
Computer Systems Analysts 8,933 $77,486.35
Computer Programmers 3,583 $70,590.38
Computer Occupations, All Other 2,419 $78,888.02
Software Developers, Applications 1,605 $85,837.46
Web Developers 822 $68,543.84
H-2B H-2A
Occupation Positions Certified
Average Wage Offer
Landscaping and Groundskeeping Workers 295 $29,363.03
Waiters and Waitresses 34 $22,516.00
Combined Food Preparation and Serving Workers, 20 $22,484.80
Plasterers and Stucco Masons 7 $56,118.40
Maids and Housekeeping Cleaners 5 $26,395.20
Occupation Positions Certified AEWR
Tobacco 173 $11.26
Nursery and Greenhouse Workers 111 $11.26
Apples 69 $11.26
Fruits and Vegetables 65 $11.26
Horses 15 $11.26

59 • OFFICE OF FOREIGN LABOR CERTIFICATION
Delaware State Summary
VISA CATEGORY
TOTAL APPLICATIONS PROCESSED
TOTAL APPLICATIONS CERTIFIED
TOTAL POSITIONS REQUESTED
TOTAL POSITIONS CERTIFIED
% OF TOTAL CERTIFIED APPLICATIONS
% OF TOTAL CERTIFIED POSITIONS
AVERAGE WAGE OFFER/AEWR
PERM 336 308 336 308 0.39% 0.39% $47.47
H-1B 3,738 3,498 8,053 7,845 0.62% 0.67% $77,055.97
H-2B 25 24 393 345 0.47% 0.34% $26,333.67
H-2A 8 8 231 231 0.08% 0.17% $11.29
Top Three Cities PERMANENT LABOR (BY POSITIONS CERTIFIED) H-1B (BY POSITIONS CERTIFIED )
City Name Positions Certified Average Wage Offer
Wilmington 127 $45.61
Newark 120 $46.04
New Castle 22 $51.32
City Name Positions Certified Average Wage Offer
Wilmington 5,454 $76,217.57
Newark 1,640 $72,326.66
New Castle 435 $75,740.32
H-2B (BY POSITIONS CERTIFIED ) H-2A (BY POSITIONS CERTIFIED )
City Name Positions Certified Average Wage Offer
Wilmington 92 $25,779.00
New Castle 60 $29,140.80
Milton 48 $23,868.00
City Name Positions Certified AEWR
Millsboro 90 $11.29
Laurel 62 $11.29
Bridgeville 61 $11.29
Top Five Occupations/Agricultural Commodities PERMANENT LABOR H-1B
Occupation Positions Certified
Average Wage Offer
Software Developers, Applications 133 $47.47
Computer Systems Analysts 47 $43.59
Network and Computer Systems Administrators 18 $36.44
Statisticians 16 $41.44
Software Developers, Systems Software 11 $48.93
Occupation Positions Certified
Average Wage Offer
Computer Systems Analysts 3,260 $70,800.40
Computer Occupations, All Other 1,087 $70,249.05
Computer Programmers 1,037 $69,111.39
Software Developers, Applications 744 $91,045.52
Management Analysts 244 $78,143.74
H-2B H-2A
Occupation Positions Certified
Average Wage Offer
Landscaping and Groundskeeping Workers 265 $26,159.47
Construction Laborers 47 $38,251.20
Maids and Housekeeping Cleaners 16 $23,056.80
Painters, Construction and Maintenance 10 $18,720.00
Farmworkers and Laborers, Crop, Nursery 7 $19,801.60
Occupation Positions Certified AEWR
Melons 189 $11.29
Agricultural Equipment Operators 12 $11.29
Beans 12 $11.29
Nursery and Greenhouse Workers 8 $11.29
Grains 6 $11.29

60 • APPENDIX A: STATE EMPLOYMENT-BASED IMMIGRATION PROFILES
District of Columbia State Summary
VISA CATEGORY
TOTAL APPLICATIONS PROCESSED
TOTAL APPLICATIONS CERTIFIED
TOTAL POSITIONS REQUESTED
TOTAL POSITIONS CERTIFIED
% OF TOTAL CERTIFIED APPLICATIONS
% OF TOTAL CERTIFIED POSITIONS
AVERAGE WAGE OFFER/AEWR
PERM 449 405 449 405 0.51% 0.51% $45.91
H-1B 3,992 3,598 5,845 5,586 0.66% 0.48% $79,233.21
H-2B 4 1 4 1 0.02% 0.00% $24,960.00
H-2A 53 53 457 478 0.53% 0.34% $11.26
Top Three Cities PERMANENT LABOR (BY POSITIONS CERTIFIED) H-1B (BY POSITIONS CERTIFIED )
City Name Positions Certified Average Wage Offer
Washington, DC 405 $45.20
— — —
— — —
City Name Positions Certified Average Wage Offer
Washington, DC 5,662 $79,195.32
— — —
— — —
H-2B (BY POSITIONS CERTIFIED ) H-2A (BY POSITIONS CERTIFIED ) City Name Positions Certified Average Wage Offer
Washington, DC 1 $24,960.00
— — —
— — —
City Name Positions Certified AEWR
— — —
— — —
— — —
Top Five Occupations/Agricultural Commodities PERMANENT LABOR H-1B
Occupation Positions Certified
Average Wage Offer
Software Developers, Applications 62 $48.42
Economists 58 $61.46
Accountants and Auditors 16 $38.77
Computer Systems Analysts 14 $50.32
Cooks, Restaurant 11 $12.86
Occupation Positions Certified
Average Wage Offer
Computer Systems Analysts 1,254 $77,783.07
Computer Programmers 759 $68,201.68
Software Developers, Applications 578 $90,286.23
Software Developers, Systems Software 357 $104,391.71
Management Analysts 272 $81,370.87
H-2B H-2A
Occupation Positions Certified
Average Wage Offer
Childcare Workers 1 $24,960.00
— — —
— — —
— — —
— — —
Occupation Positions Certified AEWR
— — —
— — —
— — —
— — —
— — —

61 • OFFICE OF FOREIGN LABOR CERTIFICATION
Florida State Summary
VISA CATEGORY
TOTAL APPLICATIONS PROCESSED
TOTAL APPLICATIONS CERTIFIED
TOTAL POSITIONS REQUESTED
TOTAL POSITIONS CERTIFIED
% OF TOTAL CERTIFIED APPLICATIONS
% OF TOTAL CERTIFIED POSITIONS
AVERAGE WAGE OFFER/AEWR
PERM 2,529 2,162 2,529 2,162 2.74% 2.74% $41.81
H-1B 19,967 18,471 40,609 39,082 3.30% 3.33% $72,915.09
H-2B 370 301 8,597 6,847 5.89% 6.73% $23,785.58
H-2A 204 192 18,740 17,942 1.93% 12.83% $10.19
Top Three Cities PERMANENT LABOR (BY POSITIONS CERTIFIED) H-1B (BY POSITIONS CERTIFIED )
City Name Positions Certified Average Wage Offer
Miami 393 $45.48
Tampa 326 $38.74
Jacksonville 141 $43.35
City Name Positions Certified Average Wage Offer
Tampa 7,815 $72,190.98
Miami 4,790 $73,240.68
Jacksonville 4,748 $71,501.76
H-2B (BY POSITIONS CERTIFIED ) H-2A (BY POSITIONS CERTIFIED ) City Name Positions Certified Average Wage Offer
Boca Raton 517 $25,244.54
Naples 463 $25,105.60
Orlando 386 $20,589.92
City Name Positions Certified AEWR
Arcadia 2,410 $10.19
Plant City 1,730 $10.19
Avon Park 1,270 $10.19
Top Five Occupations/Agricultural Commodities PERMANENT LABOR H-1B
Occupation Positions Certified
Average Wage Offer
Software Developers, Applications 581 $39.89
Computer Systems Analysts 134 $43.53
Financial Managers 66 $54.59
Accountants and Auditors 59 $34.03
Marketing Managers 52 $60.02
Occupation Positions Certified
Average Wage Offer
Computer Systems Analysts 12,803 $71,551.19
Computer Programmers 4,849 $63,435.26
Software Developers, Applications 3,857 $77,544.70
Software Developers, Systems Software 3,616 $79,037.70
Computer Occupations, All Other 2,731 $71,030.61
H-2B H-2A
Occupation Positions Certified
Average Wage Offer
Maids and Housekeeping Cleaners 1,417 $20,502.56
Landscaping and Groundskeeping Workers 1,136 $21,664.00
Amusement and Recreation Attendants 1,066 $18,923.38
Waiters and Waitresses 685 $23,007.86
Food Servers, Nonrestaurant 589 $22,550.17
Occupation Positions Certified AEWR
Oranges 5,873 $10.19
Berries 2,860 $10.19
Citrus 1,741 $10.19
Melons 1,608 $10.19
Grapefruits 1,559 $10.19

62 • APPENDIX A: STATE EMPLOYMENT-BASED IMMIGRATION PROFILES
Georgia State Summary
VISA CATEGORY
TOTAL APPLICATIONS PROCESSED
TOTAL APPLICATIONS CERTIFIED
TOTAL POSITIONS REQUESTED
TOTAL POSITIONS CERTIFIED
% OF TOTAL CERTIFIED APPLICATIONS
% OF TOTAL CERTIFIED POSITIONS
AVERAGE WAGE OFFER/AEWR
PERM 2,502 2,145 2,502 2,145 2.72% 2.72% $38.91
H-1B 22,860 21,210 45,382 43,559 3.77% 3.71% $72,793.03
H-2B 96 71 3,433 2,737 1.39% 2.69% $24,165.21
H-2A 204 192 18,740 17,942 1.93% 12.83% $10.19
Top Three Cities PERMANENT LABOR (BY POSITIONS CERTIFIED) H-1B (BY POSITIONS CERTIFIED )
City Name Positions Certified Average Wage Offer
Atlanta 691 $46.00
Alpharetta 363 $43.44
Norcross 160 $41.35
City Name Positions Certified Average Wage Offer
Atlanta 27,907 $75,331.08
Alpharetta 5,963 $70,091.60
Columbus 1,270 $67,583.74
H-2B (BY POSITIONS CERTIFIED ) H-2A (BY POSITIONS CERTIFIED ) City Name Positions Certified Average Wage Offer
Norcross 410 $25,882.13
Ringgold 254 $20,092.80
Baxley 215 $25,188.80
City Name Positions Certified AEWR
Lyons 1,686 $10.00
Lake Park 1,486 $10.00
Glennville 1,165 $10.00
Top Five Occupations/Agricultural Commodities PERMANENT LABOR H-1B
Occupation Positions Certified
Average Wage Offer
Software Developers, Applications 738 $44.28
Computer Systems Analysts 206 $40.43
Meat, Poultry, and Fish Cutters and Trimmers 164 $9.36
Computer and Information Systems Managers 103 $60.35
Accountants and Auditors 50 $33.49
Occupation Positions Certified
Average Wage Offer
Computer Systems Analysts 15,288 $69,880.64
Computer Programmers 6,560 $67,117.81
Software Developers, Applications 5,690 $77,066.28
Computer Occupations, All Other 3,876 $76,952.51
Software Developers, Systems Software 2,383 $94,275.28
H-2B H-2A
Occupation Positions Certified
Average Wage Offer
Forest and Conservation Workers 840 $19,933.96
Landscaping and Groundskeeping Workers 793 $24,629.43
Maids and Housekeeping Cleaners 187 $20,316.40
Drywall and Ceiling Tile Installers 154 $33,696.00
Construction Laborers 115 $27,445.60
Occupation Positions Certified AEWR
Onions 3,892 $10.00
Berries 1,771 $10.00
Melons 1,714 $10.00
Squash 1,304 $10.00
Cucumbers 1,202 $10.00

63 • OFFICE OF FOREIGN LABOR CERTIFICATION
Guam State Summary
VISA CATEGORY
TOTAL APPLICATIONS PROCESSED
TOTAL APPLICATIONS CERTIFIED
TOTAL POSITIONS REQUESTED
TOTAL POSITIONS CERTIFIED
% OF TOTAL CERTIFIED APPLICATIONS
% OF TOTAL CERTIFIED POSITIONS
AVERAGE WAGE OFFER/AEWR
PERM 58 51 58 51 0.06% 0.06% $23.84
H-1B 498 434 551 476 0.08% 0.04% $55,972.37
H-2B — — — — — — —
H-2A — — — — — — —
Top Three Cities PERMANENT LABOR (BY POSITIONS CERTIFIED) H-1B (BY POSITIONS CERTIFIED )
City Name Positions Certified Average Wage Offer
Tamuning 24 $24.95
Harmon 7 $20.23
Dededo 6 $18.89
City Name Positions Certified Average Wage Offer
Tamuning 189 $58,751.57
Dededo 87 $67,462.63
Barrigada 61 $45,766.85
H-2B (BY POSITIONS CERTIFIED ) H-2A (BY POSITIONS CERTIFIED ) City Name Positions Certified Average Wage Offer
— — —
— — —
— — —
City Name Positions Certified AEWR
— — —
— — —
— — —
Top Five Occupations/Agricultural Commodities PERMANENT LABOR H-1B
Occupation Positions Certified
Average Wage Offer
Civil Engineers 8 $20.12
Accountants and Auditors 5 $23.77
Financial Managers 4 $22.19
Construction Managers 4 $17.82
Architectural and Engineering Managers 2 $40.80
Occupation Positions Certified
Average Wage Offer
Civil Engineers 116 $44,140.41
Accountants And Auditors 48 $36,268.53
Electrical Engineers 47 $47,995.50
Mechanical Engineers 39 $46,268.27
Medical And Clinical Laboratory Technologists 24 $39,495.17
H-2B H-2A
Occupation Positions Certified
Average Wage Offer
— — —
— — —
— — —
— — —
— — —
Occupation Positions Certified AEWR
— — —
— — —
— — —
— — —
— — —

64 • APPENDIX A: STATE EMPLOYMENT-BASED IMMIGRATION PROFILES
State Summary
Hawaii VISA CATEGORY
TOTAL APPLICATIONS PROCESSED
TOTAL APPLICATIONS CERTIFIED
TOTAL POSITIONS REQUESTED
TOTAL POSITIONS CERTIFIED
% OF TOTAL CERTIFIED APPLICATIONS
% OF TOTAL CERTIFIED POSITIONS
AVERAGE WAGE OFFER/AEWR
PERM 81 74 81 74 0.09% 0.09% $32.79
H-1B 544 454 819 742 0.09% 0.06% $70,502.52
H-2B 3 1 3 1 0.02% 0.00% $47,840.00
H-2A 5 5 40 40 0.05% 0.03% $12.98
Top Three Cities PERMANENT LABOR (BY POSITIONS CERTIFIED) H-1B (BY POSITIONS CERTIFIED )
City Name Positions Certified Average Wage Offer
Honolulu 56 $33.75
Kapolei 5 $23.46
Kealakekua 2 $22.06
City Name Positions Certified Average Wage Offer
Honolulu 642 $68,921.40
Hilo 27 $61,352.15
Mililani 25 $61,781.25
H-2B (BY POSITIONS CERTIFIED ) H-2A (BY POSITIONS CERTIFIED ) City Name Positions Certified Average Wage Offer
Kailua 1 $47,840.00
— — —
— — —
City Name Positions Certified AEWR
Kunia 30 $12.98
Kea'au 4 $12.98
Pahala 3 $12.98
Top Five Occupations/Agricultural Commodities PERMANENT LABOR H-1B
Occupation Positions Certified
Average Wage Offer
Software Developers, Applications 5 $40.94
Marketing Managers 5 $34.67
Political Science Teachers, Postsecondary 3 $23.77
Cooks, Restaurant 3 $22.62
Accountants and Auditors 3 $30.88
Occupation Positions Certified
Average Wage Offer
Computer Systems Analysts 147 $73,106.99
Computer Programmers 66 $67,608.07
Software Developers, Applications 47 $75,046.20
Computer Occupations, All Other 47 $75,916.44
Electronics Engineers, Except Computer 45 $67,773.33
H-2B H-2A
Occupation Positions Certified
Average Wage Offer
Self-Enrichment Education Teachers 1 $47,840.00
— — —
— — —
— — —
— — —
Occupation Positions Certified AEWR
Melons 30 $12.98
Livestock 5 $12.98
Bees 4 $12.98
Oranges 1 $12.98
— — —

65 • OFFICE OF FOREIGN LABOR CERTIFICATION
Idaho State Summary
VISA CATEGORY
TOTAL APPLICATIONS PROCESSED
TOTAL APPLICATIONS CERTIFIED
TOTAL POSITIONS REQUESTED
TOTAL POSITIONS CERTIFIED
% OF TOTAL CERTIFIED APPLICATIONS
% OF TOTAL CERTIFIED POSITIONS
AVERAGE WAGE OFFER/AEWR
PERM 101 90 101 90 0.11% 0.11% $40.19
H-1B 766 704 1,439 1,375 0.13% 0.12% $75,001.01
H-2B 45 35 2,060 1,780 0.68% 1.75% $28,874.81
H-2A 426 414 2,397 2,356 4.16% 1.68% $11.14
Top Three Cities PERMANENT LABOR (BY POSITIONS CERTIFIED) H-1B (BY POSITIONS CERTIFIED )
City Name Positions Certified Average Wage Offer
Boise 61 $39.14
Moscow 5 $33.80
Pocatello 5 $32.65
City Name Positions Certified Average Wage Offer
Boise 1,205 $76,265.75
Pocatello 35 $56,922.80
Meridian 28 $84,007.26
H-2B (BY POSITIONS CERTIFIED ) H-2A (BY POSITIONS CERTIFIED ) City Name Positions Certified Average Wage Offer
Coeur d'Alene 1,001 $18,737.33
Hayden 188 $22,370.40
Jerome 110 $24,658.40
City Name Positions Certified AEWR
Hamer 413 $11.14
Rupert 158 $11.14
Idaho Falls 121 $11.14
Top Five Occupations/Agricultural Commodities PERMANENT LABOR H-1B
Occupation Positions Certified
Average Wage Offer
Electronics Engineers, Except Computer 24 $41.22
Materials Engineers 16 $39.93
Architectural and Engineering Managers 5 $49.67
Medical and Clinical Laboratory Technologists 4 $25.70
Accountants and Auditors 3 $32.64
Occupation Positions Certified
Average Wage Offer
Computer Systems Analysts 228 $71,204.52
Computer Programmers 189 $65,252.56
Computer Occupations, All Other 145 $69,240.35
Software Developers, Systems Software 109 $93,834.82
Software Developers, Applications 92 $73,340.37
H-2B H-2A
Occupation Positions Certified
Average Wage Offer
Forest and Conservation Workers 1,352 $20,899.20
Packers and Packagers, Hand 210 $19,718.40
Landscaping and Groundskeeping Workers 77 $29,749.94
Amusement and Recreation Attendants 50 $20,342.40
Rock Splitters, Quarry 40 $35,464.00
Occupation Positions Certified AEWR
Hay and Straw 618 $11.14
Potatoes 574 $11.14
Grains 348 $11.14
Livestock 234 $11.14
Corn 226 $11.14

66 • APPENDIX A: STATE EMPLOYMENT-BASED IMMIGRATION PROFILES
Illinois State Summary
VISA CATEGORY
TOTAL APPLICATIONS PROCESSED
TOTAL APPLICATIONS CERTIFIED
TOTAL POSITIONS REQUESTED
TOTAL POSITIONS CERTIFIED
% OF TOTAL CERTIFIED APPLICATIONS
% OF TOTAL CERTIFIED POSITIONS
AVERAGE WAGE OFFER/AEWR
PERM 3,657 3,295 3,657 3,295 4.17% 4.17% $44.17
H-1B 32,434 30,112 69,675 67,619 5.35% 5.76% $73,974.54
H-2B 96 70 1,865 1,543 1.37% 1.52% $26,525.05
H-2A 56 44 906 809 0.44% 0.58% $11.61
Top Three Cities PERMANENT LABOR (BY POSITIONS CERTIFIED) H-1B (BY POSITIONS CERTIFIED )
City Name Positions Certified Average Wage Offer
Chicago 1,078 $45.69
Rosemont 219 $48.28
Schaumburg 179 $41.65
City Name Positions Certified Average Wage Offer
Chicago 26,793 $76,301.89
Schaumburg 3,649 $69,336.16
Bloomington 3,555 $68,355.02
H-2B (BY POSITIONS CERTIFIED ) H-2A (BY POSITIONS CERTIFIED ) City Name Positions Certified Average Wage Offer
Wauconda 168 $26,457.60
Hoffman Estates 168 $17,451.20
Caseyville 100 $23,989.33
City Name Positions Certified AEWR
Keenes 224 $11.61
Prophetstown 93 $11.61
Cobden 64 $11.61
Top Five Occupations/Agricultural Commodities PERMANENT LABOR H-1B
Occupation Positions Certified
Average Wage Offer
Software Developers, Applications 1225 $43.31
Computer Systems Analysts 363 $41.61
Computer and Information Systems Managers 149 $57.84
Software Developers, Systems Software 124 $45.32
Mechanical Engineers 84 $40.06
Occupation Positions Certified
Average Wage Offer
Computer Systems Analysts 17,672 $71,735.61
Computer Programmers 9,344 $64,240.73
Software Developers, Applications 8,208 $77,796.03
Computer Occupations, All Other 6,914 $70,319.72
Software Developers, Systems Software 4,706 $90,744.45
H-2B H-2A
Occupation Positions Certified
Average Wage Offer
Landscaping and Groundskeeping Workers 829 $26,024.08
Amusement and Recreation Attendants 412 $19,213.53
Helpers-Roofers 149 $28,163.20
Maids and Housekeeping Cleaners 44 $22,505.60
Waiters and Waitresses 30 $20,961.20
Occupation Positions Certified AEWR
Corn 198 $11.61
Agricultural Equipment Operators 151 $11.61
Construction of Livestock Buildings 147 $11.61
General Farm Workers 113 $11.61
Fruits and Vegetables 112 $11.61

67 • OFFICE OF FOREIGN LABOR CERTIFICATION
Indiana State Summary
VISA CATEGORY
TOTAL APPLICATIONS PROCESSED
TOTAL APPLICATIONS CERTIFIED
TOTAL POSITIONS REQUESTED
TOTAL POSITIONS CERTIFIED
% OF TOTAL CERTIFIED APPLICATIONS
% OF TOTAL CERTIFIED POSITIONS
AVERAGE WAGE OFFER/AEWR
PERM 531 471 531 471 0.60% 0.60% $46.29
H-1B 6,088 5,451 12,286 11,888 1.00% 1.01% $75,828.49
H-2B 53 38 1,252 1,039 0.74% 1.02% $22,120.25
H-2A 42 38 1,326 1,266 0.38% 0.91% $11.61
Top Three Cities PERMANENT LABOR (BY POSITIONS CERTIFIED) H-1B (BY POSITIONS CERTIFIED )
City Name Positions Certified Average Wage Offer
Indianapolis 128 $44.56
Columbus 123 $38.87
West Lafayette 23 $42.00
City Name Positions Certified Average Wage Offer
Indianapolis 5,000 $73,598.33
Columbus 1,864 $71,871.36
Carmel 672 $74,277.75
H-2B (BY POSITIONS CERTIFIED ) H-2A (BY POSITIONS CERTIFIED )
City Name Positions Certified Average Wage Offer
Farmland 286 $17,596.80
Indianapolis 261 $24,042.91
Carmel 73 $23,358.40
City Name Positions Certified AEWR
Tippecanoe 350 $11.61
Vincennes 201 $11.61
Oaktown 144 $11.61
Top Five Occupations/Agricultural Commodities PERMANENT LABOR H-1B
Occupation Positions Certified
Average Wage Offer
Software Developers, Applications 65 $45.17
Mechanical Engineers 38 $38.28
Electronics Engineers, Except Computer 32 $38.23
Computer Systems Analysts 30 $40.05
Electrical Engineers 23 $39.30
Occupation Positions Certified
Average Wage Offer
Computer Systems Analysts 3,822 $67,762.69
Computer Programmers 1,240 $62,993.73
Software Developers, Applications 957 $74,433.68
Computer Occupations, All Other 710 $68,693.92
Software Developers, Systems Software 601 $79,373.43
H-2B H-2A
Occupation Positions Certified
Average Wage Offer
Landscaping and Groundskeeping Workers 584 $24,067.41
Amusement and Recreation Attendants 299 $17,534.40
Maids and Housekeeping Cleaners 57 $18,595.20
Cooks, Short Order 20 $21,153.60
Helpers-Roofers 15 $26,291.20
Occupation Positions Certified AEWR
Corn 682 $11.61
Melons 369 $11.61
Fruits and Vegetables 80 $11.61
Berries 21 $11.61
Apples 21 $11.61

68 • APPENDIX A: STATE EMPLOYMENT-BASED IMMIGRATION PROFILES
Iowa State Summary
VISA CATEGORY
TOTAL APPLICATIONS PROCESSED
TOTAL APPLICATIONS CERTIFIED
TOTAL POSITIONS REQUESTED
TOTAL POSITIONS CERTIFIED
% OF TOTAL CERTIFIED APPLICATIONS
% OF TOTAL CERTIFIED POSITIONS
AVERAGE WAGE OFFER/AEWR
PERM 333 303 333 303 0.38% 0.38% $49.56
H-1B 3,193 2,901 6,094 5,858 0.53% 0.50% $76,967.88
H-2B 31 20 272 211 0.39% 0.21% $27,114.88
H-2A 87 81 1,497 1,361 0.81% 0.97% $12.62
Top Three Cities PERMANENT LABOR (BY POSITIONS CERTIFIED) H-1B (BY POSITIONS CERTIFIED )
City Name Positions Certified Average Wage Offer
Cedar Rapids 55 $44.02
Iowa City 50 $61.30
Clive 33 $39.61
City Name Positions Certified Average Wage Offer
Des Moines 1,898 $70,382.01
Cedar Rapids 1,643 $74,600.67
Iowa City 363 $85,066.55
H-2B (BY POSITIONS CERTIFIED ) H-2A (BY POSITIONS CERTIFIED ) City Name Positions Certified Average Wage Offer
Algona 49 $31,543.20
Decorah 27 $28,946.67
Graettinger 25 $24,273.60
City Name Positions Certified AEWR
Conesville 331 $12.62
Waterloo 99 $12.62
Lawler 83 $12.62
Top Five Occupations/Agricultural Commodities
PERMANENT LABOR H-1B
Occupation Positions Certified
Average Wage Offer
Software Developers, Applications 87 $39.10
Software Developers, Systems Software 17 $38.62
Computer Systems Analysts 16 $41.42
Physicians and Surgeons, All Other 14 $127.09
Internists, General 12 $99.07
Occupation Positions Certified
Average Wage Offer
Computer Systems Analysts 2,335 $68,653.27
Computer Programmers 774 $62,000.60
Software Developers, Applications 561 $75,815.29
Computer Occupations, All Other 363 $62,842.45
Software Developers, Systems Software 194 $84,996.43
H-2B H-2A
Occupation Positions Certified
Average Wage Offer
Construction Laborers 116 $31,045.16
Helpers—Production Workers 40 $24,939.20
Landscaping and Groundskeeping Workers 18 $23,119.20
Agricultural Equipment Operators 12 $34,049.60
Nonfarm Animal Caretakers 10 $22,110.40
Occupation Positions Certified AEWR
Construction of Livestock Buildings 661 $12.62
Corn 446 $12.62
Fruits and Vegetables 99 $12.62
Agricultural Equipment Operators 77 $12.62
General Farm Workers 30 $12.62

69 • OFFICE OF FOREIGN LABOR CERTIFICATION
Kansas State Summary
VISA CATEGORY
TOTAL APPLICATIONS PROCESSED
TOTAL APPLICATIONS CERTIFIED
TOTAL POSITIONS REQUESTED
TOTAL POSITIONS CERTIFIED
% OF TOTAL CERTIFIED APPLICATIONS
% OF TOTAL CERTIFIED POSITIONS
AVERAGE WAGE OFFER/AEWR
PERM 339 306 339 306 0.39% 0.39% $42.16
H-1B 2,570 2,353 5,085 4,880 0.42% 0.42% $75,914.12
H-2B 65 56 1,443 1,242 1.10% 1.22% $26,803.03
H-2A 118 115 795 773 1.15% 0.55% $13.59
Top Three Cities PERMANENT LABOR (BY POSITIONS CERTIFIED) H-1B (BY POSITIONS CERTIFIED )
City Name Positions Certified Average Wage Offer
Overland Park 135 $40.47
Wichita 38 $52.00
Lenexa 22 $39.27
City Name Positions Certified Average Wage Offer
Overland Park 1,823 $71,085.17
Topeka 985 $86,744.14
Wichita 876 $73,117.63
H-2B (BY POSITIONS CERTIFIED ) H-2A (BY POSITIONS CERTIFIED )
City Name Positions Certified Average Wage Offer
Lenexa 574 $26,926.96
Gardner 179 $26,374.40
Olathe 152 $27,589.12
City Name Positions Certified AEWR
Hays 68 $13.59
Syracuse 42 $13.59
Great Bend 32 $13.59
Top Five Occupations/Agricultural Commodities
PERMANENT LABOR H-1B
Occupation Positions Certified
Average Wage Offer
Software Developers, Applications 91 $43.16
Computer Systems Analysts 37 $38.97
Electrical Engineers 13 $42.42
Materials Engineers 11 $33.42
Computer Programmers 11 $29.28
Occupation Positions Certified
Average Wage Offer
Computer Systems Analysts 1,390 $68,539.80
Computer Programmers 728 $64,555.50
Software Developers, Applications 567 $80,915.43
Software Developers, Systems Software 382 $85,062.57
Computer Occupations, All Other 353 $73,542.25
H-2B H-2A
Occupation Positions Certified
Average Wage Offer
Landscaping and Groundskeeping Workers 660 $26,083.20
Recreation Workers 484 $26,952.07
Construction Laborers 64 $28,121.60
Amusement and Recreation Attendants 20 $17,742.40
Combined Food Preparation and Serving Workers 10 $17,908.80
Occupation Positions Certified AEWR
Agricultural Equipment Operators 322 $13.59
Grains 288 $13.59
Construction of Livestock Buildings 44 $13.59
Nursery and Greenhouse Workers 20 $13.59
Squash 20 $13.59

70 • APPENDIX A: STATE EMPLOYMENT-BASED IMMIGRATION PROFILES
Kentucky State Summary
VISA CATEGORY
TOTAL APPLICATIONS PROCESSED
TOTAL APPLICATIONS CERTIFIED
TOTAL POSITIONS REQUESTED
TOTAL POSITIONS CERTIFIED
% OF TOTAL CERTIFIED APPLICATIONS
% OF TOTAL CERTIFIED POSITIONS
AVERAGE WAGE OFFER/AEWR
PERM 384 332 384 332 0.42% 0.42% $44.31
H-1B 2,384 2,257 7,718 7,519 0.39% 0.64% $77,510.71
H-2B 90 62 1,056 730 1.21% 0.72% $24,897.26
H-2A 1,089 1,076 6,790 6,722 10.80% 4.81% $10.28
Top Three Cities PERMANENT LABOR (BY POSITIONS CERTIFIED) H-1B (BY POSITIONS CERTIFIED )
City Name Positions Certified Average Wage Offer
Louisville 218 $37.03
Lexington 41 $46.63
Pikeville 8 $157.05
City Name Positions Certified Average Wage Offer
Louisville 4,454 $70,551.47
Lexington 946 $76,041.99
Frankfort 790 $68,492.87
H-2B (BY POSITIONS CERTIFIED ) H-2A (BY POSITIONS CERTIFIED ) City Name Positions Certified Average Wage Offer
Lexington 182 $25,975.73
Louisville 105 $24,044.80
Paducah 86 $22,224.80
City Name Positions Certified AEWR
Murray 386 $10.28
Hopkinsville 341 $10.28
Cadiz 259 $10.28
Top Five Occupations/Agricultural Commodities PERMANENT LABOR H-1B
Occupation Positions Certified
Average Wage Offer
Software Developers, Applications 134 $43.16
Physicians and Surgeons, All Other 22 $38.25
Network and Computer Systems Administrators 19 $42.42
Computer Systems Analysts 16 $47.34
Database Administrators 11 $33.42
Occupation Positions Certified
Average Wage Offer
Computer Systems Analysts 2,510 $68,933.30
Computer Programmers 797 $62,126.41
Software Developers, Applications 737 $72,700.50
Software Developers, Systems Software 656 $83,525.48
Computer Occupations, All Other 464 $68,281.06
H-2B H-2A
Occupation Positions Certified
Average Wage Offer
Landscaping and Groundskeeping Workers 462 $23,642.11
Nonfarm Animal Caretakers 87 $23,215.25
Amusement and Recreation Attendants 40 $16,744.00
Helpers-Carpenters 28 $27,570.40
Helpers-Brickmasons, Blockmasons, Stonemasons 27 $31,330.00
Occupation Positions Certified AEWR
Tobacco 5,213 $10.28
Nursery and Greenhouse Workers 797 $10.28
Hay and Straw 453 $10.28
General Farm Workers 83 $10.28
Horses 78 $10.28

71 • OFFICE OF FOREIGN LABOR CERTIFICATION
Louisiana State Summary
VISA CATEGORY
TOTAL APPLICATIONS PROCESSED
TOTAL APPLICATIONS CERTIFIED
TOTAL POSITIONS REQUESTED
TOTAL POSITIONS CERTIFIED
% OF TOTAL CERTIFIED APPLICATIONS
% OF TOTAL CERTIFIED POSITIONS
AVERAGE WAGE OFFER/AEWR
PERM 327 282 327 282 0.36% 0.36% $38.89
H-1B 2,663 2,270 3,806 3,460 0.44% 0.29% $74,811.63
H-2B 271 213 5,925 4,660 4.17% 4.58% $25,084.41
H-2A 734 719 8,211 7,787 7.22% 5.57% $10.18
Top Three Cities PERMANENT LABOR (BY POSITIONS CERTIFIED) H-1B (BY POSITIONS CERTIFIED )
City Name Positions Certified Average Wage Offer
Baton Rouge 82 $39.85
New Orleans 29 $34.96
Ruston 27 $41.45
City Name Positions Certified Average Wage Offer
Baton Rouge 1,537 $72,046.23
New Orleans 553 $70,495.27
Lafayette 252 $83,030.37
H-2B (BY POSITIONS CERTIFIED ) H-2A (BY POSITIONS CERTIFIED ) City Name Positions Certified Average Wage Offer
Baton Rouge 525 $24,151.51
Slidell 504 $22,321.00
Youngsville 236 $35,224.80
City Name Positions Certified AEWR
Delhi 628 $10.18
Jeanerette 599 $10.18
White Castle 555 $10.18
Top Five Occupations/Agricultural Commodities PERMANENT LABOR H-1B
Occupation Positions Certified
Average Wage Offer
Software Developers, Applications 80 $41.07
Civil Engineers 14 $40.61
Cooks, Restaurant 11 $12.43
Architectural and Engineering Managers 9 $55.95
Electrical Engineers 9 $43.16
Occupation Positions Certified
Average Wage Offer
Computer Systems Analysts 748 $73,731.39
Computer Programmers 734 $67,840.73
Software Developers, Applications 264 $80,309.33
Financial Analysts 145 $74,641.73
Software Developers, Systems Software 136 $91,281.74
H-2B H-2A
Occupation Positions Certified
Average Wage Offer
Landscaping and Groundskeeping Workers 1,466 $22,461.31
Packers and Packagers, Hand 793 $20,298.35
Meat, Poultry, and Fish Cutters and Trimmers 531 $19,997.90
Laborers and Freight, Stock, and Material Movers 226 $24,960.00
Construction Laborers 219 $29,064.53
Occupation Positions Certified AEWR
Sugarcane 2,902 $10.18
Crawfish 1,230 $10.18
Sweet Potatoes 934 $10.18
Agricultural Equipment Operators 630 $10.18
Rice 377 $10.18

72 • APPENDIX A: STATE EMPLOYMENT-BASED IMMIGRATION PROFILES
Maine State Summary
VISA CATEGORY
TOTAL APPLICATIONS PROCESSED
TOTAL APPLICATIONS CERTIFIED
TOTAL POSITIONS REQUESTED
TOTAL POSITIONS CERTIFIED
% OF TOTAL CERTIFIED APPLICATIONS
% OF TOTAL CERTIFIED POSITIONS
AVERAGE WAGE OFFER/AEWR
PERM 110 103 110 103 0.13% 0.13% $68.49
H-1B 706 667 1,122 1,094 0.12% 0.09% $90,360.63
H-2B 174 153 1,580 1,432 2.99% 1.41%
H-2A 67 63 754 666 0.63% 0.48% $11.26
Top Three Cities PERMANENT LABOR (BY POSITIONS CERTIFIED) H-1B (BY POSITIONS CERTIFIED )
City Name Positions Certified Average Wage Offer
Portland 31 $41.17
Bangor 21 $130.90
Orono 9 $39.92
City Name Positions Certified Average Wage Offer
Portland 488 $73,681.94
South Portland 106 $73,957.12
Augusta 93 $88,299.68
H-2B (BY POSITIONS CERTIFIED ) H-2A (BY POSITIONS CERTIFIED ) City Name Positions Certified Average Wage Offer
Ogunquit 295 $21,181.87
Bar Harbor 209 $21,210.06
Ellsworth 109 $20,533.07
City Name Positions Certified AEWR
Cherryfield 155 $11.26
Presque Isle 115 $11.26
Caribou 114 $11.26
Top Five Occupations/Agricultural Commodities PERMANENT LABOR H-1B
Occupation Positions Certified
Average Wage Offer
Software Developers, Applications 22 $44.17
Internists, General 17 $101.29
Computer Programmers 10 $39.99
Pharmacists 6 $65.75
Anesthesiologists 5 $166.35
Occupation Positions Certified
Average Wage Offer
Computer Systems Analysts 394 $71,288.84
Software Developers, Applications 144 $76,945.90
Computer Programmers 135 $63,395.60
Computer Occupations, All Other 91 $71,297.52
Internists, General 43 $213,060.21
H-2B H-2A
Occupation Positions Certified
Average Wage Offer
Maids and Housekeeping Cleaners 625 $20,815.78
Cooks, Restaurant 148 $23,924.73
Forest and Conservation Workers 130 $28,163.20
Dining Room and Cafeteria Attendants and Bartender 67 $18,869.76
Landscaping and Groundskeeping Workers 59 $27,414.40
Occupation Positions Certified AEWR
Apples 150 $11.26
Berries 140 $11.26
Fruits and Vegetables 137 $11.26
Broccoli 112 $11.26
Agricultural Equipment Operators 105 $11.26

73 • OFFICE OF FOREIGN LABOR CERTIFICATION
Maryland State Summary
VISA CATEGORY
TOTAL APPLICATIONS PROCESSED
TOTAL APPLICATIONS CERTIFIED
TOTAL POSITIONS REQUESTED
TOTAL POSITIONS CERTIFIED
% OF TOTAL CERTIFIED APPLICATIONS
% OF TOTAL CERTIFIED POSITIONS
AVERAGE WAGE OFFER/AEWR
PERM 1,329 1,140 1,329 1,140 1.44% 1.44% $40.68
H-1B 10,780 9,803 17,751 17,072 1.78% 1.46% $75,025.72
H-2B 244 188 5,575 4,586 3.68% 4.51% $25,057.03
H-2A 60 56 674 657 0.56% 0.47% $11.29
Top Three Cities PERMANENT LABOR (BY POSITIONS CERTIFIED) H-1B (BY POSITIONS CERTIFIED )
City Name Positions Certified Average Wage Offer
Baltimore 217 $34.34
Columbia 135 $42.87
Rockville 102 $43.07
City Name Positions Certified Average Wage Offer
Baltimore 3,400 $70,506.32
Columbia 2,924 $78,443.62
Bethesda 2,010 $75,877.32
H-2B (BY POSITIONS CERTIFIED ) H-2A (BY POSITIONS CERTIFIED ) City Name Positions Certified Average Wage Offer
Rockville 897 $25,515.10
Owings Mills 582 $27,062.88
Fishing Creek 324 $23,628.80
City Name Positions Certified AEWR
Kennedyville 105 $11.29
Delmar 70 $11.29
Chesapeake City 46 $11.29
Top Five Occupations/Agricultural Commodities PERMANENT LABOR H-1B
Occupation Positions Certified
Average Wage Offer
Software Developers, Applications 312 $48.85
Computer Systems Analysts 99 $42.25
Middle School Teachers, Except Special and Career/Technical Education 35 $22.98
Accountants and Auditors 31 $33.14
Network and Computer Systems Administrators 26 $42.83
Occupation Positions Certified
Average Wage Offer
Computer Systems Analysts 5,924 $71,707.56
Computer Programmers 2,118 $64,178.11
Software Developers, Applications 1,822 $87,551.69
Computer Occupations, All Other 926 $85,679.06
Software Developers, Systems Software 619 $89,521.86
H-2B H-2A
Occupation Positions Certified
Average Wage Offer
Landscaping and Groundskeeping Workers 2,847 $24,697.68
Amusement and Recreation Attendants 548 $20,163.52
Meat, Poultry, and Fish Cutters and Trimmers 445 $22,322.56
Nonfarm Animal Caretakers 147 $23,830.30
Janitors and Cleaners, Except Maids 132 $26,897.37
Occupation Positions Certified AEWR
Nursery and Greenhouse Workers 224 $11.29
Fruits and Vegetables 83 $11.29
Melons 70 $11.29
Horses 54 $11.29
General Farm Workers 46 $11.29

74 • APPENDIX A: STATE EMPLOYMENT-BASED IMMIGRATION PROFILES
Massachusetts State Summary
VISA CATEGORY
TOTAL APPLICATIONS PROCESSED
TOTAL APPLICATIONS CERTIFIED
TOTAL POSITIONS REQUESTED
TOTAL POSITIONS CERTIFIED
% OF TOTAL CERTIFIED APPLICATIONS
% OF TOTAL CERTIFIED POSITIONS
AVERAGE WAGE OFFER/AEWR
PERM 2,933 2,656 2,933 2,656 3.36% 3.36% $49.58
H-1B 23,134 20,936 47,542 45,414 3.82% 3.87% $80,521.39
H-2B 352 309 2,985 2,761 6.04% 2.71% $27,617.01
H-2A 120 118 466 459 1.18% 0.33% $11.26
Top Three Cities PERMANENT LABOR (BY POSITIONS CERTIFIED) H-1B (BY POSITIONS CERTIFIED )
City Name Positions Certified Average Wage Offer
Boston 484 $51.97
Cambridge 194 $51.94
Woburn 191 $52.61
City Name Positions Certified Average Wage Offer
Boston 13,861 $79,512.97
Cambridge 3,065 $82,748.79
Springfield 1,731 $83,250.40
H-2B (BY POSITIONS CERTIFIED ) H-2A (BY POSITIONS CERTIFIED ) City Name Positions Certified Average Wage Offer
Nantucket 640 $29,498.66
Provincetown 272 $25,938.79
Wellfleet 125 $23,878.40
City Name Positions Certified AEWR
Lunenburg 43 $11.26
Sterling 31 $11.26
Harvard 26 $11.26
Top Five Occupations/Agricultural Commodities PERMANENT LABOR H-1B
Occupation Positions Certified
Average Wage Offer
Software Developers, Applications 1052 $49.80
Computer Systems Analysts 294 $45.21
Software Developers, Systems Software 143 $51.25
Electronics Engineers, Except Computer 80 $47.93
Computer and Information Systems Managers 75 $66.07
Occupation Positions Certified
Average Wage Offer
Computer Systems Analysts 11,794 $76,367.84
Software Developers, Applications 5,929 $89,986.92
Computer Occupations, All Other 4,471 $78,173.19
Computer Programmers 4,077 $67,589.23
Software Developers, Systems Software 2,403 $102,736.80
H-2B H-2A
Occupation Positions Certified
Average Wage Offer
Maids and Housekeeping Cleaners 600 $26,875.11
Laborers and Freight, Stock, and Material Movers 248 $30,795.56
Cooks, Restaurant 247 $28,885.46
Food Preparation Workers 200 $23,805.60
Waiters and Waitresses 197 $26,062.40
Occupation Positions Certified AEWR
Fruits and Vegetables 158 $11.26
Apples 158 $11.26
Nursery and Greenhouse Workers 50 $11.26
Squash 18 $11.26
Tobacco 17 $11.26

75 • OFFICE OF FOREIGN LABOR CERTIFICATION
Michigan State Summary
VISA CATEGORY
TOTAL APPLICATIONS PROCESSED
TOTAL APPLICATIONS CERTIFIED
TOTAL POSITIONS REQUESTED
TOTAL POSITIONS CERTIFIED
% OF TOTAL CERTIFIED APPLICATIONS
% OF TOTAL CERTIFIED POSITIONS
AVERAGE WAGE OFFER/AEWR
PERM 2,544 2,330 2,544 2,330 2.95% 2.95% $42.34
H-1B 18,131 16,674 30,184 29,041 2.99% 2.48% $72,687.53
H-2B 172 141 2,607 2,267 2.76% 2.23% $23,353.91
H-2A 55 50 2,608 2,226 0.50% 1.59% $11.56
Top Three Cities PERMANENT LABOR (BY POSITIONS CERTIFIED) H-1B (BY POSITIONS CERTIFIED )
City Name Positions Certified Average Wage Offer
Troy 419 $41.03
Farmington Hills 393 $38.80
Southfield 220 $38.95
City Name Positions Certified Average Wage Offer
Troy 4,183 $66,490.72
Detroit 3,105 $77,454.67
Farmington Hills 2,579 $68,646.55
H-2B (BY POSITIONS CERTIFIED ) H-2A (BY POSITIONS CERTIFIED )
City Name Positions Certified Average Wage Offer
Mackinac Island 975 $20,772.15
Mackinaw City 240 $20,449.87
Acme 100 $20,644.00
City Name Positions Certified AEWR
Kent City 339 $11.56
Sodus 265 $11.56
Carleton 225 $11.56
Top Five Occupations/Agricultural Commodities PERMANENT LABOR H-1B
Occupation Positions Certified
Average Wage Offer
Software Developers, Applications 977 $38.99
Mechanical Engineers 229 $42.00
Software Developers, Systems Software 216 $43.64
Computer Systems Analysts 136 $39.70
Electrical Engineers 55 $41.18
Occupation Positions Certified
Average Wage Offer
Computer Systems Analysts 7,217 $68,537.14
Software Developers, Applications 4,110 $74,381.05
Computer Programmers 3,945 $61,999.94
Computer Occupations, All Other 2,276 $70,831.26
Mechanical Engineers 1,663 $77,318.39
H-2B H-2A
Occupation Positions Certified
Average Wage Offer
Landscaping and Groundskeeping Workers 564 $26,677.30
Maids and Housekeeping Cleaners 498 $20,159.36
Waiters and Waitresses 176 $20,404.80
Food Preparation Workers 174 $19,851.52
Amusement and Recreation Attendants 144 $18,736.64
Occupation Positions Certified AEWR
Apples 532 $11.56
Trees 350 $11.56
Melons 225 $11.56
Corn 204 $11.56
General Farm Workers 174 $11.56

76 • APPENDIX A: STATE EMPLOYMENT-BASED IMMIGRATION PROFILES
Minnesota State Summary
VISA CATEGORY
TOTAL APPLICATIONS PROCESSED
TOTAL APPLICATIONS CERTIFIED
TOTAL POSITIONS REQUESTED
TOTAL POSITIONS CERTIFIED
% OF TOTAL CERTIFIED APPLICATIONS
% OF TOTAL CERTIFIED POSITIONS
AVERAGE WAGE OFFER/AEWR
PERM 674 621 674 621 0.79% 0.79% $50.89
H-1B 9,926 9,285 22,380 21,683 1.64% 1.85% $75,453.03
H-2B 95 69 1,694 1,297 1.35% 1.27% $26,672.23
H-2A 108 96 1,390 1,177 0.96% 0.84% $11.56
Top Three Cities PERMANENT LABOR (BY POSITIONS CERTIFIED) H-1B (BY POSITIONS CERTIFIED )
City Name Positions Certified Average Wage Offer
Minneapolis 144 $49.41
Bloomington 53 $44.74
Eagan 43 $44.67
City Name Positions Certified Average Wage Offer
Minneapolis 8,513 $74,722.73
Richfield 1,739 $72,296.65
Brooklyn Park 1,271 $72,894.84
H-2B (BY POSITIONS CERTIFIED ) H-2A (BY POSITIONS CERTIFIED ) City Name Positions Certified Average Wage Offer
Fergus Falls 189 $25,382.93
Medina 135 $30,108.00
Hancock 83 $31,304.00
City Name Positions Certified AEWR
Newport 181 $11.56
Morris 147 $11.56
Foley 100 $11.56
Top Five Occupations/Agricultural Commodities PERMANENT LABOR H-1B
Occupation Positions Certified
Average Wage Offer
Software Developers, Applications 183 $45.70
Computer Systems Analysts 51 $41.82
Software Developers, Systems Software 28 $48.54
Electronics Engineers, Except Computer 24 $38.57
Mechanical Engineers 23 $42.02
Occupation Positions Certified
Average Wage Offer
Computer Systems Analysts 5,681 $73,330.12
Computer Programmers 3,910 $65,412.83
Computer Occupations, All Other 3,418 $69,342.97
Software Developers, Applications 2,026 $83,721.45
Software Developers, Systems Software 1,234 $93,343.64
H-2B H-2A
Occupation Positions Certified
Average Wage Offer
Landscaping and Groundskeeping Workers 381 $27,754.13
Team Assemblers 175 $31,033.60
Amusement and Recreation Attendants 163 $17,859.40
Packers and Packagers, Hand 150 $24,554.40
Construction Laborers 113 $33,401.33
Occupation Positions Certified AEWR
Nursery and Greenhouse Workers 296 $11.56
Agricultural Equipment Operators 167 $11.56
Hay and Straw 127 $11.56
Fruits and Vegetables 125 $11.56
Grains 102 $11.56

77 • OFFICE OF FOREIGN LABOR CERTIFICATION
Occupation Positions Certified
Average Wage Offer
Computer Systems Analysts 205 $64,050.37
Software Developers, Applications 83 $73,363.60
Computer Programmers 75 $66,889.48
Physicians And Surgeons, All Other 58 $291,101.73
Health Specialties Teachers, Postsecondary 38 $193,011.06
Mississippi State Summary
VISA CATEGORY
TOTAL APPLICATIONS PROCESSED
TOTAL APPLICATIONS CERTIFIED
TOTAL POSITIONS REQUESTED
TOTAL POSITIONS CERTIFIED
% OF TOTAL CERTIFIED APPLICATIONS
% OF TOTAL CERTIFIED POSITIONS
AVERAGE WAGE OFFER/AEWR
PERM 226 89 226 89 0.11% 0.11% $32.35
H-1B 790 683 1,014 936 0.13% 0.08% $94,663.02
H-2B 53 43 2,269 1,855 0.84% 1.82% $24,885.02
H-2A 50 48 844 839 0.48% 0.60% $10.18
Top Three Cities PERMANENT LABOR (BY POSITIONS CERTIFIED) H-1B (BY POSITIONS CERTIFIED )
City Name Positions Certified Average Wage Offer
Itta Bena 27 $8.19
Jackson 7 $48.51
Mississippi State 6 $30.84
City Name Positions Certified Average Wage Offer
Jackson 219 $89,981.87
Ridgeland 132 $68,886.58
Starkville 83 $135,971.21
H-2B (BY POSITIONS CERTIFIED ) H-2A (BY POSITIONS CERTIFIED ) City Name Positions Certified Average Wage Offer
Corinth 704 $20,092.80
Ackerman 165 $25,318.80
Pass Christian 149 $18,595.20
City Name Positions Certified AEWR
Lucedale 557 $10.18
Vardaman 483 $10.18
Calhoun City 393 $10.18
Top Five Occupations/Agricultural Commodities PERMANENT LABOR H-1B
Occupation Positions Certified
Average Wage Offer
Meat, Poultry, and Fish Cutters and Trimmers 27 $8.19
Software Developers, Applications 5 $32.84
Secondary School Teachers, Except Special and Career/Technical Education 5 $19.52
Physicians and Surgeons, All Other 4 $101.76
Health Specialties Teachers, Postsecondary 3 $56.13
H-2B H-2A
Occupation Positions Certified
Average Wage Offer
Forest and Conservation Workers 1,097 $24,739.87
Landscaping and Groundskeeping Workers 238 $22,657.14
Meat, Poultry, and Fish Cutters and Trimmers 149 $18,595.20
Construction Laborers 107 $24,094.72
Fishers and Related Fishing Workers 88 $36,836.80
Occupation Positions Certified AEWR
Sweet Potatoes 1,092 $10.18
Berries 509 $10.18
Agricultural Equipment Operators 319 $10.18
Potatoes 199 $10.18
Fruits and Vegetables 196 $10.18

78 • APPENDIX A: STATE EMPLOYMENT-BASED IMMIGRATION PROFILES
Missouri State Summary
VISA CATEGORY
TOTAL APPLICATIONS PROCESSED
TOTAL APPLICATIONS CERTIFIED
TOTAL POSITIONS REQUESTED
TOTAL POSITIONS CERTIFIED
% OF TOTAL CERTIFIED APPLICATIONS
% OF TOTAL CERTIFIED POSITIONS
AVERAGE WAGE OFFER/AEWR
PERM 624 568 624 568 0.72% 0.72% $44.08
H-1B 7,140 6,431 12,966 12,499 1.18% 1.07% $74,891.52
H-2B 182 149 3,233 2,671 2.91% 2.62% $26,311.58
H-2A 139 126 3,697 3,325 1.26% 2.38% $12.62
Top Three Cities PERMANENT LABOR (BY POSITIONS CERTIFIED) H-1B (BY POSITIONS CERTIFIED )
City Name Positions Certified Average Wage Offer
St. Louis 130 $48.93
North Kansas City 93 $32.21
Kansas City 66 $38.48
City Name Positions Certified Average Wage Offer
St. Louis 5,473 $72,066.52
Kansas City 2,296 $73,003.60
O'Fallon 1,083 $73,709.98
H-2B (BY POSITIONS CERTIFIED ) H-2A (BY POSITIONS CERTIFIED ) City Name Positions Certified Average Wage Offer
St. Louis 452 $28,773.68
St. Charles 248 $26,026.00
Branson 179 $20,917.24
City Name Positions Certified AEWR
Farmington 159 $12.62
Hornersville 90 $12.62
Savannah 67 $12.62
Top Five Occupations/Agricultural Commodities PERMANENT LABOR H-1B
Occupation Positions Certified
Average Wage Offer
Software Developers, Applications 265 $40.83
Computer Systems Analysts 33 $41.56
Electrical Engineers 21 $44.55
Physicians and Surgeons, All Other 17 $103.22
Internists, General 14 $98.92
Occupation Positions Certified
Average Wage Offer
Computer Systems Analysts 4,095 $71,757.01
Computer Occupations, All Other 1,672 $71,420.64
Computer Programmers 1,591 $63,972.47
Software Developers, Applications 1,510 $78,314.82
Software Developers, Systems Software 589 $95,851.66
H-2B H-2A
Occupation Positions Certified
Average Wage Offer
Landscaping and Groundskeeping Workers 2,136 $25,803.04
Maids and Housekeeping Cleaners 185 $18,904.60
Amusement and Recreation Attendants 102 $17,655.04
Cement Masons and Concrete Finishers 95 $39,908.27
Helpers-Brickmasons, Blockmasons, Stonemasons 45 $36,233.60
Occupation Positions Certified AEWR
Construction of Livestock Buildings 293 $12.62
Tomatoes 132 $12.62
Melons 115 $12.62
Apples 80 $12.62
Tobacco 62 $12.62

79 • OFFICE OF FOREIGN LABOR CERTIFICATION
Montana State Summary
VISA CATEGORY
TOTAL APPLICATIONS PROCESSED
TOTAL APPLICATIONS CERTIFIED
TOTAL POSITIONS REQUESTED
TOTAL POSITIONS CERTIFIED
% OF TOTAL CERTIFIED APPLICATIONS
% OF TOTAL CERTIFIED POSITIONS
AVERAGE WAGE OFFER/AEWR
PERM 28 20 28 20 0.03% 0.03% $52.69
H-1B 191 171 424 396 0.03% 0.03% $74,677.68
H-2B 59 39 657 480 0.76% 0.47% $22,893.87
H-2A 247 238 640 614 2.39% 0.44% $11.14
Top Three Cities PERMANENT LABOR (BY POSITIONS CERTIFIED) H-1B (BY POSITIONS CERTIFIED )
City Name Positions Certified Average Wage Offer
Great Falls 4 $69.63
Butte 3 $8.91
Billings 3 $99.74
City Name Positions Certified Average Wage Offer
Helena 134 $60,000.00
Harlem 89 $73,819.25
Bozeman 64 $61,226.39
H-2B (BY POSITIONS CERTIFIED ) H-2A (BY POSITIONS CERTIFIED ) City Name Positions Certified Average Wage Offer
Great Falls 120 $36,427.73
West Yellowstone 96 $19,796.98
Billings 74 $20,184.91
City Name Positions Certified AEWR
Dillon 91 $11.14
Wisdom 24 $11.14
Polson 21 $11.14
Top Five Occupations/Agricultural Commodities PERMANENT LABOR H-1B
Occupation Positions Certified
Average Wage Offer
Janitors and Cleaners, Except Maids and Housekeeping Cleaners 4 $8.83
Software Developers, Applications 3 $43.30
Cooks, Restaurant 2 $11.24
Internists, General 2 $90.00
Dental Laboratory Tech. 1 $12.00
Occupation Positions Certified
Average Wage Offer
Software Developers, Systems Software 70 $72,048.20
Computer Programmers 69 $60,778.76
Computer Systems Analysts 60 $65,014.83
Software Developers, Applications 36 $86,572.00
Management Analysts 30 $52,550.00
H-2B H-2A
Occupation Positions Certified
Average Wage Offer
Maids and Housekeeping Cleaners 175 $19,625.96
Heavy and Tractor-Trailer Truck Drivers 80 $41,724.80
Construction Laborers 70 $35,214.40
Laundry and Dry-Cleaning Workers 46 $19,084.00
Combined Food Preparation and Serving Workers 36 $20,182.93
Occupation Positions Certified AEWR
Livestock 194 $11.14
Hay and Straw 169 $11.14
Grains 88 $11.14
Agricultural Equipment Operators 53 $11.14
Nursery and Greenhouse Workers 26 $11.14

80 • APPENDIX A: STATE EMPLOYMENT-BASED IMMIGRATION PROFILES
Nebraska State Summary
VISA CATEGORY
TOTAL APPLICATIONS PROCESSED
TOTAL APPLICATIONS CERTIFIED
TOTAL POSITIONS REQUESTED
TOTAL POSITIONS CERTIFIED
% OF TOTAL CERTIFIED APPLICATIONS
% OF TOTAL CERTIFIED POSITIONS
AVERAGE WAGE OFFER/AEWR
PERM 286 249 286 249 0.32% 0.32% $38.21
H-1B 1,805 1,621 3,670 3,438 0.30% 0.29% $73,628.80
H-2B 66 52 1,300 1,119 1.02% 1.10%
H-2A 62 60 726 703 0.60% 0.50% $13.59
Top Three Cities PERMANENT LABOR (BY POSITIONS CERTIFIED) H-1B (BY POSITIONS CERTIFIED )
City Name Positions Certified Average Wage Offer
Omaha 145 $39.38
Lincoln 27 $38.53
Tecumseh 26 $11.60
City Name Positions Certified Average Wage Offer
Omaha 2,699 $72,277.01
Lincoln 423 $64,250.03
Sidney 82 $74,131.84
H-2B (BY POSITIONS CERTIFIED ) H-2A (BY POSITIONS CERTIFIED ) City Name Positions Certified Average Wage Offer
Lincoln 845 $26,024.96
Scottsbluff 145 $38,590.93
Omaha 40 $24,232.00
City Name Positions Certified AEWR
Minden 74 $13.59
Lyons 66 $13.59
Columbus 66 $13.59
Top Five Occupations/Agricultural Commodities PERMANENT LABOR H-1B
Occupation Positions Certified
Average Wage Offer
Software Developers, Applications 104 $38.90
Meat, Poultry, and Fish Cutters and Trimmers 26 $11.60
Computer Systems Analysts 15 $36.53
Physicians and Surgeons, All Other 9 $102.11
Slaughterers and Meat Packers 7 $10.05
Occupation Positions Certified
Average Wage Offer
Computer Systems Analysts 1,194 $68,339.97
Software Developers, Applications 485 $80,949.08
Computer Programmers 339 $63,575.69
Computer Occupations, All Other 246 $70,532.08
Software Developers, Systems Software 208 $93,390.98
H-2AH-2B
Occupation Positions Certified
Average Wage Offer
Landscaping and Groundskeeping Workers 802 $25,885.60
Heavy and Tractor-Trailer Truck Drivers 130 $38,070.93
Helpers-Roofers 64 $23,212.80
Roofers 59 $34,538.40
Amusement and Recreation Attendants 18 $17,430.40
Occupation Positions Certified AEWR
Construction of Livestock Buildings 200 $13.59
Corn 177 $13.59
Agricultural Equipment Operators 104 $13.59
Grains 72 $13.59
Fruits and Vegetables 62 $13.59

81 • OFFICE OF FOREIGN LABOR CERTIFICATION
Nevada State Summary
VISA CATEGORY
TOTAL APPLICATIONS PROCESSED
TOTAL APPLICATIONS CERTIFIED
TOTAL POSITIONS REQUESTED
TOTAL POSITIONS CERTIFIED
% OF TOTAL CERTIFIED APPLICATIONS
% OF TOTAL CERTIFIED POSITIONS
AVERAGE WAGE OFFER/AEWR
PERM 170 145 170 145 0.18% 0.18% $43.36
H-1B 1,261 1,107 2,672 2,526 0.21% 0.22% $78,110.32
H-2B 24 16 999 665 0.31% 0.65% $21,126.30
H-2A 59 57 1,971 1,940 0.57% 1.39% $11.37
Top Three Cities PERMANENT LABOR (BY POSITIONS CERTIFIED) H-1B (BY POSITIONS CERTIFIED )
City Name Positions Certified Average Wage Offer
Las Vegas 87 $45.43
Reno 22 $37.96
Henderson 16 $38.77
City Name Positions Certified Average Wage Offer
Las Vegas 1,729 $76,144.13
Reno 386 $78,204.12
Carson City 191 $92,626.48
H-2B (BY POSITIONS CERTIFIED ) H-2A (BY POSITIONS CERTIFIED ) City Name Positions Certified Average Wage Offer
Las Vegas 484 $19,110.00
North Las Vegas 70 $20,647.47
Stateline 60 $21,964.80
City Name Positions Certified AEWR
Yerington 1,835 $11.37
Ely 36 $11.37
Gerlach 20 $11.37
Top Five Occupations/Agricultural Commodities PERMANENT LABOR H-1B
Occupation Positions Certified
Average Wage Offer
Software Developers, Applications 33 $42.90
Accountants and Auditors 10 $24.77
Civil Engineers 7 $35.15
Computer Systems Analysts 7 $43.61
Marketing Managers 5 $54.71
Occupation Positions Certified
Average Wage Offer
Computer Systems Analysts 817 $72,242.80
Computer Occupations, All Other 279 $64,326.60
Software Developers, Applications 228 $83,382.17
Computer Programmers 179 $62,212.14
Accountants And Auditors 144 $59,806.78
H-2B H-2A
Occupation Positions Certified
Average Wage Offer
Gaming Dealers 225 $17,160.00
Construction Laborers 222 $19,294.60
Maids and Housekeeping Cleaners 60 $21,964.80
Helpers-Carpenters 45 $26,644.80
Amusement and Recreation Attendants 40 $17,284.80
Occupation Positions Certified AEWR
Lettuce 729 $11.37
Onions 449 $11.37
Broccoli 205 $11.37
General Farm Workers 185 $11.37
Garlic 177 $11.37

82 • APPENDIX A: STATE EMPLOYMENT-BASED IMMIGRATION PROFILES
New Hampshire State Summary
VISA CATEGORY
TOTAL APPLICATIONS PROCESSED
TOTAL APPLICATIONS CERTIFIED
TOTAL POSITIONS REQUESTED
TOTAL POSITIONS CERTIFIED
% OF TOTAL CERTIFIED APPLICATIONS
% OF TOTAL CERTIFIED POSITIONS
AVERAGE WAGE OFFER/AEWR
PERM 191 179 191 179 0.23% 0.23% $48.08
H-1B 2,071 1,805 4,001 3,841 0.34% 0.33% $78,067.65
H-2B 33 31 395 368 0.61% 0.36% $25,176.05
H-2A 44 43 167 166 0.43% 0.12% $11.26
Top Three Cities PERMANENT LABOR (BY POSITIONS CERTIFIED) H-1B (BY POSITIONS CERTIFIED )
City Name Positions Certified Average Wage Offer
Nashua 57 $46.26
Manchester 20 $50.19
Lebanon 16 $48.47
City Name Positions Certified Average Wage Offer
Portsmouth 714 $74,776.89
Concord 514 $73,767.30
Nashua 509 $75,107.46
H-2B (BY POSITIONS CERTIFIED ) H-2A (BY POSITIONS CERTIFIED ) City Name Positions Certified Average Wage Offer
Hollis 70 $27,248.00
Laconia 50 $19,503.47
Melvin Village 38 $23,899.20
City Name Positions Certified AEWR
Hollis 59 $11.26
Hampton Falls 28 $11.26
Orford 17 $11.26
Top Five Occupations/Agricultural Commodities PERMANENT LABOR H-1B
Occupation Positions Certified
Average Wage Offer
Software Developers, Applications 68 $47.52
Computer Systems Analysts 17 $47.57
Software Developers, Systems Software 12 $52.87
Database Administrators 7 $39.98
Electronics Engineers, Except Computer 7 $43.15
Occupation Positions Certified
Average Wage Offer
Computer Systems Analysts 1,476 $73,564.54
Computer Programmers 548 $64,425.53
Computer Occupations, All Other 417 $68,048.43
Software Developers, Applications 375 $80,830.32
Software Developers, Systems Software 195 $98,967.00
H-2B H-2A
Occupation Positions Certified
Average Wage Offer
Landscaping and Groundskeeping Workers 115 $27,934.40
Amusement and Recreation Attendants 65 $18,747.73
Maids and Housekeeping Cleaners 50 $22,672.00
Waiters and Waitresses 42 $20,748.00
Coaches and Scouts 24 $38,136.80
Occupation Positions Certified AEWR
Apples 79 $11.26
Fruits and Vegetables 46 $11.26
Trees 17 $11.26
Nursery and Greenhouse Workers 13 $11.26
Berries 5 $11.26

83 • OFFICE OF FOREIGN LABOR CERTIFICATION
New Jersey State Summary
VISA CATEGORY
TOTAL APPLICATIONS PROCESSED
TOTAL APPLICATIONS CERTIFIED
TOTAL POSITIONS REQUESTED
TOTAL POSITIONS CERTIFIED
% OF TOTAL CERTIFIED APPLICATIONS
% OF TOTAL CERTIFIED POSITIONS
AVERAGE WAGE OFFER/AEWR
PERM 7,172 6,257 7,172 6,257 7.93% 7.93% $44.11
H-1B 47,291 44,366 88,826 85,602 7.81% 7.30% $73,683.28
H-2B 218 176 3,370 2,764 3.44% 2.72% $29,652.88
H-2A 41 39 814 806 0.39% 0.58% $11.29
Top Three Cities PERMANENT LABOR (BY POSITIONS CERTIFIED) H-1B (BY POSITIONS CERTIFIED )
City Name Positions Certified Average Wage Offer
Edison 832 $43.11
Teaneck 656 $36.18
Jersey City 562 $53.32
City Name Positions Certified Average Wage Offer
Jersey City 12,861 $81,891.36
Princeton 5,200 $67,900.05
Teaneck 5,070 $72,091.76
H-2B (BY POSITIONS CERTIFIED ) H-2A (BY POSITIONS CERTIFIED )
City Name Positions Certified Average Wage Offer
Jackson 334 $23,881.87
Cedar Knolls 252 $30,852.64
Hopewell 150 $30,950.40
City Name Positions Certified AEWR
Elmer 126 $11.29
Swedesboro 100 $11.29
Monroeville 89 $11.29
Top Five Occupations/Agricultural Commodities PERMANENT LABOR H-1B
Occupation Positions Certified
Average Wage Offer
Software Developers, Applications 2875 $45.65
Computer Systems Analysts 1355 $40.92
Network and Computer Systems Administrators 163 $42.68
Computer and Information Systems Managers 152 $69.25
Database Administrators 137 $44.03
Occupation Positions Certified
Average Wage Offer
Computer Systems Analysts 24,550 $74,991.70
Computer Programmers 18,181 $65,911.40
Computer Occupations, All Other 11,561 $69,446.14
Software Developers, Applications 9,779 $85,010.89
Management Analysts 3,299 $80,524.14
H-2B H-2A
Occupation Positions Certified
Average Wage Offer
Landscaping and Groundskeeping Workers 1,593 $29,166.85
Recreation Workers 347 $29,440.67
Coaches and Scouts 278 $45,726.49
Counter Attendants, Cafeteria, Food Concession, 150 $19,344.00
Amusement and Recreation Attendants 111 $18,889.87
Occupation Positions Certified AEWR
Fruits and Vegetables 287 $11.29
Peaches 126 $11.29
Nursery and Greenhouse Workers 126 $11.29
Peppers 89 $11.29
Asparagus 80 $11.29

84 • APPENDIX A: STATE EMPLOYMENT-BASED IMMIGRATION PROFILES
New Mexico State Summary
VISA CATEGORY
TOTAL APPLICATIONS PROCESSED
TOTAL APPLICATIONS CERTIFIED
TOTAL POSITIONS REQUESTED
TOTAL POSITIONS CERTIFIED
% OF TOTAL CERTIFIED APPLICATIONS
% OF TOTAL CERTIFIED POSITIONS
AVERAGE WAGE OFFER/AEWR
PERM 194 152 194 152 0.19% 0.19% $54.34
H-1B 992 883 1,603 1,454 0.16% 0.12% $83,650.98
H-2B 7 4 104 66 0.08% 0.06% $20,467.20
H-2A 41 38 303 244 0.38% 0.17% $10.54
Top Three Cities PERMANENT LABOR (BY POSITIONS CERTIFIED) H-1B (BY POSITIONS CERTIFIED )
City Name Positions Certified Average Wage Offer
Albuquerque 51 $64.25
Shiprock 24 $19.78
Gallup 12 $61.73
City Name Positions Certified Average Wage Offer
Albuquerque 599 $78,002.48
Santa Fe 281 $64,191.64
Gallup 71 $57,610.28
H-2B (BY POSITIONS CERTIFIED ) H-2A (BY POSITIONS CERTIFIED ) City Name Positions Certified Average Wage Offer
Sunland Park 29 $22,474.40
Vado 22 $18,720.00
Moriarty 15 $18,200.00
City Name Positions Certified AEWR
Hobbs 48 $10.54
Dexter 43 $10.54
Clayton 30 $10.54
Top Five Occupations/Agricultural Commodities PERMANENT LABOR H-1B
Occupation Positions Certified
Average Wage Offer
Internists, General 25 $106.35
Secondary School Teachers, Except Special and Career/Technical Education 12 $19.94
Software Developers, Applications 11 $39.66
Special Education Teachers, Preschool, Kindergarten, and Elementary School 10 $18.81
Elementary School Teachers, Except Special Education 9 $21.65
Occupation Positions Certified
Average Wage Offer
Computer Systems Analysts 387 $66,579.40
Software Developers, Applications 177 $69,100.41
Physical Therapists 123 $67,127.09
Software Developers, Systems Software 108 $82,058.08
Internists, General 49 $227,792.55
H-2B H-2A
Occupation Positions Certified
Average Wage Offer
Nonfarm Animal Caretakers 29 $22,474.40
Construction Laborers 22 $18,720.00
Amusement and Recreation Attendants 15 $18,200.00
— — —
— — —
Occupation Positions Certified AEWR
Agricultural Equipment Operators 102 $10.54
Grains 65 $10.54
Livestock 29 $10.54
Cotton 20 $10.54
Nursery and Greenhouse Workers 12 $10.54

85 • OFFICE OF FOREIGN LABOR CERTIFICATION
New York State Summary
VISA CATEGORY
TOTAL APPLICATIONS PROCESSED
TOTAL APPLICATIONS CERTIFIED
TOTAL POSITIONS REQUESTED
TOTAL POSITIONS CERTIFIED
% OF TOTAL CERTIFIED APPLICATIONS
% OF TOTAL CERTIFIED POSITIONS
AVERAGE WAGE OFFER/AEWR
PERM 6,901 6,098 6,901 6,098 7.73% 7.73% $50.49
H-1B 51,160 46,561 98,022 93,560 8.44% 7.98% $82,057.15
H-2B 390 332 3,639 3,263 6.49% 3.21% $28,398.89
H-2A 352 331 5,219 5,039 3.32% 3.60% $11.26
Top Three Cities PERMANENT LABOR (BY POSITIONS CERTIFIED) H-1B (BY POSITIONS CERTIFIED )
City Name Positions Certified Average Wage Offer
New York 3,971 $55.88
Brooklyn 188 $32.28
Somers 141 $42.62
City Name Positions Certified Average Wage Offer
New York 63,502 $86,573.17
Brooklyn 5,173 $74,119.30
Melville 1,995 $71,285.95
H-2B (BY POSITIONS CERTIFIED ) H-2A (BY POSITIONS CERTIFIED ) City Name Positions Certified Average Wage Offer
Elmont 219 $24,141.24
Montauk 218 $23,586.40
Southampton 193 $28,431.10
City Name Positions Certified AEWR
Peru 570 $11.26
Wolcott 502 $11.26
Elba 478 $11.26
Top Five Occupations/Agricultural Commodities PERMANENT LABOR H-1B
Occupation Positions Certified
Average Wage Offer
Software Developers, Applications 1454 $51.53
Computer Systems Analysts 532 $46.59
Financial Analysts 432 $67.63
Accountants and Auditors 244 $44.19
Computer and Information Systems Managers 167 $71.35
Occupation Positions Certified
Average Wage Offer
Computer Systems Analysts 18,178 $75,906.27
Software Developers, Applications 8,699 $100,742.63
Computer Programmers 7,682 $66,731.34
Computer Occupations, All Other 6,659 $71,633.17
Financial Analysts 6,421 $99,935.31
H-2B H-2A
Occupation Positions Certified
Average Wage Offer
Landscaping and Groundskeeping Workers 1,124 $29,636.61
Nonfarm Animal Caretakers 659 $24,512.25
Waiters and Waitresses 255 $24,217.14
Farmworkers and Laborers, Crop, Nursery 128 $22,335.42
Amusement and Recreation Attendants 125 $21,013.20
Occupation Positions Certified AEWR
Apples 2,380 $11.26
Squash 305 $11.26
Berries 245 $11.26
Fruits and Vegetables 225 $11.26
Pears 200 $11.26

86 • APPENDIX A: STATE EMPLOYMENT-BASED IMMIGRATION PROFILES
North Carolina State Summary
VISA CATEGORY
TOTAL APPLICATIONS PROCESSED
TOTAL APPLICATIONS CERTIFIED
TOTAL POSITIONS REQUESTED
TOTAL POSITIONS CERTIFIED
% OF TOTAL CERTIFIED APPLICATIONS
% OF TOTAL CERTIFIED POSITIONS
AVERAGE WAGE OFFER/AEWR
PERM 2,034 1,666 2,034 1,666 2.11% 2.11% $36.60
H-1B 17,266 15,989 34,657 33,575 2.85% 2.86% $77,024.11
H-2B 157 123 4,206 3,412 2.41% 3.35% $22,026.35
H-2A 228 221 18,008 17,696 2.22% 12.66% $10.32
Top Three Cities PERMANENT LABOR (BY POSITIONS CERTIFIED) H-1B (BY POSITIONS CERTIFIED )
City Name Positions Certified Average Wage Offer
Charlotte 264 $47.38
Cary 189 $45.03
Raleigh 174 $43.60
City Name Positions Certified Average Wage Offer
Charlotte 12,771 $78,019.23
Cary 3,988 $77,247.72
Raleigh 3,322 $74,763.39
H-2B (BY POSITIONS CERTIFIED ) H-2A (BY POSITIONS CERTIFIED ) City Name Positions Certified Average Wage Offer
Newland 400 $20,832.69
Charlotte 287 $21,442.20
Indian Trail 240 $19,212.27
City Name Positions Certified AEWR
Vass 11,733 $10.32
Newton Grove 894 $10.32
Dunn 590 $10.32
Top Five Occupations/Agricultural Commodities PERMANENT LABOR H-1B
Occupation Positions Certified
Average Wage Offer
Software Developers, Applications 393 $46.45
Janitors and Cleaners, Except Maids and Housekeeping Cleaners 219 $8.08
Computer Systems Analysts 143 $42.24
Slaughterers and Meat Packers 107 $9.30
Meat, Poultry, and Fish Cutters and Trimmers 101 $8.18
Occupation Positions Certified
Average Wage Offer
Computer Systems Analysts 11,953 $74,045.84
Computer Programmers 4,484 $66,824.89
Software Developers, Applications 4,135 $87,043.93
Computer Occupations, All Other 3,554 $74,949.77
Software Developers, Systems Software 1,501 $95,638.04
H-2B H-2A
Occupation Positions Certified
Average Wage Offer
Landscaping and Groundskeeping Workers 1,717 $21,690.66
Meat, Poultry, and Fish Cutters and Trimmers 523 $18,005.24
Forest and Conservation Workers 280 $22,781.20
Maids and Housekeeping Cleaners 205 $20,818.72
Dishwashers 97 $17,877.60
Occupation Positions Certified AEWR
Tobacco 4,978 $10.32
Hay and Straw 3,766 $10.32
Sweet Potatoes 1,961 $10.32
Berries 1,471 $10.32
Turnips 1,315 $10.32

87 • OFFICE OF FOREIGN LABOR CERTIFICATION
North Dakota State Summary
VISA CATEGORY
TOTAL APPLICATIONS PROCESSED
TOTAL APPLICATIONS CERTIFIED
TOTAL POSITIONS REQUESTED
TOTAL POSITIONS CERTIFIED
% OF TOTAL CERTIFIED APPLICATIONS
% OF TOTAL CERTIFIED POSITIONS
AVERAGE WAGE OFFER/AEWR
PERM 92 71 92 71 0.09% 0.09% $64.46
H-1B 569 496 1,158 1,106 0.09% 0.09% $94,402.32
H-2B 98 68 1,244 804 1.33% 0.79% $31,030.54
H-2A 425 395 1,439 1,340 3.97% 0.96% $13.59
Top Three Cities PERMANENT LABOR (BY POSITIONS CERTIFIED) H-1B (BY POSITIONS CERTIFIED )
City Name Positions Certified Average Wage Offer
Fargo 32 $61.21
Minot 10 $95.49
Grand Forks 8 $87.95
City Name Positions Certified Average Wage Offer
Fargo 665 $96,075.16
Bismarck 191 $129,355.92
Minot 89 $90,524.84
H-2B (BY POSITIONS CERTIFIED ) H-2A (BY POSITIONS CERTIFIED ) City Name Positions Certified Average Wage Offer
Fargo 232 $34,064.85
Medora 129 $20,623.20
Dickinson 100 $32,687.20
City Name Positions Certified AEWR
Oakes 39 $13.59
Jamestown 36 $13.59
Devils Lake 32 $13.59
Top Five Occupations/Agricultural Commodities PERMANENT LABOR H-1B
Occupation Positions Certified
Average Wage Offer
Software Developers, Applications 13 $42.24
Internists, General 10 $114.32
Physicians and Surgeons, All Other 8 $132.17
Medical and Clinical Laboratory Technologists 6 $25.94
Engineering Teachers, Postsecondary 5 $38.80
Occupation Positions Certified
Average Wage Offer
Computer Systems Analysts 299 $70,571.39
Computer Occupations, All Other 157 $68,363.55
Software Developers, Systems Software 96 $72,040.98
Software Developers, Applications 80 $67,829.97
Computer Programmers 79 $64,562.81
H-2B H-2A
Occupation Positions Certified
Average Wage Offer
Landscaping and Groundskeeping Workers 164 $26,358.40
Cement Masons and Concrete Finishers 108 $31,907.20
Construction Laborers 107 $30,014.40
Maids and Housekeeping Cleaners 53 $18,761.60
Slaughterers and Meat Packers 50 $25,604.80
Occupation Positions Certified AEWR
Agricultural Equipment Operators 503 $13.59
Grains 249 $13.59
Bees 241 $13.59
Livestock 102 $13.59
Corn 99 $13.59

88 • APPENDIX A: STATE EMPLOYMENT-BASED IMMIGRATION PROFILES
Northern Mariana Islands State Summary
VISA CATEGORY
TOTAL APPLICATIONS PROCESSED
TOTAL APPLICATIONS CERTIFIED
TOTAL POSITIONS REQUESTED
TOTAL POSITIONS CERTIFIED
% OF TOTAL CERTIFIED APPLICATIONS
% OF TOTAL CERTIFIED POSITIONS
AVERAGE WAGE OFFER/AEWR
PERM 6 3 6 3 0.00% 0.00% $20.86
H-1B 75 57 80 59 0.01% 0.01% $39,629.48
H-2B — — — — — — —
H-2A — — — — — — —
Top Three Cities PERMANENT LABOR (BY POSITIONS CERTIFIED) H-1B (BY POSITIONS CERTIFIED )
City Name Positions Certified Average Wage Offer
Saipan 3 $21.95
— — —
— — —
City Name Positions Certified Average Wage Offer
Saipan 53 $39,996.64
Garapan 4 $40,820.20
Rota 3 $31,089.07
H-2B (BY POSITIONS CERTIFIED ) H-2A (BY POSITIONS CERTIFIED ) City Name Positions Certified Average Wage Offer
— — —
— — —
— — —
City Name Positions Certified AEWR
— — —
— — —
— — —
Top Five Occupations/Agricultural Commodities PERMANENT LABOR H-1B
Occupation Positions Certified
Average Wage Offer
Accountants and Auditors 2 $18.69
Purchasing Managers 1 $25.21
— — —
— — —
— — —
Occupation Positions Certified
Average Wage Offer
Accountants and Auditors 20 $34,171.48
Financial Managers 4 $43,135.50
Civil Engineers 4 $45,396.10
Elementary School Teachers, Except Special 4 $34,491.50
Secondary School Teachers, Except Special 3 $41,163.00
H-2B H-2A
Occupation Positions Certified
Average Wage Offer
— — —
— — —
— — —
— — —
— — —
Occupation Positions Certified AEWR
— — —
— — —
— — —
— — —
— — —

89 • OFFICE OF FOREIGN LABOR CERTIFICATION
Ohio State Summary
VISA CATEGORY
TOTAL APPLICATIONS PROCESSED
TOTAL APPLICATIONS CERTIFIED
TOTAL POSITIONS REQUESTED
TOTAL POSITIONS CERTIFIED
% OF TOTAL CERTIFIED APPLICATIONS
% OF TOTAL CERTIFIED POSITIONS
AVERAGE WAGE OFFER/AEWR
PERM 1,637 1,414 1,637 1,414 1.79% 1.79% $39.29
H-1B 15,973 14,926 34,013 32,808 2.64% 2.80% $73,407.49
H-2B 236 182 3,263 2,426 3.56% 2.38% $25,252.69
H-2A 60 51 1,106 1,027 0.51% 0.73% $11.61
Top Three Cities PERMANENT LABOR (BY POSITIONS CERTIFIED) H-1B (BY POSITIONS CERTIFIED )
City Name Positions Certified Average Wage Offer
Columbus 257 $42.60
Dublin 192 $44.03
Cleveland 112 $55.93
City Name Positions Certified Average Wage Offer
Columbus 6,651 $74,152.29
Cincinnati 5,282 $73,038.70
Cleveland 3,607 $70,005.13
H-2B (BY POSITIONS CERTIFIED ) H-2A (BY POSITIONS CERTIFIED ) City Name Positions Certified Average Wage Offer
Newbury 112 $25,694.93
Chesterland 101 $26,124.80
Cincinatti 91 $23,527.77
City Name Positions Certified AEWR
Avon 300 $11.61
Oakwood Village 174 $11.61
New Carlisle 82 $11.61
Top Five Occupations/Agricultural Commodities PERMANENT LABOR H-1B
Occupation Positions Certified
Average Wage Offer
Software Developers, Applications 468 $41.82
Meat, Poultry, and Fish Cutters and Trimmers 141 $9.47
Computer Systems Analysts 121 $42.35
Slaughterers and Meat Packers 61 $9.00
Internists, General 59 $88.49
Occupation Positions Certified
Average Wage Offer
Computer Systems Analysts 10,161 $71,333.53
Computer Programmers 6,038 $62,856.38
Software Developers, Applications 3,931 $77,549.94
Computer Occupations, All Other 3,263 $70,659.00
Software Developers, Systems Software 1,302 $88,601.44
H-2B H-2A
Occupation Positions Certified
Average Wage Offer
Landscaping and Groundskeeping Workers 1,790 $25,591.97
Amusement and Recreation Attendants 344 $18,397.60
Construction Laborers 67 $29,967.60
Helpers-Carpenters 56 $25,303.20
Helpers-Roofers 30 $21,964.80
Occupation Positions Certified AEWR
Nursery and Greenhouse Workers 679 $11.61
Construction of Livestock Buildings 116 $11.61
Fruits and Vegetables 87 $11.61
Cucumbers 43 $11.61
Agricultural Equipment Operators 24 $11.61

90 • APPENDIX A: STATE EMPLOYMENT-BASED IMMIGRATION PROFILES
Oklahoma State Summary
VISA CATEGORY
TOTAL APPLICATIONS PROCESSED
TOTAL APPLICATIONS CERTIFIED
TOTAL POSITIONS REQUESTED
TOTAL POSITIONS CERTIFIED
% OF TOTAL CERTIFIED APPLICATIONS
% OF TOTAL CERTIFIED POSITIONS
AVERAGE WAGE OFFER/AEWR
PERM 200 170 200 170 0.22% 0.22% $38.56
H-1B 2,028 1,849 3,591 3,420 0.33% 0.29% $70,603.52
H-2B 116 86 1,733 1,357 1.68% 1.33% $23,150.40
H-2A 73 71 510 501 0.71% 0.36% $10.35
Top Three Cities PERMANENT LABOR (BY POSITIONS CERTIFIED) H-1B (BY POSITIONS CERTIFIED )
City Name Positions Certified Average Wage Offer
Oklahoma City 50 $46.46
Tulsa 38 $33.65
Norman 19 $32.26
City Name Positions Certified Average Wage Offer
Tulsa 1,467 $73,986.64
Oklahoma City 1,167 $70,802.81
Bartlesville 241 $71,907.21
H-2B (BY POSITIONS CERTIFIED ) H-2A (BY POSITIONS CERTIFIED ) City Name Positions Certified Average Wage Offer
Tulsa 431 $23,209.47
Edmond 233 $24,065.60
Oklahoma City 183 $23,790.58
City Name Positions Certified AEWR
Altus 58 $10.35
Guthrie 46 $10.35
Capron 40 $10.35
Top Five Occupations/Agricultural Commodities PERMANENT LABOR H-1B
Occupation Positions Certified
Average Wage Offer
Medical and Clinical Laboratory Technologists 14 $22.28
Electrical Engineers 12 $32.54
Software Developers, Applications 12 $43.35
Computer Systems Analysts 11 $37.92
Instructional Coordinators 6 $22.12
Occupation Positions Certified
Average Wage Offer
Computer Systems Analysts 769 $68,894.71
Software Developers, Applications 357 $74,874.47
Computer Occupations, All Other 335 $66,111.84
Computer Programmers 265 $63,811.24
Accountants And Auditors 190 $48,754.42
H-2B H-2A
Occupation Positions Certified
Average Wage Offer
Landscaping and Groundskeeping Workers 1,037 $22,809.92
Construction Laborers 64 $23,342.80
Amusement and Recreation Attendants 50 $16,889.60
Forest and Conservation Workers 50 $25,625.60
Laborers and Freight, Stock, and Material Movers 43 $23,264.80
Occupation Positions Certified AEWR
Grains 146 $10.35
Agricultural Equipment Operators 94 $10.35
Cotton 58 $10.35
General Farm Workers 42 $10.35
Livestock 41 $10.35

91 • OFFICE OF FOREIGN LABOR CERTIFICATION
Oregon State Summary
VISA CATEGORY
TOTAL APPLICATIONS PROCESSED
TOTAL APPLICATIONS CERTIFIED
TOTAL POSITIONS REQUESTED
TOTAL POSITIONS CERTIFIED
% OF TOTAL CERTIFIED APPLICATIONS
% OF TOTAL CERTIFIED POSITIONS
AVERAGE WAGE OFFER/AEWR
PERM 1,237 1,023 1,237 1,023 1.30% 1.30% $43.01
H-1B 4,696 4,275 9,607 9,255 0.78% 0.79% $78,618.79
H-2B 34 23 1,764 1,473 0.45% 1.45% $24,997.98
H-2A 24 21 599 575 0.21% 0.41% $12.42
Top Three Cities PERMANENT LABOR (BY POSITIONS CERTIFIED) H-1B (BY POSITIONS CERTIFIED )
City Name Positions Certified Average Wage Offer
Hillsboro 761 $42.83
Portland 81 $43.63
Beaverton 58 $44.35
City Name Positions Certified Average Wage Offer
Hillsboro 2,644 $81,108.09
Portland 2,556 $75,831.50
Beaverton 2,466 $74,050.37
H-2B (BY POSITIONS CERTIFIED ) H-2A (BY POSITIONS CERTIFIED ) City Name Positions Certified Average Wage Offer
Central Point 343 $25,620.40
Phoenix 288 $25,636.00
Beaverton 265 $18,720.00
City Name Positions Certified AEWR
Echo 283 $12.42
Medford 90 $12.42
Hood River 54 $12.42
Top Five Occupations/Agricultural Commodities PERMANENT LABOR H-1B
Occupation Positions Certified
Average Wage Offer
Materials Engineers 292 $43.91
Electronics Engineers, Except Computer 243 $41.84
Software Developers, Systems Software 198 $43.02
Software Developers, Applications 76 $44.81
Cooks, Restaurant 28 $12.42
Occupation Positions Certified
Average Wage Offer
Computer Systems Analysts 2,923 $75,055.75
Computer Occupations, All Other 1,155 $73,079.67
Computer Programmers 915 $62,954.57
Software Developers, Applications 671 $83,995.37
Electronics Engineers, Except Computer 657 $90,351.61
H-2B H-2A
Occupation Positions Certified
Average Wage Offer
Forest and Conservation Workers 881 $25,668.50
Amusement and Recreation Attendants 353 $18,886.40
Landscaping and Groundskeeping Workers 121 $26,790.40
Floral Designers 99 $24,065.60
Pesticide Handlers, Sprayers, and Applicators 19 $29,952.00
Occupation Positions Certified AEWR
Cherries 283 $12.42
Pears 130 $12.42
Squash 36 $12.42
Leeks 34 $12.42
Berries 30 $12.42

92 • APPENDIX A: STATE EMPLOYMENT-BASED IMMIGRATION PROFILES
Pennsylvania State Summary
VISA CATEGORY
TOTAL APPLICATIONS PROCESSED
TOTAL APPLICATIONS CERTIFIED
TOTAL POSITIONS REQUESTED
TOTAL POSITIONS CERTIFIED
% OF TOTAL CERTIFIED APPLICATIONS
% OF TOTAL CERTIFIED POSITIONS
AVERAGE WAGE OFFER/AEWR
PERM 2,016 1,799 2,016 1,799 2.28% 2.28% $45.84
H-1B 22,009 20,438 64,857 63,058 3.63% 5.38% $75,204.45
H-2B 308 251 4,456 3,659 4.91% 3.60% $28,372.03
H-2A 83 74 821 777 0.74% 0.56% $11.29
Top Three Cities PERMANENT LABOR (BY POSITIONS CERTIFIED) H-1B (BY POSITIONS CERTIFIED )
City Name Positions Certified Average Wage Offer
Philadelphia 249 $48.87
Pittsburgh 238 $48.25
Canonsburg 121 $44.52
City Name Positions Certified Average Wage Offer
Philadelphia 29,346 $75,963.65
Pittsburgh 7,324 $72,203.31
Camp Hill 4,115 $67,849.14
H-2B (BY POSITIONS CERTIFIED ) H-2A (BY POSITIONS CERTIFIED ) City Name Positions Certified Average Wage Offer
Pittsburgh 365 $25,068.38
Farmington 174 $19,905.60
McMurray 154 $37,024.00
City Name Positions Certified AEWR
Orefield 73 $11.29
Dillsburg 56 $11.29
Morris 48 $11.29
Top Five Occupations/Agricultural Commodities PERMANENT LABOR H-1B
Occupation Positions Certified
Average Wage Offer
Software Developers, Applications 681 $45.06
Computer Systems Analysts 133 $41.11
Internists, General 67 $90.66
Computer and Information Systems Managers 47 $64.89
Statisticians 41 $37.41
Occupation Positions Certified
Average Wage Offer
Computer Systems Analysts 25,849 $71,849.83
Software Developers, Systems Software 6,801 $85,129.30
Computer Programmers 4,856 $82,723.69
Software Developers, Applications 4,835 $64,792.29
Financial Analysts 3,249 $78,565.22
H-2B H-2A
Occupation Positions Certified
Average Wage Offer
Landscaping and Groundskeeping Workers 2,640 $28,163.96
Coaches and Scouts 151 $40,851.20
Amusement and Recreation Attendants 151 $18,643.73
Helpers--Production Workers 121 $26,719.09
Laundry and Dry-Cleaning Workers 89 $22,734.40
Occupation Positions Certified AEWR
Nursery and Greenhouse Workers 246 $11.29
Fruits and Vegetables 110 $11.29
Construction of Livestock Buildings 77 $11.29
Trees 73 $11.29
Poultry 73 $11.29

93 • OFFICE OF FOREIGN LABOR CERTIFICATION
Puerto Rico State Summary
VISA CATEGORY
TOTAL APPLICATIONS PROCESSED
TOTAL APPLICATIONS CERTIFIED
TOTAL POSITIONS REQUESTED
TOTAL POSITIONS CERTIFIED
% OF TOTAL CERTIFIED APPLICATIONS
% OF TOTAL CERTIFIED POSITIONS
AVERAGE WAGE OFFER/AEWR
PERM 53 31 53 31 0.04% 0.04% $32.67
H-1B 203 187 452 436 0.03% 0.04% $64,649.57
H-2B 3 2 33 17 0.04% 0.02% $20,540.00
H-2A — — — — — — —
Top Three Cities PERMANENT LABOR (BY POSITIONS CERTIFIED) H-1B (BY POSITIONS CERTIFIED )
City Name Positions Certified Average Wage Offer
San Juan 11 $30.41
Aguadilla 3 $42.61
Bayamon 3 $32.30
City Name Positions Certified Average Wage Offer
San Juan 277 $64,349.87
Aguadilla 31 $57,292.53
Barceloneta 30 $66,033.53
H-2B (BY POSITIONS CERTIFIED ) H-2A (BY POSITIONS CERTIFIED ) City Name Positions Certified Average Wage Offer
Gurabo 16 $23,899.20
San Juan 1 $17,180.80
— — —
City Name Positions Certified AEWR
— — —
— — —
— — —
Top Five Occupations/Agricultural Commodities PERMANENT LABOR H-1B
Occupation Positions Certified
Average Wage Offer
Software Developers, Applications 3 $25.40
Civil Engineers 3 $29.31
Financial Managers 2 $29.69
Computer Systems Analysts 2 $30.77
Electronics Engineers, Except Computer 2 $40.45
Occupation Positions Certified
Average Wage Offer
Computer Systems Analysts 79 $57,652.76
Electronics Engineers, Except Computer 67 $55,822.00
Financial Analysts 35 $93,000.00
Software Developers, Systems Software 20 $78,993.17
Operations Research Analysts 20 $32,240.00
H-2B H-2A
Occupation Positions Certified
Average Wage Offer
Welders, Cutters, Solderers, and Brazers 16 $23,899.20
Childcare Workers 1 $17,180.80
— — —
— — —
— — —
Occupation Positions Certified AEWR
— — —
— — —
— — —
— — —
— — —

94 • APPENDIX A: STATE EMPLOYMENT-BASED IMMIGRATION PROFILES
Rhode Island State Summary
VISA CATEGORY
TOTAL APPLICATIONS PROCESSED
TOTAL APPLICATIONS CERTIFIED
TOTAL POSITIONS REQUESTED
TOTAL POSITIONS CERTIFIED
% OF TOTAL CERTIFIED APPLICATIONS
% OF TOTAL CERTIFIED POSITIONS
AVERAGE WAGE OFFER/AEWR
PERM 152 128 152 128 0.16% 0.16% $48.13
H-1B 2,863 2,694 4,702 4,571 0.47% 0.39% $78,064.89
H-2B 23 18 424 327 0.35% 0.32% $25,255.82
H-2A 5 5 6 6 0.05% 0.00% $11.26
Top Three Cities PERMANENT LABOR (BY POSITIONS CERTIFIED) H-1B (BY POSITIONS CERTIFIED )
City Name Positions Certified Average Wage Offer
Providence 31 $48.11
Woonsocket 22 $51.65
Smithfield 20 $44.52
City Name Positions Certified Average Wage Offer
Providence 1,103 $75,937.91
Woonsocket 888 $78,622.20
Cranston 860 $83,091.00
H-2B (BY POSITIONS CERTIFIED ) H-2A (BY POSITIONS CERTIFIED ) City Name Positions Certified Average Wage Offer
Block Island 104 $22,443.20
Johnston 75 $19,739.20
Watch Hill 65 $24,322.13
City Name Positions Certified AEWR
Greenville 2 $11.26
North Scituate 2 $11.26
Johnston 2 $11.26
Top Five Occupations/Agricultural Commodities PERMANENT LABOR H-1B
Occupation Positions Certified
Average Wage Offer
Software Developers, Applications 51 $46.88
Computer Systems Analysts 11 $47.44
Internists, General 8 $80.44
Mechanical Engineers 4 $38.23
Computer and Information Systems Managers 3 $59.64
Occupation Positions Certified
Average Wage Offer
Computer Systems Analysts 1,606 $73,500.02
Computer Occupations, All Other 891 $75,456.46
Computer Programmers 683 $66,631.71
Software Developers, Applications 372 $85,731.00
Software Developers, Systems Software 152 $90,097.53
H-2B H-2A
Occupation Positions Certified
Average Wage Offer
Amusement and Recreation Attendants 75 $19,739.20
Maids and Housekeeping Cleaners 70 $24,602.93
Dining Room and Cafeteria Attendants and Bartender 50 $19,302.40
Waiters and Waitresses 39 $22,183.20
Cooks, Restaurant 32 $26,832.00
Occupation Positions Certified AEWR
Apples 4 $11.26
Fruits and Vegetables 2 $11.26
— — —
— — —
— — —

95 • OFFICE OF FOREIGN LABOR CERTIFICATION
South Carolina State Summary
VISA CATEGORY
TOTAL APPLICATIONS PROCESSED
TOTAL APPLICATIONS CERTIFIED
TOTAL POSITIONS REQUESTED
TOTAL POSITIONS CERTIFIED
% OF TOTAL CERTIFIED APPLICATIONS
% OF TOTAL CERTIFIED POSITIONS
AVERAGE WAGE OFFER/AEWR
PERM 928 714 928 714 0.90% 0.90% $16.08
H-1B 2,774 2,468 5,379 5,069 0.46% 0.43% $72,200.57
H-2B 103 83 2,465 1,939 1.62% 1.91% $22,000.64
H-2A 60 58 3,777 3,594 0.58% 2.57% $10.59
Top Three Cities PERMANENT LABOR (BY POSITIONS CERTIFIED) H-1B (BY POSITIONS CERTIFIED )
City Name Positions Certified Average Wage Offer
West Columbia 205 $7.90
Greenville 134 $10.74
Anderson 108 $9.68
City Name Positions Certified Average Wage Offer
Greenville 1,566 $65,303.72
Columbia 940 $69,170.38
Fort Mill 490 $72,437.43
H-2B (BY POSITIONS CERTIFIED ) H-2A (BY POSITIONS CERTIFIED ) City Name Positions Certified Average Wage Offer
Myrtle Beach 491 $19,048.42
Kiawah Island 270 $19,801.60
Hilton Head Island 216 $20,779.20
City Name Positions Certified AEWR
Ridge Spring 982 $10.00
Monetta 403 $10.00
St. Helena Island 355 $10.00
Top Five Occupations/Agricultural Commodities PERMANENT LABOR H-1B
Occupation Positions Certified
Average Wage Offer
Janitors and Cleaners, Except Maids and Housekeeping Cleaners 229 $8.07
Meat, Poultry, and Fish Cutters and Trimmers 223 $7.83
Farmworkers and Laborers, Crop, Nursery, and Greenhouse 82 $8.10
Software Developers, Applications 22 $41.55
Mechanical Engineers 12 $42.25
Occupation Positions Certified
Average Wage Offer
Computer Systems Analysts 1,717 $66,134.34
Software Developers, Applications 725 $76,613.79
Computer Programmers 596 $64,775.24
Computer Occupations, All Other 566 $65,849.20
Mechanical Engineers 132 $70,033.33
H-2B H-2A
Occupation Positions Certified
Average Wage Offer
Maids and Housekeeping Cleaners 688 $18,700.36
Forest and Conservation Workers 378 $24,712.48
Landscaping and Groundskeeping Workers 312 $21,913.35
Waiters and Waitresses 136 $19,999.20
Cooks, Restaurant 109 $21,112.00
Occupation Positions Certified AEWR
Peaches 901 $10.00
Fruits and Vegetables 416 $10.00
General Farm Workers 401 $10.00
Tomatoes 391 $10.00
Trees 346 $10.00

96 • APPENDIX A: STATE EMPLOYMENT-BASED IMMIGRATION PROFILES
South Dakota State Summary
VISA CATEGORY
TOTAL APPLICATIONS PROCESSED
TOTAL APPLICATIONS CERTIFIED
TOTAL POSITIONS REQUESTED
TOTAL POSITIONS CERTIFIED
% OF TOTAL CERTIFIED APPLICATIONS
% OF TOTAL CERTIFIED POSITIONS
AVERAGE WAGE OFFER/AEWR
PERM 62 52 62 52 0.07% 0.07% $61.18
H-1B 394 354 749 713 0.07% 0.06% $90,998.80
H-2B 96 90 1,266 1,183 1.76% 1.16% $23,681.54
H-2A 166 156 812 751 1.57% 0.54% $13.59
Top Three Cities PERMANENT LABOR (BY POSITIONS CERTIFIED) H-1B (BY POSITIONS CERTIFIED )
City Name Positions Certified Average Wage Offer
Sioux Falls 19 $78.23
Rapid City 9 $56.03
Brookings 7 $33.52
City Name Positions Certified Average Wage Offer
Sioux Falls 478 $95,689.72
Rapid City 66 $64,369.43
Brookings 37 $84,471.19
H-2B (BY POSITIONS CERTIFIED ) H-2A (BY POSITIONS CERTIFIED ) City Name Positions Certified Average Wage Offer
Sioux Falls 258 $21,347.73
Arlington 190 $25,599.60
Aberdeen 130 $25,322.51
City Name Positions Certified AEWR
Arlington 36 $13.59
Roscoe 35 $13.59
Dolton 34 $13.59
Top Five Occupations/Agricultural Commodities PERMANENT LABOR H-1B
Occupation Positions Certified
Average Wage Offer
Physicians and Surgeons, All Other 9 $117.27
Engineering Teachers, Postsecondary 5 $36.25
Internists, General 4 $96.60
Pediatricians, General 3 $43.72
Maids and Housekeeping Cleaners 3 $96.15
Occupation Positions Certified
Average Wage Offer
Computer Systems Analysts 187 $67,398.69
Computer Programmers 111 $63,257.12
Software Developers, Applications 77 $69,938.25
Computer Occupations, All Other 41 $65,719.24
Physicians And Surgeons, All Other 32 $235,456.60
H-2B H-2A
Occupation Positions Certified
Average Wage Offer
Cement Masons and Concrete Finishers 411 $25,447.31
Maids and Housekeeping Cleaners 196 $18,796.70
Landscaping and Groundskeeping Workers 110 $24,130.31
Construction Laborers 77 $26,245.44
Food Preparation Workers 71 $18,788.34
Occupation Positions Certified AEWR
Agricultural Equipment Operators 305 $13.59
Construction of Livestock Buildings 122 $13.59
Grains 95 $13.59
Bees 93 $13.59
Livestock 75 $13.59

97 • OFFICE OF FOREIGN LABOR CERTIFICATION
Tennessee State Summary
VISA CATEGORY
TOTAL APPLICATIONS PROCESSED
TOTAL APPLICATIONS CERTIFIED
TOTAL POSITIONS REQUESTED
TOTAL POSITIONS CERTIFIED
% OF TOTAL CERTIFIED APPLICATIONS
% OF TOTAL CERTIFIED POSITIONS
AVERAGE WAGE OFFER/AEWR
PERM 411 359 411 359 0.45% 0.45% $39.26
H-1B 5,101 4,691 16,826 16,288 0.84% 1.39% $73,245.54
H-2B 48 29 791 522 0.57% 0.51% $23,681.54
H-2A 327 326 3,006 2,983 3.27% 2.13% $10.28
Top Three Cities PERMANENT LABOR (BY POSITIONS CERTIFIED) H-1B (BY POSITIONS CERTIFIED )
City Name Positions Certified Average Wage Offer
Memphis 81 $36.92
Nashville 48 $34.23
Brentwood 25 $42.17
City Name Positions Certified Average Wage Offer
Nashville 4,942 $70,079.02
Collierville 3,200 $73,423.22
Memphis 3,085 $73,364.22
H-2B (BY POSITIONS CERTIFIED ) H-2A (BY POSITIONS CERTIFIED ) City Name Positions Certified Average Wage Offer
Fayetteville 94 $22,027.20
Nashville 84 $21,659.73
Hixson 70 $21,382.40
City Name Positions Certified AEWR
Adams 305 $10.28
Evensville 231 $10.28
Cedar Hill 181 $10.28
Top Five Occupations/Agricultural Commodities PERMANENT LABOR H-1B
Occupation Positions Certified
Average Wage Offer
Software Developers, Applications 82 $41.39
Computer Systems Analysts 34 $41.12
Industrial Engineers 19 $39.12
Accountants and Auditors 11 $28.16
Web Developers 10 $27.07
Occupation Positions Certified
Average Wage Offer
Computer Systems Analysts 7,753 $70,026.54
Computer And Information Systems Managers 1,691 $88,342.35
Computer Programmers 1,387 $65,966.04
Software Developers, Applications 1,225 $81,578.86
Computer Occupations, All Other 1,163 $68,583.05
H-2B H-2A
Occupation Positions Certified
Average Wage Offer
Landscaping and Groundskeeping Workers 392 $23,122.67
Forest and Conservation Workers 70 $21,382.40
Floral Designers 16 $19,032.00
Cement Masons and Concrete Finishers 12 $31,605.60
Nonfarm Animal Caretakers 10 $20,342.40
Occupation Positions Certified AEWR
Tobacco 1,527 $10.28
Tomatoes 308 $10.28
Nursery and Greenhouse Workers 279 $10.28
Hay and Straw 263 $10.28
Cucumbers 231 $10.28

98 • APPENDIX A: STATE EMPLOYMENT-BASED IMMIGRATION PROFILES
Texas State Summary
VISA CATEGORY
TOTAL APPLICATIONS PROCESSED
TOTAL APPLICATIONS CERTIFIED
TOTAL POSITIONS REQUESTED
TOTAL POSITIONS CERTIFIED
% OF TOTAL CERTIFIED APPLICATIONS
% OF TOTAL CERTIFIED POSITIONS
AVERAGE WAGE OFFER/AEWR
PERM 14,035 13,008 14,035 13,008 16.48% 16.48% $38.50
H-1B 61,689 56,422 111,048 106,745 10.18% 9.10% $74,530.29
H-2B 823 593 20,601 15,075 11.60% 14.81% $26,399.41
H-2A 475 417 3,143 2,856 4.19% 2.04% $10.35
Top Three Cities PERMANENT LABOR (BY POSITIONS CERTIFIED) H-1B (BY POSITIONS CERTIFIED )
City Name Positions Certified Average Wage Offer
College Station 6,456 $32.89
Houston 1,731 $48.68
Irving 691 $42.07
City Name Positions Certified Average Wage Offer
Houston 30,255 $75,981.22
Dallas 15,335 $71,807.08
Irving 11,792 $72,254.37
H-2B (BY POSITIONS CERTIFIED ) H-2A (BY POSITIONS CERTIFIED ) City Name Positions Certified Average Wage Offer
Austin 1,920 $24,856.33
Houston 1,412 $37,961.73
San Antonio 957 $24,336.95
City Name Positions Certified AEWR
Dalhart 222 $10.35
Plantersville 125 $10.35
Coyanosa 124 $10.35
Top Five Occupations/Agricultural Commodities PERMANENT LABOR H-1B
Occupation Positions Certified
Average Wage Offer
Software Developers, Applications 4812 $36.24
Computer Systems Analysts 4072 $35.49
Electronics Engineers, Except Computer 281 $44.48
Computer and Information Systems Managers 208 $60.52
Mechanical Engineers 206 $46.83
Occupation Positions Certified
Average Wage Offer
Computer Systems Analysts 27,734 $71,756.71
Computer Programmers 15,701 $63,691.68
Software Developers, Applications 11,911 $81,156.31
Computer Occupations, All Other 10,105 $74,867.39
Software Developers, Systems Software 6,850 $93,976.12
H-2B H-2A
Occupation Positions Certified
Average Wage Offer
Landscaping and Groundskeeping Workers 7,420 $23,181.45
Construction Laborers 1,061 $25,463.78
Amusement and Recreation Attendants 751 $17,609.55
Welders, Cutters, Solderers, and Brazers 581 $43,914.74
Fishers and Related Fishing Workers 573 $36,916.63
Occupation Positions Certified AEWR
Livestock 443 $10.35
Agricultural Equipment Operators 416 $10.35
Grains 362 $10.35
Melons 284 $10.35
Bees 206 $10.35

99 • OFFICE OF FOREIGN LABOR CERTIFICATION
Utah State Summary
VISA CATEGORY
TOTAL APPLICATIONS PROCESSED
TOTAL APPLICATIONS CERTIFIED
TOTAL POSITIONS REQUESTED
TOTAL POSITIONS CERTIFIED
% OF TOTAL CERTIFIED APPLICATIONS
% OF TOTAL CERTIFIED POSITIONS
AVERAGE WAGE OFFER/AEWR
PERM 344 299 344 299 0.38% 0.38% $41.14
H-1B 2,631 2,438 5,632 5,354 0.43% 0.46% $71,976.39
H-2B 82 64 1,504 1,221 1.25% 1.20% $25,718.88
H-2A 145 136 848 790 1.37% 0.56% $11.37
Top Three Cities PERMANENT LABOR (BY POSITIONS CERTIFIED) H-1B (BY POSITIONS CERTIFIED )
City Name Positions Certified Average Wage Offer
Salt Lake City 160 $42.64
Lehi 27 $42.15
Provo 18 $36.41
City Name Positions Certified Average Wage Offer
Salt Lake City 3,048 $71,716.10
Lehi 1,063 $66,305.76
South Jordan 205 $83,939.06
H-2B (BY POSITIONS CERTIFIED ) H-2A (BY POSITIONS CERTIFIED ) City Name Positions Certified Average Wage Offer
West Jordan 159 $27,786.20
Salt Lake City 152 $24,918.40
Sandy 85 $27,109.33
City Name Positions Certified AEWR
Salem 100 $11.37
Payson 61 $11.37
Santaquin 60 $11.37
Top Five Occupations/Agricultural Commodities PERMANENT LABOR H-1B
Occupation Positions Certified
Average Wage Offer
Software Developers, Applications 100 $42.51
Computer Systems Analysts 24 $41.49
Computer and Information Systems Managers 12 $55.88
Electronics Engineers, Except Computer 11 $36.59
Materials Engineers 8 $38.67
Occupation Positions Certified
Average Wage Offer
Computer Systems Analysts 1,432 $71,609.87
Software Developers, Applications 825 $87,471.02
Computer Occupations, All Other 565 $72,159.87
Software Developers, Systems Software 453 $95,480.41
Computer Programmers 415 $62,529.03
H-2B H-2A
Occupation Positions Certified
Average Wage Offer
Landscaping and Groundskeeping Workers 964 $24,126.02
Maids and Housekeeping Cleaners 52 $21,118.93
Construction Laborers 52 $28,142.40
Amusement and Recreation Attendants 26 $18,522.40
Cement Masons and Concrete Finishers 20 $34,320.00
Occupation Positions Certified AEWR
Livestock 294 $11.37
Nursery and Greenhouse Workers 131 $11.37
Cherries 75 $11.37
Corn 62 $11.37
Peaches 49 $11.37

100 • APPENDIX A: STATE EMPLOYMENT-BASED IMMIGRATION PROFILES
Vermont State Summary
VISA CATEGORY
TOTAL APPLICATIONS PROCESSED
TOTAL APPLICATIONS CERTIFIED
TOTAL POSITIONS REQUESTED
TOTAL POSITIONS CERTIFIED
% OF TOTAL CERTIFIED APPLICATIONS
% OF TOTAL CERTIFIED POSITIONS
AVERAGE WAGE OFFER/AEWR
PERM 107 98 107 98 0.12% 0.12% $43.98
H-1B 344 313 611 561 0.06% 0.05% $79,657.18
H-2B 34 27 453 377 0.53% 0.37% $25,536.24
H-2A 69 68 515 507 0.68% 0.36% $11.26
Top Three Cities PERMANENT LABOR (BY POSITIONS CERTIFIED) H-1B (BY POSITIONS CERTIFIED )
City Name Positions Certified Average Wage Offer
South Burlington 75 $45.68
Burlington 5 $35.54
Brattleboro 2 $64.94
City Name Positions Certified Average Wage Offer
Montpelier 237 $78,753.83
Burlington 147 $71,272.79
Winooski 33 $71,522.32
H-2B (BY POSITIONS CERTIFIED ) H-2A (BY POSITIONS CERTIFIED )
City Name Positions Certified Average Wage Offer
Stowe 93 $24,091.60
Vergennes 60 $21,791.47
West Dover 45 $26,252.20
City Name Positions Certified AEWR
Shoreham 113 $11.26
Bennington 62 $11.26
Cornwall 58 $11.26
Top Five Occupations/Agricultural Commodities PERMANENT LABOR H-1B
Occupation Positions Certified
Average Wage Offer
Software Developers, Applications 53 $46.64
Computer Systems Analysts 13 $41.25
Network and Computer Systems Administrators 8 $45.13
Electronics Engineers, Except Computer 2 $37.15
Computer and Information Systems Managers 2 $63.95
Occupation Positions Certified
Average Wage Offer
Computer Systems Analysts 253 $69,336.84
Software Developers, Applications 87 $87,117.21
Computer Programmers 25 $66,437.17
Computer Occupations, All Other 19 $79,741.96
Software Developers, Systems Software 15 $87,022.62
H-2B H-2A
Occupation Positions Certified
Average Wage Offer
Maids and Housekeeping Cleaners 117 $23,275.20
Combined Food Preparation and Serving Workers, 36 $20,831.20
Amusement and Recreation Attendants 32 $18,907.20
Dishwashers 31 $21,736.00
Landscaping and Groundskeeping Workers 26 $31,865.60
Occupation Positions Certified AEWR
Apples 242 $11.26
Fruits and Vegetables 100 $11.26
Berries 58 $11.26
Livestock 32 $11.26
Nursery and Greenhouse Workers 16 $11.26

101 • OFFICE OF FOREIGN LABOR CERTIFICATION
Virginia State Summary
VISA CATEGORY
TOTAL APPLICATIONS PROCESSED
TOTAL APPLICATIONS CERTIFIED
TOTAL POSITIONS REQUESTED
TOTAL POSITIONS CERTIFIED
% OF TOTAL CERTIFIED APPLICATIONS
% OF TOTAL CERTIFIED POSITIONS
AVERAGE WAGE OFFER/AEWR
PERM 2,624 2,264 2,624 2,264 2.87% 2.87% $43.32
H-1B 18,821 17,376 33,977 32,717 3.11% 2.79% $74,597.69
H-2B 208 159 4,782 3,484 3.11% 3.42% $24,449.94
H-2A 95 93 3,381 3,347 0.93% 2.39% $10.32
Top Three Cities PERMANENT LABOR (BY POSITIONS CERTIFIED) H-1B (BY POSITIONS CERTIFIED )
City Name Positions Certified Average Wage Offer
Herndon 277 $48.36
Richmond 202 $41.33
Reston 174 $46.51
City Name Positions Certified Average Wage Offer
Richmond 6,724 $71,584.92
Mclean 4,999 $76,645.63
Herndon 3,508 $77,898.23
H-2B (BY POSITIONS CERTIFIED ) H-2A (BY POSITIONS CERTIFIED )
City Name Positions Certified Average Wage Offer
Sterling 320 $32,423.42
Chesapeake 213 $22,661.60
Norfolk 186 $23,618.40
City Name Positions Certified AEWR
Dry Fork 1,248 $10.32
Winchester 280 $10.32
Bloxom 197 $10.32
Top Five Occupations/Agricultural Commodities PERMANENT LABOR H-1B
Occupation Positions Certified
Average Wage Offer
Software Developers, Applications 897 $48.81
Computer Systems Analysts 224 $46.81
Network and Computer Systems Administrators 65 $43.92
Computer Programmers 46 $39.36
Database Administrators 44 $43.09
Occupation Positions Certified
Average Wage Offer
Computer Systems Analysts 9,176 $70,973.78
Computer Programmers 6,011 $64,130.06
Software Developers, Applications 4,473 $87,265.30
Computer Occupations, All Other 2,321 $79,154.62
Software Developers, Systems Software 1,504 $94,456.98
H-2B H-2A
Occupation Positions Certified
Average Wage Offer
Landscaping and Groundskeeping Workers 2,008 $23,636.10
Meat, Poultry, and Fish Cutters and Trimmers 449 $19,252.80
Packers and Packagers, Hand 185 $20,538.51
Forest and Conservation Workers 117 $24,377.60
Janitors and Cleaners, Except Maids 112 $24,818.56
Occupation Positions Certified AEWR
Hay and Straw 1,057 $10.32
Tobacco 563 $10.32
Apples 484 $10.32
General Farm Workers 341 $10.32
Nursery and Greenhouse Workers 211 $10.32

102 • APPENDIX A: STATE EMPLOYMENT-BASED IMMIGRATION PROFILES
Virgin Islands State Summary
VISA CATEGORY
TOTAL APPLICATIONS PROCESSED
TOTAL APPLICATIONS CERTIFIED
TOTAL POSITIONS REQUESTED
TOTAL POSITIONS CERTIFIED
% OF TOTAL CERTIFIED APPLICATIONS
% OF TOTAL CERTIFIED POSITIONS
AVERAGE WAGE OFFER/AEWR
PERM 21 6 21 6 0.01% 0.01% $39.95
H-1B 72 69 88 85 0.01% 0.01% $63,238.08
H-2B — — — — — — —
H-2A — — — — — — —
Top Three Cities PERMANENT LABOR (BY POSITIONS CERTIFIED) H-1B (BY POSITIONS CERTIFIED )
City Name Positions Certified Average Wage Offer
St. Thomas 5 $44.06
Christiansted 1 $19.38
— — —
City Name Positions Certified Average Wage Offer
St. Thomas 38 $55,333.29
Reston 23 $49,025.82
Christiansted 10 $75,714.29
H-2B (BY POSITIONS CERTIFIED ) H-2A (BY POSITIONS CERTIFIED ) City Name Positions Certified Average Wage Offer
— — —
— — —
— — —
City Name Positions Certified AEWR
— — —
— — —
— — —
Top Five Occupations/Agricultural Commodities PERMANENT LABOR H-1B
Occupation Positions Certified
Average Wage Offer
Marketing Managers 2 $52.88
Electrical Engineers 2 $26.75
Secondary School Teachers, Except Special and Career/Technical Education 1 $19.38
Architectural and Engineering Managers 1 $61.06
— — —
Occupation Positions Certified
Average Wage Offer
Web Developers 12 $70,833.33
Computer Programmers 11 $66,925.00
Operations Research Analysts 5 $67,034.88
Special Education Teachers, Kindergarten 4 $44,741.75
Elementary School Teachers, Except Special 4 $40,850.00
H-2B H-2A
Occupation Positions Certified
Average Wage Offer
— — —
— — —
— — —
— — —
— — —
Occupation Positions Certified AEWR
— — —
— — —
— — —
— — —
— — —

103 • OFFICE OF FOREIGN LABOR CERTIFICATION
Washington State Summary
VISA CATEGORY
TOTAL APPLICATIONS PROCESSED
TOTAL APPLICATIONS CERTIFIED
TOTAL POSITIONS REQUESTED
TOTAL POSITIONS CERTIFIED
% OF TOTAL CERTIFIED APPLICATIONS
% OF TOTAL CERTIFIED POSITIONS
AVERAGE WAGE OFFER/AEWR
PERM 3,074 2,846 3,074 2,846 3.61% 3.61% $50.99
H-1B 21,012 19,304 44,993 43,258 3.47% 3.69% $91,753.28
H-2B 86 73 1,123 988 1.43% 0.97% $33,548.69
H-2A 122 114 12,146 11,844 1.14% 8.47% $12.42
Top Three Cities PERMANENT LABOR (BY POSITIONS CERTIFIED) H-1B (BY POSITIONS CERTIFIED )
City Name Positions Certified Average Wage Offer
Seattle 1,121 $48.41
Redmond 960 $53.40
Bellevue 377 $52.53
City Name Positions Certified Average Wage Offer
Seattle 15,183 $95,533.24
Redmond 14,752 $95,778.21
Bellevue 5,941 $90,628.85
H-2B (BY POSITIONS CERTIFIED ) H-2A (BY POSITIONS CERTIFIED ) City Name Positions Certified Average Wage Offer
Chehalis 246 $24,675.73
Seattle 231 $41,816.67
Belfair 85 $24,190.40
City Name Positions Certified AEWR
Prosser 2,264 $12.42
Brewster 1,868 $12.42
Pasco 1,237 $12.42
Top Five Occupations/Agricultural Commodities PERMANENT LABOR H-1B
Occupation Positions Certified
Average Wage Offer
Software Developers, Applications 1700 $50.54
Computer Systems Analysts 179 $49.33
Software Developers, Systems Software 133 $52.85
Marketing Managers 116 $58.14
Computer and Information Systems Managers 114 $62.23
Occupation Positions Certified
Average Wage Offer
Software Developers, Applications 11,078 $111,219.54
Computer Systems Analysts 9,055 $81,909.27
Computer Occupations, All Other 6,297 $73,075.04
Computer Programmers 2,380 $78,125.47
Software Developers, Systems Software 1,961 $100,842.18
H-2B H-2A
Occupation Positions Certified
Average Wage Offer
Forest and Conservation Workers 366 $25,145.12
Food Batchmakers 254 $28,490.38
Landscaping and Groundskeeping Workers 175 $23,391.09
Floral Designers 110 $24,190.40
Laborers and Freight, Stock, and Material Movers 26 $29,556.80
Occupation Positions Certified AEWR
Apples 3,094 $12.42
Pears 2,363 $12.42
Tobacco 1,714 $12.42
Cherries 1,370 $12.42
Trees 1,082 $12.42

104 • APPENDIX A: STATE EMPLOYMENT-BASED IMMIGRATION PROFILES
West Virginia State Summary
VISA CATEGORY
TOTAL APPLICATIONS PROCESSED
TOTAL APPLICATIONS CERTIFIED
TOTAL POSITIONS REQUESTED
TOTAL POSITIONS CERTIFIED
% OF TOTAL CERTIFIED APPLICATIONS
% OF TOTAL CERTIFIED POSITIONS
AVERAGE WAGE OFFER/AEWR
PERM 56 46 56 46 0.06% 0.06% $63.50
H-1B 577 493 1,010 947 0.10% 0.08% $100,425.99
H-2B 13 11 180 158 0.22% 0.16% $20,404.80
H-2A 5 5 73 72 0.05% 0.05% $10.28
Top Three Cities PERMANENT LABOR (BY POSITIONS CERTIFIED) H-1B (BY POSITIONS CERTIFIED )
City Name Positions Certified Average Wage Offer
Morgantown 16 $48.71
Huntington 9 $64.58
Charleston 4 $79.16
City Name Positions Certified Average Wage Offer
Charleston 324 $86,007.24
Morgantown 256 $87,489.55
Beckley 45 $60,000.00
H-2B (BY POSITIONS CERTIFIED ) H-2A (BY POSITIONS CERTIFIED ) City Name Positions Certified Average Wage Offer
Snowshoe 39 $19,188.00
Ona 35 $19,364.80
Morgantown 28 $17,316.00
City Name Positions Certified AEWR
Martinsburg 62 $10.28
Lesage 5 $10.28
Buffalo 3 $10.28
Top Five Occupations/Agricultural Commodities PERMANENT LABOR H-1B
Occupation Positions Certified
Average Wage Offer
Physicians and Surgeons, All Other 10 $115.08
Computer Systems Analysts 4 $46.09
Surgeons 3 $158.15
Computer and Information Systems Managers 3 $60.74
Engineering Teachers, Postsecondary 3 $33.72
Occupation Positions Certified
Average Wage Offer
Computer Systems Analysts 220 $64,894.02
Software Developers, Systems Software 129 $79,749.92
Computer Programmers 78 $60,458.16
Software Developers, Applications 76 $71,775.61
Physicians And Surgeons, All Other 67 $245,392.11
H-2B H-2A
Occupation Positions Certified
Average Wage Offer
Landscaping and Groundskeeping Workers 96 $19,482.67
Maids and Housekeeping Cleaners 29 $18,699.20
Amusement and Recreation Attendants 13 $20,612.80
Self-Enrichment Education Teachers 10 $19,676.80
Helpers-Carpenters 7 $27,144.00
Occupation Positions Certified AEWR
Peaches 32 $10.28
Vegetables 30 $10.28
Nursery and Greenhouse Workers 5 $10.28
Tomatoes 3 $10.28
Corn 2 $10.28

105 • OFFICE OF FOREIGN LABOR CERTIFICATION
Wisconsin State Summary
VISA CATEGORY
TOTAL APPLICATIONS PROCESSED
TOTAL APPLICATIONS CERTIFIED
TOTAL POSITIONS REQUESTED
TOTAL POSITIONS CERTIFIED
% OF TOTAL CERTIFIED APPLICATIONS
% OF TOTAL CERTIFIED POSITIONS
AVERAGE WAGE OFFER/AEWR
PERM 631 547 631 547 0.69% 0.69% $45.63
H-1B 6,859 6,414 17,521 16,942 1.13% 1.44% $74,696.37
H-2B 27 18 605 472 0.35% 0.46% $23,99280
H-2A 26 21 460 448 0.21% 032% $11.56
Top Three Cities PERMANENT LABOR (BY POSITIONS CERTIFIED) H-1B (BY POSITIONS CERTIFIED )
City Name Positions Certified Average Wage Offer
Madison 115 $40.85
Verona 103 $40.84
Milwaukee 92 $51.93
City Name Positions Certified Average Wage Offer
Milwaukee 4,488 $75,899.99
Madison 2,882 $70,798.92
Appleton 1,048 $70,486.96
H-2B (BY POSITIONS CERTIFIED ) H-2A (BY POSITIONS CERTIFIED ) City Name Positions Certified Average Wage Offer
Eleva 196 $21,049.60
Bennett 43 $22,755.20
Kohler 38 $19,219.20
City Name Positions Certified AEWR
Hancock 90 $11.56
Wausau 47 $11.56
Merillan 47 $11.56
Top Five Occupations/Agricultural Commodities PERMANENT LABOR H-1B
Occupation Positions Certified
Average Wage Offer
Software Developers, Applications 234 $40.44
Computer Systems Analysts 32 $41.16
Computer and Information Systems Managers 29 $56.27
Internists, General 19 $101.15
Physicians and Surgeons, All Other 13 $99.93
Occupation Positions Certified
Average Wage Offer
Computer Systems Analysts 7,240 $71,715.31
Computer Programmers 1,856 $63,349.05
Computer Occupations, All Other 1,830 $68,584.64
Software Developers, Applications 1,757 $76,862.08
Software Developers, Systems Software 523 $93,930.61
H-2B H-2A
Occupation Positions Certified
Average Wage Offer
Forest and Conservation Workers 196 $21,049.60
Amusement and Recreation Attendants 59 $17,430.40
Floral Designers 43 $22,755.20
Maids and Housekeeping Cleaners 38 $19,219.20
Lifeguards, Ski Patrol, and Other Recreational 30 $17,680.00
Occupation Positions Certified AEWR
Corn 132 $11.56
Nursery and Greenhouse Workers 61 $11.56
Herbs 47 $11.56
General Farm Workers 47 $11.56
Agricultural Equipment Operators 38 $11.56

106 • APPENDIX A: STATE EMPLOYMENT-BASED IMMIGRATION PROFILES
State Summary
Wyoming VISA CATEGORY
TOTAL APPLICATIONS PROCESSED
TOTAL APPLICATIONS CERTIFIED
TOTAL POSITIONS REQUESTED
TOTAL POSITIONS CERTIFIED
% OF TOTAL CERTIFIED APPLICATIONS
% OF TOTAL CERTIFIED POSITIONS
AVERAGE WAGE OFFER/AEWR
PERM 16 13 16 13 0.02% 0.02% $77.40
H-1B 147 118 176 168 0.02% 0.01% $120,949.93
H-2B 42 33 401 351 0.65% 0.34% $24,605.14
H-2A 90 87 329 326 0.87% 0.23% $11.14
Top Three Cities PERMANENT LABOR (BY POSITIONS CERTIFIED) H-1B (BY POSITIONS CERTIFIED )
City Name Positions Certified Average Wage Offer
Casper 4 $96.83
Laramie 3 $35.39
Gillette 2 $200.35
City Name Positions Certified Average Wage Offer
Casper 61 $59,606.96
Cheyenne 33 $124,349.15
Laramie 29 $125,525.46
H-2B (BY POSITIONS CERTIFIED ) H-2A (BY POSITIONS CERTIFIED ) City Name Positions Certified Average Wage Offer
Jackson 116 $24,672.58
Teton Village 75 $31,548.40
Cody 72 $22,554.13
City Name Positions Certified AEWR
Rock Springs 49 $11.14
Baggs 26 $11.14
Evanston 24 $11.14
Top Five Occupations/Agricultural Commodities PERMANENT LABOR H-1B
Occupation Positions Certified
Average Wage Offer
Internists, General 3 $113.08
Medical and Clinical Laboratory Technologists 2 $29.36
Surgeons 1 $287.24
Pediatricians, General 1 $113.46
Except Mining Safety Engineers and Inspectors 1 $48.08
Occupation Positions Certified
Average Wage Offer
Computer Systems Analysts 29 $66,942.38
Cost Estimators 28 $53,000.00
Physicians And Surgeons, All Other 18 $312,821.97
Internists, General 13 $250,000.00
Petroleum Engineers 6 $83,928.32
H-2B H-2A
Occupation Positions Certified
Average Wage Offer
Maids and Housekeeping Cleaners 131 $19,920.73
Landscaping and Groundskeeping Workers 120 $28,246.40
Laundry and Dry-Cleaning Workers 55 $22,890.40
Self-Enrichment Education Teachers 14 $43,596.80
Construction Laborers 10 $18,054.40
Occupation Positions Certified AEWR
Livestock 295 $11.14
Wool 10 $11.14
Corn 6 $11.14
Hay and Straw 5 $11.14
Nursery and Greenhouse Workers 4 $11.14

APPENDIX B Agricultural Certification Statistics

108 • APPENDIX B: AGRICULTURAL CERTIFICATION STATISTICS
800
400
0
Tobacco 4000
3600
3200
2800
2400
2000
1600
1200
40 12 40 Da
ys
1 Jan Feb Mar April May June July Aug Sept Oct Nov
Berries 3000
2700
2400
2100
1800
1500
1200
900
600
14 300
Days
0
Jan Feb Mar April May June July Aug Sept Oct Nov Dec
Days
Apples 3000
2700
2400
2100
1800
1500
1200
900
600
300
7 6 2 0
Jan Feb Mar April May June July Aug Sept Oct Nov Dec
Days
Hay and Straw 2500
2250
2000
1750
1500
1250
1000
750
500
250
4 80
Jan Feb Mar April May June July Aug Sept Oct Nov Dec
Top 10 Crops – Positions Certifiedby Month Certification Begins

109 • OFFICE OF FOREIGN LABOR CERTIFICATION
0
Nursery and Greenhouse Workers 2000
1800
1600
1400
1200
1000
800
600
400
200
Jan Feb Mar April May June July Aug Sept Oct Nov Dec
Days
Agricultural Equipment Operators 1500
1350
1200
1050
900
750
600
450
300
150
Days
0
Jan Feb Mar April May June July Aug Sept Oct Nov Dec
Fruits and Vegetables 1200
1080
960
840
720
600
480
360
240
120
Days
Jan Feb Mar April May June July Aug Sept Oct Nov Dec
0 Days
2000
1800
1600
1400
1200
1000
800
600
400
200
60
Jan Feb Mar April May June July Aug Sept Oct Nov
Onions
0
Oranges 3500
3150
1
2800
2450
2100
1750
1400
1050
700
350
Mar Aug Sept Oct Nov Dec
Days
Melons 2000
1800
1600
1400
1200
1000
800
600
400
200
Jan Feb Mar April May June July Aug Sept Oct Nov
Days
0

110 • APPENDIX B: AGRICULTURAL CERTIFICATION STATISTICS
Average Duration of PositionsCertified for the Top 10 Crops In FY 2015, the average period certified for positions in each of the top 10 crops was between 3 and 8 months. Onions and melons ranked as the two crops with the shortest average certification period, with average certification periods of 3 to 4 months. Positions involving apples, berries, and other fruits and vegetables followed, with average certification periods of just over 4.5 months to 6 months. Tobacco, oranges, and hay and straw, reflecting roughly 6.8 to 7.3 month certification periods, represented the next longest average certification period among the top 10 crops. Nursery and greenhouse certifications lasted about 7.5 months. Employers with agricultural equipment operators represented the group receiving the longest average certification period in FY 2015, with an average period of nearly 8 months.
0
50
100
150
200
250
Aver
age d
ays
Tobacco Berries Apples Hay and Straw Oranges Melons Nursery Agricultural Fruits Onions and Equipment and
Greenhouse Operators Vegetables Workers

111 • OFFICE OF FOREIGN LABOR CERTIFICATION
Commodities with the Longest Certification Periods Overall The Department issues a labor certification, when appropriate, after reviewing an employer’s fact-specific request for temporary agricultural workers under the H-2A program. In all cases, the nature of the employer’s own need for temporary agricultural or services determines the certification period for the specific need for temporary agricultural workers may or may not be representative of other employers with the same crop or agricultural commodity. In FY 2015, the longest certification period was granted to employers engaged in sweet corn based on demonstrated need for temporary agricultural workers for a period of a little over 10 months. Employers engaged in growing avocado and radishes closely followed those engaged in sweet corn, both also averaging certifications for just a little over 10 months. The remaining employers with the longest average certifications all demonstrated a need for between 8.6 and 9.3 months. Those employers are engaged in growing lemons and nuts, as well as raising several species: livestock, reptiles, insects, horses, and exotic game animals.
0
50
100
150
200
250
300
Aver
age d
ays
Sweet Corn Avocado Radishes Lemons Livestock Nuts Reptiles Insects Horses Exotic Game Animals

112 • APPENDIX B: AGRICULTURAL CERTIFICATION STATISTICS
150
125
100
75
50
25
0
Cooks Horseradish Melons Celery Turnips Onions Apricots Apples Pears Figs
Aver
age d
ays
Commodities with the Shortest Certification Periods Overall For some crops and agricultural commodities, as well as workers in support of the production of such crops and commodities, employers seek temporary labor or services for a short, concentrated period of time. In FY 2015, each of the 10 crops and agricultural commodities, and support activities, with the longest certification periods represented temporary agricultural labor and services occurring for less than 5 months. Cooks and horseradish farming represent the shortest certification periods, using agricultural workers for just shy of 2 months and 3 months, respectively. Among the remaining crops or agricultural commodities with the shortest certification periods in FY 2015, farmers growing melons and celery sought temporary workers for roughly 3.5 months. While farmers growing turnips, onions, apricots, apples, pears, and figs sought temporary workers for approximately 4 to 4.5 months.

APPENDIX C Top Five Employment-Based
Permanent ImmigrationCountry Profiles

114 • APPENDIX C: TOP FIVE EMPLOAYMENT-BASED PERMANENT IMMIGRATION COUNTRY PROFILES
India Top Five Classes of Admission in PERM
SUMMARY INFORMATION DATA
Total Applications Processed 49,863
Total Applications Certified 45,670
Percent Working on H-1B Visa 65.53%
Percent Bachelors or Higher 62.64%
Average Age at Certification 33
Percent of Nat’l Total Certified Applications 57.86%
VISA POSITIONS CERTIFIED
AVERAGE OFFERED SALARY
H-1B 40,428 $46.81
L-1 2,776 $41.09
Unspecified 942 $41.56
F-1 804 $42.28
Parolee 359 $52.52
Top 10 Employers in PERM Top 10 Occupations in PERM
EMPLOYER NAME APPLICATIONS CERTIFIED
AVERAGE WAGE OFFER
Cognizant Technology Solutions U.S. Corporation 6973 $33.19
Intel Corporation 1013 $42.83
Cisco Systems Inc. 838 $52.70
Qualcomm Technologies Inc. 545 $49.28
Amazon Corporate LLC 436 $47.22
Microsoft Corporation 379 $54.99
Oracle America Inc. 364 $53.28
Google Inc. 328 $57.87
Hcl America Inc. 306 $48.54
Deloitte Consulting LLP 244 $47.60
OCCUPATION APPLICATIONS CERTIFIED
AVERAGE WAGE OFFER
Software Developers, Applications 21,231 $45.15
Computer Systems Analysts 8,732 $39.89
Software Developers, Systems Software 3,615 $52.20
Electronics Engineers, Except Computer 1,738 $47.96
Computer and Information Systems Managers 1,360 $64.30
Network and Computer Systems Administrators 960 $43.48
Database Administrators 708 $44.81
Mechanical Engineers 536 $41.79
Electrical Engineers 402 $43.86
Management Analysts 374 $53.57
Top 10 U.S. States in PERM
STATE APPLICATIONS CERTIFIED
TOTAL ON H-1B VISA
TOTAL HOLDING A BA/BS OR HIGHER
AVERAGE WAGE OFFER
PERCENTAGE ON H-1B VISA
PERCENTAGE WITH A BA/BS OR HIGHER
ECONOMIC SECTOR
TX 10072 8023 9638 $37.73 79.66% 95.69% IT
CA 9391 8557 9254 $54.73 91.12% 98.54% IT
NJ 5073 4535 4923 $45.20 89.39% 97.04% IT
NY 2348 2197 2211 $52.89 93.57% 94.17% IT
IL 2098 1940 2024 $45.10 92.47% 96.47% IT
MI 1664 1456 1614 $41.22 87.50% 97.00% IT
MA 1642 1552 1568 $50.18 94.52% 95.49% IT
WA 1391 1176 1357 $51.22 84.54% 97.56% IT
VA 1375 1271 1307 $48.08 92.44% 95.05% IT
GA 1185 1086 1156 $45.48 91.65% 97.55% IT

115 • OFFICE OF FOREIGN LABOR CERTIFICATION
China Top Five Classes of Admission in PERM
SUMMARY INFORMATION DATA
Total Applications Processed 7,230
Total Applications Certified 6,411
Percent Working on H-1B Visa 7.69%
Percent Bachelors or Higher 7.93%
Average Age at Certification 40
Percent of Nat’l Total Certified Applications 8.12%
VISA POSITIONS CERTIFIED
AVERAGE OFFERED SALARY
H-1B 4,748 $46.01
Unspecified 708 $14.60
L-1 365 $51.93
F-1 302 $41.30
Not in USA 236 $13.38
Top 10 Employers in PERM Top 10 Occupations in PERM
EMPLOYER NAME APPLICATIONS CERTIFIED
AVERAGE WAGE OFFER
Google Inc. 435 $54.00
Defender Services Inc. 190 $8.07
Microsoft Corporation 176 $53.32
Qualcomm Technologies Inc. 173 $49.03
Facebook Inc. 124 $56.86
Oracle America Inc. 109 $52.49
Intel Corporation 94 $45.72
Amazon Corporate LLC 88 $44.53
Cisco Systems Inc. 87 $49.63
Koch Foods Of Alabama LLC 72 $9.68
OCCUPATION APPLICATIONS CERTIFIED
AVERAGE WAGE OFFER
Software Developers, Applications 1,624 $50.05
Software Developers, Systems Software 639 $52.66
Electronics Engineers, Except Computer 486 $48.44
Statisticians 283 $39.91
Accountants and Auditors 282 $35.95
Janitors and Cleaners, Except Maids and Housekeeping Cleaners
267 $8.08
Financial Analysts 207 $54.46
Cooks, Restaurant 183 $12.64
Meat, Poultry, and Fish Cutters and Trimmers 182 $8.89
Computer Systems Analysts 141 $42.26
Top 10 U.S. States in PERM
STATE APPLICATIONS CERTIFIED
TOTAL ON H-1B VISA
TOTAL HOLDING A BA/BS OR HIGHER
AVERAGE WAGE OFFER
PERCENTAGE ON H-1B VISA
PERCENTAGE WITH A BA/BS OR HIGHER
ECONOMIC SECTOR
CA 2336 1929 2306 $50.16 82.58% 98.72% IT
NY 647 572 614 $46.75 88.41% 94.90% Finance
TX 411 309 347 $35.41 75.18% 84.43% Advanced Mfg
WA 396 290 378 $49.19 73.23% 95.45% IT
SC 256 11 15 $9.84 4.30% 5.86% Other Economic Sector
IL 230 187 218 $39.24 81.30% 94.78% Advanced Mfg
MA 229 193 208 $44.40 84.28% 90.83% IT
NC 191 54 59 $18.86 28.27% 30.89% Other Economic Sector
NJ 172 143 159 $40.31 83.14% 92.44% IT
GA 148 73 109 $27.22 49.32% 73.65% Agribusiness

116 • APPENDIX C: TOP FIVE EMPLOAYMENT-BASED PERMANENT IMMIGRATION COUNTRY PROFILES
South KoreaSUMMARY INFORMATION DATA
Total Applications Processed 6,250
Total Applications Certified 4,895
Percent Working on H-1B Visa 3.31%
Percent Bachelors or Higher 3.91%
Average Age at Certification 40
Percent of Nat’l Total Certified Applications 6.20%
Top Five Classes of Admission in PERM
VISA POSITIONS CERTIFIED
AVERAGE OFFERED SALARY
H-1B 1,385 $39.59
Unspecified 1,053 $15.98
F-1 945 $22.26
E-2 478 $27.58
Not in USA 420 $13.92
Top 10 Employers in PERM
EMPLOYER NAME APPLICATIONS CERTIFIED
AVERAGE WAGE OFFER
Koch Foods of Alabama LLC 185 $9.73
Case Farms Processing Inc. 134 $9.02
Koch Foods of Cincinnati LLC 98 $9.88
Jimmy Forrest Farms Inc. 80 $8.10
Norman W Fries Inc. D/b/a Claxton Poultry Farms 62 $9.35
Motorola Mobility LLC 56 $45.22
Her Services 47 $8.10
Roger Wood Foods Inc. 43 $9.31
Intel Corporation 31 $50.88
Defender Services Inc. 31 $8.09
Top 10 Occupations in PERM
OCCUPATION APPLICATIONS CERTIFIED
AVERAGE WAGE OFFER
Meat, Poultry, and Fish Cutters and Trimmers 643 $9.06
Accountants and Auditors 204 $31.75
Market Research Analysts and Marketing Specialists 170 $24.82
Chefs and Head Cooks 159 $23.01
Electronics Engineers, Except Computer 154 $49.22
Janitors and Cleaners, Except Maids and Housekeeping Cleaners
152 $8.08
Slaughterers and Meat Packers 142 $9.24
Clergy 132 $16.66
Software Developers, Applications 121 $48.49
Cooks, Restaurant 108 $13.13
Top 10 U.S. States in PERM
STATE APPLICATIONS CERTIFIED
TOTAL ON H-1B VISA
TOTAL HOLDING A BA/BS OR HIGHER
AVERAGE WAGE OFFER
PERCENTAGE ON H-1B VISA
PERCENTAGE WITH A BA/BS OR HIGHER
ECONOMIC SECTOR
CA 1497 365 1027 $31.79 24.38% 68.60% Other Economic Sector
NY 406 219 274 $32.19 53.94% 67.49% Other Economic Sector
GA 341 77 192 $19.98 22.58% 56.30% Agribusiness
AL 337 46 162 $18.07 13.65% 48.07% Agribusiness
NC 287 14 20 $10.95 4.88% 6.97% Agribusiness
TX 279 110 163 $28.42 39.43% 58.42% Other Economic Sector
NJ 243 101 159 $29.59 41.56% 65.43% Other Economic Sector
SC 235 3 5 $8.43 1.28% 2.13% Agribusiness
IL 194 71 141 $32.96 36.60% 72.68% Advanced Mfg
OH 178 18 67 $12.13 10.11% 37.64% Agribusiness

117 • OFFICE OF FOREIGN LABOR CERTIFICATION
CanadaSUMMARY INFORMATION DATA
Total Applications Processed 3,302
Total Applications Certified 2,962
Percent Working on H-1B Visa 2.24%
Percent Bachelors or Higher 3.49%
Average Age at Certification 40
Percent of Nat’l Total Certified Applications 3.75%
Top Five Classes of Admission in PERM
VISA POSITIONS CERTIFIED
AVERAGE OFFERED SALARY
H-1B 2,044 $57.48
TN 589 $51.52
L-1 170 $50.70
Unspecified 71 $39.14
E-2 31 $42.46
Top 10 Employers in PERM
EMPLOYER NAME APPLICATIONS CERTIFIED
AVERAGE WAGE OFFER
Google Inc. 130 $60.71
Microsoft Corporation 103 $56.06
Amazon Corporate LLC 71 $47.89
Apple Inc. 45 $66.03
Intel Corporation 37 $49.94
Qualcomm Technologies Inc. 33 $58.02
Cisco Systems Inc. 30 $61.07
Ernst Young U.S. LLP 21 $66.98
Facebook Inc. 20 $67.58
Bloomberg L.P. 17 $49.63
Top 10 Occupations in PERM
OCCUPATION APPLICATIONS CERTIFIED
AVERAGE WAGE OFFER
Software Developers, Applications 535 $54.03
Software Developers, Systems Software 165 $58.11
Electronics Engineers, Except Computer 138 $54.55
Computer and Information Systems Managers 126 $70.22
Computer Systems Analysts 108 $45.20
Architectural and Engineering Managers 95 $65.57
Marketing Managers 73 $67.23
Electrical Engineers 73 $47.39
Mechanical Engineers 69 $45.08
Financial Analysts 64 $65.94
Top 10 U.S. States in PERM
STATE APPLICATIONS CERTIFIED
TOTAL ON H-1B VISA
TOTAL HOLDING A BA/BS OR HIGHER
AVERAGE WAGE OFFER
PERCENTAGE ON H-1B VISA
PERCENTAGE WITH A BA/BS OR HIGHER
ECONOMIC SECTOR
CA 856 625 757 $57.13 73.01% 88.43% IT
NY 343 266 289 $62.33 77.55% 84.26% Finance
WA 288 180 263 $54.62 62.50% 91.32% IT
TX 248 148 192 $52.06 59.68% 77.42% Other Economic Sector
MI 124 69 100 $51.15 55.65% 80.65% Automotive
MA 97 71 86 $54.00 73.20% 88.66% IT
FL 97 60 61 $49.40 61.86% 62.89% Other Economic Sector
IL 85 62 79 $53.02 72.94% 92.94% Other Economic Sector
NJ 72 49 63 $53.34 68.06% 87.50% Advanced Mfg
OH 61 41 36 $50.60 67.21% 59.02% Educational Services

118 • APPENDIX C: TOP FIVE EMPLOAYMENT-BASED PERMANENT IMMIGRATION COUNTRY PROFILES
PhilippinesSUMMARY INFORMATION DATA
Total Applications Processed 1,982
Total Applications Certified 1,509
Percent Working on H-1B Visa 1.74%
Percent Bachelors or Higher 174%
Average Age at Certification 40
Percent of Nat’l Total Certified Applications 1.91%
Top Five Classes of Admission in PERM
VISA POSITIONS CERTIFIED
AVERAGE OFFERED SALARY
H-1B 1073 $37.10
Not in USA 135 $14.02
B-2 92 $25.81
Unspecified 90 $30.39
L-1 37 $43.12
Top 10 Employers in PERM
EMPLOYER NAME APPLICATIONS CERTIFIED
AVERAGE WAGE OFFER
Baltimore City Public School System 82 $22.82
Central Consolidated School District 24 $19.78
All 4 Wine LLC 23 $10.13
Home Care Options San Francisco Inc. 17 $10.97
Quest Diagnostics Inc. 17 $31.25
Los Angeles Unified School District 16 $21.94
Pinon Unified School District No 4 16 $20.19
Pointwest Technologies Corporation 13 $37.78
Jackson Therapy Partners Holdings LLC 12 $32.44
Rite Aid Corporation 12 $64.04
Top 10 Occupations in PERM
OCCUPATION APPLICATIONS CERTIFIED
AVERAGE WAGE OFFER
Medical and Clinical Laboratory Technologists 161 $26.76
Home Health Aides 138 $10.06
Occupational Therapists 111 $36.97
Software Developers, Applications 89 $44.04
Accountants and Auditors 71 $35.55
Secondary School Teachers, Except Special and Career/Technical Education
64 $20.84
Middle School Teachers, Except Special and Career/Technical Education
58 $21.98
Special Education Teachers, Secondary School 54 $21.73
Electrical Engineers 53 $46.64
Internists, General 35 $94.44
Top 10 U.S. States in PERM
STATE APPLICATIONS CERTIFIED
TOTAL ON H-1B VISA
TOTAL HOLDING A BA/BS OR HIGHER
AVERAGE WAGE OFFER
PERCENTAGE ON H-1B VISA
PERCENTAGE WITH A BA/BS OR HIGHER
ECONOMIC SECTOR
CA 380 186 293 $32.71 48.95% 77.11% Health Care
TX 140 106 114 $36.68 75.71% 81.43% Health Care
NY 140 101 114 $36.95 72.14% 81.43% Health Care
MD 124 112 115 $23.86 90.32% 92.74% Educational Services
FL 64 51 53 $35.28 79.69% 82.81% Health Care
NM 58 58 56 $24.23 100.00% 96.55% Educational Services
IL 56 37 42 $40.90 66.07% 75.00% Health Care
AZ 52 47 49 $24.27 90.38% 94.23% Educational Services
NJ 52 34 42 $35.05 65.38% 80.77% Health Care
VA 51 28 31 $29.16 54.90% 60.78% Health Care


EMPLOYMENT AND TRAINING ADMINISTRATIONUNITED STATES DEPARTMENT OF LABOR


