
Table of
Contents
Key Statistics for October
Sales 2014 Residential Sales Stats Year-to-Year Total Sales by Map Area Median 2014 Median Sales Stats Year-to-Year Median Sales by Map Area Listings 2014 Active Listings by Map Area 2014 Total Active Listings vs. Total Sales Year-to-Year Active Listings by Map Area Inventory 2014 Months of Inventory by Map Area Year-to-Year Months of Inventory
Outlook for November
About Hady Chahine Contact Information
Key Statistics for October
Back to Table of Contents
= trending positive = trending positive
= trending negative = trending negative
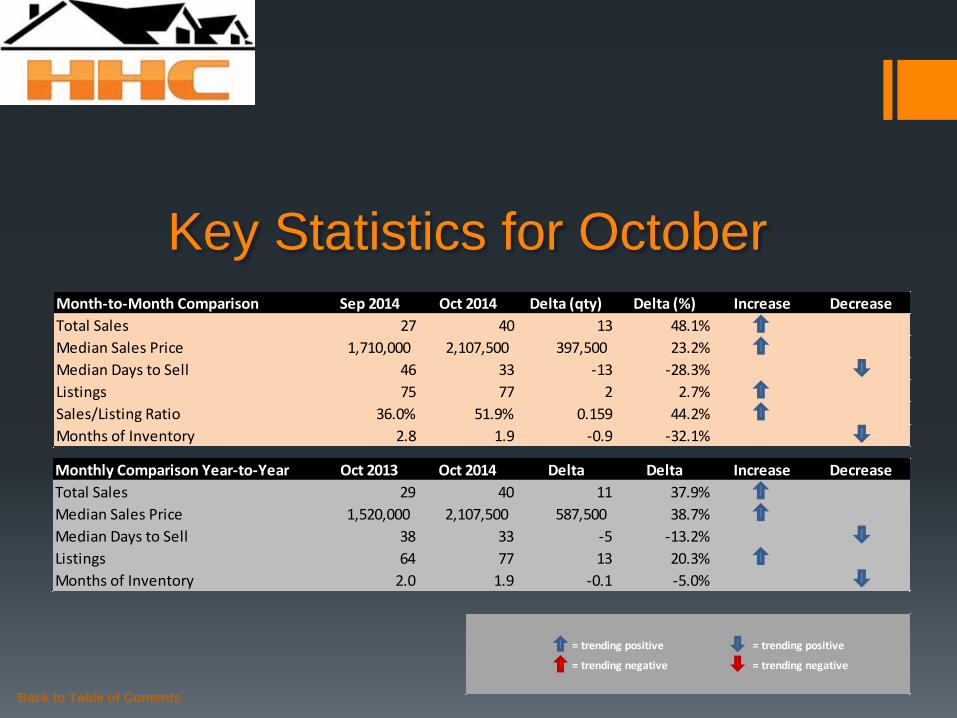
Month-to-Month Comparison Sep 2014 Oct 2014 Delta (qty) Delta (%) Increase Decrease
Total Sales 27 40 13 48.1%
Median Sales Price 1,710,000 2,107,500 397,500 23.2%
Median Days to Sell 46 33 -13 -28.3%
Listings 75 77 2 2.7%
Sales/Listing Ratio 36.0% 51.9% 0.159 44.2%
Months of Inventory 2.8 1.9 -0.9 -32.1%
Monthly Comparison Year-to-Year Oct 2013 Oct 2014 Delta Delta Increase Decrease
Total Sales 29 40 11 37.9%
Median Sales Price 1,520,000 2,107,500 587,500 38.7%
Median Days to Sell 38 33 -5 -13.2%
Listings 64 77 13 20.3%
Months of Inventory 2.0 1.9 -0.1 -5.0%

Back to Table of Contents
Total Sales Month-to-Month by Map Area Aug Sep Oct
Manhattan Bch Sand 13 10 10
Manhattan Bch Tree 9 5 12
Manhattan Bch Hill 2 2 1
Manhattan Village 4 1 3
Manhattan Bch Heights/Lib Vlg 4 4 5
Manhattan Bch Mira Costa 7 5 9
Total Sales 39 27 40
0
5
10
15
20
25
30
35
40
Aug Sep Oct
2014 Total Sales Month-to-Month by Map Area
Manhattan Bch Sand
Manhattan Bch Tree
Manhattan Bch Hill
Manhattan Village
Manhattan Bch Heights/Lib Vlg
Manhattan Bch Mira Costa
Total Sales

Back to Table of Contents
Total Sales Year-to-Year by Map Area 2012 2013 2014
Manhattan Bch Sand 10 5 10
Manhattan Bch Tree 4 11 12
Manhattan Bch Hill 2 3 1
Manhattan Village 2 2 3
Manhattan Bch Heights/Lib Vlg 8 5 5
Manhattan Bch Mira Costa 6 3 9
Total Sales 32 29 40
0
5
10
15
20
25
30
35
40
2012 2013 2014
Total Sales Year-to-Year by Map Area: October
Manhattan Bch Sand
Manhattan Bch Tree
Manhattan Bch Hill
Manhattan Village
Manhattan Bch Heights/Lib Vlg
Manhattan Bch Mira Costa
Total Sales

Back to Table of Contents
Median Sales Price Month-to-Month by Map Area Aug Sep Oct
Manhattan Bch Sand 2,250,000 2,387,500 2,500,000
Manhattan Bch Tree 1,900,000 1,910,000 2,226,000
Manhattan Bch Hill 3,510,000 2,205,000 2,999,000
Manhattan Village 1,162,000 1,375,000 1,150,000
Manhattan Bch Heights/Lib Vlg 1,337,500 1,362,500 1,510,000
Manhattan Bch Mira Costa 1,995,000 1,700,000 1,869,000
Market Median Sales Price 1,900,000 1,710,000 2,107,500
-
500,000
1,000,000
1,500,000
2,000,000
2,500,000
3,000,000
3,500,000
4,000,000
Aug Sep Oct
2014 Median Sales Price Month-to-Month by Map Area
Manhattan Bch Sand
Manhattan Bch Tree
Manhattan Bch Hill
Manhattan Village
Manhattan Bch Heights/Lib Vlg
Manhattan Bch Mira Costa
Market Median Sales Price

Back to Table of Contents
Median Sales Price Year-to-Year by Map Area 2012 2013 2014
Manhattan Bch Sand 1,850,000 1,760,000 2,500,000
Manhattan Bch Tree 1,702,500 1,520,000 2,226,000
Manhattan Bch Hill 1,800,000 1,750,000 2,999,000
Manhattan Village 875,000 1,017,500 1,150,000
Manhattan Bch Heights/Lib Vlg 1,000,000 1,335,000 1,510,000
Manhattan Bch Mira Costa 1,022,500 1,960,000 1,869,000
Market Median Sales Price 1,212,500 1,520,000 2,107,500
-
500,000
1,000,000
1,500,000
2,000,000
2,500,000
3,000,000
2012 2013 2014
Median Sales Price Year-to-Year by Map Area: October
Manhattan Bch Sand
Manhattan Bch Tree
Manhattan Bch Hill
Manhattan Village
Manhattan Bch Heights/Lib Vlg
Manhattan Bch Mira Costa
Market Median Sales Price

Back to Table of Contents
Active Listings vs. Total Sales by Map Area Jan Feb Mar Apr May Jun Jul Aug Sep Oct Nov Dec
Manhattan Bch Sand 15 15 17 13 19 24 23 30 24 20
Manhattan Bch Tree 10 10 21 28 21 19 14 13 12 17
Manhattan Bch Hill 5 6 10 10 12 6 6 5 7 9
Manhattan Village - 2 5 7 7 9 8 6 10 9
Manhattan Bch Heights/Lib Vlg 7 9 7 10 2 6 5 4 5 6
Manhattan Bch Mira Costa 8 7 13 20 24 19 22 18 17 16
Total Active Listings 45 49 73 88 85 83 78 76 75 77
-
5
10
15
20
25
30
Jan Feb Mar Apr May Jun Jul Aug Sep Oct Nov Dec
2014 Active Listings by Map Area
Manhattan Bch Sand
Manhattan Bch Tree
Manhattan Bch Hill
Manhattan Village
Manhattan Bch Heights/Lib Vlg
Manhattan Bch Mira Costa

Back to Table of Contents
Active Listings vs. Total Sales by Map Area Jan Feb Mar Apr May Jun Jul Aug Sep Oct Nov Dec
Manhattan Bch Sand 15 15 17 13 19 24 23 30 24 20
Manhattan Bch Tree 10 10 21 28 21 19 14 13 12 17
Manhattan Bch Hill 5 6 10 10 12 6 6 5 7 9
Manhattan Village - 2 5 7 7 9 8 6 10 9
Manhattan Bch Heights/Lib Vlg 7 9 7 10 2 6 5 4 5 6
Manhattan Bch Mira Costa 8 7 13 20 24 19 22 18 17 16
Total Active Listings 45 49 73 88 85 83 78 76 75 77
Total Sales 15 22 33 45 43 42 36 39 27 40
Sales/Listings Ratio 33.3% 44.9% 45.2% 51.1% 50.6% 50.6% 46.2% 51.3% 36.0% 51.9%
-
10
20
30
40
50
60
70
80
90
Jan Feb Mar Apr May Jun Jul Aug Sep Oct Nov Dec
2014 Total Active Listings vs. Total Sales
Total Active Listings
Total Sales

Back to Table of Contents
Active Listings Year-to-Year by Map Area 2012 2013 2014
Manhattan Bch Sand 34 20 20
Manhattan Bch Tree 21 14 17
Manhattan Bch Hill 10 8 9
Manhattan Village 7 2 9
Manhattan Bch Heights/Lib Vlg 7 9 6
Manhattan Bch Mira Costa 24 11 16
Total Active Listings 103 64 77
0
20
40
60
80
100
120
2012 2013 2014
Active Listings Year-to-Year by Map Area: October
Manhattan Bch Sand
Manhattan Bch Tree
Manhattan Bch Hill
Manhattan Village
Manhattan Bch Heights/Lib Vlg
Manhattan Bch Mira Costa
Total Active Listings

Back to Table of Contents
Months of Inventory by Map Area Jan Feb Mar Apr May Jun Jul Aug Sep Oct Nov Dec
Manhattan Bch Sand 3.8 1.4 2.4 1.1 1.9 3.0 3.8 2.3 2.4 2.0
Manhattan Bch Tree 3.3 2.5 2.3 2.6 1.3 1.1 1.1 1.4 2.4 1.4
Manhattan Bch Hill 5.0 3.0 2.5 1.1 12.0 1.5 3.0 2.5 3.5 9.0
Manhattan Village - - 2.5 7.0 2.3 3.0 2.0 1.5 10.0 3.0
Manhattan Bch Heights/Lib Vlg 3.5 4.5 1.4 1.7 0.3 3.0 5.0 1.0 1.3 1.2
Manhattan Bch Mira Costa 2.7 2.3 2.2 3.3 4.0 2.7 2.2 2.6 3.4 1.8
-
2.0
4.0
6.0
8.0
10.0
12.0
Jan Feb Mar Apr May Jun Jul Aug Sep Oct Nov Dec
2014 Months of Inventory by Map Area
Manhattan Bch Sand
Manhattan Bch Tree
Manhattan Bch Hill
Manhattan Village
Manhattan Bch Heights/Lib Vlg
Manhattan Bch Mira Costa
Back to Table of Contents
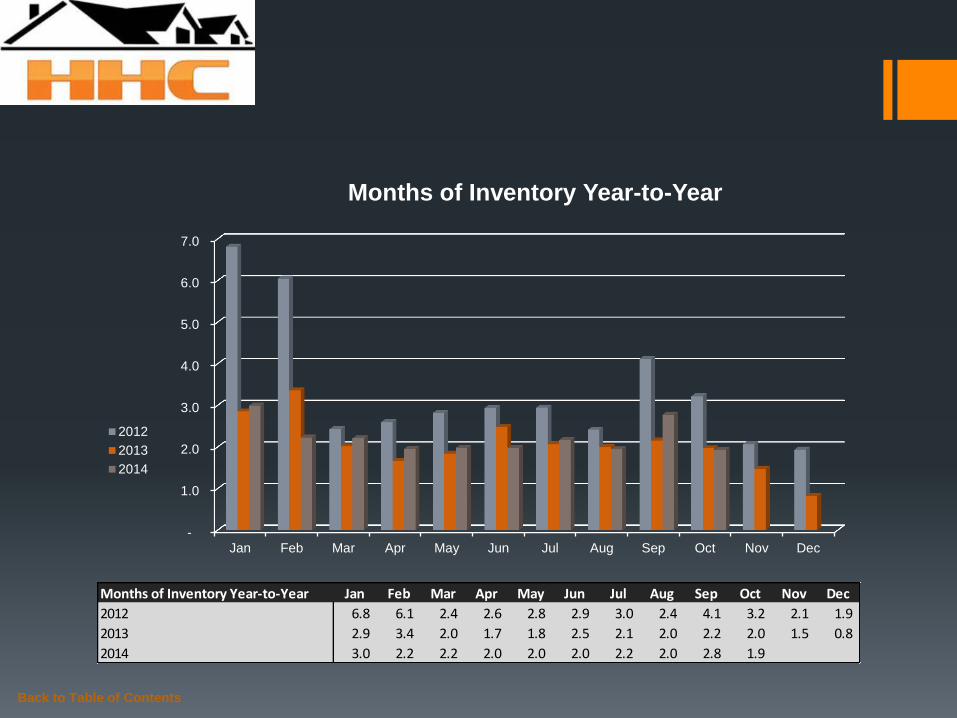
Months of Inventory Year-to-Year Jan Feb Mar Apr May Jun Jul Aug Sep Oct Nov Dec
2012 6.8 6.1 2.4 2.6 2.8 2.9 3.0 2.4 4.1 3.2 2.1 1.9
2013 2.9 3.4 2.0 1.7 1.8 2.5 2.1 2.0 2.2 2.0 1.5 0.8
2014 3.0 2.2 2.2 2.0 2.0 2.0 2.2 2.0 2.8 1.9
-
1.0
2.0
3.0
4.0
5.0
6.0
7.0
Jan Feb Mar Apr May Jun Jul Aug Sep Oct Nov Dec
Months of Inventory Year-to-Year
2012
2013
2014
Outlook for November
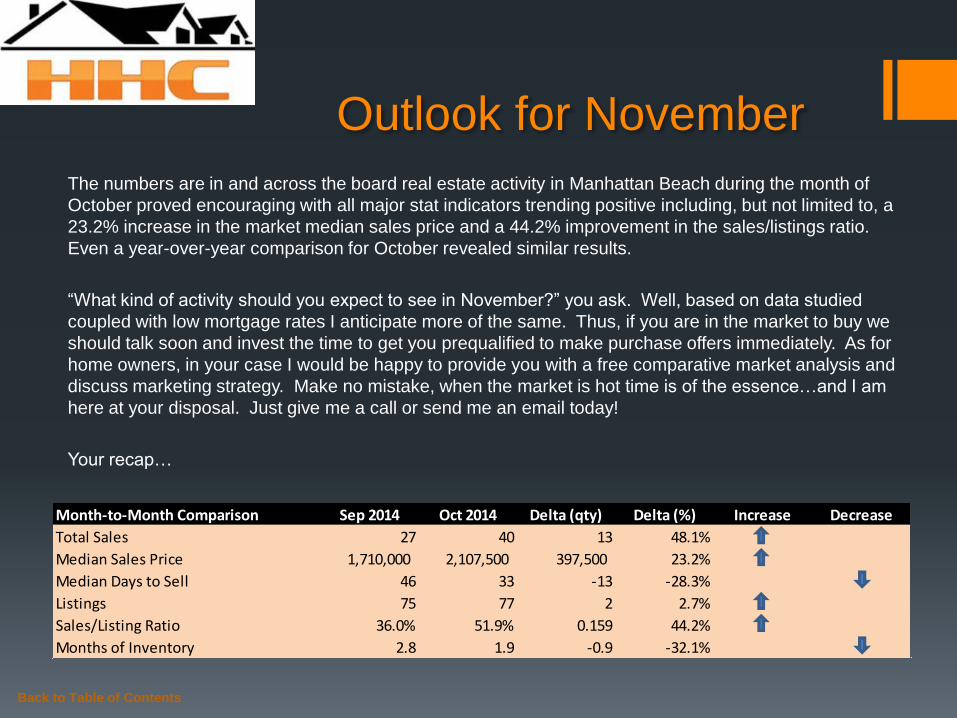
The numbers are in and across the board real estate activity in Manhattan Beach during the month of
October proved encouraging with all major stat indicators trending positive including, but not limited to, a
23.2% increase in the market median sales price and a 44.2% improvement in the sales/listings ratio.
Even a year-over-year comparison for October revealed similar results.
“What kind of activity should you expect to see in November?” you ask. Well, based on data studied
coupled with low mortgage rates I anticipate more of the same. Thus, if you are in the market to buy we
should talk soon and invest the time to get you prequalified to make purchase offers immediately. As for
home owners, in your case I would be happy to provide you with a free comparative market analysis and
discuss marketing strategy. Make no mistake, when the market is hot time is of the essence…and I am
here at your disposal. Just give me a call or send me an email today!
Your recap…
Back to Table of Contents
Month-to-Month Comparison Sep 2014 Oct 2014 Delta (qty) Delta (%) Increase Decrease
Total Sales 27 40 13 48.1%
Median Sales Price 1,710,000 2,107,500 397,500 23.2%
Median Days to Sell 46 33 -13 -28.3%
Listings 75 77 2 2.7%
Sales/Listing Ratio 36.0% 51.9% 0.159 44.2%
Months of Inventory 2.8 1.9 -0.9 -32.1%

Serving South Bay Home Buyers and Sellers Since 2001
RE/MAX Top 4 Team in California – 2012
RE/MAX 100% Club - 2011
Shorewood Realtors Top 5% in Overall Sales 2001-2006, 2008-2010
Back to Table of Contents
About
Hady Chahine…

The information being provided by CARETS (CLAW, CRISNet MLS, DAMLS, CRMLS, i-Tech MLS, and/or VCRDS) is for the visitor’s personal, non-commercial use and may not be used for
any purpose other than to identify prospective properties visitor may be interested in purchasing. Any information relating to a property referenced on this web site comes from the Internet
Data Exchange (IDX) program of CARETS. This web site may reference real estate listing(s) held by a brokerage firm other than the broker and/or agent who owns this web site. The accuracy
of all information, regardless of source, including but not limited to square footages and lot sizes, is deemed reliable but not guaranteed and should be personally verified through personal
inspection by and/or with the appropriate professionals.
Back to Table of Contents
Listings MLS BLOG Website


