

HAVERING
J S N A
By London Borough of Havering Public Health Service
Version 3.4 (March 2018)
This is Havering
2018
A Demographic and
Socio-economic profile
Some Key Facts and
Figures

Background
This is Havering… o …is a Joint Strategic Needs Assessment (JSNA)
product that provides a snapshot of the demographic and socio-economic profile of Havering
o …is intended to be the “one version of the truth” in relation to the demographic and socio-economic profile of Havering
Produced by Public Health Intelligence

Approach o A snapshot – concise and limited document size o Readable and less technical o Good visualisation of data, where appropriate o Updatable with new data, with less difficulty (quarterly
updates currently agreed)1 o Useful to commissioners and other stakeholders See the main document (“This is Havering: a demographic and socioeconomic profile”) at https://www.haveringdata.net/joint-strategic-needs-assessment/ Note: This PowerPoint version does not contain all the information in the main document
Produced by Public Health Intelligence 1 The next update is due in March 2017
GEOGRAPHIC PROFILE
POPULATION PROFILE
HOUSEHOLD PROFILE
ECONOMIC PROFILE
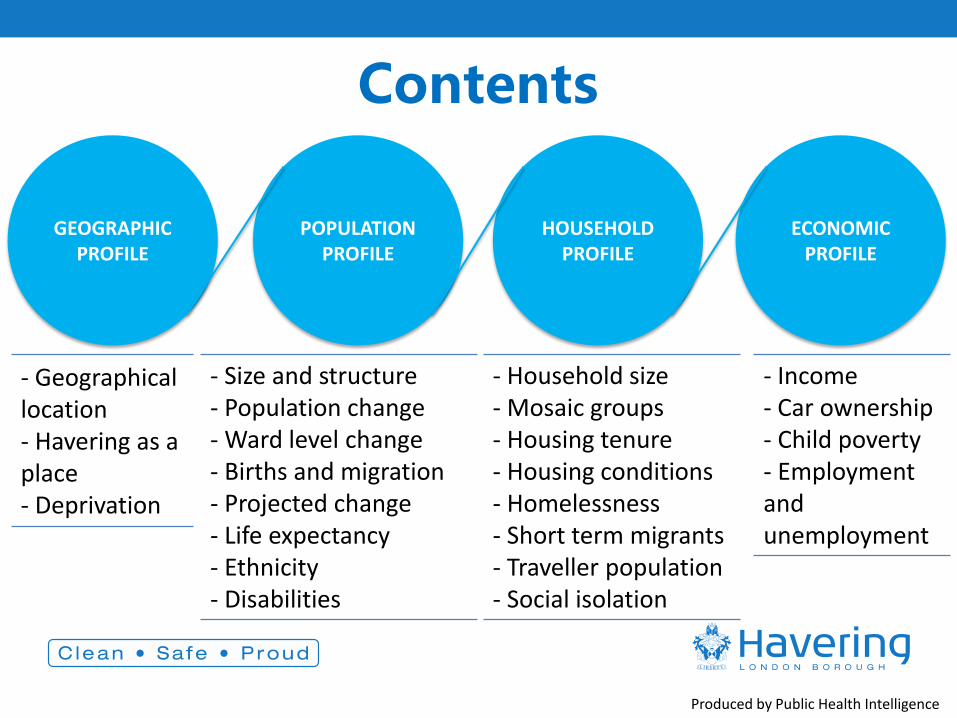
Contents
- Geographical location - Havering as a place - Deprivation
- Size and structure - Population change - Ward level change - Births and migration - Projected change - Life expectancy - Ethnicity - Disabilities
- Income - Car ownership - Child poverty - Employment and unemployment
- Household size - Mosaic groups - Housing tenure - Housing conditions - Homelessness - Short term migrants - Traveller population - Social isolation
Produced by Public Health Intelligence

GEOGRAPHIC PROFILE
POPULATION PROFILE
HOUSEHOLD PROFILE
ECONOMIC PROFILE
- Household size - Mosaic groups - Housing tenure - Housing conditions - Homelessness - Short term migrants - Traveller population - Social isolation
- Income - Car ownership - Child poverty - Employment and unemployment
Produced by Public Health Intelligence
- Geographical location - Havering as a place - Deprivation
- Size and structure - Population change - Ward level change - Births and migration - Projected change - Life expectancy - Ethnicity - Disabilities

Geographic – Summary
o The London Borough of Havering is the 3rd largest borough in London (43 miles2) and has 18 electoral wards.
o It is mainly characterised by suburban development, with almost half of the area dedicated to open green space, particularly to the east of the borough.
o Principal town (Romford) is densely populated and is an area of major metropolitan retail and night time entertainment.
o The southern part of Havering is within the London Riverside section of the Thames Gateway redevelopment area and will be an area of increasing development and population change.
o A relatively affluent borough but pockets of deprivation to the north (Gooshays and Heaton wards) and south (South Hornchurch)
Produced by Public Health Intelligence

Geographic – Location
Havering is located on the
northeast boundary of Greater London
18 Electoral Wards
3rd largest borough in Greater London (43 miles2)
Produced by Public Health Intelligence

Geographic - Green Spaces
Havering is mainly characterised by suburban development, with
almost half of the borough dedicated to open green space.
Produced by Public Health Intelligence Dataset: Local Land and Property Gazetteer Data Source: National Land and Property Gazetteer

Dataset: Mid-year Population Estimates 2016 and UK Standard Area of Measurements Data Source: Office for National Statistics (ONS)
The principal town (Romford) is densely populated and is an area of major metropolitan retail and night time entertainment.
The southern part of Havering is a part of a section of the Thames Gateway redevelopment area.
Produced by Public Health Intelligence
Geographic – Population Density

Deprivation quintile score of
Havering LSOAs*
relative to Havering
Produced by Public Health Intelligence Dataset: Indices of Multiple Deprivation, 2015 Data Source: Department for Communities and Local Government
Geography – Deprivation
Deprivation quintile score of
Havering LSOAs*
relative to England
*LSOA – Lower Super Output Area
There are pockets of deprivation to the north (Gooshays and Heaton wards) and south (South Hornchurch) of the borough.
Deprived Most Deprived More Deprived Less Deprived Least Deprived

GEOGRAPHIC PROFILE
POPULATION PROFILE
HOUSEHOLD PROFILE
ECONOMIC PROFILE
- Household size - Mosaic groups - Housing tenure - Housing conditions - Homelessness - Short term migrants - Traveller population - Social isolation
- Income - Car ownership - Child poverty - Employment and unemployment
Produced by Public Health Intelligence
- Geographical location - Havering as a place - Deprivation
- Size and structure - Population change - Ward level change - Births and migration - Projected change - Life expectancy - Ethnicity - Disabilities

Population – Summary (I) o The estimated population of Havering is 252,783 o It has the oldest population in London (median age is approximately
40 years) o Havering experienced a net population loss of 6.3% from 1983 to
2002, the population of Havering has increased year on year from 2002, with a 12.3% increase from 2002 to 2016
o There is increase in general fertility rate: 58 births (per 1,000 women aged 15-44) in 2004 to 70 in 2016 – an additional 12 births per 1,000 women aged 15-44
o Havering experienced largest net inflow of children across all London boroughs (4,580 children) in a 6-year period (2011-2016)
o Largest increases in population will occur in children (0-17 years) and older people age groups (65 years and above) up to 2033
Produced by Public Health Intelligence

Population – Summary (II) o Life expectancy at birth is 80.1 years for males and 84.2 years for
females. o Life expectancy at 65 years is 19.0 years for males and 21.7 years for
females o On 2011 census day, 83% of residents were recorded as White British
- higher than both London and England o About 90% of the borough population were born in the United
Kingdom o An increase in the Black African population is projected from 4.0% in
2016 to 5.2% of the Havering population in 2031 o 19% of working age people in Havering disclosed that they have a
disability or long term illness
Produced by Public Health Intelligence

Population – Age Structure
Population of Havering
is 252,783
Havering has the oldest population in London with a median age of
40 years old
Age structure is
similar to England but older than London.
Dataset: Mid-year Population Estimates 2015 Data Source: Office for National Statistics (ONS) Produced by Public Health Intelligence
6% 5% 4% 3% 2% 1% 0% 1% 2% 3% 4% 5% 6%
0-4
5-9
10-14
15-19
20-24
25-29
30-34
35-39
40-44
45-49
50-54
55-59
60-64
65-69
70-74
75-79
80-84
85-89
90+
Percentage of total population
Age
Gro
up
Havering Females Havering Males London Males London Females England Males England Females
FemalesMales

Population - Trend Net population loss of 6.3% from 1983 (240,200) to 2002 (225,100) but the population of Havering has increased year on year from 2002, with a 12.3% increase from 2002 to 2016
Dataset: Mid-year population estimates 1983-2016 (nearest hundreds) Data Source: Office for National Statistics (ONS) Produced by Public Health Intelligence
23
7,6
00
22
9,1
00
22
6,0
00
22
5,1
00
22
9,8
00
23
9,7
00
25
2,8
00
205,000
210,000
215,000
220,000
225,000
230,000
235,000
240,000
245,000
250,000
255,0001
984
19
851
986
19
871
988
19
891
990
19
911
992
19
931
994
19
951
996
19
971
998
19
992
000
20
012
002
20
032
004
20
052
006
20
072
008
20
092
010
20
112
012
20
132
014
20
152
016
Po
pu
lati
on
siz
e
Mid-year
Note: Axis does not start at origin

Population – Changes (2016)
Children aged 0-4
years are the largest contributors to population change, largely due to births.
Dataset: Mid-year population estimates 2016 Analysis Tool Data Source: Office for National Statistics (ONS) Produced by Public Health Intelligence
A net decrease in adults aged 75+ largely due to deaths.
-2,000 -1,000 0 1,000 2,000 3,000 4,000 5,000 6,000
0-4
5-9
10-14
15-19
20-24
25-29
30-34
35-39
40-44
45-49
50-54
55-59
60-64
65-69
70-74
75-79
80-84
85-89
90+
Population Change
Age
gro
up
s
Births Deaths
Internal Migration Inflow Internal Migration Outflow
International Migration Inflow International Migration Outflow
Other
InflowOutflow

Population – Change (Births) Increase in general fertility rate (per 1,000 women aged 15-44) from 58 births in 2004 to 70 in 2016 - an additional 12 births per 1,000 women aged 15-44
Dataset: Live Births, General Fertility Rates and Total Fertility Rates, 2004-2016 Data Source: Office for National Statistics (ONS) Produced by Public Health Intelligence
5856 54
5862
5962 62 62
6466 67
70
0
10
20
30
40
50
60
70
80
2004 2005 2006 2007 2008 2009 2010 2011 2012 2013 2014 2015 2016
Nu
mb
er
of
live
bir
ths
pe
r 1
00
0 w
om
en
age
d 1
5-4
4
Year
Bexley Havering Outer London England London Linear trend (Havering)

Population – Change (Inflow)
Between 2011 and 2016, 4,580 children settled in Havering from another
London borough - the largest net inflow of children across all London boroughs during the six year period
Produced by Public Health Intelligence Dataset: Internal Migration Flows, 2011-2016 Data Source: Greater London Authority (GLA)
-15,413
-13,982
-12,498
-12,474
-10,011
-9,243
-8,707
-8,669
-7,821
-7,798
-7,530
-7,322
-7,281
-6,215
-6,154
-5,907
-5,691
-5,599
-5,042
-2,659
-1,733
-1,637
-1,448
-949
-659
-470
-156
-90
-23
1,917
2,428
2,952
4,536
-20,000 -15,000 -10,000 -5,000 0 5,000 10,000
Newham
Wandsworth
Lambeth
Southwark
Haringey
Waltham Forest
Brent
Ealing
Lewisham
Tower Hamlets
Hackney
Hammersmith and Fulham
Westminster
Islington
Camden
Greenwich
Hounslow
Kensington and Chelsea
Merton
Barnet
Croydon
Richmond upon Thames
Redbridge
Harrow
Hillingdon
Kingston upon Thames
City of London
Enfield
Barking and Dagenham
Sutton
Bromley
Bexley
Havering

The life expectancy at birth for people living in Havering is
80.1 years for males and 84.2 years for females
Life expectancy in Havering has been mostly higher than the England average and has been on the increase over the last decade
Dataset: Life expectancy at birth, 2001-2003 to 2014-2016 Data Source: Office for National Statistics (ONS) Produced by Public Health Intelligence
Population – Life Expectancy at Birth
75
77
79
81
83
85
87
Life
exp
ect
ancy
at
bir
th (y
ear
s)
Havering Female London Female England Female
Havering Male London Male England Male
No
te: A
xis
do
es
no
t sta
rt
at o
rigi
n

Gap in life expectancy at birth between most and least deprived deciles within Havering
is 7.9 years for males and 5.5 years for females
Dataset: Public Health Outcomes Framework (PHOF - 0.1ii. Life expectancy at birth) Data Source: Public Health England (PHE) Produced by Public Health Intelligence
Population – Life Expectancy at Birth (Inequalities)

The life expectancy at 65 years for people living in Havering is
18.9 years for males and 21.6 years for females
Mostly higher than the England average for females in last decade. And has been on the increase over the last decade (for both males and females).
Produced by Public Health Intelligence Dataset: Life expectancy at 65, 2001-2003 to 2014-2016 Data Source: Public Health Outcomes Framework (PHOF)
Population – Life Expectancy at 65
15
16
17
18
19
20
21
22
23
Life
exp
ect
ancy
at
age
65
(ye
ars)
Havering Female London Female England Female
Havering Male London Male England Male
No
te: A
xis
do
es
no
t sta
rt
at o
rigi
n

The population is projected to increase from 257,514 (in 2018) by 7%, 14% and 18% to 276,645 (in 2023), 294,665 (in 2028) and 303,769 (in 2033) respectively.
Dataset: 2016 Round Strategic Housing Land Availability Assessment (SHLAA)-Based Projections Data Source: Greater London Authority (GLA) Produced by Public Health Intelligence
Population – Projections
The largest increases will occur in
children (0-17 years) and older people (65 years and above) up to
2033.
17,600 18,700 19,100 18,50020,300 22,800 24,300 24,10020,600 24,900 28,200 29,50019,800 19,900 22,200 24,200
132,400140,000
145,100 146,100
39,30041,900
46,500 49,7007,600
8,4009,300 11,700
0
50,000
100,000
150,000
200,000
250,000
300,000
350,000
2018 2023 2028 2033
Nu
mb
er
of
resi
de
nts 85+
65-84
25-64
18-24
11-17
5-10
0-4

2016
No. No.% change
from 2016No.
% change
from 2016No.
% change
from 2016
Brooklands 17,623 20,523 16.0% 23,686 34.0% 24,276 38.0%
Cranham 12,951 13,113 1.0% 13,448 4.0% 13,568 5.0%
Elm Park 13,190 13,214 0.0% 13,335 1.0% 13,439 2.0%
Emerson Park 12,299 12,296 0.0% 12,436 1.0% 12,616 3.0%
Gooshays 15,402 16,365 6.0% 16,763 9.0% 16,863 9.0%
Hacton 12,470 12,495 0.0% 12,809 3.0% 12,965 4.0%
Harold Wood 13,924 15,038 8.0% 15,805 14.0% 16,213 16.0%
Havering Park 13,410 13,482 1.0% 13,582 1.0% 13,746 3.0%
Heaton 13,952 14,165 2.0% 14,094 1.0% 14,077 1.0%
Hylands 13,301 13,433 1.0% 13,617 2.0% 13,773 4.0%
Mawneys 13,339 13,376 0.0% 13,491 1.0% 13,547 2.0%
Pettits 13,408 13,633 2.0% 14,152 6.0% 14,311 7.0%
Rainham and Wennington 13,009 13,528 4.0% 14,191 9.0% 14,569 12.0%
Romford Town 17,243 18,931 10.0% 22,028 28.0% 23,600 37.0%
South Hornchurch 15,460 20,732 34.0% 22,319 44.0% 22,276 44.0%
Squirrel's Heath 13,848 13,855 0.0% 13,898 0.0% 14,019 1.0%
St Andrew's 13,589 13,689 1.0% 14,389 6.0% 14,557 7.0%
Upminster 13,200 13,571 3.0% 14,084 7.0% 14,584 10.0%
Ward
2021 2026 2031
The populations in Romford Town, South Hornchurch and Brooklands wards are expected to increase the most over the next fifteen years.
Dataset: 2016 Round Strategic Housing Land Availability Assessment (SHLAA)-Based Projections Data Source: Greater London Authority (GLA) Produced by Public Health Intelligence
Population – Ward Projections

83%
17%
Havering
80%
20%
England45%
55%London
White British BAME
Havering is one of the most ethnically homogenous places in
London, with 83% of its residents recorded as White British higher than both London and England
Dataset: Census, 2011 Data Source: Office for National Statistics (ONS) Produced by Public Health Intelligence
Population – Ethnicity

Population – Ethnicity by Ward
Brooklands, Emerson Park, Romford Town and South Hornchurch are the wards
with the highest proportion of non-white categories.
Produced by Public Health Intelligence Dataset: Census, 2011 Data Source: Office for National Statistics (ONS)

Dataset: GLA 2015 Round Trend-based ethnic group projections, long-term migration scenario; Data Source: Greater London Authority (GLA)
The white population (including
the minority white population)
is projected to decrease from 84% (in 2016) to 78% (in 2031) of the population
Produced by Public Health Intelligence
Population – Ethnicity Projections
It is projected that the Black African population will
increase from 4% in 2016 to 5.2% of the Havering population in 2031.

Produced by Public Health Intelligence Dataset: Census, 2011 Data Source: Office for National Statistics (ONS)
Population – Country of Birth
Country of birth of non-UK born residents Count (rate per 10,000 of Havering population)
90% of Havering residents were born in the UK

Havering is estimated to have one of the highest rates of serious physical
disabilities among London boroughs.
Dataset: Health Survey for England, 2001 Data Source: Projecting Adult Needs and Service Information (PANSI 2017) Produced by Public Health Intelligence
Population – Disability
1,5
53
1,6
94
1,7
19
1,7
35
1,7
47
1,7
67
1,8
32
1,8
65
1,8
77
1,9
05
1,9
12
1,9
64
1,9
83
1,9
88
2,0
07
2,0
28
2,0
72
2,0
75
2,0
87
2,1
08
2,1
15
2,1
19
2,1
34
2,1
38
2,1
40
2,1
78
2,2
55
2,2
65
2,2
97
2,3
07
2,3
23
2,3
59
2,3
80
2,012
2,298
0
500
1,000
1,500
2,000
2,500
3,000
Tow
er
Ham
lets
Islin
gto
nH
ackn
eyLa
mb
eth
Wan
dsw
ort
hN
ewha
mSo
uth
war
kC
amd
enH
amm
ers
mit
h a
nd
Fu
lham
Har
inge
yW
estm
inst
erLe
wis
ham
Gre
enw
ich
Cit
y o
f Lo
ndo
nW
alth
am F
ores
tB
arki
ng
and
Dag
enh
amH
oun
slo
wB
ren
tK
ings
ton
up
on T
ham
es
Red
bri
dge
Hill
ingd
on
Mer
ton
Ken
sin
gto
n a
nd
Ch
else
aB
arne
tEa
ling
Enfi
eld
Har
row
Cro
ydon
Bex
ley
Sutt
on
Hav
erin
gR
ich
mo
nd
upo
n T
ham
esB
rom
ley
Rat
e p
er
10
0,0
00
po
pu
lati
on
age
d 1
8-6
4 y
ear
s London rate per 100,000 England rate per 100,000

GEOGRAPHIC PROFILE
POPULATION PROFILE
HOUSEHOLD PROFILE
ECONOMIC PROFILE
- Household size - Mosaic groups - Housing tenure - Housing conditions - Homelessness - Short term migrants - Traveller population - Social isolation
- Income - Car ownership - Child poverty - Employment and unemployment
- Geographical location - Havering as a place - Deprivation
- Size and structure - Population change - Ward level change - Births and migration - Projected change - Life expectancy - Ethnicity - Disabilities

Household – Summary (I) o There are 105,691 households in Havering o Households are mainly composed of pensioners and married
couples with dependent children o All adults in 52% of households (40,722) are working and no adults
are working in 16% of households (12,256) o In 2011, there were 7,224 one-adult households with children
under 16 in Havering. This is an increase from 2001 when there were 4,005 lone parent households.
o 73% of the population in Havering are home owners – one of the highest proportions across London boroughs
o Housing is mainly Victorian and Edwardian. Houses are generally large with an average of 2.8 bedrooms per household (higher than both London and England)
Produced by Public Health Intelligence

Household – Summary (II) o Rate of homeless households in temporary accommodation is 7.2
per 1,000 households (lower London but higher than England). o Rate of statutory homelessness (eligible people not in priority need) is
0.5 per 1,000 households (higher than both London and England). o The borough has a rate of short-term international migrants of 142
per 100,000 population, the second lowest of all London local authorities.
o 78% of the traveller caravans in Havering were on unauthorised sites, as at July 2017.
o 32% (13,449) of the population aged 65 years and above are living in one-person households. Almost half (48%) of all one person households in Havering are occupied by persons aged 65 years and over, which is the highest proportion in London
Produced by Public Health Intelligence

Household – Size and Composition In 2011, there were 7,224 one-adult households with children under 16 – an
increase from 4,005 a decade earlier. There has also been an increase in the number of one-adult households with no children.
Dataset: For 1981,1991,and 2001 - Historic Census Tables; For 2011 - Census 2011 Table KS105EW Data Source: Greater London Authority and adapted from the Office of National Statistics (ONS) Produced by Public Health Intelligence
9,537(11%)
12,514(14%)
14,306(16%)
13,499(14%)
4,640(6%)
7,801(9%)
11,312(12%)
18,933(20%)
40,982(48%)
43,445(49%)
41,288(45%)
35,526(37%)
1,540(2%)
2,417(3%)
4,005(4%)
7,224(7%)
28,014(33%)
22,889(26%)
20,811(23%)
22,017(23%)
0% 20% 40% 60% 80% 100%
1981
1991
2001
2011
Percentage of households
Ce
nsu
s Y
ea
r
One Adult Households:
No Children Under 16
(Pensionable Age)
One Adult Households:
No Children Under 16
(Under Pensionable Age)
Two or more Adult
Households: No Children
Under 16
One Adult Households:
With Children Under 16
Two or more Adult
Households: With
Children Under 16
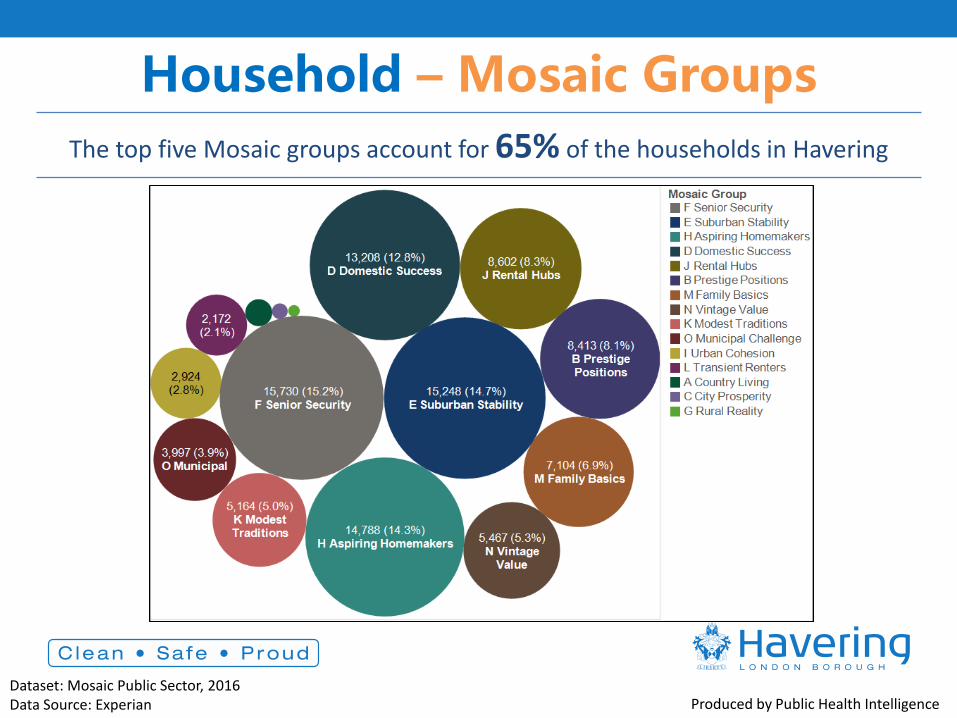
Household – Mosaic Groups
The top five Mosaic groups account for 65% of the households in Havering
Dataset: Mosaic Public Sector, 2016 Data Source: Experian Produced by Public Health Intelligence

Household – Top 5 Mosaic Groups
Produced by Public Health Intelligence Dataset: Mosaic Public Sector, 2016 Data Source: Experian
Group – Name Typical Profile Picture One Line Description Key Features
F – Senior
Security
Elderly people with assets
who are enjoying a
comfortable retirement
Elderly singles and couples
Homeowners
Comfortable homes
Additional pensions above state
Don't like new technology
Low mileage drivers
E – Suburban
Stability
Mature suburban owners
living settled lives in mid-
range housing
Older families
Some adult children at home
Suburban mid-range homes
3 bedrooms
Have lived at same address some years
Research on Internet
H – Aspiring
Homemakers
Younger households settling
down in housing priced
within their means
Younger households
Full-time employment
Private suburbs
Affordable housing costs
Starter salaries
Buy and sell on eBay
D – Domestic
Success
Thriving families who are
busy bringing up children
and following careers
Families with children
Upmarket suburban homes
Owned with a mortgage
3 or 4 bedrooms
High Internet use
Own new technology
J – Rental
Hubs
Educated young people
privately renting in urban
neighbourhoods
Aged 18-35
Private renting
Singles and sharers
Urban locations
Young neighbourhoods
High use of smartphones

Household – Tenure 73% of the population in Havering are home owners.
This is one of the highest proportions across London boroughs
Produced by Public Health Intelligence Dataset: Integrated Household Survey, 2015 Data Source: Office for National Statistics (ONS)
18%27% 29%
32%
38%44%
24%
17%14%
26%18% 12%
0%
10%
20%
30%
40%
50%
60%
70%
80%
90%
100%To
wer
Ham
lets
Wes
tmin
ster
Islin
gto
nH
ack
ney
Ne
wh
am
Sou
thw
ark
Lam
bet
hC
amd
enK
ensi
ngt
on
an
d C
hel
sea
Ham
mer
smit
h an
d Fu
lham
Ha
ring
eyB
ren
tG
reen
wic
hB
arki
ng
and
Dag
enh
amH
ou
nsl
ow
Lew
isha
mLo
nd
on
Ealin
gW
an
dsw
ort
hEn
fiel
dM
erto
nH
illin
gdon
Wal
tham
For
est
Bar
ne
tH
arr
ow
Cro
ydo
nR
edbr
idge
Engl
and
Kin
gsto
n u
po
n T
ham
esSu
tto
nB
rom
ley
Ha
veri
ng
Ric
hm
on
d u
po
n T
ham
es
Bex
ley
Pro
po
rtio
n o
f ho
use
ho
lds
Owned Outright Owned with mortgage Social Rented Private Rented

Household – Homelessness
Rate of homeless households in temporary accommodation in Havering is 7.2 per 1,000, lower than London but higher than England
Dataset: Public Health Outcomes Framework (1.15ii) Data Source: Public Health England Produced by Public Health Intelligence
Also in the highest quartile when compared to other across other local authorities in similar deprivation decile (3rd less deprived)
0.2
0.3
0.4
0.4
0.6
0.7
0.7
0.9
1.1
1.4 2.
8 3.9
7.2
10.4
18.2
15.1
2.7
0
2
4
6
8
10
12
14
16
18
20
East
Rid
ing
of
York
shir
e
Staf
ford
shir
e
Som
ers
et
Wo
rces
ters
hir
e
No
rth
So
me
rse
t
Shro
psh
ire
Traf
ford
Dev
on
Solih
ull
Pool
e
Esse
x
Swin
do
n
Hav
erin
g
Bex
ley
Bar
net
Ra
te p
er
10
00
ho
use
ho
lds
England London Deprivation decile

Household – Short-term Migration Rate of short-term international migrants is 142 per 100,000 population (2nd lowest in London and significantly lower than England)
Produced by Public Health Intelligence Dataset: Short-term International Migration Annual Report – Year ending mid-2014 estimates Data Source: Office for National Statistics (ONS)
12
91
42
14
41
45
20
53
11
33
94
01
40
14
13
43
54
38
52
15
21
54
45
58
55
85
68
58
15
81
66
66
67
68
66
88 82
88
67
92
41
,00
91
,05
0 1,3
37
1,3
84
1,4
01
616
280
0
250
500
750
1,000
1,250
1,500
1,750
2,000Su
tto
nH
aver
ing
Bro
mle
yB
exle
yR
ich
mo
nd
upo
n T
ham
esC
royd
onH
illin
gdo
nLe
wis
ham
Enfi
eld
Wan
dsw
ort
hK
ings
ton
up
on T
ham
es
Mer
ton
Red
bri
dge
Lam
bet
hG
reen
wic
hH
oun
slo
wH
amm
ers
mit
h a
nd
Fu
lham
Ealin
gB
arki
ng
and
Dag
enh
amH
ackn
eyB
arne
tK
ensi
ngt
on
an
d C
hel
sea
Sou
thw
ark
Har
row
Har
inge
yIs
lingt
on
Wal
tham
For
est
Bre
nt
Tow
er
Ham
lets
Cam
den
New
ham
Wes
tmin
ster
Rat
e p
er
10
0,0
00
London rate per 100,000 England rate per 100,000

GEOGRAPHIC PROFILE
POPULATION PROFILE
HOUSEHOLD PROFILE
ECONOMIC PROFILE
- Household size - Mosaic groups - Housing tenure - Housing conditions - Homelessness - Short term migrants - Traveller population - Social isolation
- Income - Car ownership - Child poverty - Employment and unemployment
- Geographical location - Havering as a place - Deprivation
- Size and structure - Population change - Ward level change - Births and migration - Projected change - Life expectancy - Ethnicity - Disabilities

Economic – Summary o The average gross income per household in Havering (£44,430, as
measured in 2012/13) is low in comparison to the London average (£51,770) and slightly higher than the England average of £39,557
o 77% of households in Havering have at least one car and compared to other local authorities in London, Havering has the second highest proportion of households (32.8%) with 2 or more cars.
o Majority of children in Havering are not poor, but around 8,800 live in income-deprived households. Gooshays and Heaton wards have the highest proportion of children living in poverty
o About 79.8% of working age residents in Havering were in employment between October 2016-Septmebr 2017. Overall employment rate in Havering is higher than London (73.7%) and England (74.5%).
o The proportion of working age residents in Havering claiming out-of-work benefits* (6.8%) is significantly lower than England (8.4%)
Produced by Public Health Intelligence *Main out-of-work benefits includes the groups: job seekers, ESA and incapacity benefits, lone parents and others on income related benefits.

Economic - Income The average gross household income per household in Havering is £44,430 in
2012/13. It is lower than the London average (£51,770) and slightly higher than England (£39,557).
Produced by Public Health Intelligence Dataset: Public Health Outcomes Framework Data Source: Public Health England
£3
4,0
80
£3
4,2
60
£3
9,4
60
£3
9,6
30
£4
1,2
50
£4
2,6
90
£4
3,3
60
£4
4,3
70
£4
4,4
30
£4
4,4
30
£4
4,4
90
£4
4,9
50
£4
5,1
20
£4
5,3
80
£4
5,6
90
£4
5,7
20
£4
5,8
60
£4
8,0
00
£4
8,6
10
£4
9,0
60
£4
9,1
70
£5
4,5
30
£5
4,9
50
£5
5,1
40
£5
6,9
20
£5
7,1
60
£6
2,9
10
£6
6,2
20
£6
7,9
90
£7
6,6
10
£8
0,7
60
£9
9,3
90
£1
16
,35
0
£51,770
£39,557
£0
£20,000
£40,000
£60,000
£80,000
£100,000
£120,000B
arki
ng
and
Dag
enh
amN
ew
ham
Wal
tham
Fo
rest
Bre
nt
Enfi
eld
Hac
kney
Lew
ish
amG
reen
wic
hB
exle
yH
aver
ing
Ho
uns
low
Hill
ingd
on
Cro
ydo
nR
edb
rid
geEa
ling
Tow
er
Ham
lets
Har
inge
ySo
uth
war
kLa
mb
eth
Har
row
Sutt
on
Bar
net
Islin
gton
Bro
mle
yK
ings
ton
upo
n T
ham
esM
erto
nH
amm
ersm
ith
and
Fu
lham
Wan
dsw
orth
Cam
den
Ric
hmo
nd u
po
n Th
ames
Wes
tmin
ste
rC
ity
of
Lon
do
nK
ensi
ngto
n a
nd
Che
lsea
An
nu
al In
com
e (£
)
London Average England Average

Economic – Car ownership 77% of households in Havering have at least one car and compared to other local authorities in London, Havering has the second highest proportion of households (32.8%) with 2 or more cars.
Produced by Public Health Intelligence Dataset: Census 2011 Data Source: Office for National Statistics

Economic - Child Poverty
The majority of children in Havering are not poor, but around 8,800 live in income-deprived households.
Gooshays and Heaton wards have the highest proportion of children living in poverty.
Produced by Public Health Intelligence Dataset: Index of Deprivation Affecting Children Index, 2015 Data Source: Department for Communities and Local Government
Most Deprived
More Deprived
Deprived
Less Deprived
Least Deprived
Figure 37: Income deprivation affecting Children, quintiles within Havering LSOA, 2015

Economic Profile – Employment 79.8% of working age residents in Havering were in employment (October 2016-September 2017 Annual household survey), which is higher than London and England.
Produced by Public Health Intelligence Dataset: Annual Population Survey, October 2016 – September 2017 Data Source: Office for National Statistics via NOMIS
62.1
66.3
67.0
67.5
67.8
67.9
68.8
68.8
68.9
71.7
72.9
72.9
73.6
73.6
74.5
74.7
74.9
75.1
75.3
75.4
75.7
76.3
76.5
76.8
77.0
77.3
77.4
79.5
79.8
79.9
81.3
82.5
73.7
74.5
0102030405060708090
100
Tow
er H
amle
tsN
ewha
mB
arki
ng a
nd
Dag
enha
mB
ren
tH
ari
ngey
Ken
sing
ton
and
Che
lsea
Wes
tmin
ster
Cam
den
Enfi
eld
Red
brid
geB
arne
tH
illin
gdon
Ho
uns
low
Gre
enw
ich
King
ston
up
on T
ham
esB
exle
yR
ich
mo
nd u
pon
Th
ames
Islin
gton
Hac
kney
Ha
mm
ersm
ith
and
Fulh
amEa
ling
Bro
mle
yH
arro
wSo
uthw
ark
Cro
ydo
nM
erto
nW
alth
am F
ores
tW
and
swo
rth
Hav
erin
gLe
wis
ham
Sutt
on
Lam
bet
h
Per
cen
tage
of w
ork
ing
resi
den
ts (%
)
London England
Economic Profile – Unemployment The proportion of working age residents in Havering claiming out-of-work
benefits (6.8%) is significantly lower than England.
Produced by Public Health Intelligence Dataset: Annual Population Survey, October 2016 – September 2017 Data Source: Office for National Statistics via NOMIS
4.3
4.4
4.6
5.0
5.3
5.3
5.6
5.7
5.9
6.0
6.1
6.3
6.5
6.8
6.9
7.2
7.4
7.6
7.6
7.7
7.7
7.8
8.1
8.1
8.1
8.7
8.9
8.9
9.1
9.9 10
.010
.0
7.2
8.4
0
3
6
9
12
15R
ichm
ond
up
on
Tham
esSu
tto
nK
ings
ton
upo
n T
ham
esH
ou
nslo
wH
arro
wM
erto
nR
edb
rid
geW
ands
wor
thB
arn
etB
rom
ley
Hill
ingd
on
Cro
ydo
nB
exle
yH
aver
ing
Ken
sing
ton
an
d C
hels
eaW
estm
inst
er
Ne
wh
amEa
ling
Sou
thw
ark
Ham
mer
smit
h an
d F
ulh
amW
alth
am F
ore
stB
ren
tC
amde
nLa
mb
eth
Tow
er
Ham
lets
Enfi
eld
Gre
enw
ich
Har
inge
yLe
wis
ham
Islin
gton
Bar
kin
g an
d D
agen
ham
Hac
kney
Pe
rce
nta
ge (%
)
London England
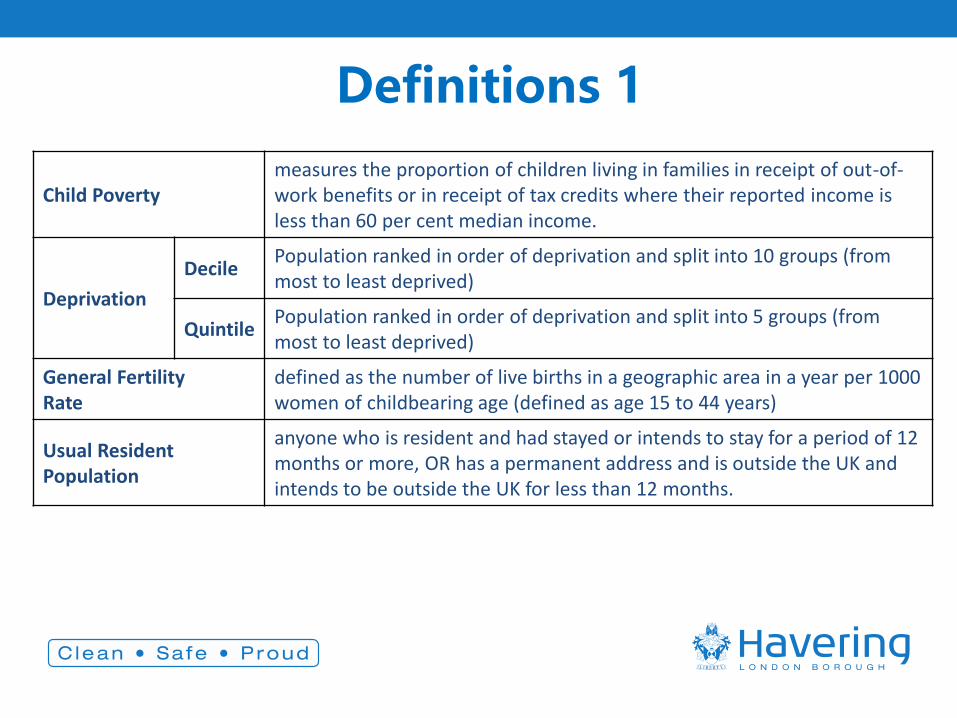
Definitions 1
Child Poverty measures the proportion of children living in families in receipt of out-of-work benefits or in receipt of tax credits where their reported income is less than 60 per cent median income.
Deprivation
Decile Population ranked in order of deprivation and split into 10 groups (from most to least deprived)
Quintile Population ranked in order of deprivation and split into 5 groups (from most to least deprived)
General Fertility Rate
defined as the number of live births in a geographic area in a year per 1000 women of childbearing age (defined as age 15 to 44 years)
Usual Resident Population
anyone who is resident and had stayed or intends to stay for a period of 12 months or more, OR has a permanent address and is outside the UK and intends to be outside the UK for less than 12 months.

Definitions 2
Life Expectancy
a frequently used indicator of the overall health of a population: a longer life expectancy is generally a reflection of better health. Reducing the differences in life expectancy is a key part of reducing health inequalities. Life expectancy at birth for an area is an estimate of how long, on average, babies born today may live if she or he experienced that area’s age-specific mortality rates for that time period throughout her or his life.
Migration
Internal calculated as the difference in total between those moving into and out of the borough from other local authorities in the United Kingdom
International
Long-term international migrants: those coming to the United Kingdom (UK) for more than a year Short-term international migrants: those coming to the United Kingdom (UK) for less than a year
Lower layer Super Output Areas
are a geographic hierarchy used by Office for National Statistics (ONS) to improve the reporting of small area statistics. They are built from groups of contiguous Output Areas and have been automatically generated to be as consistent in population size as possible, and typically contain from four to six Output Areas. The minimum population is 1000 and the mean is 1500

Definitions 3
Statutory Homelessness (Eligible people not in priority need)
This indicator demonstrates the number of households that have presented themselves to their local authority but under homelessness legislation have been deemed to be not in priority need. The majority of the people that full under this cohort are single homeless people. Households and individuals that are eligible but not in priority need or are in temporary accommodation can have greater public health needs than the population as a whole. Count of households who are eligible homeless people but deemed to be not in priority need under part VII of the Housing Act 1996 or part III of the Housing Act 1985.. People who fall under this criteria must still be provided with advice and assistance in securing their own accommodation.
Households in temporary accommodation
These data demonstrate the number of homeless households in temporary accommodation awaiting a settled home.
2 (Definition from Department of Communities and Local Government)


