
Welcome To the Second
NY2014

This presentation may make forward-looking statements relating to such matters as continued growth prospects for
the company, industry trends and product and technology initiatives. These statements are based on currently
available information and our current assumptions, expectations and projections about future events. While we
believe that our assumptions, expectations and projections are reasonable in view of currently available information,
you are cautioned not to place undue reliance on these forward-looking statements. Our actual results may differ
materially from those included in this presentation, for a variety of reasons, including those described in the forward-
looking statements and risk factor sections of our 10-K and other filings with the Securities and Exchange
Commission, which are available on our investor relations website. (http://investor.mercadolibre.com)
All of the information included in this presentation is updated as of October 15th, 2014. Except as may be required
by applicable law, we assume no obligation to publicly update or revise our statements.

Welcome and Company Overview – Marcos Galperín (CEO)
Marketplace – Stelleo Tolda (COO)
Payments – Osvaldo Giménez (MercadoPago EVP)
Coffee Break
Technology – Daniel Rabinovich (CTO)
Financial Overview – Pedro Arnt (CFO)
Q&A session
Lunch Break
End of the event
Agenda New York October 15, 2014

Company overview Strategic Summary
Marcos Galperín (CEO)

eCommerce is still very early
stage in Latin America
2013 eCommerce Penetration of Total Retail
Source: Euromonitor
0%
5%
10%
15%

The opportunity ahead is enormous;
LATAM eCommerce market to double by 2018
% of Total Retail (LATAM) 2.1 % 2.4 % 2.7 % 3.0 % 3.3 % 3.8 %
% of Total Retail (USA) 7.4 % 8.2 % 9.0 % 9.9 % 10.8 % 11.6 %
2013 2014 2015 2016 2017 2018
CAGR
(13-18)
20 %
10 %
17 %
14 %
Rest of LATAM Argentina
Mexico Brazil
Source: Euromonitor
CAGR 16%
$23B $27B
$31B $36B
$41B
$47B

As the leader in all of its
markets, MELI is poised to
benefit from these tailwinds
Source: Comscore August 2014 (Desktop only)
Brazil
24,675
Netshoes 17,074
Americanas.com 14,689
OLX 14,655
BomNegocio 13,284
Walmart 12,463
Buscapé 11,489
Submarino 9,290
Magazineluiza.com 8,145
AliExpress 8,234
Argentina
7,640
AlaMaula 2,223
OLX 2,101
Amazon 1,678
NetShoes 956
Garbarino 896
Frávega 856
Musimundo 715
Netflix 675
Falabella 667
4,471
VivaAnuncios 2,153
Amazon 2,029
Ebay 1,749
Netflix 1,278
Apple 1,265
Segundamano.mx 1,256
Walmart 1,019
TicketMaster 1,011
Trovit 871
Mexico Venezuela
4,100
Amazon 2,416
OLX 1,123
QueBarato! 415
Apple 401
Ebay 362
Clasf 209
Alibaba.com 209
VivaStreet 191
HP 188
Colombia
2,319
Amazon 968
OLX 930
Ebay 707
Linio 516
Apple 502
Buscapé 472
Exito 468
Trovit 457
Dafiti 441
1,271
Yapo.cl 934
Falabella 924
Amazon 663
Sodimac 622
OLX 599
Paris.cl 589
Riplay 563
Buscapé 468
QueBarato! 393
Chile
864
OLX 566
Amazon 564
Falabella 366
Linio 293
Apple 263
Nuestromercado 249
Ebay 232
Neoauto.com 227
Urbania.pe 209
Peru
Unique Visitors (K)
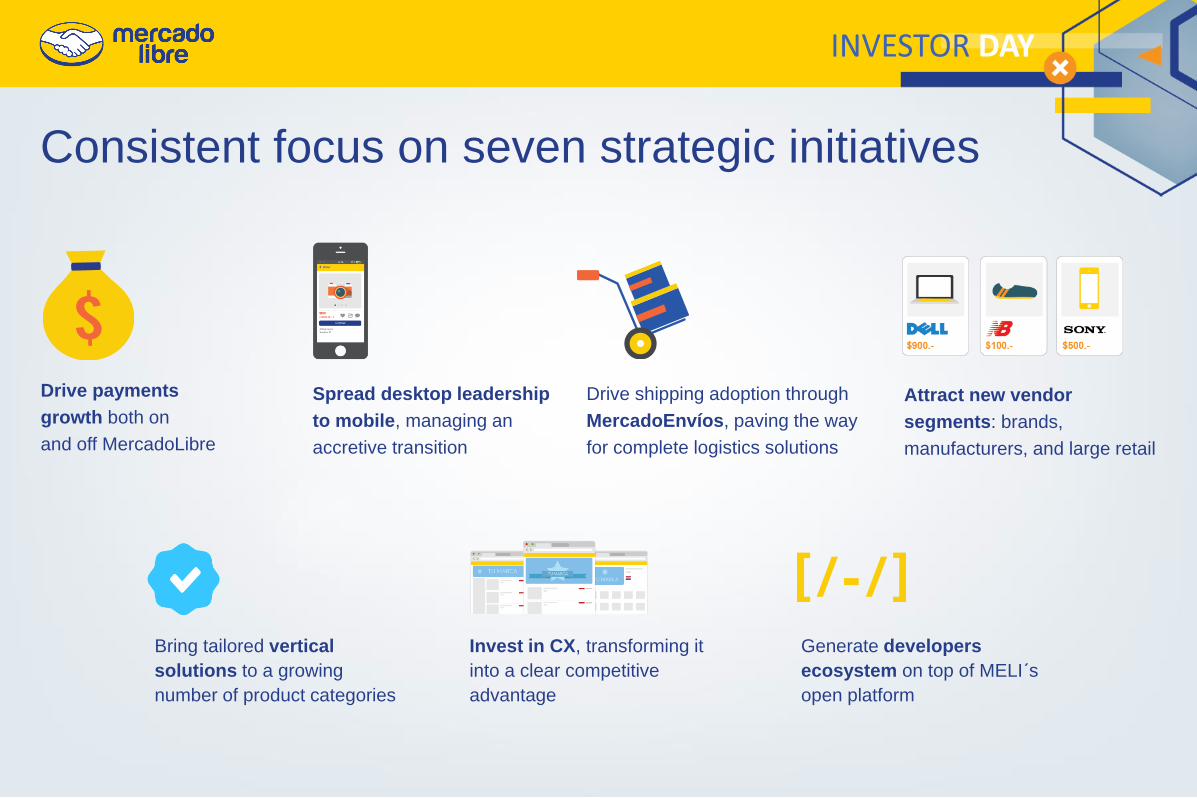
Consistent focus on seven strategic initiatives
Drive payments
growth both on
and off MercadoLibre
Spread desktop leadership
to mobile, managing an
accretive transition
Drive shipping adoption through
MercadoEnvíos, paving the way
for complete logistics solutions
Attract new vendor
segments: brands,
manufacturers, and large retail
Generate developers
ecosystem on top of MELI´s
open platform
Bring tailored vertical
solutions to a growing
number of product categories
Invest in CX, transforming it
into a clear competitive
advantage

We continue to
Advance new
solutions on a
growing platform
Logistics
service
Your own
virtual store
Send &
receive
payments
Advertise & grow
your sales

We still have room to expand existing solutions
across our current markets
Monetized marketplace On-platform Off-platform Financing Marketplace
Brazil
Argentina
Mexico
Venezuela
Colombia
Chile
Uruguay
Peru
Ecuador
Costa Rica
Dominican Republic
Panama
Portugal

We are building an enhanced marketplace

…With significant
volume across
the platform in
the past year
6M items
shipped
112K active
virtual stores
37M
Transactions
13K
Advertisers
90M
Items Sold

There is still much more opportunity to capture
in the market and within MercadoLibre
Note: Figures not drawn to scale, Numbers shown are approximate
Source: WorldBank, Euromonitor, ComScore, Company Estimates
Mercado
Libre 600M People
300M Internet Users
200M
Online Shoppers
Latin
America GMV
TPV
Financing
Mercado
Envios
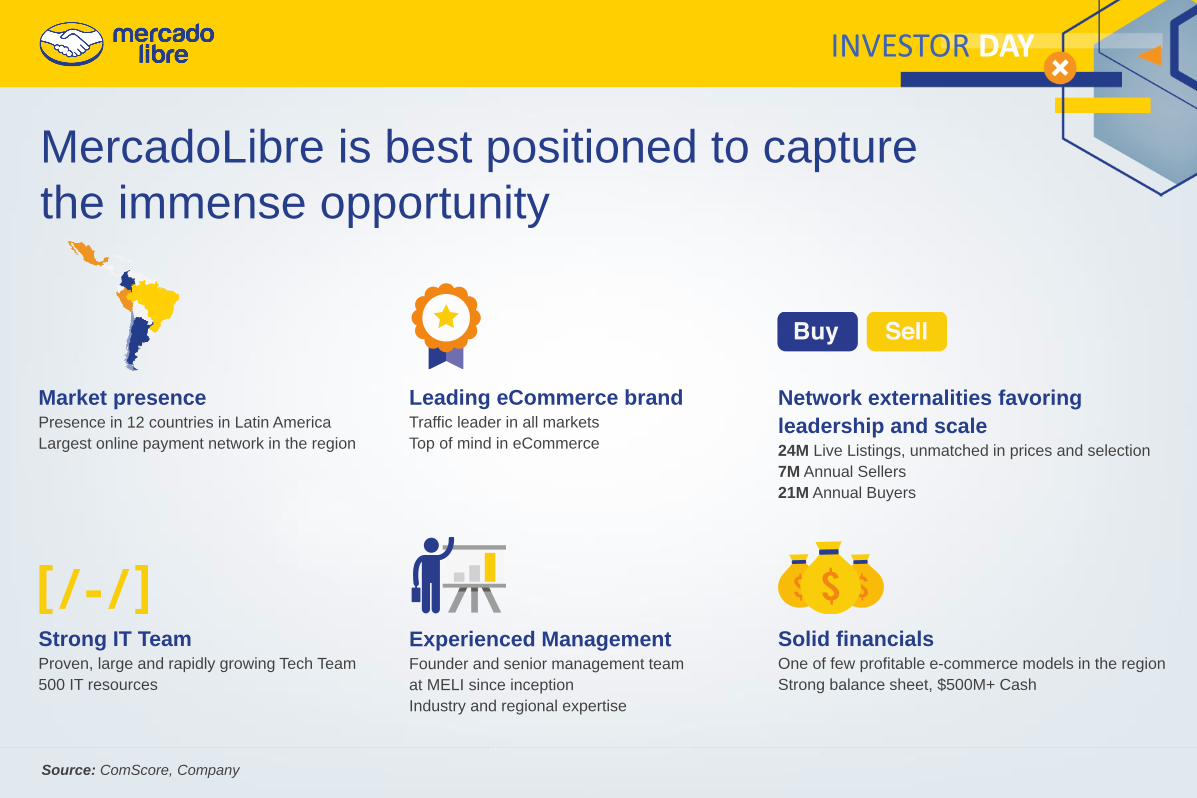
MercadoLibre is best positioned to capture
the immense opportunity
Source: ComScore, Company
Market presence Presence in 12 countries in Latin America
Largest online payment network in the region
Experienced Management Founder and senior management team
at MELI since inception
Industry and regional expertise
Leading eCommerce brand Traffic leader in all markets
Top of mind in eCommerce
Network externalities favoring
leadership and scale 24M Live Listings, unmatched in prices and selection
7M Annual Sellers
21M Annual Buyers
Solid financials One of few profitable e-commerce models in the region
Strong balance sheet, $500M+ Cash
Strong IT Team Proven, large and rapidly growing Tech Team
500 IT resources

Marketplace
Stelleo Tolda (COO)

The scale of our
marketplace
attracts sellers
and buyers
across Latin
America
24M Live Listings
21M
Buyers
90M Items
Purchased
7M
Sellers
$7.6B
GMV
Note: Live listings as of June 2014; other data shown represents trailing twelve months through June 2014

Our marketplace continues to show
strong growth in key metrics
Note: TTM = Trailing twelve months
Successful Items (M) Gross Merchandise
Volume ($B) Sellers (M) Buyers (M)
0
2
4
6
8
June 2011TTM
June 2014TTM
0
2
4
6
8
June 2011TTM
June 2014TTM
0
20
40
60
80
100
June 2011TTM
June 2014TTM
0
5
10
15
20
25
June 2011TTM
June 2014TTM
CAGR:
20%
CAGR:
17%
CAGR:
27%
CAGR:
25%

It is evolving into an enhanced marketplace
From To
Marketplace
Mostly electronics
Targeted shopping
Hobby sellers
Reactive customer support
eCommerce facilitator
Unmatched selection
Verticalized experiences
SMBs and Large Retail
Proactive customer management

We are maximizing
our user experience
through integrated
platform solutions
Marketplace eCommerce facilitator

Marketplace eCommerce facilitator
Mobile is an
increasingly
important source
of traffic,
registrations and
transactions
16%
of GMV
31%
of New
Registrations
Note: As of June 2014
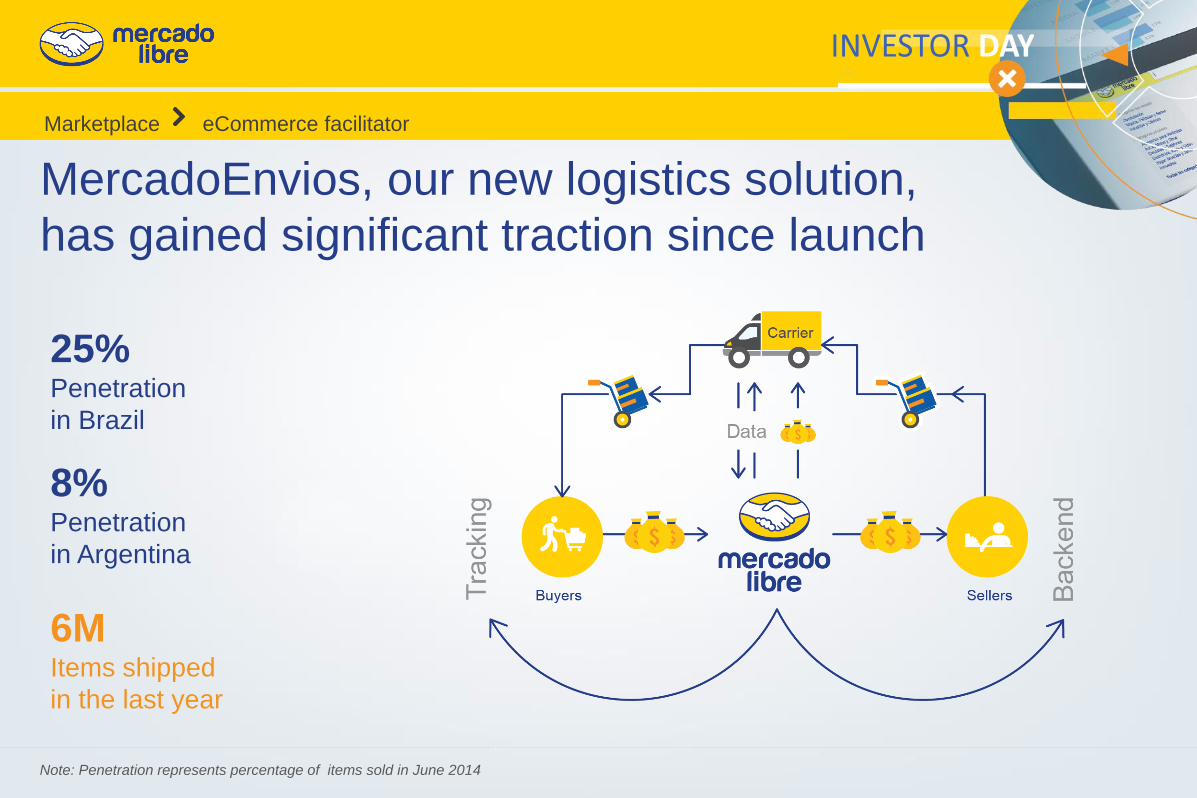
Marketplace eCommerce facilitator
MercadoEnvios, our new logistics solution,
has gained significant traction since launch
25% Penetration
in Brazil
8% Penetration
in Argentina
6M Items shipped
in the last year
Note: Penetration represents percentage of items sold in June 2014

Marketplace eCommerce facilitator
Brazil, our most advanced
market, shows how current
and future initiatives come
together 58% 33% 25% 11%
Investor Day 2011
% of GMV*
*as of June 2014

Mostly electronics Unmatched selection
Selection is expanding rapidly as more
categories develop
Successful Items Listings (M)
0%
20%
40%
60%
80%
100%
Q2 2011 Q2 20140
5
10
15
20
25
Q2 2011 Q2 2014
Consumer
Electronics
Fashion &
Body Care
Home & Outdoors
Entertainment
& Hobbies
Autoparts
Others
Entertainment
& Hobbies
Consumer
Electronics
Fashion &
Body Care
Autoparts
Home & Outdoors
Others
Consumer
Electronics
Fashion &
Body Care
Home & Outdoors
Entertainment
& Hobbies
Autoparts
Others
Entertainment
& Hobbies
Consumer Electronics
Fashion & Body Care
Autoparts Home & Outdoors
Others
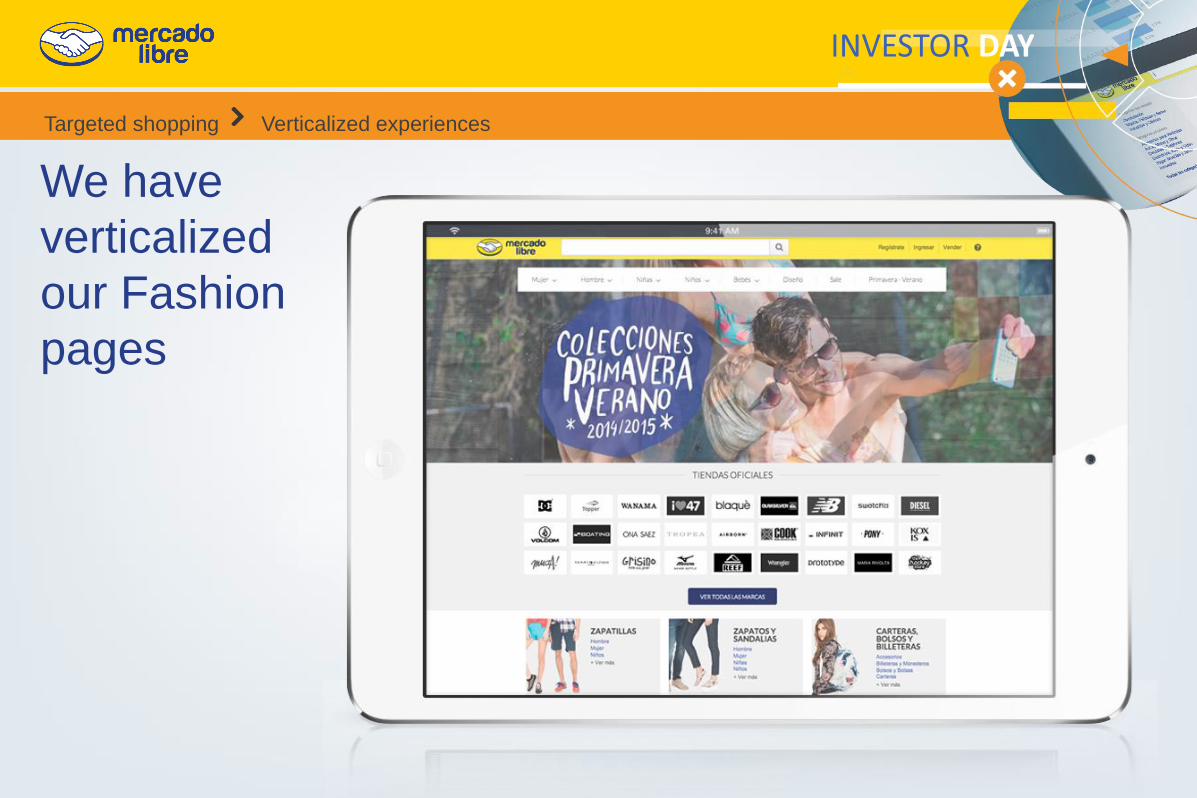
Targeted shopping Verticalized experiences
We have
verticalized
our Fashion
pages

Targeted shopping Verticalized experiences
Our Classifieds sites offer vertical experiences
for Motors, Real Estate, and Services
Motors Real Estate Services

Targeted shopping Verticalized experiences
We have acquired
leading vertical
properties in
the region

Hobby sellers SMBs and Large Retail
We are
building
a mall on
our platform

The meritocracy of our marketplace
drives B2C growth and quality product selection
Hobby sellers SMBs and Large Retail
Products sold on our platform are
98% Fixed Price
89% New
70% B2C
0%
20%
40%
60%
80%
100%
Sellers Listings SI GMV
B2C
B2C
B2C B2C
C2C C2C
C2C
C2C
Note: As of Q2 2014

Reactive customer support Proactive customer management
We are transforming
customer experience
into a competitive
advantage
Decreased contact rate
Increased number of channels
Increased NPS
100
105
110
115
120
125
130
135
NPS (Base 100) March 2012 – June 2014

Technology
Daniel Rabinovich (CTO)

Technology foundations
Quick look into some of the things we’ve been doing
Open Platform
Agenda

Split MELI into 100 interconnected “cells” Each cell operates as if it were a separated company

Dramatic Lift in the Pace of Execution Descentralized teams deploy into production at their own pace
1 5,000 Huge Deploy
a Week
Small Deploys
a Week
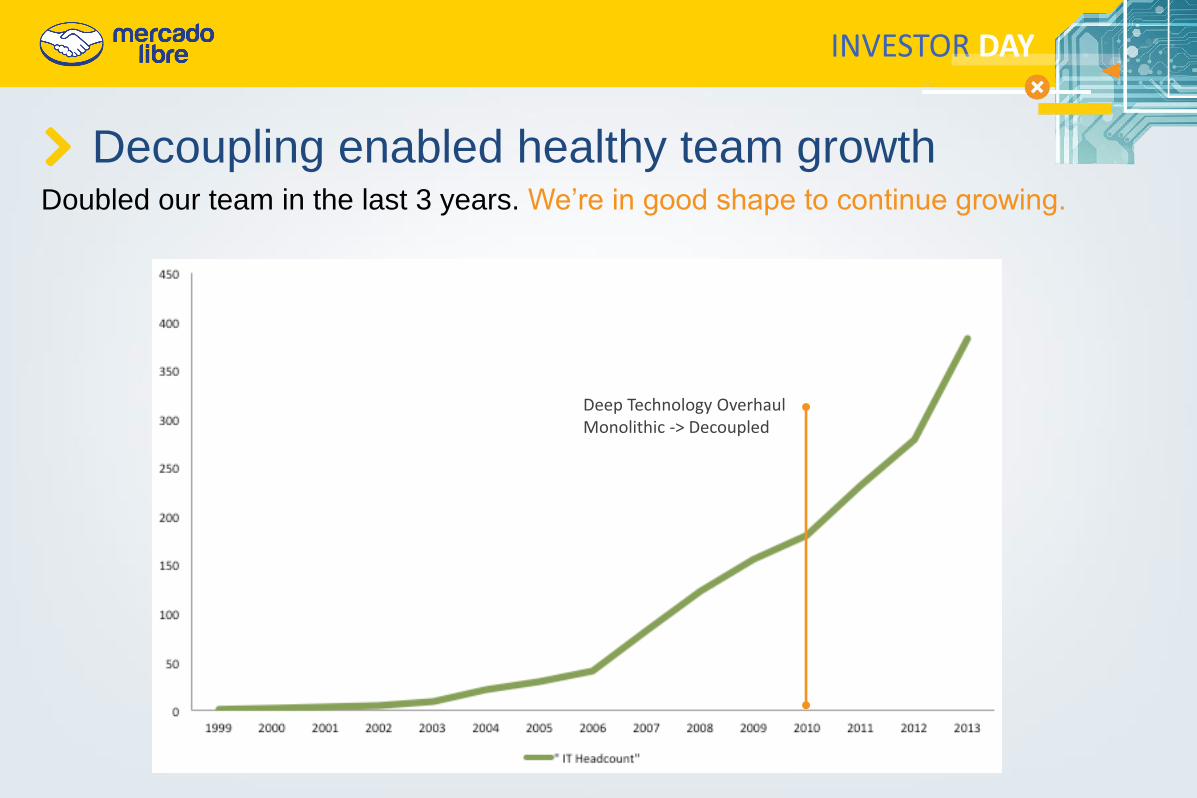
Decoupling enabled healthy team growth Doubled our team in the last 3 years. We’re in good shape to continue growing.
Deep Technology Overhaul Monolithic -> Decoupled

Technology Foundations
Quick look into some of the things we’ve been doing
Open Platform
Agenda

Design Overhaul – New Home Page example New Design Standards + Curated Content
Merchandising Push Notifications Curated content

Leveraged Data – An Example Search is constantly “learning” from our users, finding real time new trends
New iPhone 6
(Subexposed)
Old iPhone 5s
(Overexposed)
Click-through rate
Row in search results

Verticalized the Experience (Real Estate) Challenge was to seamlessly verticalize from the regular search box
Belgrano
“neighborhood”
Belgrano “street”
Ambiguities

Verticalized the Experience (Fashion)
Standardized thousands
of different retailers in
one consistent product
Studio Quality Pictures:
Enforced using machine learning
algorithms to detect good pictures
Multi-SKU (Size, Color)
Blends different standards in
one consistent scale

Official Stores: a Mall inside the Marketplace Gradually creating a premium, curated marketplace
Customized “Environment” Brand Logo Search in the Store

Shipping: a strong Drop-Ship implementation
Same Day / Next Day delivery
+
Free Shipping
Delivery to carrier branch
(lockers):
faster and inexpensive
Along with payments, Shipping closes the loop to a great shopping experience
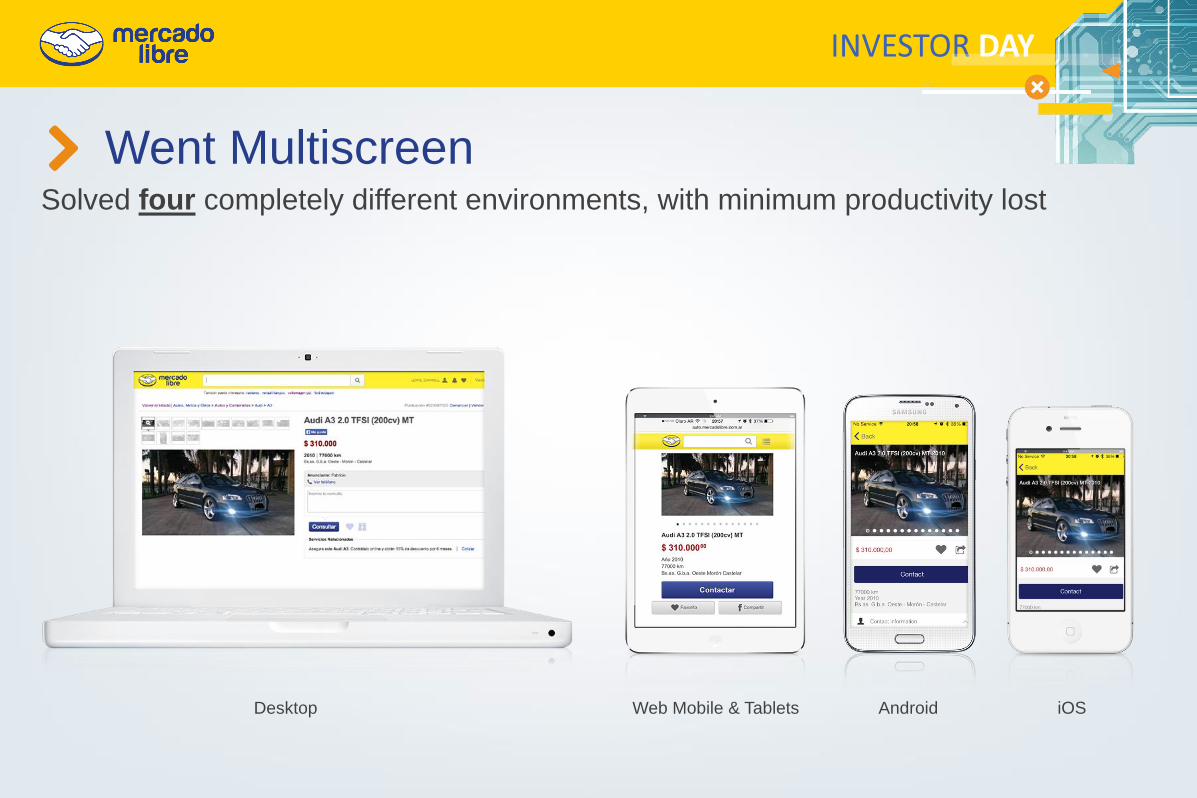
Went Multiscreen Solved four completely different environments, with minimum productivity lost
iOS Android Desktop Web Mobile & Tablets

Strong mobile penetration growth Mobile continues to gain share, as apps get better
16% mobile
GMV
2012 2013 2014

Mobile Off Platform: Payments Leveraged our infrastructure to launch a Wallet,
an in-app Payments SDK and a mPOS

Technology Foundations
Quick look into some of the things we’ve been doing
Open Platform
Agenda

From a Website to a Platform Built an API, rewrote our properties on top of it, and then opened to 3rd parties

External
innovation
unleashed An entire ecosystem
was created on top of
our Open Platform

A Strong impact on our ecosystam Power Sellers are using external tools to manage
sales (don’t use our platform directly)
25% Of new listings
are created through
our Open Platform

Technology Foundations
Quick look into some of the things we’ve been doing
Open Platform
Wrapping up…
Agenda

Wrapping Up...
Strong Technology Foundations
Performed a Design Overhaul
Big Data allows our product to “learn” from users
Verticalized the first Core Category (Fashion), more to come
Launched “Official Stores”, closer to a Mall experience
Strong progress in Shipping
Solid Progress on Mobile, 16% share and growing
Opened our Platform, 25% of New Listings from 3rd party apps

MercadoPago
Osvaldo Giménez (EVP MercadoPago)

MercadoPago facilitates online payments
Buyer’s CC
Buyer’s Bank
Account
Buyer’s Cash
Payment
Money in Money Through Money Out
Buyer’s
MP Account
Seller’s
MP Account
Fraud Prevention
Buyer Protection Program
Seller Protection Program
Seller’s Bank
Account
Revenue sources Countries Value Proposition
· Financing Revenues (On
and Off MercadoLibre)
· Processing Fee (Off
MercadoLibre)
· Bundled with FVFs on
MercadoLibre
· Brazil
· Argentina
· Mexico
· Colombia
· Venezuela
· Chile
· For buyers:
· Secure
· Convenient
· Offers installments
· For sellers:
· Easy & flexible to set up
· High conversion rate
· Large user base & stored cc’s

MercadoPago has experienced strong growth
Note: TTM = Trailing twelve months
Total
Payment Volume ($B)
Total
Transactions (M)
0
10
20
30
40
June 2011 TTM June 2014 TTM
0
1
2
3
June 2011 TTM June 2014 TTM
CAGR
54%
CAGR
43%
37M $2.8B

Five avenues for growth
Growth opportunities
Share of GMV Verticals
Countries
Cross Border
Open Platform
Revenues
Interest-free Financing
Cash Flow Positive
In App Payments
Mobile App
Mobile POS
Cobranded Credit Cards
Prepaid Cards
Seller Credits
Mercado
Libre
Merchant
Services Financing
Mobile
Payments
Buyer and
Seller Credit

MercadoLibre
Replicating the Strategy across MercadoLibre Free for buyers & bundled for sellers
Optimized fraud prevention for higher approval rates
Synergistic with Shipping
Integrated Payments for high ticket items
Chile Venezuela
Colombia Mexico Argentina Brazil
100% (of GMV)
Note: Figure not drawn to scale

Merchant Services
Retail
Coupons
Travel
Merchant services growing strongly
in top markets
Merchant Services
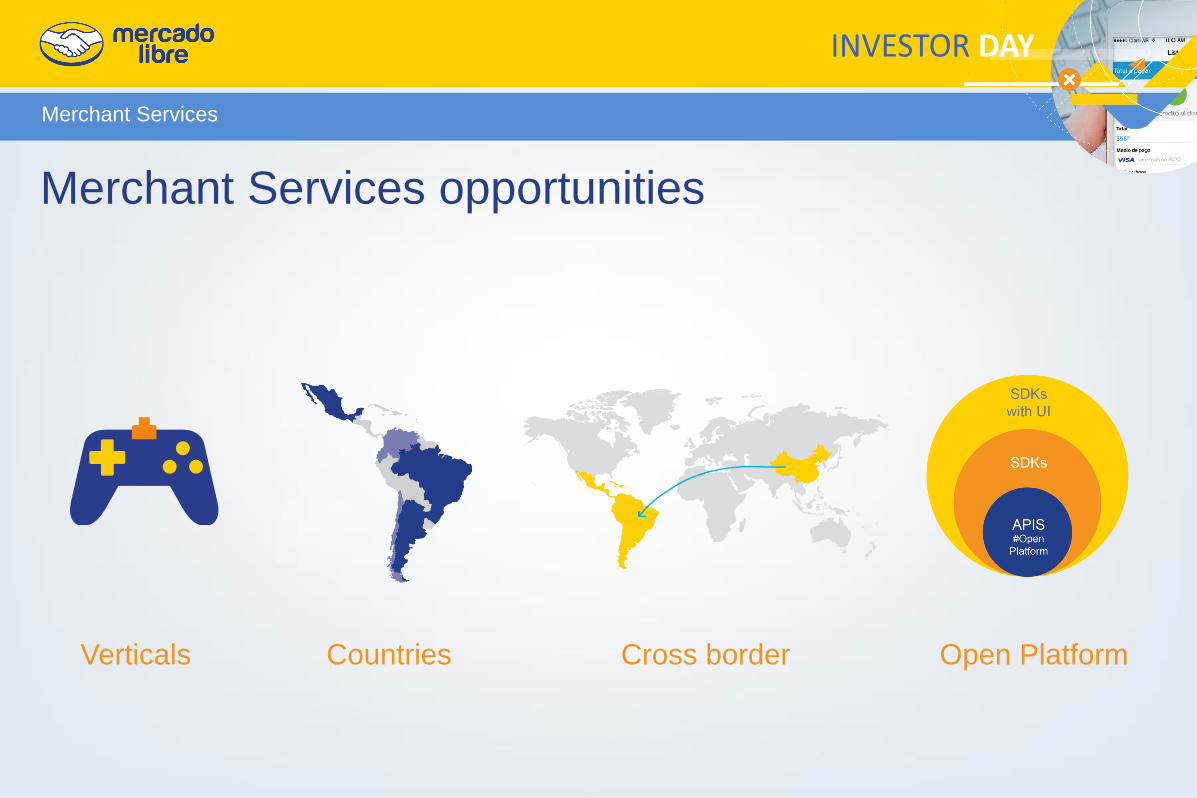
Verticals Countries Cross border Open Platform
Merchant Services opportunities

No credit risk Positive cash flow by selling receivables
Half of our TPV is paid in installments
0%
20%
40%
60%
80%
100%
TPV Credit Card TPV Financed TPV by Installments
2014 H1
Bank Transfer & Alternative
Payments
Credit Cards
Non-financed
Financed
12
+12
10
9
6
5
4
3
2
Financing

Financing
Sem Juros: Interest-free financing

Mobile
Mobile Payments
Mobile
POS
SDKs for In
App Payments
MercadoPago
Mobile App

Software Development Kits (SDKs)
for In App Payments
Mobile

MercadoPago Mobile App
P2P Payments
Pay for items already boutght on MercadoLibre
Mobile web MercadoPago checkouts
QR Codes
Mobile

Mobile POS Solution
Features
Interaction with seller stocks,
catalogues and billing systems
Store analytics
Client management tools
Ecosystem Synergies
Payments with MercadoPago balance
Withdrawals to MercadoPago’s
prepaid cards
Interaction with MercadoShops App
Mobile

Cobranded Credit Cards Prepaid Card in Mexico Seller Credit
Buyer and Seller Credit
We are expanding our services with cards and
credit
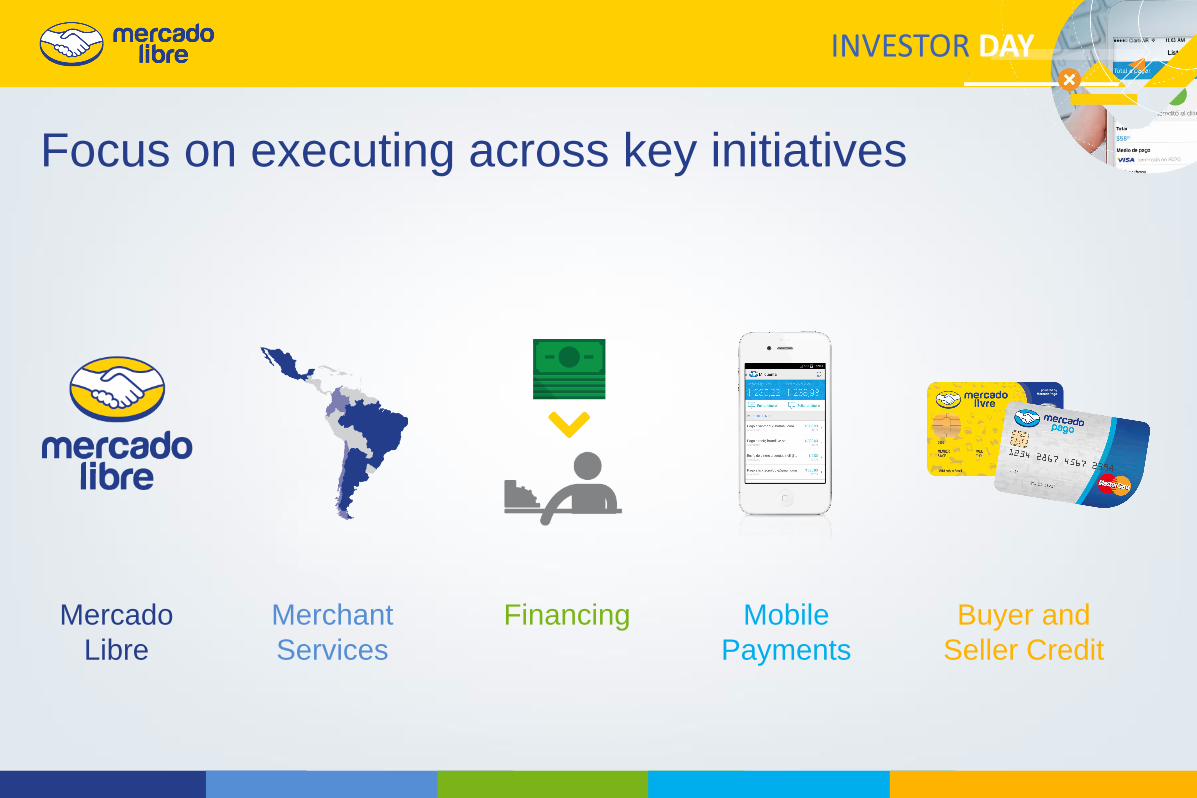
Focus on executing across key initiatives
Mercado
Libre
Merchant
Services
Financing Mobile
Payments
Buyer and
Seller Credit

Financial Overview
Pedro Arnt (CFO)

What we said…How we are doing
How we think about our financial model
Wrapping Up
Agenda

Strong & Diversified Top Line Growth
What we said in October 2011… Relevant aspects of our financial model
Healthy Gross Margin Profile Impacted by Mix Shift
Scale In Operating Expenses
Growth In Earnings
Cash Flow Generation
Robust Balance Sheet & Efficient Capital Structure

Sustained StrongTop Line Growth How we are doing …
Source: Company Data
216.7
298.9
373.6
472.6
247.2
6.4%
6.9%
0.0%
1.0%
2.0%
3.0%
4.0%
5.0%
6.0%
7.0%
8.0%
0
50
100
150
200
250
300
350
400
450
500
2010 2011 2012 2013 H1'2014
Millio
ns
Renevue
Take Rate
CAGR
30%
LC CAGR
39%
YoY Growth 15%
YoY Growth LC 58%

Source: Company Data - Revenue by Country: Data forJune 2014
Revenue
by Country Other Countries
Revenue
by Source
Brazil
Argentina
Mexico
Venezuela
Other Countries
Costa Rica Peru
Ecuador
Uruguay
Colombia
Chile
Marketplace
Payments
Classifieds
Advertising
Shipping Others
Marketplace (Brazil)
Further Diversifying by Country & Source How we are doing …
No added
services
Payment
Only
Financing
Shipping
Multiple

170
227
276
343
179
79% 76%
74% 72%
73%
20%
27%
31% 34%
0%
10%
20%
30%
40%
50%
60%
70%
80%
90%
0
50
100
150
200
250
300
350
400
2010 2011 2012 2013 H1'2014
Millio
ns
Gross Profit
Gross Margin
TPV/GMV
Healthy Gross Margin Impacted by Mix How we are doing …
44% (1)
(1) Company Data – TPV/GMVE Q2 2014
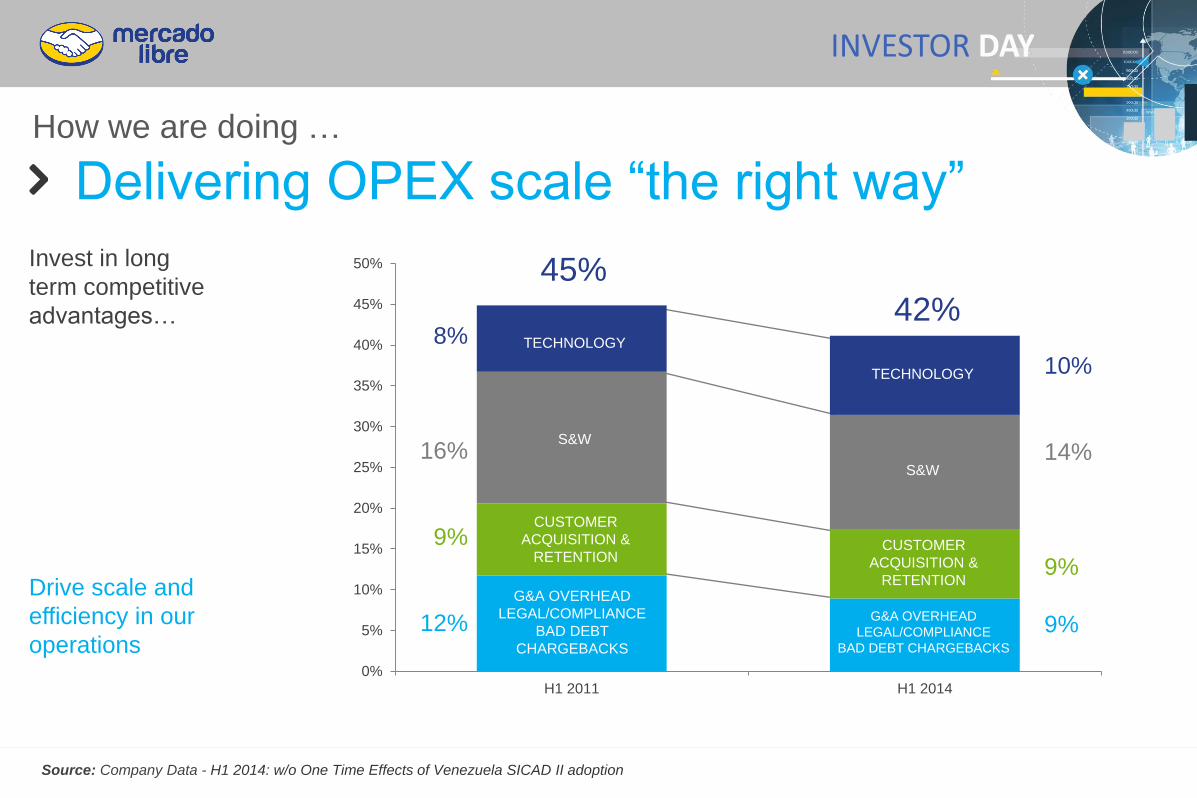
Source: Company Data - H1 2014: w/o One Time Effects of Venezuela SICAD II adoption
Invest in long
term competitive
advantages…
0%
5%
10%
15%
20%
25%
30%
35%
40%
45%
50%
H1 2011 H1 2014
CUSTOMER
ACQUISITION &
RETENTION
S&W
TECHNOLOGY
G&A OVERHEAD
LEGAL/COMPLIANCE
BAD DEBT
CHARGEBACKS
CUSTOMER
ACQUISITION &
RETENTION
S&W
TECHNOLOGY
G&A OVERHEAD
LEGAL/COMPLIANCE
BAD DEBT CHARGEBACKS
Drive scale and
efficiency in our
operations
8%
16%
9%
12%
10%
14%
9%
9%
45%
42%
Delivering OPEX scale “the right way” How we are doing …

Source: Company Data - Net Income Margin H1 2014: w/o One Time Effects of Venezuela SICAD II adoption
54.8
59.6
0%
5%
10%
15%
20%
25%
30%
0
20
40
60
80
100
120
2010 2011 2012 2013 H1'2014
Millio
ns Net Income
Net Income Margin
CAGR
28%
Ven
ezue
la o
ne
- o
ff
56.0 76.8 101.3 117.5
26% 24%
Continue to Grow Earnings How we are doing …

Source: Company Data – Adjusted: Free Cash Flow excluding M&A & purchases of buildings, Net Income Adjusted: H1 2014: without One Time Effects of Venezuela
SICAD II adoption
Adjusted Free Cash Flow
* Adjusted FCF
Adjusted Net Income
Converting NI to FCF* How we are doing …
76.8
101.3 117.5
59.6
54.7
70.5
129.8
119.6
73.3
-
20.0
40.0
60.0
80.0
100.0
120.0
140.0
2010 2011 2012 2013 H1'2014
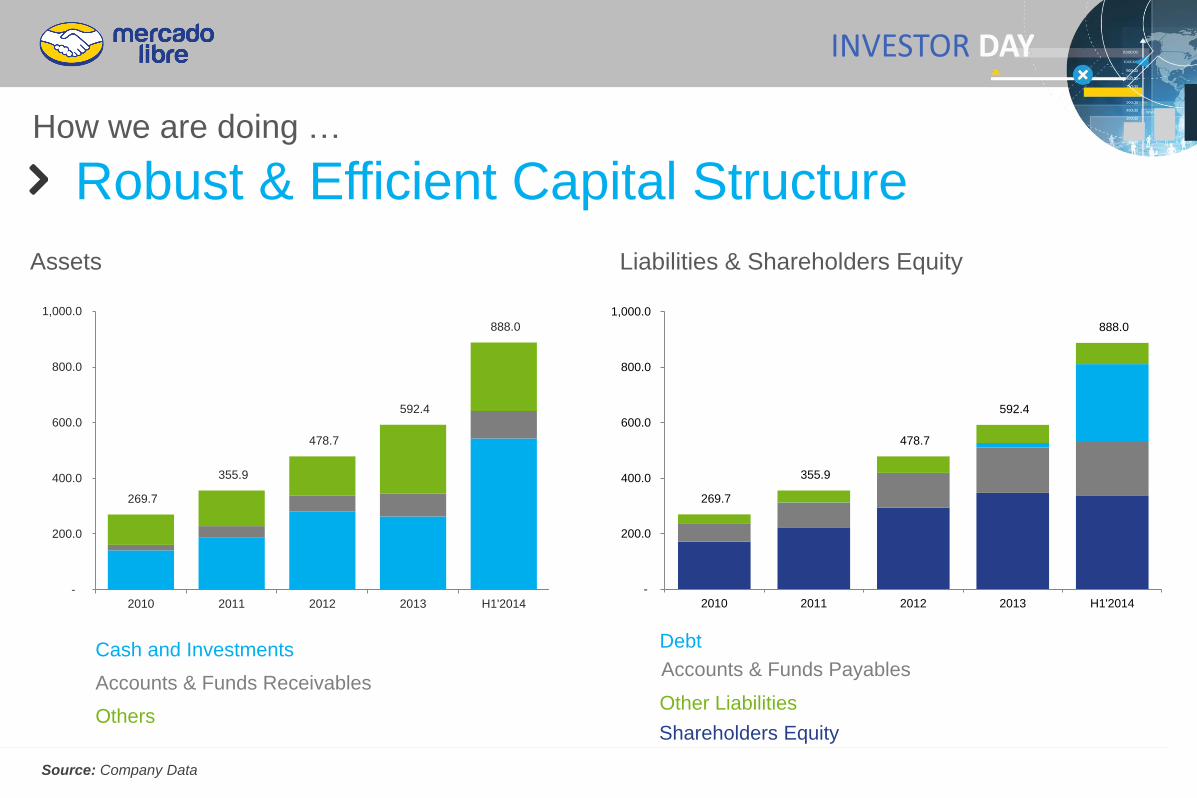
Source: Company Data
Assets Liabilities & Shareholders Equity
269.7
355.9
478.7
592.4
888.0
-
200.0
400.0
600.0
800.0
1,000.0
2010 2011 2012 2013 H1'2014
Cash and Investments
Accounts & Funds Receivables
Others
Accounts & Funds Payables
Debt
Other Liabilities
Robust & Efficient Capital Structure How we are doing …
Shareholders Equity
269.7
355.9
478.7
592.4
888.0
-
200.0
400.0
600.0
800.0
1,000.0
2010 2011 2012 2013 H1'2014
Agenda
What we said…How we are doing
How we think about our financial model
Wrapping Up

We re committed to
investing efficiently
to generate growth
and capture the
opportunity we are
presented with... Context
Capture
Growing
User
Base
Transition to
Enhanced
Marketplace
Model
Increase
User
Engagement
Scale Generates
Profit and Capital
for Growth
Continuous
Investment In
Innovation

…Efficiency requires
balancing investment
in growth with solid
financial results
Invest for Growth Solid Financials

We operate in a very dynamic context…
Transition to Enhanced Marketplace Model
Capture
Growing
User Base
Increase User Engagement
Scale Drives Profitable-Cash Generating Financial Model
Continuous Investment In Innovation / Iteration
Co
nte
xt
Source: Top 10 retail: Comscore, Latinfocus, World Celular Forecast 14-19,
EuroMonitor
Secular trends and consolidation in e-commerce further benefit MELI
Number of Users % Retail online Top 10 retail sites traffic (PV 000)
Mobile = sustained user growth Enabling e-commerce adoption With consolidation in sector
Optimistic mid term macro and currency outlook for Latin America
USD/LC evolution GDP Growth OPEX margin gains due to AR$ devaluation
Accelerating GDP forecast… …leading to currency stability Hedged by costs in local $
H2'14 H1'15 H2'15 H1'16 H2'16
ARS BRL MEX COL CHI USD
-4%
-2%
0%
2%
4%
6%
2014 2015 2016 2017 2018
Arg Bra Mex Ven Col Chi
155
207
H2'13 H1'14*
Capture Growing User Base
Transition to Enhanced Marketplace Model
Increase User Engagement
Scale Drives Profitable-Cash Generating Financial Model
Continuous Investment In Innovation / Iteration
Co
nte
xt
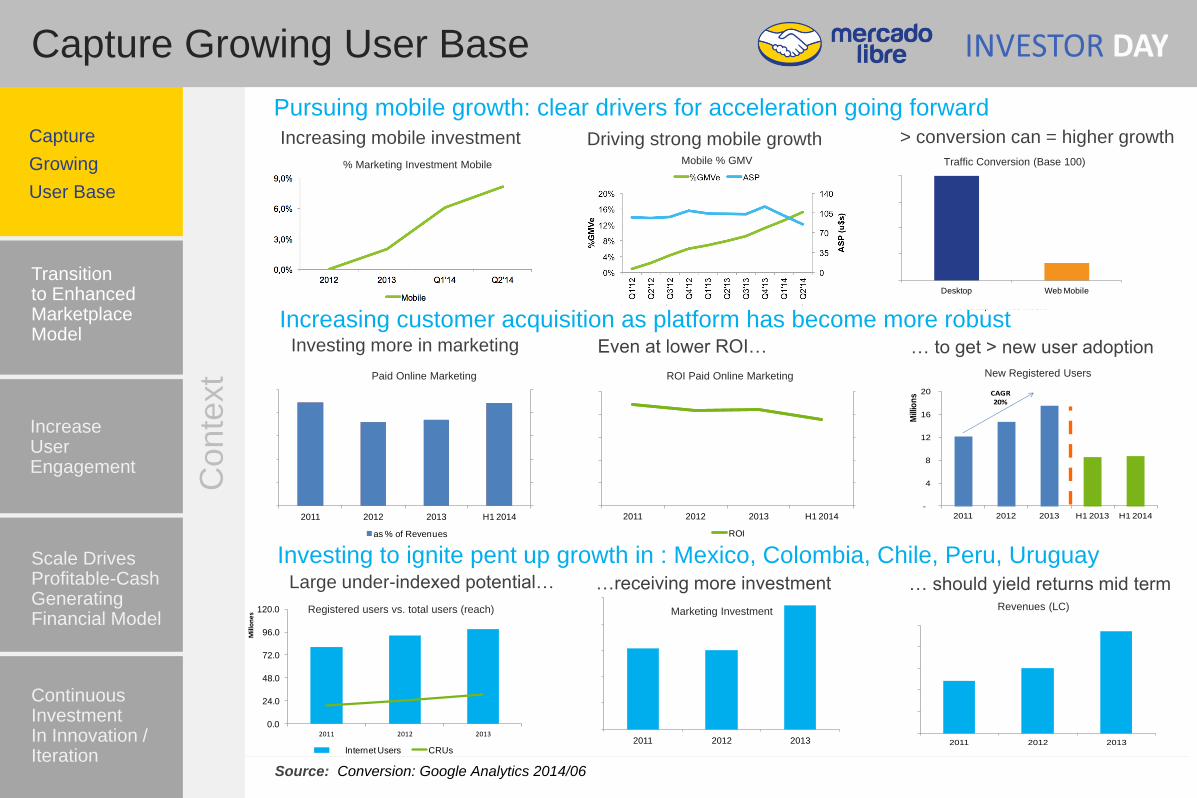
Source: Conversion: Google Analytics 2014/06
Capture
Growing
User Base
Pursuing mobile growth: clear drivers for acceleration going forward
Driving strong mobile growth Increasing mobile investment > conversion can = higher growth Mobile % GMV % Marketing Investment Mobile Traffic Conversion (Base 100)
0%
25%
50%
75%
100%
Desktop Web Mobile
Desktop Web Mobile
Paid Online Marketing
Increasing customer acquisition as platform has become more robust
ROI Paid Online Marketing New Registered Users
Even at lower ROI… Investing more in marketing … to get > new user adoption
2011 2012 2013 H1 2014
as % of Revenues
2011 2012 2013 H1 2014
ROI
-
4
8
12
16
20
2011 2012 2013 H1 2013 H1 2014
Mill
ion
s CAGR 20%
0.0
24.0
48.0
72.0
96.0
120.0
2011 2012 2013
Mill
on
es
Internet Users CRUs
Investing to ignite pent up growth in : Mexico, Colombia, Chile, Peru, Uruguay …receiving more investment Large under-indexed potential… … should yield returns mid term
Registered users vs. total users (reach) Marketing Investment Revenues (LC)
0.0
1.6
3.2
4.8
6.4
8.0
2011 2012 20130.0
1.6
3.2
4.8
6.4
8.0
2011 2012 2013

Transition to enhanced marketplace
Capture
Growing
User Base
Transition to Enhanced Marketplace Model
Increase User Engagement
Scale Drives Profitable-Cash Generating Financial Model
Continuous Investment In Innovation / Iteration
Co
nte
xt
Entering into Shipping and Fulfillment in financially efficient manner
% SI donde throuh MercadoEnvios Shipping Revenues and Costs Consolidated Take Rate
Currently w/ limited margin impact Continued rapid shipping growth …also permits higher take rate
0.0%
1.6%
3.2%
4.8%
6.4%
8.0%
Q3'13 Q4'13 Q1'14 Q2'14
Others Verticals Consumer Electronics Official Stores
Category Expansion and Stores strengthens financial model
Category % GMV # Users Take Rate
Gain share in large merchants Gain share in non CE categories … w/ positive financial impact
Growth in payments has financial benefits to partially off-set margin impact
MP % GMV Gross Margin and OPEX as % Revenue Consolidated Take Rate
More COGS, less OPEX… Continued rapid payments growth …and drives higher take rate
6.2%6.5% 6.5%
6.9%
0.0%
1.5%
3.0%
4.5%
6.0%
7.5%
2011 2012 2013 H1 2014
Consolidated Take Rate

Increase User Engagement…
Capture
Growing
User Base
Increase User Engagement
Scale Drives Profitable-Cash Generating Financial Model
Continuous Investment In Innovation / Iteration
Co
nte
xt
Transition to Enhanced Marketplace Model
SI/User TPN/ Receiver SI/% Financed GMVe
Platform improvements paying off: better engagement metrics…
More purchases per user …as well as payments …and credit transactions
2.5 2.9
Revenue/User Revenue per Listing
$ 50
$ 38 $ 18
$ 14
…driving improved monetization ratios
Improved revenues per listing… …and per receiver Leading to ARPU growth
Revenue per Receiver

Scale Drives Profitable Financial Model…
Capture
Growing
User Base
Increase User Engagement
Scale Drives Profitable-Cash Generating Financial Model
Continuous Investment In Innovation / Iteration
Co
nte
xt
Transition to Enhanced Marketplace Model
Headcount (largest OPEX) efficiency while investing in talent for long term
Headcount Ratios S&W as % of Rev and Opex Headcount vs Revenues
= improving HC ratios Tight headcount control Well managed S&W expenses
16% 14%
36% 34%
0%
10%
20%
30%
40%
0%
15%
30%
45%
60%
H1 2011 H1 2012 H1 2013 H1 2014
As
% o
f O
pe
x
AS
% o
f R
ev
en
ue
s
S&W/ Revs S&W/ Opex
G&A scale generates margin to re-invest in PD and user acquistion
G&A Non S&W / Revenues Ratio G&A to PD & SM
Beyond S&W management Strong G&A scale Permits focus in other areas
166%
120%
166%
156%
0%
50%
100%
150%
200%
250%
2011 2011 2013 2014
G&A / PD G&A / MKT
G&A / Revenues
Efficient Capital Expenditure with asset light low CAPEX financial model
CAPEX / Revenues Operational CAPEX / Revenues M&A + RE CAPEX / Revenues
Frees up $ for strategic investments Low recurring CAPEX … in investment cycle years
0.0%
5.0%
10.0%
15.0%
20.0%
25.0%
2011 2011 2013 2014 0.0%
5.0%
10.0%
15.0%
20.0%
25.0%
2011 2011 2013 2014
0.0%
1.0%
2.0%
3.0%
4.0%
5.0%
2011 2011 2013 2014

Continuous Investment in Innovation and growth…
Capture
Growing
User Base
Increase User Engagement
Scale Drives Profitable-Cash Generating Financial Model
Continuous Investment In Innovation
Co
nte
xt
Transition to Enhanced Marketplace Model
PD / Revenues PD Headcount PD Projects Capitalized
Committed to investing in PD as competitive edge…
Ramping up PD investment Mainly in engineering talent … allows increased PD output
…across the range of PD investment opportunities
Site Operation / Revenues PD CAPEX / Revenues M&A / Engineers
Also investing in IT operations Through operational CAPEX And strategic CAPEX
0,7%
1,6%
0,0%
0,5%
0,9%
1,4%
1,8%
2011 2012 2013
-
10
20
30
40
50
60
2011 2012 2013 2014

Principles for managing our financial model
Prioritize top line growth
Invest behind what is strategic to our business
Drive scale in less strategic expenditures
Deploy capital more aggressively in certain areas
Focus on capturing the opportunities in Latin American e-commerce
Product development and technology
User acquisition and retention
General and Administrative expenses
Control headcount increases leading to managed compensation growth
Corporate overhead
Under indexed regions, new business opportunities, M&A targets

What we said…. How we are doing!
How we think about our financial model
Wrapping Up
Agenda

We are in an even better position to continue
capturing the opportunity
In the past 15 years we:
Now with e-commerce growth still presenting a huge opportunity…
Built the pre-eminent e-commerce platform in Latin America, and
Created a strong brand that is synonymous with e-commerce
Successfully began the transition to an enhanced marketplace model
We have a much better financial position, access to credit and capitalization
A cutting edge open technology platform, and
An ecosystem of business units that are more diversified and have stronger
network effects than ever before
…this makes us feel optimistic about the long term prospects for the company

Thanks for coming!


