
FOR RELEASE April 8, 2014
FOR FURTHER INFORMATION
ON THIS REPORT:
D’Vera Cohn, Senior Writer
Kim Parker, Director of Social Trends Research
Gretchen Livingston, Senior Researcher
Molly Rohal, Communications Associate
202.419.4372
www.pewresearch.org
RECOMMENDED CITATION: D’Vera Cohn, Gretchen Livingston and Wendy Wang, 2014, “After Decades of Decline, A Rise in Stay-at-
Home Mothers.” Washington, D.C.: Pew Research Center’s Social & Demographic Trends project, April.
NUMBERS, FACTS AND TRENDS SHAPING THE WORLD

1
PEW RESEARCH CENTER
www.pewresearch.org
About This Report
This report examines the demographic characteristics of U.S. mothers who lived with their
children younger than 18 in 2012 and did not work outside the home. It compares them with their
counterparts in earlier years and reports on trends for this population since 1970, based on U.S.
Census Bureau data. In addition, it compares the characteristics of stay-at-home mothers with
those of mothers who work for pay outside the home. The report also compares the time use of
stay-at-home and working mothers, using data from the American Time Use Survey, and reports
on trends in public opinion about working and stay-at-home mothers.
This report is a collaborative effort based on the input and analysis of the following individuals.
Paul Taylor, executive vice president of the Pew Research Center, provided editorial guidance, as
did Claudia Deane, the center’s director of research practices. Kim Parker, director of social trends
research, provided additional guidance and wrote the chapter on public attitudes toward working
and stay-at-home mothers. D’Vera Cohn, senior writer, wrote the overview and chapters 1-3, based
on data analysis by Gretchen Livingston, senior researcher. Wendy Wang, research associate,
wrote the chapter on time use. Charts were prepared by Eileen Patten, research analyst. Number-
checking was done by Anna Brown, research assistant. The report was copy-edited by Marcia
Kramer. Find related reports online at pewresearch.org/socialtrends.
Paul Taylor, Executive Vice President
Kim Parker, Director of Social Trends Research
D’Vera Cohn, Senior Writer
Gretchen Livingston, Senior Researcher
Wendy Wang, Research Associate
Eileen Patten, Research Analyst
Anna Brown, Research Assistant

2
PEW RESEARCH CENTER
www.pewresearch.org
A Note on Terminology
“Mothers,” in this report, refers to women ages 18-69 living with their own children (biological,
step or adopted) younger than 18.
“Working mothers” refers to those who worked outside of the home for pay in the prior year.
“Stay-at-home mothers” refers to those not employed for pay outside the home at all in the
calendar year.
“Married mothers with non-working husbands” includes those mothers whose spouses were not
working at all in the calendar year, as well as some mothers who report that they are married but
whose spouse is absent from the household.
“Single mothers” refers to mothers who have never been married, are divorced, separated, or
widowed, and who are not cohabiting. Before 2006, this category includes cohabiting mothers.
“Cohabiting mothers” refers to mothers who are living with a non-marital partner. This also
includes a small number of mothers in same-sex couples, regardless of whether those couples are
married or cohabiting.
All references to whites, blacks and Asians are to the non-Hispanic components of those
populations. Asians also include Pacific Islanders.
“Foreign born” refers to persons born outside of the United States, including those born in Puerto
Rico or other U.S. territories. “Native born” refers to persons born in the United States.
References to respondents who are “high school graduates” or who have a “high school diploma”
also include those who have earned an equivalent degree, such as a GED (General Educational
Development) certificate.
Poverty is based on the U.S. Census Bureau measure. This measure is defined by an income
threshold that is dependent on family composition and income, adjusted for inflation. In 2012, the
official poverty threshold for a family of four was $23,283.

3
PEW RESEARCH CENTER
www.pewresearch.org
About Pew Research Center
Pew Research Center is a nonpartisan fact tank that informs the public about the issues, attitudes
and trends shaping America and the world. It does not take policy positions. It conducts public
opinion polling, demographic research, media content analysis and other empirical social science
research. The center studies U.S. politics and policy views; media and journalism; internet and
technology; religion and public life; Hispanic trends; global attitudes; and U.S. social and demo-
graphic trends. All of the center’s reports are available at www.pewresearch.org. Pew Research
Center is a subsidiary of The Pew Charitable Trusts.
Alan Murray, President
Michael Dimock, Vice President, Research
Elizabeth Mueller Gross, Vice President
Paul Taylor, Executive Vice President, Special Projects
Andrew Kohut, Founding Director
Managing Directors
Jim Bell, Director of International Survey Research
Alan Cooperman, Director, Pew Research Center’s Religion & Public Life Project
Claudia Deane, Director, Research Practices
Carroll Doherty, Director, Pew Research Center for the People & the Press
Scott Keeter, Director of Survey Research
Vidya Krishnamurthy, Communications Director
Mark Hugo Lopez, Director of Hispanic Research
Amy Mitchell, Director of Journalism Research
Kim Parker, Director of Social Trends Research
Lee Rainie, Director, Pew Research Center’s Internet & American Life Project
Richard Wike, Director of Global Attitudes
© Pew Research Center 2014

4
PEW RESEARCH CENTER
www.pewresearch.org
Table of Contents
About This Report 1
A Note on Terminology 2
About Pew Research Center 3
Overview 5
Demographic Characteristics 7
Time Use of Mothers 10
Public Opinion 10
Chapter 1: Comparing Stay-at-Home and Working Mothers 11
Married Mothers with Working Husbands 12
Single Mothers 13
Cohabiting Mothers 14
Married Mothers with Non-Working Husbands 15
Chapter 2: Stay-at-Home Mothers by Demographic Group 17
Racial and Ethnic Groups 17
Trends by Nativity 18
Educational Attainment 19
Chapter 3: How Do Mothers Spend Their Time at Home? 20
Children’s Characteristics 21
Mothers’ Characteristics 23
Chapter 4: Public Views on Staying at Home vs. Working 26
Appendix A: Additional Tables 30
Appendix B: Time-Use Activity Classifications 36

5
PEW RESEARCH CENTER
www.pewresearch.org
Overview
BY D’Vera Cohn, Gretchen Livingston AND Wendy Wang
The share of mothers who do not work outside the home rose to 29% in 2012, up from a modern-
era low of 23% in 1999, according to a new Pew Research Center analysis of government data.1
This rise over the past dozen years represents the reversal of a long-term decline in “stay-at-home”
mothers that had persisted for
the last three decades of the
20th century.2 The recent
turnaround appears to be
driven by a mix of
demographic, economic and
societal factors, including
rising immigration as well as a
downturn in women’s labor
force participation, and is set
against a backdrop of
continued public ambivalence
about the impact of working
mothers on young children.
The broad category of “stay-
at-home” mothers includes
not only mothers who say they
are at home in order to care
for their families, but also
those who are at home
because they are unable to
find work, are disabled or are
enrolled in school.
The largest share consists of
“traditional” married stay-at-
home mothers with working
1 The share of mothers who did not work outside the home was 24% in 1997, 1998 and 2001. These are not statistically different from the
23% recorded in 1999 and 2000. The difference between 23% and 29% (the 2012 share) is statistically significant. 2 Analysis limited to mothers who are ages 18-69 with their own children (biological, adopted, step) in the household. “Working mothers”
refers to those who worked outside the home for pay in the prior year.
After Decades of Decline, a Rising Share of
Stay-at-Home Mothers
% of mothers with child(ren) younger than 18 who do not work outside the
home
Note: Based on mothers ages 18-69 with own child(ren) younger than 18 in the household.
Mothers are categorized based on employment status in the year prior to the survey.
“Other” stay-at-home mothers are those who are married with a non-working or absent
husband.
Source: Pew Research Center analysis of March Current Population Surveys Integrated
Public Use Microdata Series (IPUMS-CPS), 1968-2013
PEW RESEARCH CENTER
0
55
1967 1972 1977 1982 1987 1992 1997 2002 2007 2012
20
43
49
Married with working husband
Single/Cohabiting/Other
9
6
%
In 2012, 29% of
all mothers were
stay-at-home
In 1999, 23% of
all mothers were
stay-at-home

6
PEW RESEARCH CENTER
www.pewresearch.org
husbands. They made up roughly two-thirds of
the nation’s 10.4 million stay-at-home mothers
in 2012. In addition to this group, some stay-
at-home mothers are single, cohabiting or
married with a husband who does not work.
The economic ups and downs of the past
decade likely influenced mothers’ decisions on
whether to stay home or go to work. The share
of mothers staying home with their children
rose from 2000 to 2004, but the rise stopped
in 2005, amid economic uncertainty that
foreshadowed the official start of the Great
Recession in 2007. The increase in both
number and share eventually resumed: From
2010 to 2012, the share of stay-at-home
mothers (29%) was three percentage points
higher than in 2008 (26%), at the height of the
recession.
A growing share of stay-at-home mothers (6%
in 2012, compared with 1% in 2000) say they
are home with their children because they
cannot find a job. With incomes stagnant in
recent years for all but the college-educated,
less educated workers in particular may weigh
the cost of child care against wages and decide
it makes more economic sense to stay home.3
Married stay-at-home mothers are more likely
than single or cohabiting stay-at-home mothers to say they are not employed because they are
caring for their families (85% said this in 2012). By comparison, only 41% of single stay-at-home
mothers and 64% of cohabiting mothers give family care as their primary reason for being home,
according to census data. They are more likely than married stay-at-home mothers to say they are
ill or disabled, unable to find a job, or enrolled in school.
3 See Sharon R. Cohany and Emy Sok, “Trends in Labor Force Participation of Married Mothers of Infants.” Monthly Labor Review. February
2007.
Affluent Married Stay-at-Home Mothers
Although they are often in the media spotlight,
relatively few married stay-at-home mothers (with
working husbands) would qualify as highly
educated and affluent. This group is sometimes
called “opt-out mothers,” although some
researchers say they may have been pushed out
of the workforce due to work-family conflicts.
In 2012, nearly 370,000 U.S. married stay-at-
home mothers (with working husbands) had at
least a master’s degree and family income
exceeding $75,000. This group accounted for 5%
of married stay-at-home mothers with working
husbands.
These affluent stay-at-home mothers, who have a
median family income of nearly $132,000, are
somewhat older than married stay-at-home
mothers with working husbands overall,
according to 2011-2012 data. Half are ages 35-
44, while just 19% are younger than 35. As is
true of all married stay-at-home mothers, about
half of this elite group (53%) has at least one
child age 5 or younger at home.
These women stand out from other married stay-
at-home mothers in that they are
disproportionately white or Asian. About seven-in-
ten (69%) are white, and fully 19% are Asian.
Only 7% are Hispanic, and 3% are black.

7
PEW RESEARCH CENTER
www.pewresearch.org
The recent rise in stay-at-home motherhood is the flip side of a
dip in female labor force participation after decades of growth.4
The causes are debated, but survey data do not indicate the dip
will become a plunge, as most mothers say they would like to
work, part time or full time.
(Stay-at-home fathers, while not the focus of this report,
represent a small but growing share5 of all stay-at-home
parents.6)
The share of stay-at-home mothers has risen since 2000
among married mothers with working husbands and single
mothers. Whether married, single or cohabiting, each group of
stay-at-home mothers has a demographic profile distinctly
different from that of their working counterparts—and also
different from each other’s. No matter what their marital
status, mothers at home are younger and less educated than
their working counterparts. Among all stay-at-home mothers
in 2012, about four-in-ten (42%) were younger than 35. This
compares with roughly a third (35%) of working mothers. Half
(51%) of stay-at-home mothers care for at least one child age 5
or younger, compared with 41% of working mothers.
Fully 49% have a high school diploma or less, compared with
30% of working mothers. In addition, stay-at-home mothers
are less likely than working mothers to be white (51% are
white, compared with 60% of working mothers) and more
likely to be immigrants (33% vs. 20%). The overall rise in the
share of U.S. mothers who are foreign born, and rapid growth
of the nation’s Asian and Latino populations, may account for
4 See Julie L. Hotchkiss, “Changes in Behavioral and Characteristic Determination of Female Labor Force Participation, 1975-2005,”
Economic Review-Federal Reserve Bank of Atlanta, second quarter 2006, and Mark Mather, “Closing the Male-Female Labor Force Gap,”
Population Reference Bureau, March 2007. 5 See Karen Z. Kramer, Erin L. Kelly and Jan B. McCulloch, “Stay-at-Home Fathers: Definition and Characteristics Based on 34 Year of CPS
Data,” Journal of Family Issues, September 12, 2013. 6 A previous Pew Research Center analysis found that 6% of fathers who are married or living with a partner do not work outside the home.
Stay-at-Home and
Working Mothers Who …
% of mothers with child(ren)
younger than 18
Note: Based on mothers ages 18-69 with
own child(ren) younger than 18 in the
household. Mothers are categorized based
on employment status in 2012.
Source: Pew Research Center analysis of
March Current Population Survey Integrated
Public Use Microdata Series (IPUMS-CPS),
2013
PEW RESEARCH CENTER
49
40
... are non-white (including Hispanics)
Stay-at-home
Working
33
20
... are foreign born
Stay-at-home
Working
34
12
... are living in poverty
Stay-at-home
Working
49
30
... have a high school diploma or less
Stay-at-home
Working

8
PEW RESEARCH CENTER
www.pewresearch.org
some of the recent increase in the share of stay-at-home mothers.
One of the most striking demographic differences between stay-at-home mothers and working
mothers relates to their economic well-being. Fully a third (34%) of stay-at-home mothers are
living in poverty, compared with 12% of working mothers.
There also is substantial variation among stay-at-home mothers. Those who are married with
working husbands generally are better off financially than the other groups. They are more highly
educated, and relatively few are in poverty (15%), compared with a majority of other stay-at-home
mothers. Married stay-at-home mothers (whether their husbands work or not) also are markedly
more likely than single or cohabiting stay-at-home mothers to be foreign born. Single or
cohabiting stay-at-home mothers are younger than their married counterparts; most are younger
than 35, compared with about
four-in-ten married stay-at-
home mothers.
Among all mothers, the share
who are stay-at-home mothers
with working husbands fell to
20% in 2012 from 40% in
1970. Among all stay-at-home
mothers, those who are
married with working
husbands make up the largest
share (68% in 2012), but that
has declined significantly
from 1970, when it was 85%.
As marriage rates have
declined among U.S. adults, a
growing share of stay-at-home
mothers consists of single
mothers (20% in 2012,
compared with 8% in 1970).
About 5% are cohabiting mothers, and 7% are married mothers whose husbands do not work.
Other significant changes in the nation’s demographics since 1970 also have reshaped the profile
of stay-at-home mothers. As women’s education levels have risen, 25% of 2012’s stay-at-home
mothers were college graduates, compared with 7% in 1970. And 19% in 2012 had less than a high
Stay-at-Home and Working Mothers, 1970 and 2012
% of mothers with child(ren) younger than 18 who are …
Note: Based on mothers ages 18-69 with own child(ren) younger than 18 in the household.
Mothers are categorized based on employment status in 1970 and 2012. “Other” stay-at-
home mothers are those who are single, cohabiting, or married with a non-working or
absent husband.
Source: Pew Research Center analysis of March Current Population Surveys Integrated
Public Use Microdata Series (IPUMS-CPS), 1971 and 2013
PEW RESEARCH CENTER
20%
9%
71%
Married w/
working
husband
Working 2012 Stay-at-Home
Other
40%
7%
53% Married w/
working
husband
Working 1970 Stay-at-Home
Other

9
PEW RESEARCH CENTER
www.pewresearch.org
school diploma, compared with 35% in 1970. In spite of these educational gains, the share of stay-
at-home mothers living in poverty has more than doubled since 1970.
This report analyzes the prevalence and characteristics of U.S. mothers living with their children
younger than age 18, using data from the Census Bureau’s Current Population Survey. The analysis
looks at trends from 1970 to 2012,7 focusing most closely on patterns since 2000, including the
years surrounding the Great Recession from 2007 to 2009. In addition, the report compares time
use of mothers at home and mothers at work, using data from the 2003-2012 American Time Use
Survey. It also explores public opinion findings about mothers at home and at work.
The changing circumstances of mothers have clear implications
for the nation’s children. About three-in-ten children (28%) in
the U.S. today are being raised by a stay-at-home mother. This
totaled 21.1 million in 2012 out of 74.2 million Americans
younger than 18,8 up from 17.3 million (24% of children) in
2000. In 1970, 48% of children (34 million) had a mother who
stayed at home.
One-in-five U.S. children today are living in a household with a
married stay-at-home mother and her working husband. In
1970, 41% of children lived in this type of household. In 2012,
5% of children (3.7 million) lived with a single stay-at-home
mother, and 1% (992,000) with a cohabiting stay-at-home
mother. An additional 1.5 million children (2% of the total)
lived with married parents who were both out of the paid
workforce.
Most children today, regardless of race or ethnicity, are growing
up with a working mother. Asian and Hispanic children are the
most likely to be raised by stay-at-home mothers—37% and 36%, respectively, were in 2012. That
compares with 26% of white children and 23% of black children.
7 Each year’s Current Population Survey reports labor force activity for the previous year. This analysis is based on the year the activity took
place, which is the year preceding the survey release date. 8 These numbers are based on all children younger than 18 living in households; in 2012, 11%, or 7.8 million, did not live with their mothers.
Among only those children living with their mother, 32% were being raised by a stay-at-home mother.
Children with a
“Traditional” Stay-at-
Home Mother
% of children with a married
stay-at-home mother with a
working husband
Note: Based on children younger than 18.
Their mothers are categorized based on
employment status in 1970 and 2012.
Source: Pew Research Center analysis of
March Current Population Surveys
Integrated Public Use Microdata Series
(IPUMS-CPS), 1971 and 2013
PEW RESEARCH CENTER
41
20
1970 2012

10
PEW RESEARCH CENTER
www.pewresearch.org
60% 35%
3%
Just as well off
when parents
work
Better off
w/parent at
home
Neither/
Both
Analysis of time-use diaries finds that mothers at home spend more hours per week than working
mothers on child care and housework,9 as well as more time on leisure and sleep. Time use also
varies among different groups of mothers at home: Married stay-at-home mothers put more time
into child care and less into leisure than their single counterparts.
Overall, mothers at home spend 18 hours a week on child care10, compared with 11 hours for
working mothers, a seven-hour difference. The child-care time gap between mothers who work
outside the home and those who do not is largest among married mothers with working husbands.
There is a nine-hour disparity in weekly child-care hours of stay-at-home married mothers with
employed husbands (20 hours) compared with working married mothers with employed husbands
(11 hours). The difference for cohabiting mothers is seven hours, and it is five hours for single
mothers.
Public opinion has grown more supportive of working mothers
over time. When the General Social Survey first asked in 1977
whether a working mother “can establish just as warm and
secure a relationship with her children” as a mother who stays
home, only half of Americans (49%) agreed. That share
generally rose until 1994, when it was 70%, then declined into
the low to mid-60s over the following decade. Since 2008, the
share agreeing has reached 70% or more.
However, Americans also continue to think that having a
mother (or parent) at home is best for a child. In a recent Pew
Research survey, 60% of respondents said children are better
off when a parent stays home to focus on the family, compared
with 35% who said children are just as well off with working
parents.
9 These differences may reflect, in part, the fact that stay-at-home mothers are more likely than their working counterparts to have young
children and to have multiple children. 10 Time spent on child care does not include time when a mother may be engaged in another activity (such as housework, shopping or leisure)
while her children are present. For more details on time use classification, see Appendix B.
What’s Best for Children?
% saying children are …
Note: “Don’t know/Refused” share is
shown but not labeled.
Source: Pew Research Center survey Jan.
23-Feb. 9, 2014, N=3,341
PEW RESEARCH CENTER

11
PEW RESEARCH CENTER
www.pewresearch.org
About the Data Findings in this report are based primarily on data from the Current Population Survey and the American
Time Use Survey.
Current Population Survey Data: Analyses of the trends and demographic characteristics of U.S. mothers
are based on data from the 1971-2013 Annual Social and Economic Supplement (ASEC) of the Current
Population Survey (CPS), which is conducted jointly by the U.S. Census Bureau and the Bureau of Labor
Statistics. These data are collected each March and included about 90,000 household interviews in 2013.
The data were obtained from the Integrated Public Use Microdata database (IPUMS-CPS), provided by the
University of Minnesota. Further information about the IPUMS is available at http://www.ipums.org.
The Pew Research Center analyses are based upon all women ages 18-69 who report living with at least
one of their own children younger than 18 years of age. Responses include all biological children, adopted
children and stepchildren.
While the analyses based on time-use data classify mothers and their husbands or partners based upon
their current employment status, the demographic analyses categorize them based upon their employment
status during the prior year. This is similar to the approach adopted by the U.S. Census Bureau.
American Time Use Data: The time-use findings presented in Chapter 3 are based on the American Time
Use Survey (ATUS) 2003-2012. The ATUS is the nation’s largest survey on time use and the only federal
survey providing such data. It was launched in 2003 by the Bureau of Labor Statistics. The ATUS sample is
nationally representative and drawn from the Current Population Survey. The ATUS interviews a randomly
selected individual age 15 or older from a subset of the households that complete their eighth and last
interview from the CPS. Interviews are conducted over the telephone. The monthly sample is divided into
four randomly selected panels, one for each week of the month. It is also split evenly between weekdays
and weekends. The response rate for each year has been above 50% since the survey started in 2003. For
more information on the ATUS methodology, see http://www.bls.gov/tus/atususersguide.pdf.
The Pew Research Center analyses are based on the yearly ATUS data from 2003 to 2012. To increase the
sample sizes for mothers in different type of families, we pooled the data for all years. The sample size for
all stay-at-home mothers ages 18 to 69 with their own child(ren) younger than 18 is 10,535, including
6,640 married mothers who are not employed and whose husbands are working for pay; 266 stay-at-home
mothers who are cohabiting; and 2,558 single mothers who are not employed. There are 1,071 married
(n=970) or cohabiting mothers (n=101) who are not employed and whose husbands/partners are not
employed either. These mothers are included in the overall stay-at-home mothers, but not analyzed
separately.
Employment status in the ATUS is measured for the previous week; this measure differs from Current
Population Survey data used elsewhere in this report, for which employment status is measured for the
prior year. The ATUS data files were downloaded from ATUS-X (www.atusdata.org).* The data were weighted
to adjust for nonresponse, oversampling and weekend and weekday distribution.
*Sandra L. Hofferth, Sarah M. Flood, and Matthew Sobek. 2013. American Time Use Survey Data Extract System:
Version 2.4 [Machine-readable database]. Maryland Population Research Center, University of Maryland, College Park,
Maryland, and Minnesota Population Center, University of Minnesota, Minneapolis, Minnesota.
12
PEW RESEARCH CENTER
www.pewresearch.org
Chapter 1: Comparing Stay-at-Home and Working Mothers
From their education levels to their birthplaces, the nation’s 10.4 million stay-at-home mothers
have distinct differences from the 25.2 million mothers who work outside the home. But there are
equally striking differences among different groups of stay-at-home mothers, be they married,
single or cohabiting.
In general, married stay-at-home mothers are better off financially than their counterparts who
are single or cohabiting. They are more likely to say they are home because they choose to be, not
because they could not find a job, or are ill, disabled or enrolled in school. They are better
educated and less likely to be in poverty.
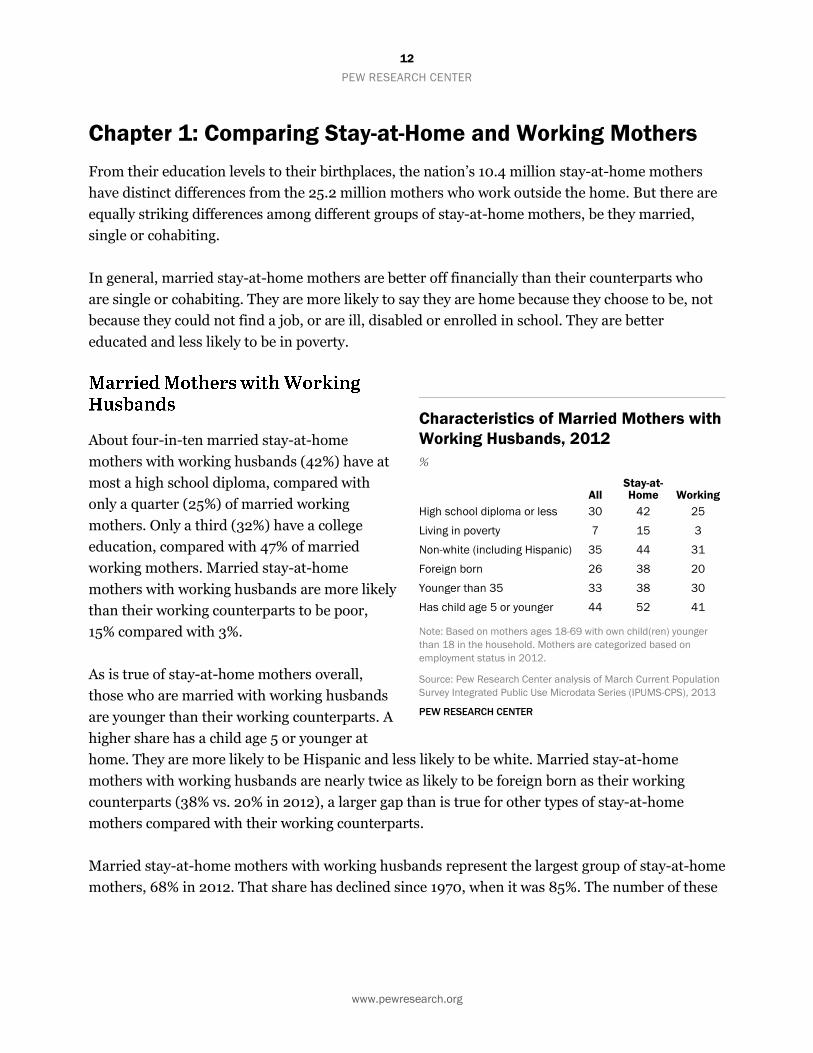
About four-in-ten married stay-at-home
mothers with working husbands (42%) have at
most a high school diploma, compared with
only a quarter (25%) of married working
mothers. Only a third (32%) have a college
education, compared with 47% of married
working mothers. Married stay-at-home
mothers with working husbands are more likely
than their working counterparts to be poor,
15% compared with 3%.
As is true of stay-at-home mothers overall,
those who are married with working husbands
are younger than their working counterparts. A
higher share has a child age 5 or younger at
home. They are more likely to be Hispanic and less likely to be white. Married stay-at-home
mothers with working husbands are nearly twice as likely to be foreign born as their working
counterparts (38% vs. 20% in 2012), a larger gap than is true for other types of stay-at-home
mothers compared with their working counterparts.
Married stay-at-home mothers with working husbands represent the largest group of stay-at-home
mothers, 68% in 2012. That share has declined since 1970, when it was 85%. The number of these
Characteristics of Married Mothers with
Working Husbands, 2012
%
All Stay-at-Home Working
High school diploma or less 30 42 25
Living in poverty 7 15 3
Non-white (including Hispanic) 35 44 31
Foreign born 26 38 20
Younger than 35 33 38 30
Has child age 5 or younger 44 52 41
Note: Based on mothers ages 18-69 with own child(ren) younger
than 18 in the household. Mothers are categorized based on
employment status in 2012.
Source: Pew Research Center analysis of March Current Population
Survey Integrated Public Use Microdata Series (IPUMS-CPS), 2013
PEW RESEARCH CENTER

13
PEW RESEARCH CENTER
www.pewresearch.org
married stay-at-home mothers, 11.6 million in 1970, was 6.4 million in 2000 and 7.1 million in
2012.
The vast majority of married stay-at-home mothers with a working husband (85% in 2012) say
they are not working because they are taking care of their home and family. The share was 96% in
1970. Small shares say they are home because they were ill or disabled (5%), were in school (4%)
or could not find a job (3%).
Education levels of single stay-at-home mothers
are markedly lower than those of single working
mothers. About two-thirds (64%) have at most
a high school diploma compared with 40% of
single working mothers. Only 8% have at least a
college degree, compared with 20% of single
working mothers who do.
Most (71% in 2012) are below the poverty level,
compared with a quarter (27%) of single
working mothers. One-in-five single stay-at-
home mothers (20%) received welfare income
in 2012, compared with only 4% of single
working mothers. About a quarter (23%)
received alimony or child support, compared
with 30% of working single mothers who did.
And 5% reported receiving some income from
family or friends.
Single stay-at-home mothers are slightly younger than working single mothers, and are more
likely to have at least one child age 5 or younger at home. About a third are white, somewhat less
than the 42% of working single women who are, and about a third are black, somewhat more than
the 29% of working single mothers who are. A quarter are Hispanic, a similar share as for working
single mothers (23%). The share of foreign-born is similar for single stay-at-home mothers and
working mothers but is lower than for married stay-at-home mothers.
Characteristics of Single Mothers, 2012
%
All Stay-at-Home Working
High school diploma or less 46 64 40
Living in poverty 37 71 27
Non-white (including Hispanic) 60 65 58
Foreign born 18 18 17
Younger than 35 47 53 45
Has child age 5 or younger 41 47 39
Note: Based on mothers ages 18-69 with own child(ren) younger
than 18 in the household. Mothers are categorized based on
employment status in 2012.
Source: Pew Research Center analysis of March Current Population
Survey Integrated Public Use Microdata Series (IPUMS-CPS), 2013
PEW RESEARCH CENTER

14
PEW RESEARCH CENTER
www.pewresearch.org
The share of all stay-at-home mothers who are single rose to 29% in 1993, fell to 18% in 1999 and
grew slightly to 20% in 2012.11 There were 1.1 million single stay-at-home mothers in 1970, 1.5
million in 2000 and 2 million in 2012.
Single stay-at-home mothers include those who have never been married, are divorced, separated
or widowed, and who do not have partners living with them. About half (48%) have another adult
relative in the household, an indication that someone else may be available to help with child care
or financial support.
Less than half of single mothers at home (41% in 2012) say the reason they do not hold a paying
job is to take care of home and family. The rest say say they are home because they are ill or
disabled (27%), cannot find work (14%), or are in school (13%). The reasons for being home have
changed substantially for this group since 1970, when 76% said they were at home in order to care
for home and family.
As is true of single mothers, there is a wide
education gap between cohabiting stay-at-home
mothers and cohabiting working mothers. Two-
thirds of cohabiting stay-at-home mothers
(66%) have a high school diploma at most,
compared with 39% of working cohabiting
mothers. Only 5% have at least a college
education, compared with 17% of cohabiting
working mothers. Most are poor (88%),
compared with a third (32%) of their working
counterparts.
Among cohabiting stay-at-home mothers, fully
one-in-five (21%) is younger than 25, compared
with 15% of working cohabiting mothers.
Nearly two-thirds have at least one child age 5
or younger at home, compared with about half of cohabiting working mothers who do.
11 It is beyond the scope of this report to analyze the reason for these trends, but other researchers have documented a rise in employment of
low-income single mothers after passage of the 1996 welfare reform law, the Personal Responsibility and Work Opportunity Reconciliation
Act, which included stricter work requirements and time limits on cash benefits.
Characteristics of Cohabiting
Mothers, 2012
%
All Stay-at-Home Working
High school diploma or less 46 66 39
Living in poverty 48 88 32
Non-white (including Hispanic) 42 46 41
Foreign born 16 20 15
Younger than 35 60 67 57
Has child age 5 or younger 52 63 47
Note: Based on mothers ages 18-69 with own child(ren) younger
than 18 in the household. Mothers are categorized based on
employment status in 2012.
Source: Pew Research Center analysis of March Current Population
Survey Integrated Public Use Microdata Series (IPUMS-CPS), 2013
PEW RESEARCH CENTER

15
PEW RESEARCH CENTER
www.pewresearch.org
Cohabiting stay-at-home mothers are somewhat less likely than their working counterparts to be
white, and somewhat more likely to be Hispanic. The shares of cohabiting stay-at-home mothers
and at-work mothers who are black are identical. One-in-five cohabiting stay-at-home mothers
(20%) is foreign born, somewhat higher than for cohabiting working mothers (15%) but lower than
for married stay-at-home mothers (38%).
Data for cohabiting mothers have been fully available only since 2006, when they made up 4% of
all stay-at-home mothers; their share was 5% in 2012.
About two-thirds of cohabiting stay-at-home mothers (64% in 2012) say they are taking care of
home and family. Others say they are not working because they are ill or disabled (17%), going to
school (11%) or unable to find work (6%).
In terms of education, more than half (58%) of married stay-at-home mothers whose husbands do
not work have a high school diploma or less, markedly more than the 39% share for married
working mothers with non-working husbands.
Only 16% have graduated from college,
compared with a third (34%) of their working
counterparts.
About three-fourths (74%) are poor, compared
with a quarter (24%) of their working
counterparts. Among this group, 9% received
welfare in 2012, compared with 4% of their
working counterparts.
They are somewhat more likely to be Hispanic
than comparable working mothers and less
likely to be white. The share who are
immigrants was 35% in 2012, compared with
31% of their working counterparts.
Married stay-at-home mothers whose husbands
are not working made up 7% of all stay-at-home mothers in 2012. Since 1970, their share of stay-
at-home mothers has ranged from 5% to 9%. They are younger than comparable working mothers:
About four-in-ten (39%) are younger than 35, compared with 29% of married working mothers
Characteristics of Married Mothers with
Non-Working Husbands, 2012
%
All Stay-at-Home Working
High school diploma or less 46 58 39
Living in poverty 42 74 24
Non-white (including Hispanic) 52 57 49
Foreign born 32 35 31
Younger than 35 32 39 29
Has child age 5 or younger 40 41 40
Note: Based on mothers ages 18-69 with own child(ren) younger
than 18 in the household. “Married mothers with non-working
husbands” includes married mothers with absent husbands.
Mothers are categorized based on employment status in 2012.
Source: Pew Research Center analysis of March Current Population
Survey Integrated Public Use Microdata Series (IPUMS-CPS), 2013
PEW RESEARCH CENTER
16
PEW RESEARCH CENTER
www.pewresearch.org
with non-working husbands. However, they are less likely than other stay-at-home mothers to
have children age 5 or younger at home; only 41% did in 2012, about the same as married working
mothers with non-working husbands (40%).
Some 57% of married stay-at-home mothers with non-working husbands say they themselves are
home in order to take care of home and family. One-in-five (19%) say they are home because they
are ill or disabled, and 9% each say it is because they are going to school or could not find a job.

17
PEW RESEARCH CENTER
www.pewresearch.org
Chapter 2: Stay-at-Home Mothers by Demographic Group
There is substantial variation in the share of stay-at-home mothers among racial and ethnic
groups and among mothers of different education levels. But the direction of change among all
groups has been the same in recent years: The share of stay-at-home mothers has risen.
For all groups except Asians (whose data trail is shorter), the share of all stay-at-home mothers
declined from 1970 to 2000 but rose somewhat from 2000 to 2012. For Asians, data began in
1987; the share of all Asian stay-at-home mothers rose from 2000 to 2012.
Comparing racial and ethnic groups, Hispanic
mothers (38% in 2012) and Asian mothers
(36%) are most likely to be home with their
children. Among white mothers, 26% were
home with their children in 2012, as were 27%
of black mothers.
The higher share of stay-at-home mothers
among Hispanic and Asian women relates to
the fact that so many are immigrants. Fully
86% of Asian mothers were born outside of the
U.S., as were 60% of Hispanic mothers. In
comparison, just 13% of black mothers and 6%
of white mothers are foreign born. Among all
immigrant mothers in 2012, 40% were stay-at-
home mothers, compared with 26% of
mothers born in the U.S.
Among stay-at-home mothers, the
“traditional” married stay-at-home mother
(with a working husband) is the most common
type among Asians, whites and Hispanics.
Black stay-at-home mothers are most likely to be single. The share of stay-at-home mothers has
risen since 2000 for all four racial and ethnic groups, after declining in the years leading up to
2000. The rise from 2000 to 2012 was most striking for black mothers, whose stay-at-home share
rose to 27% from 18%. For the period from 1970 to 2012, stay-at-home mothers declined as a share
Stay-at-Home and Working Mothers,
By Race and Ethnicity, 2012
% of mothers with child(ren) younger than 18 who are …
Note: Based on mothers ages 18-69 with own child(ren) younger
than 18 in the household. Whites, blacks and Asians include only
non-Hispanics. Hispanics are of any race. “Other” stay-at-home
mothers are those who are cohabiting or married with a non-working
or absent husband. Mothers are categorized based on employment
status in 2012.
Source: Pew Research Center analysis of March Current Population
Surveys Integrated Public Use Microdata Series (IPUMS-CPS), 2013
PEW RESEARCH CENTER
27
30
8
19
7
2
15
3
5
4
3
3
Hispanic
Asian
Black
White
62
Working
74
73
64
Single Married with
Working Husband Other
------------------ Stay-at-Home-------------------

18
PEW RESEARCH CENTER
www.pewresearch.org
of all mothers for whites, blacks and Hispanics. Data for Asian stay-at-home mothers have been
available since 1987; the share is about the same in both years.
Foreign-born mothers are far more likely than
U.S.-born mothers not to work outside the
home. In 2012, 40% of immigrant mothers
were stay-at-home mothers, compared with
26% of U.S.-born mothers. Immigrants also
are more likely than U.S.-born mothers to be
married stay-at-home mothers.
Trends in the share of stay-at-home mothers
are similar for foreign-born and U.S.-born
mothers since 1993, the first year for which
data became available by nativity. The share of
stay-at-home mothers declined for both
groups for 1993-2000 and grew for 2000-
2012, with an interruption for several years
around the time of the Great Recession.
Stay-at-Home and Working Mothers,
by Nativity, 2012
% of mothers with child(ren) younger than 18 who are …
Note: Based on mothers ages 18-69 with own child(ren) younger
than 18 in the household. Mothers are categorized based on
employment status in 2012. “Other” stay-at-home mothers are
those who are cohabiting or married with a non-working or absent
husband.
Source: Pew Research Center analysis of March Current Population
Surveys Integrated Public Use Microdata Series (IPUMS-CPS), 2013
PEW RESEARCH CENTER
32
16
4
6
4
3
Working
74
60
Single
Married with
Working Husband Other
------------------ Stay-at-Home ------------------
Native born
Foreign born

19
PEW RESEARCH CENTER
www.pewresearch.org
In terms of schooling, the least educated
mothers are the most likely not to work
outside the home. In 2012, 51% of mothers
with less than a high school education were
stay-at-home mothers, compared with 35% of
high school graduates, 25% of mothers with
some college education and 21% of college
graduates. The least educated mothers are
most likely to be stay-at-home single mothers.
Among stay-at-home mothers, the most
educated mothers are the most likely to be
married with a working husband (not shown
in chart). Fully 88% of stay-at-home mothers
with a college degree are married to a working
husband. By contrast, among stay-at-home
mothers with less than a high school diploma,
only 57% are married with a working husband.
The share is slightly higher for high school
graduates who are stay-at-home mothers with
a working husband (60%).
Only the least educated mothers are about as
likely now as in 1970 to be stay-at-home
mothers, though their share dipped in the late 1990s before rising again. Among women of other
educational attainment groups, the share dipped until about 2000, when it began rising again, but
it did not reach earlier levels. Among mothers with a college degree, the share of stay-at-home
mothers grew only one percentage point, from 20% in 2000 to 21% in 2012.12
12 Because of the sharp rise in educational attainment for mothers (and all women) since 1970, any trends in the number of stay-at-home
mothers by educational attainment are swamped by the increase in the number of the most educated women. About one-third of mothers had
less than a high school education in 1970, but only 11% did in 2012. Only 8% had a college degree or more in 1970, compared with a third in
2012.
Stay-at-Home and Working Mothers,
by Educational Attainment, 2012
% of mothers with child(ren) younger than 18 who are …
Note: Based on mothers ages 18-69 with own child(ren) younger
than 18 in the household. Mothers are categorized based on
employment status in 2012. “Other” stay-at-home mothers are
those who are cohabiting or married with a non-working or absent
husband. "High school diploma" includes those with its equivalent,
such as a GED (General Educational Development) certificate.
"Some college" includes those with a two-year/associate degree.
Data labels not showing are 1%.
Source: Pew Research Center analysis of March Current Population
Surveys Integrated Public Use Microdata Series (IPUMS-CPS), 2013.
PEW RESEARCH CENTER
29
21
17
19
14
9
5
8
5
3
49
Working
79
75
65
Single Married with
Working Husband Other
------------------ Stay-at-Home ------------------
Less than
high school
Bachelor's
degree or more
Some college
High school
diploma

20
PEW RESEARCH CENTER
www.pewresearch.org
Chapter 3: How Do Mothers Spend Their Time at Home?
Mothers who are not working for pay spend more time, on average, on child care and housework
than do working mothers, but they also have
more time for leisure and sleep, according to a
new Pew Research analysis of pooled data
from the 2003-2012 American Time Use
Survey.
Stay-at-home mothers spend an average of 18
hours per week in child-care activities, seven
hours more than working mothers.13 At the
same time, stay-at-home mothers spend nine
hours more per week than working mothers on
housework (23 hours vs. 14 hours), and they
also have nine more hours per week of leisure
time and five more hours per week of time to
sleep (including naps) than do working
mothers.14
Working mothers’ time at home is limited by
their hours at work. On average, working
mothers spend 36 hours per week in paid
work, while stay-at-home mothers spend only
about one hour per week on activities intended
to generate income.15
One reason that stay-at-home mothers may spend more time on child care is that their children
are younger and require more intense attention. As explained elsewhere in this report, 51% of stay-
at-home mothers care for at least one child age 5 or younger, compared with 41% of working
mothers. As also noted earlier in this report, mothers who are at home with their children differ
from working mothers on key demographic variables such as age, education, race, ethnicity and
nativity. (See Chapter 1 for more detail.)
13 All analyses are based on mothers ages 18 to 69 with own child(ren) younger than 18 in the household. “At-home” mothers refers to
mothers who are not employed. Employment status in the ATUS is measured for the previous week, which is different from the Current
Population Survey measure (employment in the past year) used elsewhere in this report. 14 Leisure time in the ATUS includes time spent on TV and media use, social activities and sports. For more information, see Appendix B. 15 Even though not employed, mothers at home still report time spent in work-related activities, such as making artwork for sale or job
searching.
Time Use: Stay-at-Home Mothers vs.
Working Mothers
Average number of hours per week spent on …
Note: Based on mothers ages 18 to 69 with own child(ren) younger
than 18 in the household. Mothers are categorized based on
employment status in the previous week.
Source: Pew Research Center analysis of 2003-2012 American
Time Use Survey, ATUS-X
PEW RESEARCH CENTER
23
18
31
63
14
11
22
58
Housework
Child care
Leisure
Sleep
Stay-at-Home Working

21
PEW RESEARCH CENTER
www.pewresearch.org
Among all stay-at-home mothers, time-use
patterns vary considerably by marital status.
Married stay-at-home mothers with working
husbands spend more time on child care than
do single mothers who are at home (20 hours
per week vs. 15 hours).16 They also spend more
time doing housework. These married stay-at-
home mothers have less leisure time than their
single counterparts (29 hours per week vs. 35
hours).
The total time cohabiting stay-at-home
mothers spend on home activities falls in
between that of married mothers and single
mothers. For example, their child-care time is
slightly less than that of married mothers (19
hours per week vs. 20 hours), but more than
that of single mothers (15 hours per week).
The child-care time gap between working and
stay-at-home mothers is largest among
married mothers. Married stay-at-home
mothers spend an average of 20 hours per
week on child care, nine hours more than
married working mothers. By contrast, single
stay-at-home mothers spend about 15 hours
per week taking care of their children, only
about five hours more than single working
mothers.
One important factor related to mothers’ time
use is the age of their children. Younger
children create greater demands on their
parents’ time. Among married stay-at-home
mothers, those with children ages 5 or younger
16 Throughout the chapter, “married stay-at-home mothers” refers to those who are not employed and whose spouses are working for pay.
Stay-at-Home Mothers’ Time, by Marital
Status
Average number of hours per week spent on …
Note: Based on mothers ages 18 to 69 with own child(ren) younger
than 18 in the household. Mothers are categorized based on
employment status in the previous week.
Source: Pew Research Center analysis of 2003-2012 American
Time Use Survey, ATUS-X
PEW RESEARCH CENTER
Parenting Gap, by Work and Marital
Status of Mothers
Average number of hours per week spent on child care
Note: Based on mothers ages 18 to 69 with own child(ren) younger
than 18 in the household. Mothers are categorized based on
employment status in the previous week.
Source: Pew Research Center analysis of 2003-2012 American
Time Use Survey, ATUS-X
PEW RESEARCH CENTER
25
20
29
21
19
34
18
15
35
Housework
Child care
Leisure
Married with
Working Husband
Cohabiting Single
20
19
15
11
12
10
Stay-at-Home Working
Married with
working husband
Cohabiting
Single
+9
+7
+5
Stay-at-Home-
Working
Diff.

22
PEW RESEARCH CENTER
www.pewresearch.org
24 25
27 27
12
31
Housework Child care Leisure
ages 0-5 ages 6-17
spend twice as much time on child-care
activities as do those with older children (25
hours per week vs. 12 hours). At the same
time, stay-at-home mothers with younger
children do somewhat less housework than
their counterparts with older children (24
hours per week vs. 27 hours).
Married stay-at-home mothers have more
leisure time when their children are older.
Those with school-age children have an
average of four more hours per week of leisure
time than those with children ages 5 or
younger (31 hours per week vs. 27 hours per
week).
The same pattern can be seen with married
working mothers. Those with younger children
spend more than twice as much time on child-
care activities as do mothers with children age
6 or older (16 hours per week vs. 7 hours).
Their time doing housework is also somewhat
lower (14 hours per week vs. 16 hours).
The number of children in a family also affects parents’ child-care time. Married stay-at-home
mothers with two children younger than 18 spend more time than those with one child on child-
care activities (20 hours per week vs. 16 hours), and married stay-at-home mothers with three or
more children spend even more time on child-care activities—23 hours per week. This pattern
applies to married working mothers as well: Those with two children spend about three hours
more on child-care activities than mothers with one child (12 hours per week vs. nine hours), and
those with three or more children spend 14 hours per week on child care.
Single mothers’ child-care time also is affected by children’s characteristics. (There is not a large
enough sample of cohabiting mothers to report on their time use at this level of detail.) Stay-at-
home single mothers with children ages 5 or younger spend about twice as much time on child
care as their counterparts with older children (19 hours per week vs. 10 hours). There is a similar
gap among working single mothers—those with young children spend 14 hours per week on child
care, compared with seven hours among those with school-age children.
Time Use of Married Stay-at-Home
Mothers with Working Husbands,
by Age of Youngest Child
Average number of hours per week spent on …
Note: Based on married stay-at-home mothers with a working
husband, ages 18 to 69 with own child(ren) younger than 18 in the
household. Mothers are categorized based on employment status in
the previous week.
Source: Pew Research Center analysis of 2003-2012 American
Time Use Survey, ATUS-X
PEW RESEARCH CENTER

23
PEW RESEARCH CENTER
www.pewresearch.org
Single stay-at-home mothers with three or more children spend an average of 20 hours per week
on child care, significantly more than their counterparts with one or two children (11 hours per
week and 17 hours per week, respectively). Working single mothers’ child-care time also increases
by the number of children they have. Single mothers who work for pay spend an average of eight
hours per week on child care if they have one child, 11 hours if they have two children and 13 hours
if they have three or more.
The amount of time married stay-at-home
mothers spend with their children differs
significantly by education, race and ethnicity.
College-educated stay-at-home mothers who
are married spend more time on child care
than their less-educated counterparts—an
average of 24 hours per week. By comparison,
mothers with some college education spend 19
hours per week on child care, and mothers
with a high school education or less spend 17
hours per week.
Asian and white married stay-at-home
mothers record more time with their children
than their counterparts who are black or
Hispanic. On average, married stay-at-home
Asian mothers spend 23 hours per week on
child-care activities, and married stay-at-home
white mothers spend 21 hours per week. By
contrast, Hispanic married stay-at-home
mothers spend about 17 hours per week on
those activities, and black mothers who are
married and staying at home with their children spend 16 hours per week on child care.
Among single stay-at-home mothers, those who are college-educated spend more time on child-
care activities than do mothers without a college degree (17 hours per week vs. 15 hours). However,
among working single mothers, education doesn’t make a difference in their child-care time.
Single mothers who work for pay spend about 10 hours per week on child care, whether they have
a college education or a high school education.
Child-care Time of Married Stay-at-Home
Mothers with Working Husbands, by
Education and Race
Average number of hours per week spent on child care
Note: Based on married stay-at-home mothers with a working
husband, ages 18 to 69 with own child(ren) younger than 18 in the
household. Mothers are categorized based on employment status in
the previous week. Whites, blacks and Asians include only non-
Hispanics. Hispanics are of any race. Asians include Pacific
Islanders.
Source: Pew Research Center analysis of 2003-2012 American
Time Use Survey, ATUS-X
PEW RESEARCH CENTER
20
24
19
17
21
16
17
23
All
Bachelor's degree+
White
Hispanic
Some college
High school
diploma or less
Black
Asian

24
PEW RESEARCH CENTER
www.pewresearch.org
The racial differences in child-care time among single mothers are smaller than they are among
married mothers. White single mothers who are at home on average devote about one hour more
to child care than do Hispanic mothers (16 hours per week vs. 15 hours), and two hours more than
black mothers (14 hours per week). Black
single working mothers spend slightly less
time on child-care activities than their
counterparts in other racial and ethnicity
groups (nine hours per week vs. 10 hours).
There is not a large enough sample of Asian
single mothers to report on their time use at
this level of detail.
Aside from differences in the amount of time
stay-at-home mothers and working mothers
spend with their children, there are differences
in the types of activities in which each group
engages. The data can be broken down into
four broad categories of child-care activities:
physical, managerial, recreational and
educational.17 Physical care includes activities
such as changing diapers, feeding or dressing a
child, and care related to children’s health.
Recreational care includes activities such as
playing games or sports with children.
Educational activities include reading or helping with homework. And managerial activities
related to child care include organizing and planning for children, attending events and the like.
Married stay-at-home mothers spend more time than their working counterparts in each of these
areas. The gap is larger for physical, recreational and educational activities; married stay-at-home
mothers spend about twice as much time in these activities as do working mothers. The smallest
gap is in managerial activities, where working mothers do 77% of what the stay-at-home mothers
do.
For both groups of mothers, physical child-care activities take up the largest share of their child-
care time. This is especially true for married stay-at-home mothers: about 42% of their child-care
17 For more information about this categorization, see R Wang, “What Makes a Good Dad? Contexts, Measures and Covariates of Paternal
Care” Dissertation, University of Maryland, College Park. 2008.
Detailed Child-care Activities Among
Married Mothers, by Work Status
Average number of hours per week spent on …
Note: Based on married mothers ages 18 to 69 with own child(ren)
younger than 18 in the household. Mothers are categorized based
on employment status in the previous week.
Source: Pew Research Center analysis of 2003-2012 American
Time Use Survey, ATUS-X.
PEW RESEARCH CENTER
8.3
4.7 4.0
3.0
4.2 3.6
1.7 1.7
Physical Managerial Recreational Educational
Stay-at-Home Working

25
PEW RESEARCH CENTER
www.pewresearch.org
time is spent on taking care of children’s physical needs. Among married working mothers, 37% of
their child-care time is spent on physical care.
Single mothers who are at home also spend about twice as much time in physical care as their
counterparts who work for pay (6.6 hours per week vs. 3.4 hours). But the two groups of mothers
spend similar amounts of time in managerial child-care activities (3.6 hours per week vs. 3.3
hours). The gaps in educational or recreational activities among single mothers are not as large as
those observed among married mothers. For stay-at-home single mothers, 2.1 hours per week are
spent on educational activities with their children, compared with 1.6 hours among working single
mothers. And stay-at-home single mothers spend 2.5 hours per week on recreational activities
with their children, compared with 1.5 hours among working single mothers.

26
PEW RESEARCH CENTER
www.pewresearch.org
60% 35%
3%
Just as well off
when parents
work
Better off
w/parent at
home
Neither/
Both
Chapter 4: Public Views on Staying at Home vs. Working
Despite the fact that most mothers in the U.S. work at least part
time, many Americans continue to believe that having a mother
who stays at home is beneficial for a young child, though as is
often the case with public opinion variations in question
wording elicit slightly different responses. A recent Pew
Research survey focusing on “parents,” rather than just on
mothers, asked Americans which statement came closer to their
view: First, children are better off when a parent stays home to
focus on the family; or second, children are just as well off when
their parents work outside the home. Fully six-in-ten adults
chose the first statement and only about one-third (35%) chose
the second statement.18
Men (65%) are somewhat more likely than women to say
children are better off when a parent stays home. But even
among women, 55% say having a parent at home is better for a
child. Four-in-ten women say children are just as well off when
their parents work outside the home.
Sharper differences of opinion on this question emerge across
ethnic, socioeconomic and religious lines. Hispanics are considerably more likely than whites or
blacks to say children are better off with a parent at home—73% of Hispanics say this, compared
with 57% of both whites and blacks. These attitudes may be linked to behaviors as Hispanic
mothers are among the most likely to be stay-at-home mothers.
Views also differ significantly by educational attainment, with support for working parents rising
as educational levels rise, though in no group does a majority say children are just as well off when
their parents work. Among college graduates, 51% say children are better off with a parent at home
to focus on the family, while 43% say children are just as well off when a parent works. And
college-educated women are one of the few groups in which a plurality (50%) say children are just
as well off with working parents. By contrast, among adults with a high school diploma or less
education, fully 66% say children are better off with a parent at home and only 30% say children
do just as well with working parents. Adults with some college education, but not a bachelor’s
18 These findings are based on a Pew Research survey conducted Jan. 23-Feb. 9, 2014, among 3,341 adults nationwide. The full survey
report has not yet been released.
What’s Best for Children?
% saying children are …
Note: “Don’t know/Refused” share is
shown but not labeled.
Source: Pew Research Center survey Jan.
23-Feb. 9, 2014, N=3,341
PEW RESEARCH CENTER

27
PEW RESEARCH CENTER
www.pewresearch.org
55
65
57
57
73
51
60
66
46
54
58
69
Women
Men
White
Black
Hispanic
College graduate
Some college
High school or less
Unaffiliated
White mainline Prot.
White Catholic
White evang. Prot.
Bachelor's degree
or more
High school
diploma or less
degree, fall in the middle–60% say having a
parent at home is preferable, and 35% say it
doesn’t matter either way.
Religious affiliation is also strongly correlated
with views on this issue. Among white
evangelical Protestants, 69% say it’s better for
children if a parent is at home to focus on the
family, and 26% say children are just as well
off when their parents work outside the home.
White mainline Protestants and white
Catholics are more evenly split on this
question, although each group leans toward
saying that it is better for children to have a
parent at home. Adults who are not affiliated
with any religion are among the least likely to
say children are better off with a parent at
home (46%). About half (50%) say children
are just as well off when their parents work
outside the home.
Among parents with children younger than 18,
mothers (56%) are less likely than fathers
(69%) to say it is better for children to have a
parent at home. Women’s views on this issue
are fairly consistent, regardless of whether or
not they have children. But among men,
there’s a wide gap between fathers and non-
fathers. While about seven-in-ten fathers say
children are better off when a parent stays
home to focus on the family, only 58% of men
who are not fathers agree.19
Previous polling has shown that the public clearly differentiates between mothers and fathers
when considering what is best for children. In a 2013 Pew Research survey, respondents were
asked whether children are better off if their mother is home and doesn’t hold a job, or if they are
19 The 58% figure is based on men under age 50 to avoid including older men who may be fathers but whose children are age 18 or older.
Demographic Groups Differ Over What’s
Better for Children
% saying children are better off when a parent stays
home to focus on the family
Note: Blacks and whites include only non-Hispanics. Hispanics are
of any race.
Source: Pew Research Center survey Jan. 23-Feb. 9, 2014,
N=3,341
PEW RESEARCH CENTER
28
PEW RESEARCH CENTER
www.pewresearch.org
29
58
20
30
40
50
60
1987 1989 1991 1997 2002 2007 2012
just as well off if their mother works. Some 51% of respondents said that children are better off if
their mother is at home, while 34% said they are just as well off with a working mother. And, in a
separate question, they were asked about fathers and their children. Only 8% of all adults said that
children are better off if their father is home and doesn’t hold a job, while 76% said children are
just as well off if their father works.
That same 2013 survey found that while the public recognizes the clear economic benefits of
having more mothers in the workplace, many voice concerns about the toll this is having on
children. Roughly two-thirds of adults (67%) say the increasing number of women working for pay
outside the home has made it easier for families to earn enough to live comfortably. But at the
same time, 74% say this trend has made it harder for parents to raise children.
Asked what the ideal situation is for young children, the share of Americans who say having a
mother who does not work outside the home is ideal has declined since a 2009 Pew Research
Center survey, when 43% said so, to 2012, when 33% did. A plurality (42%) in 2012 said having a
mother who works part time is ideal for young children, while 16% said a full-time working mother
is ideal. When the question was asked from the mother’s point of view—which situation is ideal for
women with young children—the results were similar: 33% in 2012 said not working at all was
ideal, compared with 39% who said so in 2009.
Opinions about what is best for children have changed considerably over time. In 1985 when the
General Social Survey asked about the impact
that a working mother might have on a young
child, some 55% of adults agreed that “a pre-
school child is likely to suffer if his or her
mother works.” By 2012, only 35% of adults
agreed with that statement.
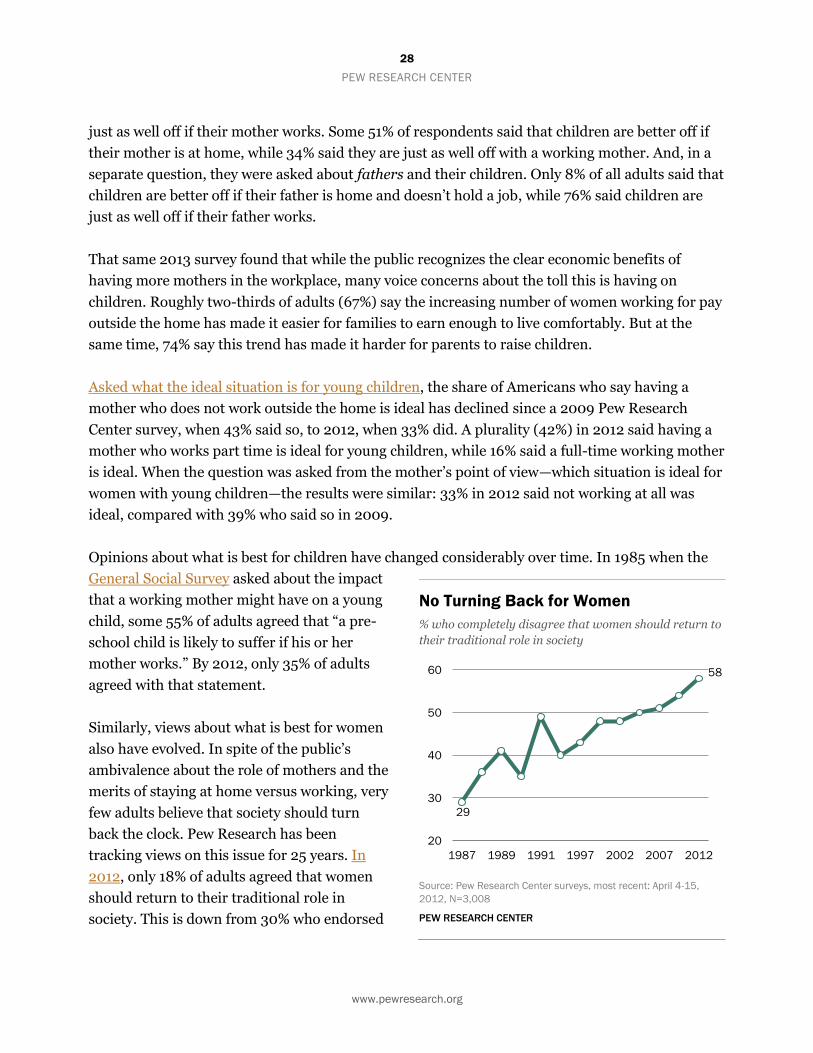
Similarly, views about what is best for women
also have evolved. In spite of the public’s
ambivalence about the role of mothers and the
merits of staying at home versus working, very
few adults believe that society should turn
back the clock. Pew Research has been
tracking views on this issue for 25 years. In
2012, only 18% of adults agreed that women
should return to their traditional role in
society. This is down from 30% who endorsed
No Turning Back for Women
% who completely disagree that women should return to
their traditional role in society
Source: Pew Research Center surveys, most recent: April 4-15,
2012, N=3,008
PEW RESEARCH CENTER

29
PEW RESEARCH CENTER
www.pewresearch.org
28
24
10
10
42
39
27
13
Fathers
Mothers
Taken a significant
amount of time off
Reduced
work hours
Quit job
Turned down a
promotion
this idea in 1987. Over the same period, the share of adults who completely disagree that women
should return to their traditional roles has risen from 29% to 58%.
In a Pew Research Center survey in 2012, a plurality of working and stay-at-home mothers said
that the ideal situation for them is to work part time. Only 36% of stay-at-home mothers said that
not working at all is ideal for them. The share of stay-at-home mothers who said that not working
at all is their ideal situation has fallen since 2007, when 48% said so.
Despite the additional time they spend on child care, mothers who do not work outside the home
give themselves slightly lower ratings than working mothers for the job they are doing as parents.
In a 2012 survey, 66% of stay-at-home mothers
rated themselves as “excellent” or “very good”
parents, compared with 78% of working
mothers.
There is also a middle ground for parents
between working and staying at home, and
some adults move in and out of these categories
over the course of their careers.
A recent Pew Research survey found that
women are much more likely than men to
report having had a significant career
interruption related to family caregiving.
Among adults who have ever worked, fully 42%
of mothers say they have reduced their work
hours in order to care for a child or other
family member. This compares with 28% of
fathers. And roughly the same share of mothers
(39%) say they have taken a significant amount
of time off from work in order to care for a
family member (compared with 24% of fathers). About one-quarter of mothers (27%) with some
work experience say at some point in their working life they quit their job in order to care for a
child or other family member.
Mothers, More than Fathers,
Experience Career Interruptions
% saying they have … in order to care for a child or
family member
Notes: Based on those who have ever worked. “Fathers” and
“mothers” include those with children of any age, including adult
children (n=1,254).
Source: Pew Research Center survey, Oct. 7-27, 2013
PEW RESEARCH CENTER

30
PEW RESEARCH CENTER
www.pewresearch.org
Appendix A: Additional Tables
Characteristics of Stay-at-Home and Working Mothers, 1970
---------------------------------------------At Home-------------------------------------- Working
All
Married w/ Working Husband Single
Married w/ Non-Working
Husband
All mothers 13,690,102 11,624,289 1,089,922 975,891 15,421,263
White 11,601,530 10,302,970 566,594 731,966 12,635,313
Black 1,096,590 590,873 379,569 126,148 1,981,023
Hispanic 828,416 607,672 139,043 81,701 615,955
Less than high school 4,855,754 3,754,119 702,348 399,287 4,519,676
High school diploma 6,344,808 5,634,584 293,611 416,613 7,622,531
Some college 1,554,895 1,363,845 72,872 118,178 1,874,182
Bachelor’s degree 934,645 871,740 21,092 41,813 1,404,873
Notes: Based on mothers ages 18-69 with own child(ren) younger than 18 in the household. Mothers are
categorized based on employment status in 1970. Whites and blacks include only non-Hispanics. Hispanics are
of any race. Data on cohabitation, Asian-origin and nativity status not available. “Married w/ non-working
husband” includes married mothers with absent husbands.
Source: Pew Research Center tabulations of the March Current Population Survey Integrated Public Use
Microdata Series (IPUMS-CPS), 1971
PEW RESEARCH CENTER

31
PEW RESEARCH CENTER
www.pewresearch.org
Characteristics of Stay-at-Home and Working Mothers, 2000
-----------------------------------------At Home--------------------------------------- Working
All
Married w/ Working Husband Single
Married w/ Non-Working
Husband
All mothers 8,379,044 6,393,144 1,485,673 500,228 27,737,662
White 5,019,579 4,193,534 549,925 276,120 18,692,451
Black 846,919 289,993 507,804 49,122 3,917,863
Hispanic 1,887,655 1,391,371 376,435 119,849 3,585,258
Asian 529,851 449,586 32,299 47,966 1,266,381
Native born 6,061,096 4,541,559 1,207,199 312,338 23,555,349
Foreign born 2,317,947 1,851,585 278,473 187,889 4,182,313
Less than high school 1,953,661 1,192,540 585,460 175,661 2,795,611
High school diploma 2,555,380 1,885,206 506,597 163,577 8,786,868
Some college 2,093,191 1,645,830 343,122 104,239 8,946,130
Bachelor’s degree 1,776,811 1,669,568 50,492 56,751 7,209,053
Notes: Based on mothers ages 18-69 with own child(ren) younger than 18 in the household. Mothers are
categorized based on employment status in 2000. Whites and blacks include only non-Hispanics. Hispanics
are of any race. Data on cohabitation and Asian-origin status not available. “Married w/ non-working husband”
includes married mothers with absent husbands.
Source: Pew Research Center tabulations of the March Current Population Survey Integrated Public Use
Microdata Series (IPUMS-CPS), 2001
PEW RESEARCH CENTER

32
PEW RESEARCH CENTER
www.pewresearch.org
Detailed Characteristics of Stay-at-Home Mothers, 2012
All
Married w/ Working Husband Single Cohabiting
Married w/ Non-Working
Husband
All mothers 10,371,463 7,067,359 2,043,259 531,124 729,721
White 5,255,184 3,948,713 711,212 284,394 310,865
Black 1,246,172 376,578 711,769 63,820 94,005
Hispanic 2,812,131 1,951,424 511,375 153,794 195,538
Asian 834,922 703,381 36,358 5,383 89,800
Native born 6,979,889 4,407,906 1,668,998 425,650 477,335
Foreign born 3,391,575 2,659,454 374,261 105,474 252,386
Less than high school 1,992,854 1,126,833 543,855 145,910 176,256
High school diploma 3,063,861 1,838,202 773,245 203,193 249,221
Some college 2,753,369 1,847,559 565,323 154,520 185,967
Bachelor’s degree 2,561,381 2,254,765 160,836 27,502 118,278
18-24 years 966,166 378,767 397,883 112,957 76,559
25-34 3,438,594 2,313,200 675,641 244,562 205,191
35-44 3,780,568 2,843,112 576,384 141,825 219,247
45-54 1,831,742 1,332,983 309,497 23,599 165,663
55-64 321,072 184,452 73,435 8,181 55,004
65-69 33,323 14,845 10,420 0 8,058
Continued on next page
PEW RESEARCH CENTER

33
PEW RESEARCH CENTER
www.pewresearch.org
Detailed Characteristics of Stay-at-Home Mothers, 2012
(Continued)
All
Married w/ Working Husband Single Cohabiting
Married w/ Non-Working
Husband
Living with own child age 5 or younger 5,269,575 3,665,313 970,384 337,166 296,712
Not working because taking care of home/family 7,601,786 6,018,297 831,849 339,152 412,489
Couldn’t find work 633,542 240,376 295,185 33,133 64,848
Ill or disabled 1,151,177 367,827 556,537 88,958 137,855
Going to school 693,438 296,250 271,914 57,585 67,689
Retired 175,584 82,330 53,199 4,984 35,071
Not working for some other reason 115,936 62,280 34,576 7,312 11,769
Living below poverty line 3,544,478 1,092,798 1,443,252 466,290 542,138
Received WIC or public assistance 618,599 72,534 417,866 66,007 62,192
Received alimony or child support income 757,811 143,832 474,402 100,723 38,854
Received income from family or friends 165,569 19,639 107,098 15,392 23,440
Notes: Based on mothers ages 18-69 with own child(ren) younger than 18 in the household. Mothers are
categorized based on employment status in 2012. Whites and blacks include only non-Hispanics. Hispanics are
of any race. “Married w/non-working husband” includes married mothers with absent husbands. WIC is the
government Special Supplemental Nutrition Program for Women, Infants and Children.
Source: Pew Research Center tabulations of the March Current Population Survey Integrated Public Use
Microdata Series (IPUMS-CPS), 2013
PEW RESEARCH CENTER

34
PEW RESEARCH CENTER
www.pewresearch.org
Detailed Characteristics of Working Mothers, 2012
All
Married w/ Working Husband Single Cohabiting
Married w/ Non-Working
Husband
All mothers 25,176,251 15,992,819 6,428,146 1,381,655 1,373,631
White 15,194,841 10,980,864 2,698,260 819,530 696,187
Black 3,412,427 1,170,019 1,871,525 167,684 203,199
Hispanic 4,537,371 2,444,263 1,494,549 282,395 316,164
Asian 1,500,699 253,322 169,225 56,814 130,309
Native born 20,182,618 12,737,655 5,319,846 1,177,014 948,103
Foreign born 4,993,633 3,255,164 1,108,300 204,641 425,528
Less than high school 1,912,393 858,940 736,633 136,898 179,922
High school diploma 5,694,936 3,079,054 1,860,675 396,025 359,182
Some college 8,074,523 4,570,335 2,523,062 613,341 367,785
Bachelor’s degree 9,494,398 7,484,490 1,307,775 235,391 466,742
18-24 years 1,406,040 375,648 773,534 202,226 54,632
25-34 7,516,045 4,471,668 2,119,055 581,852 343,470
35-44 10,056,755 6,818,369 2,257,016 434,427 546,943
45-54 5,555,595 3,910,533 1,123,459 153,186 368,417
55-64 598,872 386,853 146,046 9,964 56,009
65-69 42,944 29,749 9,036 0 4,159
Continued on next page
PEW RESEARCH CENTER

35
PEW RESEARCH CENTER
www.pewresearch.org
Detailed Characteristics of Working Mothers, 2012 (Continued)
All
Married w/ Working Husband Single Cohabiting
Married w/ Non-Working
Husband
Living with own child age 5 or younger 10,238,780 6,549,950 2,493,526 652,329 542,975
Living below poverty line 2,942,891 434,344 1,728,804 444,142 335,601
Received WIC or public assistance 428,161 66,460 271,419 41,086 49,196
Received alimony or child support income 2,940,421 567,408 1,935,424 348,725 88,864
Received income from family or friends 254,299 59,441 155,290 21,543 18,025
Notes: Based on mothers ages 18-69 with own child(ren) younger than 18 in the household. Mothers are
categorized based on employment status in 2012. Whites and blacks include only non-Hispanics. Hispanics are
of any race. “Married w/non-working husband” includes married mothers with absent husbands. WIC is the
government Special Supplemental Nutrition Program for Women, Infants and Children.
Source: Pew Research Center tabulations of the March Current Population Survey Integrated Public Use
Microdata Series (IPUMS-CPS), 2013
PEW RESEARCH CENTER

36
PEW RESEARCH CENTER
www.pewresearch.org
Appendix B: Time-Use Activity Classifications
Time-Use Activities for Paid Work, Housework, Child Care and Leisure
Time-use
classification Examples of activities included Code in ATUS
Paid work At work (main job or other jobs), work-related activities (e.g., socializing,
events, lunch with clients), other income-generating activities (e.g.,
making art for sale, playing in a band for pay), job searching and
interviewing, work-related travel
05 series,
180501-180599
Housework 02 series
Cleaning Laundry, cleaning
Cooking Food and drink preparation, presentation and cleanup
Management Household management, financial management, planning, pet care
Repair Interior and exterior maintenance, lawn, gardens, vehicles
Child care
0301-0303 series
180301-180304
Physical Physical care, providing medical care to children, travel related to
children’s health
Managerial Organizing/planning activities for household children, attending
children’s events, picking up or dropping off children
Recreational Playing with children, arts and crafts with children, playing sports with
children
Educational Reading to children, helping with children's homework, home schooling,
talking with/listening to children
Leisure
12 and 13 series
TV and other Television & movies, games, music, radio, computer use for leisure
Social Socializing, attending/hosting social events, relaxing, hobbies, reading for personal
interest, attending performing arts, museums
Sports Playing sports, biking, bowling, dancing, fishing, exercising, attending
sports/recreational events
Source: U.S. Bureau of Labor Statistics: American Time Use Survey Activity Lexicon 2003-2012.
PEW RESEARCH CENTER


