1
Nuclear Binding Energy, Fission and Fusion: Obviating a ‘Thermodynamic
Ponzi Scheme’. A Historical Perspective
SOSALE CHANDRASEKHAR
Department of Organic Chemistry, Indian Institute of Science, Bangalore 560 012, India
(E-mail: [email protected]; [email protected])
2
ABSTRACT
It is argued that the scale of atomic masses rests far too heavily on two possibly dubious
pieces of evidence. These are the nineteenth-century determination of the atomic weight of
hydrogen, and early mass spectrographic work on the determination of atomic masses. The
determination of the atomic weight of hydrogen is possibly prone to overestimation because
of adventitious enrichment in deuterium during the experimental procedure. The mass
spectrographic work is likely to be susceptible to both systemic and theoretical errors
deriving from the assumptions employed; it is also possibly enmeshed in the confusion
between the (then prevailing) chemical and physical scales of atomic weight. All these
ambiguities may well have led to a dubious confirmation of the atomic mass of hydrogen.
The idea of the ‘mass defect’, deriving from this work, formed a corner-stone of the
subsequently developed theory of the structure of the atomic nucleus. A particular problem
with the mass-defect idea is that, by mass-energy equivalence, heavier atoms would be less
stable than lighter ones. (Thus, the mass defect may well be an artefact deriving from the
inherent inaccuracies of early mass-spectrographic studies.) All this has apparently led to a
dubious theory of nuclear structure. Thus, the balance between the electrostatic and strong
forces should favour the latter with increasing atomic mass – contrary to current theory,
which apparently neglects to take account of the predominance of nearest-neighbour
interactions between nucleons. Consequently, the origins of nuclear energy, whether by
fission or fusion, seem unclear. Taken as a whole, these arguments indicate a fundamental
reappraisal of current theoretical ideas: It would appear that mass-energy equivalence may be
involved more fundamentally and insidiously in the generation of nuclear energy; it is also
possible that the radionuclides arise by the malformation of nuclei during their creation, a
consequence of their mass and size.
3
INTRODUCTION
The Atomic Idea
Dalton’s resurrection of the atomic hypothesis (1803), the philosophic roots of which lay
in classical Greece, symbolised the spirit of the Enlightenment. Dalton’s ideas were thus a
key element in a general efflorescence of intellectual culture, which indeed laid the
foundations of modern experimental and theoretical science.1
One of the key concepts that flowed from the atomic hypothesis was that of atomic
weight. In formulating the relative scale of atomic weights, Dalton was influenced to varying
extents by related – and often contemporaneous – developments in physico-chemical science.
In particular, the ideal gas law (Eqn. 1, the symbols have the usual meaning) and Avogadro’s
hypothesis were the critical enabling concepts that led to the modern idea of atomic weight.
The roots of Eqn. 1, in fact, lie in the kinetic theory of gases, and n may be considered as
representing the number of gas particles (atoms or diatomic molecules).
PV = nRT (1)
Thus, equal volumes of any two gases at the same pressure and temperature would
contain the same numbers of particles. (Avogadro’s Hypothesis; note that the gas constant R
cancels out in the ratio of volumes.) The ratio of the weights of two gases under these
conditions would provide the relative weight of a single particle. If one of the gases is taken
as an arbitrary standard, a scale of atomic weights can be set up. (The number of atoms in the
gas molecule can be estimated from the valence of the element: vide infra. This is only a
broad outline of the approach, the practical details being available in standard texts on
physical chemistry.)
Originally, Dalton chose hydrogen as the standard gas, as it is the lightest element and
simplified calculation of the atomic weights of other elements. Thus, with the atomic weight
of hydrogen assigned as 1, a scale of atomic weights was set up. Later (1860’s) it was found

4
more convenient to employ oxygen as a standard, particularly as it formed compounds more
readily (than hydrogen) with almost all elements. This enabled the determination of the
atomic weights of the solid elements, along with knowledge of the valence of the element
(indicated by the Law of Equivalents, 1792). The original atomic weight of oxygen (16 on the
hydrogen scale), however, was retained for convenience. The oxygen standard then held
sway for the next hundred years.
The early decades of the 20th
century saw momentous developments in the theory of
atomic structure, largely aided by brilliant experimental work. Earlier work on the nature of
electrical discharges in gases was extended to a study of external electrical and magnetic
fields in cathode ray tubes. Photographic capture of the resultant subatomic particles at the
receiving end in the tubes, allowed their trajectories and (ultimately) mass/charge (m/e)
values to be determined. These developments heralded the arrival of the first mass
spectrographs in the 1920’s. Clearly, no praise is too high for the inventive genius of the
brilliant pioneers of this era.
The determination of atomic masses with the mass spectrograph was now possible, and
led to the discovery of isotopes. The discovery of the neutron (1932) provided the necessary
insight into the structure of the atomic nucleus, and explained the existence of isotopes. Thus,
a picture of the atom – generally accepted to this day – emerged, in which a central nucleus
consisting of protons and neutrons was bounded by orbiting electrons. Whilst the number of
negatively charged electrons perforce equalled the number of positively charged protons, the
number of charge-neutral neutrons varied, not just from element to element, but also within
an element.
Thus, an element was characterised by a fixed number of protons (and electrons), which
was signified by its atomic number; the number of neutrons, then, characterised an isotope of
the element. Hydrogen, exceptionally, possessed no neutron, being composed of a proton and
5
an electron. (Deuterium and tritium, isotopes of hydrogen with 1 and 2 neutrons respectively,
were discovered later.) All other elements possessed both protons and neutrons in the
nucleus, with the ratio of these two ‘nucleons’ increasing with atomic weight in favour of
neutrons.
An important development was the realisation that the atomic weight of an element was
not a whole number, which is a consequence of the existence of isotopes. Thus, the atomic
weight was an average of the ‘atomic weights’ of all the isotopes of the element, weighted for
their relative occurrence (‘natural abundance’). (This was a blow to the 1815 ‘Prout’s Law’
which required integral atomic weights, apparently relative to the archetypal hydrogen atom.
Note that the atomic weight need not even be a constant, because of variations in the natural
abundances of the isotopes with location, terrestrial or not!) The ‘atomic weight’ of an
isotope (relative to oxygen as 16) was now designated as its ‘atomic mass’; closely related to
this was the ‘mass number’, equal to the total nucleon count.
It is opportune to take stock of four key conceptual signposts: Atomic number (number
of protons in the nucleus); atomic mass (mass of an isotope relative to the oxygen standard);
atomic weight (average of all the isotopic atomic masses of an element, weighted for natural
abundance); and mass number (total number of protons and neutrons in the nucleus). The
mass number (upper left-hand) and the atomic number (lower left-hand) are added to the
chemical symbol of an element as designations. (The latter is generally not shown, as it is a
constant for an element and hence superfluous in terms of identification.)
Current usage employs several closely related definitions, viz. relative atomic mass
(synonymous with atomic weight), relative isotopic mass, etc. These are now related to 12
C as
the standard. However, the above definitions are not only simpler but also accord with the
historical evolution of the relevant ideas (as is being sketched out herein), so have been
retained herein.
6
The near concordance between the atomic mass of an isotope and its mass number is
particularly noteworthy. This essentially arises because the atomic masses of both the proton
and the neutron are close to 1, and also because the electrons possess negligible mass. (Thus,
the atomic mass is practically identical to the nuclear mass.)
However, although it is entirely to be expected that the atomic weight would not be a
whole number (barring coincidence), the origin of the non-integral masses of the proton and
the neutron are apparently complex and debatable. In fact, they gave rise to the idea of the
‘mass defect’, of fundamental importance in the current theory of the atomic nucleus, and key
to the current theory of nuclear energy, as discussed below.
DISCUSSION
Atomic Weights and Masses
Clearly, the discovery of isotopes and the determination of their atomic masses would
have been practically impossible without the mass spectrograph. However, intriguing
questions remain about the manner in which the atomic masses were assigned their particular
numerical values, the sequence of events being particularly interesting and remarkable.
The initial assignments (~ 1925) were apparently made with the availability of the first
mass spectrographs of enhanced sensitivity (1 in 104). Thus, hydrogen was assigned an
atomic mass of 1.00778: curiously, practically identical to the then known classical atomic
weight value (1.008). This, in fact, was viewed as corroborating the mass spectrographic
value.
Furthermore, the mass spectrographs of the period, despite their sensitivity, apparently
failed to detect deuterium (2H), the heavier isotope of hydrogen. The existence of deuterium,
however, was suspected (based on the non-integral atomic weight of hydrogen), and was
proven ultimately (1932).

7
In fact, not only was this a few years after the above assignment of the atomic mass
(1.00778), but also before the isotopes of oxygen itself were discovered (1929). This is
particularly noteworthy because the classical chemical scale of atomic weights took the
atomic weight of naturally occurring oxygen as 16 (a whole number), i.e. without taking
cognisance of the existence of 18
O. The new physical scale based on mass-spectrographic
determination, apparently also took 16
O as the standard (again, apparently, 18
O was not
detected).
Thus, the chemical scale, although applying only to atomic weights, was prone to the
variation in the natural abundance of the oxygen isotopes; this, of course, would be in
addition to the variation in the isotopic natural abundances of the element in question. The
physical scale, essentially applying to the individual isotopes of an element, was free of these
inaccuracies. However, the averaged atomic weights obtained from the physical scale would
not accurately match the values of the chemical scale (for the aforementioned variation in
defining the oxygen standard).
All this, of course, is hindsight! At the time of the above assignments, the chemical and
physical scales, apparently, would have been considered equal as far as the oxygen standard
was concerned. Was this, then, the reason for ‘assigning’ the atomic mass of 1H a value
practically identical to its chemical atomic weight?
In fact, there are, in principle, two ways in which the atomic mass can be assigned in a
mass spectrograph. In one, essentially, the m/e ratio of each isotope can be calculated, and
converted to the mass by assuming the charge. Alternatively, an assignment can be made on
the basis of ‘prior knowledge’ against a standard, e.g., in the above case, assigning a value for
1H (1.00778) against
16O (16). The latter method would align the then evolving physical scale
with the established chemical scale.

8
Interestingly, a trend in the listing of atomic weights offers an important clue in this
regard. The aforementioned assignment of the atomic mass of hydrogen as 1.00778 implies
that all atomic masses less than that of 16
O (‘upstream’) would be overestimated, whereas all
those greater than that of 16
O (‘downstream’) would be underestimated, relative to the
respective mass numbers. This is because the initial assignment for 1H, an apparent
overestimation, establishes a linear scale in terms of distance from 16
O.
This distance (or length) was the basis for defining the
length representing unit atomic mass. Thus, the initial
assignment implied that unit length > unit atomic mass. In
other words, the length between 1H and
16O did not represent
the mass number difference (15) but the atomic mass
difference (16 – 1.00778 = 14.99222): Unit length now
represented (14.99222/15) = 0.9994813 mass unit. Note that
this ‘accumulates’, so the ‘offset’ depends on the particular
atom.
Based on this representation of atomic mass in terms of
unit length, elements ‘downstream’ from 16
O would suffer an
underestimation of their atomic masses relative to their
respective mass numbers. This is indeed what is generally
observed, as may be gleaned from readily available listings,
exemplifying data being shown in Table 1.
A possible explanation for this trend is that it is an artefact
arising from the initial ‘assignment’ of the atomic mass of 1H,
as argued at length above. Alternatively, of course, it could
represent a genuine trend deriving from inherent structural
Table 1
Atom Mass
4He 4.0026
9Be 9.0122
14N 14.003
16O 15.995
19F 18.998
23Na 22.991
31P 30.975
45Sc 44.956
75As 74.922
93Nb 92.906
159Tb 158.925
9
features of the atomic nucleus, particularly the manner in which the constituent nucleons are
packed together (vide infra).
Artefact or not? A decision on this intriguing question
must await the discussion below on the presumed significance
of the difference between atomic mass and mass number.
The Mass Defect Idea
An early explanation for the above trend was based on the
proposal of the ‘packing fraction’, which was an attempt to
reconcile the observed departures from the whole number rule
(cf. Prout’s Law above). In fact, this had resurfaced with the
discovery of isotopes in a new manifestation, which was
perhaps more reasonable than the previous form. Thus, the
expectation now was that the atomic masses would be whole
numbers. (Intriguingly, the packing fraction concept was
proposed before the neutron was discovered, so this period
presumably represented, conceptually, a middle ground vis-a-
vis Prout’s Law, involving the proton as the unit of nuclear
structure.)
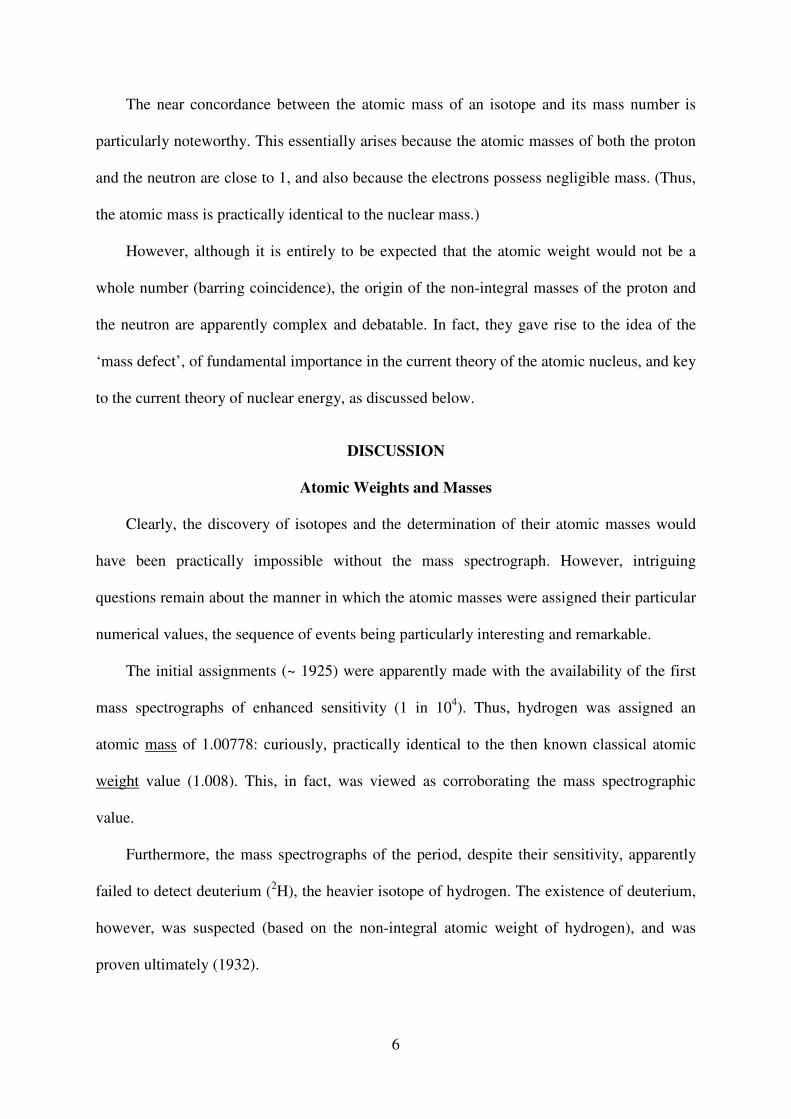
The packing fraction (PF) was defined in terms of a
fractional departure of the observed atomic mass (MAo) from
the mass number (MN; Eqn. 2, which is a later version
incorporating the neutron). Thus, the packing fraction for
various atoms was calculated, as shown in Table 2. (Hence PF
restates the trends in Table 1 above in quantitative terms.)
Table 2
Atom
Packing
fraction
(PF)
1H 77.8
4He 5.4
10Be 13.5
12C 3.7
14N 5.7
16O 0.0
19F 0.0
31P -5.6
75As -8.8
81Br -8.6
98Mo -5.5
10
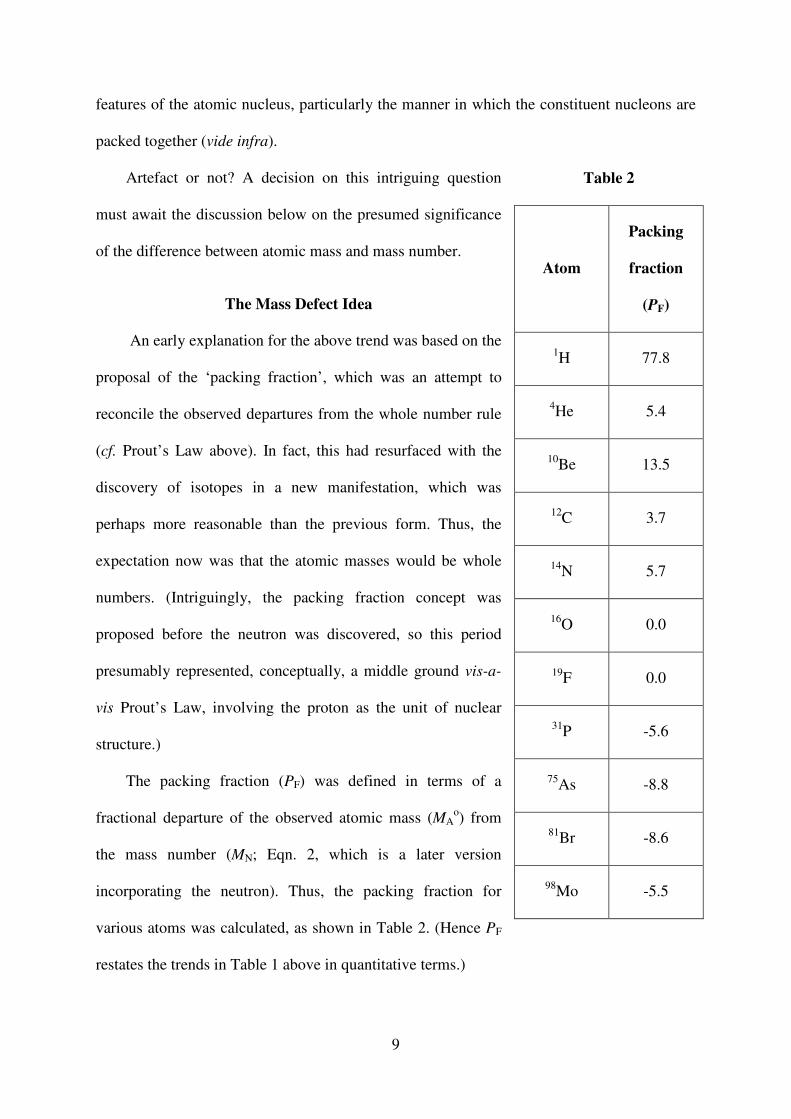
PF = (MAo – MN) x 10
4/MN (2)
It was proposed that these trends reflected the relative stability of the atomic nucleus in
various elements. The loss of mass as reflected in the PF value was believed to represent the
nuclear binding energy in terms of the mass-energy equivalence formula (Eqn. 3, m being
mass and c the velocity of light).
E = mc2 (3)
However, the PF = 0 by definition for the nucleus taken as standard (as for 16
O above).
Thus, the PF would represent only a relative binding energy (per nucleon), and would not be
valid in any absolute sense.
Later treatments apparently preferred the ‘mass defect’ criterion (MD), defined (per
nucleon) as in Eqn. 4. In this, MA is the atomic mass calculated from the known masses of the
constituent nucleons, MAo is the observed atomic mass and MN is the mass number.
MD = (MA – MAo)/MN (4)
This differs from the packing fraction in that the departure is essentially defined relative
to the calculated mass MA, rather than MN itself. It is noteworthy that MA is derived from the
observed mass of 1H (1.00778) and the related neutron mass (vide infra for a detailed
critique).
It is also noteworthy that the PF scale is essentially ‘anchored’ at 16
O, so the differences
between the expected and observed mass values are proportional to ‘distance from anchor’.
On the ‘upstream’ side the scale terminates with a maximum difference at 1H. On the
‘downstream’ side the differences take on negative values, but their absolute magnitudes
increase with ‘distance from anchor’. (The PF scale, apparently, is based on an idealised
building block with a mass of exactly 1.0 relative to 16
O, a notion that is a relic of Prout’s
Law.)
11
Table 3
Item No.
Atom (Isotope)
Atomic Weight (Year)
1900 1925 1961
1 9Be 9.1 9.02 9.0122
2 19
F 19.05 19.00 18.9984
3 23
Na 23.00
(1909)
22.997 22.9898
4 27
Al 27.1 26.97 26.9815
5 31
P 31.0 31.027 31.9738
6 45
Sc 45.1 45.10
(1921)
44.956
7 55
Mn 55 54.93
(1909)
54.9380
8 59
Co 59.0 58.94 58.9332
9 75
As 75.0 74.96
(1910)
74.9216
10 89
Y 89.0 88.9 88.905
11 93
Nb
93.7 93.3
(1931)
92.906
12 103
Rh
103.0 102.91 102.905
13 133
Cs
132.9 132.91
(1934)
132.904
14 141
Pr 143.6
(1897)
140.92 140.907
14 159
Tb
159.2
(1907)
158.88
(1953)
158.924
15 165
Ho
163.5
(1913)
164.94
(1941)
164.930
16 169
Tm
171
(1903)
169.4 168.934
17 197
Au
197.2
(1900)
197.0
(1953)
196.967
The MD scale, however, is essentially ‘anchored’ to the observed masses of the nucleons
(which go into calculating MA). These, along with the MAo values, are ‘taken’ from the PF
scale, i.e. are related to 16
O. Since these (MAo) are continuously decreasing relative to the

12
corresponding MA values, MD increases with nuclear mass. This is because MA > MN, and the
difference (MA - MN) increases with MN; MAo > MN (‘upstream’) and MA
o < MN
(‘downstream’) relative to 16
O, but the difference (MAo - MN) steadily decreases with MN.
However, there are serious ambiguities plaguing the mass defect (MD) scale, the prime
among them being that MA may not be calculated for 16
O, which by definition is 16.00. Thus,
the initial assignment of the mass of 1H (1.00778) is itself based on
16O = 16.00, so this fixes
both the masses! This means that the scale of MA values relates to the mass of 1H (1.00778),
whereas the scale of MAo values relates to the mass of
16O (16.00). Thus, the mass defect
(Eqn. 4), comprising both MA and MA
o values, is unviable in itself.
Atomic Weights and Atomic Masses
Interestingly, the classical atomic weight of hydrogen dates back to 1894 (around the
time the 16
O scale was adopted). It may appear that the later mass spectrographic
determinations confirmed the non-integral value, and thus indicated that the idea of the mass
defect had a sound chemical basis. The arguments are complicated as the original non-
integral atomic weights were later deemed non-integral because of the existence of isotopes.
In the case of hydrogen, deuterium had not been detected by the early mass spectrographs, so
the non-integral atomic weight of hydrogen led to the idea of the mass defect.
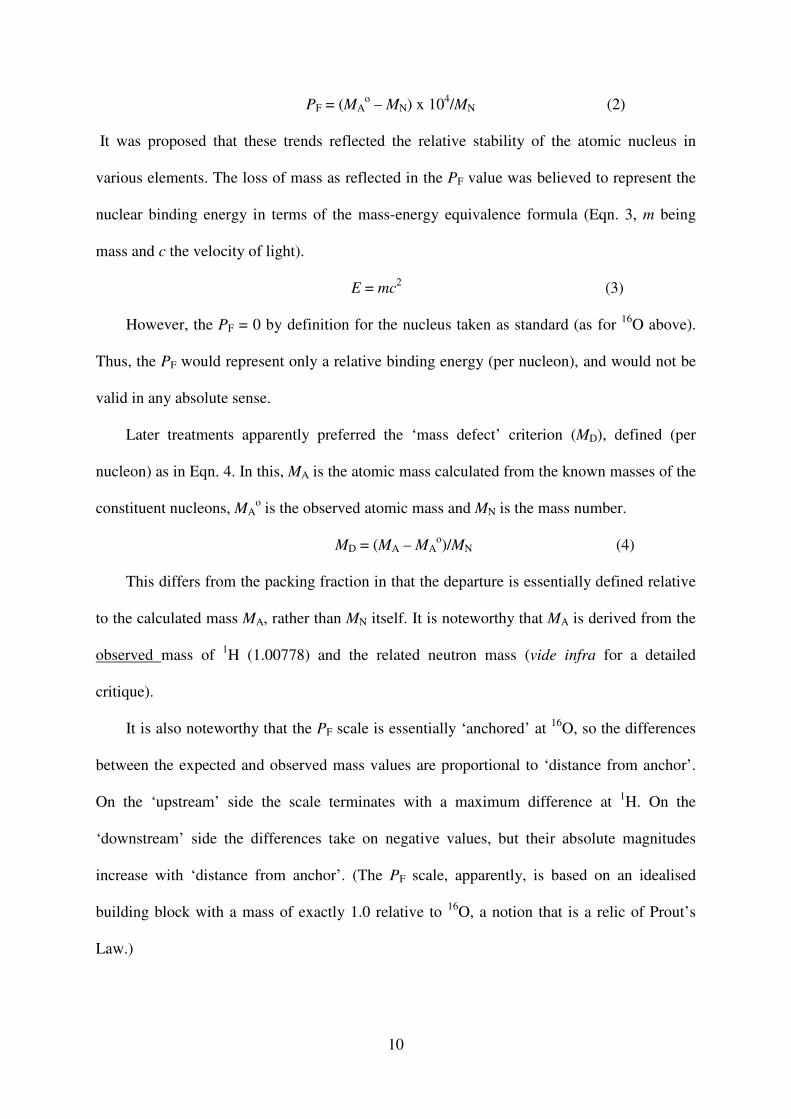
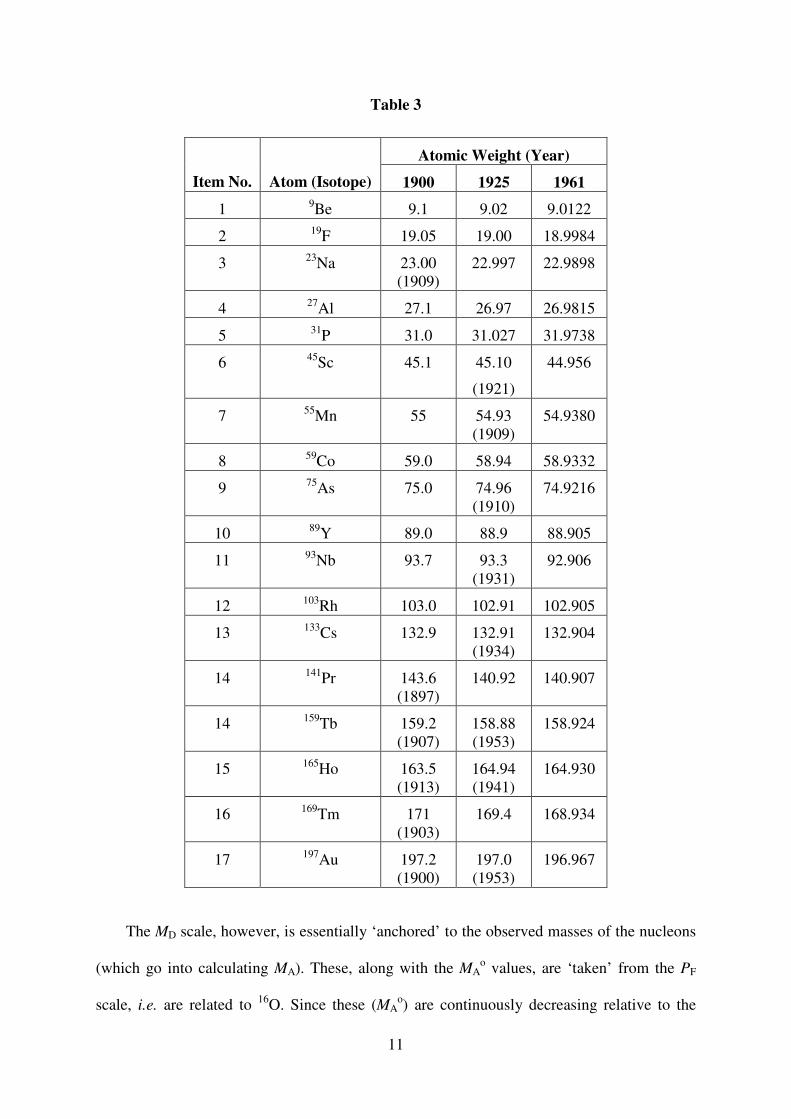
However, it is noteworthy that a large number of classical atomic weights – of elements
which possessed only a single stable isotope – not only possessed non-integral values but also
often exceeded the corresponding mass numbers. Table 3 lists the atomic weights of the
common elements which possess a single isotope that occurs in 100% natural abundance.2
Thus, these fractional values would represent either genuine departures from the whole
number rule or experimental error.
This is interesting in light of the later finding that atoms ‘downstream’ from 16
O
possessed atomic masses below their expected integral values (purportedly by the mass

13
defect). This raises the question whether the classical atomic weight of hydrogen, which was
in excess of 1, reflected experimental error! If so, the later mass spectrographic
‘corroboration’ is bound to be dubious.3
In other words, the classical atomic weights generally indicate no mass defect, as almost
all values – not just for hydrogen – were generally overestimations relative to the mass
spectrographic ones.
The change in the atomic weight as a function of the year of determination (Table 3), to
reiterate, indicates that almost all the classical values (~ 1900) overestimated the atomic mass
regardless of the mass number. Interestingly, the 1925 values – around the time of the first
mass spectrographic reports – show a downward trend. This is further exacerbated in the
1961 values (now relative to 12
C).4
It is also noteworthy that, prior to the discovery of isotopes, deviations from Prout’s Law
had been accepted – perhaps grudgingly – although they remained mystifying, all the same.
Ironically, however, Prout’s Law apparently acquired renewed significance with increasing
knowledge of atomic structure, as it was now incumbent on the investigator to explain why
Prout’s Law was not obeyed in the case of atomic masses, if the proton and the neutron were
the basic building blocks! (Thus, if 16
O possessed an integral mass equal to 16, then its
building blocks too should possess integral fractions of this.)
The mass defect idea perhaps evolved in response to this need. However, the question of
the origin of these minuscule variations, whether in the classical values (in Table 3) or the
mass spectrographic determinations, remains: are the determinations accurate enough to rule
out the possibility of experimental errors? (Thus, was Prout’s Law perhaps abandoned in
haste? It is particularly noteworthy that assigning the atomic mass of 1H as 1.00778 and that
of 16
O as 16, ineluctably leads to the mass defect idea.)

14
Nuclear Binding Energy
The currently accepted explanation for the above trends in the PF and the MD values is
that they represent nuclear binding energy, via the mass-energy equivalence relation proposed
by Einstein (Eqn. 3).
Thus, the difference in mass corresponds to the energy that was ‘lost’ when the nucleus
first formed from the composite free nucleons. This, then, represents the binding energy of
the nucleus. This explanation was proposed along with the PF, and so dates back to the early
years of the mass spectrograph. These ideas were apparently bolstered by parallel
developments in radioactivity and nuclear fission, and thus struck deep roots in the
conceptual firmament of modern physics and chemistry. (They also – ostensibly, as it now
appears – represented an early success of Eqn. 3.)
A key problem with invoking the mass-energy equivalence idea in this manner is that it
also implies that the heavier nuclei are relatively less stable. (Greater mass is associated with
higher energy content by Eqn. 3.) The energy corresponding to the mass defect is but a
fraction of the total nuclear mass, as revealed by Eqns. 2 and 4 (MN being nearly identical
with the atomic mass). Thus, the increase in MD with nuclear mass – supposedly representing
enhanced nuclear binding – would be subsumed in the increase in energy due to the
corresponding increase in atomic mass.
Yet, it is believed that the MD estimates the nuclear binding energy via Eqn. 3, as
depicted in the familiar binding energy diagram (Fig. 2). This is believed to indicate that the
nuclear binding energy increases steeply for the lighter atoms up to 16
O; it then increases less
steeply – curving gently, in fact – to reach a maximum at 56
Fe; the line thence descends
slowly towards the uranium isotopes.
This behaviour is explained by current theory on the basis of a balance between two
forces acting in opposition within the confines of the atomic nucleus. One of these is the

15
electrostatic force (EF), derived from the repulsion between the positively charged protons;
the other is believed to be the strong nuclear force (NF), which binds all nucleons together.
Also, the EF is a longer range force, whereas the stronger NF wanes relatively rapidly with
distance.
Thus, in the lighter nuclei, the NF is believed to predominate, so binding energy steadily
increases (up to 56
Fe). Beyond this, however, and because of the increase in nuclear size, the
NF weakens and yields (to an extent) to its repulsive counterpart, the EF; thus, in the heavier
elements (beyond around 56
Fe), the overall binding energy begins to decrease with atomic
mass. (However, vide infra for a critique.)
An Alternative Possibility
However, an alternative explanation for the profile in Fig. 2 is also possible. In this, the
mass defect relationship (Eqn. 4) is treated as a purely mathematical function, without any
assumptions about nuclear stability and binding energy.
For this, it would be useful to recast Eqn. 4 into Eqn. 5; in this, the ratio (MA/MN) defines
the average nucleon mass (Mav), and the ratio (MAo/MN) is represented by the variable x.
MD = (MA/MN) – (MAo/MN) = (Mav – x) (5)
Mav = (MA/MN) = (MnNn + MpNp)/(Nn + Np) (6)
These definitions arise as MA is the calculated mass based on the masses of the proton
and the neutron, and MAo is the observed atomic mass which is related to the mass number
(MN) by a factor which is characteristic for each nucleus (cf. Table 1).
Also, Mav can be expanded as in Eqn. 6; in this, MA = (MnNn + MpNp) and MN = (Nn +
Np), Mn and Mp being the masses of the neutron and the proton respectively, and Nn and Np
the numbers of neutron and proton respectively. Eqn. 6 can be recast into Eqn. 7, by dividing
both numerator and denominator by MnNn, and representing (Mp/Mn) by y and (Np/Nn) by z.
Eqn. 7 leads to Eqn. 8, which relates MD to MN, x, y and z.

16
Table 4
Atom z (Np/Nn) Mav x (MAo/MN) MD (Mav-x)
4He 1.00 1.007970 1.00065 0.00732
9Be 0.80 1.008047 1.00136 0.00669
14N 1.00 1.007970 1.00021 0.00776
16O 1.00 1.007970 0.99969 0.00828
19F 0.90 1.008007 0.99989 0.00812
23Na 0.92 1.008000 0.99961 0.00839
31P 0.93 1.008000 0.99919 0.00881
45Sc 0.88 1.008015 0.99902 0.00900
56Fe 0.87 1.008015 0.99884 0.00918
75As 0.79 1.008052 0.99896 0.00909
93Nb 0.79 1.008052 0.99898 0.00907
112Cd 0.75 1.008070 0.99913 0.00894
159Tb 0.69 1.008098 0.99953 0.00857
235U 0.64 1.008123 1.00019 0.00794
17
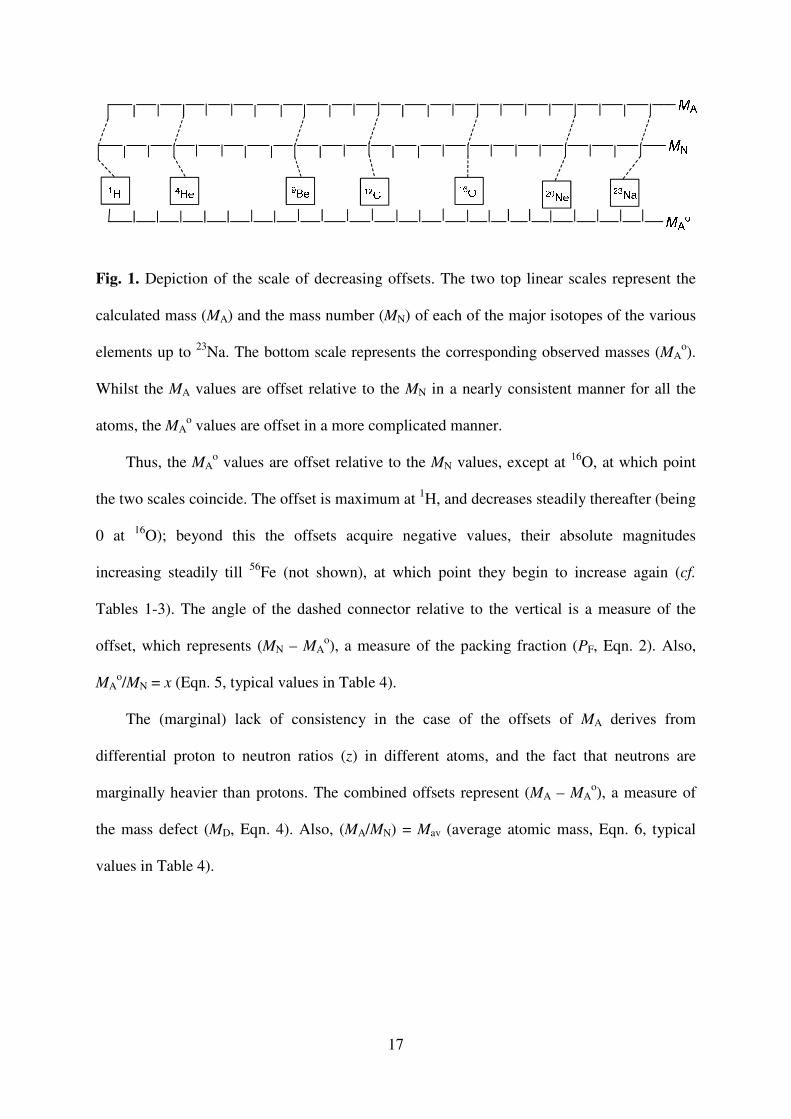
Fig. 1. Depiction of the scale of decreasing offsets. The two top linear scales represent the
calculated mass (MA) and the mass number (MN) of each of the major isotopes of the various
elements up to 23
Na. The bottom scale represents the corresponding observed masses (MAo).
Whilst the MA values are offset relative to the MN in a nearly consistent manner for all the
atoms, the MAo values are offset in a more complicated manner.
Thus, the MAo values are offset relative to the MN values, except at
16O, at which point
the two scales coincide. The offset is maximum at 1H, and decreases steadily thereafter (being
0 at 16
O); beyond this the offsets acquire negative values, their absolute magnitudes
increasing steadily till 56
Fe (not shown), at which point they begin to increase again (cf.
Tables 1-3). The angle of the dashed connector relative to the vertical is a measure of the
offset, which represents (MN – MAo), a measure of the packing fraction (PF, Eqn. 2). Also,
MAo/MN = x (Eqn. 5, typical values in Table 4).
The (marginal) lack of consistency in the case of the offsets of MA derives from
differential proton to neutron ratios (z) in different atoms, and the fact that neutrons are
marginally heavier than protons. The combined offsets represent (MA – MAo), a measure of
the mass defect (MD, Eqn. 4). Also, (MA/MN) = Mav (average atomic mass, Eqn. 6, typical
values in Table 4).
18
56Fe
235U
BE
MN
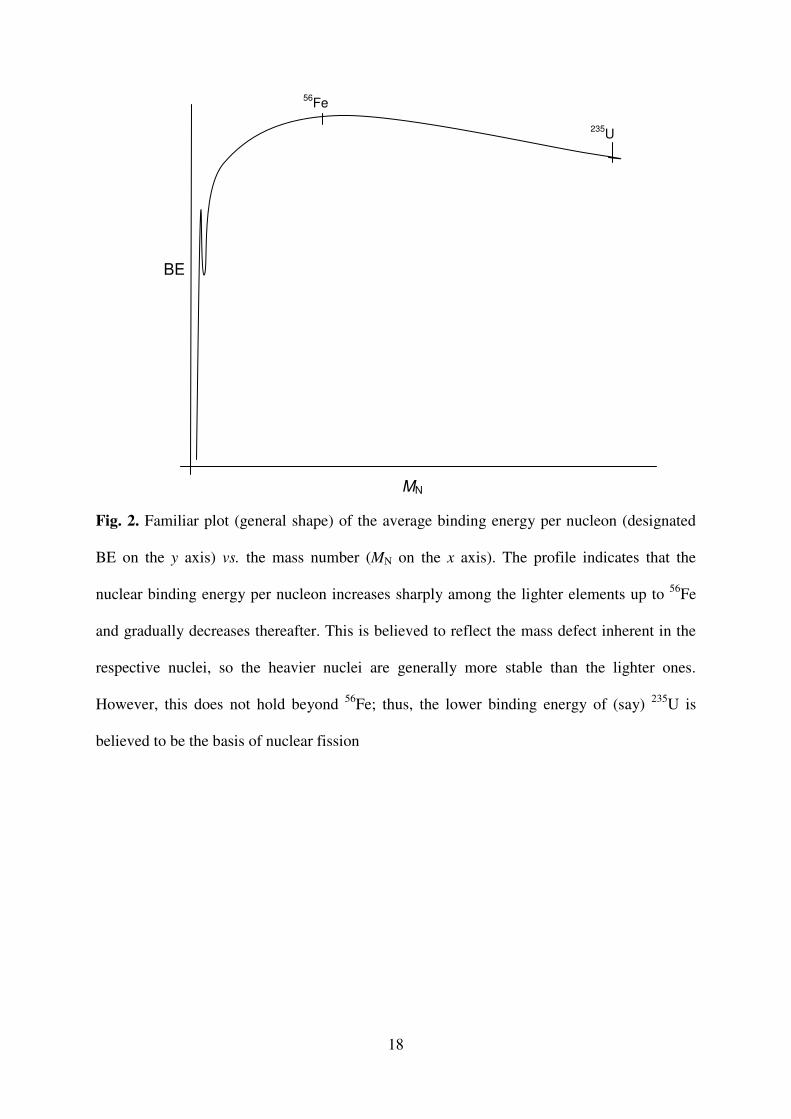
Fig. 2. Familiar plot (general shape) of the average binding energy per nucleon (designated
BE on the y axis) vs. the mass number (MN on the x axis). The profile indicates that the
nuclear binding energy per nucleon increases sharply among the lighter elements up to 56
Fe
and gradually decreases thereafter. This is believed to reflect the mass defect inherent in the
respective nuclei, so the heavier nuclei are generally more stable than the lighter ones.
However, this does not hold beyond 56
Fe; thus, the lower binding energy of (say) 235
U is
believed to be the basis of nuclear fission

19
Mav = (Mn)[1 + (Mp/Mn)(Np/Nn)]/[1 + (Np/Nn)] = (Mn)(1 + yz)/(1 + z) (7)
MD = [Mn(1 + yz)/(1 + z)] - x (8)
Note that y (Mp/Mn) is a constant (= 0.9986235). However, both x and z (Np/Nn) vary, z
rather more than x (cf. Table 4), and these determine the variations in MD. The x can be
obtained from the data in Table 1, by dividing the observed atomic mass by the
corresponding mass number; the resulting values are listed in Table 4 (along with z, Mav and
MD). In Eqn. 8, the factor (1 + yz)/(1 + z) would be marginally less than 1, as y = 0.999821.
In Eqn. 5, Mav is calculated from the known masses of the proton and the neutron. On the
other hand, x is essentially a function of the offsets of MAo relative to MN that – in principle –
decrease steadily (cf. Fig. 1). However, it is observed that x reaches a minimum at 56
Fe, and
thence increases again. This, of course, relates to the characteristic decrease in the binding
energy profile in Fig. 2 (beyond 56
Fe).
Mav
MN
Fig. 3. Plot (general shape) of the average nucleon mass (Mav, cf. Eqn. 7) vs. the mass number
(MN)

20
x
56
Fe
MN
Fig. 4. Plot (general shape) of x (MAo/MN, cf. Eqn. 7) vs. MN (MA
o is the observed atomic
mass and MN the atomic number)
Interestingly, plotting Mav vs. MN leads to the curve in Fig. 3; plotting x vs. MN leads to
the curve in Fig. 4. Thus, apparently, Mav by itself partly captures the overall profile of Fig. 2:
in other words, the shape of this profile is, to an extent, due to the relative increase in the
neutron content in the heavier nuclei (decrease of z, as reflected in the increase in Mav). Thus,
this analysis of the data in Table 4 leads to the profile in Fig. 2 only for the case of the lighter
elements. The abrupt decrease in MD beyond 56
Fe is not replicated by the above theoretical
analysis based on Eqn. 8. These trends, therefore, are likely to be due to other effects as
discussed below.
Possible Mass Spectrographic Inaccuracies
Early mass spectral studies, although characterised by great experimental ingenuity,
were possibly plagued by errors and inaccuracies. Whilst many of these were unavoidable
during the pioneering years, and were indeed appropriately addressed, a few may have

21
escaped due scrutiny. Two in particular are noteworthy, as they may well bear upon the
above problems.
Firstly, the theoretical basis of the mass spectrograph, that the extent of deflection of a
magnetised particle in an external magnetic field is inversely related to the mass of the
particle, may be oversimplified. This is because a heavier particle would offer greater inertial
resistance than a lighter one. This would curtail the extent of deviation of the heavier particle.
The inertial resistance – representing a ‘stickiness’ – is generally to be expected
whenever a moving body changes its path. In the general case, this largely arises from
interactions (friction, etc.) between the moving body and the surrounding medium. The
particles in a mass spectrograph, of course, move in a vacuum. However, the external
magnetic field may be considered the ‘medium’, in the sense that particles of different mass,
size and polarisability interact differently with it. This is usually neglected, but may well exist
and effect fine changes in trajectory.
The gross deviations are described as in Eqn. 9, wherein H is the strength of the external
magnetic field and r is the radius of curvature of the parabolic path adopted by the particle,
m, e and v being the mass, charge and velocity associated with the particle.
m(v/eH) = r (9)
If v, e and H are held constant, a linear relationship exists between m and r. Thus,
heavier particles suffer smaller deviations (larger r). By the above arguments, the inertial
resistance should marginally increase r further, leading to correspondingly larger observed
masses. Perhaps a relation of the form in Eqn. 10 would better explain the observations (p is a
constant, 0 ≤ p ≤ 1).
m(1+p)(v/eH) = r (10)
The ‘inertial drift’ is represented by the term ‘mp(v/eH)’ and would gain importance
with increasing m. This may well be contributing to the apparently smaller ‘mass defects’

22
observed in the case of the heavier atoms beyond 56
Fe, as discussed above. (The ‘inertial
drift’ would be weaker in the lighter elements, and thus subsumed in the other changes
discussed above.)
It is also noteworthy that the purported ‘inertial drift’ is apparently associated with
relatively large neutron content (i.e. lower z values in the heavier elements, cf. Table 4). This
means a relatively lower charge density in the nucleus, possibly leading to a smaller
‘secondary deviation’ in the trajectory. ‘Secondary deviation’ here implies that the ‘primary
deviation’ arises from the magnetic moment of the particle derived from the overall positive
charge on the atom (as a result of the loss of an electron during ionisation). Hence, the
‘secondary deviation’ possibly represents a minor contribution arising from the nuclear
charge. Also, the polarisability of the atom’s electron cloud may influence the extent of the
deflection. (All these secondary effects contribute to ‘p’ in Eqn. 10.)
Secondly, the assumption that relative deviations can be related to the relative r values
(Eqn. 9) can be a serious source of error. Thus, it is believed that the spacing between two
lines can be related to the difference between two r values, which then leads to the difference
between the two masses (m values). However, this would be only valid if the r values
represent radii derived from concentric circles, i.e. with a common centre.
This is, of course, impossible in practice, as the ions (in effect) exit from a common
source. Thus, the trajectories can only be related to parts of intersecting circles without a
common centre. In fact, Eqn. 9 is derived on the basis of the presumed circular motion of
each ion, i.e. each trajectory being part of an independent circle. The placement of the
detecting photographic plate (or a luminescent screen) also assumes importance, as the angle
it subtends with the incoming rays also determines the line spacing. This is because the
trajectories diverge from a common source point, so the projection of their relative position
would depend on the angle of projection. (These arguments are represented in Fig. 5.)

23
Fig. 5. (a) Two mass spectral ion trajectories emanating from a common source. The two
straight lines represent a recording plate or screen at two different angles. Different line
spacings are projected onto the plate. (b) Two concentric circles with a common centre. The
difference in the radii can be related to the difference in the masses of two ions which adopt
the two circular paths. (c) Two intersecting circles as opposed to the case in (b). These have
no common centre, hence, in the case of two circulating masses, the difference in masses
cannot be simply related to the difference in radii, which is not easily determined. This is
similar to the case shown in (a)
Finally, early studies apparently do not pay sufficient heed to the level of accuracy in the
various terms involved in the equation describing the deflection. Thus, although the final
atomic mass is cited to 6 significant digits, the magnetic field strength and the electric field
were not always defined to the same accuracy. By Eqn. 9, m may not be determined to a
higher level of accuracy than either H or r.
In fact, the thickness of the observed lines may not allow the level of accuracy claimed
in the final masses. Even if these lines are well separated, the accuracies of the separations
would be limited by the thickness of the lines themselves! Taking the mid-point of each line
only leads to the average value of the spacing between them, and does not eliminate the error
per se.
These arguments also apply to the widely-used high resolution mass spectrometric
determination of atomic masses. Although this apparently leads to the correct results in terms
of the elemental composition of the molecular ion, the apparent success may be largely based

24
on empirical correlations. Thus, different molecular ions with ‘identical mass’ (identical MN
values) would differ in terms of their interaction with the external magnetic field, as argued at
length above. This would partly reflect the ‘mass defect’ in the exact masses of the
constituent atoms.)
Mass Defect and Nuclear Binding Energy: Fact or Fiction?
The above extended arguments have traced the origins of the mass defect idea and its
evolution to current status as the basis of nuclear structure and energy. It appears, however,
that fundamental questions remain as to the validity of this basis. Perhaps unsurprisingly,
then, the current theory of nuclear structure itself raises questions not easily answered, as
discussed below.
A particular problem, as noted above, is that the mass-energy equivalence idea enshrined
in Eqn. 3 implies that atoms of higher mass possess more energy than those of lower mass.
This flies in the face of the current view that – generally – the heavier atoms are more stable,
as indicated in Fig. 2. The increase in the purported mass defect would be but a minuscule
fraction of the increase in mass – and its equivalent in energy by Eqn. 3 – on going from one
element to the next higher in atomic mass.
Furthermore, current theory posits a balance between the strong nuclear force (NF) and
the electrostatic force of repulsion (EF) between the constituent protons. Both wane with
increasing distance, but NF more rapidly. The result is that NF predominates at shorter
distances, whereas EF predominates at larger distances. Intriguingly, this is believed to
support the mass-defect idea and Fig. 2: as an increase in nuclear mass is accompanied by a
corresponding increase in size, so EF gains, gradually and incrementally, over NF. Ultimately,
the incremental repulsive force (EF) overtakes the strong force (NF) at 56
Fe, beyond which the
nuclear binding energy decreases steadily.
25
A serious problem with this view is that an increase in nuclear mass (by the addition of a
nucleon) results in an increase in both short-range and long-range interactions with other
nucleons. The short-range interactions – with ‘nearest-neighbour nucleons’ – would be far
greater than the long-range interactions with remote nucleons. The short-range interactions
would be dominated by the strong force (NF), hence would be strongly attractive in the sum.
The long-range interactions would be less attractive than the short-range ones in the medium-
sized nuclei, but would be dominated by the repulsive force in the larger nuclei (i.e. EF > NF).
However, this would be overwhelmed by the short-range, net-attractive forces between the
nearest-neighbour nucleons.
Thus, current theory is likely flawed by the neglect of this dominant short-range
interaction, possibly because it relies implicitly on the mass-defect idea. Interestingly, it is
currently believed that in nuclear fission the product nuclei are more stable by virtue of the
mass defect (as in the case of the fission of 235
U, cf. Eqn. 11). However, the collapse of the
mass defect idea, as discussed at length above, invalidates this argument. Also, although a
heavier atom would possess higher energy (by Eqn. 3), overall mass is conserved in the
products of the fission process (e.g. Eqn. 11). Thus, apparently, this cannot be the source of
fission energy.
235
U → 92
Kr + 141
Ba + 2n (11)
It is, of course, possible that the product nuclei in a fission reaction are indeed more
stable than the original nucleus, for reasons other than the mass defect. Alternatively, a
process as yet unrecognised may be involved. An intriguing possibility would be the
conversion of a part of the mass of a neutron into energy, the fission process then providing a
pathway for this conversion. (Fission, of course, is accompanied by an increase of entropy,
but this would be too minuscule to account for the observed energy released.)
26
As argued at length above, mass-energy equivalence (Eqn. 3) implies that larger, heavier
nuclei should be less stable than smaller, lighter nuclei, in general: Thus, fission should be
observed even among the lighter nuclei. However, this by itself would not generate energy as
mass would be conserved in the process (implying an equilibrium constant of unity).
It is also particularly noteworthy that, although the binding energy is believed to
decrease for nuclei heavier than 56
Fe, it is still much higher relative to many of the lighter
nuclei! This indicates that the instability of the radionuclides does not derive from the
purported mass defect. It would appear that these nuclei are malformed and hence metastable,
perhaps because of their size. Possibly, the likelihood of malformation increases with mass
and size, because of the need for precise incorporation of the nucleons and consequent
structural organisation of the nuclei during their creation. (Analogous chemical phenomena
involve the malformation of crystals, super-cooling and glass formation, polymorphism, etc.)
The interpretation of the mass-energy equivalence principle (Eqn. 3) may indeed be
subtle. All the same, the above discussion indicates that the origins of fission energy are as
yet unclear. Further discussion, however, is clearly beyond the scope of this paper.
CONCLUSIONS
The assignment of the atomic mass of hydrogen, based on early mass-spectrographic
work, represented a conceptual watershed in the history of science. In enforcing the
abandonment of Prout’s Law – which required integral values for atomic weights, and by
later implication, for atomic masses – it imparted a new and revolutionary meaning to the
idea of the atom itself. In particular, it seminally influenced the development of the theory of
the atomic nucleus by introducing the idea of the ‘mass defect’. This, in conjunction with the
mass-energy equivalence principle proposed by Einstein, lead to the current theory of nuclear
binding energy, apart from indicating the nature and significance of radioactivity.

27
However, the accuracy of the mass spectrographic work is apparently not beyond doubt.
Also, importantly, the sequence of events leading up to the assignment of the atomic mass of
hydrogen is intriguing, as it predated the detection of both 2H and
18O. The assignment to the
mass of 1H a value practically identical to the then known atomic weight of hydrogen is also
curious and intriguing. It raises the possibility that the assignment may have been influenced
by a need to align the evolving physical scale of atomic masses with the established chemical
scale of atomic weights. All this indicates that the basis of the mass defect – itself of key
importance in the current theory of nuclear structure and energy – is possibly not beyond
doubt.
These doubts are apparently reinforced by the possibility that, by mass-energy
equivalence, heavier atoms would generally be unstable relative to lighter ones. This would
very effectively overcome the purported mass defect criterion of nuclear stability, and clearly
invalidate currently held views on the nature and origin of the nuclear binding energy. Thus,
it would appear that current theory leans too heavily on early work, which, despite its
pioneering brilliance, was possibly not without flaw. (It seems that the high resolution mass
spectral technique of determining molecular elemental composition, an important spinoff of
the early mass spectral studies, has an empirical basis.)
Furthermore, the nature of the two nuclear forces – the repulsive electrostatic force (EF)
between the protons and the attractive strong force (NF) between all nucleons – raises several
questions. Current theory is apparently flawed in neglecting short-range interactions in the
heavier nuclei, possibly in order to conform to the mass defect idea. These arguments raise
fundamental questions about the nature and the origin of the energy released in the process of
nuclear fission.

28
NOTES
1. In view of the contentious nature of the arguments presented herein, no references are
listed (except for ref. 2), in order to avoid acrimony and misunderstanding with selected
authors. The arguments are based on information readily available in a variety of standard
sources and text books.
2. Coplen, T. B.; Peiser, H. S. Pure Appl. Chem. 1998, 70 (1), 237-257.
3. Admittedly, however, the atomic weight of natural hydrogen, i.e. including deuterium, and
based on integral atomic masses, is calculated to be 1.00043. This is well below the classical
value of 1.008, and could be viewed as supporting the mass defect idea in the heavier atoms.
Alternatively, it could also indicate experimental error. (Natural abundance values of
99.985% for 1H, 0.015% for
2H, 99.759 for
16O, 0.204 for
18O and 0.037 for
17O were
assumed in the above calculation.)
In fact, a highly likely source of error derives from the greater density of deuterium (D2)
relative to hydrogen (H2). Classical atomic weights were determined by the vapour density
method (particularly for gases), employing large glass globes. It involved the repeated filling
and refilling of the globes by the gas in question that was (presumably) prepared, purified and
stored prior to the determinations. The repeated operations of sweeping out the gases in the
globes would have lead to a gradual enrichment of the stored hydrogen in deuterium. (This is
because of the existence of a density gradient, and also assuming the gas was drawn out from
the top of the stored container). Thus, the resulting atomic weight would not reflect the
normal abundance values of deuterium, but would lead to a positive error. A considerable
part of the deviation from Prout’s Law in the classical atomic weight of hydrogen may well
be due to this, noting that a three-fold enhancement in the deuterium content over the natural
value would fully account for the observed deviation (i.e. the value of 1.008).
29
Another likely source of error derives from the purification procedures employed in the
preparation of hydrogen. Usually, hydrogen was prepared by the action of dilute sulphuric
acid on zinc and purified elaborately by passing through tubes containing: lead nitrate (to
remove H2S), silver sulphate (to remove arsine, stibine, etc.), caustic potash (thrice, to
remove acid vapours), concentrated H2SO4 and P2O5 (for drying). It seems likely that many
of these purifying reagents would adsorb hydrogen itself to varying extents. Also, H2 is
generally more reactive than D2 because of an expected isotope effect, leading to a
corresponding enrichment of the sample in favour of deuterium.
4. There have been essentially three changes in the reference standard for atomic weights and
masses. The first was from hydrogen (1.0) to oxygen (16.0) which occurred in 1894, i.e. prior
to the discovery of isotopes, so these refer to classical atomic weights. The second was from
the chemical to the physical scale, which occurred with the arrival of the early mass
spectrographic results (~1925). These are now relative to 16
O, and refer to atomic masses of
individual isotopes. The third was from the 16
O standard to the 12
C standard (1961).
Interestingly, the first of the above changes would, in principle, not alter the values of
the atomic weights. This is because – as far as was known – neither hydrogen nor oxygen,
apparently, deviated from Prout’s Law. Thus, the values listed for these in 1892 were 1.00
and 16.00 respectively. (However, several other elements deviated, often substantially, from
Prout’s Law.) Intriguingly, the 1894 values for hydrogen and oxygen are listed as 1.008 and
16.000 respectively. The deviation from Prout’s Law in the case of hydrogen presumably
reflects enhanced confidence in the determinations.
The second of the above changes would, in principle, alter the earlier values of atomic
weights. This is because of the realisation of the existence of isotopes of both hydrogen and
oxygen (although early mass spectrographic results did not indicate this). As improved mass
spectrographic results emerged, it became apparent that the new atomic mass values would be
30
substantially different for two reasons, viz. the earlier atomic weights were weighted averages
of atomic masses, which themselves apparently flouted Prout’s Law (purportedly the mass
defect).
The inclusion of the mass of 2H into the weighted-average atomic weight of hydrogen
leads to a value of 1.0002. Clearly, the presence of deuterium makes only a marginal
contribution to the substantial deviation from Prout’s Law seen in the 1894 value of 1.008.
The inclusion of 18
O into the averaged atomic weight of oxygen, likewise, leads to a value of
16.0045. This would alter the earlier atomic weight values upward by a factor of 1.00028,
and would embody the new physical scale.
The third of the above changes eliminated the ambiguity between the earlier chemical scale
(relative to natural oxygen, i.e. a mixture of isotopes) and the new physical scale (relative to
16O). This required defining a new standard that was both widely prevalent and easily
determined. Thus was 12
C chosen and assigned a value of 12.0000. This entailed a downward
revision of the atomic masses, and consequently the atomic weights too, as the atomic mass
of 12
C relative to 16
O in the earlier physical scale was 12.0036.


