
Nowcasting Thunderstorm Potential from Satellite
Robert M Rabin
NOAA/National Severe Storms LaboratoryNorman, OK USA
Cooperative Institute for Meteorological Satellite StudiesUniversity of Wisconsin
Madison, WI USA

●1951 FAWBUSH AND MILLER ESTABLISHED SEVERE STORMS
FORECAST CENTER FOR AIR FORCE FACILITIES IN 48 STATES
●1952 WBAN ANALYSIS CENTER SEVERE STORMS FORECAST UNI
●1952 FIRST WATCH ISSUED
●1953 RENAMED "SELS" -- AROUND THE CLOCK COVERAGE
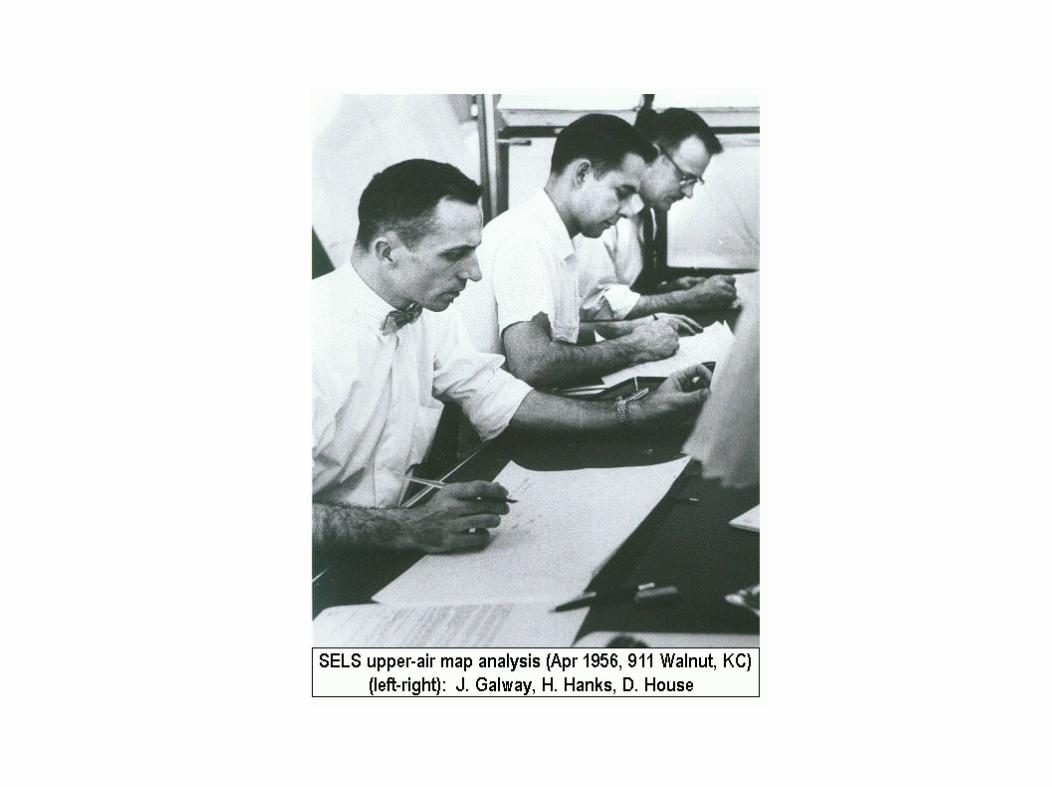
●1954 SELS TRANSFERRED TO KANSAS CITY (911 WALNUT)
●1955 FIRST CONVECTIVE OUTLOOK
“PRE-SATELLITE FORECAST ACTIVITIES”
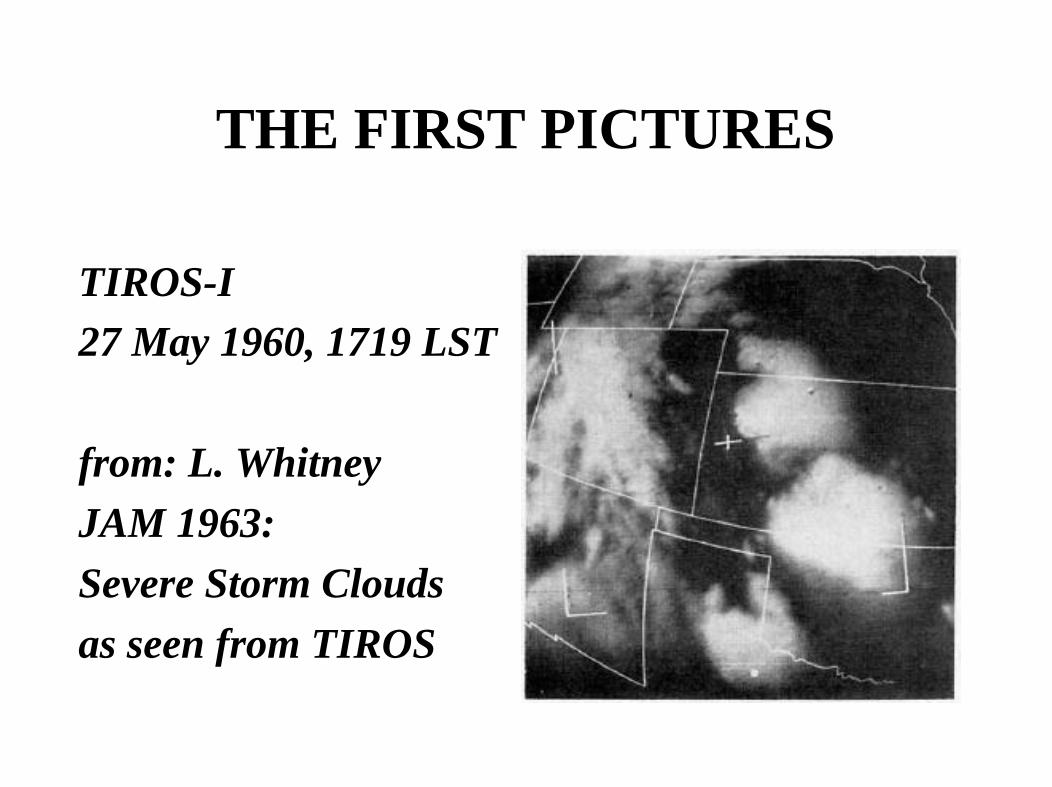
THE FIRST PICTURES
TIROS-I 27 May 1960, 1719 LST
from: L. WhitneyJAM 1963:Severe Storm Cloudsas seen from TIROS

From: L. F. Whitney, 1963, JAM, figure 3

1966 RENAMED NSSFC AND MOVED TO 601 E. 12TH STREET, KANSAS CITY MO
1966 FIRST GEOSTATIONARY: ATS-1

Relationships between size of cirrus shields and severity
R.J. Boucher 1967, JAM
TIROS IV-VII
17 cases1962-1964
From: Fig. 2

Satellite imagery and severe weather warnings
James F.W. Purdom, 1971
Polar orbiting: NOAA-1
●Squall lines: characteristic appearance, narrowing to south
●Locations of jets: polar and subtropical
●Shear with height: thermal ridge and amount of veering

ATS-3 Visible imagery (1971): 11-minute updates on demand
●Early detection of squall lines as compared to radar
●Isolation of areas under threat for severe weather:
- Often southern portion of convective clusters
●Growth of anvil:
- Pause in expansion linked time of tornado occurrence
- McCann(1979) linked collapsing tops to downdraft
and tornado formation

1972 SFSS (SATELLITE FIELD SERVICES STATION) ESTABLISHED AT MKC

CONVECTIVE INITIATION
1974 First SMS
1975 GOES-1

Some uses of high-resolution GOES imageryin the mesoscale forecasting of
convection and its behavior
James F.W. Purdom, 1976 MWR

EXPLORATION OF INFRARED IMAGERY

Anvil outflow patterns as indicators of tornadic thunderstorms
Charles E. Anderson, 1979
●Observed characteristics of cirrus plumesof severe storms (limited cases)
- Displaced to the right of the ambient wind- Anticyclonic rotation- Spiral bands- Similarity to hurricanes

On overshooting-collapsing thunderstorm tops
Donald W. McCann, 1979
●Previously observed by aircraft (Fujita, 73;Umenhofer, 75)
●Collapse does NOT cause tornado
●May be related to acceleration of gust front:- Occlusion of mesolow- Strong surface outflow (i.e. bow echo)

Mesoscale convective complexesRobert Maddox, 1980 BAMS

GROWTH RATES

Thunderstorm intensity as determined from satellite data (SMS 2: IR 5-minute)Robert Adler and Douglas Fenn, JAM 1979

Observations of damaging hailstorms from geosynchronous satellite digital data
(GOES 30-minute data: 9 storms)
David W. Reynolds, 1980 MWR

Detection of severe Midwest thunderstormsusing geosynchronous satellite data
SMS-2 and GOES-1: ~5 minute data
Robert Adler, Michael Markus, Douglas FennMWR 1985

1980: FIRST GOES VAS “DWELL SOUNDINGS” (GOES-4)
1980 Cooperative Institute for Meteorological Satellite Studies founded

1982 CSIS -- FIRST OPERATIONAL McIDAS WORKSTATION --INSTALLED
1983 SFSS BECOMES PART OF NSSFC


THE ENHANCED-V
AND RELATED STRUCTURE

Detection of tropopause penetrations byintense convection with GOES enhanced
infrared imageryPeter Mills, Elford Astling, 1977, 10th SLS
●First observations of warm spots on anvil●Near tropopause penetrations
- confirmed by radar●Possible causes
- higher emissivity above updraft- stratospheric cirrus- rapid sinking

The enhanced-V: a satellite observable severe storm signature
Donald W. McCann 1983, MWR

Thunderstorm cloud top dynamics as inferred fromsatellite observations and a cloud top parcel model
Robert Adler, Robert Mach, 1986 JAS

Upper-level structure of Oklahoma tornadic stormson 2 May 1979, I: Radar and satellite observations
Gerald Heymsfield, Roy Blackmer, Steven SchotzJAS, 1983

Satellite-observed characteristicsof Midwest severe thunderstorm anvils
Gerald Heymsfield, Roy Blackmer, MWR 1988

1991 VDUC (ENHANCED McIDAS WORKSTATION) -- INSTALLED TO REPLACE CSIS
1994 FIRST INDEPENDENT GOES SOUNDER (GOES-8) 1995 SELS BECOMES SPC, NAWAU BECOMES AWC (AVIATION
WEATHER CENTER)1997 SPC COMPLETES MOVE TO NORMAN OK1999 AWIPS WORKSTATIONS INSTALLED


PLUMES:
SHORT WAVE IR REFLECTANCE

The AVHRR channel 3 cloud topreflectivity of convective storms
Martin Setvak, Charles Doswell, 1991 MWR

Multispectral high-resolution satellite observations of plumes on top of convective
storms
Vincenzo Levizzani, Martin Setvak, 1996 JAS

Satellite observations of convective storm tops in the 1.6, 3.7 and 3.9 spectral bands
Martin Setvak, Robert Rabin, Charles Doswell,Vincenzo Levizzani, 2003 Atmos. Res.

Moisture plumes above thunderstorm anvils and their contributions to cross-tropopause
transport of water vapor in midlatitudesPao Wang, 2003, JGR

CURRENT APPLICATIONS

Nowcasting storm initiation and growthusing GOES-8 and WSR-88D dataRita Roberts, Steven Rutledge, 2003 WF

NCAR auto-nowcast systemCindy Mueller et al, 2003, WF

Kristopher Bedka and John Mecikalski, 2004 EUMETSAT Satellite Conference
UW-CIMSS Satellite Convective Storm Nowcasting
GOES-12 1 km Visible and 4 km Imager: 4 May 2003
Convective Cloud Mask
Nowcast Time
Multi-spectral Techniques
Cloud-top Cooling Estimates Using Satellite-Derived Winds
Identify pre-CI signatures in GOES Visible and IR data using: 1) convective cloud
masking 2) multi-spectral band differencing techniques 3) cloud-top temperature trend assessments
Develop CI nowcasts (0-1 hour) by accumulating pre-CI satellite indicators attributed to the first occurrence of a ≥ 30 dBZ radar echo
Incorporate Satellite-Based Convective Cloud Analyses for Nowcasting Convective Initiation (CI)
CI Nowcast Algorithm
Red: CI NowcastsGrey: Cirrus Anvil
Doppler Radar for Validation
1 Hour Later

Validation and use of GOES sounder information
Tim Schmit, et al., 2002 WF

Storm trackerA Web-based tool for monitoring MCS
Robert Rabin, Tom Whittaker 2004


SUMMARY
●40 year history of satellite research
●Hot research topic through 1980's
●Limits to Operational use of early ideas
- Advent of Doppler radar network
- Resolution limitations
- Limited early access
●Greatest impact: qualitative use of imagery

THE FUTURE?
●MSG (now)
●AWIPS
●GOES-R (2013)
●Space-borne Radars?


