
corporate informationinvestni.com
North EasternRegional Briefing:Antrim & Newtownabbey Borough Council andMid & East Antrim Borough CouncilJune 2017

1
Contents
Background 2
North Eastern Region OverviewNorth Eastern Invest NI Activity 4 North Eastern Invest NI Supported Businesses’ Performance 6North Eastern Economic Profile 8North Eastern Sector Focus 12North Eastern Economic Development Partners 14
District Council Briefings
Antrim & Newtownabbey 16Mid & East Antrim 23
Appendices Data Tables 31Notes 38Data Sources 40

2
Background
Invest NI has produced Regional Briefings for areas across Northern Ireland to help inform and supportunderstanding of sub-regional economic performance. They are aligned to Invest NI’s regional office network and each includes analysis for the relevant local councils.
The purpose of the briefings is to provide an overview of the latest available economic metrics from a range of data sources. This includes:
● Invest NI support to businesses and organisations in the area to stimulate job creation, investment and economic growth;
● Official statistics including; Population, Labour Market, Employee Jobs, Earnings, Qualifications, Business Base, Productivity and Tourism; and
● Information on Sectors and Economic Development Partners in the region.
Data tables, detailed notes on definitions and measures and sources are available in the appendices. The Regional Briefings are supported by an interactive dataset and access to these resources is available through the contact points below.
For further information please contact:
Moira Loughran Fiona JohnstonRegional Manager Statistical Support Invest NI - North Eastern Regional Office Invest NI - Corporate Information [email protected] [email protected] 9069 8325 028 9069 8288

3
North EasternRegionOverview
Invest Northern Ireland is committed to working with our partners in the North Eastern Region to help businesses create jobs, innovate and grow exports. Our North Eastern Regional office is located in Ballymena and provides advice and support to potential entrepreneurs, start-ups and established businesses within the Antrim & Newtownabbey Borough Council and Mid & East Antrim Borough Council areas.

4
North Eastern Invest NI Activity (2012-13 to 2016-17)
North EasternRegionOverview
Invest Northern Ireland is committed to working with our partners in the North Eastern Region to help businesses create jobs, innovate and grow exports. Our North Eastern Regional office is located in Ballymena and provides advice and support to potential entrepreneurs, start-ups and established businesses within the Antrim & Newtownabbey Borough Council and Mid & East Antrim Borough Council areas.
Total Support = £113.22m Total Investment = £565.63m
No. of Businesses = 726 No. of Offers = 2,484
Jobs Promoted = 4,288 Jobs Created = 4,206
Type of Support Notes
2016-17
2015-16
2014-15
2013-14
2012-13
£31.41m
£81.81m
£228.01m
£337.62m
187
2,297
28
698
1,491
2,797
1,357
2,849
13.99
11.16
14.20
6.28
36.19
3.11
17.97
7.57
1.17
1.59
49.63
50.78
106.33
31.62
99.26
21.74
145.68
48.39
6.79
5.42
280
259
206
181
15
19
18
11
7
527
575
504
347
344
53
64
42
15
13
677
1,245
165
284
446
887
150
8
0
853
481
726
267
523
103
130
501
530
92
2016-17
2015-16
2014-15
2013-14
2012-13
2016-17
2015-16
2014-15
2013-14
2012-13
●Business totals may not add as a business can be supported in more than one year and can move from local to externally-owned during the 5 year period.
●Does not include £26.83m of support to External Delivery Organisations or universities, which contributes towards £41.47m of investment, as this benefits businesses across all of Northern Ireland.
●’Jobs Promoted’ are those which are expected as a result of the implementation of a business plan. As this happens, they become ‘Jobs Created’.
£m £m
426
260
Externally-Owned Businesses
Locally-Owned Businesses
Over the five year period from 2012-13 to 2016-17, Invest NI has made 2,484 offers of support to 726 businesses located in the North Eastern region. This support is valued at £113.22m and has contributed towards £565.63m of investment secured for the area, including the promotion of 4,288 new jobs.
The information below shows this support disaggregated by business ownership (locally-owned or externally-owned) and type of support.
Jobs Innovation&
Technology
Trade Skills R&D LoanFund
Other
£35.02m
£6.15m £6.97m
£47.38m
£13.74m
£2.65m£1.31m
5
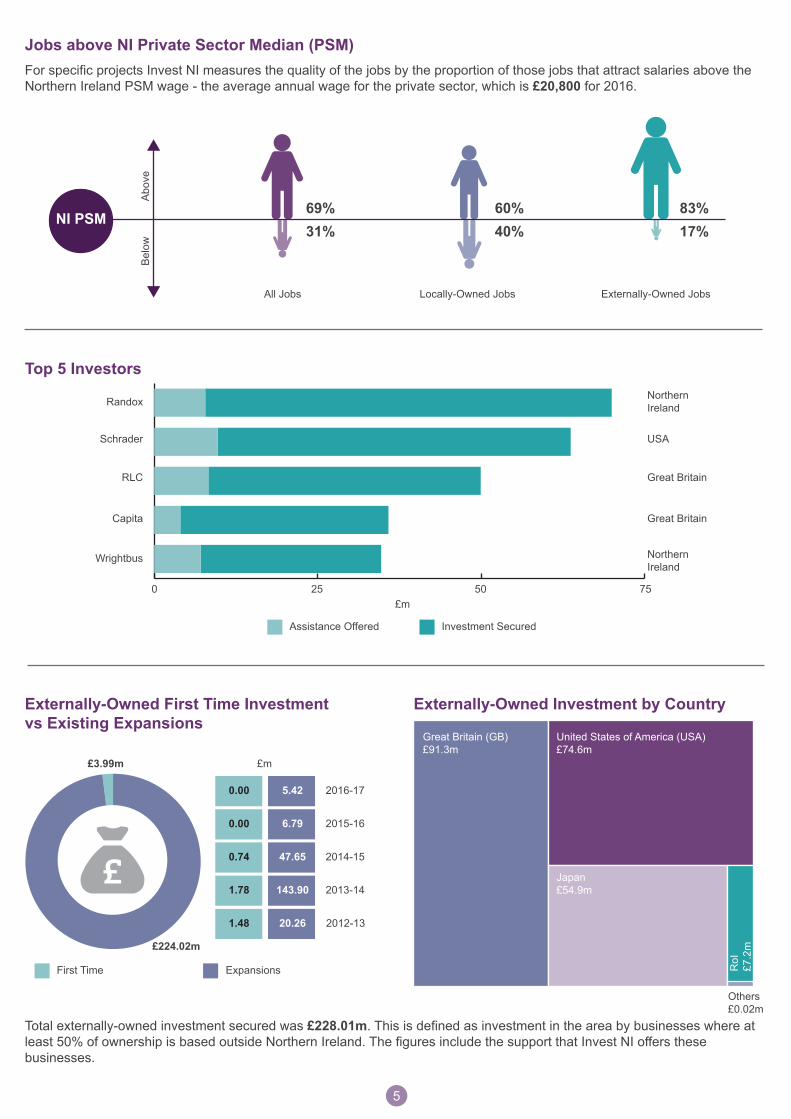
Externally-Owned First Time Investmentvs Existing Expansions
Externally-Owned Investment by Country
£m
2016-17
2015-16
2014-15
2013-14
2012-13
5.42
6.79
47.65
143.90
20.26
0.00
0.00
0.74
1.78
1.48
£3.99m
£224.02m
First Time Expansions
Top 5 Investors
Investment Secured Assistance Offered
NorthernIreland
USA
Great Britain
Great Britain
NorthernIreland
Randox
Schrader
RLC
Capita
Wrightbus
£m0 25 50 75
Total externally-owned investment secured was £228.01m. This is defined as investment in the area by businesses where at least 50% of ownership is based outside Northern Ireland. The figures include the support that Invest NI offers these businesses.
Jobs above NI Private Sector Median (PSM)For specific projects Invest NI measures the quality of the jobs by the proportion of those jobs that attract salaries above the Northern Ireland PSM wage - the average annual wage for the private sector, which is £20,800 for 2016.
Abov
eBe
low
All Jobs Locally-Owned Jobs Externally-Owned Jobs
NI PSM69%31%
60%40%
83%17%
United States of America (USA)£74.6m
Great Britain (GB)£91.3m
Japan£54.9m
RoI
£7.2
m
Others£0.02m

6
15,539Employment
£2,862mAll Sales
£2,218mExternal
Sales
£1,299mExportSales
SupportedBusinesses
172
Turnover by Sector
Total Turnover £2,862m
Total Employment 15,539
Employment by Sector
Key Performance Indicators (KPIs) are collected from a sub-set of Invest NI supported businesses with potential for growth through external markets. KPIs are geographically assigned based on the business’ HQ location. These include all sales, external sales, exports and employment.
Per employee ratios are provided to enable comparisons across all businesses in the Invest NI portfolio.
Sectors are classified according to Invest NI’s sector reporting structure which is based on supported businesses’ main product/service within Northern Ireland.
Per Employee Ratios
North EastAll Invest NI Businesses
Sales per Employee £184,153 £146,156
External Sales per Employee (Outside NI) £142,706 £109,714
Export Sales per Employee (Outside UK) £83,572 £52,704
AdvancedEngineering &Manufacturing£1,598m (55.8%)
Agri-Food£257m (9.0%)
Construction£640m (22.4%)
Financial Prof. & Business£43m (1.5%)
Digital &Creative£140m(4.9%)
Life & Health£160m (5.6%)
Leisure &Tourism£24m (0.8%)
Advanced Engineering &Manufacturing7,862 (50.6%)
Agri-Food712 (4.6%)
Financial, Professional& Business 387 (2.5%)
Construction3,411(22.0%)
Life & Health1,691 (10.9%)
Leisure &Tourism482 (3.1%)
Digital &Creative994 (6.4%)
North Eastern Invest NI Supported Businesses’ Performance (2015)
Externally-Owned First Time Investmentvs Existing Expansions
Externally-Owned Investment by Country
£m
2016-17
2015-16
2014-15
2013-14
2012-13
5.42
6.79
47.65
143.90
20.26
0.00
0.00
0.74
1.78
1.48
£3.99m
£224.02m
First Time Expansions
Top 5 Investors
Investment Secured Assistance Offered
NorthernIreland
USA
Great Britain
Great Britain
NorthernIreland
Randox
Schrader
RLC
Capita
Wrightbus
£m0 25 50 75
Total externally-owned investment secured was £228.01m. This is defined as investment in the area by businesses where at least 50% of ownership is based outside Northern Ireland. The figures include the support that Invest NI offers these businesses.
Jobs above NI Private Sector Median (PSM)For specific projects Invest NI measures the quality of the jobs by the proportion of those jobs that attract salaries above the Northern Ireland PSM wage - the average annual wage for the private sector, which is £20,800 for 2016.
Abov
eBe
low
All Jobs Locally-Owned Jobs Externally-Owned Jobs
NI PSM69%31%
60%40%
83%17%
United States of America (USA)£74.6m
Great Britain (GB)£91.3m
Japan£54.9m
RoI
£7.2
m
Others£0.02m
7
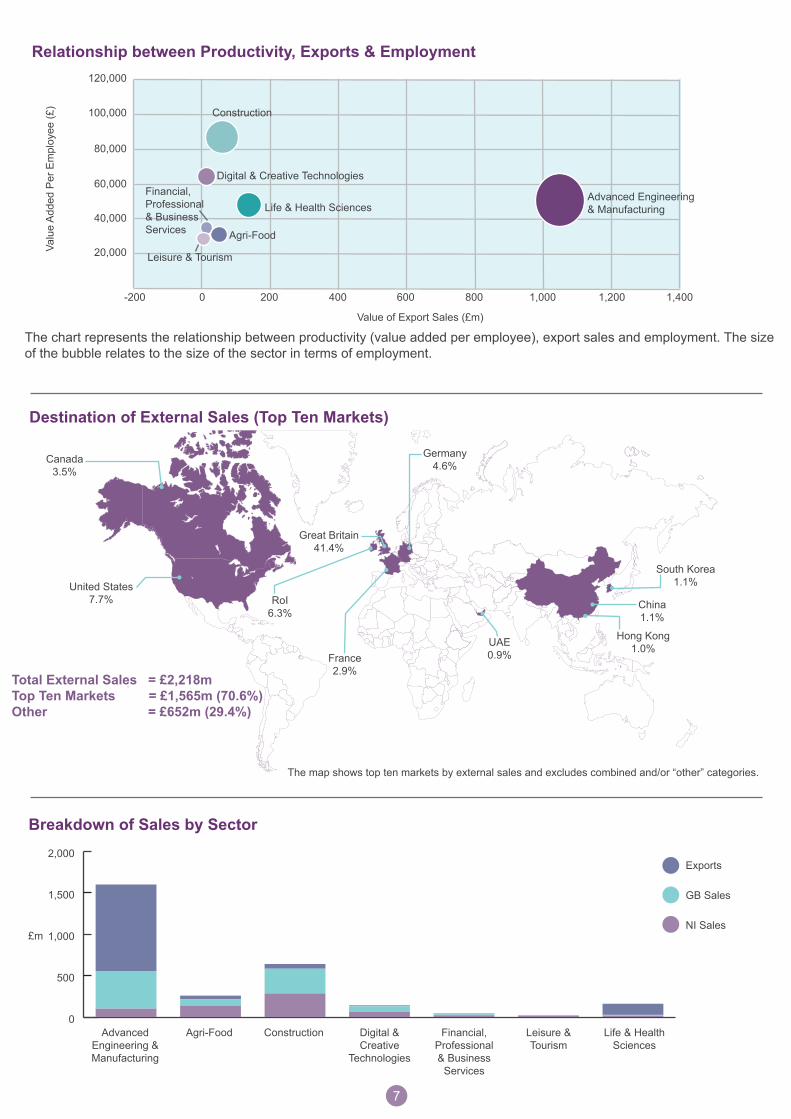
Breakdown of Sales by Sector
Destination of External Sales (Top Ten Markets)
Relationship between Productivity, Exports & Employment
United States7.7%
Hong Kong1.0%
Great Britain41.4%
RoI6.3%
UAE0.9%France
2.9%
South Korea1.1%
Germany4.6%
China1.1%
Canada3.5%
0
500
1,000
1,500
2,000Exports
GB Sales
NI Sales£m
AdvancedEngineering &Manufacturing
Agri-Food Construction Digital &Creative
Technologies
Financial,Professional& Business
Services
Life & HealthSciences
Leisure &Tourism
Total External Sales = £2,218mTop Ten Markets = £1,565m (70.6%)Other = £652m (29.4%)
The map shows top ten markets by external sales and excludes combined and/or “other” categories.
The chart represents the relationship between productivity (value added per employee), export sales and employment. The size of the bubble relates to the size of the sector in terms of employment.
Value of Export Sales (£m)
Valu
e Ad
ded
Per E
mpl
oyee
(£)
200 400 600 800 1,000 1,200 1,400-200
120,000
100,000
80,000
60,000
40,000
20,000Agri-Food
Construction
Digital & Creative TechnologiesFinancial,Professional& BusinessServices
Life & Health Sciences
Leisure & Tourism
0
Advanced Engineering& Manufacturing
8
North Eastern Economic Profile
Breakdown of Sales by Sector
Destination of External Sales (Top Ten Markets)
Relationship between Productivity, Exports & Employment
United States7.7%
Hong Kong1.0%
Great Britain41.4%
RoI6.3%
UAE0.9%France
2.9%
South Korea1.1%
Germany4.6%
China1.1%
Canada3.5%
0
500
1,000
1,500
2,000Exports
GB Sales
NI Sales£m
AdvancedEngineering &Manufacturing
Agri-Food Construction Digital &Creative
Technologies
Financial,Professional& Business
Services
Life & HealthSciences
Leisure &Tourism
Total External Sales = £2,218mTop Ten Markets = £1,565m (70.6%)Other = £652m (29.4%)
The map shows top ten markets by external sales and excludes combined and/or “other” categories.
The chart represents the relationship between productivity (value added per employee), export sales and employment. The size of the bubble relates to the size of the sector in terms of employment.
Value of Export Sales (£m)
Valu
e Ad
ded
Per E
mpl
oyee
(£)
200 400 600 800 1,000 1,200 1,400-200
120,000
100,000
80,000
60,000
40,000
20,000Agri-Food
Construction
Digital & Creative TechnologiesFinancial,Professional& BusinessServices
Life & Health Sciences
Leisure & Tourism
0
Advanced Engineering& Manufacturing
TotalPopulation277,612
Population by Age
15% of total NI population
0-15 years
16-39 years
40-64 years
65+ years
20%
30%33%
17%(NI 21%)
(NI 31%)(NI 32%)
(NI 16%)
Labour Market Structure (2015)
North Eastern Northern Ireland
76% 73%economicallyactive
economicallyactive
24% 27%economicallyinactive
economicallyinactive
Population (2015)
●Total Employed 122,000 (72% rate)
●Self-Employed 12,000 (10% rate)
In Employment
3%of population claimingunemployment benefit
and of this number
North Eastern
are long-term(over one year)
34%
are youth(aged 18-24)
29%
4%of population claimingunemployment benefit
and of this number
Northern Ireland
are long-term(over one year)
37%
are youth(aged 18-24)
26%
Unemployment Claimants
North Eastern Northern Ireland
●Total Employed 798,000 (68% rate)
●Self-Employed 98,000 (12% rate)
Source: Mid Year Population Estimates, NISRA
Source: Labour Force Survey, NISRA
Source: Claimant Count, NISRA
The labour market structure is composed of the economically active (people in employment and seeking work) and inactive (not seeking nor available for work). This data is provided through the Labour Force Survey (LFS), the largest regular household sample survey in Northern Ireland. Total numbers in employment do not equate to total jobs as a person can have more than one job.
Unemployment annual averages data is derived from the Claimant Count as LFS figures fall below suppression thresholds. This is an administrative data source based on the numbers claiming unemployment-related benefits. It uses a different definition of unemployment to the LFS.
Both measures of the labour market are based on the working-age (16-64) population.
9
Public Sector Private Sector
25% 75%28% 72%North
EasternNorthernIreland
NorthEastern
NorthernIreland
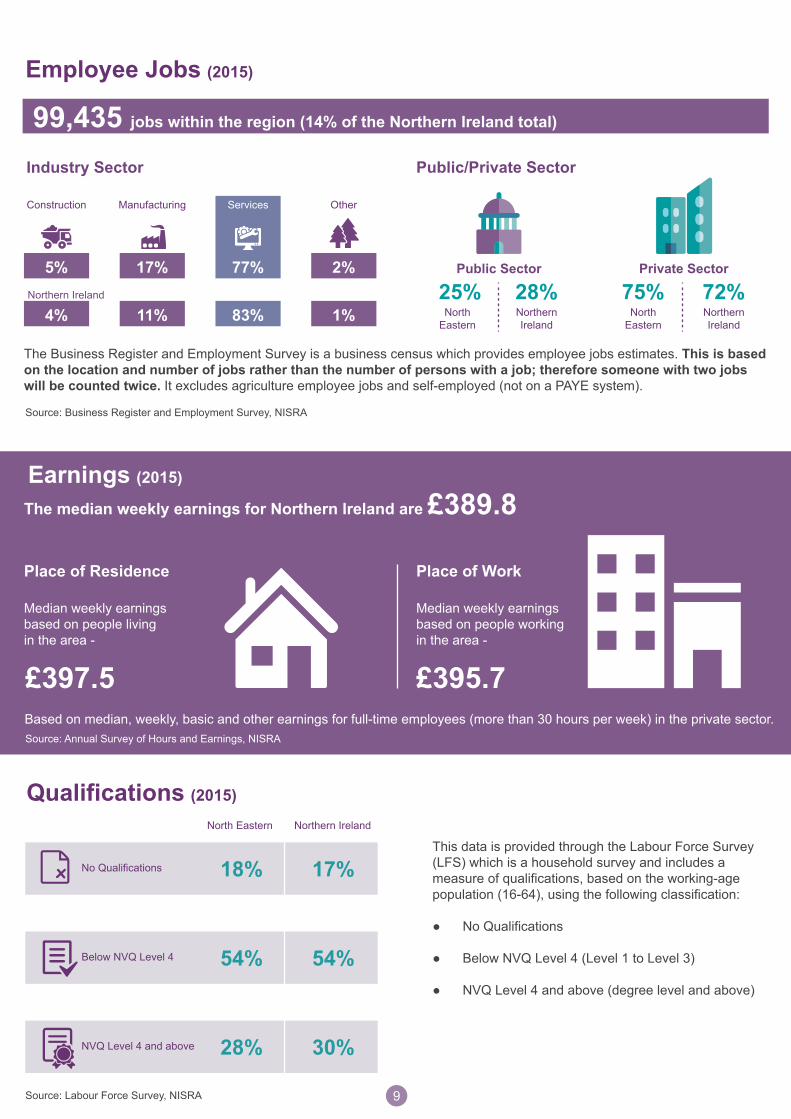
Employee Jobs (2015)
Public/Private SectorIndustry Sector
Construction Manufacturing
5% 17%
Services
77%
4% 11% 83% 1%
Other
2%Northern Ireland
Earnings (2015)
Qualifications (2015)
No Qualifications
Below NVQ Level 4
NVQ Level 4 and above
x 18%
54%
28%
17%
54%
30%
Place of WorkPlace of Residence
Northern IrelandNorth Eastern
99,435 jobs within the region (14% of the Northern Ireland total)
The median weekly earnings for Northern Ireland are £389.8
Median weekly earningsbased on people livingin the area -
£397.5
Median weekly earningsbased on people workingin the area -
£395.7
The Business Register and Employment Survey is a business census which provides employee jobs estimates. This is based on the location and number of jobs rather than the number of persons with a job; therefore someone with two jobs will be counted twice. It excludes agriculture employee jobs and self-employed (not on a PAYE system).
Based on median, weekly, basic and other earnings for full-time employees (more than 30 hours per week) in the private sector.
This data is provided through the Labour Force Survey (LFS) which is a household survey and includes a measure of qualifications, based on the working-age population (16-64), using the following classification: ● No Qualifications
● Below NVQ Level 4 (Level 1 to Level 3)
● NVQ Level 4 and above (degree level and above)
Source: Business Register and Employment Survey, NISRA
Source: Annual Survey of Hours and Earnings, NISRA
Source: Labour Force Survey, NISRA

10
Public Sector Private Sector
25% 75%28% 72%North
EasternNorthernIreland
NorthEastern
NorthernIreland
Employee Jobs (2015)
Public/Private SectorIndustry Sector
Construction Manufacturing
5% 17%
Services
77%
4% 11% 83% 1%
Other
2%Northern Ireland
Earnings (2015)
Qualifications (2015)
No Qualifications
Below NVQ Level 4
NVQ Level 4 and above
x 18%
54%
28%
17%
54%
30%
Place of WorkPlace of Residence
Northern IrelandNorth Eastern
99,435 jobs within the region (14% of the Northern Ireland total)
The median weekly earnings for Northern Ireland are £389.8
Median weekly earningsbased on people livingin the area -
£397.5
Median weekly earningsbased on people workingin the area -
£395.7
The Business Register and Employment Survey is a business census which provides employee jobs estimates. This is based on the location and number of jobs rather than the number of persons with a job; therefore someone with two jobs will be counted twice. It excludes agriculture employee jobs and self-employed (not on a PAYE system).
Based on median, weekly, basic and other earnings for full-time employees (more than 30 hours per week) in the private sector.
This data is provided through the Labour Force Survey (LFS) which is a household survey and includes a measure of qualifications, based on the working-age population (16-64), using the following classification: ● No Qualifications
● Below NVQ Level 4 (Level 1 to Level 3)
● NVQ Level 4 and above (degree level and above)
Source: Business Register and Employment Survey, NISRA
Source: Annual Survey of Hours and Earnings, NISRA
Source: Labour Force Survey, NISRA
Business Base (2015)
8,190businesses
MicroBusinesses(0-9employees)
SmallBusinesses(10-49employees)
MediumBusinesses (50-249employees)
LargeBusinesses(250+employees)
Businesses by Size
Businesses by Sector
88%
10%1% 0.2%
NorthEastern
NorthernIreland
25% 13% 7% 55%
25% 13% 6% 55%
Agriculture Production (incl. Manu.)Construction Services
Number of Registered Businesses
Business Births
North Eastern Northern Ireland
9% 10%
The business population is defined here by the Inter Departmental Business Register which excludes smaller businesses and the self-employed who fall below the VAT registered/PAYE thresholds.
A business birth is identified as a business that was present in the latest annual active business population dataset, but not the two previous ones. The birth rate is expressed as a percentage of total active enterprises in the current year. Business demography data excludes the agriculture sector.
Source: Inter Departmental Business Register, NISRA
This accounts for 12% of all the businesses in Northern Ireland

11
NorthEastern
NorthernIreland
Productivity Work-Place Based (2014)
£36,392£49,459per head per head
Tourism
Visitor Attractions (2015)
visits to visitorattractions
Antrim Castle Gardens & Clotworthy House 357,051
Shaftesbury Park 63,800
Carrickfergus Caste 53,692
Tourism Jobs (2015)
Overnight Trips & Associated Spend (2015)
8,156 tourism jobs
Total jobs in North Eastern Region
9% of all jobs in Northern Ireland are within the tourist industry
0.6movernight tripsto the North
Eastern Region(13% of NI total)
resulting in
£80mexpenditure
(10% of NI total)
8%
Availability of Accommodation (2015)
5,331
11% 5%13%in B&Bs in Self-cateringin Hotels
beds available(12% of NI total)
1.0m
The most popular visitor attractions in 2015 were:-
Productivity is based on the approximate Gross Value Added (aGVA) generated by the non-financial business economy (and excludes public sector). This is measured by the Northern Ireland Annual Business Inquiry based on income, less cost of goods and services used to create this income.
Per head calculations are made using total in employment, rather than the resident population as this can be subject to distortion (due to the effects of commuting and variations in age distribution).
A variety of statistics are used to provide a picture of tourism. These include: passenger and household surveys which measure the number of overnight trips and associated expenditure; occupancy surveys of local hotels and commercial accommodation and the Visitor Attraction Survey.
Source: Northern Ireland Annual Business Inquiry, NISRA
Source: Tourism Statistics, NISRA
(percentage of Northern Ireland total)

12
Advanced Engineering & Manufacturing
Digital & Creative Technologies
Construction
The North Eastern region has a rich heritage of advanced engineering and manufacturing companies. Today this region is home to innovative and export-focused businesses such as Schrader Electronics who design, develop and manufacture remote tyre pressure monitoring systems for the automotive sector.
Others include: Wrightbus, who design and manufacture the iconic new London Routemaster bus; Yelo who design and manufacture automated test equipment for the international electronics market; RLC who manufacture products for the aerospace sector and Ryobi who manufacture aluminium components for the automotive sector.
Northern Ireland has a growing reputation for producing businesses in the digital and creative technologies sector.
In the North Eastern region these include: Texthelp who provide literacy and language learning software solutions to customers worldwide; Capita Managed IT Solutions who focus on cloud infrastructure and ICT managed services for customers across the UK and Marketstall Services and Software Solutions who design innovative software for the retail market and have a strong export focus.
CMASS is an Electronic Contract Manufacturing company that provides wide ranging and flexible manufacturing, supplying global customers across the telecommunications, power, defence, aerospace and medical sectors.
In the North Eastern region, SAM Mouldings is one of the UK’s leading manufacturers of MDF mouldings for the construction sector. Garage Door Systems produce roller-door systems for customers across the UK and Ireland.
New World Developments launched their Lumi window and door range in 2015 at the London Grand Designs show. Lumi is a ground-breaking new range of customisable, matching frameless windows, bi-folds and doors and was awarded ‘Best New Product’ at the Glass and Glazing industry’s ‘G Awards’ in 2015.
FleckImet Group is based in Ballymena and produce steel structures for areas such as stairways and mezzanine floors. The company has recently carried out work with large commercial projects for Urban Outfitters in Amsterdam and London and Forever 21 in Manchester and London.
North Eastern Sector Focus
NorthEastern
NorthernIreland
Productivity Work-Place Based (2014)
£36,392£49,459per head per head
Tourism
Visitor Attractions (2015)
visits to visitorattractions
Antrim Castle Gardens & Clotworthy House 357,051
Shaftesbury Park 63,800
Carrickfergus Caste 53,692
Tourism Jobs (2015)
Overnight Trips & Associated Spend (2015)
8,156 tourism jobs
Total jobs in North Eastern Region
9% of all jobs in Northern Ireland are within the tourist industry
0.6movernight tripsto the North
Eastern Region(13% of NI total)
resulting in
£80mexpenditure
(10% of NI total)
8%
Availability of Accommodation (2015)
5,331
11% 5%13%in B&Bs in Self-cateringin Hotels
beds available(12% of NI total)
1.0m
The most popular visitor attractions in 2015 were:-
Productivity is based on the approximate Gross Value Added (aGVA) generated by the non-financial business economy (and excludes public sector). This is measured by the Northern Ireland Annual Business Inquiry based on income, less cost of goods and services used to create this income.
Per head calculations are made using total in employment, rather than the resident population as this can be subject to distortion (due to the effects of commuting and variations in age distribution).
A variety of statistics are used to provide a picture of tourism. These include: passenger and household surveys which measure the number of overnight trips and associated expenditure; occupancy surveys of local hotels and commercial accommodation and the Visitor Attraction Survey.
Source: Northern Ireland Annual Business Inquiry, NISRA
Source: Tourism Statistics, NISRA
(percentage of Northern Ireland total)
13
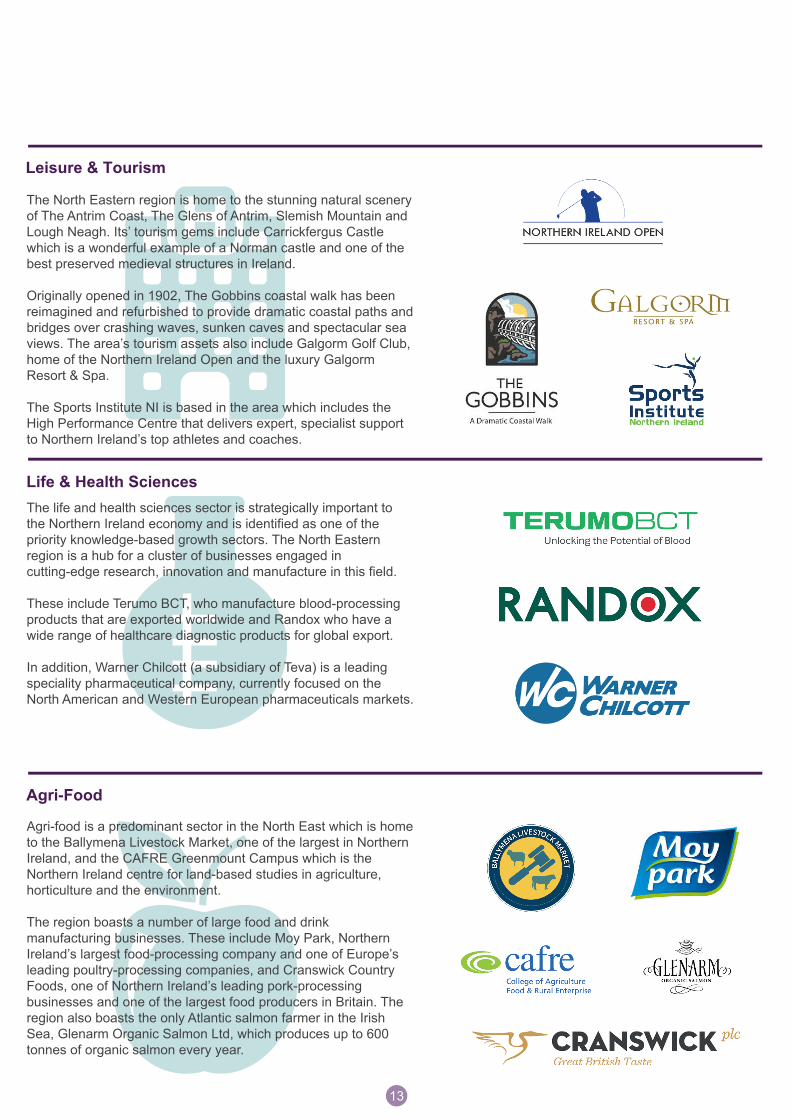
Leisure & Tourism
Life & Health Sciences
Agri-Food
The North Eastern region is home to the stunning natural scenery of The Antrim Coast, The Glens of Antrim, Slemish Mountain and Lough Neagh. Its’ tourism gems include Carrickfergus Castle which is a wonderful example of a Norman castle and one of the best preserved medieval structures in Ireland.
Originally opened in 1902, The Gobbins coastal walk has been reimagined and refurbished to provide dramatic coastal paths and bridges over crashing waves, sunken caves and spectacular sea views. The area’s tourism assets also include Galgorm Golf Club, home of the Northern Ireland Open and the luxury Galgorm Resort & Spa.
The Sports Institute NI is based in the area which includes the High Performance Centre that delivers expert, specialist support to Northern Ireland’s top athletes and coaches.
The life and health sciences sector is strategically important to the Northern Ireland economy and is identified as one of the priority knowledge-based growth sectors. The North Eastern region is a hub for a cluster of businesses engaged in cutting-edge research, innovation and manufacture in this field.
These include Terumo BCT, who manufacture blood-processing products that are exported worldwide and Randox who have a wide range of healthcare diagnostic products for global export.
In addition, Warner Chilcott (a subsidiary of Teva) is a leading speciality pharmaceutical company, currently focused on the North American and Western European pharmaceuticals markets.
Agri-food is a predominant sector in the North East which is home to the Ballymena Livestock Market, one of the largest in Northern Ireland, and the CAFRE Greenmount Campus which is the Northern Ireland centre for land-based studies in agriculture, horticulture and the environment.
The region boasts a number of large food and drink manufacturing businesses. These include Moy Park, Northern Ireland’s largest food-processing company and one of Europe’s leading poultry-processing companies, and Cranswick Country Foods, one of Northern Ireland’s leading pork-processing businesses and one of the largest food producers in Britain. The region also boasts the only Atlantic salmon farmer in the Irish Sea, Glenarm Organic Salmon Ltd, which produces up to 600 tonnes of organic salmon every year.

14
Invest NIInvest NI works in partnership across Northern Ireland to support business development, increase productivity and export levels, attract inward investment and stimulate a culture of entrepreneurship and innovation. Invest NI offers financial support, tailored guidance, training and information. A free information service is available at: nibusinessinfo.co.uk
CouncilsAmong the many other functions councils control they now also provide a continuum of support to enable local economic development. Their programmes focus on starting a business, youth and social entrepreneurship, women in business and neighbourhood renewal.
Department of Agriculture, Environment & Rural AffairsDAERA responsibilities include rural development and support for the agriculture sector.
Chamber of CommerceNI Chamber of Commerce and Industry is the network for business in Northern Ireland, enabling members to grow their organisation both locally and internationally and drive the development of the economy. There are local branches throughout Northern Ireland.
Department for the EconomyDfE is responsible for, among other areas, economic policy development and aims to transform Northern Ireland into an innovative and globally competitive economy.
Department for CommunitiesDfC responsibilities include urban regeneration, community and voluntary sector development and training and support for jobseekers and employers. It aims to bring communities together, tackle disadvantage and promote equality of opportunity.
Tourism AgenciesBoth Tourism NI and Tourism Ireland are responsible for development and marketing to build the value of tourism to the local economy.
InterTradeIrelandInterTradeIreland helps SMEs across the island by offering practical cross-border business funding, intelligence and contacts.
Enterprise AgenciesThese agencies work with entrepreneurs helping them to set up their business in Northern Ireland, enabling them to grow and develop and providing support to established businesses through loan funding, trade support and premises.
Michelin Development FundThis provides financial support, as well as business expertise and advice, to SMEs. Support is available to viable projects that can demonstrate the potential to create quality sustainable jobs.
University & CollegeThese support economic prosperity through education, training and skills development of individuals, businesses and communities. They also offer knowledge transfer partnerships and spin-out activity.
North Eastern Economic Development Partners
Leisure & Tourism
Life & Health Sciences
Agri-Food
The North Eastern region is home to the stunning natural scenery of The Antrim Coast, The Glens of Antrim, Slemish Mountain and Lough Neagh. Its’ tourism gems include Carrickfergus Castle which is a wonderful example of a Norman castle and one of the best preserved medieval structures in Ireland.
Originally opened in 1902, The Gobbins coastal walk has been reimagined and refurbished to provide dramatic coastal paths and bridges over crashing waves, sunken caves and spectacular sea views. The area’s tourism assets also include Galgorm Golf Club, home of the Northern Ireland Open and the luxury Galgorm Resort & Spa.
The Sports Institute NI is based in the area which includes the High Performance Centre that delivers expert, specialist support to Northern Ireland’s top athletes and coaches.
The life and health sciences sector is strategically important to the Northern Ireland economy and is identified as one of the priority knowledge-based growth sectors. The North Eastern region is a hub for a cluster of businesses engaged in cutting-edge research, innovation and manufacture in this field.
These include Terumo BCT, who manufacture blood-processing products that are exported worldwide and Randox who have a wide range of healthcare diagnostic products for global export.
In addition, Warner Chilcott (a subsidiary of Teva) is a leading speciality pharmaceutical company, currently focused on the North American and Western European pharmaceuticals markets.
Agri-food is a predominant sector in the North East which is home to the Ballymena Livestock Market, one of the largest in Northern Ireland, and the CAFRE Greenmount Campus which is the Northern Ireland centre for land-based studies in agriculture, horticulture and the environment.
The region boasts a number of large food and drink manufacturing businesses. These include Moy Park, Northern Ireland’s largest food-processing company and one of Europe’s leading poultry-processing companies, and Cranswick Country Foods, one of Northern Ireland’s leading pork-processing businesses and one of the largest food producers in Britain. The region also boasts the only Atlantic salmon farmer in the Irish Sea, Glenarm Organic Salmon Ltd, which produces up to 600 tonnes of organic salmon every year.

15
DistrictCouncilBriefings

16
DistrictCouncilBriefings
Antrim & NewtownabbeyCouncil Area Profile
Sources: VariousJune 2017
Invest NI Activity (2012-13 to 2016-17)
Total Support = £74.52m Total Investment = £370.34m
No. of Businesses = 375 No. of Offers = 1,372
Jobs Promoted = 2,595 Jobs Created = 3,095
Type of Support Notes
2016-17
2015-16
2014-15
2013-14
2012-13
£23.52m
£51.00m
£158.25m
£212.09m
106
1,266
15
360
851
1,744
1,070
2,025
6.64
6.41
8.94
2.85
26.16
0.47
14.29
7.01
0.30
1.45
21.13
24.18
83.42
15.41
67.94
3.00
102.78
46.01
1.44
5.02
153
132
115
98
10
12
9
6
2
282
341
265
195
183
28
41
21
9
7
292
923
90
195
30
663
150
8
0
708
259
459
192
406
42
130
452
444
1
2016-17
2015-16
2014-15
2013-14
2012-13
2016-17
2015-16
2014-15
2013-14
2012-13
●Business totals may not add as a business can be supported in more than one year and can move from local to externally-owned during the 5 year period.
●Does not include £26.08m of support to External Delivery Organisations or universities, which contributes towards £40.30m of investment, as this benefits businesses across all of Northern Ireland.
●’Jobs Promoted’ are those which are expected as a result of the implementation of a business plan. As this happens, they become ‘Jobs Created’.
£m £m
244
139
Externally-Owned Businesses
Locally-Owned Businesses
Jobs Innovation&
Technology
Trade Skills R&D LoanFund
Other
£23.76m
£3.22m £2.55m
£38.89m
£3.93m £1.37m£0.81m

17
Externally-Owned First Time Investmentvs Existing Expansions
Externally-Owned Investment by Country
£m
2016-17
2015-16
2014-15
2013-14
2012-13
5.02
1.44
45.28
102.00
1.52
0.00
0.00
0.74
0.78
1.48
£2.99m
£155.26m
First Time Expansions
Top 5 Investors
Investment Secured Assistance Offered
Northern Ireland
USA
Great Britain
Great Britain
Northern Ireland
Randox
Schrader
RLC
Capita
Mivan Marine
£m0 20 40 60 80
Total externally-owned investment secured was £158.25m. This is defined as investment in the area by businesses where at least 50% of ownership is based outside Northern Ireland. The figures include the support that Invest NI offers these businesses.
Jobs above NI Private Sector Median (PSM)For specific projects Invest NI measures the quality of the jobs by the proportion of those jobs that attract salaries above the Northern Ireland PSM wage - the average annual wage for the private sector, which is £20,800 for 2016.
Abov
eBe
low
All Jobs Locally-Owned Jobs Externally-Owned Jobs
NI PSM75%25%
67%33%
85%15%
United States ofAmerica (USA)£64.3m
Great Britain (GB)£90.1m
RoI £2.3m Japan £1.6m

18
Externally-Owned First Time Investmentvs Existing Expansions
Externally-Owned Investment by Country
£m
2016-17
2015-16
2014-15
2013-14
2012-13
5.02
1.44
45.28
102.00
1.52
0.00
0.00
0.74
0.78
1.48
£2.99m
£155.26m
First Time Expansions
Top 5 Investors
Investment Secured Assistance Offered
Northern Ireland
USA
Great Britain
Great Britain
Northern Ireland
Randox
Schrader
RLC
Capita
Mivan Marine
£m0 20 40 60 80
Total externally-owned investment secured was £158.25m. This is defined as investment in the area by businesses where at least 50% of ownership is based outside Northern Ireland. The figures include the support that Invest NI offers these businesses.
Jobs above NI Private Sector Median (PSM)For specific projects Invest NI measures the quality of the jobs by the proportion of those jobs that attract salaries above the Northern Ireland PSM wage - the average annual wage for the private sector, which is £20,800 for 2016.
Abov
eBe
low
All Jobs Locally-Owned Jobs Externally-Owned Jobs
NI PSM75%25%
67%33%
85%15%
United States ofAmerica (USA)£64.3m
Great Britain (GB)£90.1m
RoI £2.3m Japan £1.6m
Limavady
Dungiven
8,753Employment
£1,503mAll Sales
£1,025mExternal
Sales
£621mExportSales
SupportedBusinesses
96
Turnover by Sector
Total Turnover £1,503m
Total Employment 8,753
Employment by Sector
Key Performance Indicators (KPIs) are collected from a sub-set of Invest NI supported businesses with potential for growth through external markets. KPIs are geographically assigned based on the business’ HQ location. These include all sales, external sales, exports and employment.
Per employee ratios are provided to enable comparisons across all businesses in the Invest NI portfolio.
Sectors are classified according to Invest NI’s sector reporting structure which is based on supported businesses’ main product/service within Northern Ireland.
Invest NI Supported Businesses’ Performance (2015)
Per Employee RatiosAntrim &
NewtownabbeyAll Invest NI Businesses
Sales per Employee £171,722 £146,156
External Sales per Employee (Outside NI) £117,115 £109,714
Export Sales per Employee (Outside UK) £70,895 £52,704
AdvancedEngineering &Manufacturing£624m (41.5%)
Construction£527m (35.0%)
FinancialProf. & Business£15m (1.0%)
Digital &Creative£139m(9.2%)
Life & Health£111m (7.4%)
Other£87m (5.8%)
Advanced Engineering &Manufacturing3,547 (40.5%)
FinancialProf. & Business99(1.1%)
Construction2,534(29.0%)
Life & Health1,209 (13.8%)
Other376 (4.3%)
Digital &Creative988 (11.3%)

19
TotalPopulation140,467
Population by Age
8% of total NI population
0-15 years
16-39 years
40-64 years
65+ years
21%
31%32%
16%(NI 21%)
(NI 31%)
(NI 32%)
(NI 16%)
Labour Market Structure (2015)
Antrim & Newtownabbey Northern Ireland
75% 73%economicallyactive
economicallyactive
25% 27%economicallyinactive
economicallyinactive
Population (2015)
●Total Employed 61,000 (71% rate)
●Self-Employed 6,000 (10% rate)
In Employment
3%of population claimingunemployment benefit
and of this number
Antrim & Newtownabbey
are long-term(over one year)
32%
are youth(aged 18-24)
28%
4%of population claimingunemployment benefit
and of this number
Northern Ireland
are long-term(over one year)
37%
are youth(aged 18-24)
26%
Unemployment Claimants
Antrim &Newtownabbey
Northern Ireland
●Total Employed 798,000 (68% rate)
●Self-Employed 98,000 (12% rate)
Source: Mid Year Population Estimates, NISRA
Source: Labour Force Survey, NISRA
Source: Claimant Count, NISRA
The labour market structure is composed of the economically active (people in employment and seeking work) and inactive (not seeking nor available for work). This data is provided through the Labour Force Survey (LFS), the largest regular household sample survey in Northern Ireland. Total numbers in employment do not equate to total jobs as a person can have more than one job.
Unemployment annual averages data is derived from the Claimant Count as LFS figures fall below suppression thresholds. This is an administrative data source based on the numbers claiming unemployment-related benefits. It uses a different definition of unemployment to the LFS.
Both measures of the labour market are based on the working-age (16-64) population.
Economic Profile
20
TotalPopulation140,467
Population by Age
8% of total NI population
0-15 years
16-39 years
40-64 years
65+ years
21%
31%32%
16%(NI 21%)
(NI 31%)
(NI 32%)
(NI 16%)
Labour Market Structure (2015)
Antrim & Newtownabbey Northern Ireland
75% 73%economicallyactive
economicallyactive
25% 27%economicallyinactive
economicallyinactive
Population (2015)
●Total Employed 61,000 (71% rate)
●Self-Employed 6,000 (10% rate)
In Employment
3%of population claimingunemployment benefit
and of this number
Antrim & Newtownabbey
are long-term(over one year)
32%
are youth(aged 18-24)
28%
4%of population claimingunemployment benefit
and of this number
Northern Ireland
are long-term(over one year)
37%
are youth(aged 18-24)
26%
Unemployment Claimants
Antrim &Newtownabbey
Northern Ireland
●Total Employed 798,000 (68% rate)
●Self-Employed 98,000 (12% rate)
Source: Mid Year Population Estimates, NISRA
Source: Labour Force Survey, NISRA
Source: Claimant Count, NISRA
The labour market structure is composed of the economically active (people in employment and seeking work) and inactive (not seeking nor available for work). This data is provided through the Labour Force Survey (LFS), the largest regular household sample survey in Northern Ireland. Total numbers in employment do not equate to total jobs as a person can have more than one job.
Unemployment annual averages data is derived from the Claimant Count as LFS figures fall below suppression thresholds. This is an administrative data source based on the numbers claiming unemployment-related benefits. It uses a different definition of unemployment to the LFS.
Both measures of the labour market are based on the working-age (16-64) population.
Economic Profile
Public Sector Private Sector
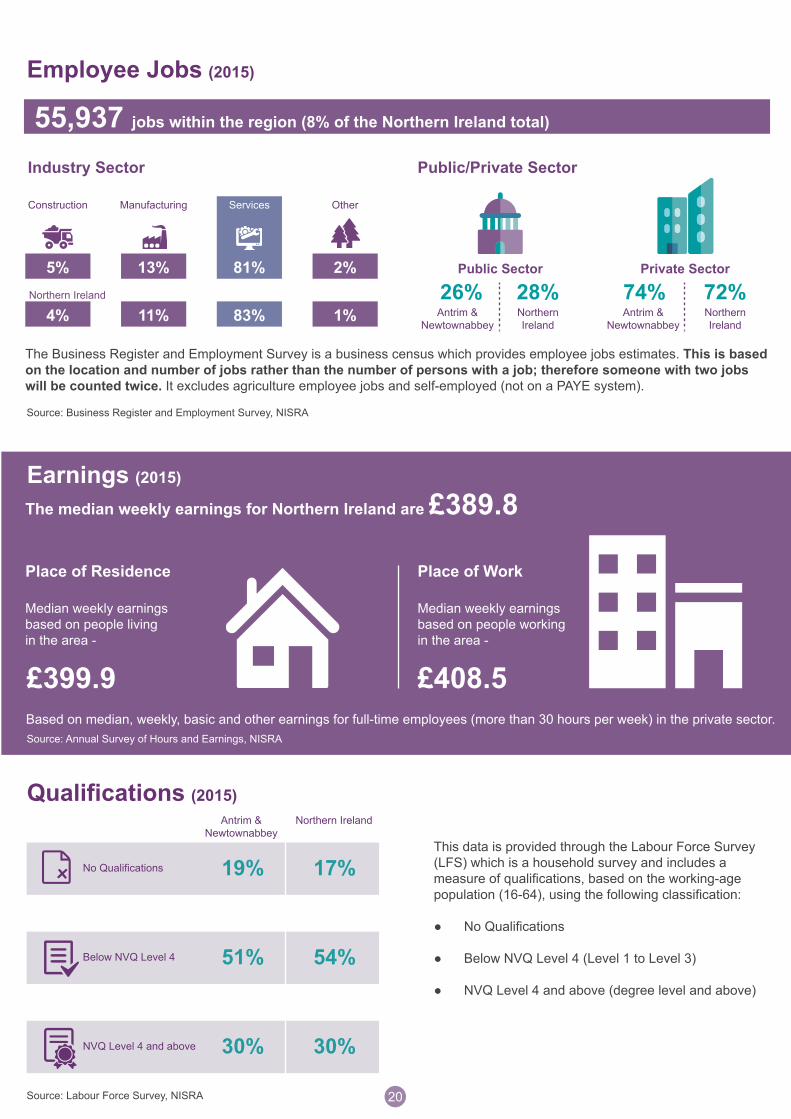
26% 74%28% 72%Antrim &
NewtownabbeyNorthernIreland
Antrim &Newtownabbey
NorthernIreland
Employee Jobs (2015)
Public/Private SectorIndustry Sector
Construction Manufacturing
5% 13%
Services
81%
4% 11% 83% 1%
Other
2%Northern Ireland
Earnings (2015)
Qualifications (2015)
No Qualifications
Below NVQ Level 4
NVQ Level 4 and above
x 19%
51%
30%
17%
54%
30%
Place of WorkPlace of Residence
Northern IrelandAntrim &Newtownabbey
55,937 jobs within the region (8% of the Northern Ireland total)
The median weekly earnings for Northern Ireland are £389.8
Median weekly earningsbased on people livingin the area -
£399.9
Median weekly earningsbased on people workingin the area -
£408.5
The Business Register and Employment Survey is a business census which provides employee jobs estimates. This is based on the location and number of jobs rather than the number of persons with a job; therefore someone with two jobs will be counted twice. It excludes agriculture employee jobs and self-employed (not on a PAYE system).
Based on median, weekly, basic and other earnings for full-time employees (more than 30 hours per week) in the private sector.
This data is provided through the Labour Force Survey (LFS) which is a household survey and includes a measure of qualifications, based on the working-age population (16-64), using the following classification: ● No Qualifications
● Below NVQ Level 4 (Level 1 to Level 3)
● NVQ Level 4 and above (degree level and above)
Source: Business Register and Employment Survey, NISRA
Source: Annual Survey of Hours and Earnings, NISRA
Source: Labour Force Survey, NISRA

21
Business Base (2015)
3,685businesses
MicroBusinesses(0-9employees)
SmallBusinesses(10-49employees)
MediumBusinesses (50-249employees)
LargeBusinesses(250+employees)
Businesses by Size
Businesses by Sector
86%
12%2% 0.4%
Antrim &Newtownabbey
NorthernIreland
18% 14% 8% 60%
25% 13% 6% 55%
Agriculture Production (incl. Manu.)Construction Services
Number of Registered Businesses
This accounts for 5% of all the businesses in Northern Ireland
Business Births
Antrim &Newtownabbey Northern Ireland
9% 10%
The business population is defined here by the Inter Departmental Business Register which excludes smaller businesses and the self-employed who fall below the VAT registered/PAYE thresholds.
A business birth is identified as a business that was present in the latest annual active business population dataset, but not the two previous ones. The birth rate is expressed as a percentage of total active enterprises in the current year. Business demography data excludes the agriculture sector.
Source: Inter Departmental Business Register, NISRA

22
Business Base (2015)
3,685businesses
MicroBusinesses(0-9employees)
SmallBusinesses(10-49employees)
MediumBusinesses (50-249employees)
LargeBusinesses(250+employees)
Businesses by Size
Businesses by Sector
86%
12%2% 0.4%
Antrim &Newtownabbey
NorthernIreland
18% 14% 8% 60%
25% 13% 6% 55%
Agriculture Production (incl. Manu.)Construction Services
Number of Registered Businesses
This accounts for 5% of all the businesses in Northern Ireland
Business Births
Antrim &Newtownabbey Northern Ireland
9% 10%
The business population is defined here by the Inter Departmental Business Register which excludes smaller businesses and the self-employed who fall below the VAT registered/PAYE thresholds.
A business birth is identified as a business that was present in the latest annual active business population dataset, but not the two previous ones. The birth rate is expressed as a percentage of total active enterprises in the current year. Business demography data excludes the agriculture sector.
Source: Inter Departmental Business Register, NISRA corporate informationinvestni.comJune 2017
Antrim&
N’abbey
NorthernIreland
Productivity Work-Place Based (2014)
£36,392£39,148per head per head
Tourism
Visitor Attractions (2015)
visits to visitorattractions
Antrim Castle Gardens & Clotworthy House 357,051
Shane’s Castle 40,000
Clementsmount Fun Farm 16,000
Tourism Jobs (2015)
Overnight Trips & Associated Spend (2015)
4,197 tourism jobs
Total jobs in Antrim & Newtownabbey
9% of all jobs in Northern Ireland are within the tourist industry
0.2movernight trips
to Antrim &Newtownabbey(4% of NI total)
resulting in
£34mexpenditure
(4% of NI total)
8%
Availability of Accommodation (2015)
3,384
3% 2%7%in B&Bs in Self-cateringin Hotels
beds available(8% of NI total)
0.4m
The most popular visitor attractions in 2015 were:-
Productivity is based on the approximate Gross Value Added (aGVA) generated by the non-financial business economy (and excludes public sector). This is measured by the Northern Ireland Annual Business Inquiry based on income, less cost of goods and services used to create this income.
Per head calculations are made using total in employment, rather than the resident population as this can be subject to distortion (due to the effects of commuting and variations in age distribution).
A variety of statistics are used to provide a picture of tourism. These include: passenger and household surveys which measure the number of overnight trips and associated expenditure; occupancy surveys of local hotels and commercial accommodation and the Visitor Attraction Survey.
Source: Northern Ireland Annual Business Inquiry, NISRA
Source: Tourism Statistics, NISRA
(percentage of Northern Ireland total)

23
Mid & East AntrimCouncil Area Profile
Sources: VariousJune 2017
Invest NI Activity (2012-13 to 2016-17)
Total Support = £38.70m Total Investment = £195.29m
No. of Businesses = 351 No. of Offers = 1,112
Jobs Promoted = 1,693 Jobs Created = 1,111
Type of Support Notes
2016-17
2015-16
2014-15
2013-14
2012-13
£7.88m
£30.82m
£69.76m
£125.53m
81
1,031
13
338
640
1,053
287
824
7.35
4.76
5.26
3.43
10.02
2.64
3.68
0.56
0.88
0.14
28.49
26.59
22.91
16.21
31.32
18.74
42.90
2.37
5.36
0.39
127
127
91
83
5
7
9
5
5
245
234
239
152
161
25
23
21
6
6
386
322
75
89
416
224
0
0
0
145
222
267
75
116
61
0
49
86
91
2016-17
2015-16
2014-15
2013-14
2012-13
2016-17
2015-16
2014-15
2013-14
2012-13
●Business totals may not add as a business can be supported in more than one year and can move from local to externally-owned during the 5 year period.
●Does not include £0.75m of support to External Delivery Organisations or universities, which contributes towards £1.17m of investment, as this benefits businesses across all of Northern Ireland.
●’Jobs Promoted’ are those which are expected as a result of the implementation of a business plan. As this happens, they become ‘Jobs Created’.
£m £m
182
121
Externally-Owned Businesses
Locally-Owned Businesses
Jobs Innovation&
Technology
Trade Skills R&D LoanFund
Other
£11.26m
£2.93m£4.42m
£8.49m£9.81m
£1.28m£0.50m

24
Mid & East AntrimCouncil Area Profile
Sources: VariousJune 2017
Invest NI Activity (2012-13 to 2016-17)
Total Support = £38.70m Total Investment = £195.29m
No. of Businesses = 351 No. of Offers = 1,112
Jobs Promoted = 1,693 Jobs Created = 1,111
Type of Support Notes
2016-17
2015-16
2014-15
2013-14
2012-13
£7.88m
£30.82m
£69.76m
£125.53m
81
1,031
13
338
640
1,053
287
824
7.35
4.76
5.26
3.43
10.02
2.64
3.68
0.56
0.88
0.14
28.49
26.59
22.91
16.21
31.32
18.74
42.90
2.37
5.36
0.39
127
127
91
83
5
7
9
5
5
245
234
239
152
161
25
23
21
6
6
386
322
75
89
416
224
0
0
0
145
222
267
75
116
61
0
49
86
91
2016-17
2015-16
2014-15
2013-14
2012-13
2016-17
2015-16
2014-15
2013-14
2012-13
●Business totals may not add as a business can be supported in more than one year and can move from local to externally-owned during the 5 year period.
●Does not include £0.75m of support to External Delivery Organisations or universities, which contributes towards £1.17m of investment, as this benefits businesses across all of Northern Ireland.
●’Jobs Promoted’ are those which are expected as a result of the implementation of a business plan. As this happens, they become ‘Jobs Created’.
£m £m
182
121
Externally-Owned Businesses
Locally-Owned Businesses
Jobs Innovation&
Technology
Trade Skills R&D LoanFund
Other
£11.26m
£2.93m£4.42m
£8.49m£9.81m
£1.28m£0.50m
Externally-Owned First Time Investmentvs Existing Expansions
Externally-Owned Investment by Country
£m
2016-17
2015-16
2014-15
2013-14
2012-13
0.39
5.36
2.37
41.90
18.74
0.00
0.00
0.00
1.00
0.00
£1.00m
£68.76m
First Time Expansions
Oth
ers
£0.0
2m
Top 5 Investors
Investment Secured Assistance Offered
Japan
Northern Ireland
Northern Ireland
USA
Northern Ireland
Ryobi
Wrightbus
Terumo
Caterpillar
Galgorm Manor Hotel
£m0 10 20 30 40
Total externally-owned investment secured was £69.76m. This is defined as investment in the area by businesses where at least 50% of ownership is based outside Northern Ireland. The figures include the support that Invest NI offers these businesses.
Jobs above NI Private Sector Median (PSM)For specific projects Invest NI measures the quality of the jobs by the proportion of those jobs that attract salaries above the Northern Ireland PSM wage - the average annual wage for the private sector, which is £20,800 for 2016.
Abov
eBe
low
All Jobs Locally-Owned Jobs Externally-Owned Jobs
NI PSM54%46%
46%54%
73%27%
United Statesof America(USA)£10.3m
Japan£53.3m
RoI£4.9m
Great Britain (GB)£1.2m

25
6,786Employment
£1,358mAll Sales
£1,192mExternal
Sales
£678mExportSales
SupportedBusinesses
76
Key Performance Indicators (KPIs) are collected from a sub-set of Invest NI supported businesses with potential for growth through external markets. KPIs are geographically assigned based on the business’ HQ location. These include all sales, external sales, exports and employment.
Per employee ratios are provided to enable comparisons across all businesses in the Invest NI portfolio.
Sectors are classified according to Invest NI’s sector reporting structure which is based on supported businesses’ main product/service within Northern Ireland.
Invest NI Supported Businesses’ Performance (2015)
Per Employee RatiosMid & East
AntrimAll Invest NI Businesses
Sales per Employee £200,187 £146,156
External Sales per Employee (Outside NI) £175,714 £109,714
Export Sales per Employee (Outside UK) £99,924 £52,704
Limavady
Dungiven
Turnover by Sector
Total Turnover £1,358m
Total Employment 6,786
Employment by Sector
AdvancedEngineering &Manufacturing£974m (71.7%)
Agri-Food£178m (13.1%)
Construction£113m (8.3%)
Financial, Prof. & Business£28m (2.0%)
Life &Health£49m(3.6%)
Other £17m(1.3%)
Advanced Engineering &Manufacturing4,315 (63.6%)
Agri-Food449 (6.6%)
Financial,Prof. & Business288 (4.2%)
Construction877 (12.9%)
Life & Health482 (7.1%)
Other375 (5.5%)

26
6,786Employment
£1,358mAll Sales
£1,192mExternal
Sales
£678mExportSales
SupportedBusinesses
76
Key Performance Indicators (KPIs) are collected from a sub-set of Invest NI supported businesses with potential for growth through external markets. KPIs are geographically assigned based on the business’ HQ location. These include all sales, external sales, exports and employment.
Per employee ratios are provided to enable comparisons across all businesses in the Invest NI portfolio.
Sectors are classified according to Invest NI’s sector reporting structure which is based on supported businesses’ main product/service within Northern Ireland.
Invest NI Supported Businesses’ Performance (2015)
Per Employee RatiosMid & East
AntrimAll Invest NI Businesses
Sales per Employee £200,187 £146,156
External Sales per Employee (Outside NI) £175,714 £109,714
Export Sales per Employee (Outside UK) £99,924 £52,704
Limavady
Dungiven
Turnover by Sector
Total Turnover £1,358m
Total Employment 6,786
Employment by Sector
AdvancedEngineering &Manufacturing£974m (71.7%)
Agri-Food£178m (13.1%)
Construction£113m (8.3%)
Financial, Prof. & Business£28m (2.0%)
Life &Health£49m(3.6%)
Other £17m(1.3%)
Advanced Engineering &Manufacturing4,315 (63.6%)
Agri-Food449 (6.6%)
Financial,Prof. & Business288 (4.2%)
Construction877 (12.9%)
Life & Health482 (7.1%)
Other375 (5.5%)
TotalPopulation137,145
Population by Age
7% of total NI population
0-15 years
16-39 years
40-64 years
65+ years
19%
29%34%
18%(NI 21%)
(NI 31%)(NI 32%)
(NI 16%)
Labour Market Structure (2015)
Mid & East Antrim Northern Ireland
77% 73%economicallyactive
economicallyactive
23% 27%economicallyinactive
economicallyinactive
Population (2015)
●Total Employed 61,000 (74% rate)
●Self-Employed sample size too small for a reliable estimate
In Employment
3%of population claimingunemployment benefit
and of this number
Mid & East Antrim
are long-term(over one year)
32%
are youth(aged 18-24)
27%
4%of population claimingunemployment benefit
and of this number
Northern Ireland
are long-term(over one year)
37%
are youth(aged 18-24)
26%
Unemployment Claimants
Mid & EastAntrim
Northern Ireland
●Total Employed 798,000 (68% rate)
●Self-Employed 98,000 (12% rate)
Source: Mid Year Population Estimates, NISRA
Source: Labour Force Survey, NISRA
Source: Claimant Count, NISRA
The labour market structure is composed of the economically active (people in employment and seeking work) and inactive (not seeking nor available for work). This data is provided through the Labour Force Survey (LFS), the largest regular household sample survey in Northern Ireland. Total numbers in employment do not equate to total jobs as a person can have more than one job.
Unemployment annual averages data is derived from the Claimant Count as LFS figures fall below suppression thresholds. This is an administrative data source based on the numbers claiming unemployment-related benefits. It uses a different definition of unemployment to the LFS.
Both measures of the labour market are based on the working-age (16-64) population.
Economic Profile

27
Public Sector Private Sector
23% 77%28% 72%Mid & East
AntrimNorthernIreland
Mid & EastAntrim
NorthernIreland
Employee Jobs (2015)
Public/Private SectorIndustry Sector
Construction Manufacturing
5% 21%
Services
72%
4% 11% 83% 1%
Other
2%Northern Ireland
Earnings (2015)
Qualifications (2015)
No Qualifications
Below NVQ Level 4
NVQ Level 4 and above
x 17%
58%
26%
17%
54%
30%
Place of WorkPlace of Residence
Northern IrelandMid & EastAntrim
43,498 jobs within the region (6% of the Northern Ireland total)
The median weekly earnings for Northern Ireland are £389.8
Median weekly earningsbased on people livingin the area -
£392.3
Median weekly earningsbased on people workingin the area -
£383.5
The Business Register and Employment Survey is a business census which provides employee jobs estimates. This is based on the location and number of jobs rather than the number of persons with a job; therefore someone with two jobs will be counted twice. It excludes agriculture employee jobs and self-employed (not on a PAYE system).
Based on median, weekly, basic and other earnings for full-time employees (more than 30 hours per week) in the private sector.
This data is provided through the Labour Force Survey (LFS) which is a household survey and includes a measure of qualifications, based on the working-age population (16-64), using the following classification: ● No Qualifications
● Below NVQ Level 4 (Level 1 to Level 3)
● NVQ Level 4 and above (degree level and above)
Source: Business Register and Employment Survey, NISRA
Source: Annual Survey of Hours and Earnings, NISRA
Source: Labour Force Survey, NISRA

28
Public Sector Private Sector
23% 77%28% 72%Mid & East
AntrimNorthernIreland
Mid & EastAntrim
NorthernIreland
Employee Jobs (2015)
Public/Private SectorIndustry Sector
Construction Manufacturing
5% 21%
Services
72%
4% 11% 83% 1%
Other
2%Northern Ireland
Earnings (2015)
Qualifications (2015)
No Qualifications
Below NVQ Level 4
NVQ Level 4 and above
x 17%
58%
26%
17%
54%
30%
Place of WorkPlace of Residence
Northern IrelandMid & EastAntrim
43,498 jobs within the region (6% of the Northern Ireland total)
The median weekly earnings for Northern Ireland are £389.8
Median weekly earningsbased on people livingin the area -
£392.3
Median weekly earningsbased on people workingin the area -
£383.5
The Business Register and Employment Survey is a business census which provides employee jobs estimates. This is based on the location and number of jobs rather than the number of persons with a job; therefore someone with two jobs will be counted twice. It excludes agriculture employee jobs and self-employed (not on a PAYE system).
Based on median, weekly, basic and other earnings for full-time employees (more than 30 hours per week) in the private sector.
This data is provided through the Labour Force Survey (LFS) which is a household survey and includes a measure of qualifications, based on the working-age population (16-64), using the following classification: ● No Qualifications
● Below NVQ Level 4 (Level 1 to Level 3)
● NVQ Level 4 and above (degree level and above)
Source: Business Register and Employment Survey, NISRA
Source: Annual Survey of Hours and Earnings, NISRA
Source: Labour Force Survey, NISRA
Business Base (2015)
4,505businesses
MicroBusinesses(0-9employees)
SmallBusinesses(10-49employees)
MediumBusinesses (50-249employees)
LargeBusinesses(250+employees)
Businesses by Size
Businesses by Sector
90%
8%1% 0%
Mid & EastAntrim
NorthernIreland
30% 12% 7% 51%
25% 13% 6% 55%
Agriculture Production (incl. Manu.)Construction Services
Number of Registered Businesses
This accounts for 7% of all the businesses in Northern Ireland
Business Births
Mid & EastAntrim Northern Ireland
9% 10%
The business population is defined here by the Inter Departmental Business Register which excludes smaller businesses and the self-employed who fall below the VAT registered/PAYE thresholds.
A business birth is identified as a business that was present in the latest annual active business population dataset, but not the two previous ones. The birth rate is expressed as a percentage of total active enterprises in the current year. Business demography data excludes the agriculture sector.
Source: Inter Departmental Business Register, NISRA

29corporate informationinvestni.com
June 2017
Mid &East
Antrim
NorthernIreland
Productivity Work-Place Based (2014)
£36,392£63,274per head per head
Tourism
Visitor Attractions (2015)
visits to visitorattractions
Shaftesbury Park 63,800
Carrickfergus Castle 53,692
Mid Antrim Museum at the Braid 26,111
Tourism Jobs (2015)
Overnight Trips & Associated Spend (2015)
3,959 tourism jobs
Total jobs in Mid & East Antrim
9% of all jobs in Northern Ireland are within the tourist industry
0.4movernight tripsto Mid & East
Antrim(8% of NI total)
resulting in
£46mexpenditure
(6% of NI total)
9%
Availability of Accommodation (2015)
1,947
8% 3%6%in B&Bs in Self-cateringin Hotels
beds available(4% of NI total)
0.6m
The most popular visitor attractions in 2015 were:-
Productivity is based on the approximate Gross Value Added (aGVA) generated by the non-financial business economy (and excludes public sector). This is measured by the Northern Ireland Annual Business Inquiry based on income, less cost of goods and services used to create this income.
Per head calculations are made using total in employment, rather than the resident population as this can be subject to distortion (due to the effects of commuting and variations in age distribution).
A variety of statistics are used to provide a picture of tourism. These include: passenger and household surveys which measure the number of overnight trips and associated expenditure; occupancy surveys of local hotels and commercial accommodation and the Visitor Attraction Survey.
Source: Northern Ireland Annual Business Inquiry, NISRA
Source: Tourism Statistics, NISRA
(percentage of Northern Ireland total)

30
Appendices

Appendices Population, 2015
Data Tables
Council or RegionAge Band
0-15Age Band
0-15 % Age Band
16-39 Age Band 16-39 %
Age Band 40-64
Age Band 40-64 %
Age Band 65+
Age Band65+ % All Population
All (% NI Population)
Antrim & Newtownabbey 29,484 21% 43,109 31% 45,495 32% 22,379 16% 140,467 8%
Ards & North Down 29,801 19% 43,239 27% 54,094 34% 31,663 20% 158,797 9%
Armagh, Banbridge & Craigavon 46,040 22% 65,286 31% 65,490 32% 30,981 15% 207,797 11%
Belfast 66,581 20% 122,942 36% 100,076 30% 49,308 15% 338,907 18%
Causeway Coast & Glens 28,506 20% 42,613 30% 47,597 33% 24,432 17% 143,148 8%
Derry & Strabane 32,745 22% 47,838 32% 47,955 32% 20,935 14% 149,473 8%
Fermanagh & Omagh 24,909 22% 34,679 30% 37,567 33% 18,156 16% 115,311 6%
Lisburn & Castlereagh 28,053 20% 41,571 30% 46,942 33% 23,639 17% 140,205 8%
Mid & East Antrim 26,224 19% 39,352 29% 46,711 34% 24,858 18% 137,145 7%
Mid Ulster 33,123 23% 47,646 33% 43,621 30% 19,612 14% 144,002 8%
Newry, Mourne & Down 39,734 23% 54,841 31% 55,933 32% 25,861 15% 176,369 10%
Eastern 66,581 20% 122,942 36% 100,076 30% 49,308 15% 338,907 18%
North Eastern 55,708 20% 82,461 30% 92,206 33% 47,237 17% 277,612 15%
North Western 61,251 21% 90,451 31% 95,552 33% 45,367 16% 292,621 16%
Southern 97,588 21% 139,651 29% 156,969 33% 81,163 17% 475,371 26%
Western 104,072 22% 147,611 32% 146,678 31% 68,749 15% 467,110 25%
NI 385,200 21% 583,116 31% 591,481 32% 291,824 16% 1,851,621 100%
Council or Region
Economically Active
Number
Economically ActiveRate
Economically Inactive Number
Economically Inactive
Rate Employment
Number Employment
Rate
Self-Employed Number
Self-Employed
Rate
Claimant Count
Number
Claimant Count Rate
Claimant Count 18-24
Claimant Count18-24
(% of total)
Claimant Count
Over One Year
Claimant Count
Over One Year
(% of total)
Antrim & Newtownabbey 65,000 75% 21,000 25% 61,000 71% 6,000 10% 2,330 3% 645 28% 730 32%
Ards & North Down 73,000 78% 21,000 22% 69,000 74% 11,000 16% 2,965 3% 750 25% 1,085 37%
Armagh, Banbridge & Craigavon 98,000 74% 35,000 26% 93,000 69% 9,000 10% 3,825 3% 965 25% 1,265 33%
Belfast 154,000 70% 66,000 30% 146,000 66% 9,000 6% 10,852 5% 2,685 25% 4,130 39%
Causeway Coast & Glens 61,000 70% 26,000 30% 55,000 62% 7,000 13% 3,373 4% 905 27% 1,240 37%
Derry & Strabane 66,000 67% 32,000 33% 58,000 60% 7,000 13% 6,720 7% 1,705 26% 3,000 46%
Fermanagh & Omagh 56,000 77% 17,000 23% 54,000 74% 11,000 20% 2,490 3% 575 24% 910 38%
Lisburn & Castlereagh 66,000 77% 20,000 24% 62,000 72% * * 1,969 2% 555 28% 595 31%
Mid & East Antrim 64,000 77% 19,000 23% 61,000 74% * * 2,489 3% 655 27% 770 32%
Mid Ulster 68,000 73% 25,000 27% 64,000 69% 9,000 14% 2,244 3% 570 27% 555 26%
Newry, Mourne & Down 79,000 70% 33,000 30% 74,000 66% 16,000 22% 3,769 3% 920 25% 1,380 37%
Eastern 154,000 70% 66,000 30% 146,000 66% 9,000 6% 10,852 5% 2,685 25% 4,130 39%
North Eastern 129,000 76% 40,000 24% 122,000 72% 12,000 10% 4,819 3% 1,300 29% 1,500 34%
North Western 127,000 68% 59,000 32% 113,000 61% 14,000 13% 10,093 5% 2,610 26% 4,240 43%
Southern 217,000 75% 74,000 26% 206,000 71% 33,000 16% 8,703 3% 2,225 26% 3,060 35%
Western 223,000 74% 77,000 26% 210,000 70% 29,000 14% 8,559 3% 2,110 24% 2,730 32%
NI 850,000 73% 317,000 27% 798,000 68% 98,000 12% 43,024 4% 10,925 26% 15,655 37%
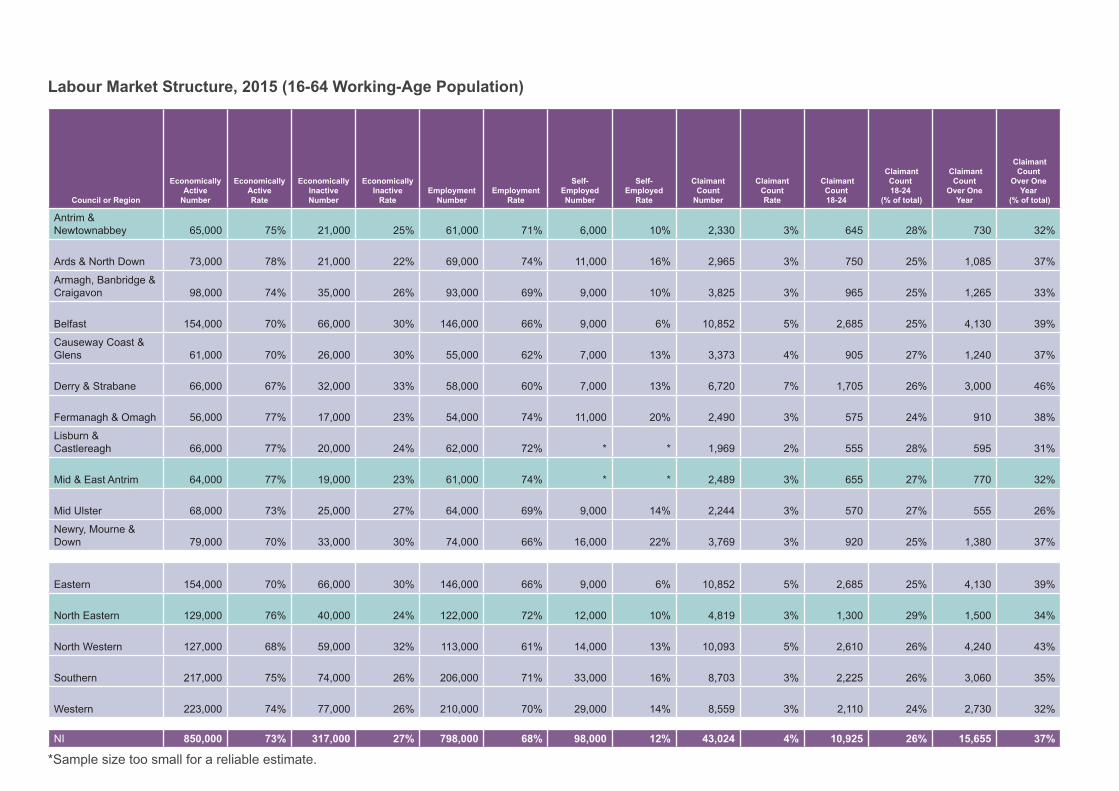
Labour Market Structure, 2015 (16-64 Working-Age Population)
*Sample size too small for a reliable estimate.

Council or Region All Jobs
% of All Northern
Ireland Jobs ConstructionConstruction
% ManufacturingManufacturing
% Services Services
% OtherOther
% Public Sector Private Sector
Antrim & Newtownabbey 55,937 8% 2,587 5% 7,370 13% 45,086 81% 894 2% 14,356 (26%) 41,581 (74%)
Ards & North Down 38,182 5% 1,200 3% 2,825 7% 33,834 89% 323 1% 9,250 (24%) 28,932 (76%)
Armagh, Banbridge & Craigavon 70,101 10% 3,356 5% 11,757 17% 53,851 77% 1,137 2% 18,748 (27%) 51,353 (73%)
Belfast 220,190 31% 4,481 2% 9,643 4% 203,933 93% 2,133 1% 69,283 (31%) 150,907 (69%)
Causeway Coast & Glens 39,552 6% 2,074 5% 3,654 9% 33,354 84% 470 1% 10,557 (27%) 28,995 (73%)
Derry & Strabane 53,630 7% 2,235 4% 5,092 9% 45,658 85% 645 1% 18,453 (34%) 35,177 (66%)
Fermanagh & Omagh 39,426 5% 2,724 7% 4,809 12% 31,085 79% 808 2% 12,485 (32%) 26,941 (68%)
Lisburn & Castlereagh 54,092 8% 2,813 5% 5,141 10% 45,599 84% 539 1% 17,692 (33%) 36,400 (67%)
Mid & East Antrim 43,498 6% 2,053 5% 9,173 21% 31,344 72% 928 2% 10,195 (23%) 33,303 (77%)
Mid Ulster 50,156 7% 4,425 9% 13,880 28% 30,969 62% 882 2% 9,571 (19%) 40,585 (81%)
Newry, Mourne & Down 52,341 7% 3,458 7% 6,669 13% 41,018 78% 1,196 2% 13,771 (26%) 38,570 (74%)
Eastern 220,190 31% 4,481 2% 9,643 4% 203,933 93% 2,133 1% 69,283 (31%) 150,907 (69%)
North Eastern 99,435 14% 4,640 5% 16,543 17% 76,430 77% 1,822 2% 24,551 (25%) 74,884 (75%)
North Western 93,182 13% 4,309 5% 8,746 9% 79,012 85% 1,115 1% 29,010 (31%) 64,172 (69%)
Southern 144,615 20% 7,471 5% 14,635 10% 120,451 83% 2,058 1% 40,713 (28%) 103,902 (72%)
Western 159,683 22% 10,505 7% 30,446 19% 115,905 73% 2,827 2% 40,804 (26%) 118,879 (74%)
NI 717,105 100% 31,406 4% 80,013 11% 595,731 83% 9,955 1% 204,361 (28%) 512,744 (72%)
Employee Jobs, 2015

Earnings (Basic and Other, Full-Time, Private Sector), 2015 and Qualifications, 2015 and Productivity, 2014
Council or RegionMedian Weekly Earnings
Place of ResidenceMedian Weekly Earnings
Place of Work No QualificationsQualifications
Below NVQ Level 4 Qualifications
NVQ Level 4 and above
ProductivityGross Value Added
per Head Workplace
Antrim & Newtownabbey £399.9 £408.5 16,000 (19%) 43,000 (51%) 25,000 (30%) £39,148
Ards & North Down £440.0 £390.4 10,000 (11%) 49,000 (53%) 32,000 (35%) £25,849
Armagh, Banbridge & Craigavon £364.6 £357.4 24,000 (18%) 76,000 (58%) 32,000 (24%) £34,178
Belfast £420.6 £471.7 36,000 (17%) 109,000 (51%) 70,000 (33%) £37,594
Causeway Coast & Glens £340.8 £316.2 16,000 (18%) 53,000 (60%) 19,000 (22%) £27,475
Derry & Strabane £336.0 £340.0 20,000 (21%) 49,000 (51%) 27,000 (28%) £30,351
Fermanagh & Omagh £372.8 £372.8 11,000 (15%) 42,000 (59%) 19,000 (27%) £33,130
Lisburn & Castlereagh £458.3 £380.2 8,000 (10%) 40,000 (49%) 34,000 (41%) £31,118
Mid & East Antrim £392.3 £383.5 13,000 (17%) 47,000 (58%) 21,000 (26%) £63,274
Mid Ulster £365.0 £355.7 17,000 (20%) 48,000 (54%) 24,000 (27%) £38,469
Newry, Mourne & Down £384.6 £373.7 16,000 (14%) 57,000 (52%) 38,000 (34%) £33,663
Eastern £420.6 £471.7 36,000 (17%) 109,000 (51%) 70,000 (33%) £37,594
North Eastern £397.5 £395.7 29,000 (18%) 90,000 (54%) 46,000 (28%) £49,459
North Western £340.0 £325.6 36,000 (20%) 101,000 (55%) 46,000 (25%) £29,065
Southern £427.3 £380.8 34,000 (12%) 146,000 (51%) 104,000 (37%) £30,711
Western £364.7 £359.1 52,000 (18%) 166,000 (57%) 75,000 (26%) £35,436
NI £389.8 £389.8 188,000 (17%) 613,000 (54%) 342,000 (30%) £36,392
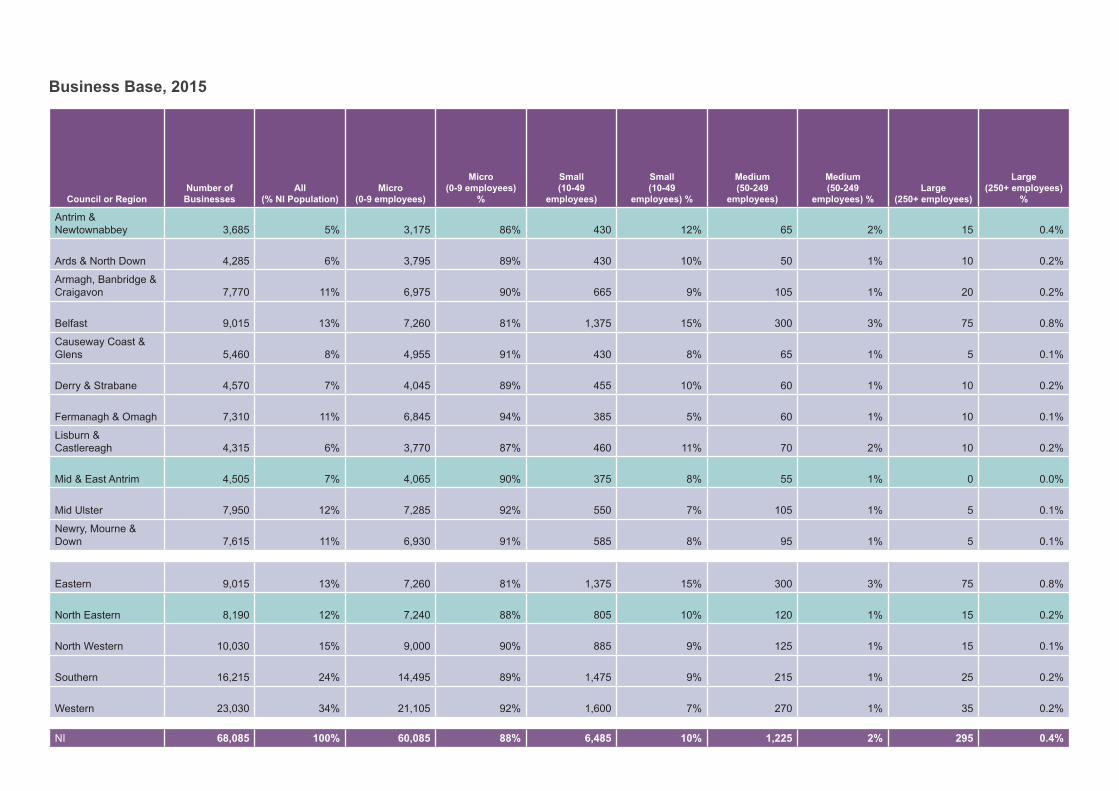
Business Base, 2015
Council or RegionNumber of
BusinessesAll
(% NI Population) Micro
(0-9 employees)
Micro (0-9 employees)
%
Small (10-49
employees)
Small (10-49
employees) %
Medium (50-249
employees)
Medium (50-249
employees) %Large
(250+ employees)
Large (250+ employees)
%
Antrim & Newtownabbey 3,685 5% 3,175 86% 430 12% 65 2% 15 0.4%
Ards & North Down 4,285 6% 3,795 89% 430 10% 50 1% 10 0.2%
Armagh, Banbridge & Craigavon 7,770 11% 6,975 90% 665 9% 105 1% 20 0.2%
Belfast 9,015 13% 7,260 81% 1,375 15% 300 3% 75 0.8%
Causeway Coast & Glens 5,460 8% 4,955 91% 430 8% 65 1% 5 0.1%
Derry & Strabane 4,570 7% 4,045 89% 455 10% 60 1% 10 0.2%
Fermanagh & Omagh 7,310 11% 6,845 94% 385 5% 60 1% 10 0.1%
Lisburn & Castlereagh 4,315 6% 3,770 87% 460 11% 70 2% 10 0.2%
Mid & East Antrim 4,505 7% 4,065 90% 375 8% 55 1% 0 0.0%
Mid Ulster 7,950 12% 7,285 92% 550 7% 105 1% 5 0.1%
Newry, Mourne & Down 7,615 11% 6,930 91% 585 8% 95 1% 5 0.1%
Eastern 9,015 13% 7,260 81% 1,375 15% 300 3% 75 0.8%
North Eastern 8,190 12% 7,240 88% 805 10% 120 1% 15 0.2%
North Western 10,030 15% 9,000 90% 885 9% 125 1% 15 0.1%
Southern 16,215 24% 14,495 89% 1,475 9% 215 1% 25 0.2%
Western 23,030 34% 21,105 92% 1,600 7% 270 1% 35 0.2%
NI 68,085 100% 60,085 88% 6,485 10% 1,225 2% 295 0.4%

Business Base, 2015
Council or Region Agriculture Agriculture % Construction Construction %
Production(incl
Manufacturing)
Production(incl
Manufacturing) % Services Services %Business
Births
BusinessBirthRate
Antrim & Newtownabbey 670 18% 510 14% 280 8% 2,220 60% 300 9%
Ards & North Down 585 14% 555 13% 295 7% 2,855 67% 395 9%
Armagh, Banbridge & Craigavon 2,305 30% 1,025 13% 495 6% 3,945 51% 605 10%
Belfast 30 0.3% 815 9% 425 5% 7,755 86% 1,165 11%
Causeway Coast & Glens 1,865 34% 800 15% 275 5% 2,510 46% 380 9%
Derry & Strabane 1,180 26% 655 14% 290 6% 2,445 54% 455 12%
Fermanagh & Omagh 3,405 47% 880 12% 380 5% 2,645 36% 390 9%
Lisburn & Castlereagh 630 15% 615 14% 325 8% 2,735 63% 395 10%
Mid & East Antrim 1,345 30% 540 12% 315 7% 2,295 51% 300 9%
Mid Ulster 2,950 37% 1,295 16% 720 9% 2,990 38% 495 9%
Newry, Mourne & Down 2,145 28% 1,215 16% 485 6% 3,775 50% 560 9%
Eastern 30 0.3% 815 9% 425 5% 7,755 86% 1,165 11%
North Eastern 2,015 25% 1,050 13% 595 7% 4,515 55% 600 9%
North Western 3,045 30% 1,455 15% 565 6% 4,955 49% 835 10%
Southern 3,360 21% 2,385 15% 1,105 7% 9,365 58% 1,350 9%
Western 8,660 38% 3,200 14% 1,595 7% 9,580 42% 1,490 9%
NI 17,255 25% 8,975 13% 4,380 6% 37,475 55% 5,440 10%
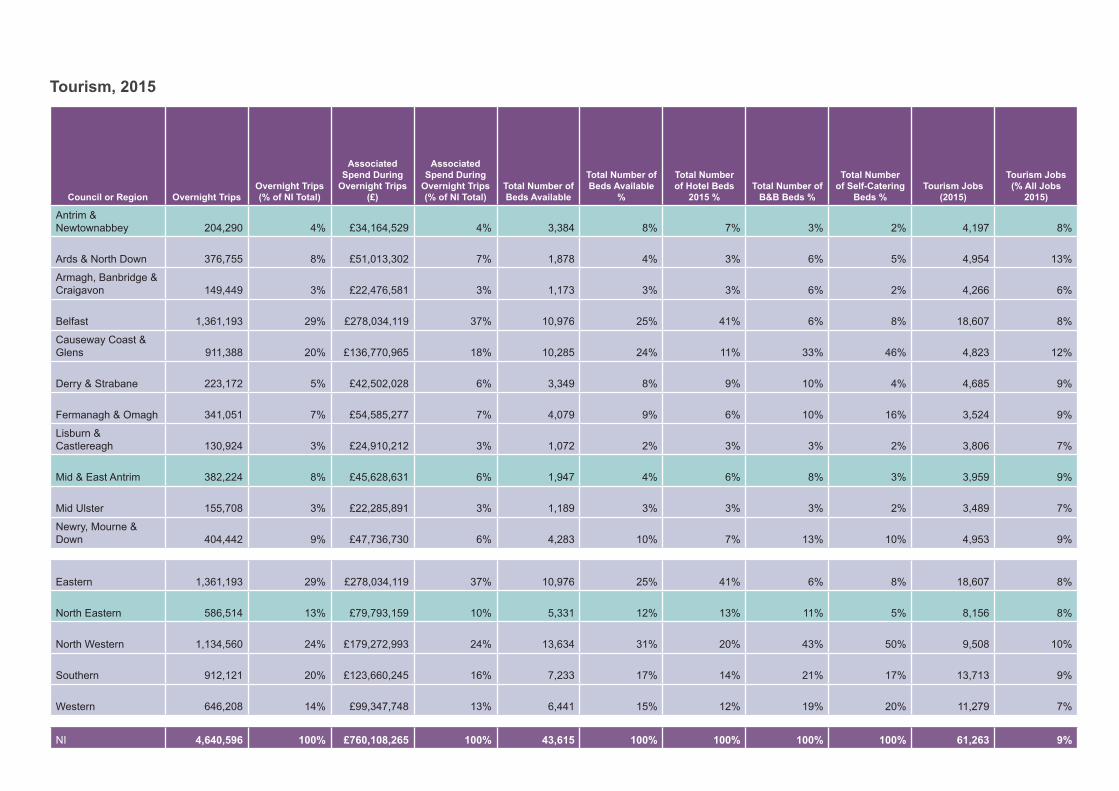
Tourism, 2015
Council or Region Overnight TripsOvernight Trips(% of NI Total)
Associated Spend During
Overnight Trips (£)
Associated Spend During
Overnight Trips (% of NI Total)
Total Number of Beds Available
Total Number of Beds Available
%
Total Number of Hotel Beds
2015 %Total Number of
B&B Beds %
Total Number of Self-Catering
Beds %Tourism Jobs
(2015)
Tourism Jobs (% All Jobs
2015)
Antrim & Newtownabbey 204,290 4% £34,164,529 4% 3,384 8% 7% 3% 2% 4,197 8%
Ards & North Down 376,755 8% £51,013,302 7% 1,878 4% 3% 6% 5% 4,954 13%
Armagh, Banbridge & Craigavon 149,449 3% £22,476,581 3% 1,173 3% 3% 6% 2% 4,266 6%
Belfast 1,361,193 29% £278,034,119 37% 10,976 25% 41% 6% 8% 18,607 8%
Causeway Coast & Glens 911,388 20% £136,770,965 18% 10,285 24% 11% 33% 46% 4,823 12%
Derry & Strabane 223,172 5% £42,502,028 6% 3,349 8% 9% 10% 4% 4,685 9%
Fermanagh & Omagh 341,051 7% £54,585,277 7% 4,079 9% 6% 10% 16% 3,524 9%
Lisburn & Castlereagh 130,924 3% £24,910,212 3% 1,072 2% 3% 3% 2% 3,806 7%
Mid & East Antrim 382,224 8% £45,628,631 6% 1,947 4% 6% 8% 3% 3,959 9%
Mid Ulster 155,708 3% £22,285,891 3% 1,189 3% 3% 3% 2% 3,489 7%
Newry, Mourne & Down 404,442 9% £47,736,730 6% 4,283 10% 7% 13% 10% 4,953 9%
Eastern 1,361,193 29% £278,034,119 37% 10,976 25% 41% 6% 8% 18,607 8%
North Eastern 586,514 13% £79,793,159 10% 5,331 12% 13% 11% 5% 8,156 8%
North Western 1,134,560 24% £179,272,993 24% 13,634 31% 20% 43% 50% 9,508 10%
Southern 912,121 20% £123,660,245 16% 7,233 17% 14% 21% 17% 13,713 9%
Western 646,208 14% £99,347,748 13% 6,441 15% 12% 19% 20% 11,279 7%
NI 4,640,596 100% £760,108,265 100% 43,615 100% 100% 100% 100% 61,263 9%

38
Notes
All Invest NI results are provisional and subject to revision as more up-to-date information becomes available. For NISRA datasets please refer to the original data source.
Invest NI Activity Data:●Number of offers of support is greater than the number of businesses supported, as a business can receive more than one offer from Invest NI per annum.
●Total investment figures include the assistance offered by Invest NI.
●In addition to the support offered directly to businesses detailed in the briefing, Invest NI offered support indirectly to businesses through other organisations like universities and External Delivery Organisations (EDOs) that administered schemes on our behalf. This support will benefit business in all areas across Northern Ireland.
●‘Jobs Promoted’ are those jobs which supported businesses expect to create in future years as a result of the implementation of a business plan. Promoted jobs become ‘Jobs Created’ as the business plan is implemented and the promoted jobs are filled. Jobs Created may relate to investments secured in earlier years. Therefore, it is not possible to directly compare the number of jobs promoted in a particular period with those that have been created during the same period.
●When measuring Job Quality, or the number of jobs above the Northern Ireland Private Sector Median (PSM), support schemes designed to boost employment over the short-term are not included. This is due to wage levels not being taken into account in the final funding decision.
●Externally-Owned First Time Investment refers to Greenfield investment in Northern Ireland by an externally-owned business that has not been assisted before. Externally-Owned Existing Expansions refers to investment by externally-owned businesses that already have a presence in Northern Ireland.
Economic Profile Data:●Population estimates are based on the Mid-Year Population Estimates derived from the Report of the Registrar General as of the 30 June each year.
●Labour market structure is based on the Labour Force Survey (LFS) Local Area Database which is an annual database comprising four consecutive quarters of the LFS and facilitates extensive sub-regional analysis. The LFS is the largest regular household survey in Northern Ireland and provides a rich source of information on the labour force using internationally agreed concepts and definitions.
●Unemployment statistics are based on Claimant Count Annual Averages which is an administrative data source, derived from Jobs and Benefits Offices systems, and records the number of people aged 16-64 claiming Jobseeker’s Allowance. Claimants must declare that they are out of work, capable of, available for and actively seeking work during the week in which their claim is made.
●Employee Jobs are collected through the Business Register and Employment Survey which is a survey of employers in Northern Ireland. The survey provides employee job estimates for Northern Ireland as a whole, split by four broad industries: Construction, Manufacturing, Services and ‘Other’. The ‘Other’ category includes the following sectors: Animal Husbandry Services, Hunting, Trapping and Game Propagation, Forestry and Fishing; Mining and Quarrying; Electricity, Gas, Steam and Air Conditioning Supply; and Water Supply, Sewerage, Waste Management and Remediation Activities.

39
●Earnings data is provided through the Annual Survey of Hours and Earnings, a UK wide survey that provides data on hourly, weekly and annual earnings by gender, work patterns, industry and occupation, including public versus private sector pay comparisons. Basic and other pay includes: all basic pay, relating to the pay period, before deductions for PAYE, National Insurance, pension schemes, student loan repayments and voluntary deductions. This includes paid leave, maternity pay, sick pay and area allowances. It also includes, for example, car allowances paid through the payroll, on call and standby allowances, clothing, first aider or fire fighter allowances. It excludes pay for a different pay period, shift premium pay, bonus or incentive pay, overtime pay, expenses and the value of salary sacrifice schemes and benefits in kind.
●Qualifications data is based on the Labour Force Survey (LFS) Local Area Database which is an annual database comprising four consecutive quarters of the LFS and facilitates extensive sub-regional analysis.
●Business base and births information comes from the Inter-Department Business Register (IDBR) which is a central register containing information on all businesses in the UK which are VAT registered or operating a PAYE scheme. The Northern Ireland element of the register is maintained by NISRA. IDBR does not include very small businesses which are not VAT registered (the threshold for VAT in 2015/16 was £82,000) unless they operate a PAYE scheme.
●Productivity data comes from the Northern Ireland Annual Business Inquiry which is a key resource for measuring the size, performance and structure of the Northern Ireland non-financial business economy. It collects both financial and employment information from businesses and other establishments and covers about two-thirds of the economy. The survey covers the Production, Construction, Distribution and Service industries but it excludes public sector activity for the most part. Approximate Gross Value Added (aGVA) represents the income generated by businesses, out of which is paid wages and salaries, the cost of capital investment and financial charges before arriving at a figure for profit. It includes taxes on production (e.g. business rates), net of subsidies but excludes subsidies and taxes on products (e.g. VAT and excise duty). This is an output-based measure of aGVA and all published aGVA is given at basic prices.
●Tourism statistics use a series of measures to form a more complete picture of tourism within Northern Ireland. Two key measures of tourism are the number of overnight trips and the associated expenditure (based on passenger and household surveys). Other measures include rooms sold in commercial accommodation (monthly occupancy surveys), visitor attraction visits (annual Visitor Attraction Survey) and tourism employment (Business Register and Employment Survey). Local tourism can be impacted by initiatives from government, tourism agencies and events as well as the local film industry and the political and economic situation.

40
Data Sources
Population: Mid Year Population Estimates, 2015 (NISRA) Labour Market: Labour Force Survey - Local Area Database, 2015 (NISRA) Claimant Count: Claimant Count Tables, December 2016 (NISRA)
Jobs: Business Register and Employment Survey, 2015 (NISRA)
Earnings: Annual Survey of Hours and Earnings, 2015 (NISRA)
Qualifications: Labour Force Survey - Local Area Database, 2015 (NISRA) Business Base: Inter Departmental Business Register, 2015 (NISRA) Productivity: Northern Ireland Annual Business Inquiry, 2014 (NISRA)
Tourism: LGD Tourism Statistics, 2015 (NISRA)

41
corporate informationinvestni.com
If you would like further informationregarding this report please contact:
Corporate Information Team
E-Mail: [email protected]


