N.C. Weekly Influenza Summary - February 1, 2020 1
NORTH CAROLINA WEEKLY INFLUENZA SURVEILLANCE SUMMARY2019-2020 INFLUENZA SEASONWEEK ENDING FEBRUARY 1, 2020
ILINet has now expanded to include emergency department data that were previously reported separately.
*For more information about national data visit https://www.cdc.gov/flu/weekly/index.htm.
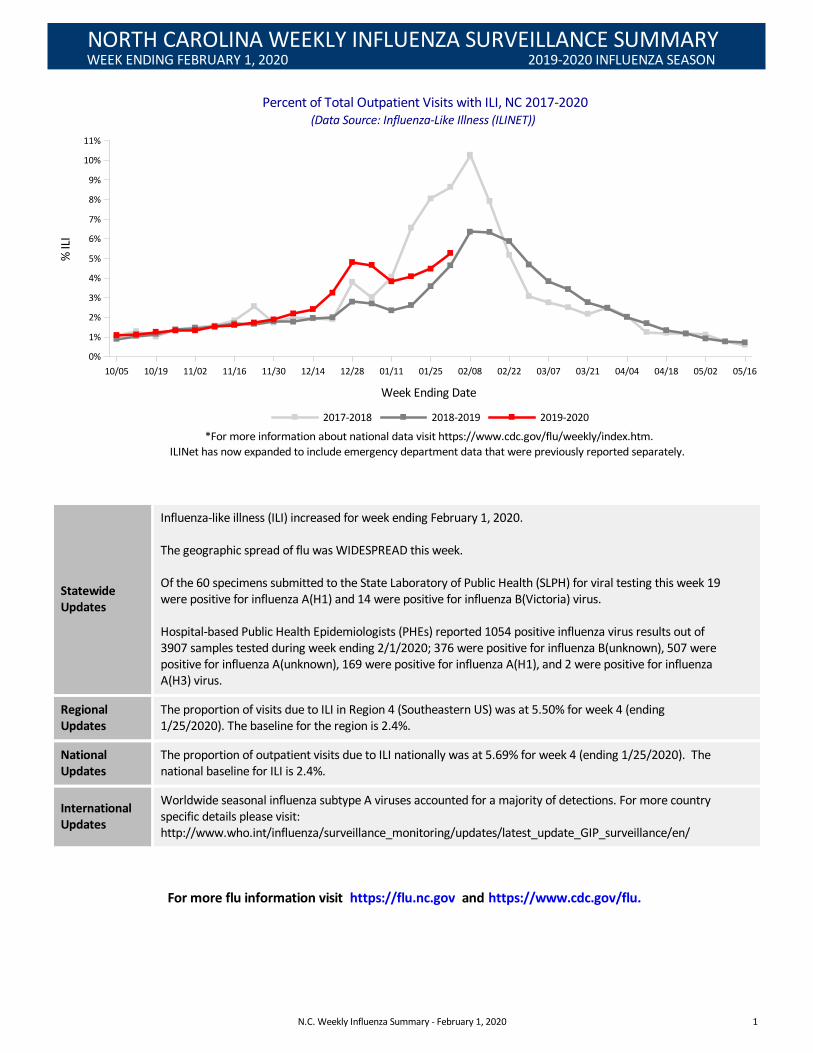
(Data Source: Influenza-Like Illness (ILINET))
Percent of Total Outpatient Visits with ILI, NC 2017-2020
10/05 10/19 11/02 11/16 11/30 12/14 12/28 01/11 01/25 02/08 02/22 03/07 03/21 04/04 04/18 05/02 05/16
Week Ending Date
0%
1%
2%
3%
4%
5%
6%
7%
8%
9%
10%
11%
% IL
I
2019-20202018-20192017-2018
StatewideUpdates
Influenza-like illness (ILI) increased for week ending February 1, 2020.
The geographic spread of flu was WIDESPREAD this week.
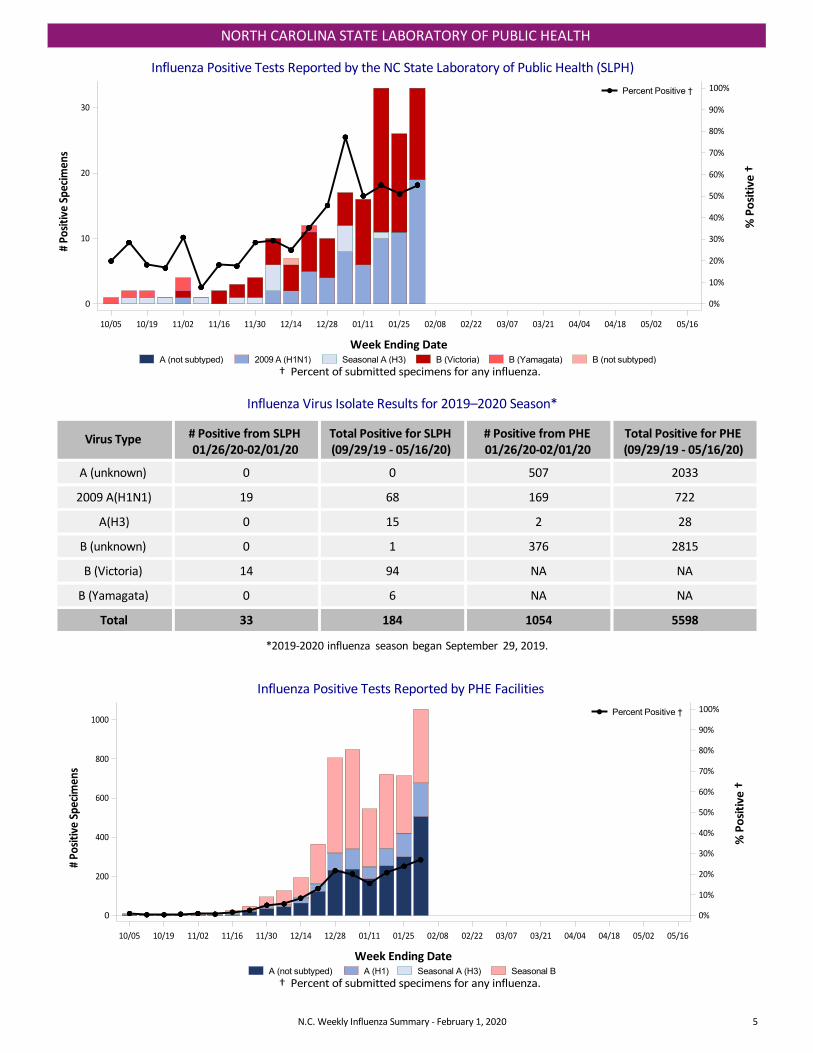
Of the 60 specimens submitted to the State Laboratory of Public Health (SLPH) for viral testing this week 19were positive for influenza A(H1) and 14 were positive for influenza B(Victoria) virus.
Hospital-based Public Health Epidemiologists (PHEs) reported 1054 positive influenza virus results out of3907 samples tested during week ending 2/1/2020; 376 were positive for influenza B(unknown), 507 werepositive for influenza A(unknown), 169 were positive for influenza A(H1), and 2 were positive for influenzaA(H3) virus.
RegionalUpdates
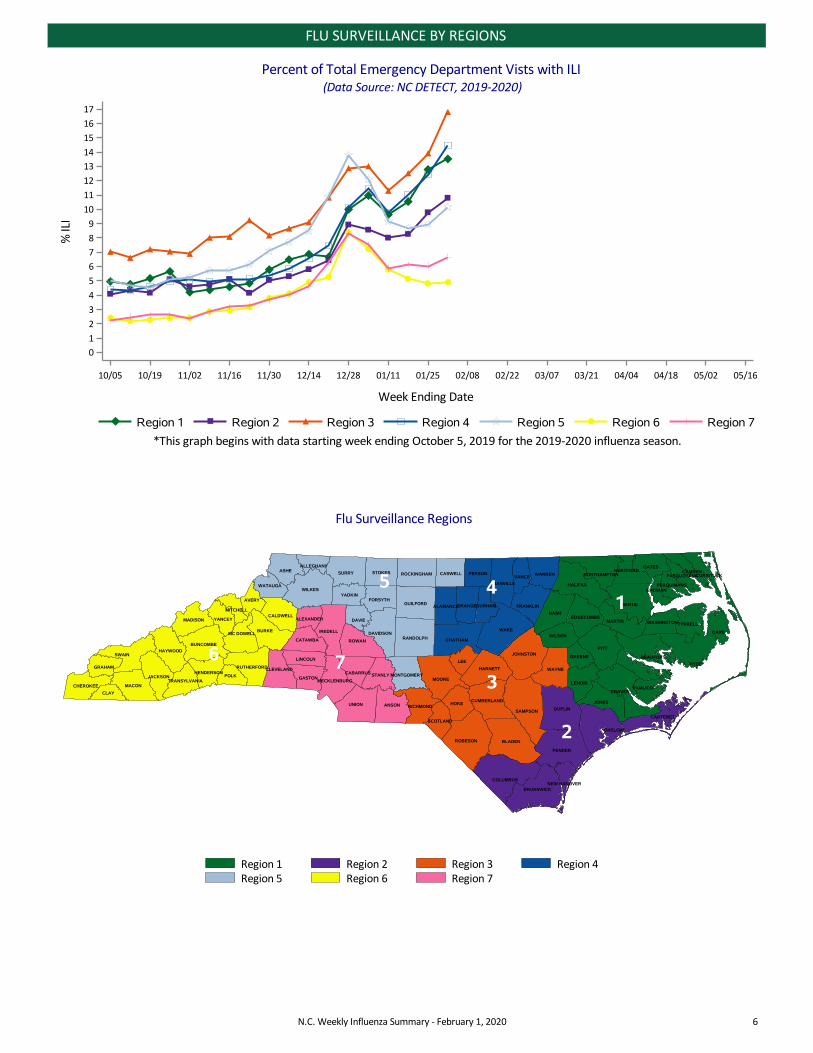
The proportion of visits due to ILI in Region 4 (Southeastern US) was at 5.50% for week 4 (ending1/25/2020). The baseline for the region is 2.4%.
NationalUpdates
The proportion of outpatient visits due to ILI nationally was at 5.69% for week 4 (ending 1/25/2020). Thenational baseline for ILI is 2.4%.
InternationalUpdates
Worldwide seasonal influenza subtype A viruses accounted for a majority of detections. For more countryspecific details please visit:http://www.who.int/influenza/surveillance_monitoring/updates/latest_update_GIP_surveillance/en/
For more flu information visit https://flu.nc.gov and https://www.cdc.gov/flu.
N.C. Weekly Influenza Summary - February 1, 2020 2
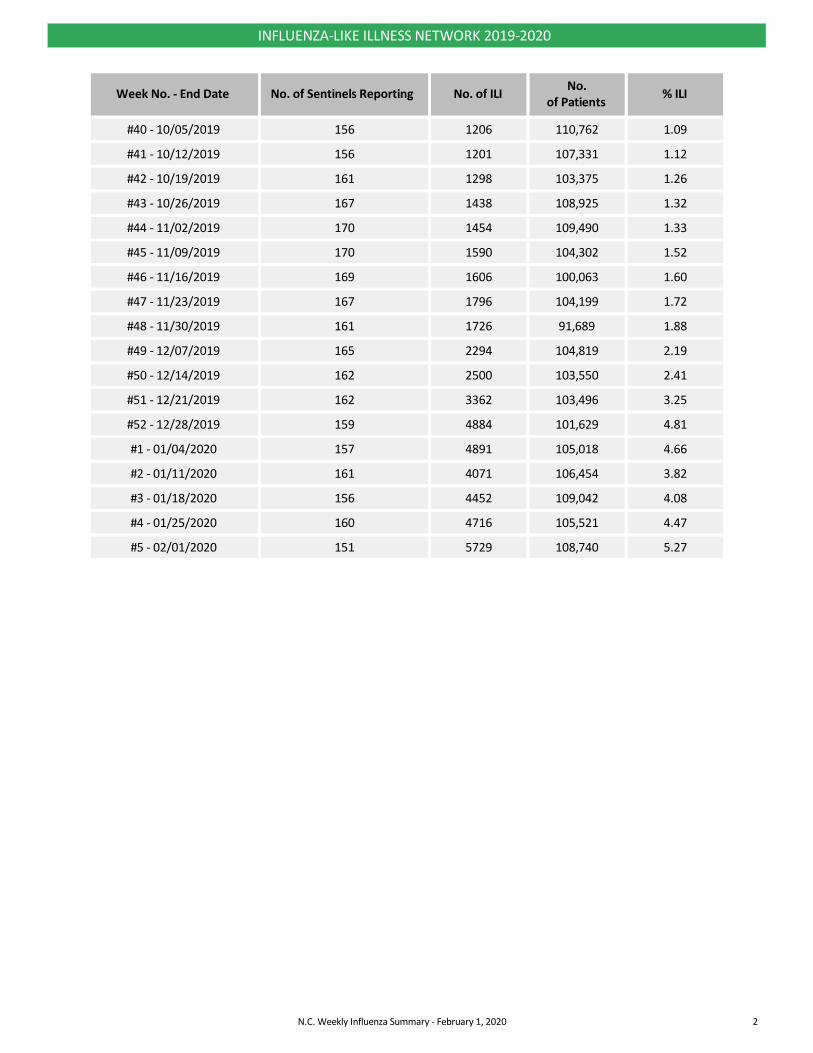
INFLUENZA-LIKE ILLNESS NETWORK 2019-2020
Week No. - End Date No. of Sentinels Reporting No. of ILINo.
of Patients% ILI
#40 - 10/05/2019 156 1206 110,762 1.09
#41 - 10/12/2019 156 1201 107,331 1.12
#42 - 10/19/2019 161 1298 103,375 1.26
#43 - 10/26/2019 167 1438 108,925 1.32
#44 - 11/02/2019 170 1454 109,490 1.33
#45 - 11/09/2019 170 1590 104,302 1.52
#46 - 11/16/2019 169 1606 100,063 1.60
#47 - 11/23/2019 167 1796 104,199 1.72
#48 - 11/30/2019 161 1726 91,689 1.88
#49 - 12/07/2019 165 2294 104,819 2.19
#50 - 12/14/2019 162 2500 103,550 2.41
#51 - 12/21/2019 162 3362 103,496 3.25
#52 - 12/28/2019 159 4884 101,629 4.81
#1 - 01/04/2020 157 4891 105,018 4.66
#2 - 01/11/2020 161 4071 106,454 3.82
#3 - 01/18/2020 156 4452 109,042 4.08
#4 - 01/25/2020 160 4716 105,521 4.47
#5 - 02/01/2020 151 5729 108,740 5.27
N.C. Weekly Influenza Summary - February 1, 2020 3
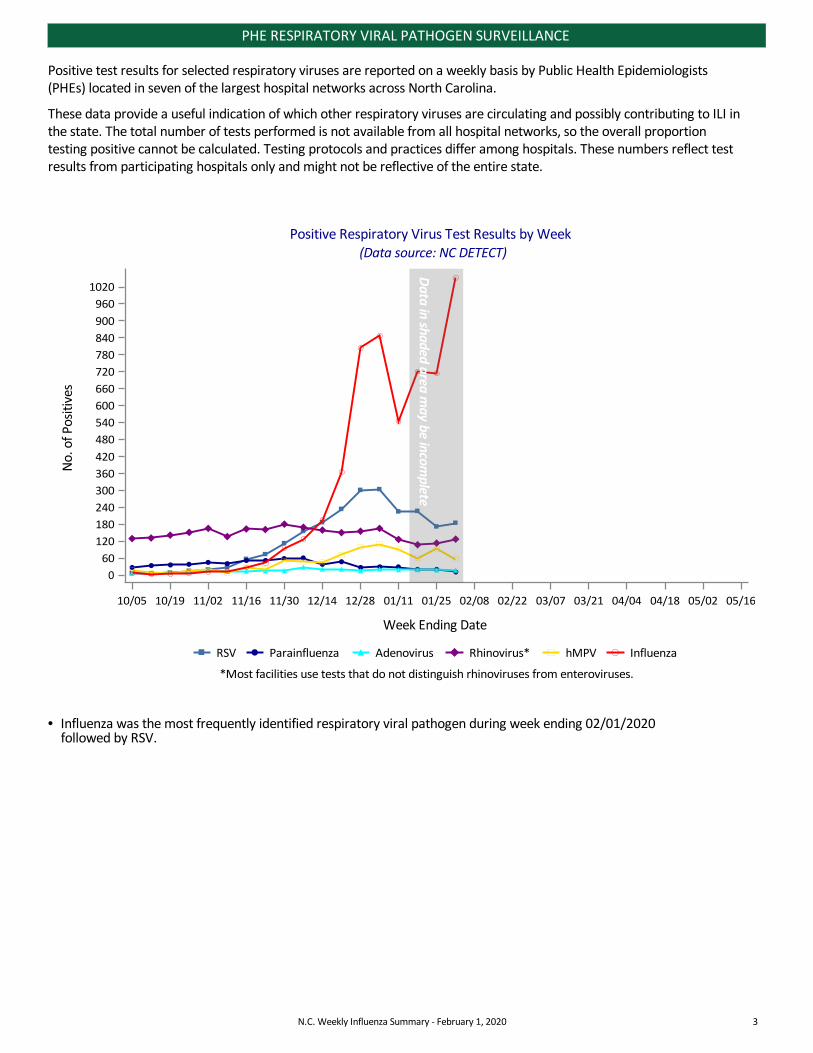
PHE RESPIRATORY VIRAL PATHOGEN SURVEILLANCE
Positive test results for selected respiratory viruses are reported on a weekly basis by Public Health Epidemiologists(PHEs) located in seven of the largest hospital networks across North Carolina.
These data provide a useful indication of which other respiratory viruses are circulating and possibly contributing to ILI inthe state. The total number of tests performed is not available from all hospital networks, so the overall proportiontesting positive cannot be calculated. Testing protocols and practices differ among hospitals. These numbers reflect testresults from participating hospitals only and might not be reflective of the entire state.
*Most facilities use tests that do not distinguish rhinoviruses from enteroviruses.
(Data source: NC DETECT)
Positive Respiratory Virus Test Results by Week
10/05 10/19 11/02 11/16 11/30 12/14 12/28 01/11 01/25 02/08 02/22 03/07 03/21 04/04 04/18 05/02 05/16
Week Ending Date
0
60
120
180
240
300
360
420
480
540
600
660
720
780
840
900
960
1020
No.
of P
osit
ives
InfluenzahMPVRhinovirus*AdenovirusParainfluenzaRSV
Data in shaded area m
ay be incomplete
• Influenza was the most frequently identified respiratory viral pathogen during week ending 02/01/2020 followed by RSV.
N.C. Weekly Influenza Summary - February 1, 2020 4
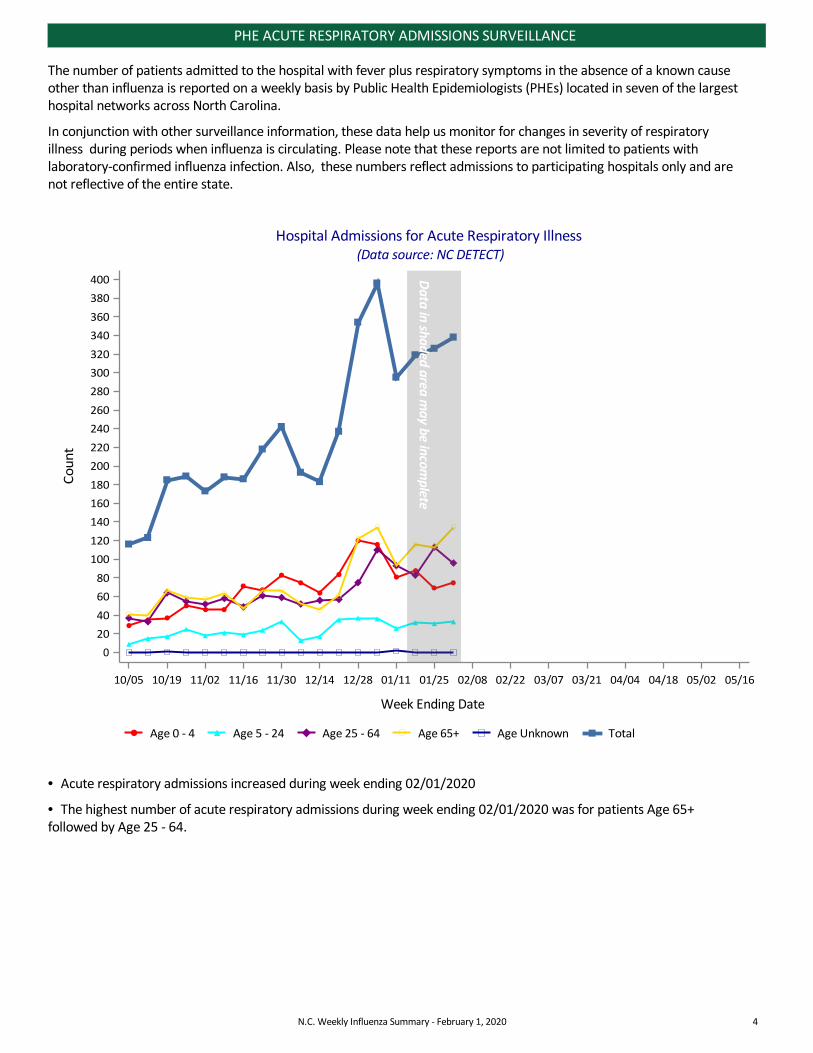
PHE ACUTE RESPIRATORY ADMISSIONS SURVEILLANCE
The number of patients admitted to the hospital with fever plus respiratory symptoms in the absence of a known causeother than influenza is reported on a weekly basis by Public Health Epidemiologists (PHEs) located in seven of the largesthospital networks across North Carolina.
In conjunction with other surveillance information, these data help us monitor for changes in severity of respiratoryillness during periods when influenza is circulating. Please note that these reports are not limited to patients withlaboratory-confirmed influenza infection. Also, these numbers reflect admissions to participating hospitals only and arenot reflective of the entire state.
(Data source: NC DETECT)
Hospital Admissions for Acute Respiratory Illness
10/05 10/19 11/02 11/16 11/30 12/14 12/28 01/11 01/25 02/08 02/22 03/07 03/21 04/04 04/18 05/02 05/16
Week Ending Date
0
20
40
60
80
100
120
140
160
180
200
220
240
260
280
300
320
340
360
380
400
Co
un
t
TotalAge UnknownAge 65+Age 25 - 64Age 5 - 24Age 0 - 4
Data in shaded area m
ay be incomplete
• Acute respiratory admissions increased during week ending 02/01/2020
• The highest number of acute respiratory admissions during week ending 02/01/2020 was for patients Age 65+followed by Age 25 - 64.
N.C. Weekly Influenza Summary - February 1, 2020 5
NORTH CAROLINA STATE LABORATORY OF PUBLIC HEALTH
Influenza Positive Tests Reported by the NC State Laboratory of Public Health (SLPH)
† Percent of submitted specimens for any influenza.
10/05 10/19 11/02 11/16 11/30 12/14 12/28 01/11 01/25 02/08 02/22 03/07 03/21 04/04 04/18 05/02 05/16
Week Ending Date
0
10
20
30
# Po
siti
ve S
peci
men
s
0%
10%
20%
30%
40%
50%
60%
70%
80%
90%
100%
% P
osi
tive
†
B (not subtyped)B (Yamagata)B (Victoria)Seasonal A (H3)2009 A (H1N1)A (not subtyped)
Percent Positive †
Influenza Virus Isolate Results for 2019–2020 Season*
Virus Type # Positive from SLPH01/26/20-02/01/20
Total Positive for SLPH(09/29/19 - 05/16/20)
# Positive from PHE01/26/20-02/01/20
Total Positive for PHE(09/29/19 - 05/16/20)
A (unknown) 0 0 507 2033
2009 A(H1N1) 19 68 169 722
A(H3) 0 15 2 28
B (unknown) 0 1 376 2815
B (Victoria) 14 94 NA NA
B (Yamagata) 0 6 NA NA
Total 33 184 1054 5598
*2019-2020 influenza season began September 29, 2019.
Influenza Positive Tests Reported by PHE Facilities
† Percent of submitted specimens for any influenza.
10/05 10/19 11/02 11/16 11/30 12/14 12/28 01/11 01/25 02/08 02/22 03/07 03/21 04/04 04/18 05/02 05/16
Week Ending Date
0
200
400
600
800
1000
# Po
siti
ve S
peci
men
s
0%
10%
20%
30%
40%
50%
60%
70%
80%
90%
100%
% P
osi
tive
†
Seasonal BSeasonal A (H3)A (H1)A (not subtyped)
Percent Positive †
N.C. Weekly Influenza Summary - February 1, 2020 6
FLU SURVEILLANCE BY REGIONS
*This graph begins with data starting week ending October 5, 2019 for the 2019-2020 influenza season.
(Data Source: NC DETECT, 2019-2020)
Percent of Total Emergency Department Vists with ILI
10/05 10/19 11/02 11/16 11/30 12/14 12/28 01/11 01/25 02/08 02/22 03/07 03/21 04/04 04/18 05/02 05/16
Week Ending Date
0
1
2
3
4
5
6
7
8
9
10
11
12
13
14
15
16
17
% IL
I
Region 7Region 6Region 5Region 4Region 3Region 2Region 1
Flu Surveillance Regions
Region 1 Region 2 Region 3 Region 4Region 5 Region 6 Region 7
ALAMANCE
ALEXANDER
ALLEGHANY
ANSON
ASHE
AVERY
BEAUFORT
BERTIE
BLADEN
BRUNSWICK
BUNCOMBE
BURKE
CABARRUS
CALDWELL
CAMDEN
CARTERET
CASWELL
CATAWBA CHATHAM
CHEROKEE
CHOWAN
CLAY
CLEVELAND
COLUMBUS
CRAVEN
CUMBERLAND
CURRITUCK
DAREDAVIDSON
DAVIE
DUPLIN
DURHAM
EDGECOMBE
FORSYTH
FRANKLIN
GASTON
GATES
GRAHAM
GRANVILLE
GREENE
GUILFORD
HALIFAX
HARNETT
HAYWOOD
HENDERSON
HERTFORD
HOKE
HYDE
IREDELL
JACKSON
JOHNSTON
JONES
LEE
LENOIR
LINCOLN
MC DOWELL
MACON
MADISON MARTIN
MECKLENBURG
MITCHELL
MONTGOMERYMOORE
NASH
NEW HANOVER
NORTHAMPTON
ONSLOW
ORANGE
PAMLICO
PASQUOTANK
PENDER
PERQUIMANS
PERSON
PITT
POLK
RANDOLPH
RICHMOND
ROBESON
ROCKINGHAM
ROWAN
RUTHERFORD
SAMPSON
SCOTLAND
STANLY
STOKESSURRY
SWAIN
TRANSYLVANIA
TYRRELL
UNION
VANCE
WAKE
WARREN
WASHINGTON
WATAUGA
WAYNE
WILKES
WILSON
YADKIN
YANCEY
3
45
6
1
7
2
N.C. Weekly Influenza Summary - February 1, 2020 7
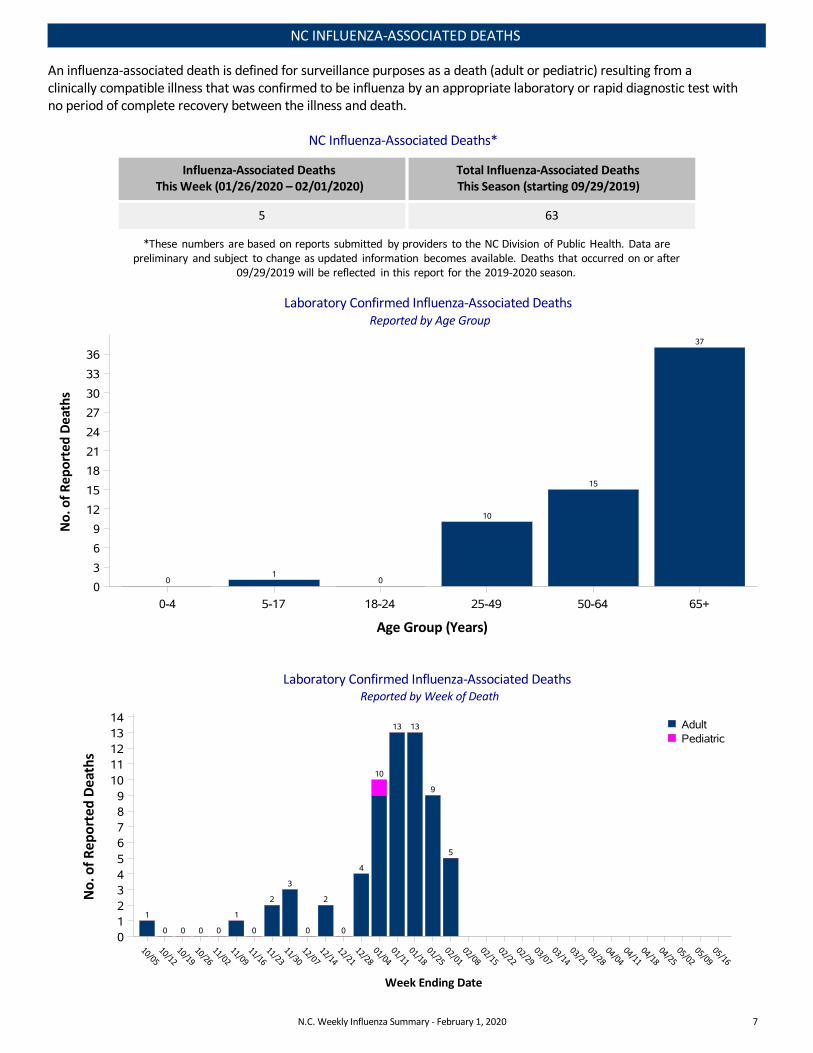
NC INFLUENZA-ASSOCIATED DEATHS
An influenza-associated death is defined for surveillance purposes as a death (adult or pediatric) resulting from aclinically compatible illness that was confirmed to be influenza by an appropriate laboratory or rapid diagnostic test withno period of complete recovery between the illness and death.
NC Influenza-Associated Deaths*
Influenza-Associated DeathsThis Week (01/26/2020 – 02/01/2020)
Total Influenza-Associated DeathsThis Season (starting 09/29/2019)
5 63
*These numbers are based on reports submitted by providers to the NC Division of Public Health. Data arepreliminary and subject to change as updated information becomes available. Deaths that occurred on or after
09/29/2019 will be reflected in this report for the 2019-2020 season.
Reported by Age Group
Laboratory Confirmed Influenza-Associated Deaths
01
0
10
15
37
0-4 5-17 18-24 25-49 50-64 65+
Age Group (Years)
0
3
6
9
12
15
18
21
24
27
30
33
36
No
. of
Rep
ort
ed D
eath
s
Reported by Week of Death
Laboratory Confirmed Influenza-Associated Deaths
1
0 0 0 0
1
0
2
3
0
2
0
4
10
13 13
9
5
10/0510/12
10/1910/26
11/0211/09
11/1611/23
11/3012/07
12/1412/21
12/2801/04
01/1101/18
01/2502/01
02/0802/15
02/2202/29
03/0703/14
03/2103/28
04/0404/11
04/1804/25
05/0205/09
05/16
Week Ending Date
0123456789
1011121314
No
. of
Rep
ort
ed D
eath
s
PediatricAdult
N.C. Weekly Influenza Summary - February 1, 2020 8
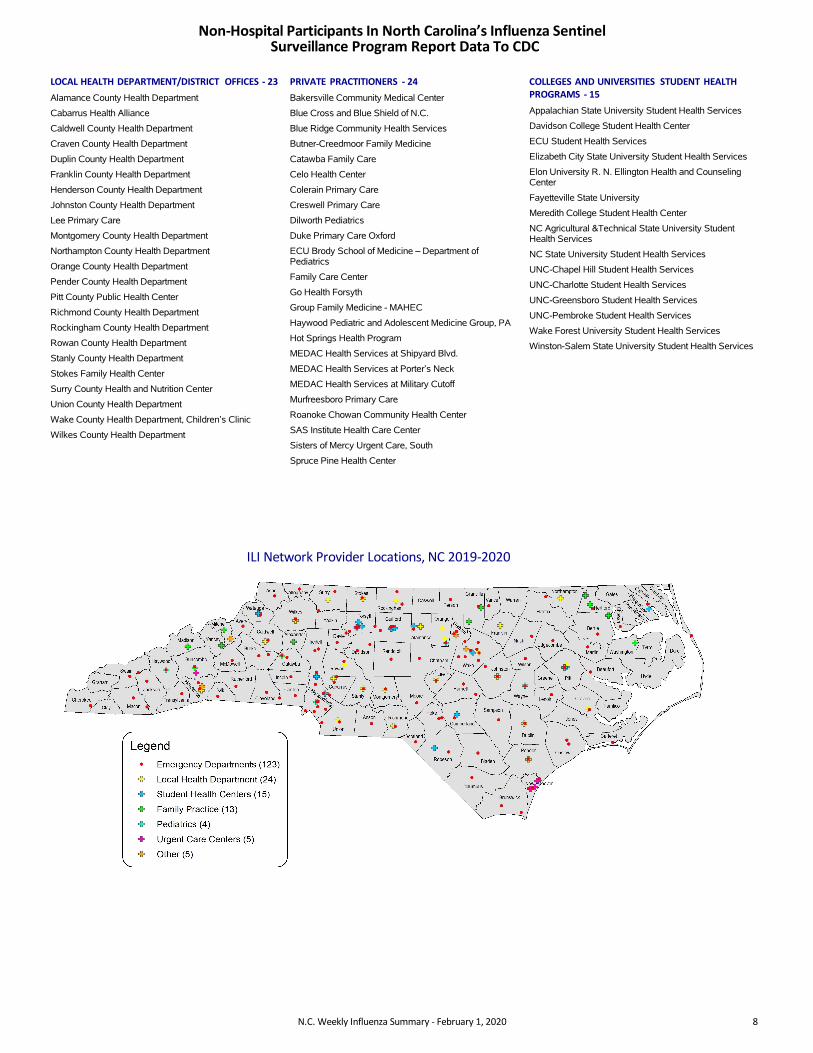
ILI Network Provider Locations, NC 2019-2020
Non-Hospital Participants In North Carolina’s Influenza Sentinel Surveillance Program Report Data To CDC
LOCAL HEALTH DEPARTMENT/DISTRICT OFFICES - 23
Alamance County Health Department
Cabarrus Health Alliance
Caldwell County Health Department
Craven County Health Department
Duplin County Health Department
Franklin County Health Department
Henderson County Health Department
Johnston County Health Department
Lee Primary Care
Montgomery County Health Department
Northampton County Health Department
Orange County Health Department
Pender County Health Department
Pitt County Public Health Center
Richmond County Health Department
Rockingham County Health Department
Rowan County Health Department
Stanly County Health Department
Stokes Family Health Center
Surry County Health and Nutrition Center
Union County Health Department
Wake County Health Department, Children’s Clinic
Wilkes County Health Department
PRIVATE PRACTITIONERS - 24
Bakersville Community Medical Center
Blue Cross and Blue Shield of N.C.
Blue Ridge Community Health Services
Butner-Creedmoor Family Medicine
Catawba Family Care
Celo Health Center
Colerain Primary Care
Creswell Primary Care
Dilworth Pediatrics
Duke Primary Care Oxford
ECU Brody School of Medicine – Department ofPediatrics
Family Care Center
Go Health Forsyth
Group Family Medicine - MAHEC
Haywood Pediatric and Adolescent Medicine Group, PA
Hot Springs Health Program
MEDAC Health Services at Shipyard Blvd.
MEDAC Health Services at Porter’s Neck
MEDAC Health Services at Military Cutoff
Murfreesboro Primary Care
Roanoke Chowan Community Health Center
SAS Institute Health Care Center
Sisters of Mercy Urgent Care, South
Spruce Pine Health Center
COLLEGES AND UNIVERSITIES STUDENT HEALTHPROGRAMS - 15
Appalachian State University Student Health Services
Davidson College Student Health Center
ECU Student Health Services
Elizabeth City State University Student Health Services
Elon University R. N. Ellington Health and CounselingCenter
Fayetteville State University
Meredith College Student Health Center
NC Agricultural &Technical State University StudentHealth Services
NC State University Student Health Services
UNC-Chapel Hill Student Health Services
UNC-Charlotte Student Health Services
UNC-Greensboro Student Health Services
UNC-Pembroke Student Health Services
Wake Forest University Student Health Services
Winston-Salem State University Student Health Services


