Download - Non-Performing Assets (NPA)

NON-PERFORMING
ASSETS (NPA)

Year ending
March 31
Specified period
1993 four quarters
1994 three quarters
1995 onwards two quarters
An asset, including a leased asset, becomes non-performing when it
ceases to generate income for the bank. A ‘non-performing asset’
(NPA) was defined as a credit facility in respect of which the
interest and/or installment of principal has remained ‘past due’ for a
specified period of time. The specified period was reduced in a
phased manner as under :
DEFINITION
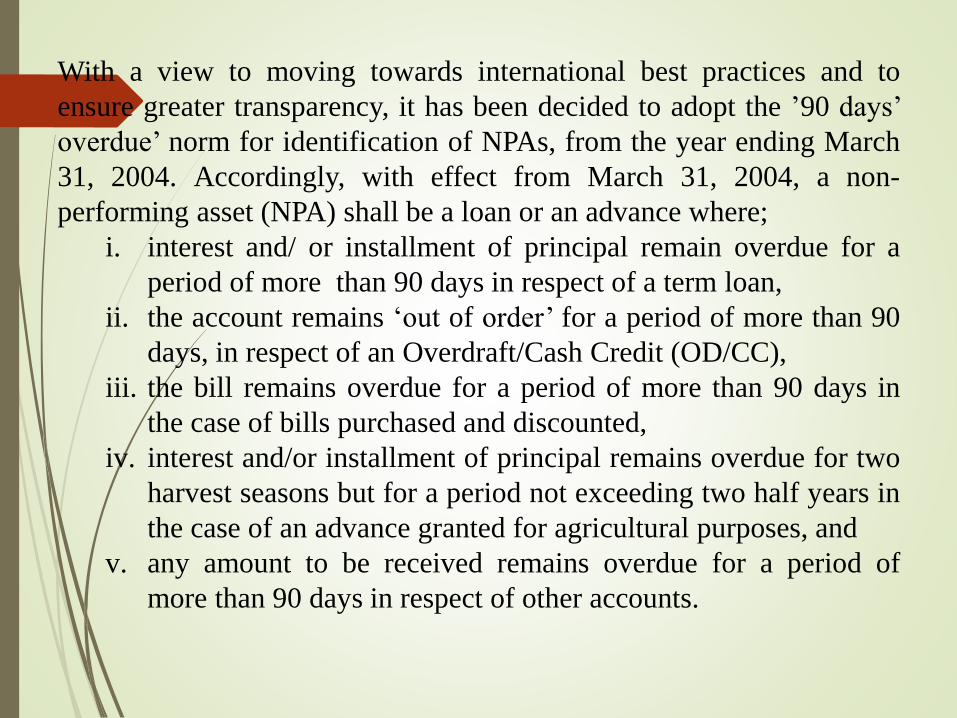
With a view to moving towards international best practices and to
ensure greater transparency, it has been decided to adopt the ’90 days’
overdue’ norm for identification of NPAs, from the year ending March
31, 2004. Accordingly, with effect from March 31, 2004, a non-
performing asset (NPA) shall be a loan or an advance where;
i. interest and/ or installment of principal remain overdue for a
period of more than 90 days in respect of a term loan,
ii. the account remains ‘out of order’ for a period of more than 90
days, in respect of an Overdraft/Cash Credit (OD/CC),
iii. the bill remains overdue for a period of more than 90 days in
the case of bills purchased and discounted,
iv. interest and/or installment of principal remains overdue for two
harvest seasons but for a period not exceeding two half years in
the case of an advance granted for agricultural purposes, and
v. any amount to be received remains overdue for a period of
more than 90 days in respect of other accounts.
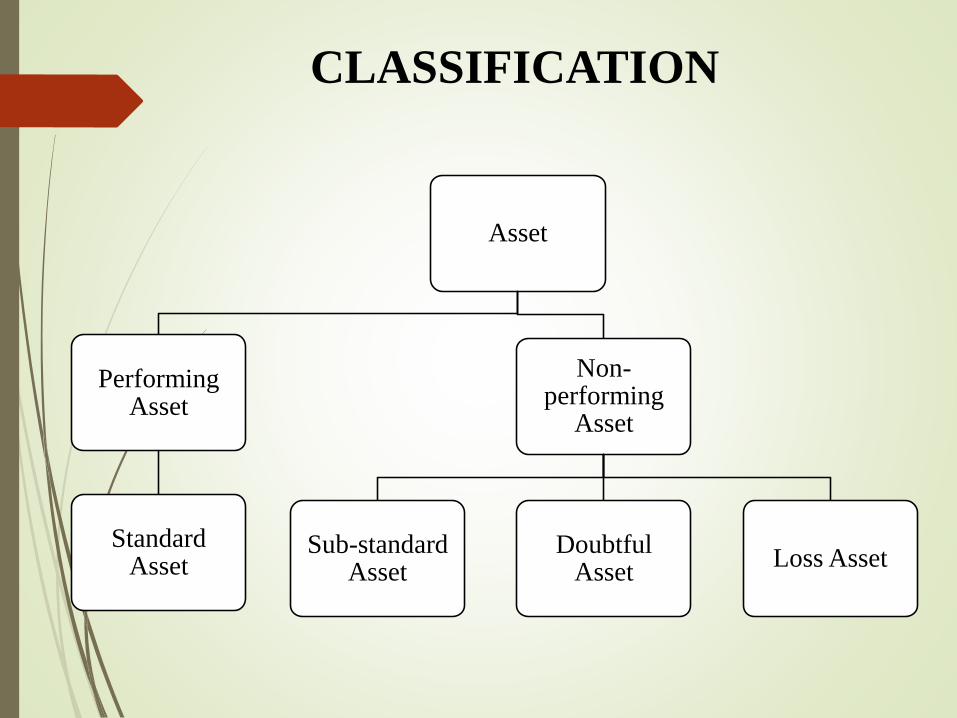
Asset
Non-performing
Asset
Loss AssetDoubtful
AssetSub-standard
Asset
Performing Asset
Standard Asset
CLASSIFICATION

Substandard Asset: Substandard asset is one which has
remained NPA for a period less than or equal to 18 months.
Doubtful Asset: Doubtful asset is one which has remained NPA
for a period exceeding 18 months.
Loss Asset: A loss asset is one where loss has been identified
by the bank or internal or external auditors or the RBI
inspection but the amount has not been written off wholly. In
other words, such an asset is considered uncollectible and of
such little value that its continuance as a bankable asset is not
warranted although there may be some salvage or recovery
value.
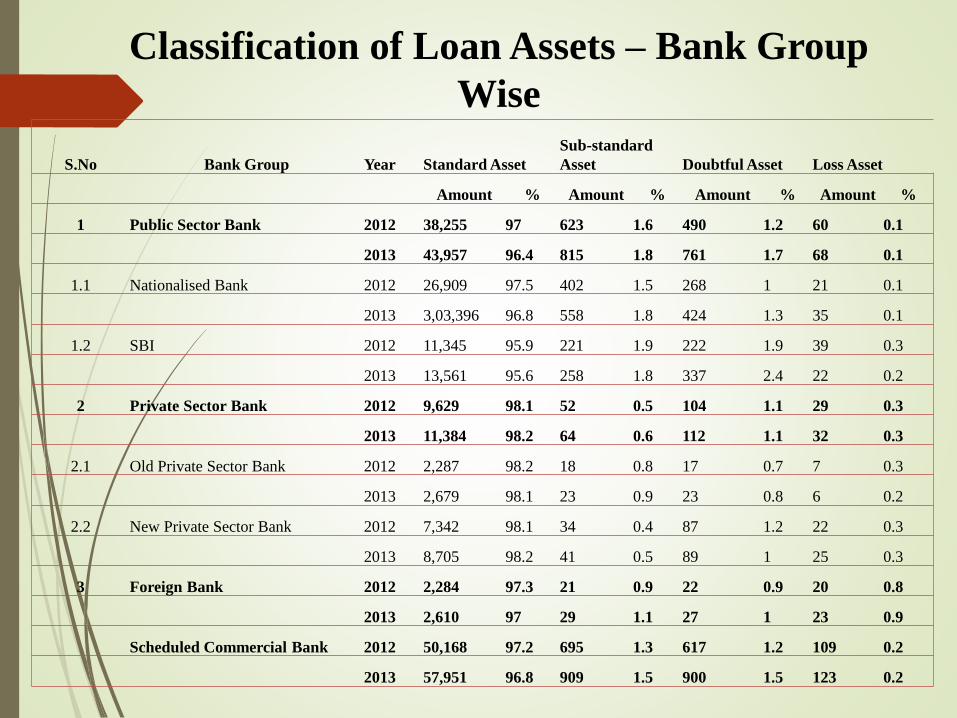
S.No Bank Group Year Standard Asset
Sub-standard
Asset Doubtful Asset Loss Asset
Amount % Amount % Amount % Amount %
1 Public Sector Bank 2012 38,255 97 623 1.6 490 1.2 60 0.1
2013 43,957 96.4 815 1.8 761 1.7 68 0.1
1.1 Nationalised Bank 2012 26,909 97.5 402 1.5 268 1 21 0.1
2013 3,03,396 96.8 558 1.8 424 1.3 35 0.1
1.2 SBI 2012 11,345 95.9 221 1.9 222 1.9 39 0.3
2013 13,561 95.6 258 1.8 337 2.4 22 0.2
2 Private Sector Bank 2012 9,629 98.1 52 0.5 104 1.1 29 0.3
2013 11,384 98.2 64 0.6 112 1.1 32 0.3
2.1 Old Private Sector Bank 2012 2,287 98.2 18 0.8 17 0.7 7 0.3
2013 2,679 98.1 23 0.9 23 0.8 6 0.2
2.2 New Private Sector Bank 2012 7,342 98.1 34 0.4 87 1.2 22 0.3
2013 8,705 98.2 41 0.5 89 1 25 0.3
3 Foreign Bank 2012 2,284 97.3 21 0.9 22 0.9 20 0.8
2013 2,610 97 29 1.1 27 1 23 0.9
Scheduled Commercial Bank 2012 50,168 97.2 695 1.3 617 1.2 109 0.2
2013 57,951 96.8 909 1.5 900 1.5 123 0.2
Classification of Loan Assets – Bank Group
Wise

Asset
Classification
Particulars Provision
Required
%
Standard Direct Advances to Agriculture & SME Sectors 0.25
Commercial Real Estate Advances 1.00
All other Loans & Advances not included in above 0.40
Sub-standard Secured Exposure (up to 6 months)
-6 months to 1 year
15
25
Unsecured Exposure for Escrow A/cs available in
case of Infrastructure lending, infrastructure loan
accounts (up to 6 months)
-6 months to 1 year
25
40
Other Unsecured Exposure (up to 6 months)
-6 months to 1 year
25
407
PROVISIONING NORMS

Asset
Classification
Particulars Provision Required
%
Doubtful - Secured Unsecured
D1 (Up to 2 year) 40 100
D2 (3rd and 4th year) 100 100
D3 (5th year onwards) 100 100
Loss Asset 100

•When a loan a/c of a borrower is treated as NPA, all the other loan a/c
of the borrower, even if they are otherwise regular, should be treated as
NPA as NPA classification should be borrower wise & not facility
wise.
•When various advance a/c of a borrower are in different categories of
NPA, then the provisioning shall be as per the lowest category
applicable.
BORROWER WISE & NOT
FACILITY WISE

Particulars Amount
1. Gross advances *
2. Gross NPAs *
3. Gross NPAs as a percentage of gross advances
4. Total Deductions (i+ii+iii+iv)
i) Balance in Interest Suspense account$
ii) DICGC/ECGC claims received and held pending adjustment
iii) Part payment received and kept in suspense account
iv) Total provisions held **
5. Net advances (1-4)
6. Net NPAs (2-4)
7. Net NPAs as a percentage of net Advances
Reporting Format for Non-Performing
Asset – Gross and Net Position
Name of the Bank:
Position as on ....................
(rupees in crore up to two decimals)
*excluding Technical write off of Rs. ………. crore.
** excluding amount of technical write off (Rs…….. …crores) and provision on standard assets (Rs………..crore)
$ banks which do not maintain an Interest Suspense account to park the accrued interest on NPAs, may furnish the amount of
interest receivable on NPAs as a foot note to this statement
NPA of the banks, especially PSBs have been going up sharply
recently.
The Gross NPA of the listed banks rose 35.2% to 2.43 crore lakh crore
during the first three quarters of 2013-14. in absolute terms, the 40
listed banks added ₹63,386 crore to their gross NPA during the nine
months till Dec,13, with the SBI the largest lender in the country,
leading with an accretion of ₹16,610 crore.
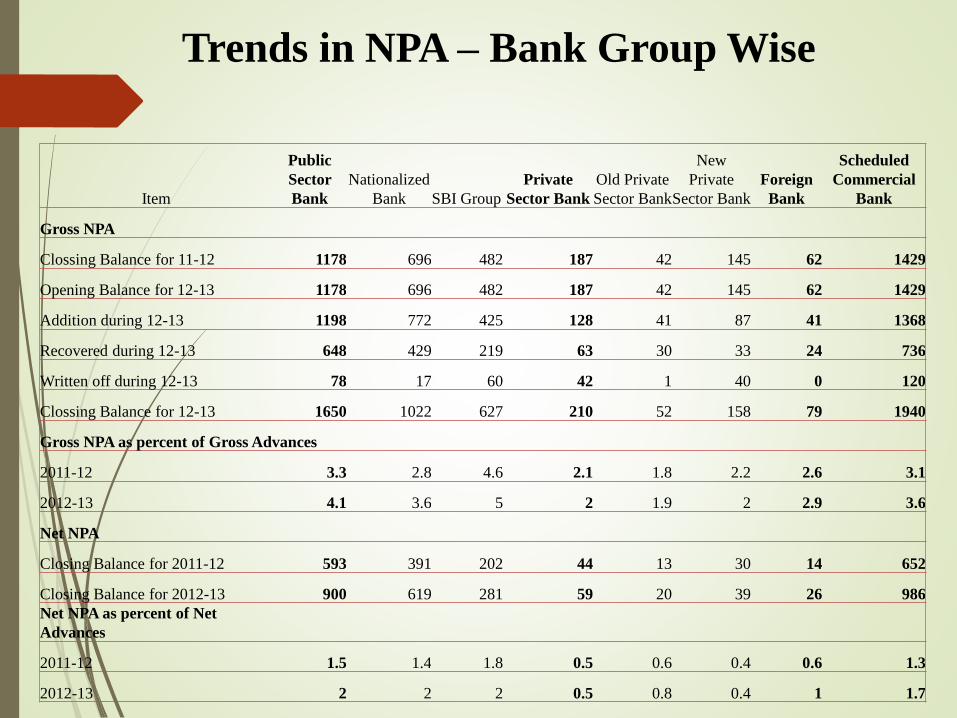
Item
Public
Sector
Bank
Nationalized
Bank SBI Group
Private
Sector Bank
Old Private
Sector Bank
New
Private
Sector Bank
Foreign
Bank
Scheduled
Commercial
Bank
Gross NPA
Clossing Balance for 11-12 1178 696 482 187 42 145 62 1429
Opening Balance for 12-13 1178 696 482 187 42 145 62 1429
Addition during 12-13 1198 772 425 128 41 87 41 1368
Recovered during 12-13 648 429 219 63 30 33 24 736
Written off during 12-13 78 17 60 42 1 40 0 120
Clossing Balance for 12-13 1650 1022 627 210 52 158 79 1940
Gross NPA as percent of Gross Advances
2011-12 3.3 2.8 4.6 2.1 1.8 2.2 2.6 3.1
2012-13 4.1 3.6 5 2 1.9 2 2.9 3.6
Net NPA
Closing Balance for 2011-12 593 391 202 44 13 30 14 652
Closing Balance for 2012-13 900 619 281 59 20 39 26 986
Net NPA as percent of Net
Advances
2011-12 1.5 1.4 1.8 0.5 0.6 0.4 0.6 1.3
2012-13 2 2 2 0.5 0.8 0.4 1 1.7
Trends in NPA – Bank Group Wise
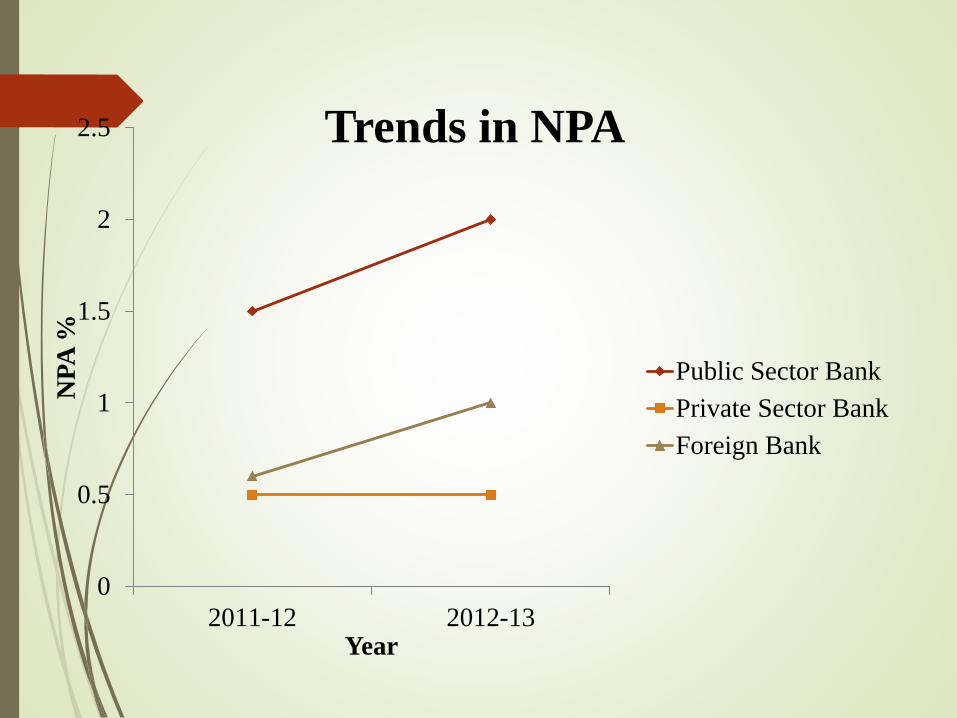
0
0.5
1
1.5
2
2.5
2011-12 2012-13
NP
A %
Year
Trends in NPA
Public Sector Bank
Private Sector Bank
Foreign Bank
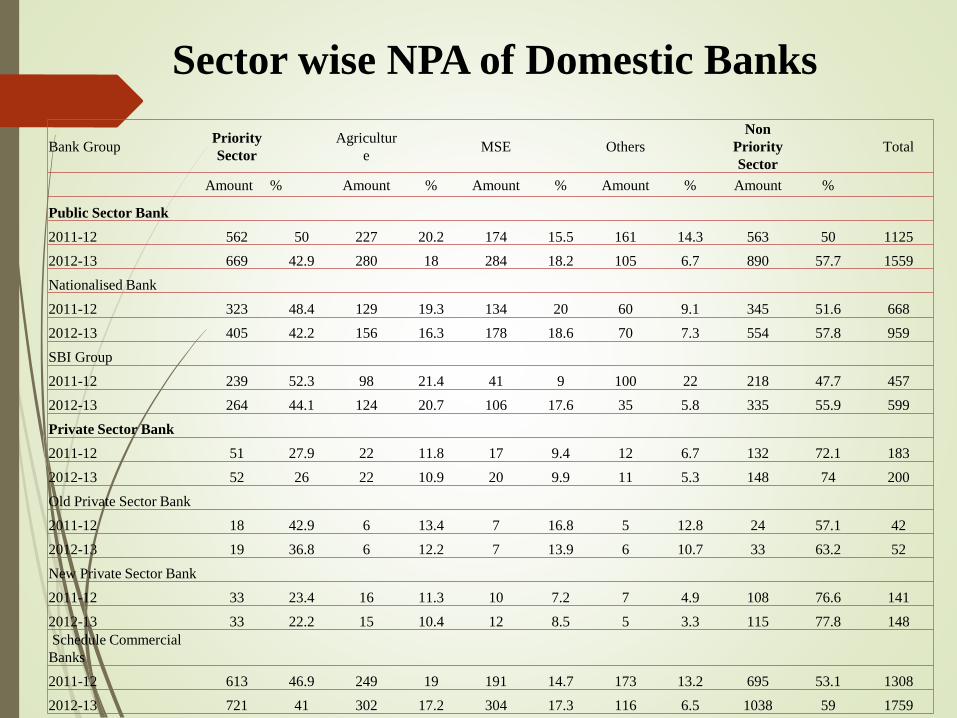
Bank GroupPriority
Sector
Agricultur
eMSE Others
Non
Priority
Sector
Total
Amount % Amount % Amount % Amount % Amount %
Public Sector Bank
2011-12 562 50 227 20.2 174 15.5 161 14.3 563 50 1125
2012-13 669 42.9 280 18 284 18.2 105 6.7 890 57.7 1559
Nationalised Bank
2011-12 323 48.4 129 19.3 134 20 60 9.1 345 51.6 668
2012-13 405 42.2 156 16.3 178 18.6 70 7.3 554 57.8 959
SBI Group
2011-12 239 52.3 98 21.4 41 9 100 22 218 47.7 457
2012-13 264 44.1 124 20.7 106 17.6 35 5.8 335 55.9 599
Private Sector Bank
2011-12 51 27.9 22 11.8 17 9.4 12 6.7 132 72.1 183
2012-13 52 26 22 10.9 20 9.9 11 5.3 148 74 200
Old Private Sector Bank
2011-12 18 42.9 6 13.4 7 16.8 5 12.8 24 57.1 42
2012-13 19 36.8 6 12.2 7 13.9 6 10.7 33 63.2 52
New Private Sector Bank
2011-12 33 23.4 16 11.3 10 7.2 7 4.9 108 76.6 141
2012-13 33 22.2 15 10.4 12 8.5 5 3.3 115 77.8 148
Schedule Commercial
Banks
2011-12 613 46.9 249 19 191 14.7 173 13.2 695 53.1 1308
2012-13 721 41 302 17.2 304 17.3 116 6.5 1038 59 1759
Sector wise NPA of Domestic Banks

• Economic Slowdown
Economic growth slowing down & rate of interest going up sharply,
corporate have been finding it difficult to repay loans, and it add up to
rising NPA.
•Wait and watch approach
Banks allow deteriorating asset class to go from bad to worse in the
hope of revival and often offer restructuring option to corporate.
• Poor credit assessment process
•Operational factors
Ordinary people often complain about difficulty in getting loans, while
some large borrowers just get loans on a platter.
REASONS FOR INCREASED NPA’s

•Other factors
−Project not completed in time
−Failure of business
−Willful defaulters
−Natural calamities
−Diversion of funds

•Reduce profitability
•Liquidity & Opportunity Cost
•Waste of valuable management time
•Impact on share prices
•Loss of credibility as high NPA reflect poorly on
Management
•Gross NPA more than 10% in case of Co-op. Banks,
Supervisory Action follows & restrictions imposed.
IMPACT OF NPA
•Banks should stop “ever-greening” or repeated restructuring of
corporate debt to check the constant burging of their NPA.
Management issue of ever-greening of loans could be avoided by “not
renewing loans, particularly of corporate”.
Extending those extra helping hand can go against the financial
health of banks.
•Bank need to be more conservative in granting loans to sectors that
have been traditionally found to be contributors of NPAs.
•Banks need to go much beyond the traditional analysis of financial
statements & analyzing the history of promoters. There is a need to
incorporate significance of economic factors in credit assessment
process.
HOW TO REDUCE ?
•Banks need to evolve strategy through which defaulters are kept
out of system unless they honor the previous payment.
•Banks need to look at operational factors causing increasing
incidents of bad loans.

NPA RECOVERING TOOLS
•Lok adalats
•Debt Recovery Tribunals (DRTs)
•SARFAESI ACT, 2002 (Securitization & Reconstruction
of Financial Assets & Enforcement of Security Interest Act,
2002)
Lok Adalats
Small value loans up to Rs 20 lakh can be amicably settled between
the borrower and the lender using the forum of Lok Adalats.
Debt Recovery Tribunals (DRTs)
•Narasimham Committee Report I (1991) recommended the setting up
of Special Tribunals to reduce the time required for settling cases.
Accepting the recommendations, Debt Recovery Tribunals (DRTs)
were established.
•There are 22 DRTs and 5 Debt Recovery Appellate Tribunals.
•In this court, only the recovery cases of Rs.10 Lacs & above can be
filed.

•The SARFAESI Act, 2002 gives powers of "seize and desist" to banks.
Banks can give a notice in writing to the defaulting borrower requiring
it to discharge its liabilities within 60 days.
•The Act provides three alternative methods for recovery of non-
performing assets, namely:
- Securitization
- Asset Reconstruction
•Bad loans with outstanding above Rs. 1.00 Lac.
•NPA loan accounts where the amount is less than 20% of the Principal
& Interest are not eligible to be dealt with under this Act.
SARFAESI ACT, 2002

2011-2012 2012-2013
Recovery channel
No of
cases
referred
Amount
Involved
Amount
recovered
(4) as a %
of (3)
No of
cases
referred
Amount
Involved
Amount
recovered
(4) as a %
of (3)
1. Lok Adalats 476073 17 2 11.8 8,40,691 66 4 6.1
2. DRTS 13,365 241 41 17 13,408 310 44 14
3.SARFAEST AcT 1,40,991 353 101 28.6 1,90,537 681 185 27.1
Total 6,30,429 611 144 23.6 10,44,636 1,058 232 21.9
NPAs OF Schedule Commercial Banks
Recovered through various channels

THANK YOU


