Biogeosciences, 13, 2415–2428, 2016
www.biogeosciences.net/13/2415/2016/
doi:10.5194/bg-13-2415-2016
© Author(s) 2016. CC Attribution 3.0 License.
Nitrous oxide and methane in two tropical estuaries in a
peat-dominated region of northwestern Borneo
Denise Müller1, Hermann W. Bange2, Thorsten Warneke1, Tim Rixen3,4, Moritz Müller5, Aazani Mujahid6, and
Justus Notholt1,7
1Institute of Environmental Physics, University of Bremen, Otto-Hahn-Allee 1, 28359 Bremen, Germany2GEOMAR Helmholtz Centre for Ocean Research Kiel, Düsternbrooker Weg 20, 24105 Kiel, Germany3Leibniz Center for Tropical Marine Ecology, Fahrenheitstr. 6, 28359 Bremen, Germany4Institute of Geology, University of Hamburg, Bundesstr. 55, 20146 Hamburg, Germany5Swinburne University of Technology, Faculty of Engineering, Computing and Science, Jalan Simpang Tiga,
93350 Kuching, Sarawak, Malaysia6Department of Aquatic Science, Faculty of Resource Science & Technology, University Malaysia Sarawak,
94300 Kota Samarahan, Sarawak, Malaysia7MARUM Center for Marine Environmental Sciences at the University of Bremen, Leobener Str., 28359 Bremen, Germany
Correspondence to: Denise Müller ([email protected])
Received: 5 January 2016 – Published in Biogeosciences Discuss.: 18 January 2016
Revised: 29 March 2016 – Accepted: 12 April 2016 – Published: 26 April 2016
Abstract. Estuaries are sources of nitrous oxide (N2O) and
methane (CH4) to the atmosphere. However, our present
knowledge of N2O and CH4 emissions from estuaries in
the tropics is very limited because data are scarce. In this
study, we present first measurements of dissolved N2O and
CH4 from two estuaries in a peat-dominated region of north-
western Borneo. Two campaigns (during the dry season
in June 2013 and during the wet season in March 2014)
were conducted in the estuaries of the Lupar and Saribas
rivers. Median N2O concentrations ranged between 7.2 and
12.3 nmol L−1 and were higher in the marine end-member
(13.0± 7.0 nmol L−1). CH4 concentrations were low in the
coastal ocean (3.6± 0.2 nmol L−1) and higher in the estuar-
ies (medians between 10.6 and 64.0 nmol L−1). The respi-
ration of abundant organic matter and presumably anthro-
pogenic input caused slight eutrophication, which did not
lead to hypoxia or enhanced N2O concentrations, however.
Generally, N2O concentrations were not related to dissolved
inorganic nitrogen concentrations. Thus, the use of an emis-
sion factor for the calculation of N2O emissions from the in-
organic nitrogen load leads to an overestimation of the flux
from the Lupar and Saribas estuaries. N2O was negatively
correlated with salinity during the dry season, which suggests
a riverine source. In contrast, N2O concentrations during the
wet season were not correlated with salinity but locally en-
hanced within the estuaries, implying that there were addi-
tional estuarine sources during the wet (i.e., monsoon) sea-
son. Estuarine CH4 distributions were not driven by fresh-
water input but rather by tidal variations. Both N2O and CH4
concentrations were more variable during the wet season.
We infer that the wet season dominates the variability of the
N2O and CH4 concentrations and subsequent emissions from
tropical estuaries. Thus, we speculate that any changes in the
Southeast Asian monsoon system will lead to changes in the
N2O and CH4 emissions from these systems. We also suggest
that the ongoing cultivation of peat soil in Borneo is likely to
increase N2O emissions from these estuaries, while the effect
on CH4 remains uncertain.
1 Introduction
Nitrous oxide (N2O) and methane (CH4) are greenhouse
gases whose global warming potentials exceed that of car-
bon dioxide (CO2) by far (a factor of 265 for N2O and 28 for
CH4 on a 100-year time horizon; Myhre et al., 2013). Thus,
an assessment of the natural and anthropogenic sources and
sinks as well as the formation pathways of N2O and CH4
Published by Copernicus Publications on behalf of the European Geosciences Union.
2416 D. Müller et al.: Nitrous oxide and methane in two tropical estuaries
is essential to understand Earth’s present climate variability
and to predict its future development. The world’s oceans,
including its coastal zones, are sources of N2O and CH4 to
the atmosphere and play a major role in the global budget of
atmospheric N2O, but only a minor role in the global bud-
get of atmospheric CH4 (Ciais et al., 2013). Rivers and es-
tuaries are considered hot spots for the production and emis-
sion of both N2O and CH4 (Bange, 2006; Bastviken et al.,
2011; Borges et al., 2015; Murray et al., 2015; Seitzinger and
Kroeze, 1998).
In aquatic systems, N2O is mainly formed as a byproduct
during nitrification (NH+4 →NO−3 ) and to minor extent as
an intermediate during denitrification (NO−3 →N2O→N2)
(Freing et al., 2010). In both processes, the yield of N2O
strongly depends on the concentration of oxygen (O2) (e.g.,
Bange, 2008). Both nitrification and denitrification are mi-
crobial processes and occur in the water column and in sedi-
ments (e.g., Bange, 2008). CH4 is formed during the decom-
position of organic material by microbial methanogenesis
(e.g., Reeburgh, 2007; Valentine, 2011; Ferry, 2010). Since
CH4 formation requires strictly anaerobic conditions, CH4 is
produced in anoxic environments found in sediments, in the
interior of suspended particles or in zooplankton guts (see,
e.g., Reeburgh, 2007; Valentine, 2011). Additionally, CH4 is
oxidized under aerobic and anaerobic conditions in the water
column and in the sediments, respectively (e.g., Valentine,
2011). On the continental shelf so-called geological CH4
can be released directly to the water column through mud
volcanoes, via groundwater input or seeping at pockmark
structures (e.g., Valentine, 2011). Alternative aerobic CH4
formation pathways in the nutrient poor (oligotrophic) sur-
face ocean have been suggested (see, e.g., Karl et al., 2008;
Damm et al., 2010; Zindler et al., 2013), but they are negli-
gible in nutrient-rich (eutrophic) coastal systems.
In this study, we present first measurements of dissolved
N2O and CH4 from the estuaries of the Lupar and Saribas
rivers, which are located in northwestern Borneo (Sarawak,
Malaysia, Southeast Asia). These measurements are com-
plemented by dissolved N2O and CH4 measurements from
a cruise on the adjacent coastal shelf of the South China
Sea. The Lupar and Saribas rivers drain catchments which
are covered by tropical peatlands, parts of which have been
converted to oil palm plantations or other crops. This study
aimed at investigating the effect of the carbon-rich peatlands
on the N2O and CH4 estuarine distributions and emissions
and the potential impact of estuarine eutrophication. Two in-
tensive sampling campaigns took place during the dry and
wet seasons in June 2013 and March 2014, respectively, and
provide a first account of the seasonality in these systems.
&
&
& &
&
&
CIFOR
Sri Aman
Betong
Pusa
Sebuyau
Lingga
LUPAR
SARIBASMaludam
Sarawak (MY)
Additional stations from SO218PEAT
(a)
(b)Beladin
South China Sea
Kalimantan (ID)
0 250 500km
0 10 20km
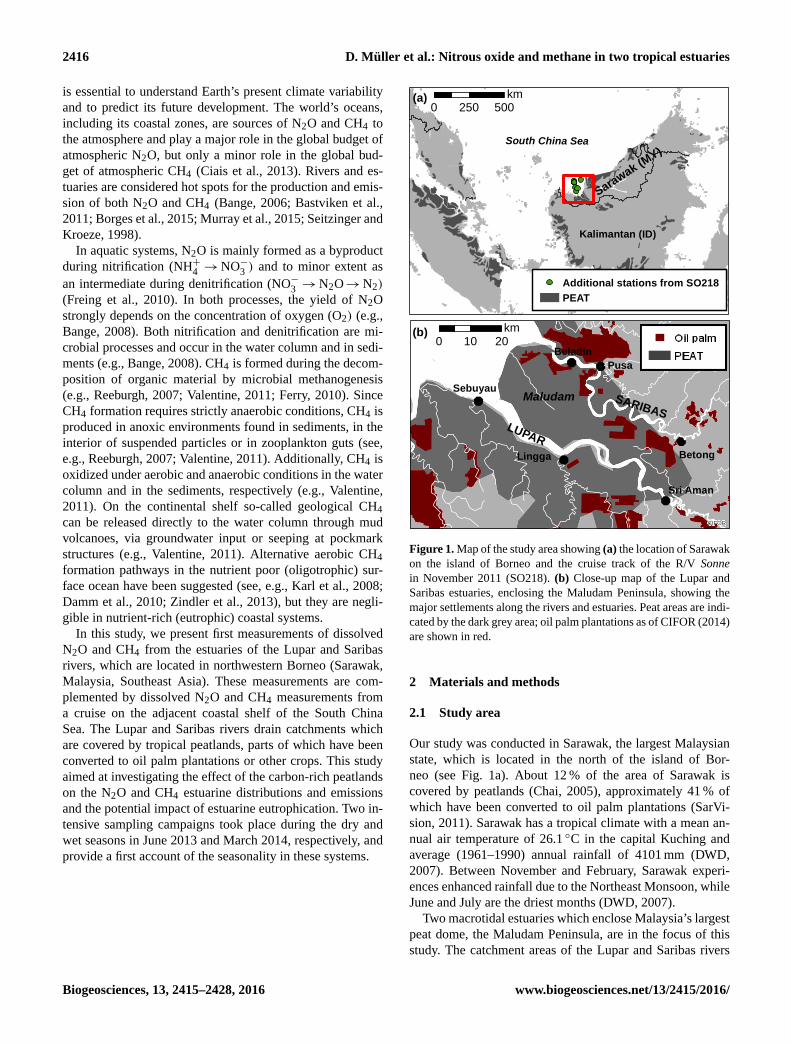
Figure 1. Map of the study area showing (a) the location of Sarawak
on the island of Borneo and the cruise track of the R/V Sonne
in November 2011 (SO218). (b) Close-up map of the Lupar and
Saribas estuaries, enclosing the Maludam Peninsula, showing the
major settlements along the rivers and estuaries. Peat areas are indi-
cated by the dark grey area; oil palm plantations as of CIFOR (2014)
are shown in red.
2 Materials and methods
2.1 Study area
Our study was conducted in Sarawak, the largest Malaysian
state, which is located in the north of the island of Bor-
neo (see Fig. 1a). About 12 % of the area of Sarawak is
covered by peatlands (Chai, 2005), approximately 41 % of
which have been converted to oil palm plantations (SarVi-
sion, 2011). Sarawak has a tropical climate with a mean an-
nual air temperature of 26.1 ◦C in the capital Kuching and
average (1961–1990) annual rainfall of 4101 mm (DWD,
2007). Between November and February, Sarawak experi-
ences enhanced rainfall due to the Northeast Monsoon, while
June and July are the driest months (DWD, 2007).
Two macrotidal estuaries which enclose Malaysia’s largest
peat dome, the Maludam Peninsula, are in the focus of this
study. The catchment areas of the Lupar and Saribas rivers
Biogeosciences, 13, 2415–2428, 2016 www.biogeosciences.net/13/2415/2016/
D. Müller et al.: Nitrous oxide and methane in two tropical estuaries 2417
are 6558 and 1943 km2 , respectively (Lehner et al., 2006),
with approximate discharges of 490 and 160 m3 s−1 (Müller
et al., 2016). The Lupar catchment comprises mainly the di-
vision of Sri Aman, which has a population of approximately
95 000. The Saribas basin belongs largely to the Betong di-
vision, with a population of approximately 110 000 (SPU,
2012). Major settlements along the Lupar River and estu-
ary are Sri Aman, Lingga, and Sebuyau (Fig. 1b). Important
settlements along the Saribas River and estuary are Betong,
Pusa, and Beladin. Oil palms are being cultivated in both
catchments (Fig. 1b).
In the Lupar and Saribas estuaries, sampling took place
during two campaigns in June 2013 and March 2014.
Our sampling strategy is described in detail in Müller et
al. (2016). In that study, we showed that precipitation dur-
ing June 2013 and March 2014 did not deviate much from
the historical average, so we considered the measurements
in June 2013 representative of the dry season and those in
March 2014 representative of the wet season. Therefore, we
refer to the two campaigns as “MLD dry” (June 2013) and
“MLD wet” (March 2014). Note that the peak of the mon-
soon season is between December and February, so the mon-
soon recedes in March, which is why our statements about
seasonality are conservative.
We complement this data set with measurements that were
performed during the cruise SO218 – SHIVA with the Ger-
man research vessel (R/V) Sonne (15–29 November 2011)
(Quack and Krüger, 2013). The cruise started in Singapore
and went along the Sarawakian coastline to end in Manila,
Philippines (see Fig. 1a). For this study, we selected those
samples that were taken in the coastal ocean off northwest-
ern Sarawak (latitude < 2.5, 110.5 < longitude < 111.5) in or-
der to complement our data set from the Lupar and Saribas
estuaries.
2.2 Water chemistry
In the Lupar and Saribas inner and outer estuaries, we sam-
pled 20 stations during the dry season and 23 during the wet
season. Water samples were taken from approximately 1 m
below the water surface. Samples were taken for dissolved
organic carbon (DOC), dissolved inorganic (nitrogenous) nu-
trients (DIN=NO−3 , NO−2 , and NH+4 ), salinity, water tem-
perature, and O2.
Samples for DOC were filtered (pore size: 0.45 µm)
and acidified with 21 % phosphoric acid until the pH had
dropped below 2. DOC concentrations were determined by
high-temperature combustion and subsequent measurement
of resultant CO2 with a non-dispersive infrared detector
(NDIR) (EPA method 415.1). Details are given in Müller et
al. (2016).
Inorganic nutrient samples were filtered through a What-
man glass microfiber filter (pore size 0.7 µm), preserved with
a mercuric chloride (HgCl2) solution, and frozen until anal-
ysis. Concentrations of NO−3 , NO−2 , and NH+4 were deter-
mined spectrophotometrically (Hansen and Koroleff, 1999)
at a wavelength of 540 nm with a continuous flow analyzer
(Alliance, Austria).
Salinity and temperature were measured with a CastAway
CTD at each station during the MLD cruises. Additionally,
we measured conductivity using a TetraCon 925 conduc-
tivity sensor (WTW, Germany). We converted conductivity
to salinity using the equations from Bennett (1976). Dur-
ing SO218, salinity and temperature were measured continu-
ously with a thermosalinograph on board.
Dissolved oxygen (DO) was measured using a Multi3420
with an FDO 925 oxygen sensor (WTW, Germany). A rou-
tine function check in water-vapor-saturated air was con-
ducted prior to the measurements using the check and cal-
ibration vessel that was provided with the sensor.
2.3 N2O and CH4 measurements
Our setup during the MLD cruises is described in detail in
Müller et al. (2016). Surface water was pumped through a
Weiss equilibrator (Johnson, 1999) at a rate of approximately
20 L min−1. The headspace air was analyzed using an in situ
Fourier transform infrared (FTIR) trace gas analyzer (Uni-
versity of Wollongong, Australia). This instrument allows
for the continuous and simultaneous measurements of sev-
eral trace gas species, such as N2O and CH4 as well as CO2
and CO (Müller et al., 2016), with high accuracy and pre-
cision over a wide range of concentrations (Griffith et al.,
2012). Spectra were averaged over 5 min, and dry air-mole
fractions were retrieved using the software MALT5 (Grif-
fith, 1996). The gas dry-air mole fractions were corrected for
pressure, water, and temperature cross-sensitivities (Hammer
et al., 2013). The CO2 and CO data obtained from these
measurements have been reported by Müller et al. (2016).
Here, we present the N2O and CH4 measurements. Calibra-
tion was achieved by measuring a suite of gravimetrically
prepared gas mixtures (Deuste Steininger) ranging from 324
to 3976 ppb N2O and 1.8 to 239 ppm CH4 in synthetic air,
which were calibrated against the World Meteorological Or-
ganization (WMO) reference scale at the Max Planck Insti-
tute for Biogeochemistry in Jena, Germany. The error associ-
ated with the FTIR retrieval is usually small. In ambient air,
the total uncertainties reported by Hammer et al. (2013) are
0.084 for N2O and 0.25 nmol mol−1 for CH4, corresponding
to approximately 0.01 and 0.03 %. The larger source of un-
certainty is a potentially remaining disequilibrium between
water and headspace in the equilibrator, which can cause an
error of < 0.2 % for N2O and 2 % for CH4 (Johnson, 1999).
Water temperature in the equilibrator and in the water as
well as ambient air temperature and pressure were monitored
as described in Müller et al. (2016). N2O and CH4 partial
pressures were calculated. Since the sample air was dried be-
fore entering the FTIR analyzer, we corrected for the removal
of water vapor (Dickson et al., 2007). N2O molar concentra-
tions were calculated from N2O fugacity and solubility (K0)
www.biogeosciences.net/13/2415/2016/ Biogeosciences, 13, 2415–2428, 2016
2418 D. Müller et al.: Nitrous oxide and methane in two tropical estuaries
according to Weiss and Price (1980). CH4 molar concentra-
tions were calculated from CH4 partial pressure, and solubil-
ities were derived from the equations given by Wiesenburg
and Guinasso (1979).
During the R/V Sonne cruise SO218, surface sea wa-
ter was continuously supplied from the ship’s hydrographic
shaft (moon pool) using a submersible pump at about 4 m
water depth. N2O and CH4 samples were taken in tripli-
cates, preserved with HgCl2, and analyzed in the lab us-
ing headspace equilibration and gas chromatography. Details
about the analytical procedures can be found in Walter et
al. (2006) and Bange et al. (2010). The average of the three
samples was calculated, and data were discarded if the stan-
dard deviation exceeded 30 % of the average value. For N2O,
two additional data points were taken from the surface N2O
concentrations determined in depth profiles.
Atmospheric mixing ratios of N2O were taken from the
Mauna Loa (Hawaii) monitoring station of the NOAA/ESRL
halocarbons in situ program (Dutton et al., 2015), which
was the nearest atmospheric N2O monitoring station in the
Northern Hemisphere. Atmospheric N2O in Mauna Loa av-
eraged 325.15 in November 2011, 326.26 in June 2013,
and 327.08 ppb in March 2014. Atmospheric CH4 was de-
rived from the NOAA/ESRL GMD Carbon Cycle Cooper-
ative Global Air Sampling Network (Dlugokencky et al.,
2014). The nearest atmospheric CH4 monitoring station was
Bukit Kototabang, Indonesia. Unfortunately, CH4 data from
NOAA/ ESRL were not available for March 2014, so we
estimated the atmospheric CH4 during that month from the
value reported for March 2013 and an annual growth rate
of 4 ppb between 2004 and 2013 at Bukit Kototabang. At-
mospheric CH4 averaged 1841.64 in November 2011 and
1798.64 in June 2013, and a value of 1879.35 ppb was de-
rived for March 2014.
2.4 Flux estimation
In order to calculate N2O and CH4 flux densities F (in
nmol m−2 s−1) across the water–air interface, we used the
thin-film model, which is expressed by the following equa-
tion:
F = kK0 (pGaswater−pGasair)f, (1)
where k is the gas exchange velocity (m s−1), Ko ist the sol-
ubility of N2O and CH4 in seawater (mol L−1 atm−1; see
Sect. 2.3), pGaswater is the partial pressure derived from the
equilibrator measurements (natm), pGasair is the partial pres-
sure of the gas in air (natm) as measured at the atmospheric
monitoring stations (see Sect. 2.3), and f is a conversion fac-
tor from L−1 to m−3.
For k, we used k600 values that were derived for the Lu-
par and Saribas estuaries using the floating chamber method
(Müller et al., 2016). Floating chamber measurements were
conducted at several locations along the estuaries during the
wet-season campaign and averaged over the spatial extent of
the individual estuaries. We argued in Müller et al. (2016)
that the k600 values determined in this way are more appro-
priate than commonly used wind speed parameterizations,
which neglect the influence of tidal currents and the water
flow velocity. In situ k was calculated based on the Schmidt
numbers of N2O and CH4, which relates the kinematic vis-
cosity to the diffusivity of the gas in water. Kinematic viscos-
ity was calculated according to Siedler and Peters (1986), the
diffusivity of N2O was computed using Eq. (2) in Bange et
al. (2001), and the diffusivity of CH4 was calculated with the
formula given in Jähne et al. (1987). The annual areal flux
density was estimated as the average of the wet- and dry-
season values (for the spatial extent that was covered dur-
ing the 2013 cruise, see Müller et al., 2016). The total N2O
and CH4 fluxes (t N yr−1 and t C yr−1) were calculated as-
suming an estuarine surface area of 220 km2 for the Lupar
and 102 km2 for the Saribas estuary (Müller et al., 2016).
For N2O, we compare this estimate to one derived using the
DIN export and the emission factor for estuaries suggested in
Mosier et al. (1998) (0.0025 kg N2O-N / kg N leaching and
runoff). The DIN export was calculated from river discharge
(see Sect. 2.1) and the median DIN concentration.
3 Results
3.1 Water chemistry
In the Lupar and Saribas estuaries, salinity ranged from 0 to
30.6 in the dry season and from 0 to 31.0 in the wet season.
N2O and CH4 concentration data are available for salinities
of 4.3–26.5 (MLD dry) and 6.9–26.4 (MLD wet). For the
coastal ocean off northwestern Sarawak, N2O measurements
covered salinities between 31.3 and 32.7 and CH4 measure-
ments between 32.2 and 32.7. DO saturation in the estuaries
ranged from 63.6 to 94.6 % (MLD dry) and 79.0–100.4 %
(MLD wet) (Müller et al., 2016).
The total DIN concentrations have already been published
in Müller et al. (2016). Here, we report the concentrations
of the different inorganic nitrogen species. Generally, DIN
concentrations were quite low but locally enhanced. NO−3ranged between 6.3 and 36.3 µmol L−1 in the dry season and
between 2.8 and 17.9 µmol L−1 in the wet season. A max-
imum value of 84.0 µmol L−1 was observed during MLD
dry approximately 20 km offshore in the northwestern direc-
tion from Sebuyau. There, an influence from the Lupar River
plume, and possibly also from the close-by Sadong River,
was detected (salinity= 22.2).
NO−2 concentrations ranged between 0.1 and 0.6 µmol L−1
in the dry season and between < 0.1 and 2.3 µmol L−1 in the
wet season. NH+4 ranged between < 0.1 and 2.6 µmol L−1 in
the dry season, whereas a maximum value of 8.0 µmol L−1
was observed at one station in the Lupar estuary. In the
wet season, NH+4 was higher, ranging between 0.2 and
7.8 µmol L−1. However, overall, DIN concentrations were
Biogeosciences, 13, 2415–2428, 2016 www.biogeosciences.net/13/2415/2016/

D. Müller et al.: Nitrous oxide and methane in two tropical estuaries 2419
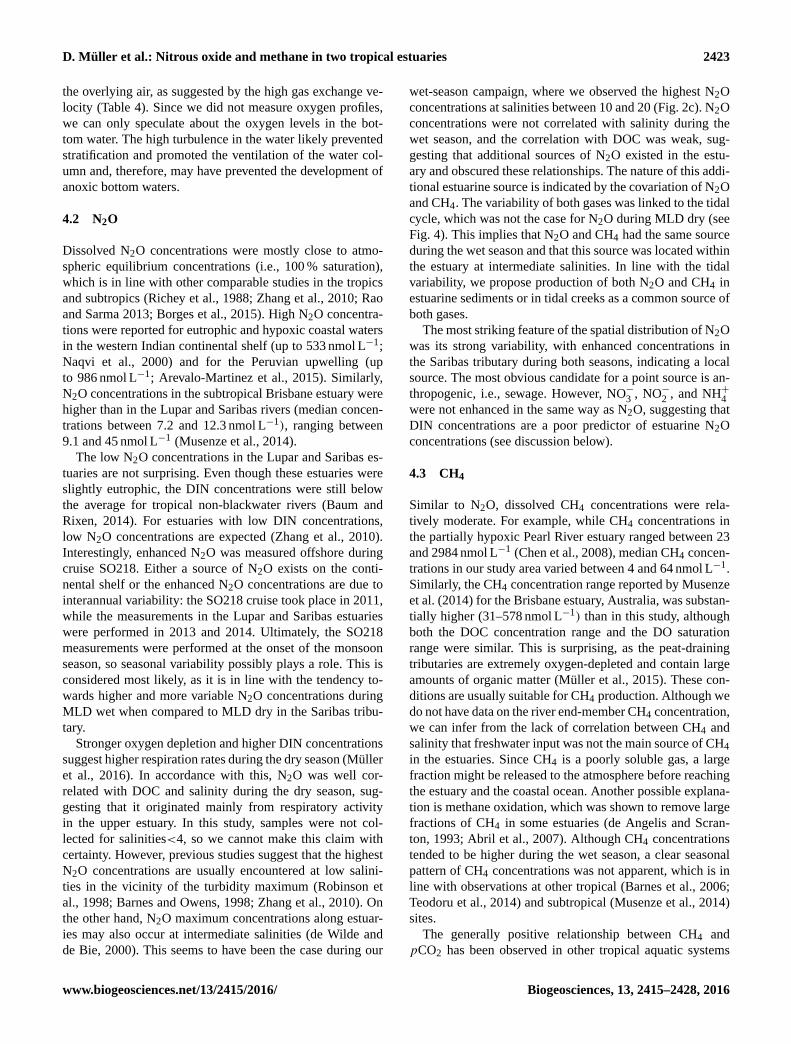
Figure 2. Relationship of nitrous oxide concentrations with (a) dissolved organic carbon (DOC), (b) dissolved inorganic nitrogen (DIN),
(c) salinity, and (d) dissolved oxygen (DO). MLD refers to the campaigns on the Lupar and Saribas estuaries in the dry and wet season,
respectively; SO218 denotes data from the R/V Sonne cruise.
higher in the dry season than in the wet season (Müller et
al., 2016, Table 1).
On the Lupar River, we determined average DIN concen-
trations of 5.1 (2013) and 5.3 µmol L−1 (2014) upstream of
the town of Sri Aman, which can be considered unpolluted.
This value is 2–6 times lower than the DIN concentrations in
the Lupar estuary. On the Saribas River, a slightly enhanced
value of 18.6 µmol L−1 (2013) was measured at salinity 0
outside the town of Betong, so it cannot be considered un-
polluted, yet it was lower than the DIN concentrations in the
estuary during that season (Table 1). We estimated that, to-
gether, the Lupar and Saribas rivers deliver 6086 t N as DIN
to the South China Sea every year (Table 1).
3.2 N2O
Dissolved N2O concentrations in the water ranged from
6.9 to 13.4 nmol L−1 during MLD dry in June 2013 (cor-
responding to saturations of 103 to 184 %) and from 6.6
to 116.8 nmol L−1 during MLD wet in March 2014 (102 to
1679 % saturation). Most of the time, N2O was close to at-
mospheric equilibrium. However, local enhancements were
observed: during both the dry and the wet season, the Saribas
tributary exhibited markedly higher N2O concentrations than
the main Saribas River (Fig. 3a, b, Table 2). During the
wet season, N2O concentrations were more variable (higher
standard deviation, SD) and higher maximum concentrations
were observed (Table 2). Although the mean N2O concentra-
tions in the Saribas estuary and Saribas tributary were higher
in the wet season as well, no difference was found with re-
gards to the medians (Table 2).
Salinity and N2O concentrations were correlated in the
dry season (r =−0.62) but uncorrelated in the wet sea-
son (Fig. 2c). By the town of Sebuyau at the Lupar River
mouth, where the Sebuyau River flows into the South
China Sea, N2O was enhanced with concentrations of up to
116.8 nmol L−1 in the wet season (not shown in Figs. 2–4).
The data from SO218 revealed enhanced N2O concentra-
tions offshore during November 2011 (see Fig. 2c), with a
median of 13.0± 7.0 nmol L−1 (218± 119 % saturation; see
Table 2).
N2O was correlated with DOC (Fig. 2a); this correlation
was strong in the dry season (r = 0.87) and weak during the
wet season (r = 0.38). N2O concentrations were not corre-
lated with DIN (Fig. 2b), NO−3 , NH+4 (not shown), or DO
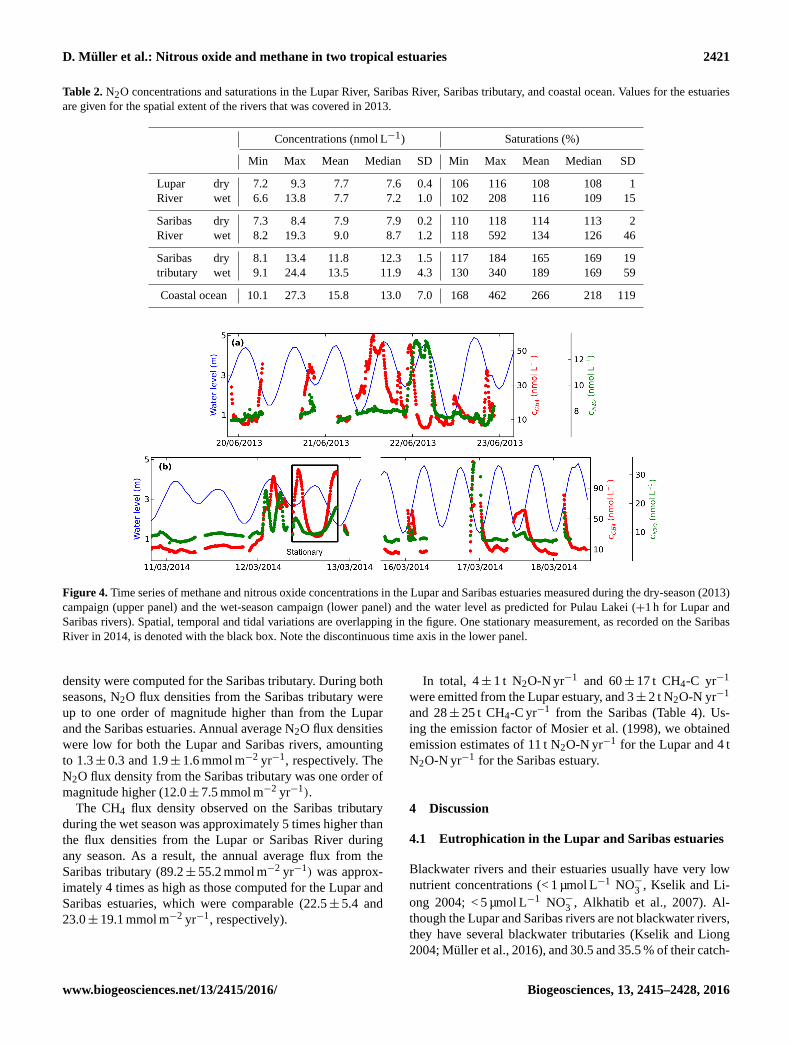
(Fig. 2d). During the dry season, we found no link between
N2O concentrations and tidal variations (Fig. 4a). In the wet
season, however, N2O exhibited slightly higher concentra-
tions during low tide, and its spatiotemporal variation resem-
bled that of CH4 (Fig. 4b).
3.3 CH4
Dissolved CH4 concentrations ranged from 5.2 to
59 nmol L−1 during MLD dry in 2013 (228 to 2782 %
saturation) and from 3.7 to 135 nmol L−1 during MLD wet
www.biogeosciences.net/13/2415/2016/ Biogeosciences, 13, 2415–2428, 2016
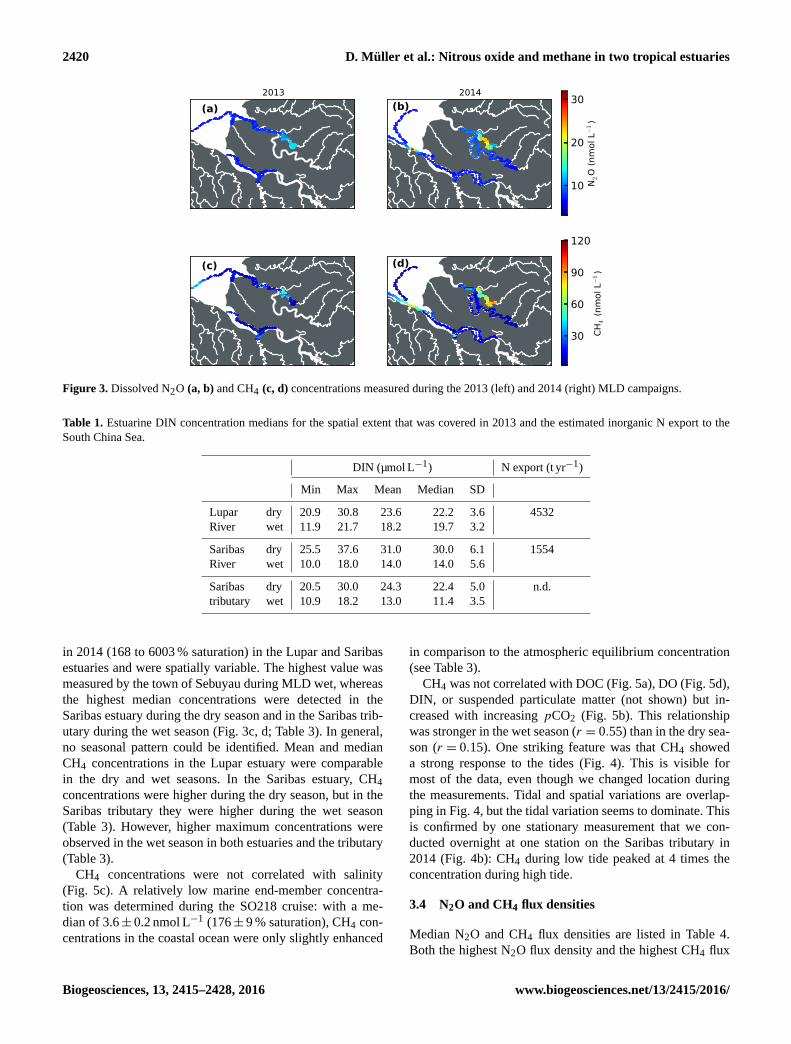
2420 D. Müller et al.: Nitrous oxide and methane in two tropical estuaries
Figure 3. Dissolved N2O (a, b) and CH4 (c, d) concentrations measured during the 2013 (left) and 2014 (right) MLD campaigns.
Table 1. Estuarine DIN concentration medians for the spatial extent that was covered in 2013 and the estimated inorganic N export to the
South China Sea.
DIN (µmol L−1) N export (t yr−1)
Min Max Mean Median SD
Lupar dry 20.9 30.8 23.6 22.2 3.6 4532
River wet 11.9 21.7 18.2 19.7 3.2
Saribas dry 25.5 37.6 31.0 30.0 6.1 1554
River wet 10.0 18.0 14.0 14.0 5.6
Saribas dry 20.5 30.0 24.3 22.4 5.0 n.d.
tributary wet 10.9 18.2 13.0 11.4 3.5
in 2014 (168 to 6003 % saturation) in the Lupar and Saribas
estuaries and were spatially variable. The highest value was
measured by the town of Sebuyau during MLD wet, whereas
the highest median concentrations were detected in the
Saribas estuary during the dry season and in the Saribas trib-
utary during the wet season (Fig. 3c, d; Table 3). In general,
no seasonal pattern could be identified. Mean and median
CH4 concentrations in the Lupar estuary were comparable
in the dry and wet seasons. In the Saribas estuary, CH4
concentrations were higher during the dry season, but in the
Saribas tributary they were higher during the wet season
(Table 3). However, higher maximum concentrations were
observed in the wet season in both estuaries and the tributary
(Table 3).
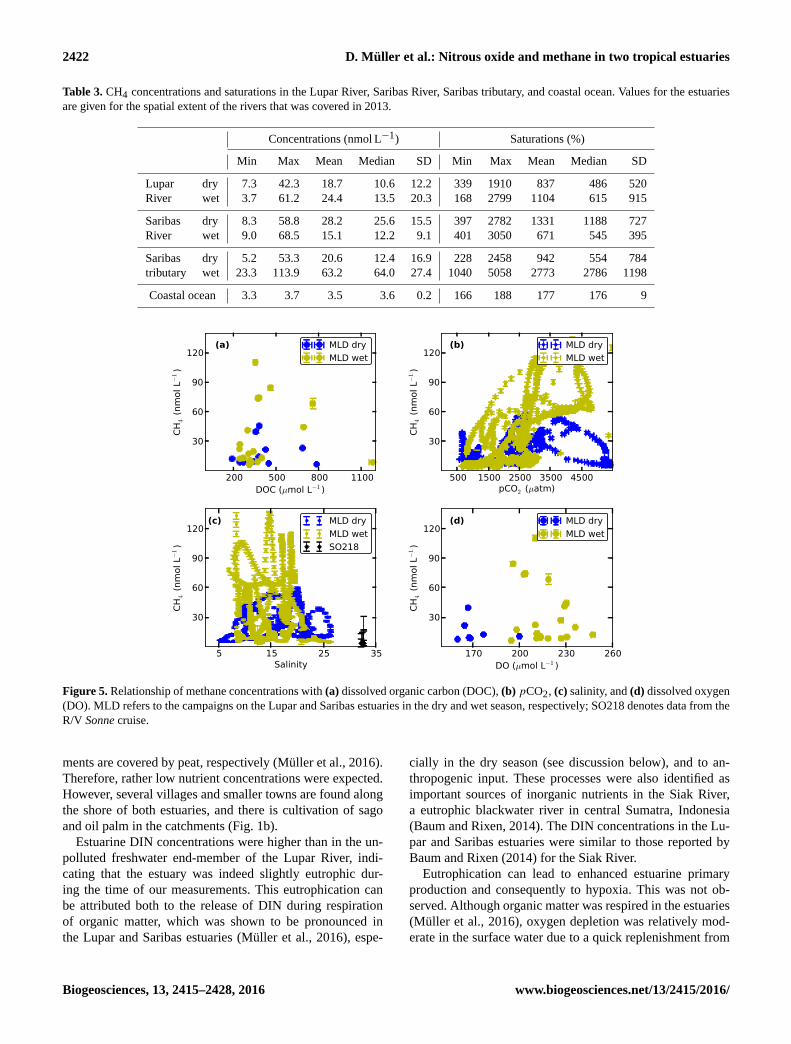
CH4 concentrations were not correlated with salinity
(Fig. 5c). A relatively low marine end-member concentra-
tion was determined during the SO218 cruise: with a me-
dian of 3.6± 0.2 nmol L−1 (176± 9 % saturation), CH4 con-
centrations in the coastal ocean were only slightly enhanced
in comparison to the atmospheric equilibrium concentration
(see Table 3).
CH4 was not correlated with DOC (Fig. 5a), DO (Fig. 5d),
DIN, or suspended particulate matter (not shown) but in-
creased with increasing pCO2 (Fig. 5b). This relationship
was stronger in the wet season (r = 0.55) than in the dry sea-
son (r = 0.15). One striking feature was that CH4 showed
a strong response to the tides (Fig. 4). This is visible for
most of the data, even though we changed location during
the measurements. Tidal and spatial variations are overlap-
ping in Fig. 4, but the tidal variation seems to dominate. This
is confirmed by one stationary measurement that we con-
ducted overnight at one station on the Saribas tributary in
2014 (Fig. 4b): CH4 during low tide peaked at 4 times the
concentration during high tide.
3.4 N2O and CH4 flux densities
Median N2O and CH4 flux densities are listed in Table 4.
Both the highest N2O flux density and the highest CH4 flux
Biogeosciences, 13, 2415–2428, 2016 www.biogeosciences.net/13/2415/2016/
D. Müller et al.: Nitrous oxide and methane in two tropical estuaries 2421
Table 2. N2O concentrations and saturations in the Lupar River, Saribas River, Saribas tributary, and coastal ocean. Values for the estuaries
are given for the spatial extent of the rivers that was covered in 2013.
Concentrations (nmol L−1) Saturations (%)
Min Max Mean Median SD Min Max Mean Median SD
Lupar dry 7.2 9.3 7.7 7.6 0.4 106 116 108 108 1
River wet 6.6 13.8 7.7 7.2 1.0 102 208 116 109 15
Saribas dry 7.3 8.4 7.9 7.9 0.2 110 118 114 113 2
River wet 8.2 19.3 9.0 8.7 1.2 118 592 134 126 46
Saribas dry 8.1 13.4 11.8 12.3 1.5 117 184 165 169 19
tributary wet 9.1 24.4 13.5 11.9 4.3 130 340 189 169 59
Coastal ocean 10.1 27.3 15.8 13.0 7.0 168 462 266 218 119
Figure 4. Time series of methane and nitrous oxide concentrations in the Lupar and Saribas estuaries measured during the dry-season (2013)
campaign (upper panel) and the wet-season campaign (lower panel) and the water level as predicted for Pulau Lakei (+1 h for Lupar and
Saribas rivers). Spatial, temporal and tidal variations are overlapping in the figure. One stationary measurement, as recorded on the Saribas
River in 2014, is denoted with the black box. Note the discontinuous time axis in the lower panel.
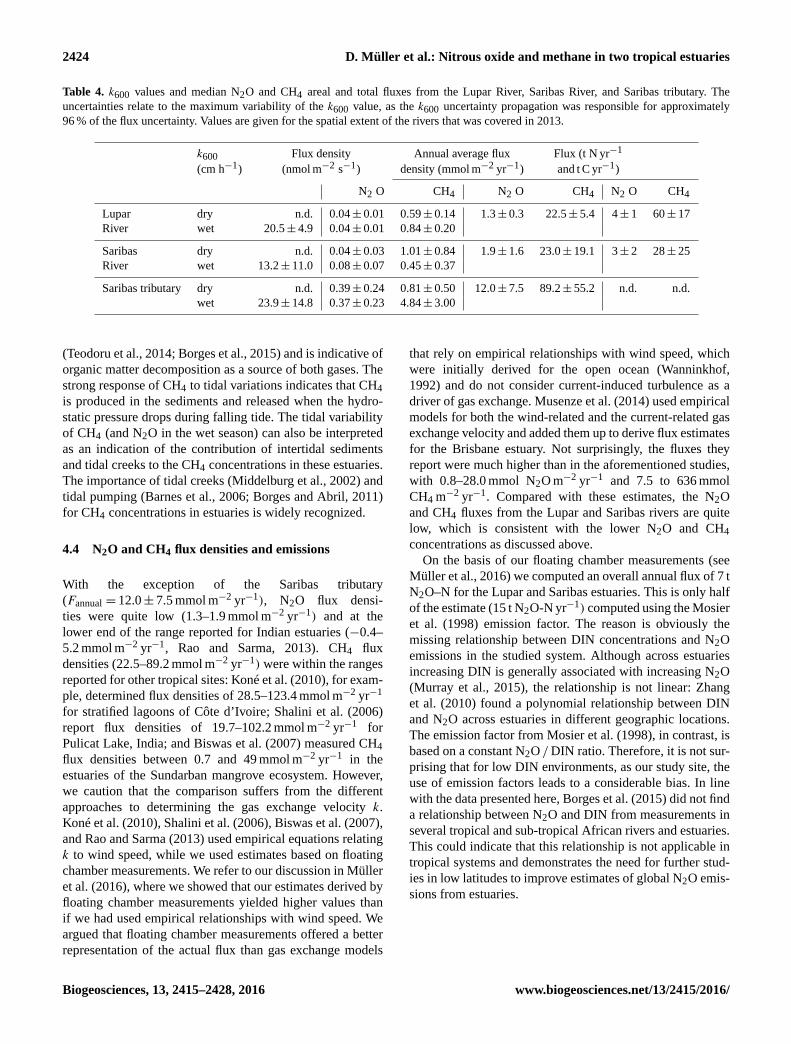
density were computed for the Saribas tributary. During both
seasons, N2O flux densities from the Saribas tributary were
up to one order of magnitude higher than from the Lupar
and the Saribas estuaries. Annual average N2O flux densities
were low for both the Lupar and Saribas rivers, amounting
to 1.3± 0.3 and 1.9± 1.6 mmol m−2 yr−1, respectively. The
N2O flux density from the Saribas tributary was one order of
magnitude higher (12.0± 7.5 mmol m−2 yr−1).
The CH4 flux density observed on the Saribas tributary
during the wet season was approximately 5 times higher than
the flux densities from the Lupar or Saribas River during
any season. As a result, the annual average flux from the
Saribas tributary (89.2± 55.2 mmol m−2 yr−1) was approx-
imately 4 times as high as those computed for the Lupar and
Saribas estuaries, which were comparable (22.5± 5.4 and
23.0± 19.1 mmol m−2 yr−1, respectively).
In total, 4± 1 t N2O-N yr−1 and 60± 17 t CH4-C yr−1
were emitted from the Lupar estuary, and 3± 2 t N2O-N yr−1
and 28± 25 t CH4-C yr−1 from the Saribas (Table 4). Us-
ing the emission factor of Mosier et al. (1998), we obtained
emission estimates of 11 t N2O-N yr−1 for the Lupar and 4 t
N2O-N yr−1 for the Saribas estuary.
4 Discussion
4.1 Eutrophication in the Lupar and Saribas estuaries
Blackwater rivers and their estuaries usually have very low
nutrient concentrations (< 1 µmol L−1 NO−3 , Kselik and Li-
ong 2004; < 5 µmol L−1 NO−3 , Alkhatib et al., 2007). Al-
though the Lupar and Saribas rivers are not blackwater rivers,
they have several blackwater tributaries (Kselik and Liong
2004; Müller et al., 2016), and 30.5 and 35.5 % of their catch-
www.biogeosciences.net/13/2415/2016/ Biogeosciences, 13, 2415–2428, 2016
2422 D. Müller et al.: Nitrous oxide and methane in two tropical estuaries
Table 3. CH4 concentrations and saturations in the Lupar River, Saribas River, Saribas tributary, and coastal ocean. Values for the estuaries
are given for the spatial extent of the rivers that was covered in 2013.
Concentrations (nmol L−1) Saturations (%)
Min Max Mean Median SD Min Max Mean Median SD
Lupar dry 7.3 42.3 18.7 10.6 12.2 339 1910 837 486 520
River wet 3.7 61.2 24.4 13.5 20.3 168 2799 1104 615 915
Saribas dry 8.3 58.8 28.2 25.6 15.5 397 2782 1331 1188 727
River wet 9.0 68.5 15.1 12.2 9.1 401 3050 671 545 395
Saribas dry 5.2 53.3 20.6 12.4 16.9 228 2458 942 554 784
tributary wet 23.3 113.9 63.2 64.0 27.4 1040 5058 2773 2786 1198
Coastal ocean 3.3 3.7 3.5 3.6 0.2 166 188 177 176 9
Figure 5. Relationship of methane concentrations with (a) dissolved organic carbon (DOC), (b) pCO2, (c) salinity, and (d) dissolved oxygen
(DO). MLD refers to the campaigns on the Lupar and Saribas estuaries in the dry and wet season, respectively; SO218 denotes data from the
R/V Sonne cruise.
ments are covered by peat, respectively (Müller et al., 2016).
Therefore, rather low nutrient concentrations were expected.
However, several villages and smaller towns are found along
the shore of both estuaries, and there is cultivation of sago
and oil palm in the catchments (Fig. 1b).
Estuarine DIN concentrations were higher than in the un-
polluted freshwater end-member of the Lupar River, indi-
cating that the estuary was indeed slightly eutrophic dur-
ing the time of our measurements. This eutrophication can
be attributed both to the release of DIN during respiration
of organic matter, which was shown to be pronounced in
the Lupar and Saribas estuaries (Müller et al., 2016), espe-
cially in the dry season (see discussion below), and to an-
thropogenic input. These processes were also identified as
important sources of inorganic nutrients in the Siak River,
a eutrophic blackwater river in central Sumatra, Indonesia
(Baum and Rixen, 2014). The DIN concentrations in the Lu-
par and Saribas estuaries were similar to those reported by
Baum and Rixen (2014) for the Siak River.
Eutrophication can lead to enhanced estuarine primary
production and consequently to hypoxia. This was not ob-
served. Although organic matter was respired in the estuaries
(Müller et al., 2016), oxygen depletion was relatively mod-
erate in the surface water due to a quick replenishment from
Biogeosciences, 13, 2415–2428, 2016 www.biogeosciences.net/13/2415/2016/
D. Müller et al.: Nitrous oxide and methane in two tropical estuaries 2423
the overlying air, as suggested by the high gas exchange ve-
locity (Table 4). Since we did not measure oxygen profiles,
we can only speculate about the oxygen levels in the bot-
tom water. The high turbulence in the water likely prevented
stratification and promoted the ventilation of the water col-
umn and, therefore, may have prevented the development of
anoxic bottom waters.
4.2 N2O
Dissolved N2O concentrations were mostly close to atmo-
spheric equilibrium concentrations (i.e., 100 % saturation),
which is in line with other comparable studies in the tropics
and subtropics (Richey et al., 1988; Zhang et al., 2010; Rao
and Sarma 2013; Borges et al., 2015). High N2O concentra-
tions were reported for eutrophic and hypoxic coastal waters
in the western Indian continental shelf (up to 533 nmol L−1;
Naqvi et al., 2000) and for the Peruvian upwelling (up
to 986 nmol L−1; Arevalo-Martinez et al., 2015). Similarly,
N2O concentrations in the subtropical Brisbane estuary were
higher than in the Lupar and Saribas rivers (median concen-
trations between 7.2 and 12.3 nmol L−1), ranging between
9.1 and 45 nmol L−1 (Musenze et al., 2014).
The low N2O concentrations in the Lupar and Saribas es-
tuaries are not surprising. Even though these estuaries were
slightly eutrophic, the DIN concentrations were still below
the average for tropical non-blackwater rivers (Baum and
Rixen, 2014). For estuaries with low DIN concentrations,
low N2O concentrations are expected (Zhang et al., 2010).
Interestingly, enhanced N2O was measured offshore during
cruise SO218. Either a source of N2O exists on the conti-
nental shelf or the enhanced N2O concentrations are due to
interannual variability: the SO218 cruise took place in 2011,
while the measurements in the Lupar and Saribas estuaries
were performed in 2013 and 2014. Ultimately, the SO218
measurements were performed at the onset of the monsoon
season, so seasonal variability possibly plays a role. This is
considered most likely, as it is in line with the tendency to-
wards higher and more variable N2O concentrations during
MLD wet when compared to MLD dry in the Saribas tribu-
tary.
Stronger oxygen depletion and higher DIN concentrations
suggest higher respiration rates during the dry season (Müller
et al., 2016). In accordance with this, N2O was well cor-
related with DOC and salinity during the dry season, sug-
gesting that it originated mainly from respiratory activity
in the upper estuary. In this study, samples were not col-
lected for salinities<4, so we cannot make this claim with
certainty. However, previous studies suggest that the highest
N2O concentrations are usually encountered at low salini-
ties in the vicinity of the turbidity maximum (Robinson et
al., 1998; Barnes and Owens, 1998; Zhang et al., 2010). On
the other hand, N2O maximum concentrations along estuar-
ies may also occur at intermediate salinities (de Wilde and
de Bie, 2000). This seems to have been the case during our
wet-season campaign, where we observed the highest N2O
concentrations at salinities between 10 and 20 (Fig. 2c). N2O
concentrations were not correlated with salinity during the
wet season, and the correlation with DOC was weak, sug-
gesting that additional sources of N2O existed in the estu-
ary and obscured these relationships. The nature of this addi-
tional estuarine source is indicated by the covariation of N2O
and CH4. The variability of both gases was linked to the tidal
cycle, which was not the case for N2O during MLD dry (see
Fig. 4). This implies that N2O and CH4 had the same source
during the wet season and that this source was located within
the estuary at intermediate salinities. In line with the tidal
variability, we propose production of both N2O and CH4 in
estuarine sediments or in tidal creeks as a common source of
both gases.
The most striking feature of the spatial distribution of N2O
was its strong variability, with enhanced concentrations in
the Saribas tributary during both seasons, indicating a local
source. The most obvious candidate for a point source is an-
thropogenic, i.e., sewage. However, NO−3 , NO−2 , and NH+4were not enhanced in the same way as N2O, suggesting that
DIN concentrations are a poor predictor of estuarine N2O
concentrations (see discussion below).
4.3 CH4
Similar to N2O, dissolved CH4 concentrations were rela-
tively moderate. For example, while CH4 concentrations in
the partially hypoxic Pearl River estuary ranged between 23
and 2984 nmol L−1 (Chen et al., 2008), median CH4 concen-
trations in our study area varied between 4 and 64 nmol L−1.
Similarly, the CH4 concentration range reported by Musenze
et al. (2014) for the Brisbane estuary, Australia, was substan-
tially higher (31–578 nmol L−1) than in this study, although
both the DOC concentration range and the DO saturation
range were similar. This is surprising, as the peat-draining
tributaries are extremely oxygen-depleted and contain large
amounts of organic matter (Müller et al., 2015). These con-
ditions are usually suitable for CH4 production. Although we
do not have data on the river end-member CH4 concentration,
we can infer from the lack of correlation between CH4 and
salinity that freshwater input was not the main source of CH4
in the estuaries. Since CH4 is a poorly soluble gas, a large
fraction might be released to the atmosphere before reaching
the estuary and the coastal ocean. Another possible explana-
tion is methane oxidation, which was shown to remove large
fractions of CH4 in some estuaries (de Angelis and Scran-
ton, 1993; Abril et al., 2007). Although CH4 concentrations
tended to be higher during the wet season, a clear seasonal
pattern of CH4 concentrations was not apparent, which is in
line with observations at other tropical (Barnes et al., 2006;
Teodoru et al., 2014) and subtropical (Musenze et al., 2014)
sites.
The generally positive relationship between CH4 and
pCO2 has been observed in other tropical aquatic systems
www.biogeosciences.net/13/2415/2016/ Biogeosciences, 13, 2415–2428, 2016
2424 D. Müller et al.: Nitrous oxide and methane in two tropical estuaries
Table 4. k600 values and median N2O and CH4 areal and total fluxes from the Lupar River, Saribas River, and Saribas tributary. The
uncertainties relate to the maximum variability of the k600 value, as the k600 uncertainty propagation was responsible for approximately
96 % of the flux uncertainty. Values are given for the spatial extent of the rivers that was covered in 2013.
k600 Flux density Annual average flux Flux (t N yr−1
(cm h−1) (nmol m−2 s−1) density (mmol m−2 yr−1) and t C yr−1)
N2 O CH4 N2 O CH4 N2 O CH4
Lupar dry n.d. 0.04± 0.01 0.59± 0.14 1.3± 0.3 22.5± 5.4 4± 1 60± 17
River wet 20.5± 4.9 0.04± 0.01 0.84± 0.20
Saribas dry n.d. 0.04± 0.03 1.01± 0.84 1.9± 1.6 23.0± 19.1 3± 2 28± 25
River wet 13.2± 11.0 0.08± 0.07 0.45± 0.37
Saribas tributary dry n.d. 0.39± 0.24 0.81± 0.50 12.0± 7.5 89.2± 55.2 n.d. n.d.
wet 23.9± 14.8 0.37± 0.23 4.84± 3.00
(Teodoru et al., 2014; Borges et al., 2015) and is indicative of
organic matter decomposition as a source of both gases. The
strong response of CH4 to tidal variations indicates that CH4
is produced in the sediments and released when the hydro-
static pressure drops during falling tide. The tidal variability
of CH4 (and N2O in the wet season) can also be interpreted
as an indication of the contribution of intertidal sediments
and tidal creeks to the CH4 concentrations in these estuaries.
The importance of tidal creeks (Middelburg et al., 2002) and
tidal pumping (Barnes et al., 2006; Borges and Abril, 2011)
for CH4 concentrations in estuaries is widely recognized.
4.4 N2O and CH4 flux densities and emissions
With the exception of the Saribas tributary
(Fannual = 12.0± 7.5 mmol m−2 yr−1), N2O flux densi-
ties were quite low (1.3–1.9 mmol m−2 yr−1) and at the
lower end of the range reported for Indian estuaries (−0.4–
5.2 mmol m−2 yr−1, Rao and Sarma, 2013). CH4 flux
densities (22.5–89.2 mmol m−2 yr−1) were within the ranges
reported for other tropical sites: Koné et al. (2010), for exam-
ple, determined flux densities of 28.5–123.4 mmol m−2 yr−1
for stratified lagoons of Côte d’Ivoire; Shalini et al. (2006)
report flux densities of 19.7–102.2 mmol m−2 yr−1 for
Pulicat Lake, India; and Biswas et al. (2007) measured CH4
flux densities between 0.7 and 49 mmol m−2 yr−1 in the
estuaries of the Sundarban mangrove ecosystem. However,
we caution that the comparison suffers from the different
approaches to determining the gas exchange velocity k.
Koné et al. (2010), Shalini et al. (2006), Biswas et al. (2007),
and Rao and Sarma (2013) used empirical equations relating
k to wind speed, while we used estimates based on floating
chamber measurements. We refer to our discussion in Müller
et al. (2016), where we showed that our estimates derived by
floating chamber measurements yielded higher values than
if we had used empirical relationships with wind speed. We
argued that floating chamber measurements offered a better
representation of the actual flux than gas exchange models
that rely on empirical relationships with wind speed, which
were initially derived for the open ocean (Wanninkhof,
1992) and do not consider current-induced turbulence as a
driver of gas exchange. Musenze et al. (2014) used empirical
models for both the wind-related and the current-related gas
exchange velocity and added them up to derive flux estimates
for the Brisbane estuary. Not surprisingly, the fluxes they
report were much higher than in the aforementioned studies,
with 0.8–28.0 mmol N2O m−2 yr−1 and 7.5 to 636 mmol
CH4 m−2 yr−1. Compared with these estimates, the N2O
and CH4 fluxes from the Lupar and Saribas rivers are quite
low, which is consistent with the lower N2O and CH4
concentrations as discussed above.
On the basis of our floating chamber measurements (see
Müller et al., 2016) we computed an overall annual flux of 7 t
N2O–N for the Lupar and Saribas estuaries. This is only half
of the estimate (15 t N2O-N yr−1) computed using the Mosier
et al. (1998) emission factor. The reason is obviously the
missing relationship between DIN concentrations and N2O
emissions in the studied system. Although across estuaries
increasing DIN is generally associated with increasing N2O
(Murray et al., 2015), the relationship is not linear: Zhang
et al. (2010) found a polynomial relationship between DIN
and N2O across estuaries in different geographic locations.
The emission factor from Mosier et al. (1998), in contrast, is
based on a constant N2O / DIN ratio. Therefore, it is not sur-
prising that for low DIN environments, as our study site, the
use of emission factors leads to a considerable bias. In line
with the data presented here, Borges et al. (2015) did not find
a relationship between N2O and DIN from measurements in
several tropical and sub-tropical African rivers and estuaries.
This could indicate that this relationship is not applicable in
tropical systems and demonstrates the need for further stud-
ies in low latitudes to improve estimates of global N2O emis-
sions from estuaries.
Biogeosciences, 13, 2415–2428, 2016 www.biogeosciences.net/13/2415/2016/
D. Müller et al.: Nitrous oxide and methane in two tropical estuaries 2425
4.5 Implications for future land use change
Nutrient loads to estuaries are predicted to increase in the fu-
ture in most of Southeast Asia (Seitzinger and Kroeze, 1998).
Our results imply that eutrophication in peat-dominated es-
tuaries does not automatically lead to enhanced N2O emis-
sions. However, the localized elevation of N2O concentra-
tions, as observed on the Saribas tributary, suggests that estu-
arine N2O concentrations might be impacted by local anthro-
pogenic sources. Indeed, it has been shown that N2O emis-
sions from peat soils depend on land use and that cultivated
sites generally exhibit higher N2O fluxes to the atmosphere
(Hadi et al., 2000). It is likely that this behavior is mirrored
in the aquatic systems as well.
As CH4 emissions from peatlands depend largely on the
water table (Couwenberg et al., 2010), CH4 fluxes from peat-
lands are enhanced under sago (Melling et al., 2005) and
rice (Couwenberg et al., 2010) and reduced under oil palm
(Melling et al., 2005). The cultivation of sago in the catch-
ment of the Saribas tributary might therefore partially ex-
plain the observed high CH4 fluxes from the Saribas tribu-
tary. The future development of CH4 dynamics in estuaries
in this region in conjunction with land use change is hard
to predict, as there are potentially counteracting effects of
the conversion of peatlands to oil palm and other industrial
crops, which require different agricultural practices (flooding
versus drainage).
5 Conclusions
Overall, we found that the two tropical estuaries of the Lu-
par and Saribas rivers in a peat-dominated region in Malaysia
were small to moderate sources of N2O and CH4 to the at-
mosphere. DIN concentrations were slightly enhanced com-
pared to the unpolluted riverine end-member. This eutrophi-
cation did not lead to hypoxia or to enhanced N2O concen-
trations. DIN was generally a poor predictor of N2O, which
provides further evidence that the use of emission factors for
the calculation of N2O fluxes from tropical estuaries is in-
appropriate. Although predictions about the future develop-
ment of the Southeast Asian monsoon are highly uncertain
and locally variable, it is likely that rainfall will moderately
increase in this region (Christensen et al., 2013). Our results
suggest that this may increase the N2O and probably also
the CH4 emissions from estuaries, as the concentrations of
both gases were more variable during the wet season, with
higher maximum concentrations of both gases and additional
sources of N2O in the estuaries. For our study area, additional
sampling at the peak of the monsoon season would be desir-
able in order to consolidate these statements. Yet, our results
provide a first account of the seasonality in these systems
and underline the fact that time series measurements (sea-
sonal sampling) are vital for the understanding of N2O and
CH4 fluxes from aquatic systems in monsoonal regions.
Data availability
For measurements of dissolved N2O and CH4 in the Lupar
and Saribas estuaries, our research permit entails the provi-
sion that the Sarawak Biodiversity Center (SBC) approves of
intended publications prior to submission. As this cannot be
guaranteed if the data can be publicly accessed, the research
permit does not include permission to make data publicly
available. Data are stored at the Institute of Environmental
Physics, University of Bremen, Bremen, Germany, and can
be requested from the corresponding author.
Measurements of dissolved N2O and CH4 during
SO218 are available from the GEOMAR Helmholtz Cen-
tre for Ocean Research Kiel (https://memento.geomar.
de/). Atmospheric N2O concentrations at Mauna Loa
are available from the NOAA/ESRL Global Monitoring
Division (ftp://aftp.cmdl.noaa.gov/data/hats/n2o/insituGCs/
CATS/monthly/). Atmospheric CH4 concentrations at Bukit
Kototabang, Indonesia, are available from the NOAA/ESRL
Global Monitoring Division (ftp://aftp.cmdl.noaa.gov/data/
trace_gases/ch4/flask/surface/).
Acknowledgements. We would like to thank the Sarawak Bio-
diversity Center for permission to conduct research in Sarawak
waters (permit no. SBC-RA-0097-MM and export permit SBC-
EP-0040-MM). We thank Hella van Asperen (University of
Bremen, Germany), Nastassia Denis, Felicity Kuek, Joanne Yeo,
Hong Chang Lim, Edwin Sia (all Swinburne University, Malaysia),
and all scientists and students from Swinburne University and the
University of Malaysia Sarawak who were involved in the MLD
cruises and their preparation. Lukas Chin and the crew members
of the SeaWonder are acknowledged for their support. We thank
Franziska Wittke (GEOMAR), who performed the sampling for
N2O and CH4 on the R/V Sonne cruise SO218, and Annette Kock
(GEOMAR), who computed the data from SO218. The authors
thank Matthias Birkicht and Dorothee Dasbach (ZMT Bremen,
Germany) for their help in the lab performing the analyses of the
MLD samples. We acknowledge the University of Bremen for
funding the MLD cruises through the “exploratory project” in the
framework of the University’s Institutional Strategy and the EU
FP7 project InGOS for supporting the development of the FTIR
measurements. Cruise SO218 was supported by the EU FP7 project
SHIVA under grant agreement no. 226224.
The article processing charges for this open-access
publication were covered by the University of Bremen.
Edited by: S. W. A. Naqvi
References
Abril, G., Commarieu, M. V., and Guérin, F.: Enhanced methane
oxidation in an estuarine turbidity maximum, Limnol. Oceanogr.,
52, 470–475, 2007.
www.biogeosciences.net/13/2415/2016/ Biogeosciences, 13, 2415–2428, 2016
2426 D. Müller et al.: Nitrous oxide and methane in two tropical estuaries
Alkhatib, M., Jennerjahn, T. C., and Samiaji, J.: Biogeochemistry
of the Dumai River estuary, Sumatra, Indonesia, a tropical black-
water river, Limnol. Oceanogr., 52, 2410–2417, 2007.
Arévalo-Martínez, D. L., Kock, A., Löscher, C. A., Schmitz, R. A.,
and Bange, H. W.: Massive nitrous oxide emissions from the
tropical South Pacific Ocean, Nat. Geosci., 8, 530–533, 2015.
Bange, H. W.: Nitrous oxide and methane in European coastal wa-
ters, Estuar. Coast. Shelf S., 70, 361–374, 2006.
Bange, H. W.: Gaseous nitrogen compounds (NO, N2O, N2, NH3)
in the ocean, in: Nitrogen in the Marine Environment, edited by:
Capone, D. G., Bronk, D. A., Mulholland, M. R., and Carpenter,
E. J., 2nd Edn., Elsevier B.V., Amsterdam, 2, 51–94, 2008.
Bange, H. W., Andreae, M. O., Lal, S., Law, C. S., Naqvi, S. W. A.,
Oatra, P. K., Rixen, T., and Upstill-Goddard, R. C.: Nitrous ox-
ide emissions from the Arabian Sea: A synthesis, Atmos. Chem.
Phys., 1, 61–71, doi:10.5194/acp-1-61-2001, 2001.
Bange, H. W., Bergmann, K., Hansen, H. P., Kock, A., Koppe, R.,
Malien, F., and Ostrau, C.: Dissolved methane during hypoxic
events at the Boknis Eck time series station (Eckernförde Bay,
SW Baltic Sea), Biogeosciences, 7, 1279–1284, doi:10.5194/bg-
7-1279-2010, 2010.
Barnes, J. and Owens, N. J. P.: Denitrification and Nitrous Ox-
ide Concentrations in the Humber Estuary, UK, and Adjacent
Coastal Zones, Mar. Pollut. Bull., 37, 247–260, 1998.
Barnes, J., Ramesh, R., Purvaja, R., Nirmal Rajkumar, A., Senthil
Kumar, B., Krithika, K., Ravichandran, K., Uher, G., and Upstill-
Goddard, R.: Tidal dynamics and rainfall control N2O and CH4
emissions from a pristine mangrove creek, Geophys. Res. Lett.,
33, L15405, doi:10.1029/2006GL026829, 2006.
Bastviken, D., Tranvik, L. J., Downing, J. A., Crill, P.
M., and Enrich-Prast, A.: Freshwater methane emis-
sions offset continental carbon sink, Science, 331, p. 50,
doi:10.1126/science.1196808, 2011.
Baum, A. and Rixen, T.: Dissolved inorganic nitrogen and phos-
phate in the human affected blackwater river Siak, central Suma-
tra, Indonesia, Asian Journal of Water, Environ. Pollut., 11, 13–
24, 2014.
Bennett, A. S.: Conversion of in situ measurements of conductivity
to salinity, Deep-Sea Res., 23, 157–165, 1976.
Biswas, H., Mukhopadhyay, S. K., Sen, S., and Jana, T. K.: Spatial
and temporal patterns of methane dynamics in the tropical man-
grove dominated estuary, NE coast of Bay of Bengal, India, J.
Marine Syst., 68, 55–64, 2007.
Borges, A. V. and Abril, G.: Carbon dioxide and methane dynamics
in estuaries, in: Treatise on Estuarine and Coastal Science, edited
by: Wolanski, E. and McLusky, D. S., Academic Press, Waltham,
5, 119–161, 2011.
Borges, A. V., Darchambeau, F., Teodoru, C. R., Marwick, T. R.,
Tamooh, F., Geeraert, N., Omengo, F. O., Guérin, F., Lambert,
T., Morana, C., Okuku, E., and Bouillon, S.: Globally signifi-
cant greenhouse-gas emissions from African inland waters, Nat.
Geosci., 8, 673–642, 2015.
Chai, P. K.: Management plan for Maludam National Park Be-
tong Division Sarawak, Tech. Rep., Alterra/Forest Department
Sarawak/Sarawak Forestry Corporation, Wageningen, 2005.
Chen, C. T. A., Wang, S. L., Lu, X. X., Zhang, S. R., Lui, H. K.,
Tseng, H. C., Wang, B. J., and Huang, H. I.: Hydrogeochemistry
and greenhouse gases of the Pearl River, its estuary and beyond,
Quat. Int., 186, 79–90, 2008.
Christensen, J. H., Krishna Kumar, K., Aldrian, E., An, S. I., Cav-
alcanti, I. F. A., de Castro, M., Dong, W., Goswami, P., Hall, A.,
Kanyanga, J. K., Kitoh, A., Kossin, J., Lau, N. C., Renwick, J.,
Stephenson, D. B., Xie, S. P., and Zhou, T.: Climate Phenom-
ena and their Relevance for Future Regional Climate Change, in:
Climate Change 2013: The Physical Science Basis. Contribution
of Working Group I to the Fifth Assessment Report of the Inter-
governmental Panel on Climate Change, edited by: Stocker, T.
F., Qin, D., Plattner, G. K., Tignor, M., Allen, S. K., Boschung,
J., Nauels, A., Xia, Y., Bex, V., and Midgley, P. M., Cambridge
University Press, Cambridge, United Kingdom and New York,
NY, USA, 2013.
Ciais, P., Sabine, C., Bala, G., Bopp, L., Brovkin, V., Canadell, J.,
Chhabra, A., DeFries, R., Galloway, J., Heimann, M., Jones, C.,
Le Quéré, C., Myneni, R. B., Piao, S., and Thornton, P.: Carbon
and Other Biogeochemical Cycles, in: Climate Change 2013:
The Physical Science Basis, Contribution of Working Group I to
the Fifth Assessment Report of the Intergovernmental Panel on
Climate Change, edited by: Stocker, T. F., Qin, D., Plattner, G.
K., Tignor, M., Allen, S. K., Boschung, J., Nauels, A., Xia, Y.,
Bex, V., and Midgley, P. M., Cambridge University Press, Cam-
bridge, United Kingdom and New York, NY, USA, 2013.
CIFOR: Center for International Forestry Research, Industrial plan-
tations in Borneo, Shapefiles for ArcGIS, available at: http:
//www.cifor.org/ (last access: 17 June 2015), 2014.
Couwenberg, J., Dommain, R., and Joosten, H.: Greenhouse gas
fluxes from tropical peatlands in south-east Asia, Glob. Change
Biol., 16, 1715–1732, 2010.
Damm, E., Helmke, E., Thoms, S., Schauer, U., Nöthig, E., Bakker,
K., and Kiene, R. P.: Methane production in aerobic oligotrophic
surface water in the central Arctic Ocean, Biogeosciences, 7,
1099–1108, doi:10.5194/bg-7-1099-2010, 2010.
de Angelis, M. A. and Scranton, M. I.: Fate of methane in the Hud-
son River and Estuary, Global Biogeochem. Cy., 7, 509–523,
1993.
de Wilde, H. P. J. and de Bie, M. J. M.: Nitrous oxide in the Schelde
estuary: production by nitrification and emission to the atmo-
sphere, Mar. Chem., 69, 203–216, 2000.
Dickson, A., Sabine, C., and Christian, G.: Guide to best practices
for ocean CO2 measurements, North Pacific Marine Science Or-
ganization (PICES) Special Publication, 3rd Edn., available at:
http://cdiac.ornl.gov/oceans/Handbook_2007.html (last access: 6
July 2015), 191 pp., 2007.
Dlugokencky, E. J., Lang, P. M., Crotwell, A. M., Masarie, K. A.,
and Crotwell, M. J.: Atmospheric Methane Dry Air Mole Frac-
tions from the NOAA ESRL Carbon Cycle Cooperative Global
Air Sampling Network, 1983–2013, Version: 2014-06-24, ftp:
//aftp.cmdl.noaa.gov/data/trace_gases/ch4/flask/surface/ (last ac-
cess: 25 April 2016), 2014.
Dutton, G. S., Elkins, J. W., and Hall, B. D.: Nitrous oxide
data from the NOAA/ESRL halocarbons in situ program, avail-
able at: ftp://aftp.cmdl.noaa.gov/data/hats/n2o/insituGCs/CATS/
monthly/, (last access: 25 April 2016), 2015.
DWD: Deutscher Wetterdienst, Climate data worldwide, as Excel
file, http://www.dwd.de/bvbw/appmanager/bvbw/ (last access: 3
June 2015), 2007.
Ferry, J. G.: How to make a living by exhaling methane, An. Rev.
Microbiol., 64, 453–473, 2010.
Biogeosciences, 13, 2415–2428, 2016 www.biogeosciences.net/13/2415/2016/
D. Müller et al.: Nitrous oxide and methane in two tropical estuaries 2427
Freing, A., Wallace, D. W. R., and Bange, H. W.: Global oceanic
production of nitrous oxide, Philos. Tr. R. Soc., 367, 1245–1255,
2012.
Griffith, D. W. T.: Synthetic calibration and quantitative analysis of
gas-phase FT-IR spectra, Appl. Spectrosc., 50, 59–70, 1996.
Griffith, D. W. T., Deutscher, N. M., Caldow, C., Kettlewell, G.,
Riggenbach, M., and Hammer, S.: A Fourier transform infrared
trace gas and isotope analyser for atmospheric applications, At-
mos. Meas. Tech., 5, 2481–2498, doi:10.5194/amt-5-2481-2012,
2012.
Hadi, A., Inubushi, K., Purnomo, E., Razie, F., Yamakawa, K.,
and Tsuruta, H.: Effect of land-use changes on nitrous oxide
(N2O) emission from tropical peatlands, Chemosphere, 2, 347–
358, 2000.
Hammer, S., Griffith, D. W. T., Konrad, G., Vardag, S., Caldow,
C., and Levin, I.: Assessment of a multi-species in situ FTIR for
precise atmospheric greenhouse gas observations, Atmos. Meas.
Tech., 6, 1153–1170, doi:10.5194/amt-6-1153-2013, 2013.
Hansen, H. P. and Koroleff, F.: Determination of nutrients, in: Meth-
ods of Seawater Analysis, edited by: Grasshoff, K., Kremling, K.,
and Ehrhardt, M., 3rd Edn., Wiley-VCH, Weinheim, 1999.
Jähne, B., Heinz, G., and Dietrich, W.: Measurement of the diffu-
sion coefficients of sparingly soluble gases in water, J. Geophys.
Res., 92, 10767–10776, 1987.
Johnson, J. E.: Evaluation of a seawater equilibrator for shipboard
analysis of dissolved oceanic trace gases, Anal. Chim. Acta, 395,
119–132, 1999.
Karl, D. M., Beversdorf, L., Björkman, K. M., Church, M. J., Mar-
tinez, A., and Delong, E. F.: Aerobic production of methane in
the sea, Nat. Geosci., 1, 473–478, 2008.
Koné, Y. J. M., Abril, G., Delille, B., and Borges, A. V.: Seasonal
variability of methane in the rivers and lagoons of Ivory Coast
(West Africa), Biogeochemistry, 100, 21–37, 2010.
Kselik, R. A. L. and Liong, T. Y.: Hydrology of the peat swamp
in the Maludam National Park Betong Division Sarawak, Tech.
Rep., Alterra/Forest Department Sarawak/Sarawak Forestry Cor-
poration, Kuching, Sarawak, Malaysia, 2004.
Lehner, B., Verdin, K., and Jarvis, A.: HydroSHEDS technical
documentation. World Wildlife Funds US, Washington, DC, 1st
Edn., http://hydrosheds.cr.usgs.gov (last access: 17 June 2015),
2006.
Melling, L., Hatano, R., and Goh, K. J.: Methane Fluxes from three
ecosystems in tropical peatland of Sarawak, Malaysia, Soil Biol.
Biogeochem., 37, 1445–1453, 2005.
Middelburg, J. J., Nieuwenhuize, J., Iversen, N., Hogh, N., de
Wilde, H., Helder, W., Seifert, R., and Christof, O.: Methane dis-
tribution in European tidal estuaries, Biogeochemistry, 59, 95–
119, 2002.
Mosier, A., Kroeze, C., Nevison, C., Oenema, O., Seitzinger, S. P.,
and van Cleemput, O.: Closing the global N2O budget: nitrous
oxide emissions through the agricultural nitrogen cycle, Nutr.
Cycl. Agroecosys., 52, 225–248, 1998.
Müller, D., Warneke, T., Rixen, T., Müller, M., Jamahari, S., Denis,
N., Mujahid, A., and Notholt, J.: Lateral carbon fluxes and CO2
outgassing from a tropical peat-draining river, Biogeosciences,
12, 5967–5979, doi:10.5194/bg-12-5967-2015, 2015.
Müller, D., Warneke, T., Rixen, T., Müller, M., Mujahid, A., Bange,
H. W., and Notholt, J.: Fate of terrestrial organic carbon and asso-
ciated CO2 and CO emissions from two Southeast Asian estuar-
ies, Biogeosciences, 13, 691–705, doi:10.5194/bg-13-691-2016,
2016.
Murray, R. H., Erler, D. V., and Eyre, B. D.: Nitrous oxide fluxes in
estuarine environments: response to global change, Glob. Change
Biol., 21, 3219–3245, doi:10.1111/gcb.12923, 2015.
Musenze, R. S., Werner, U., Grinham, A., Udy, J., and Yuan, Z.:
Methane and nitrous oxide emissions from a subtropical estuary
(the Brisbane River estuary, Australia), Sci. Total Environ., 472,
719–729, 2014.
Myhre, G., Shindell, D., Bréon, F. M., Collins, W., Fuglestvedt,
J., Huang, J., Koch, D., Lamarque, J. F., Lee, D., Mendoza,
B., Nakajima, T., Robock, A., Stephens, G., Takemura, T., and
Zhang, H.: Anthropogenic and natural radiative forcing, in: Cli-
mate Change 2013: The Physical Science Basis, Contribution
of Working Group I to the Fifth Assessment Report of the In-
tergovernmental Panel on Climate Change, edited by: Stocker,
T., Qin, D., Plattner, G. K., Tignor, M., Allen, S., Boschung, J.,
Nauels, A., Xia, Y., Bex, V., and Midgley, P., Cambridge Univer-
sity Press, Cambridge, United Kingdom and New York, 2013.
Naqvi, S. W. A., Jayakumar, D. A., Narvekar, P. V., Naik, H., Sarma,
V. V. S. S., D’Souza, W., Joseph, S., and George, M. D.: In-
creased marine production of N2O due to intensifying anoxia on
the Indian continental shelf, Nature, 408, 346–349, 2000.
Quack, B. and Krüger, K.: Stratospheric ozone: Halogen Impacts in
a Varying Atmosphere, GEOMAR-Report 12, ISSN 2193-8113,
2013.
Rao, G. D. and Sarma, V. V. S. S.: Contribution of N2O emissions
to the atmosphere from Indian monsoonal estuaries, Tellus B, 65,
19660, doi:10.3402/tellusb.v65i0.19660, 2013.
Reeburgh, W. S. Oceanic methane biogeochemistry, Chem. Rev.,
107, 486–513, 2007.
Richey, J. E., Devol, A. H., Wofsy, S. C., Victoria, R., and Riberio,
M. N. G.: Biogenic gases and the oxidation and reduction of car-
bon in Amazon River and floodplain waters, Limnol. Oceanogr.,
33, 551–561, 1988.
Robinson, A. D., Nedwell, D. B., Harrison, R. M., and Ogilvie, B.
G.: Hypernutrified estuaries as sources of N2O emission to the at-
mosphere: the estuary of the River Colne, Essex, UK, Mar. Ecol.
Prog. Ser., 164, 59–71, 1998.
SarVision: Impact of oil palm plantations on peatland conversion in
Sarawak 2005–2010, Tech. Rep., SarVision, Wageningen, 2011.
Seitzinger, S. P. and Kroeze, C.: Global distribution of nitrous oxide
production and N inputs in freshwater and coastal marine ecosys-
tems, Global Biogeochem. Cy., 12, 93–113, 1998.
Shalini, A., Ramesh, R., Purvaja, R., and Barnes, J.: Spatial and
temporal distribution of methane in an extensive shallow estuary,
south India, J. Earth Syst. Sci., 115, 451–460, 2006.
Siedler, G. and Peters, H.: Properties of sea water, in: Oceanog-
raphy, edited by: Sündermann, J., Landolt-Börnstein, vol. 3a,
Springer Verlag, New York, 233–264, 1986.
SPU: State Planning Unit Sarawak Facts and Figures 2012,
available at: http://www.spu.sarawak.gov.my/download_facts.
html (last access: 23 June 2015), 2012.
Teodoru, C. R., Nyoni, F. C., Borges, A. V., Darchambeau, F.,
Nyambe, I., and Bouillon, S.: Dynamics of greenhouse gases
(CO2, CH4, N2O) along the Zambezi River and major tributaries,
and their importance in the riverine carbon budget, Biogeo-
sciences 12, 2431–2453, doi:10.5194/bg-12-2431-2015, 2014.
www.biogeosciences.net/13/2415/2016/ Biogeosciences, 13, 2415–2428, 2016
2428 D. Müller et al.: Nitrous oxide and methane in two tropical estuaries
Valentine, D. L.: Emerging topics in marine methane biogeochem-
istry, Ann. Rev. Mar. Sci., 3, 147–171, 2011.
Walter, S., Bange, H. W., Breitenbach, U., and Wallace, D. W.
R.: Nitrous oxide in the north atlantic ocean, Biogeosciences, 3,
607–619, 2006.
Wanninkhof, R.: Relationship between wind speed and gas ex-
change over the ocean, J. Geophys. Res., 97, 7373–7382, 1992.
Weiss, R. F. and Price, B. A.: Nitrous oxide solubility in water and
seawater, Mar. Chem., 8, 347–359, 1980.
Wiesenburg, D. A. and Guinasso Jr., N. L.: Equilibrium solubilities
of methane, carbon monoxide, and hydrogen in water and sea-
water, J. Chem. Eng. Data, 24, 356–360, 1979.
Zhang, G. L., Zhang, J., Liu, S. M., Ren, J. L., and Zhao, Y. C.:
Nitrous oxide in the Changjiang (Yangtze River) estuary and its
adjacent marine area: Riverine input, sediment release and atmo-
spheric fluxes, Biogeosciences, 7, 3505–3516, doi:10.5194/bg-7-
3505-2010, 2010.
Zindler, C., Bracher, A., Marandino, C. A., Taylor, B., Torrecilla,
E., Kock, A., and Bange, H. W.: Sulphur compounds, methane
and phytoplankton: Interactions along a north-south transit in
the western Pacific Ocean, Biogeosciences, 10, 3297–3311,
doi:10.5194/bg-10-3297-2013, 2013.
Biogeosciences, 13, 2415–2428, 2016 www.biogeosciences.net/13/2415/2016/


