
FOR IMMEDIATE RELEASE
1
Contacts:
Liz Werner (Investors): 212-770-7074; [email protected]
Fernando Melon (Investors): 212-770-4630; [email protected]
Daniel O’Donnell (Media): 212-770-3141; [email protected]
Claire Talcott (Media): 212-458-6343; [email protected]
AIG REPORTS SECOND QUARTER 2018 RESULTS
NEW YORK, August 2, 2018 - American International Group, Inc. (NYSE: AIG) today
reported net income of $937 million, or $1.02 per diluted share, for the second quarter of 2018,
compared to net income of $1.1 billion, or $1.19 per diluted share, in the prior-year quarter.
Adjusted after-tax income was $961 million, or $1.05 per diluted share, for the second quarter
of 2018, compared to adjusted after-tax income of $1.4 billion, or $1.53 per diluted share, in
the prior-year quarter.
SECOND QUARTER FINANCIAL SUMMARY*
Three Months Ended
June 30,
($ in millions, except per share amounts) 2018 2017
Net income $ 937 $ 1,130
Net income per diluted share $ 1.02 $ 1.19
Adjusted after-tax income $ 961 $ 1,449
Adjusted after-tax income per diluted share $ 1.05 $ 1.53
Return on equity 6.0 % 6.1 %
Adjusted return on equity 7.6 % 10.5 %
Adjusted return on attributed equity - Core 8.2 % 10.5 %
Book value per common share $ 68.65 $ 81.62
Book value per common share, excluding accumulated other comprehensive income 68.40 76.12
Adjusted book value per common share 57.34 60.31 *Refer to the Comments on Regulation G and the tables that follow for a discussion of non-GAAP financial measures and the
reconciliations of the non-GAAP financial measures to GAAP measures.
“We remain diligently focused on pursuing long-term, sustainable and profitable growth across
AIG, and our diversified businesses provide flexibility and strength to execute on our strategy,”
said Brian Duperreault, President and Chief Executive Officer. “In the second quarter, we
continued to take actions across General Insurance to establish a culture of underwriting
excellence and added stellar talent. Our efforts are taking hold and we remain committed to
achieving an underwriting profit as we exit 2018. Solid results in Life & Retirement reflect an
ongoing strategy to leverage our broad product expertise and distribution strengths.”
Mr. Duperreault continued, “With the closing of the Validus acquisition in July, we have
further enhanced our underwriting expertise and expanded our offerings. We also took actions
to efficiently manage our Legacy liabilities with the partial sale of DSA Re, providing a path
Press Release AIG 175 Water Street New York, NY 10038 www.aig.com
FOR IMMEDIATE RELEASE
2
towards a standalone platform for managing run-off business. Moving forward, we will
continue to look for opportunities to grow AIG and create long-term shareholder value.”
SECOND QUARTER 2018 HIGHLIGHTS
General Insurance Results – General Insurance has continued to execute its strategy to
improve core underwriting performance. Second quarter adjusted pre-tax income of $568
million reflected lower net investment income, primarily driven by lower income from
alternative investments. Underwriting results included catastrophe losses that were lower than
expected and slightly favorable prior year loss reserve development. The loss ratio included a
high frequency of severe losses that totaled $293 million (4.5 pts) which is more than double
the long-term average, resulting in a second quarter loss ratio of 65.7, and an accident year loss
ratio, as adjusted, of 65.4. Excluding the increase in severe losses, the second quarter accident
year loss ratio, as adjusted, was in line with full year 2017 results. The second quarter expense
ratio of 35.6 primarily reflected an increase in the North America acquisition ratio due to
changes in Personal Insurance business mix towards lower loss ratio and higher commission
businesses and an increase in general operating expenses related to strategic initiatives.
Life and Retirement Results – Life and Retirement produced solid results, reporting second
quarter adjusted pre-tax income of $962 million. High levels of assets under administration in
Individual Retirement and Group Retirement, due to strong equity market performance, drove
growth in fee income. Growth of assets under management for Institutional Markets reflected
the execution of opportunistic transactions over the last twelve months. Total net investment
income increased due to higher invested assets, partially offset by lower alternative and other
yield enhancement income. Total Individual Retirement net flows improved, excluding Retail
Mutual Funds. Adjusted pre-tax income benefited from net actuarial adjustments of $51
million in Life and Individual Retirement.
Legacy – Second quarter adjusted pre-tax income of $134 million, compared to $431 million in
the prior-year quarter reflected lower net investment income and lower income from fair value
option assets, as well as the sale of the Life Settlement portfolio in 2017. On August 1, 2018
AIG announced the sale of 19.9% of DSA Re, which positions DSA Re to be a platform to
provide solutions for insurance liabilities globally.
Net Investment Income –Second quarter net investment income from our insurance companies,
including the Legacy insurance portfolios, decreased 12% from the prior-year quarter to $3.1
billion. The decline was primarily driven by lower investment returns on alternative
investments, primarily driven by less robust private equity and hedge fund performance
compared to last year, and a decline in income from securities for which the fair value option
was elected as a result of credit spread widening and rising interest rates. Net investment
income from our insurance companies including the Legacy insurance portfolios totaled $6.5
billion for the first six months of 2018, and is on track with our $13 billion full year guidance
previously provided.
Restructuring Charge – In the second quarter, AIG recorded pre-tax non-operating
restructuring costs of $200 million, primarily related to efficiency initiatives.

FOR IMMEDIATE RELEASE
3
Liquidity and Capital – As of June 30, 2018, AIG Parent liquidity stood at approximately $9.3
billion. In the second quarter, AIG Parent received approximately $1.8 billion of distributions
from insurance subsidiaries in the form of cash and fixed maturity securities, including tax
sharing payments.
On July 18, 2018 AIG completed its acquisition of Validus Holdings, Ltd. for approximately
$5.5 billion in cash.
In the second quarter, AIG repurchased 6.5 million common shares for $348 million and
warrants for $2 million. From July 1 through August 2, 2018 AIG repurchased $149 million of
additional common shares and $1 million of additional warrants. As of August 2, 2018,
approximately $1.5 billion remained under the share repurchase authorization.
Book Value per Common Share – As of June 30, 2018, book value per common share was
$68.65 compared to $72.49 at December 31, 2017. Book value per common share excluding
accumulated other comprehensive income and deferred tax assets (Adjusted book value per
common share) increased 2.2% to $57.34 in the second quarter.
GENERAL INSURANCE
Three Months Ended June 30,
($ in millions) 2018 2017 Change
Total General Insurance
Gross premiums written $ 8,653 $ 8,311 4 %
Net premiums written $ 6,977 $ 6,672 5
Underwriting income (loss) $ (89) $ 149 NM
Adjusted pre-tax income $ 568 $ 1,046 (46)
Underwriting ratios:
Loss ratio 65.7 64.0 1.7 pts
Impact on loss ratio:
Catastrophe losses and reinstatement premiums (2.3) (2.8) 0.5
Prior year development 0.8 (1.1) 1.9
Adjustments for ceded premium under reinsurance
contracts and other 1.2 (0.4) 1.6
Accident year loss ratio, as adjusted 65.4 59.7 5.7
Expense ratio 35.6 33.7 1.9
Combined ratio 101.3 97.7 3.6
Accident year combined ratio, as adjusted 101.0 93.4 7.6

FOR IMMEDIATE RELEASE
4
General Insurance - North America
Three Months Ended June 30,
($ in millions) 2018 2017 Change
North America
Net premiums written $ 3,236 $ 3,125 4 %
Commercial Lines 2,321 2,312 -
Personal Insurance 915 813 13
Underwriting income (loss) $ (127) $ (58) (119)
Commercial Lines (91) (159) 43
Personal Insurance (36) 101 NM
Adjusted pre-tax income $ 407 $ 721 (44)
Underwriting ratios:
North America
Loss ratio 73.1 74.9 (1.8) pts
Impact on loss ratio:
Catastrophe losses and reinstatement premiums (3.7) (6.1) 2.4
Prior year development 1.6 (0.7) 2.3
Adjustments for ceded premium under reinsurance
contracts and other 3.0 (1.1) 4.1
Accident year loss ratio, as adjusted 74.0 67.0 7.0
Expense ratio 31.3 27.1 4.2
Combined ratio 104.4 102.0 2.4
Accident year combined ratio, as adjusted 105.3 94.1 11.2
North America Commercial Lines
Loss ratio 78.1 83.9 (5.8) pts
Impact on loss ratio:
Catastrophe losses and reinstatement premiums (4.6) (8.3) 3.7
Prior year development 4.2 (1.5) 5.7
Adjustments for ceded premium under reinsurance
contracts and other 4.5 (1.6) 6.1
Accident year loss ratio, as adjusted 82.2 72.5 9.7
Expense ratio 26.3 23.6 2.7
Combined ratio 104.4 107.5 (3.1)
Accident year combined ratio, as adjusted 108.5 96.1 12.4
North America Personal Insurance
Loss ratio 60.6 50.8 9.8 pts
Impact on loss ratio:
Catastrophe losses and reinstatement premiums (1.4) (0.2) (1.2)
Prior year development (5.0) 1.4 (6.4)
Accident year loss ratio, as adjusted 54.2 52.0 2.2
Expense ratio 43.7 36.4 7.3
Combined ratio 104.3 87.2 17.1
Accident year combined ratio, as adjusted 97.9 88.4 9.5

FOR IMMEDIATE RELEASE
5
All comparisons are against the second quarter of 2017, unless otherwise indicated. Refer to the AIG Second
Quarter 2018 Financial Supplement, which is posted on AIG's website in the Investors section, for further
information.
Adjusted pre-tax income of $407 million included $160 million of severe losses and
$107 million of catastrophe-related losses. Net favorable prior year loss reserve
development of $54 million included $95 million of favorable prior year loss
development from Commercial Lines which included the amortization of the deferred
gain from the adverse development reinsurance coverage with National Indemnity
Company, partially offset by $41 million of unfavorable prior year loss development in
Personal Insurance primarily related to development from 2017 catastrophe losses. Net
investment income decreased by $245 million primarily driven by lower alternative
investment income.
Net premiums written increased by 4%, largely due to lower ceded premiums driven by
changes in the 2018 reinsurance programs and growth in the Travel business in
Personal Insurance. Net premiums earned included a favorable adjustment of $115
million for multi-year policies related to earlier accident years.
The decrease in the North America loss ratio was driven by lower catastrophe losses
and favorable prior year loss reserve development. The accident year loss ratio, as
adjusted, increased 7.0 points, reflecting the impact of higher severe losses (3.4 pts)
and the impact of changes in our reinsurance program. Also, the second quarter of
2017 did not reflect the increased loss estimates which occurred in the second half of
2017.
The increase in the expense ratio reflected a higher acquisition expense ratio driven by
changes in Personal Insurance’s portfolio mix and an increase in general operating
expenses related to strategic initiatives.
General Insurance - International
Three Months Ended June 30,
($ in millions) 2018 2017 Change
International
Net premiums written $ 3,741 $ 3,547 5 %
Commercial Lines 1,590 1,514 5
Personal Insurance 2,151 2,033 6
Underwriting income (loss) $ 38 $ 207 (82)
Commercial Lines (76) 61 NM
Personal Insurance 114 146 (22)
Adjusted pre-tax income $ 161 $ 325 (50)
FOR IMMEDIATE RELEASE
6
Three Months Ended June 30,
($ in millions) 2018 2017 Change
Underwriting ratios:
International
Loss ratio 59.9 55.3 4.6 pts
Impact on loss ratio:
Catastrophe losses and reinstatement premiums (1.2) (0.1) (1.1)
Prior year development 0.2 (1.5) 1.7
Accident year loss ratio, as adjusted 58.9 53.7 5.2
Expense ratio 39.1 39.0 0.1
Combined ratio 99.0 94.3 4.7
Accident year combined ratio, as adjusted 98.0 92.7 5.3
International Commercial Lines
Loss ratio 68.2 61.1 7.1 pts
Impact on loss ratio:
Catastrophe losses and reinstatement premiums (1.6) (0.3) (1.3)
Prior year development 0.5 (2.9) 3.4
Accident year loss ratio, as adjusted 67.1 57.9 9.2
Expense ratio 36.3 35.2 1.1
Combined ratio 104.5 96.3 8.2
Accident year combined ratio, as adjusted 103.4 93.1 10.3
International Personal Insurance
Loss ratio 52.9 50.6 2.3 pts
Impact on loss ratio:
Catastrophe losses and reinstatement premiums (0.8) - (0.8)
Prior year development - (0.3) 0.3
Accident year loss ratio, as adjusted 52.1 50.3 1.8
Expense ratio 41.4 42.1 (0.7)
Combined ratio 94.3 92.7 1.6
Accident year combined ratio, as adjusted 93.5 92.4 1.1
All comparisons are against the second quarter of 2017, unless otherwise indicated. Refer to the AIG Second
Quarter 2018 Financial Supplement, which is posted on AIG's website in the Investors section, for further
information.
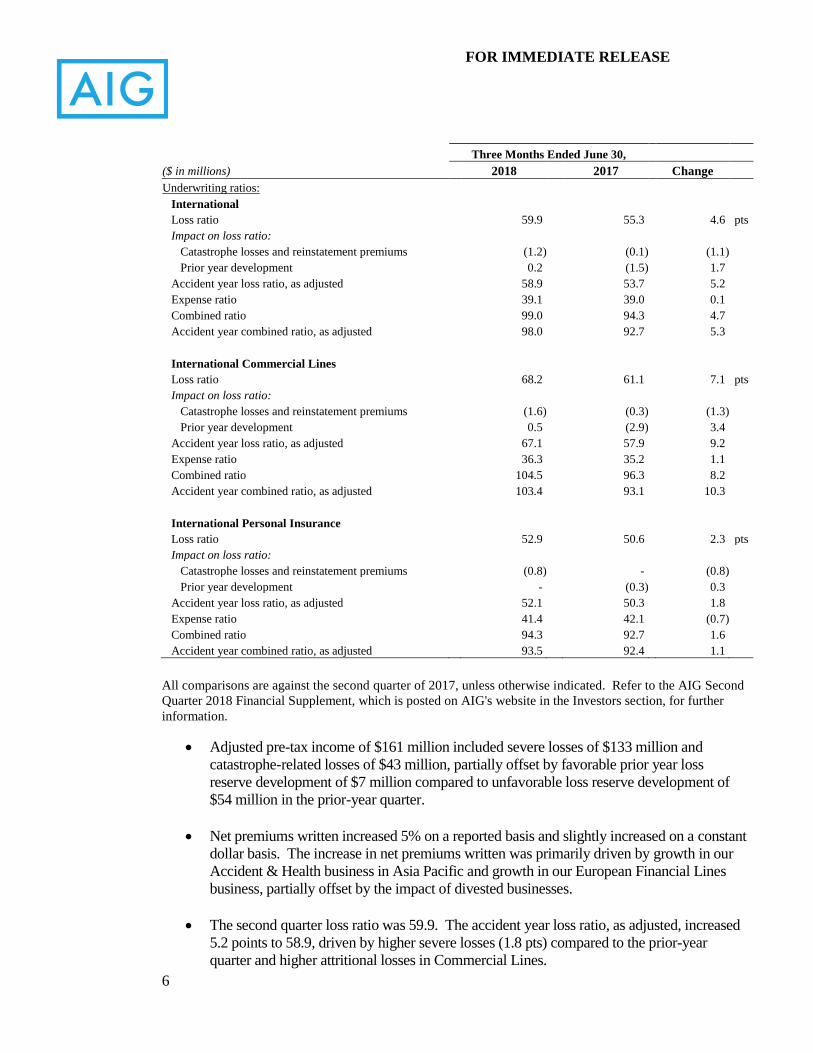
Adjusted pre-tax income of $161 million included severe losses of $133 million and
catastrophe-related losses of $43 million, partially offset by favorable prior year loss
reserve development of $7 million compared to unfavorable loss reserve development of
$54 million in the prior-year quarter.
Net premiums written increased 5% on a reported basis and slightly increased on a constant
dollar basis. The increase in net premiums written was primarily driven by growth in our
Accident & Health business in Asia Pacific and growth in our European Financial Lines
business, partially offset by the impact of divested businesses.
The second quarter loss ratio was 59.9. The accident year loss ratio, as adjusted, increased
5.2 points to 58.9, driven by higher severe losses (1.8 pts) compared to the prior-year
quarter and higher attritional losses in Commercial Lines.

FOR IMMEDIATE RELEASE
7
The expense ratio was relatively flat compared to the prior-year quarter.
LIFE AND RETIREMENT
Three Months Ended June 30,
($ in millions) 2018 2017 Change
Life and Retirement
Premiums & Fees $ 1,221 $ 1,196 2 %
Net Investment Income 1,995 1,944 3
Adjusted Revenue 3,465 3,365 3
Benefits, losses and expenses 2,503 2,372 6
Adjusted pre-tax income 962 993 (3)
Premiums and deposits 7,399 5,791 28
Individual Retirement
Premiums & Fees $ 218 $ 223 (2) %
Net Investment Income 975 1,003 (3)
Adjusted Revenue 1,366 1,383 (1)
Benefits, losses and expenses 904 825 10
Adjusted pre-tax income 462 558 (17)
Premiums and deposits 3,422 2,892 18
Net flows (1,049) (691) (52)
Group Retirement
Premiums & Fees $ 127 $ 105 21 %
Net Investment Income 542 535 1
Adjusted Revenue 730 696 5
Benefits, losses and expenses 480 430 12
Adjusted pre-tax income 250 266 (6)
Premiums and deposits 2,345 1,802 30
Net flows (459) (181) (154)
Life Insurance
Premiums & Fees $ 795 $ 757 5 %
Net Investment Income 282 261 8
Adjusted Revenue 1,092 1,030 6
Benefits, losses and expenses 917 924 (1)
Adjusted pre-tax income 175 106 65
Premiums and deposits 980 947 3
Institutional Markets
Premiums & Fees $ 81 $ 111 (27) %
Net Investment Income 196 145 35
Adjusted Revenue 277 256 8
Benefits, losses and expenses 202 193 5
Adjusted pre-tax income 75 63 19
Premiums and deposits 652 150 335
All comparisons are against the second quarter of 2017, unless otherwise indicated. Refer to the AIG Second
Quarter 2018 Financial Supplement, which is posted on AIG's website in the Investors section, for further
information.

FOR IMMEDIATE RELEASE
8
In Individual Retirement, adjusted pre-tax income reflected unfavorable actuarial
adjustments to Variable Annuities of $47 million compared to favorable adjustments to
immediate annuities in the prior-year quarter. Fee income increased primarily from
growth in assets under management. Net investment income decreased due to lower
alternative and other yield enhancement income. Base portfolio income increased
primarily due to growth in Index Annuities invested assets. Base yields, excluding
accretion and other investment income, declined consistent with expectations, while
related base spreads increased slightly for Variable and Index Annuities and declined
for Fixed Annuities. Overall net flows reflected improvement from the prior-year
quarter in Fixed Annuities and Index Annuities sales, which was more than offset by
increases in Retail Mutual Funds outflows.
In Group Retirement, fee income increased primarily from growth in assets under
administration. Base portfolio income increased primarily due to accretion and other
investment income. Base spreads, excluding accretion and other investment income,
were in line with the prior-year quarter. Group Retirement net flows reflect outflows
due to higher surrenders, partially offset by increased deposits primarily from new
group plan acquisitions.
In Life Insurance, adjusted pre-tax income reflected favorable actuarial adjustments of
$98 million and higher net investment income driven by growth in invested
assets. Mortality was within pricing expectations.
In Institutional Markets, adjusted pre-tax income was driven by continued growth in
the in-force business and higher net investment income.
CONFERENCE CALL
AIG will host a conference call tomorrow, Friday, August 3, 2018 at 8:00 a.m. ET to review these
results. The call is open to the public and can be accessed via a live listen-only webcast in the
Investors section of www.aig.com. A replay will be available after the call at the same location.
# # #
Additional supplementary financial data is available in the Investors section at www.aig.com.
The conference call (including the conference call presentation material), the earnings release and
the financial supplement may include, and officers and representatives of AIG may from time to
time make and discuss, projections, goals, assumptions and statements that may constitute
“forward-looking statements” within the meaning of the Private Securities Litigation Reform Act
of 1995. These projections, goals, assumptions and statements are not historical facts but instead
represent only a belief regarding future events, many of which, by their nature, are inherently
uncertain and outside AIG’s control. These projections, goals, assumptions and statements include

FOR IMMEDIATE RELEASE
9
statements preceded by, followed by or including words such as “will,” “believe,” “anticipate,”
“expect,” “intend,” “plan,” “focused on achieving,” “view,” “target,” “goal” or “estimate.” These
projections, goals, assumptions and statements may relate to future actions, prospective services or
products, future performance or results of current and anticipated services or products, sales efforts,
expenses, the outcome of contingencies such as legal proceedings, anticipated organizational,
business or regulatory changes, anticipated sales, monetization and/or acquisitions of businesses or
assets, or successful integration of acquired businesses, management succession and retention
plans, exposure to risk, trends in operations and financial results.
It is possible that AIG’s actual results and financial condition will differ, possibly materially, from
the results and financial condition indicated in these projections, goals, assumptions and statements.
Factors that could cause AIG’s actual results to differ, possibly materially, from those in the
specific projections, goals, assumptions and statements include:
changes in market and industry conditions;
negative impacts on customers, business partners and other stakeholders;
the occurrence of catastrophic events, both natural and man-made;
AIG’s ability to successfully reorganize its businesses, as well as improve profitability,
without negatively impacting client relationships or its competitive position;
AIG’s ability to successfully dispose of, monetize and/or acquire businesses or assets, or
successfully integrate acquired businesses;
changes in judgments concerning insurance underwriting and insurance liabilities;
changes in judgments concerning potential cost saving opportunities;
the impact of potential information technology, cybersecurity or data security breaches,
including as a result of cyber-attacks or security vulnerabilities;
disruptions in the availability of AIG’s electronic data systems or those of third parties;
AIG’s ability to successfully manage Legacy portfolios;
concentrations in AIG’s investment portfolios;
actions by credit rating agencies;
the requirements, which may change from time to time, of the global regulatory
framework to which AIG is subject, including as a global systemically important insurer;
significant legal, regulatory or governmental proceedings;
changes in judgments concerning the recognition of deferred tax assets; and
such other factors discussed in Part I, Item 2. Management's Discussion and Analysis of
Financial Condition and Results of Operations (MD&A) and Part II, Item 1A. Risk
Factors in AIG’s Quarterly Report on Form 10-Q for the quarterly period ended June 30,
2018 (which will be filed with the SEC), Part I, Item 2. MD&A in AIG’s Quarterly Report
on Form 10-Q for the quarterly period ended March 31, 2018 and Part II, Item 7. MD&A
and Part I, Item 1A. Risk Factors in AIG’s Annual Report on Form 10-K for the year
ended December 31, 2017.
AIG is not under any obligation (and expressly disclaims any obligation) to update or alter any
projections, goals, assumptions or other statements, whether written or oral, that may be made from
time to time, whether as a result of new information, future events or otherwise.

FOR IMMEDIATE RELEASE
10
# # #
COMMENT ON REGULATION G
Throughout this press release, including the financial highlights, AIG presents its financial
condition and results of operations in the way it believes will be most meaningful and
representative of its business results. Some of the measurements AIG uses are “non-GAAP
financial measures” under Securities and Exchange Commission rules and regulations. GAAP is
the acronym for “generally accepted accounting principles” in the United States. The non-GAAP
financial measures AIG presents may not be comparable to similarly-named measures reported by
other companies. The reconciliations of such measures to the most comparable GAAP measures in
accordance with Regulation G are included within the relevant tables or in the Second Quarter
2018 Financial Supplement available in the Investor Information section of AIG’s website,
www.aig.com.
Book Value per Common Share, Excluding Accumulated Other Comprehensive Income
(AOCI) and Book Value per Common Share, Excluding AOCI and Deferred Tax Assets
(DTA) (Adjusted Book Value per Common Share) are used to show the amount of AIG’s net
worth on a per-share basis. AIG believes these measures are useful to investors because they
eliminate items that can fluctuate significantly from period to period, including changes in fair
value of AIG’s available for sale securities portfolio, foreign currency translation adjustments and
U.S. tax attribute deferred tax assets. These measures also eliminate the asymmetrical impact
resulting from changes in fair value of AIG’s available for sale securities portfolio wherein there is
largely no offsetting impact for certain related insurance liabilities. AIG excludes deferred tax
assets representing U.S. tax attributes related to net operating loss carryforwards and foreign tax
credits as they have not yet been utilized. Amounts for interim periods are estimates based on
projections of full-year attribute utilization. As net operating loss carryforwards and foreign tax
credits are utilized, the portion of the DTA utilized is included in these book value per common
share metrics. Book value per common share, excluding AOCI, is derived by dividing Total AIG
Shareholders’ equity, excluding AOCI, by total common shares outstanding. Adjusted Book Value
per Common Share is derived by dividing Total AIG shareholders’ equity, excluding AOCI and
DTA (Adjusted Shareholders’ Equity), by total common shares outstanding.
AIG Return on Equity – Adjusted After-tax Income Excluding AOCI and DTA (Adjusted
Return on Equity) is used to show the rate of return on shareholders’ equity. AIG believes this
measure is useful to investors because it eliminates items that can fluctuate significantly from
period to period, including changes in fair value of AIG’s available for sale securities portfolio,
foreign currency translation adjustments and U.S. tax attribute deferred tax assets. This measure
also eliminates the asymmetrical impact resulting from changes in fair value of AIG’s available for
sale securities portfolio wherein there is largely no offsetting impact for certain related insurance
liabilities. AIG excludes deferred tax assets representing U.S. tax attributes related to net operating
loss carryforwards and foreign tax credits as they have not yet been utilized. Amounts for interim
periods are estimates based on projections of full-year attribute utilization. As net operating loss
carryforwards and foreign tax credits are utilized, the portion of the DTA utilized is included in
Adjusted Return on Equity. Adjusted Return on Equity is derived by dividing actual or annualized
adjusted after-tax income attributable to AIG by average Adjusted Shareholders’ Equity.

FOR IMMEDIATE RELEASE
11
Core Adjusted Attributed Equity is an attribution of total AIG Adjusted Shareholders’ Equity to
these segments based on AIG’s internal capital model, which incorporates the segments’ respective
risk profiles. Adjusted attributed equity represents AIG’s best estimates based on current facts and
circumstances and will change over time.
Core Return on Equity – Adjusted After-tax Income (Adjusted Return on Attributed Equity) is used to show the rate of return on Adjusted Attributed Equity. Adjusted Return on Attributed
Equity is derived by dividing actual or annualized Adjusted After-tax Income by Average Adjusted
Attributed Equity.
Adjusted After-tax Income Attributable to Core is derived by subtracting attributed interest
expense and income tax expense from adjusted pre-tax income. Attributed debt and the related
interest expense is calculated based on AIG’s internal capital model. Tax expense or benefit is
calculated based on an internal attribution methodology that considers among other things the
taxing jurisdiction in which the segments conduct business, as well as the deductibility of expenses
in those jurisdictions.
Adjusted Revenues exclude Net realized capital gains (losses), income from non-operating
litigation settlements (included in Other income for GAAP purposes) and changes in fair value of
securities used to hedge guaranteed living benefits (included in Net investment income for GAAP
purposes). Adjusted revenues is a GAAP measure for AIG’s operating segments.
AIG uses the following operating performance measures because AIG believes they enhance the
understanding of the underlying profitability of continuing operations and trends of AIG’s business
segments. AIG believes they also allow for more meaningful comparisons with AIG’s insurance
competitors. When AIG uses these measures, reconciliations to the most comparable GAAP
measure are provided on a consolidated basis.
FOR IMMEDIATE RELEASE
12
Adjusted Pre-tax Income (APTI) is derived by excluding the items set forth below from income
from continuing operations before income tax. This definition is consistent across AIG’s segments.
These items generally fall into one or more of the following broad categories: legacy matters
having no relevance to AIG’s current businesses or operating performance; adjustments to enhance
transparency to the underlying economics of transactions; and measures that AIG believes to be
common to the industry. APTI is a GAAP measure for AIG’s segments. Excluded items include
the following:
• changes in fair value of securities used to
hedge guaranteed living benefits;
• changes in benefit reserves and deferred
policy acquisition costs (DAC), value of
business acquired (VOBA), and sales
inducement assets (SIA) related to net
realized capital gains and losses;
• loss (gain) on extinguishment of debt;
• all net realized capital gains and losses
except earned income (periodic settlements
and changes in settlement accruals) on
derivative instruments used for non-
qualifying (economic) hedging or for asset
replication. Earned income on such
economic hedges is reclassified from net
realized capital gains and losses to specific
APTI line items based on the economic risk
being hedged (e.g. net investment income
and interest credited to policyholder account
balances);
• income or loss from discontinued
operations;
• pension expense related to a one-time
lump sum payment to former employees;
• income and loss from divested businesses;
• non-operating litigation reserves and
settlements;
• restructuring and other costs related to
initiatives designed to reduce operating
expenses, improve efficiency and simplify
AIG’s organization;
• the portion of favorable or unfavorable
prior year reserve development for which
AIG has ceded the risk under retroactive
reinsurance agreements and related
changes in amortization of the deferred
gain; and
• net loss reserve discount benefit (charge).
Adjusted After-tax Income attributable to AIG (AATI) is derived by excluding the tax effected
APTI adjustments described above and the following tax items from net income attributable to
AIG:
• deferred income tax valuation allowance releases and charges;
• changes in uncertain tax positions and other tax items related to legacy matters having no
relevance to AIG’s current businesses or operating performance; and
• net tax charge related to the enactment of the Tax Cuts and Jobs Act (Tax Act).
See page 15 for the reconciliation of Net income attributable to AIG to Adjusted After-tax Income
Attributable to AIG.
Ratios: AIG, along with most property and casualty insurance companies, uses the loss ratio, the
expense ratio and the combined ratio as measures of underwriting performance. These ratios are
relative measurements that describe, for every $100 of net premiums earned, the amount of losses

FOR IMMEDIATE RELEASE
13
and loss adjustment expenses (which for General Insurance excludes net loss reserve discount), and
the amount of other underwriting expenses that would be incurred. A combined ratio of less than
100 indicates underwriting income and a combined ratio of over 100 indicates an underwriting loss.
AIG’s ratios are calculated using the relevant segment information calculated under GAAP, and
thus may not be comparable to similar ratios calculated for regulatory reporting purposes. The
underwriting environment varies across countries and products, as does the degree of litigation
activity, all of which affect such ratios. In addition, investment returns, local taxes, cost of capital,
regulation, product type and competition can have an effect on pricing and consequently on
profitability as reflected in underwriting income and associated ratios.
Accident year loss and combined ratios, as adjusted: both the accident year loss and
combined ratios, as adjusted, exclude catastrophe losses and related reinstatement premiums,
prior year development, net of premium adjustments, and the impact of reserve discounting.
Natural and man-made catastrophe losses are generally weather or seismic events having a net
impact on AIG in excess of $10 million each and also include certain man-made events, such
as terrorism and civil disorders that meet the $10 million threshold. AIG believes the as
adjusted ratios are meaningful measures of AIG’s underwriting results on an ongoing basis as
they exclude catastrophes and the impact of reserve discounting which are outside of
management’s control. AIG also excludes prior year development to provide transparency
related to current accident year results.
Underwriting ratios are computed as follows:
a) Loss ratio = Loss and loss adjustment expenses incurred ÷ Net premiums earned
(NPE)
b) Acquisition ratio = Total acquisition expenses ÷ NPE
c) General operating expense ratio = General operating expenses ÷ NPE
d) Expense ratio = Acquisition ratio + General operating expense ratio
e) Combined ratio = Loss ratio + Expense ratio
f) Accident year loss ratio, as adjusted (AYLR) = [Loss and loss adjustment expenses
incurred – CATs – PYD] ÷ [NPE +/(-) Reinstatement premiums (RIPs) related to
catastrophes +/(-) RIPs related to prior year catastrophes + (Additional) returned
premium related to PYD on loss sensitive business + Adjustment for ceded premiums
under reinsurance contracts related to prior accident years]
g) Accident year combined ratio = AYLR + Expense ratio
h) Catastrophe losses (CATs) and reinstatement premiums = [Loss and loss adjustment
expenses incurred – (CATs)] ÷ [NPE +/(-) RIPs related to catastrophes] – Loss ratio
i) Prior year development net of (additional) return premium related to PYD on loss
sensitive business = [Loss and loss adjustment expenses incurred – Prior year loss
reserve development unfavorable (favorable) (PYD), net of reinsurance] ÷ [NPE +/(-)
RIPs related to prior year catastrophes + (Additional) returned premium related to
PYD on loss sensitive business] – Loss ratio
Premiums and deposits: includes direct and assumed amounts received and earned on traditional
life insurance policies, group benefit policies and life-contingent payout annuities, as well as
deposits received on universal life, investment-type annuity contracts, Federal Home Loan Bank
(FHLB) funding agreements and mutual funds.
Results from discontinued operations are excluded from all of these measures.

FOR IMMEDIATE RELEASE
14
# # #
American International Group, Inc. (AIG) is a leading global insurance organization. Founded in 1919, today AIG member companies provide a wide range of property casualty insurance, life insurance, retirement products, and other financial services to customers in more than 80 countries and jurisdictions. These diverse offerings include products and services that help businesses and individuals protect their assets, manage risks and provide for retirement security. AIG common stock is listed on the New York Stock Exchange and the Tokyo Stock Exchange. Additional information about AIG can be found at www.aig.com | YouTube: www.youtube.com/aig | Twitter: @AIGinsurance www.twitter.com/AIGinsurance | LinkedIn: www.linkedin.com/company/aig. These references with additional information about AIG have been provided as a convenience, and the information contained on such websites is not incorporated by reference into this press release. AIG is the marketing name for the worldwide property-casualty, life and retirement, and general insurance operations of American International Group, Inc. For additional information, please visit our website at www.aig.com. All products and services are written or provided by subsidiaries or affiliates of American International Group, Inc. Products or services may not be available in all countries, and coverage is subject to actual policy language. Non-insurance products and services may be provided by independent third parties. Certain property-casualty coverages may be provided by a surplus lines insurer. Surplus lines insurers do not generally participate in state guaranty funds, and insureds are therefore not protected by such funds.

15
American International Group, Inc.
Selected Financial Data and Non-GAAP Reconciliation
($ in millions, except per share data)
Reconciliations of Adjusted Pre-tax and After-tax Income (Loss) Three Months Ended June 30,
2018 2017
Pre-tax Tax Effect After-tax Pre-tax Tax Effect After-tax
Pre-tax income/net income, including noncontrolling interests $ 1,252 $ 321 $ 933 $ 1,667 $ 557 $ 1,118
Noncontrolling interest - - 4 - - 12
Pre-tax income/net income attributable to AIG 1,252 321 937 1,667 557 1,130
Adjustments:
Changes in uncertain tax positions and other tax adjustments - (3) 3 - (66) 66
Deferred income tax valuation allowance (releases) charges - (7) 7 - 8 (8)
Changes in fair value of securities used to hedge
guaranteed living benefits 36 8 28 (80) (28) (52)
Changes in benefit reserves and DAC, VOBA and
SIA related to net realized capital gains (losses) (1) - (1) (58) (20) (38)
Unfavorable (favorable) prior year development and related
amortization changes ceded under retroactive reinsurance agreements (32) (7) (25) 251 89 162
(Gain) loss on extinguishment of debt 5 1 4 (4) (2) (2)
Net realized capital (gains) losses* (155) (29) (126) 69 38 31
Noncontrolling interest on net realized capital (gains) losses - - (2) - - -
Income from discontinued operations - - - - - (8)
(Income) loss from divested businesses (25) (5) (20) 60 40 20
Non-operating litigation reserves and settlements 12 2 10 (80) (28) (52)
Net loss reserve discount (benefit) charge (14) (3) (11) 260 90 170
Pension expense related to a one-time lump sum payment
to former employees - - - 1 1 -
Restructuring and other costs 200 43 157 47 17 30
Adjusted pre-tax income/Adjusted after-tax income $ 1,278 $ 321 $ 961 $ 2,133 $ 696 $ 1,449
Six Months Ended June 30,
2018 2017
Pre-tax Tax Effect After-tax Pre-tax Tax Effect After-tax
Pre-tax income/net income, including noncontrolling interests $ 2,479 $ 598 $ 1,881 $ 3,394 $ 1,073 $ 2,324
Noncontrolling interest - - (6) - - (9)
Pre-tax income/net income attributable to AIG 2,479 598 1,875 3,394 1,073 2,315
Adjustments:
Changes in uncertain tax positions and other tax adjustments - 1 (1) - (16) 16
Deferred income tax valuation allowance (releases) charges - (37) 37 - 21 (21)
Changes in fair value of securities used to hedge
guaranteed living benefits 113 24 89 (91) (32) (59)
Changes in benefit reserves and DAC, VOBA and
SIA related to net realized capital gains (losses) 30 6 24 (111) (39) (72)
Unfavorable (favorable) prior year development and related
amortization changes ceded under retroactive reinsurance agreements 2 - 2 265 93 172
(Gain) loss on extinguishment of debt 9 2 7 (5) (2) (3)
Net realized capital (gains) losses* (136) (30) (106) 184 85 99
Noncontrolling interest on net realized capital (gains) losses - - (1) - - 5
(Income) loss from discontinued operations - - 1 - - (8)
(Income) loss from divested businesses (33) (7) (26) 160 34 126
Non-operating litigation reserves and settlements 25 5 20 (86) (30) (56)
Net loss reserve discount (benefit) charge (219) (46) (173) 235 81 154
Pension expense related to a one-time lump sum payment
to former employees - - - 1 1 -
Restructuring and other costs 224 48 176 228 80 148
Adjusted pre-tax income/Adjusted after-tax income $ 2,494 $ 564 $ 1,924 $ 4,174 $ 1,349 $ 2,816
* Includes all net realized capital gains and losses except earned income (periodic settlements and changes in settlement accruals) on derivative instruments used for
non-qualifying (economic) hedging or for asset replication.

16
American International Group, Inc.
Selected Financial Data and Non-GAAP Reconciliation (continued)
($ in millions, except per share data)
Summary of Key Financial Metrics
Three Months Ended June 30, Six Months Ended June 30,
% Inc. % Inc.
2018 2017 (Dec.) 2018 2017 (Dec.)
Earnings per common share:
Basic
Income from continuing operations $ 1.04 $ 1.21 (14.0) % $ 2.07 $ 2.42 (14.5) %
Income from discontinued operations - 0.01 NM - 0.01 NM
Net income attributable to AIG $ 1.04 $ 1.22 (14.8) $ 2.07 $ 2.43 (14.8)
Diluted
Income from continuing operations $ 1.02 $ 1.18 (13.6) $ 2.04 $ 2.36 (13.6)
Income from discontinued operations - 0.01 NM - 0.01 NM
Net income attributable to AIG $ 1.02 $ 1.19 (14.3) $ 2.04 $ 2.37 (13.9)
Adjusted after-tax income attributable to AIG per diluted share $ 1.05 $ 1.53 (31.4) % $ 2.09 $ 2.88 (27.4) %
Weighted average shares outstanding:
Basic 903.2 925.8 905.6 953.1
Diluted 916.6 948.2 920.9 976.6
Return on equity (a) 6.0 % 6.1 % 5.9 % 6.2 %
Adjusted return on equity (b) 7.6 % 10.5 % 7.7 % 10.0 %
As of period end: June 30, 2018 March 31, 2018 June 30, 2017 December 31, 2017
Total AIG shareholders' equity $ 61,186 $ 62,792 $ 73,732 $ 65,171
Accumulated other comprehensive income (AOCI) 230 2,220 4,962 5,465
Total AIG shareholders' equity, excluding AOCI 60,956 60,572 68,770 59,706
Deferred tax assets (c) 9,853 10,214 14,287 10,492
Total adjusted AIG shareholders' equity $ 51,103 $ 50,358 $ 54,483 $ 49,214
As of period end: June 30, 2018 March 31, 2018 % Inc. (Dec.) June 30, 2017 % Inc. (Dec.) December 31, 2017 % Inc. (Dec.)
Book value per common share (d) $ 68.65 $ 69.95 (1.9) % $ 81.62 (15.9) % $ 72.49 (5.3) %
Book value per common share, excluding AOCI (e) $ 68.40 $ 67.48 1.4 $ 76.12 (10.1) $ 66.41 3.0
Adjusted book value per common share (f) $ 57.34 $ 56.10 2.2 $ 60.31 (4.9) $ 54.74 4.7
Total common shares outstanding 891.2 897.7 903.4 899.0
Financial highlights - notes
(a) Computed as Annualized net income (loss) attributable to AIG divided by average AIG shareholders' equity. Equity includes AOCI and DTA.
(b) Computed as Annualized Adjusted after-tax income attributable to AIG divided by Adjusted Shareholders' Equity.
(c) Represents deferred tax assets only related to U.S. net operating loss and foreign tax credit carryforwards on a U.S. GAAP basis and excludes other balance sheet deferred tax
assets and liabilities.
(d) Represents total AIG shareholders' equity divided by Total common shares outstanding.
(e) Represents total AIG shareholders' equity, excluding AOCI, divided by Total common shares outstanding.
(f) Represents Adjusted Shareholders' Equity, divided by Total common shares outstanding.

17
American International Group, Inc.
Selected Financial Data and Non-GAAP Reconciliation
($ in millions, except per share amounts)
Reconciliations of Core Adjusted Return on Equity
Three Months Ended
June 30,
2018 2017
Adjusted pre-tax income $ 1,144 $ 1,702
Interest expense (benefit) on attributed financial debt - (43)
Adjusted pre-tax income including attributed interest expenses 1,144 1,745
Income tax expense 294 561
Adjusted after-tax income 850 1,184
Ending adjusted attributed equity $ 41,836 $ 44,571
Average adjusted attributed equity $ 41,474 $ 44,898
Adjusted return on attributed equity 8.2 % 10.5 %
Net Premiums Written - Change in Constant Dollar
Three Months Ended
General Insurance - International June 30, 2018
Foreign exchange effect on worldwide premiums:
Change in net premiums written
Increase (decrease) in original currency 0.4 %
Foreign exchange effect 5.1
Increase (decrease) as reported in U.S. dollars 5.5 %
Reconciliation of Insurance Company Net Investment Income Three Months Ended Six Months Ended
June 30, June 30,
2018 2017 2018 2017
Net investment income per Consolidated Statement of Operations $ 3,065 $ 3,613 $ 6,326 $ 7,299
Changes in fair value of securities used to hedge guaranteed living benefits 27 (80) 104 (91)
Net realized capital gains related to non-qualifying hedges 28 - 38 -
Total Insurance Company Net investment income $ 3,120 $ 3,533 $ 6,468 $ 7,208

18
American International Group, Inc.
Selected Financial Data and Non-GAAP Reconciliation (continued)
($ in millions, except per share amounts)
Reconciliations of Premiums and Deposits Three Months Ended
June 30,
2018 2017
Individual Retirement:
Premiums $ 16 $ 31
Deposits 3,408 2,862
Other (2) (1)
Total premiums and deposits $ 3,422 $ 2,892
Group Retirement:
Premiums $ 15 $ 4
Deposits 2,330 1,798
Other - -
Total premiums and deposits $ 2,345 $ 1,802
Life Insurance:
Premiums $ 418 $ 400
Deposits 410 381
Other 152 166
Total premiums and deposits $ 980 $ 947
Institutional Markets:
Premiums $ 41 $ 67
Deposits 565 76
Other 46 7
Total premiums and deposits $ 652 $ 150
Total Life and Retirement:
Premiums $ 490 $ 502
Deposits 6,713 5,117
Other 196 172
Total premiums and deposits $ 7,399 $ 5,791


