February 1, 2017
New Year, New Trends: HR Technology Plans for 2017 Sierra-Cedar HR Systems Survey, 19th Annual Edition
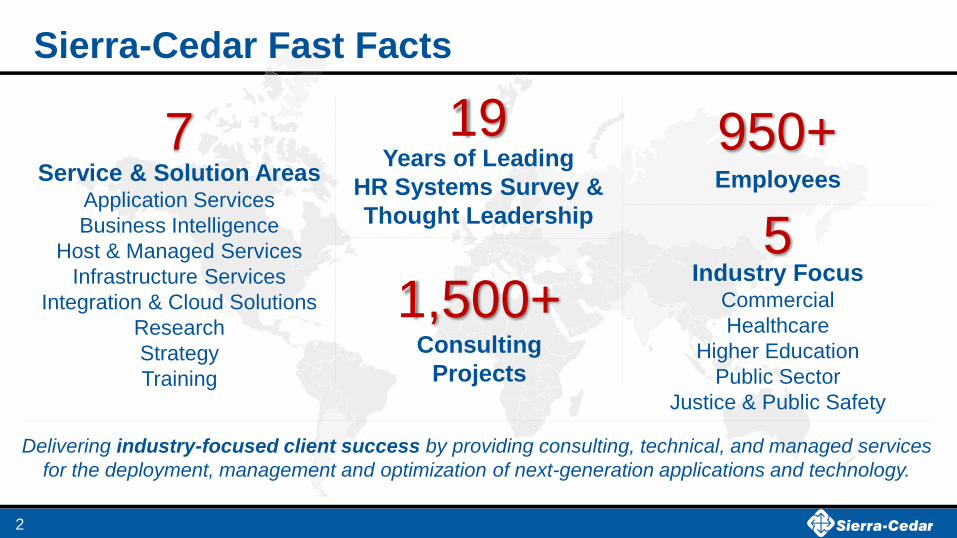
Employees Service & Solution Areas Application Services
Business Intelligence
Host & Managed Services
Infrastructure Services
Integration & Cloud Solutions
Research
Strategy
Training
Delivering industry-focused client success by providing consulting, technical, and managed services
for the deployment, management and optimization of next-generation applications and technology.
Industry Focus Commercial
Healthcare
Higher Education
Public Sector
Justice & Public Safety
Sierra-Cedar Fast Facts
Years of Leading
HR Systems Survey &
Thought Leadership
7 19 950+
5
2
Consulting
Projects
1,500+

Presenters:
3
Background:
● Oversees the HR Systems Survey
● HR and OE Practitioner for over 10 years in
finance, retail, and franchised businesses.
● Director of Research at Bersin & Associates,
Launched the HR research practice
● VP of Research for Brandon Hall Group
● Feel free to connect at:
www.linkedin.com/in/staceyharris
● @StaceyHarrisHR
Background:
● Programs the HR Systems Survey
● Research at Brandon Hall Group
● Learning Administration at ACS
● LMS administration and training at
MRINetwork
● Feel free to connect at:
www.linkedin.com/pub/erin-
spencer/6/734/388
● @Erin_HR
Erin Spencer Research Consultant
Stacey Harris VP Research and Analytics
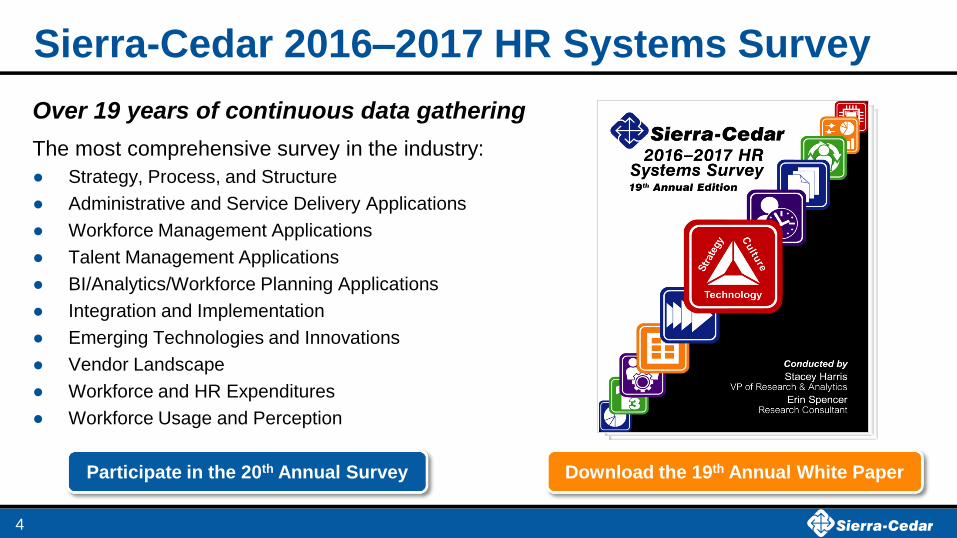
Sierra-Cedar 2016–2017 HR Systems Survey
Over 19 years of continuous data gathering
The most comprehensive survey in the industry:
● Strategy, Process, and Structure
● Administrative and Service Delivery Applications
● Workforce Management Applications
● Talent Management Applications
● BI/Analytics/Workforce Planning Applications
● Integration and Implementation
● Emerging Technologies and Innovations
● Vendor Landscape
● Workforce and HR Expenditures
● Workforce Usage and Perception
Participate in the 20th Annual Survey Download the 19th Annual White Paper
4

Poll One
Have you downloaded and read one of our previous White Papers?
1. Every year!
2. Once in a while
3. Meant to
4. Sad to say no
5
Today’s Agenda
● HR Strategy, Technology and Culture
● Changing Expectations for HR Technology Services
● Next Generation HR Technology Environments
● The Future of HR Tech: Looking Ahead
6
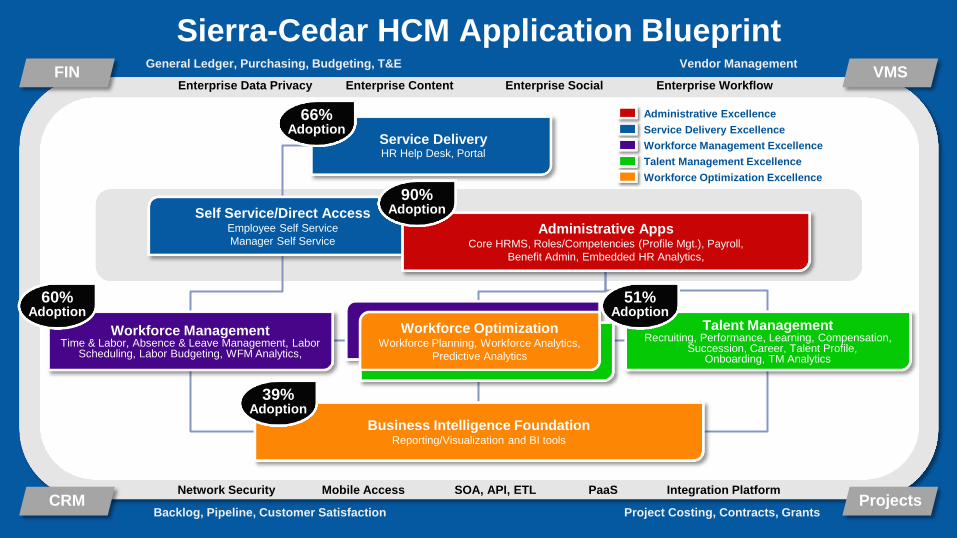
Backlog, Pipeline, Customer Satisfaction
General Ledger, Purchasing, Budgeting, T&E Vendor Management
Project Costing, Contracts, Grants Projects
FIN
CRM
VMS
Talent Management Excellence
Service Delivery Excellence
Administrative Excellence
Workforce Management Excellence
Workforce Optimization Excellence
SOA, API, ETL
Enterprise Content Enterprise Workflow
Network Security
Enterprise Social
Mobile Access Integration Platform
Workforce Optimization Workforce Planning, Workforce Analytics,
Predictive Analytics
Service Delivery HR Help Desk, Portal
Self Service/Direct Access Employee Self Service
Manager Self Service
Workforce Management Time & Labor, Absence & Leave Management, Labor
Scheduling, Labor Budgeting, WFM Analytics,
Talent Management Recruiting, Performance, Learning, Compensation,
Succession, Career, Talent Profile, Onboarding, TM Analytics
Business Intelligence Foundation Reporting/Visualization and BI tools
Administrative Apps Core HRMS, Roles/Competencies (Profile Mgt.), Payroll,
Benefit Admin, Embedded HR Analytics,
Sierra-Cedar HCM Application Blueprint
66% Adoption
90% Adoption
60% Adoption
51% Adoption
39% Adoption
PaaS
Enterprise Data Privacy
8
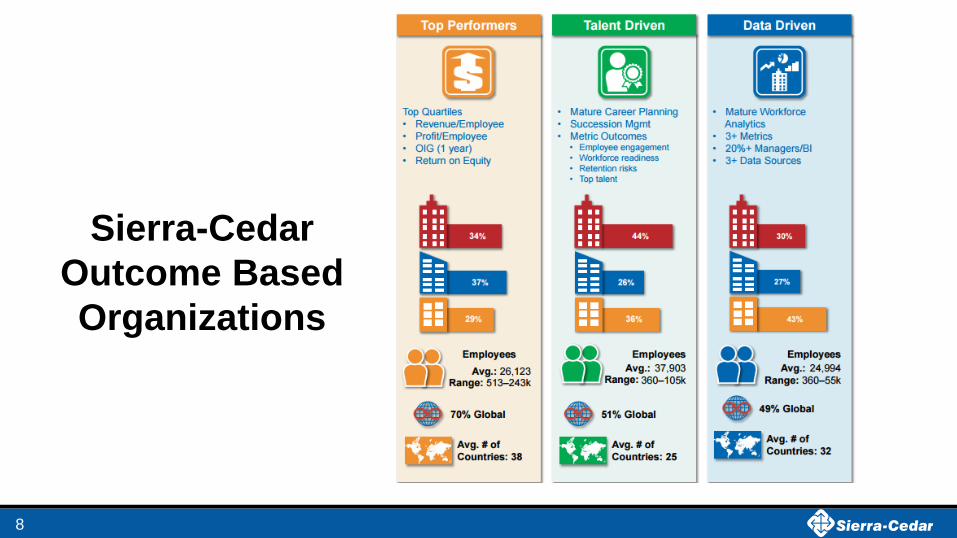
Sierra-Cedar
Outcome Based
Organizations
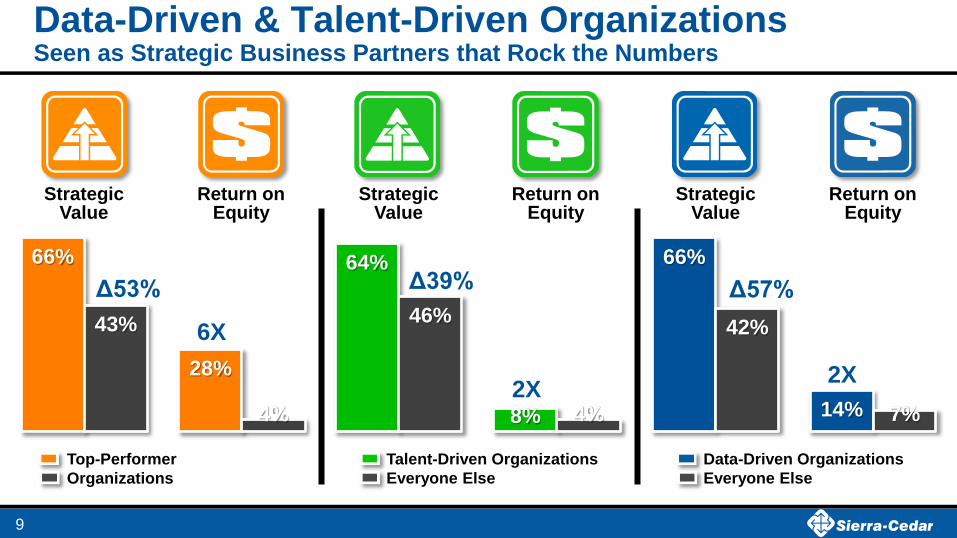
66%
14%
42%
7%
66%
28%
43%
4%
Data-Driven & Talent-Driven Organizations Seen as Strategic Business Partners that Rock the Numbers
9
64%
8%
46%
4%
Strategic Value
Talent-Driven Organizations
Everyone Else
2X
Δ53%
Return on Equity
Data-Driven Organizations
Everyone Else
Top-Performer
Organizations
Δ39% Δ57%
2X
6X
Strategic Value
Return on Equity
Strategic Value
Return on Equity
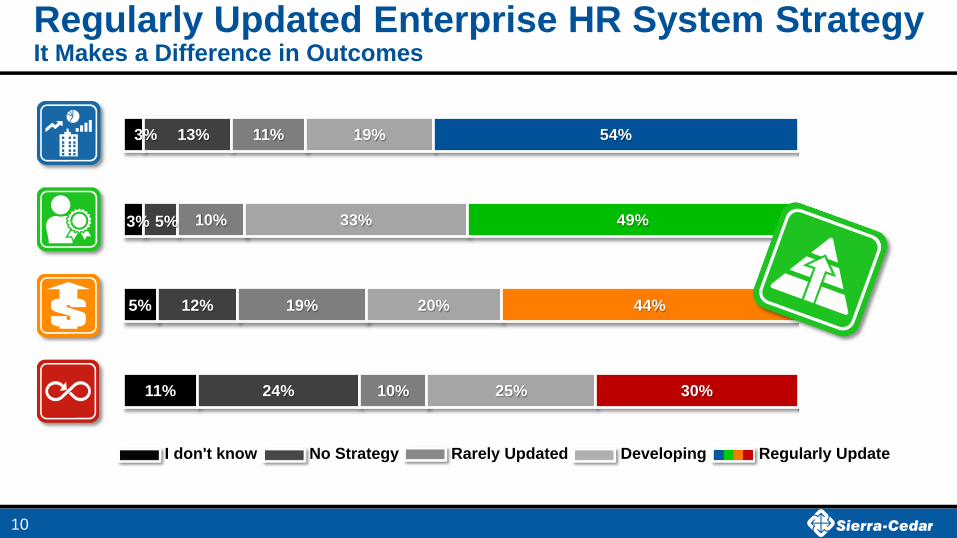
11%
5%
3%
3%
24%
12%
5%
13%
10%
19%
10%
11%
25%
20%
33%
19%
30%
44%
49%
54%
I don't know No Strategy Rarely Updated Developing Regularly Update
Regularly Updated Enterprise HR System Strategy It Makes a Difference in Outcomes
10
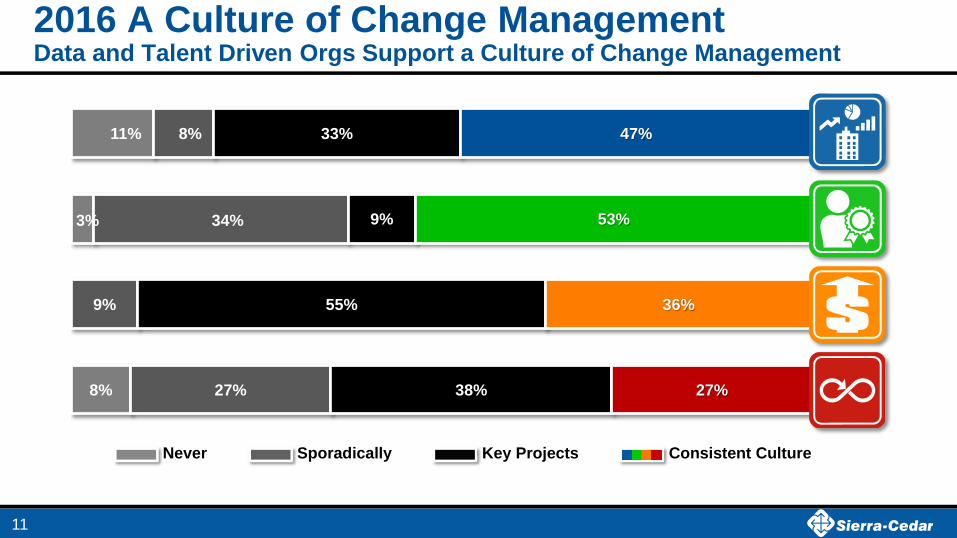
8%
3%
11%
27%
9%
34%
8%
38%
55%
9%
33%
27%
36%
53%
47%
Never Sporadically Key Projects Consistent Culture
2016 A Culture of Change Management Data and Talent Driven Orgs Support a Culture of Change Management
11
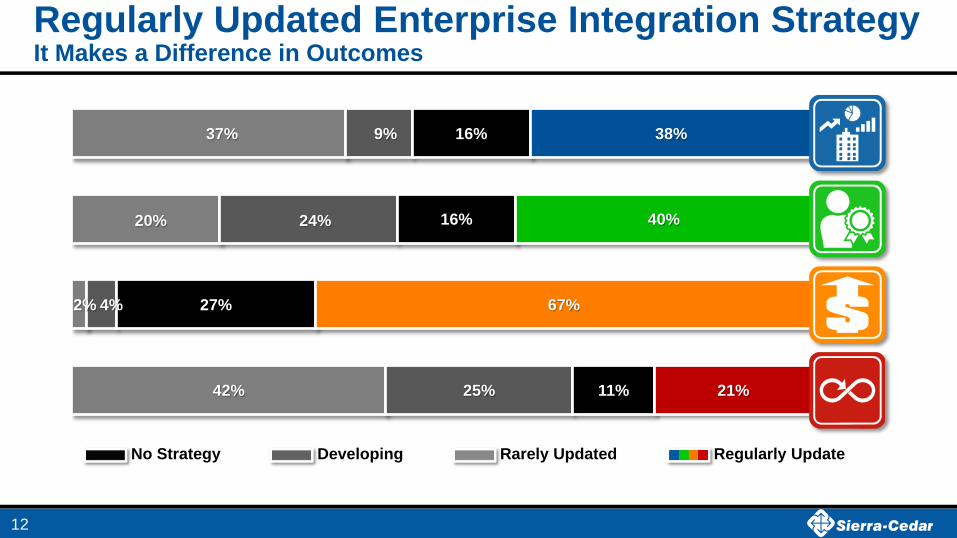
42%
2%
20%
37%
25%
4%
24%
9%
11%
27%
16%
16%
21%
67%
40%
38%
No Strategy Developing Rarely Updated Regularly Update
Regularly Updated Enterprise Integration Strategy It Makes a Difference in Outcomes
12
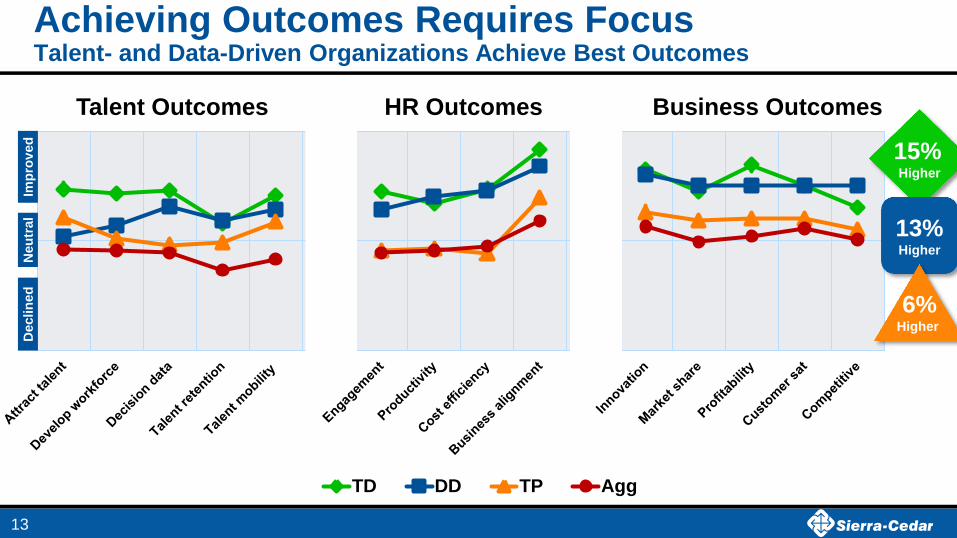
Achieving Outcomes Requires Focus Talent- and Data-Driven Organizations Achieve Best Outcomes
13
TD DD TP Agg
Talent Outcomes HR Outcomes Business Outcomes
Imp
rov
ed
N
eu
tral
Declin
ed
15%
Higher
13%
Higher
6% Higher
Today’s Agenda
● HR Strategy, Technology and Culture
● Changing Expectations for HR Technology Services
● Next Generation HR Technology Environments
● The Future of HR Tech: Looking Ahead
14
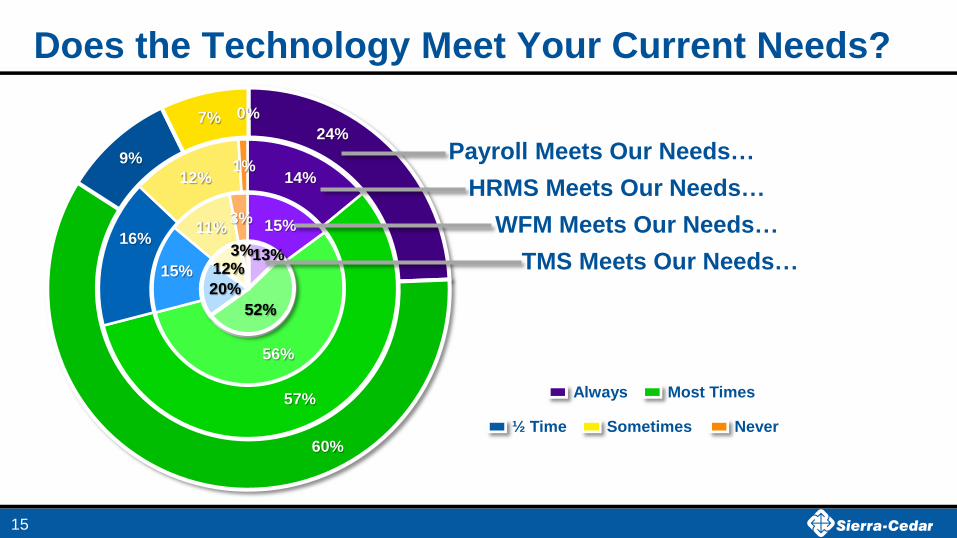
24%
60%
9%
7% 0%
14%
57%
16%
12% 1%
15%
56%
15%
11% 3%
13%
52%
20%
12% 3%
Payroll Meets Our Needs…
HRMS Meets Our Needs…
WFM Meets Our Needs…
TMS Meets Our Needs…
Does the Technology Meet Your Current Needs?
15
Always Most Times
½ Time Sometimes Never
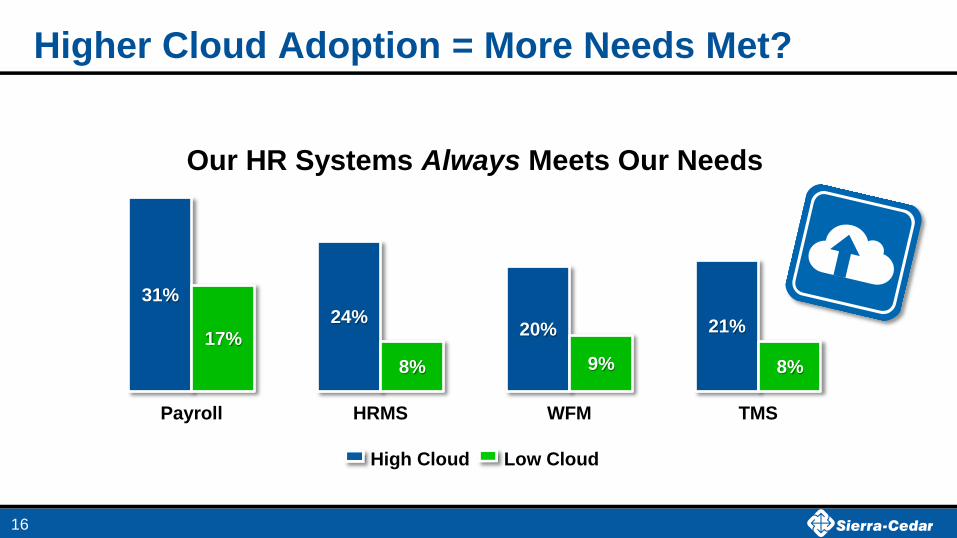
Higher Cloud Adoption = More Needs Met?
16
31% 24%
20% 21% 17%
8% 9% 8%
Payroll HRMS WFM TMS
Our HR Systems Always Meets Our Needs
High Cloud Low Cloud

52%
43%
54%
31%
44%
35%
38%
24%
WFM Licensed
Payroll Licensed
HRMS Licensed
TM Licensed
On Premise Deployments
2016 The Enterprise HR Cloud Conversation Movement to the Cloud is about transforming the User Experience
n = 980
72%
63%
59%
50%
66%
51%
53%
41%
TM Cloud
HRMSCloud
PayrollCloud
WFM Cloud
SaaS/Cloud Deployments
17
3.46 Average User Experience Scores
2.99 Average User Experience Scores
Note these include combination and hosted environments
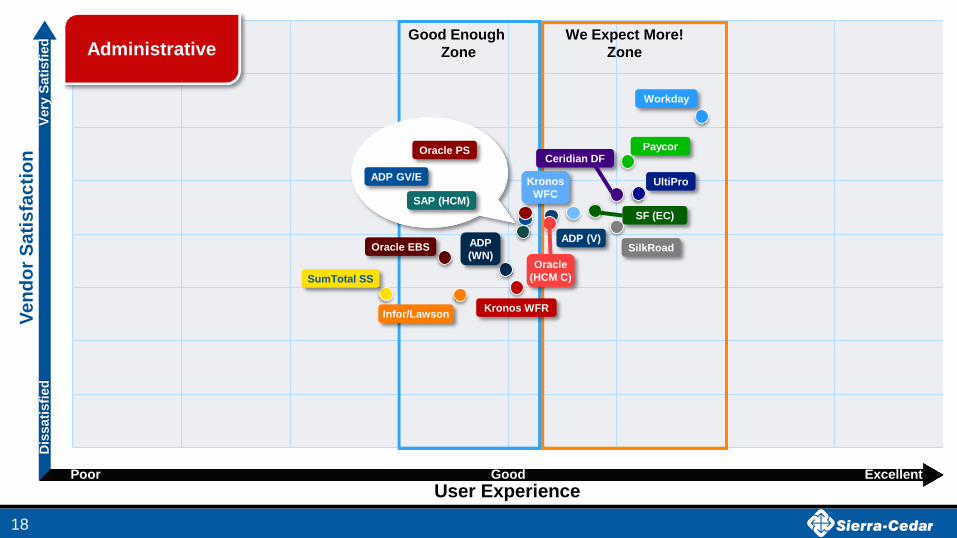
Ve
nd
or
Sa
tis
fac
tio
n
User Experience
Good Enough
Zone
We Expect More!
Zone
18
Workday
Ceridian DF
UltiPro
SF (EC)
Oracle
(HCM C)
SilkRoad
Kronos
WFC
Oracle PS
ADP
(WN)
Infor/Lawson
SAP (HCM)
Oracle EBS ADP (V)
ADP GV/E
Paycor
Kronos WFR
SumTotal SS
Administrative
Good Excellent
Dis
sati
sfi
ed
V
ery
Sati
sfi
ed
Poor

19
EE + Cont.* EE/HR % Global # Countries* # Int. Non-HR
Systems* Vol. Turnover* Time owned*
% Shared Service Center
Imp. in Months*
Aggregate 13,551 122 36% 25 0.88 19% 6.65 69% 8.31
SAP (HCM) 45,371 122 74% 32 1.03 11% 9.85 83% 10.25
SumTotal SS 43,065 123 40% 44 0.67 11% 4.43 100% 8.00
Oracle (PSFT) 30,056 143 42% 36 1.42 19% 10.78 80% 11.63
ADP (GV/E) 25,641 118 75% 26 1.03 18% 7.22 67% 7.40
Kronos WFC 22,580 159 33% 19 1.00 20% 8.12 67% 9.44
Oracle (EBS) 21,853 126 60% 30 1.54 16% 9.08 79% 13.33
SuccessFactors (EC) 21,100 116 68% 15 0.90 13% 3.39 71% 9.13
Oracle (HCM C/Fusion) 20,288 102 53% 48 1.21 19% 4.17 81% 10.00
SilkRoad 13,570 136 27% 13 1.60 27% 4.15 75% n/a
Workday 11,255 96 59% 22 1.05 17% 3.16 76% 8.70
Infor/Lawson 10,955 132 21% 14 0.91 19% 9.54 71% n/a
ADP (Vantage) 5,589 206 39% 11 0.38 16% 4.40 71% 8.67
Ultimate (Ultipro) 5,487 115 34% 7 0.36 17% 5.74 73% 6.45
Ceridian Dayforce 4,149 163 26% 17 0.30 23% 3.39 77% 7.71
Kronos WFR 3,623 112 27% 12 0.25 25% 6.36 57% n/a
ADP (WFN) 2,331 91 37% 14 0.36 18% 5.43 70% 6.33
Paycor 423 103 13% 6 0.42 19% 2.65 33% 4.83
* Average
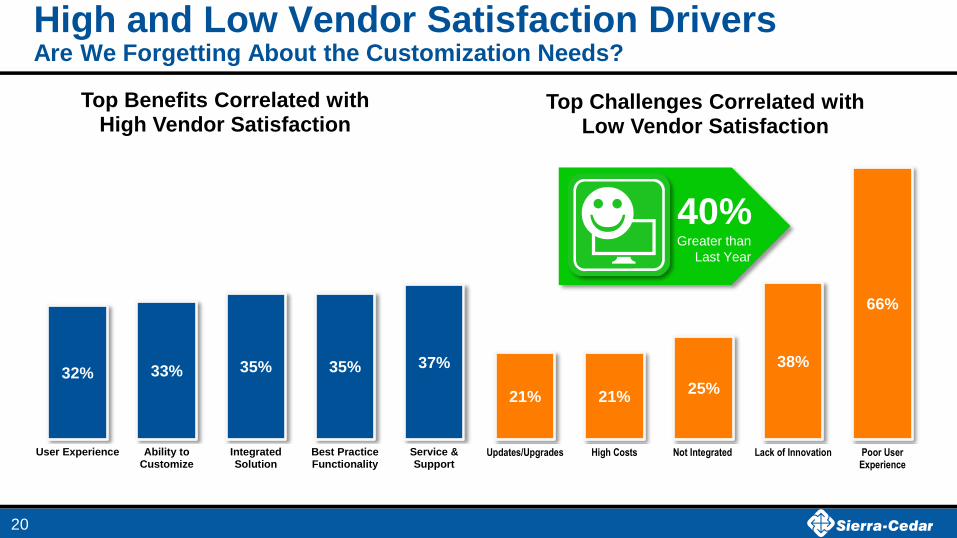
High and Low Vendor Satisfaction Drivers Are We Forgetting About the Customization Needs?
20
32% 33% 35% 35% 37%
User Experience Ability toCustomize
IntegratedSolution
Best PracticeFunctionality
Service &Support
Top Benefits Correlated with High Vendor Satisfaction
21% 21% 25%
38%
66%
Updates/Upgrades High Costs Not Integrated Lack of Innovation Poor UserExperience
Top Challenges Correlated with Low Vendor Satisfaction
40% Greater than
Last Year

10% 7%
10% 7% 6% 5%
7% 8% 4% 3% 5%
14% 15% 12%
16% 16%
21% 23% 23%
29% 33%
37%
Payroll HRManagement
HR Generalist HR BusinessPartner
Benefits WorkforceManagement
HR ITInfrastructure
HR SystemSupport
TalentManagement
HR DataAnalytics
Learning &Development
n = 1,304 Increase Decrease
Tomorrow’s HR is More Focused and Analytical What HR roles does your organization plan to increase or decrease this year?
21
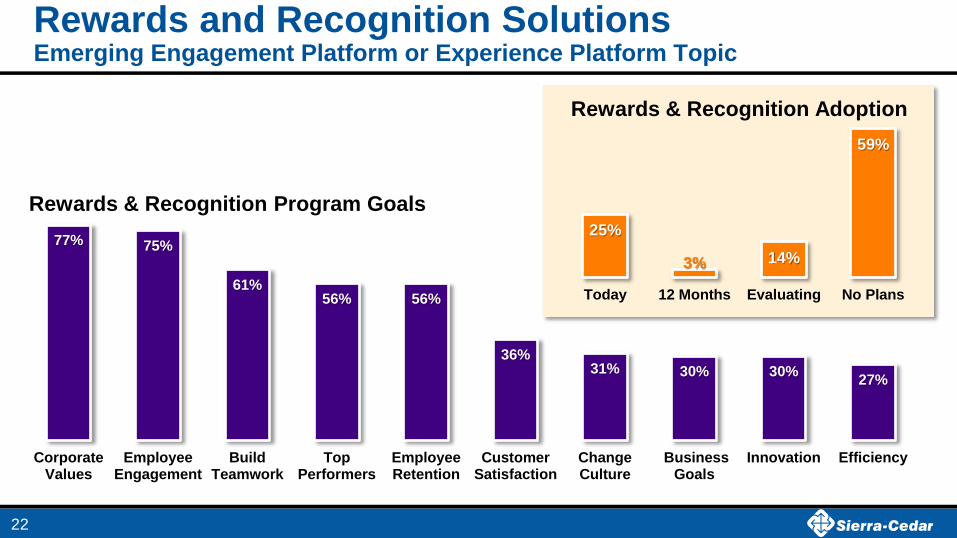
Rewards and Recognition Solutions Emerging Engagement Platform or Experience Platform Topic
22
77% 75%
61% 56% 56%
36% 31% 30% 30%
27%
CorporateValues
EmployeeEngagement
BuildTeamwork
TopPerformers
EmployeeRetention
CustomerSatisfaction
ChangeCulture
BusinessGoals
Innovation Efficiency
Rewards & Recognition Program Goals 25%
3% 14%
59%
Today 12 Months Evaluating No Plans
Rewards & Recognition Adoption
Today’s Agenda
● HR Strategy, Technology and Culture
● Changing Expectations for HR Technology Services
● Next Generation HR Technology Environments
● The Future of HR Tech: Looking Ahead
23
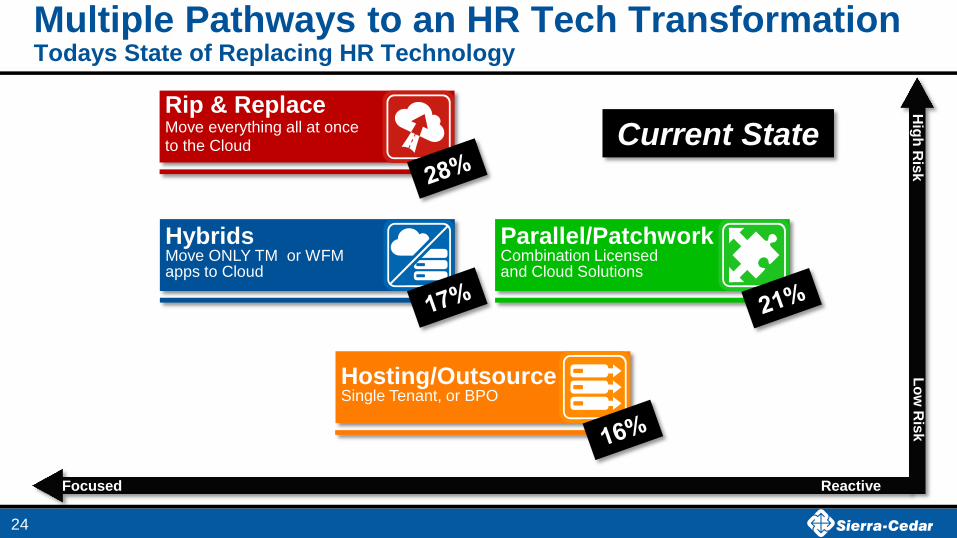
Hybrids Move ONLY TM or WFM apps to Cloud
Rip & Replace Move everything all at once to the Cloud
Parallel/Patchwork Combination Licensed and Cloud Solutions
Hosting/Outsource Single Tenant, or BPO
Multiple Pathways to an HR Tech Transformation Todays State of Replacing HR Technology
24
Reactive Focused
Hig
h R
isk
Lo
w R
isk
Current State
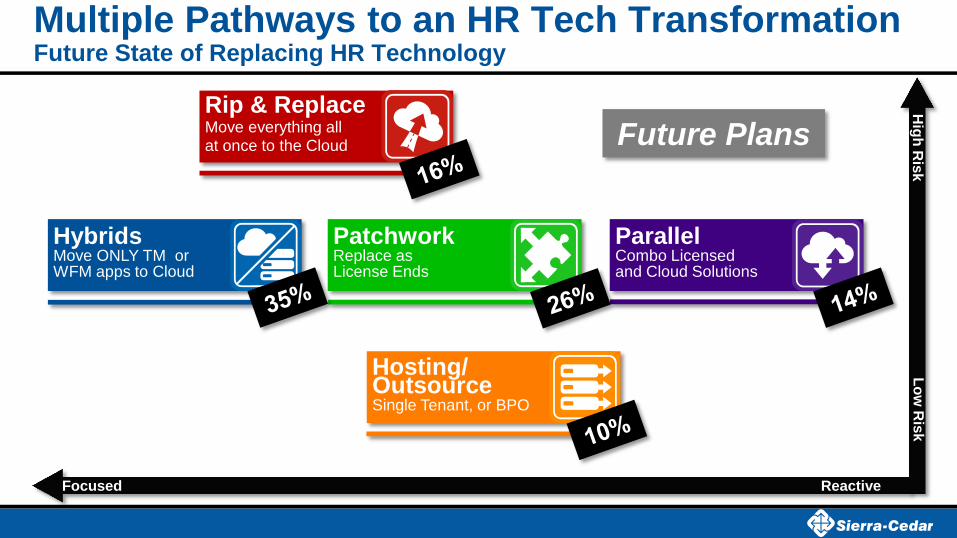
Multiple Pathways to an HR Tech Transformation Future State of Replacing HR Technology
Future Plans
Reactive Focused
Hig
h R
isk
Lo
w R
isk
Hybrids Move ONLY TM or WFM apps to Cloud
Rip & Replace Move everything all at once to the Cloud
Patchwork Replace as License Ends
Hosting/ Outsource Single Tenant, or BPO
Parallel Combo Licensed and Cloud Solutions
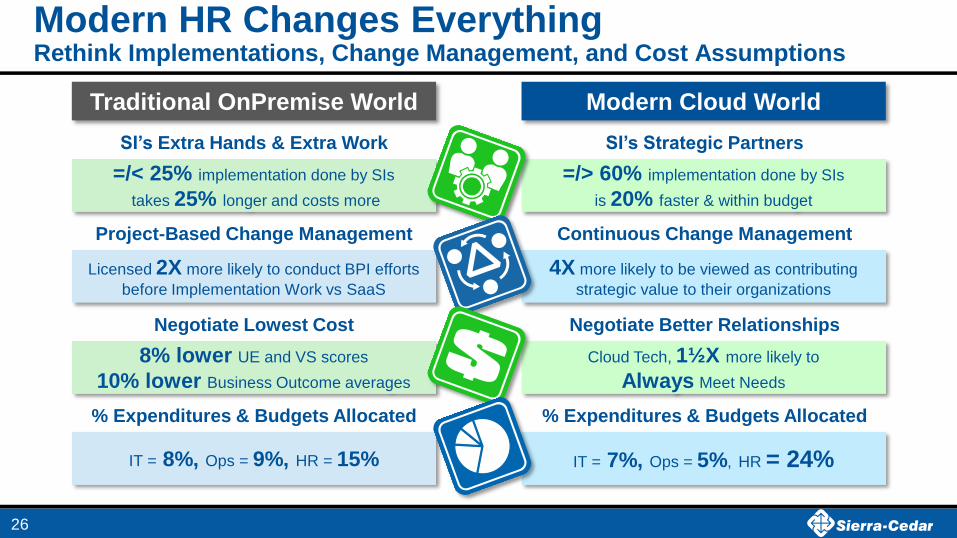
Modern HR Changes Everything Rethink Implementations, Change Management, and Cost Assumptions
26
Traditional OnPremise World Modern Cloud World
=/< 25% implementation done by SIs
takes 25% longer and costs more
=/> 60% implementation done by SIs
is 20% faster & within budget
Licensed 2X more likely to conduct BPI efforts
before Implementation Work vs SaaS
8% lower UE and VS scores
10% lower Business Outcome averages
4X more likely to be viewed as contributing
strategic value to their organizations
SI’s Extra Hands & Extra Work SI’s Strategic Partners
Negotiate Lowest Cost Negotiate Better Relationships
Project-Based Change Management Continuous Change Management
Cloud Tech, 1½X more likely to
Always Meet Needs
IT = 8%, Ops = 9%, HR = 15%
% Expenditures & Budgets Allocated % Expenditures & Budgets Allocated
IT = 7%, Ops = 5%, HR = 24%
Today’s Agenda
● HR Strategy, Technology and Culture
● Changing Expectations for HR Technology Services
● Next Generation HR Technology Environments
● The Future of HR Tech: Looking Ahead
27
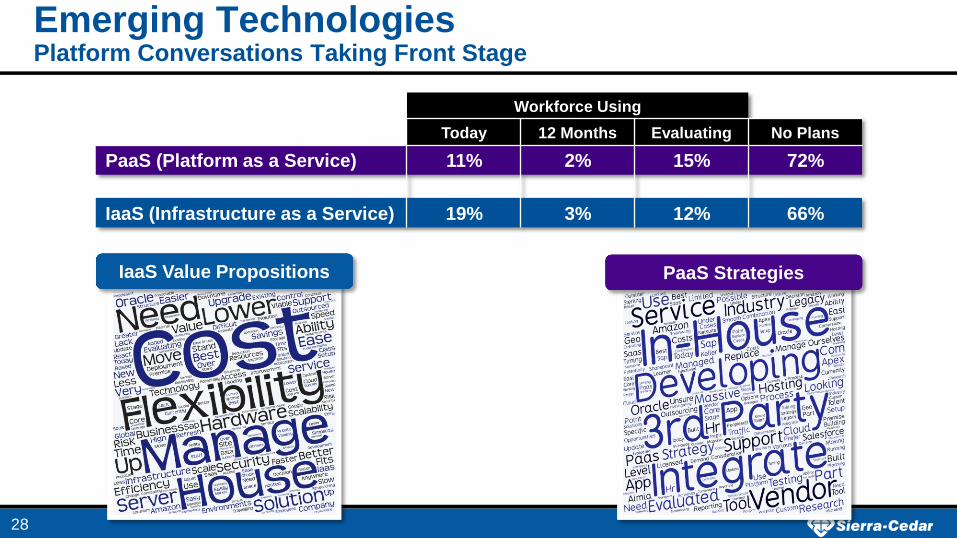
Emerging Technologies Platform Conversations Taking Front Stage
Workforce Using
Today 12 Months Evaluating No Plans
PaaS (Platform as a Service) 11% 2% 15% 72%
IaaS (Infrastructure as a Service) 19% 3% 12% 66%
28
IaaS Value Propositions PaaS Strategies

Clo
ud
Pa
rtn
er
Ma
rke
tpla
ce
s
Traditional
(On-Premise)
Applications (customize,
maintain)
Data
Operating Systems
Security & Integration
Virtualization
Servers
Storage
Networking
Data Centers
Emerging Platform Conversations
Platform as A Service
(PaaS)
Applications (customize)
Data
Operating Systems
Security & Integration
Virtualization
Servers
Storage
Networking
Data Centers
Own Here
Infrastructure as A Service
(IaaS)
Applications (customize,
maintain)
Data
Operating Systems
Security & Integration
Virtualization
Servers
Storage
Networking
Data Centers
Software as A Service
(SaaS)
Applications (Configure)
Data
Operating Systems
Security & Integration
Virtualization
Servers
Storage
Networking
Data Centers
Customer Responsibility Vendor/Third-Party Responsibility
Migrate Here Build Here Consume Here
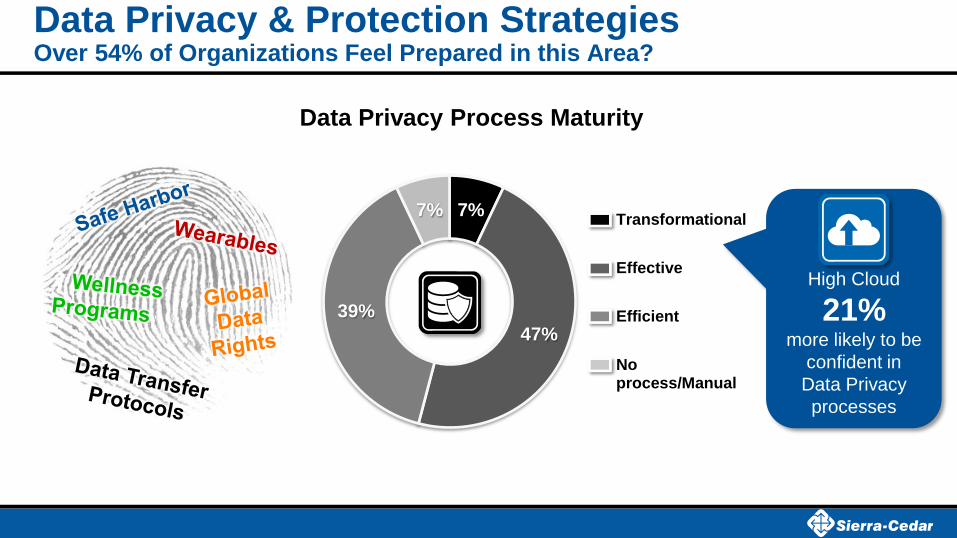
Data Privacy & Protection Strategies Over 54% of Organizations Feel Prepared in this Area?
7%
47%
39%
7%
Data Privacy Process Maturity
Transformational
Effective
Efficient
Noprocess/Manual
High Cloud
21% more likely to be
confident in
Data Privacy
processes

Mobile-enabled HR Process Adoption Overall Mobile Adoption Has Doubled in the Last Three Years
13%
23%
39%
47%
Organizations that Use Mobile-enabled HR Technology
31
2014 2015 2016 12 Months
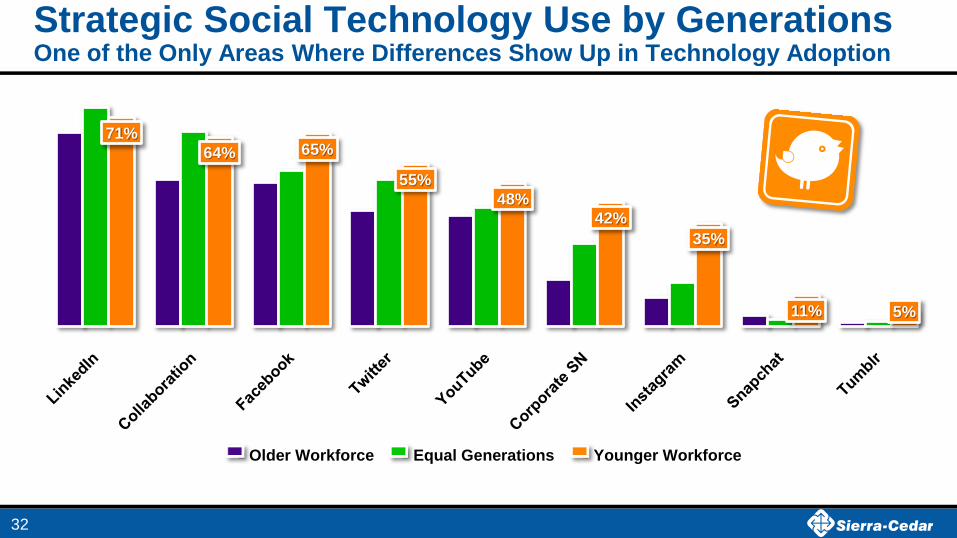
Strategic Social Technology Use by Generations One of the Only Areas Where Differences Show Up in Technology Adoption
71%
64% 65%
55%
48%
42%
35%
11% 5%
Older Workforce Equal Generations Younger Workforce
32
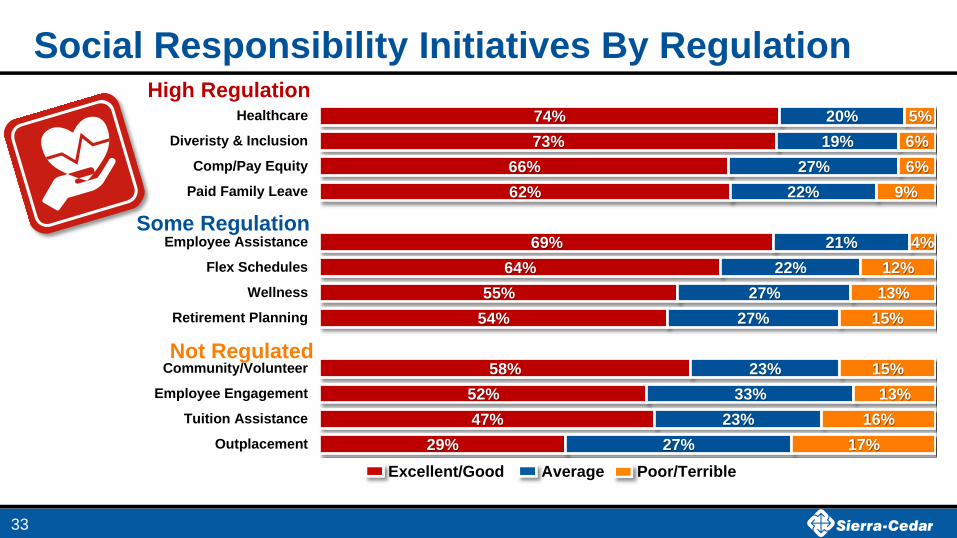
Social Responsibility Initiatives By Regulation
33
29%
47%
52%
58%
54%
55%
64%
69%
62%
66%
73%
74%
27%
23%
33%
23%
27%
27%
22%
21%
22%
27%
19%
20%
17%
16%
13%
15%
15%
13%
12%
4%
9%
6%
6%
5%
Outplacement
Tuition Assistance
Employee Engagement
Community/Volunteer
Retirement Planning
Wellness
Flex Schedules
Employee Assistance
Paid Family Leave
Comp/Pay Equity
Diveristy & Inclusion
Healthcare
Excellent/Good Average Poor/Terrible
High Regulation
Some Regulation
Not Regulated
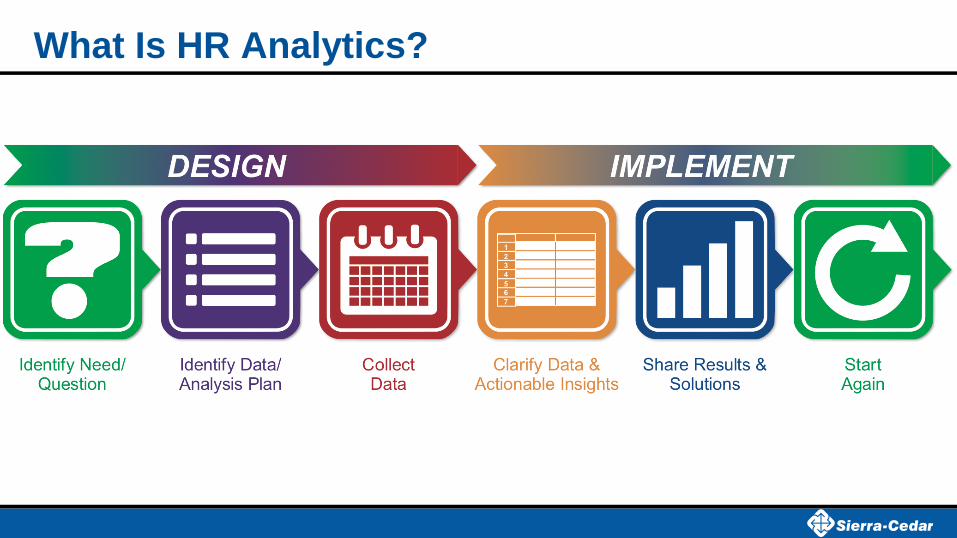
What Is HR Analytics?
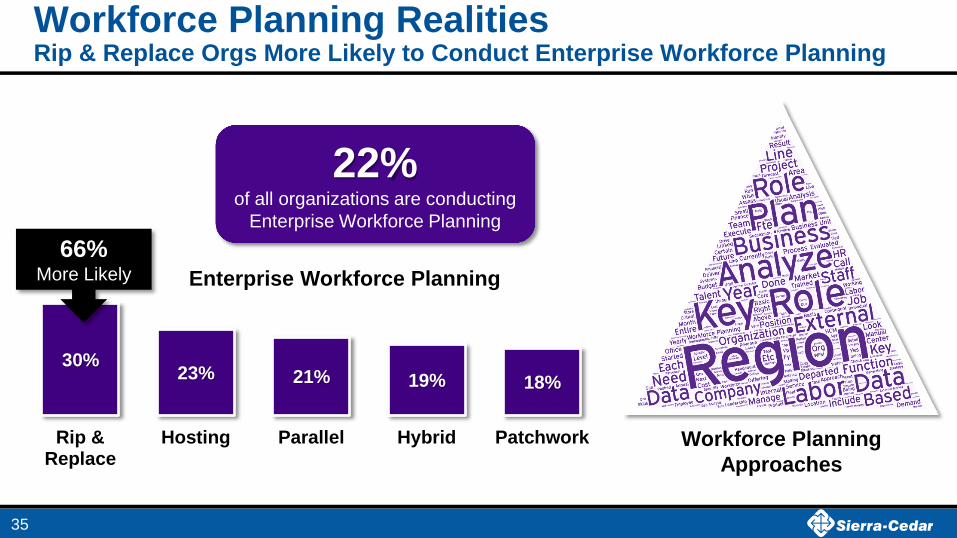
Workforce Planning Realities Rip & Replace Orgs More Likely to Conduct Enterprise Workforce Planning
30% 23% 21% 19% 18%
Rip &Replace
Hosting Parallel Hybrid Patchwork
Enterprise Workforce Planning
35
66% More Likely
22% of all organizations are conducting
Enterprise Workforce Planning
Workforce Planning
Approaches
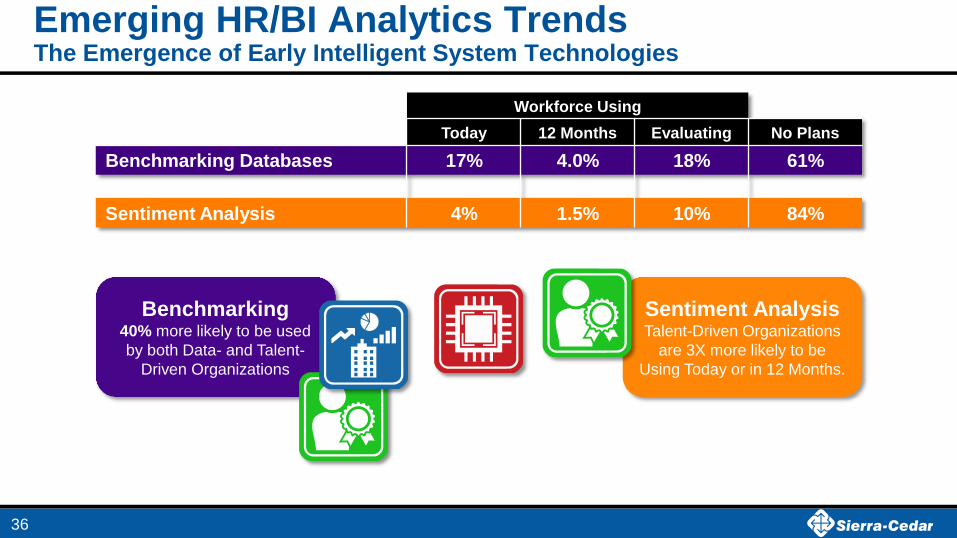
Emerging HR/BI Analytics Trends The Emergence of Early Intelligent System Technologies
Workforce Using
Today 12 Months Evaluating No Plans
Benchmarking Databases 17% 4.0% 18% 61%
Sentiment Analysis 4% 1.5% 10% 84%
36
Benchmarking 40% more likely to be used
by both Data- and Talent-
Driven Organizations
Sentiment Analysis Talent-Driven Organizations
are 3X more likely to be
Using Today or in 12 Months.
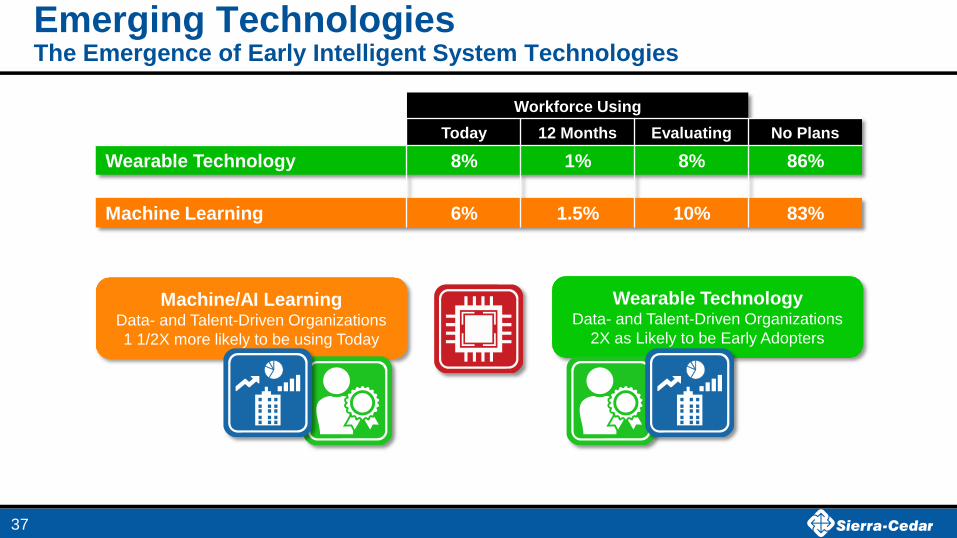
Emerging Technologies The Emergence of Early Intelligent System Technologies
Workforce Using
Today 12 Months Evaluating No Plans
Wearable Technology 8% 1% 8% 86%
Machine Learning 6% 1.5% 10% 83%
37
Wearable Technology Data- and Talent-Driven Organizations
2X as Likely to be Early Adopters
Machine/AI Learning Data- and Talent-Driven Organizations
1 1/2X more likely to be using Today
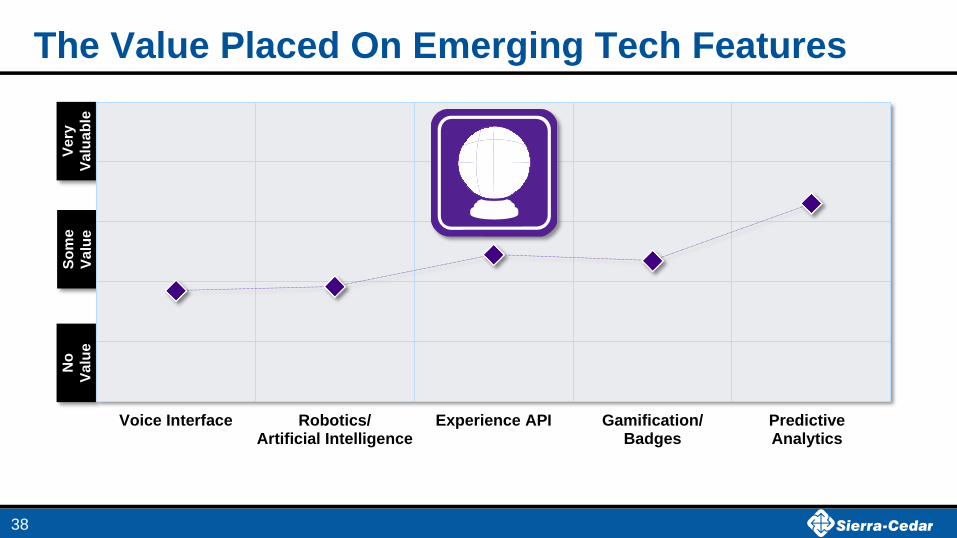
Ve
ry
Va
lua
ble
No
Va
lue
So
me
Va
lue
The Value Placed On Emerging Tech Features
38
Voice Interface Robotics/Artificial Intelligence
Experience API Gamification/Badges
PredictiveAnalytics
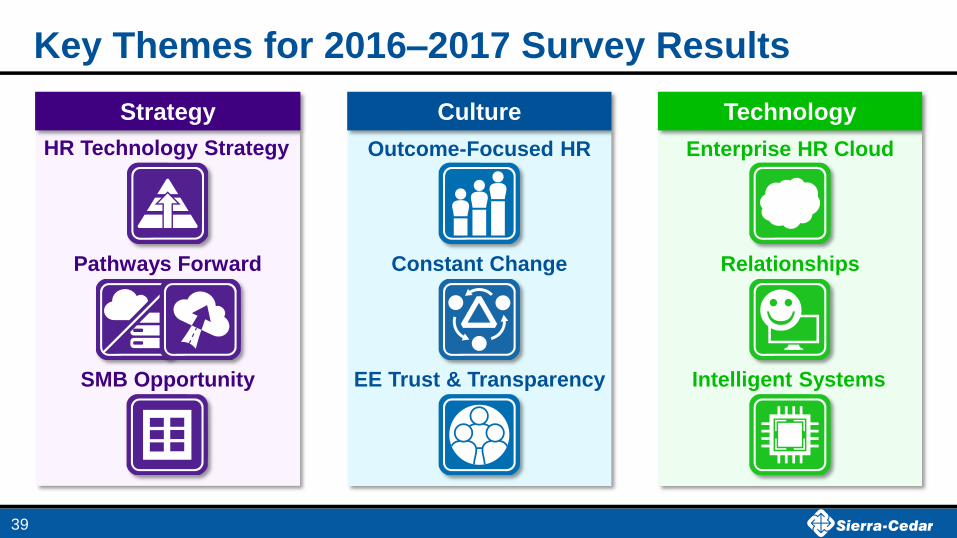
Culture Strategy Technology
Key Themes for 2016–2017 Survey Results
Relationships
HR Technology Strategy
SMB Opportunity
Enterprise HR Cloud
EE Trust & Transparency
Pathways Forward
Intelligent Systems
Outcome-Focused HR
39
Constant Change
Thank you!
40
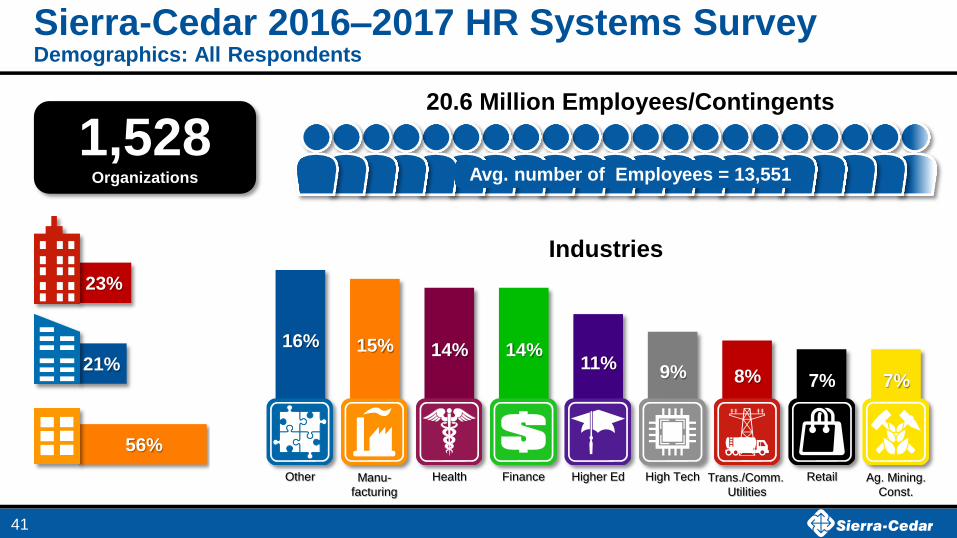
High Tech Health Manu-
facturing
Sierra-Cedar 2016–2017 HR Systems Survey Demographics: All Respondents
41
Trans./Comm.
Utilities
Higher Ed Finance Retail Ag. Mining.
Const.
16% 15% 14% 14% 11%
9% 8% 7% 7%
Other
20.6 Million Employees/Contingents
Avg. number of Employees = 13,551
1,528 Organizations
Industries
56%
21%
23%
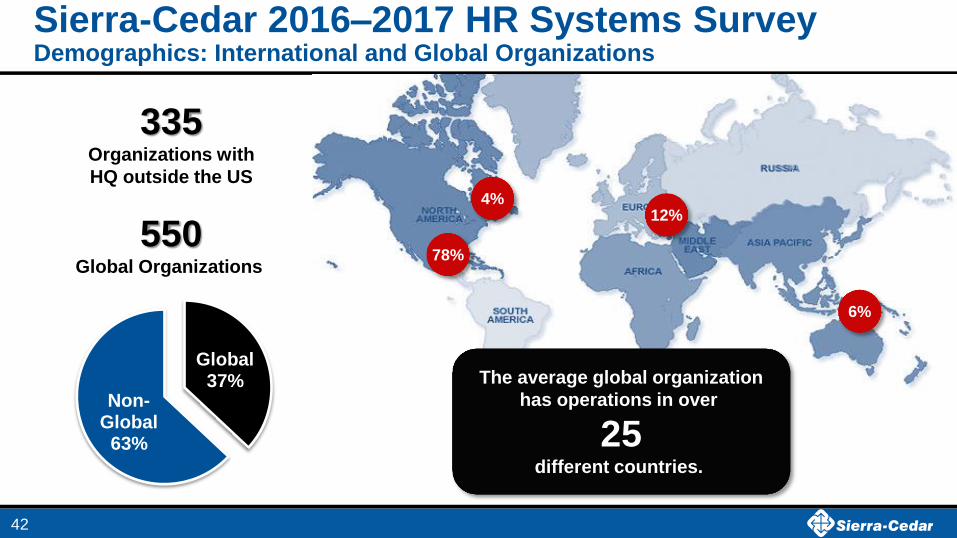
Sierra-Cedar 2016–2017 HR Systems Survey Demographics: International and Global Organizations
78%
4% 12%
6%
Global 37%
Non-Global
63%
The average global organization
has operations in over
25 different countries.
335 Organizations with
HQ outside the US
550 Global Organizations
42
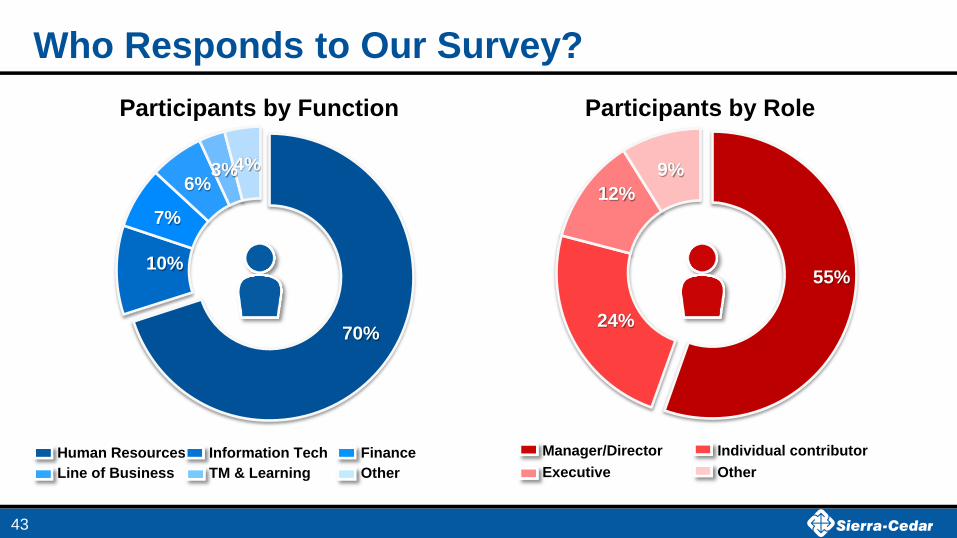
Who Responds to Our Survey?
70%
10%
7%
6% 3% 4%
Participants by Function
Human Resources Information Tech Finance
Line of Business TM & Learning Other
55%
24%
12%
9%
Participants by Role
Manager/Director Individual contributor
Executive Other
43
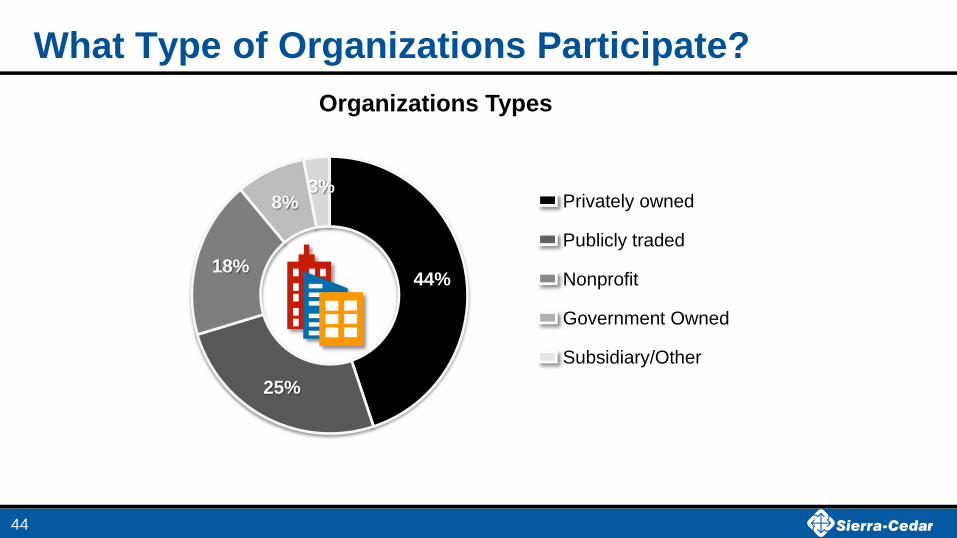
What Type of Organizations Participate?
44
44%
25%
18%
8% 3%
Organizations Types
Privately owned
Publicly traded
Nonprofit
Government Owned
Subsidiary/Other
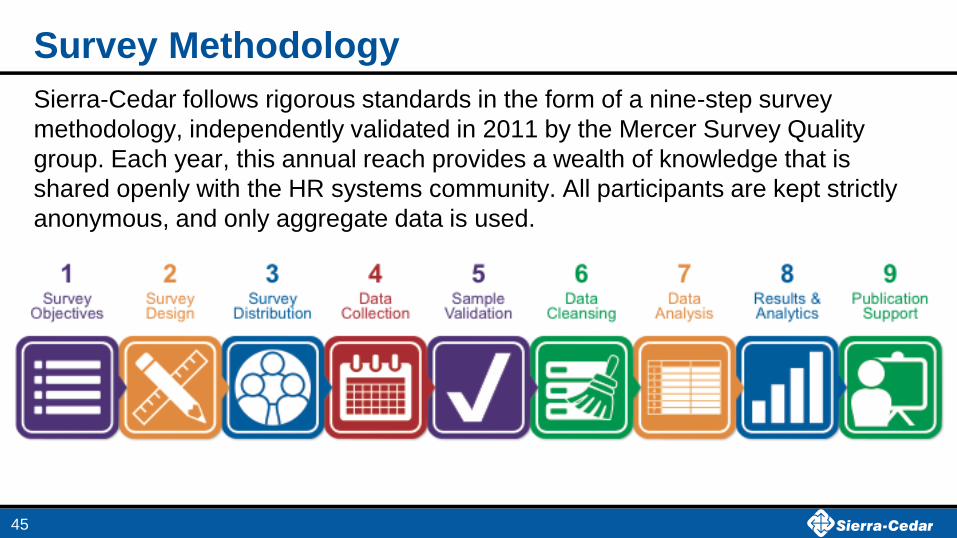
Survey Methodology
Sierra-Cedar follows rigorous standards in the form of a nine-step survey
methodology, independently validated in 2011 by the Mercer Survey Quality
group. Each year, this annual reach provides a wealth of knowledge that is
shared openly with the HR systems community. All participants are kept strictly
anonymous, and only aggregate data is used.
45
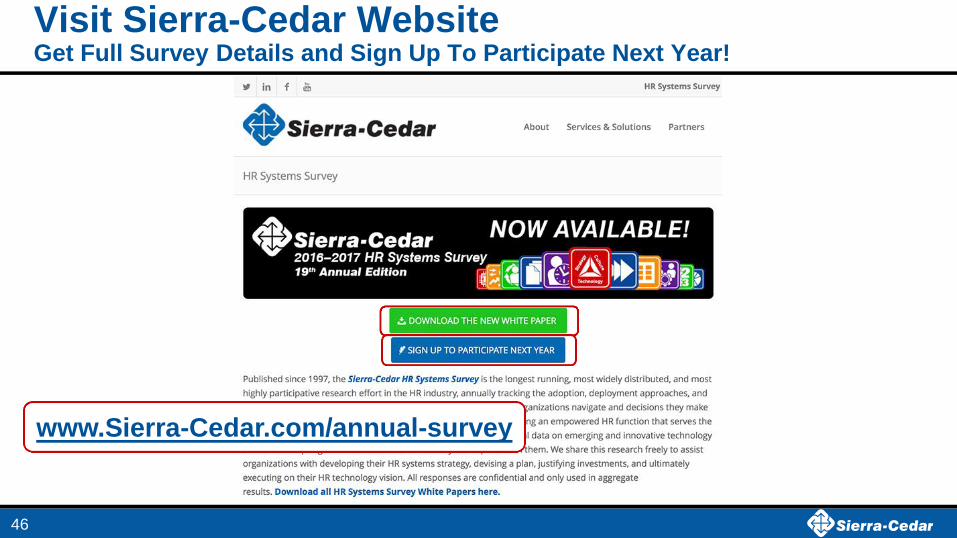
Visit Sierra-Cedar Website Get Full Survey Details and Sign Up To Participate Next Year!
46
www.Sierra-Cedar.com/annual-survey


