
_____________________________________________________________________________________ 2010 Lake Winnipesaukee Tributaries Water Quality Report 1
New Hampshire Volunteer River Assessment Program 2010 Lake Winnipesaukee Tributaries
Water Quality Report
January 2011
_____________________________________________________________________________________ 2010 Lake Winnipesaukee Tributaries Water Quality Report 2
NHDES R-WD-11-1W
New Hampshire Volunteer River Assessment Program 2010 Lake Winnipesaukee Tributaries Water Quality Report
State of New Hampshire Department of Environmental Services
Water Division Watershed Management Bureau
P.O. Box 95 29 Hazen Drive
Concord, New Hampshire 03302-0095 www.des.nh.gov
Thomas S. Burack Commissioner
Harry T. Stewart Water Division Director
Prepared By:
Ted Walsh, VRAP Program Manager
Jen Drociak, VRAP Coordinator
Suzanne Richardson, VRAP Assistant
January 2011
Cover Photo: Paugus Bay, Jacquie Colburn, NHDES

_____________________________________________________________________________________ 2010 Lake Winnipesaukee Tributaries Water Quality Report 1
TABLE OF CONTENTS
1. INTRODUCTION…………………………………………………………………. 1
1.1 Purpose of Report………………………………………………………………… 1
1.2 Report Format……………………………………………………………………. 1
2. PROGRAM OVERVIEW………………………………………………………… 3
2.1 What is VRAP?.................................................................................. 3
2.2 Why is VRAP Important?................................................................... 3
2.3 How Does VRAP Work?..................................................................... 3
2.4 Equipment & Sampling Schedule……………………………………………. 4
2.5 Training & Technical Support………………………………………………… 4
2.6 Data Usage………………………………………………………………………… 4
2.7 Quality Assurance & Quality Control……………………………………….. 5
3. METHODS…………………………………………………………………………. 7
4. RESULTS & RECOMMENDATIONS………………………………………… 9
4.1 Dissolved Oxygen………………………………………………………………… 9
4.2 pH……………………………………………………………………………………. 11
4.3 Turbidity……………………………………………………………………………. 13
4.4 Specific Conductance…………………………………………………………… 15
4.5 Water Temperature……………………………………………………………… 17

_____________________________________________________________________________________ 2010 Lake Winnipesaukee Tributaries Water Quality Report 2
List of Figures and Tables
Figure 1: Dissolved Oxygen Concentration Statistics……………………. 10
Figure 2: pH Statistics…………………………………………………………… 12
Figure 3: Turbidity Statistics…………………………………………………... 14
Figure 4: Specific Conductance Statistics………………………………….. 16
Figure 5: Water Temperature Statistics……………………………………… 18
Table 1: Field Analytical Quality Controls…………………………………. 6
Table 2: Sampling and Analysis Methods…………………………………. 8
Table 3: Sampling Stations for Lake Winni Tributaries, 2010………… 8
Table 4: Dissolved Oxygen Concentration Data Summary…………….. 9
Table 5: pH Data Summary…………………………………………………… 11
Table 6: Turbidity Data Summary…………………………………………… 13
Table 7: Specific Conductance Data Summary…………………………… 15
Table 8: Water Temperature Data Summary……………………………… 17
List of Appendices
Appendix A: 2010 Lake Winnipesaukee Tributaries Water Quality Data
Appendix B: Interpreting Water Quality Parameters
Appendix C: VRAP Volunteer Monitor Field Sampling Procedures Assessment (Field Audit)
_____________________________________________________________________________________ 2010 Lake Winnipesaukee Tributaries Water Quality Report 3
ACKNOWLEDGEMENTS The New Hampshire Department of Environmental Services Volunteer River Assessment Program extends sincere thanks to the volunteers of the Lake Winnipesaukee Watershed Association, Laconia Conservation Commission, and the Wolfeboro Conservation Commission for their efforts during 2010. This report was created solely from the data collected by the volunteers listed below. Their time and dedication is an expression of their genuine concern for local water resources and has significantly contributed to our knowledge of river and stream water quality in New Hampshire.
2010 Lake Winnipesaukee Tributaries Volunteers
Dean Anson
Patty Calvin
Dan Coons
Doug Driscoll
Mike Hodder
Patricia Tarpey
Daniel Tousignault

_____________________________________________________________________________________ 2010 Lake Winnipesaukee Tributaries Water Quality Report 1
1.0 INTRODUCTION 1.1. Purpose of Report Each year the New Hampshire Volunteer River Assessment Program prepares and distributes a water quality report for each volunteer river monitoring group that is based solely on the water quality data collected by that group during a specific year. The reports summarize and interpret the data, particularly as they relate to New Hampshire’s surface water quality standards, and serve as a teaching tool and guidance document for future monitoring activities by the individual volunteer groups.
1.2. Report Format
Each report includes the following:
Volunteer River Assessment Program Overview
This section includes a description of the history of VRAP, the technical support, training and guidance provided by NHDES, and how data is transmitted to the volunteers and used in surface water quality assessments. Monitoring Program Description
This section provides a description of the volunteer group’s monitoring program including monitoring objectives as well as a table and map showing sample station locations. Results and Recommendations
Water quality data collected during the year are summarized on a parameter-by-parameter basis using; (1) a data summary table which includes the number of samples collected, data ranges, the number of samples meeting New Hampshire water quality standards, and the number of samples adequate for water quality assessments at each station; (2) a discussion of the data; (3) a river graph showing the range of measured values at each station; and (4) a list of applicable recommendations. Sample results reported as less than the detection limit were assumed equal to one-half the detection limit on the river graphs. This approach simplifies the understanding of the parameter of interest, and specifically helps one to visualize how the river or watershed is functioning from upstream to downstream. In addition, this format allows the reader to better understand potential pollution areas and target those areas for additional sampling or environmental enhancements. Where applicable, the river graph also shows New Hampshire surface water quality standards or levels of concern for comparison purposes.
_____________________________________________________________________________________ 2010 Lake Winnipesaukee Tributaries Water Quality Report 2
Appendix A – Water Quality Data
This appendix includes a spreadsheet detailing the data results and additional information such as data results which do not meet New Hampshire surface water quality standards, and data that is unusable for assessment purposes due to quality control requirements.
Appendix B – Interpreting VRAP Water Quality Parameters
This appendix provides a brief description of water quality parameters typically sampled by VRAP volunteers, as well as applicable state water quality criteria or levels of concern. Appendix C – VRAP Volunteer Monitor Field Sampling Procedures Assessment (Field Audits)
This appendix provides an overview of the VRAP Volunteer Monitor Field Sampling Procedures Assessment (field audit) process with respect to programmatic quality assurance/quality control (QA/QC) guidelines.

_____________________________________________________________________________________ 2010 Lake Winnipesaukee Tributaries Water Quality Report 3
2.0 PROGRAM OVERVIEW 2.1 What is VRAP? In 1998, the New Hampshire Volunteer River Assessment Program was established to promote awareness and education of the importance of maintaining water quality in New Hampshire’s rivers and streams. VRAP aims to educate people about river and stream water quality and ecology and to improve water quality monitoring coverage for the protection of water resources. Today, VRAP loans water quality monitoring equipment, provides technical support, and facilitates educational programs to volunteer groups on numerous rivers and watersheds throughout the state. VRAP volunteers conduct water quality monitoring on an ongoing basis and increase the amount of river water quality information available to local, state and federal governments, which allows for better watershed planning.
2.2 Why is VRAP Important?
VRAP establishes a regular volunteer-driven water sampling program to assist NHDES in evaluating water quality throughout the state. VRAP empowers volunteers with information about the health of New Hampshire’s rivers and streams. Regular collection of water quality data allows for early detection of water quality changes allowing NHDES to trace potential problems to their source. Data collected by VRAP volunteers are directly contributing to New Hampshire’s obligations under the Clean Water Act. Measurements taken by volunteers are used in assessing the water quality of New Hampshire’s river and streams, and are included in reporting to the US Environmental Protection Agency.
2.3 How Does VRAP Work?
VRAP is a cooperative program between NHDES, river groups, local advisory committees, watershed associations, and individuals working to protect New Hampshire’s rivers and streams. Volunteers are trained by VRAP staff in the use of water quality monitoring equipment at an annual training workshop. VRAP works with each group to establish monitoring stations and develop a sampling plan.
During the summer months, VRAP receives water quality data from trained volunteers. The data are reviewed for quality assurance, and are entered into the environmental monitoring database at NHDES. During the off-season, VRAP interprets the data and compiles the results into an annual report for each river. VRAP volunteers can use the data as a means of understanding the details of water quality, as well as guide future sampling efforts. NHDES can use the data for making surface water quality assessments, provided that the data met certain quality assurance/quality control guidelines.

_____________________________________________________________________________________ 2010 Lake Winnipesaukee Tributaries Water Quality Report 4
2.4 Equipment and Sampling Schedule
VRAP frequently lends and maintains water quality monitoring equipment kits to VRAP groups throughout the state. The kits contain meters and supplies for routine water quality parameter measurements of turbidity, pH, dissolved oxygen, water temperature and specific conductance (conductivity). Other parameters such as nutrients, metals, and E. coli can also be studied, although VRAP does not always provide funds to cover laboratory analysis costs. Thus, VRAP encourages groups to pursue other fundraising activities such as association membership fees, special events, in-kind services (non-monetary contributions from individuals and organizations), and grant writing.
Each year, volunteers design and arrange a sampling schedule in cooperation with VRAP staff. Project designs are created through a review and discussion of existing water quality information, such as known and perceived problem areas or locations of exceptional water quality. The interests, priorities, and resources of the partnership determine monitoring locations, parameters, and frequency. VRAP typically recommends sampling every other week from May through September, and VRAP groups are encouraged to organize a long-term sampling program in order to begin to determine trends in river conditions.
2.5 Training and Technical Support
Each VRAP volunteer attends an annual training workshop to receive a demonstration of monitoring protocols and sampling techniques and the calibration and use of water quality monitoring equipment. During the training, volunteers have an opportunity for hands-on use of the equipment and receive instruction in the collection of samples for laboratory analysis.
VRAP groups conduct sampling according to a prearranged monitoring schedule and VRAP protocols. VRAP staff aim to visit each group annually during a scheduled sampling event to verify that volunteers successfully follow the VRAP protocols (see Appendix C). If necessary, volunteers are re-trained during the visit, and the group’s monitoring coordinator is notified of the result of the verification visit. VRAP groups forward water quality results to NHDES for incorporation into an annual report and state water quality assessment activities.
2.6 Data Usage Annual Water Quality Reports
Water quality measurements repeated over time create a picture of the fluctuating conditions in rivers and streams and help to determine where improvements, restoration or preservation may benefit the river and the communities it supports. All data collected by volunteers are summarized in water quality reports that are prepared and distributed after the conclusion of the sampling period. VRAP groups can use the reports and data as a means of understanding the details of water quality, guiding future sampling efforts, or determining restoration activities.
_____________________________________________________________________________________ 2010 Lake Winnipesaukee Tributaries Water Quality Report 5
New Hampshire Surface Water Quality Assessments
Along with data collected from other water quality programs, specifically the State Ambient River Monitoring Program, applicable volunteer data are used to support periodic NHDES surface water quality assessments. VRAP data are entered into NHDES’s Environmental Monitoring Database and are ultimately uploaded to the EPA database. Assessment results and the methodology used to assess surface waters are published by NHDES every two years (i.e., Section 305(b) Water Quality Reports) as required by the federal Clean Water Act. The reader is encouraged to log on to the NHDES web page to review the assessment methodology and list of impaired waters http://des.nh.gov/organization/divisions/water/wmb/swqa/index.htm.
2.7 Quality Assurance/Quality Control
In order for VRAP data to be used in the assessment of New Hampshire’s surface waters, the data must meet quality control guidelines as outlined in the VRAP Quality Assurance Project Plan (QAPP). The VRAP QAPP was approved by NHDES and reviewed by EPA in the summer of 2003. The QAPP is reviewed annually and is officially updated and approved every five years. The VRAP quality assurance/quality control (QA/QC) measures include a six-step approach to ensuring the accuracy of the equipment and consistency in sampling efforts.
Calibration: Prior to each measurement, the pH and DO meters must be calibrated. Conductivity and turbidity meters are checked against a known standard before the first measurement and after the last one.
Replicate Analysis: A second measurement by each meter is taken from the original sample at one of the stations during the sampling day. If the same sampling schedule is used throughout the monitoring season, the replicate analysis should be conducted at different stations. Replicates should be measured within 15 minutes of the original measurements.
6.0 pH Standard: A reading of the pH 6.0 buffer is recorded at one of the stations during the sampling day. If the same sampling schedule is used throughout the monitoring season, the 6.0 pH standard check should be conducted at different stations.
Zero Oxygen Solution: A reading of a zero oxygen solution is recorded at one of the stations during the sampling day. If the same sampling schedule is used throughout the monitoring season, the zero oxygen standard check should be conducted at different stations.
DI (De-Ionized) Turbidity Blank: A reading of the DI blank is recorded at one of the stations during the sampling day. If the same sampling schedule is used throughout the monitoring season, the blank check should be conducted at different stations.
End of the Day Conductivity and Turbidity Meter Check: At the conclusion of each sampling day, the conductivity and turbidity meters are re-checked against a known standard.

_____________________________________________________________________________________ 2010 Lake Winnipesaukee Tributaries Water Quality Report 6
2.7.1 Measurement Performance Criteria
Precision is calculated for field and laboratory measurements through measurement replicates (instrumental variability) and is calculated for each sampling day. The use of VRAP data for assessment purposes is contingent on compliance with a parameter-specific relative percent difference (RPD) as derived from equation 1, below. Any data exceeding the limits of the individual measures are disqualified from surface water quality assessments. All data that exceeds the limits defined by the VRAP QAPP are acknowledged in the data tables with an explanation of why the data was unusable. Table 1 shows typical parameters studied under VRAP and the associated quality control procedures.
(Equation 1. Relative Percent Difference)
Where x1 is the original sample and x2 is the replicate sample.
Table 1. Field Analytical Quality Controls
Water Quality Parameter
QC Check QC Acceptance
Limit Corrective Action
Person Responsible for Corrective
Action
Data Quality Indicator
Temperature
Measurement Replicate
RPD < 10% or Absolute Difference
<0.8 C.
Repeat Measurement
Volunteer Monitors
Precision
Measurement Replicate
RPD < 10% Recalibrate
Instrument, Repeat Measurement
Volunteer Monitors
Precision Dissolved Oxygen
Known Buffer (Zero O2 Sol.)
RPD < 10% or Absolute Difference
<0.4 mg/L
Recalibrate Instrument, Repeat
Measurement
Volunteer Monitors
Relative Accuracy
Measurement Replicate
Absolute Difference <0.3 pH units
Recalibrate Instrument, Repeat
Measurement
Volunteer Monitors
Precision
pH
Known Buffer (pH = 6.0)
± 0.1 std units
Recalibrate Instrument, Repeat
Measurement
Volunteer Monitors
Accuracy
Measurement Replicate
RPD < 10% or Absolute Difference
<5µS/cm
Recalibrate Instrument, Repeat
Measurement
Volunteer Monitors
Precision Specific
Conductance
Known Buffer ± 20% µS/cm
Recalibrate Instrument, Repeat
Measurement
Volunteer Monitors
Accuracy
Measurement Replicate
RPD < 10% or Absolute Difference
<1.0 NTU
Recalibrate Instrument, Repeat
Measurement
Volunteer Monitors
Precision
Turbidity
Method Blank (DI Water)
± 0.1 NTU
Recalibrate Instrument, Repeat
Measurement
Volunteer Monitors
Accuracy
Laboratory Parameters
Measurement Replicate
RPD < 20% or Absolute Difference less than ½ the mean
value of the parameter in NHDES’s
Environmental Monitoring Database
Repeat Measurement
Volunteer Monitors
Precision
%100
2
21
21×
+
−=
xx
xxRPD

_____________________________________________________________________________________ 2010 Lake Winnipesaukee Tributaries Water Quality Report 7
3.0 METHODS During the summer of 2004, volunteers from the Lake Winnipesaukee Watershed Association began water quality monitoring on the inlet tributaries of Lake Winnipesaukee. The goal of this effort was to provide water quality data from the Lake Winnipesaukee tributaries relative to surface water quality standards and to allow for the assessment of the river for support of aquatic life and primary contact recreation (swimming). The establishment of a long-term monitoring program will allow for an understanding of the river’s dynamics, or variations on a station-by-station and year-to-year basis. The data can also serve as a baseline from which to determine any water pollution problems in the river and/or watershed. The Volunteer River Assessment Program has provided field training, equipment, and technical assistance. During 2010, volunteers from the Lake Winnipesaukee Watershed Assocation, Laconia Conservation Commission, and the Wolfeboro Conservation Commission monitored water quality at five stations in the Lake Winnipesakuee watershed (Table 3). NHDES Stations IDs are typically designated using a three-letter code to identify the waterbody name plus a number indicating the relative position of the station. The higher the station number the more upstream the station is in the watershed. However, at this time, NHDES has used the existing station IDs provided by the Laconia Conservation Commission. All stations monitored in 2010 are designated as Class B waters. This classification is used to apply the appropriate water quality standard.
Water quality monitoring was conducted in July and September. In-situ measurements of water temperature, dissolved oxygen, pH, turbidity and specific conductance were taken using handheld meters. Table 2 summarizes the parameters measured and equipment used.

_____________________________________________________________________________________ 2010 Lake Winnipesaukee Tributaries Water Quality Report 8
Table 2. Sampling and Analysis Methods
Parameter Sample Type Standard Method
Equipment Used
Laboratory
Temperature In-Situ SM 2550 YSI 95 ------
Dissolved Oxygen In-Situ SM 4500 O G YSI 95 ------
pH In-Situ SM 4500 H+ Orion pH 11 ------
Turbidity In-Situ EPA 180.1 LaMotte 2020 ------
Specific Conductance In-Situ SM 2510 YSI 30 ------
Table 3. Sampling Stations for the Lake Winnipesaukee Tributaries, NHDES VRAP, 2010
Station ID & AUID
Class Waterbody Name
Location Town Elevation (Rounded to the Nearest 100 Feet)
12-GSK NHRIV700020107-04
B Gunstock River
Hoyt Road Gilford 500
TRIB-22 No AUID at 1 to
100,000 B
Tributary to Paugus Bay
Black Brook at Union Ave
Laconia 500
TRIB-23 No AUID at 1 to
100,001 B
Tributary to Paugus Bay
Black Brook Behind Paugus Bay Diner
Laconia 500
03-SRW NHRIV700020101-19
B Smith River
Crescent Lake Outlet
Wolfeboro 500
01-SRW NHRIV700020101-21
B Smith River
Back Bay Outlet Wolfeboro 500

_____________________________________________________________________________________ 2010 Lake Winnipesaukee Tributaries Water Quality Report 9
4.0 RESULTS AND RECOMMENDATIONS
Results and recommendations for each monitored parameter are presented in the following sections. For a description of the importance of each parameter and pertinent water quality criteria for these and other parameters, please see Appendix B, “Interpreting VRAP Water Quality Parameters.”
4.1 Dissolved Oxygen Either one or two measurements were taken in the field for dissolved oxygen concentration at five stations in the Lake Winnipesaukee watershed (Table 4). Of the seven measurements taken, none met quality assurance/quality control requirements and are usable for New Hampshire’s 2012 surface water quality report to the US Environmental Protection Agency. The Class B New Hampshire surface water quality standard for dissolved oxygen includes a minimum concentration of 5.0 mg/L and a minimum daily average of 75 percent of saturation. In other words, there are criteria for both concentration and saturation that must be met before the river can be assessed as meeting dissolved oxygen standards. Table 4 reports only dissolved oxygen concentration as more detailed analysis is required to determine if instantaneous dissolved oxygen saturation measurements are above or below water quality standards. Table 4. Dissolved Oxygen (mg/L) Summary – Lake Winnipesaukee Tributaries, 2010
Station ID Samples Collected
Data Range (mg/l)
Acceptable Samples Not Meeting NH Class
B Standards
Number of Usable Samples for 2012 NH Surface Water
Quality Assessment
12-GSK 1 9.28 0 0
TRIB-22 1 5.50 0 0
TRIB-23 1 7.23 0 0
03-SRW 2 7.62 - 7.71 0 0
01-SRW 2 7.83 - 11.53 0 0
Total 7 _____ 0 0
All measurements taken for dissolved oxygen concentration were above the New Hampshire Class B surface water quality standard (Figure 1). Levels of dissolved oxygen sustained above the standards are considered adequate for the support of aquatic life and other desirable water quality conditions.

_____________________________________________________________________________________ 2010 Lake Winnipesaukee Tributaries Water Quality Report 10
Figure 1. Dissolved Oxygen Statistics for the Lake Winnipesaukee Tributaries
July 1 - September 24, 2010, NHDES VRAP
0
1
2
3
4
5
6
7
8
9
10
11
12
13
14
15
12-GSK TRIB-22 TRIB-23 03-SRW 01-SRW
Station ID
Dissolved Oxygen (mg/L)
Individual Dissolved Oxygen Measurements
Class B Single Sample NH SWQS
Recommendations
Continue sampling at all stations in order to develop a long-term data set to better understand trends as time goes on.
If possible, take measurements between 5 a.m. and 10 a.m., which is when dissolved oxygen is usually the lowest, and between 2 p.m. and 7 p.m. when dissolved oxygen is usually the highest. In general, dissolved oxygen levels are lowest in the early morning when there is low photosynthetic activity and a peak in respiration from organisms throughout the water column. This is the time of least oxygen production and greatest carbon dioxide emission. Peak dissolved oxygen levels occur when photosynthetic activity is at its peak. The greater the amount of photosynthetic activity the greater the production of oxygen as a byproduct of photosynthesis.
Consider incorporating the use of in-situ dataloggers to automatically record dissolved oxygen saturation levels during a period of several days. The use of these instruments is dependent upon availability, and requires coordination with NHDES.

_____________________________________________________________________________________ 2010 Lake Winnipesaukee Tributaries Water Quality Report 11
4.2 pH Either one or two measurements were taken in the field for pH at five stations in the Lake Winnipesaukee watershed (Table 5). Of the seven measurements taken, six met quality assurance/quality control requirements and are usable for New Hampshire’s 2012 surface water quality report to the US Environmental Protection Agency.
The Class B New Hampshire surface water quality standard is 6.5 - 8.0, unless naturally occurring.
Table 5. pH Data Summary - Lake Winnipesaukee Tributaries, 2010
Station ID Samples Collected
Data Range (standard units)
Acceptable Samples Not
Meeting NH Class B Standards
Number of Usable Samples for 2012 NH Surface Water
Quality Assessment
12-GSK 1 7.00 0 0
TRIB-22 1 6.12 1 1
TRIB-23 1 6.01 1 1
03-SRW 2 6.17 - 6.23 2 2
01-SRW 2 6.35 - 6.42 2 2
Total 7 _____ 6 6
All but one measurement taken for pH was below the New Hampshire Class B surface water quality standard minimum (Figure 2).
Lower pH measurements are likely the result of natural conditions such as the soils, geology, or the presence of wetlands in the area. Rain and snow falling in New Hampshire is relatively acidic, which can also affect pH levels; after the spring melt or significant rain events, surface waters will generally have a lower pH.

_____________________________________________________________________________________ 2010 Lake Winnipesaukee Tributaries Water Quality Report 12
Figure 2. pH Statistics for the Lake Winnipesaukee Tributaries
July 1 - September 24, 2010, NHDES VRAP
5.0
5.5
6.0
6.5
7.0
7.5
8.0
12-GSK TRIB-22 TRIB-23 03-SRW 01-SRW
Station ID
pH (standard units)
Individual pH Measurements
NH Class B Minimum SWQS
Recommendations
Continue sampling at all stations in order to develop a long-term data set to better understand trends as time goes on.
Consider sampling for pH in some of the tributaries and wetland areas that are influencing the pH of stations with measurements below state standards. Wetlands can lower the pH of a river naturally by releasing tannic and humic acids from decaying plant material. If the sampling location is influenced by wetlands or other natural conditions, then the low pH measurements are not considered a violation of water quality standards. It is important to note that the New Hampshire water quality standard for pH is fairly conservative, thus pH levels slightly below the standard are not necessarily harmful to aquatic life. In this case, additional information about factors influencing pH levels is needed.

_____________________________________________________________________________________ 2010 Lake Winnipesaukee Tributaries Water Quality Report 13
4.3 Turbidity Either one or two measurements were taken in the field for turbidity at four stations in the Lake Winnipesaukee watershed [Table 6]. Of the six measurements taken, all met quality assurance/quality control requirements and are usable for New Hampshire’s 2012 surface water quality report to the US Environmental Protection Agency. The Class B New Hampshire surface water quality standard for turbidity is less than 10 NTU above natural background. Higher turbidity measurements may be naturally occurring as they are influenced by precipitation, soil type, and the composition and geology of the streambed. Table 6. Turbidity Data Summary - Lake Winnipesaukee Tributaries, 2010
Station ID Samples Collected
Data Range (NTU)
Acceptable Samples Not Meeting NH Class
B Standards
Number of Usable Samples for 2012 NH Surface Water
Quality Assessment
TRIB-22 1 11 0 1
TRIB-23 1 6.60 0 1
03-SRW 2 0.00 - 0.35 0 2
01-SRW 2 0.05 - 0.60 0 2
Total 6 _____ 0 6
Turbidity levels were relatively low. Tributary stations TRIB-22 and TRIB-23 in Laconia had higher turbidity measurements than stations in the Smith River in Wolfeboro (Figure 3).

_____________________________________________________________________________________ 2010 Lake Winnipesaukee Tributaries Water Quality Report 14
Figure 3. Turbidity Statistics for the Lake Winnipesaukee Tributaries
July 1 - September 24, 2010, NHDES VRAP
0
2
4
6
8
10
12
TRIB-22 TRIB-23 03-SRW 01-SRW
Station ID
Turbidity (NTU)
Individual Turbidity Measurements
Although clean waters are associated with low turbidity there is a high degree of natural variability involved. Precipitation often contributes to increased turbidity by flushing sediment, organic matter and other materials from the surrounding landscape into surface waters. However, human activities, such as removal of vegetation near surface waters and disruption of nearby soils, can lead to dramatic increases in turbidity levels. In general, it is typical to see a rise in turbidity in more developed areas due to increased runoff.
Recommendations
Continue sampling at all stations in order to develop a long-term data set to better understand trends as time goes on.
Collect samples during wet weather. This will help us to understand how the river responds to runoff and sedimentation.
If a higher than normal turbidity measurement occurs, volunteers can investigate further by moving upstream and taking additional measurements. This will facilitate isolating the location of the cause of the elevated turbidity levels. In addition, take good field notes and photographs. If human activity is suspected or verified as the source of elevated turbidity levels, volunteers should contact NHDES.

_____________________________________________________________________________________ 2010 Lake Winnipesaukee Tributaries Water Quality Report 15
4.4 Specific Conductance Either one or two measurements were taken in the field for specific conductance at five stations in the Lake Winnipesaukee watershed (Table 7). Of the seven measurements taken, six met quality assurance/quality control requirements and are usable for New Hampshire’s 2012 surface water quality report to the US Environmental Protection Agency. Although New Hampshire surface water quality standards do not contain numeric criteria for specific conductance, the New Hampshire Consolidated Assessment and Listing Methodology (CALM) allows for instantaneous specific conductance measurements to be used as a surrogate to predict compliance with numeric water quality criteria for chloride. NHDES has developed a statewide specific conductance to chloride relationship based on simultaneous measurement of specific conductance and chloride. The Class B New Hampshire surface water quality standard for chloride and corresponding specific conductance measurements are as follows:
Freshwater chronic criterion 230 mg/l 835 uS/cm Freshwater acute criterion 860 mg/l 2755 uS/cm
Table 7. Specific Conductance Data Summary - Lake Winnipesaukee Tributaries, 2010
Station ID
Samples Collected
Data Range (uS/cm)
Acceptable Samples Not
Meeting NH Class B Standards (µS/cm
as chloride surrogate)
Number of Usable Samples for 2012 NH
Surface Water Quality Assessment
12-GSK 1 273 0 0
TRIB-22 1 374 0 1
TRIB-23 1 441 0 1
03-SRW 2 55.2 - 57.1 0 2
01-SRW 2 57.8 - 62.5 0 2
Total 7 _____ 0 6
Specific conductance levels were variable throughout the watershed (Figure 4). Higher specific conductance levels can be indicative of pollution from sources such as urban/agricultural runoff, road salt, failed septic systems, or groundwater pollution. The variable specific conductance levels indicate low pollutant levels at some stations and high pollutant levels at others.

_____________________________________________________________________________________ 2010 Lake Winnipesaukee Tributaries Water Quality Report 16
Figure 4. Specific Conductance Statistics for the Lake Winnipesaukee Tributaries
July 1 - September 24, 2010, NHDES VRAP
0
50
100
150
200
250
300
350
400
450
500
550
600
12-GSK TRIB-22 TRIB-23 03-SRW 01-SRW
Station ID
Specific Conductance (µS/cm)
Individual Specific Conductance Measurements
Recommendations
Continue sampling at all stations in order to develop a long-term data set to better understand trends as time goes on.
Continue collecting chloride samples at the same time that specific conductance is measured. During the late winter/early spring snowmelt, higher specific conductance levels are often seen due to elevated concentrations of chloride in the runoff. Specific conductance levels are very closely correlated to chloride levels. Simultaneously measuring chloride and specific conductance will allow for a better understanding of their relationship.
Consider incorporating the use of in-situ dataloggers to automatically determine specific conductance levels during rain events, snowmelt, and baseline dry weather conditions. The use of these instruments is dependent upon availability, and requires coordination with NHDES.

_____________________________________________________________________________________ 2010 Lake Winnipesaukee Tributaries Water Quality Report 17
4.5 Water Temperature
Either one or two measurements were taken in the field for water temperature at five stations in the Lake Winnipesaukee watershed (Table 8). Of the seven measurements taken, six met quality assurance/quality control requirements and are usable for New Hampshire’s 2012 surface water quality report to the US Environmental Protection Agency. Although there is currently no numerical water quality criteria for water temperature, NHDES is in the process of collecting biological and water temperature data that will contribute to the development of a procedure for assessing rivers and stream based on water temperature and its corresponding impact to the biological integrity of the waterbody. Table 8. Water Temperature Data Summary – Lake Winnipesaukee Tributaries, 2010
Station ID Samples Collected
Data Range (C)
Acceptable Samples Not
Meeting NH Class B Standards
Number of Usable Samples for 2012 NH Surface Water Quality Assessment
12-GSK 1 18.8 Not Applicable 0
TRIB-22 1 21.5 N/A 1
TRIB-23 1 18.3 N/A 1
03-SRW 2 19.4 – 26.8 N/A 2
01-SRW 2 18.6 – 26.8 N/A 2
Total 7 _____ N/A 6
Figure 5 shows the results of instantaneous water temperature measurements at five stations in the Lake Winnipesaukee watershed. Water temperature is a critical parameter for aquatic life and has an impact on other water quality parameters such as dissolved oxygen concentrations, and the activity of bacteria in the water. Water temperature controls the metabolic and reproductive processes of aquatic species and can determine which fish and macroinvertebrate species can survive in a given river or stream. A number of factors can have an impact on water temperature including the quantity and maturity of riparian vegetation along the shoreline, the rate of flow, the percent of impervious surfaces contributing stormwater, thermal discharges, impoundments and the influence of groundwater.

_____________________________________________________________________________________ 2010 Lake Winnipesaukee Tributaries Water Quality Report 18
Figure 5. Water Temperature Statistics for the Lake Winnipesaukee Tributaries
July 1 - September 24, 2010, NHDES VRAP
0
2
4
6
8
10
12
14
16
18
20
22
24
26
28
30
12-GSK TRIB-22 TRIB-23 03-SRW 01-SRW
Station ID
Temperature (C)
Individual Water Temperature Measurements
Recommendations
Continue collecting water temperature data via both instantaneous readings and consider long-term deployment of NHDES water temperature dataloggers.

APPENDIX A: 2010 LAKE WINNIPESAUKEE TRIBUTARIES
WATER QUALITY DATA
Measurements not meeting New Hampshire surface water quality standards
Measurements not meeting NHDES quality assurance/quality control standards
A Specific conductance > 835 µS/cm indicate exceedance of chronic chloride standard of 230 mg/L
12-GSK, Gunstock River, Hoyt Road, Gilford
DateTime of
Sample
DO
(mg/L)DO (% sat.) pH
Turbidity
(NTUs)
Specific
Conductance
(uS/cm)
Water Temp.
(°C)
Standard NA >5.0>75% Daily
Average6.5-8.0
<10 NTU
above
backgrd835 µS/cm
A NA
07/22/2010 11:05 9.28 99.8 7.00 272.5 18.8
TRIB-22, Black Brook, Union Ave, Laconia
DateTime of
Sample
DO
(mg/L)DO (% sat.) pH
Turbidity
(NTUs)
Specific
Conductance
(uS/cm)
Water Temp.
(°C)
Standard NA >5.0>75% Daily
Average6.5-8.0
<10 NTU
above
backgrd835 µS/cm
A NA
07/01/2010 14:23 5.50 62.2 6.12 11.0 374.4 21.5
TRIB-23, Black Brook Behind Paugus Diner, Laconia
DateTime of
Sample
DO
(mg/L)DO (% sat.) pH
Turbidity
(NTUs)
Specific
Conductance
(uS/cm)
Water Temp.
(°C)
Standard NA >5.0>75% Daily
Average6.5-8.0
<10 NTU
above
backgrd835 µS/cm
A NA
07/01/2010 13:25 7.23 72.4 6.01 6.6 440.7 18.3
03-SRW, Smith River, Crescent Lake Outlet, Wolfeboro
DateTime of
Sample
DO
(mg/L)DO (% sat.) pH
Turbidity
(NTUs)
Specific
Conductance
(uS/cm)
Water Temp.
(°C)
Standard NA >5.0>75% Daily
Average6.5-8.0
<10 NTU
above
backgrd835 µS/cm
A NA
07/16/2010 11:10 7.71 97.1 6.17 0.0 57.1 26.8
09/24/2010 11:19 7.62 89.0 6.23 0.4 55.2 19.4
01-SRW, Smith River, Back Bay Outlet, Wolfeboro
DateTime of
Sample
DO
(mg/L)DO (% sat.) pH
Turbidity
(NTUs)
Specific
Conductance
(uS/cm)
Water Temp.
(°C)
Standard NA >5.0>75% Daily
Average6.5-8.0
<10 NTU
above
backgrd835 µS/cm
A NA
07/16/2010 10:40 7.83 97.1 6.35 0.1 57.8 26.8
09/24/2010 10:38 11.53 124.8 6.42 0.6 62.5 18.6

Appendix B: Interpreting VRAP Water Quality Monitoring Parameters 1
APPENDIX B: Interpreting VRAP Water Quality Monitoring Parameters
Chemical Parameters
Dissolved Oxygen (DO)
Unit of Measurement: concentration in milligrams per liter (mg/L) and percent saturation (%).
Description: A measure of the amount of oxygen in the water: Concentration is a measure of the amount of oxygen in a volume of water; saturation is a measurement of the amount of oxygen in the water compared to the amount of oxygen the water can actually hold at full saturation. Both of these measurements are necessary to accurately determine whether New Hampshire surface water quality standards are met.
Importance: Oxygen is dissolved into the water from the atmosphere, aided by wind and wave action, or by rocky, steep, or uneven stream beds. The presence of dissolved oxygen is vital to bottom-dwelling organisms as well as fish and amphibians. Aquatic plants and algae produce oxygen in the water during the day, and consume oxygen during the night. Bacteria utilize oxygen both day and night when they process organic matter into smaller and smaller particles.
pH
Unit of Measurement: units (no abbreviation).
Description: A measure of hydrogen ion activity in water, or, in general terms, the acidity of water. pH is measured on a logarithmic scale of 0 to 14, with 7 being neutral. A high pH indicates alkaline (or basic) conditions and a low pH indicates acidic conditions. pH is influenced by geology and soils, organic acids (decaying leaves and other matter), and human-induced acids from acid rain (which typically has a pH of 3.5 to 5.5).
Importance: pH affects many chemical and biological processes in the water and this is important to the survival and reproduction of fish and other aquatic life. Different organisms flourish within different ranges of pH. Measurements outside of an organism’s preferred range can limit growth and reproduction and lead to physiological stress. Low pH can also affect the toxicity of aquatic compounds such as ammonia and certain metals by making them more “available” for uptake by aquatic plants and animals. This can produce conditions that are toxic to aquatic life.
Class A NH Surface Water Quality Standard: 6 mg/L at any place or time, or 75% minimum daily average – (unless naturally occurring). Class B NH Surface Water Quality Standard: 5 mg/L at any place or time or 75% minimum daily average – (unless naturally occurring).
Several measurements of oxygen saturation taken in a 24-hour period must be averaged to compare to the 75 percent daily average saturation standard. The concentration of dissolved oxygen is dependent on many factors including temperature and sunlight, and tends to fluctuate throughout the day. Saturation values are averaged because a reading taken in the morning may be low due to respiration, while a measurement that afternoon may show that the saturation has recovered to acceptable levels. Water can become saturated with more than 100 percent dissolved oxygen.
Appendix B: Interpreting VRAP Water Quality Monitoring Parameters
2
pH Units Category
<5.0 High Impact
5.0 – 5.9 Moderate to High Impact
6.0 – 6.4 Normal; Low Impact
6.5 – 8.0 Normal;
6.1 – 8.0 Satisfactory
Specific Conductance or Conductivity
Unit of Measurement: micromhos per centimeter (umhos/cm) or microsiemens per centimeter (uS/cm).
Description: The numerical expression of the ability of water to carry an electrical current at
25o C and a measure of free ion (charged particles) content in the water. These ions can come
from natural sources such as bedrock, or human sources such as stormwater runoff. Specific conductance can be used to indicate the presence of chlorides, nitrates, sulfates, phosphates, sodium, magnesium, calcium, iron, and aluminum ions. There is a difference between conductivity and specific conductance. Specific conductance measures the free ion content of water at a specific water temperature, whereas conductivity measures the free ion content of water at 25º C. VRAP uses the term “specific conductance” because our conductivity measurements account for temperature. In some studies and programs, the term “conductivity” is used. This term should only be used when the measurement does not adjust to a specific temperature.
Importance: Specific conductance readings can help locate potential pollution sources because polluted water usually has a higher specific conductance than unpolluted waters. High specific conductance values often indicate pollution from road salt, septic systems, wastewater treatment plants, or urban/agricultural runoff. Specific conductance can also be related to geology. In unpolluted rivers and streams, geology and groundwater are the primary influences on specific conductance levels.
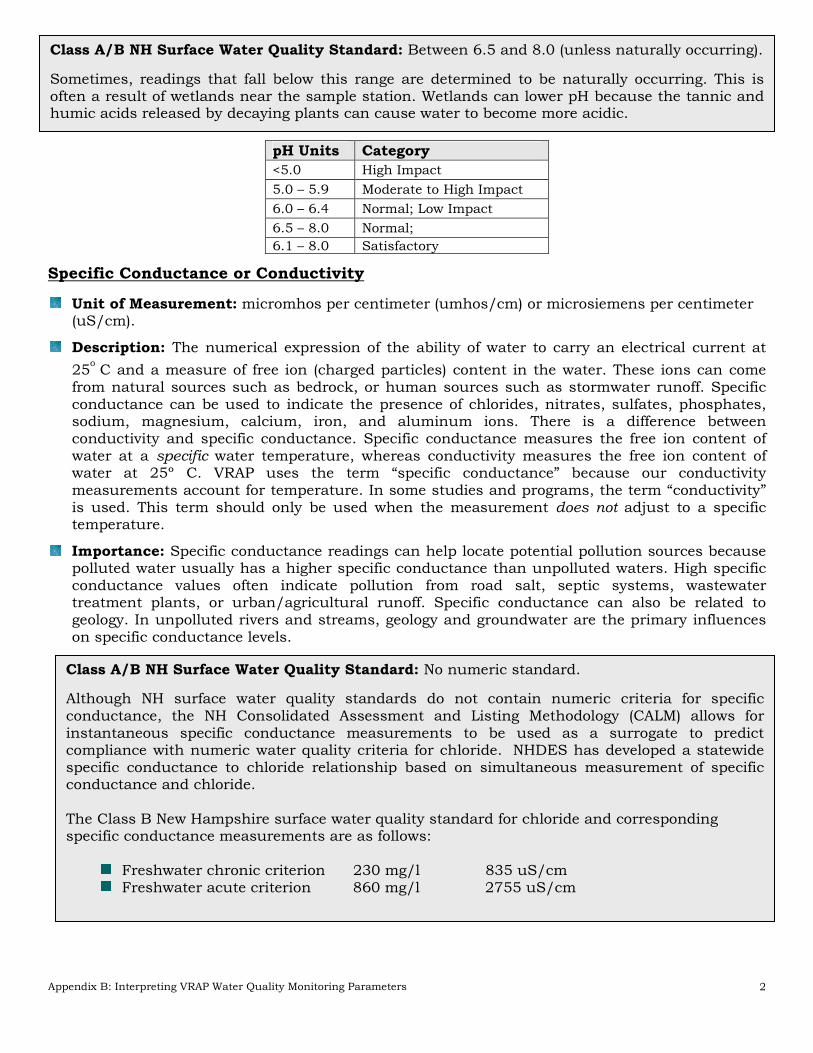
Class A/B NH Surface Water Quality Standard: Between 6.5 and 8.0 (unless naturally occurring).
Sometimes, readings that fall below this range are determined to be naturally occurring. This is often a result of wetlands near the sample station. Wetlands can lower pH because the tannic and humic acids released by decaying plants can cause water to become more acidic.
Class A/B NH Surface Water Quality Standard: No numeric standard.
Although NH surface water quality standards do not contain numeric criteria for specific conductance, the NH Consolidated Assessment and Listing Methodology (CALM) allows for instantaneous specific conductance measurements to be used as a surrogate to predict compliance with numeric water quality criteria for chloride. NHDES has developed a statewide specific conductance to chloride relationship based on simultaneous measurement of specific conductance and chloride. The Class B New Hampshire surface water quality standard for chloride and corresponding specific conductance measurements are as follows:
Freshwater chronic criterion 230 mg/l 835 uS/cm Freshwater acute criterion 860 mg/l 2755 uS/cm

Appendix B: Interpreting VRAP Water Quality Monitoring Parameters
3
Turbidity
Unit of Measurement: Nephelometric Turbidity Units (abbreviated at NTU).
Description: A measurement of the amount of suspended material in the water. This material, which is comprised of particles such as clay, silt, algae, suspended sediment, and decaying plant material, causes light to be scattered and absorbed, rather than transmitted in straight lines through the water.
Importance: Higher turbidity increases water temperatures because suspended particles absorb more heat. This, in turn, reduces dissolved oxygen (DO) concentrations because warm water holds less DO than cold water. Higher turbidity also reduces the amount of light that can penetrate the water, which reduces photosynthesis and DO production. Suspended materials can clog fish gills, reducing disease resistance, lowering growth rates, and affecting egg and larval development. As the particles settle, they can blanket the stream bottom, especially in slower waters, and smother fish eggs and benthic macroinvertebrates. Clean waters are generally associated with low turbidity, but there is a high degree of natural variability involved. Rain events can increase turbidity in surface waters by flushing sediment, organic matter and other materials into the water. Human activities such as vegetation removal and soil disruption can also lead to dramatic increases in turbidity levels.
Physical Parameters Temperature
Unit of Measurement: Degrees Celsius ( º C)
Importance: Water temperature is a critical parameter for aquatic life and has an impact on other water quality parameters such as dissolved oxygen concentrations, and bacteria activity in water. Water temperature controls the metabolic and reproductive processes of aquatic species and can determine which fish and macroinvertabrate species can survive in a given river or stream.
A number of factors can have an impact on water temperature including the quantity and maturity of riparian vegetation, the rate of flow, the percent of impervious surfaces contributing stormwater, thermal discharges, impoundments and groundwater.
Nutrient Parameters
Specific Conductance (uS/cm) Category
0 – 100 Normal
101 – 200 Low Impact
201 – 500 Moderate Impact
> 501 High Impact
> 835 Exceeding chronic chloride standard
Class A NH Surface Water Quality Standard: As naturally occurs.
Class B NH Surface Water Quality Standard: Shall not exceed naturally occurring conditions by more than 10 NTU.
Class A NH Surface Water Quality Standard: As naturally occurs.
Class B NH Surface Water Quality Standard: No numeric standard
Although there is currently no numerical water quality criteria for water temperature, NHDES is in the process of collecting biological and water temperature data that will contribute to the development of a procedure for assessing rivers and stream based on water temperature and its corresponding impact to the biological integrity of the waterbody.

Appendix B: Interpreting VRAP Water Quality Monitoring Parameters
4
Chlorophyll-a (Chlor a)
Unit of Measurement: Milligrams per liter (mg/L).
Description: An indicator of the biomass, or abundance, of planktonic algae in the river. The technical term “biomass” is used to represent “amount by weight.” Chlorophyll-a can be strongly influenced by phosphorus, which is derived by natural and human activities.
Importance: Because algae is a plant and contains the green pigment chlorophyll-a, the concentration of chlorophyll-a found in the water gives an estimation of the concentration of algae. If the chlorophyll-a concentration increases, this indicates an increase in the algal population.
Chlorophyll-a (mg/L) Category
< 3 Excellent
3 – 7 Good
7 – 15 Less than desirable
> 15 Nuisance
Total Phosphorus (TP)
Unit of Measurement: Milligrams per liter (mg/L).
Description: A measure of all forms of phosphorus in the water, including inorganic and organic forms. There are many sources of phosphorus, both natural and human. These include soil and rocks, sewage, animal manure, fertilizer, erosion, and other types of contamination.
Importance: Phosphorus is a nutrient that is essential to plants and animals. However, excess amounts can cause rapid increases in the biological activity in water. Phosphorus is usually the “limiting nutrient” in freshwater streams, which means relatively small amounts can increase algae and chlorophyll-a levels. Algal blooms and/or excessive aquatic plant growth can decrease oxygen levels and make water unattractive. Phosphorus can indicate the presence of septic systems, sewage, animal waste, lawn fertilizer, road and construction erosion, other types of pollution, or natural wetlands and atmospheric deposition.
Total Phosphorus (mg/L) Category
< 0.010 Ideal
0.011 – 0.025 Average
0.026 – 0.049 More than desirable
> 0.050 Potential nuisance concentration
Class A NH Surface Water Quality Standard: No numeric standard.
Class B NH Surface Water Quality Standard: No numeric standard.
Class A/B NH Surface Water Quality Standard: There is no numeric standard for total phosphorus for Class A/B waters. The narrative standard states that “unless naturally occurring, shall contain no phosphorus in such concentrations that would impair any existing or designated uses.” New Hampshire’s surface water regulations (Env-Wq 1700) for Class B waters include narrative criteria for phosphorus which state that “unless naturally occurring, shall contain no phosphorus in such concentrations that would impair any existing or designated uses”. New Hampshire does not currently have numeric nutrient criteria for rivers and streams, but is in the process of developing them. Draft numeric nutrient criteria developed for Vermont and Maine surface waters indicate a maximum allowable summer mean phosphorus level of approximately 0.035 mg/L. Although this value is approximately two to three times typical natural background levels in many rivers and streams, it is considered protective of all designated uses (i.e., swimming, aquatic life, etc). in Vermont and Maine. It’s possible that phosphorus criteria for New Hampshire rivers and streams will be similar.

Appendix B: Interpreting VRAP Water Quality Monitoring Parameters
5
Total Kjeldahl Nitrogen (TKN)
Unit of Measurement: Milligrams per liter (mg/L).
Description: A measure of the amount of ammonia and organic nitrogen in the water.
Importance: High nitrogen levels can increase algae and chlorophyll-a levels in the river, but is generally less of a concern in fresh water than phosphorus. Nitrogen can indicate the presence of sewage, animal waste, fertilizer, erosion, or other types of pollution.
Other Parameters
Chloride
Unit of Measurement: Milligrams per liter (mg/L).
Description: The chloride ion (Cl-) is found naturally in some surface waters and groundwater. It is also found in high concentrations in seawater. Higher-than-normal chloride concentrations in freshwater is detrimental to water quality. In New Hampshire, applying road salt for winter accident prevention is a large source of chloride to the environment. Unfortunately, this has increased over time due to road expansion and increased vehicle traffic. Road salt (most often sodium chloride) readily dissolves and enters aquatic environments in ionic forms. Although chloride can originate from natural sources, most of the chloride that enters the environment is associated with the storage and application of road salt. As such, chloride-containing compounds commonly enter surface water, soil, and groundwater during late-spring snowmelt (since the ground is frozen during much of the late winter and early spring). Sodium chloride is also used on foods as table salt, and consequently is present in human waste. Thus, sometimes chloride in water can indicate sewage pollution. Saltwater intrusion can also elevate groundwater chlorides in drinking water wells near coastlines. Chloride ions are conservative, which means they are not degraded in the environment and tend to remain in solution, once dissolved. Chloride ions that enter ground water can ultimately be expected to reach surface water and, therefore, influence aquatic environments and humans.
Importance: Research shows elevated chloride levels can be toxic to freshwater aquatic life. Among the species tested, freshwater aquatic plants and invertebrates tend to be the most sensitive to chloride. In order to protect freshwater aquatic life in New Hampshire, the state has adopted acute and chronic chloride criteria.
TKN (mg/L) Category
< 0.25 Ideal
0.26 – 0.40 Average
0.41 – 0.50 More than desirable
> 0.51 Excessive (potential nuisance concentration)
Class A NH Surface Water Quality Standard: No numeric standard; as naturally occurs.
Class B NH Surface Water Quality Standard: No numeric standard; as naturally occurring, shall contain no nitrogen in such concentrations that would impair any existing or designated uses.
Acute Standard: 860 mg/L.
Chronic Standard: 230 mg/L.

Appendix B: Interpreting VRAP Water Quality Monitoring Parameters
6
Escherichia Coliform Bacteria (E. coli)
Unit of Measurement: Counts per 100 milliliter (cts/100 mL).
Description: An indicator of the potential presence of pathogens in fresh water. E. coli bacteria is a normal component in the large intestines of humans and other warm-blooded animals, and can be excreted in their fecal material. Organisms causing infections or disease (pathogens) are often excreted in the fecal material of humans and other warm-blooded animals.
Importance: E.coli bacteria is a good indicator of fecal pollution and the possible presence of pathogenic organisms. In freshwater, E. coli concentrations help determine if the water is safe for recreational uses such as swimming.
Several factors can contribute to elevated E. coli levels, including, but not limited to rain storms, low river flows, the presence of wildlife, and the presence of septic systems along the river.
Metals
Depending on the metal concentration, its form (dissolved or particulate), and the hardness of the water, trace metals can be toxic to aquatic life. Metals in dissolved form are generally more toxic than metals in the particulate form. The dissolved metal concentration is dependent on pH, as well as the presence of solids and organic matter that can bind with the metal to render it less toxic.
Hardness is primarily a measure of the calcium and magnesium ion concentrations in water, expressed as calcium carbonate. The hardness concentration affects the toxicity of certain metals. New Hampshire water quality regulations include numeric criteria for a variety of metals. Since dissolved metals are typically found in extremely low concentrations, the potential contamination of samples collected for trace metals analyses has become a primary concern of water quality managers. To prevent such contamination and to ensure reliable results, the use of “clean techniques” is becoming more and more frequent when sampling for dissolved metals. Because of this, sampling for metals may be more costly and require additional effort than in the past.
Class A NH Surface Water Quality Standard: Unless naturally occurring, shall contain not more than either a geometric mean of 47 E.coli cts/100 mL based on at least three samples obtained over a sixty-day period, or greater than 153 E.coli cts/100 mL in any one sample.
Class B NH Surface Water Quality Standard: Unless naturally occurring, shall contain not more than either a geometric mean of 126 E.coli cts/100 mL based on at least three samples obtained over a sixty-day period, or greater than 406 E.coli cts/100 mL in any one sample.
New Hampshire Volunteer River Assessment Program
29 Hazen Drive – PO Box 95 Concord, NH 03302-0095
p (603) 271-0699 – f (603) 271-7894 www.des.nh.gov
2008 (Revised 2010)

Appendix C: VRAP Field Audit 1
APPENDIX C:
2010 VRAP Field Audit
On July 1, 2010, VRAP staff visited volunteers from the Paugus Bay VRAP group to conduct a field audit. VRAP staff aim to visit each group annually during a scheduled sampling event to verify that volunteers successfully follow the VRAP protocols. If necessary, volunteers are re-trained during the visit, and the group is notified of the result of the verification visit. During the visit, volunteers were assessed in the following five categories: 1) Overall Sampling Procedures
Appropriate storage of meters, sample collection, laboratory sample collection and transportation, beginning and end of day meter checks, collecting a field replicate, performing QA/QC Meter Checks, and ensuring that all calibration and sampling data are properly documented on the VRAP Field Data Sheet and the Laboratory Services Login & Custody Sheet.
2) Turbidity
Inspecting and cleaning of glass turbidity vials prior to measurement of standards and samples, performing the Initial Turbidity Meter Check, calibrating the meter to a known standard at the beginning of the sampling day, recording the value of the DI turbidity blank (QA/QC Meter Check) once during the sampling day, and performing the End of the Day Meter Check at the conclusion of the sampling day.
3) pH
Inspecting the pH electrode prior to sampling, calibrating to both pH 7.0 and 4.0 buffers prior to each measurement, rinsing and wiping the pH electrode probe prior to and after the measurement of standards and samples, allowing the pH measurement to stabilize prior to recording the measurement, and recording the value of the 6.0 buffer (QA/QC Meter Check) once during the sampling day.
4) Water Temperature/Dissolved Oxygen
Ensuring that the meter is allowed an adequate time to stabilize prior to the first calibration, the meter is calibrated prior to each measurement, the calibration value is properly recorded, the chamber reading is properly recorded, that sufficient time is allowed for readings to stabilize, and that a zero oxygen check (QA/QC Meter Check) is completed during the sampling day.
5) Specific Conductance
Performing the Initial Conductivity Meter Check using a known standard, allowing for the meter to properly stabilize before recording measurements, properly cleaning the probe between stations, and performing the End of the Day Meter Check at the conclusion of the sampling day.
During the field sampling procedures assessment, VRAP staff offered important reminders and suggestions to ensure proper sampling techniques and re-trained volunteers in the areas needing improvement. Overall, the Paugus Bay VRAP group did a good job but has areas which need improvement. It is important to ensure that all volunteers attend an annual VRAP training workshop prior to the sampling season and to familiarize themselves with proper sampling techniques. Please remember to schedule an annual field audit in 2011.


