
New Color Quality Design for Lighting
– How lighting can be made more attractive?
Yoshi Ohno
Ph. D., NIST Fellow, Sensor Science Division
(IES Fellow, CIE President)
National Institute of Standards and Technology
Gaithersburg, Maryland USA
IALD Enlighten Americas 2015, Baltimore,
Oct. 8 to 10, 2015

National Institute of Standards and Technology (NIST)
Gaithersburg, Maryland campus
• National metrology institute for USA
under U.S. Dept. of Commerce
• NBS established in 1901, name changed to
NIST in 1988
• ~3000 researchers and staff in Gaithersburg.
• Annual budget ~$800M

3 IALD Enlighten Americas 2015
Color Quality = CCT and CRI ?
CCT: Correlated Color Temperature (CIE 15, CIE S017 ILV)
CRI: Color Rendering Index (CIE 13.3)
Some example
CCT = 3049 K
CRI (Ra)= 91
This product is not acceptable.
Why?
Too yellowish! (Duv= 0.012)
Normal CCT does not tell the whole story of chromaticity.

4 IALD Enlighten Americas 2015
CCT=4000 K CCT=4000 K
CRI Ra=94 CRI Ra=78
This looks better
(for most people)
Color Quality = CCT and CRI ?
CRI does not tell the whole story of
color rendering.

5 IALD Enlighten Americas 2015
Color Quality of Lighting
Chromaticity (white light)
Color Rendering
Color Quality
400 450 500 550 600 650 700
400 500 600 700
• CCT, Duv
• Chromaticity
coordinates
(x,y), (u’,v’)
• Color fidelity (CRI)
• Color preference

6 IALD Enlighten Americas 2015
Traditional White Light Chromaticity for Lighting
CIE 1931 (x, y) Diagram
ANSI C78.376-2001 for
fluorescent lamps IEC 60081 for Fluorescent Lamps

7 IALD Enlighten Americas 2015
ANSI C78.377 (for Solid State Lighting Products)
(2015 rev)

8 IALD Enlighten Americas 2015
Chromaticity shift across Planckian Locus
Lights below Planckian
locus look better.
Anecdotes say …
An example in neodymium
lamp

9 IALD Enlighten Americas 2015
Duv defined in ANSI C78.377 (2008)
Symbol: Duv Closest distance from the Planckian locus on the (u', 2/3 v') diagram, with +
sign for above and - sign for below the Planckian locus.
Duv scale on (u’, v’) diagram
10 IALD Enlighten Americas 2015
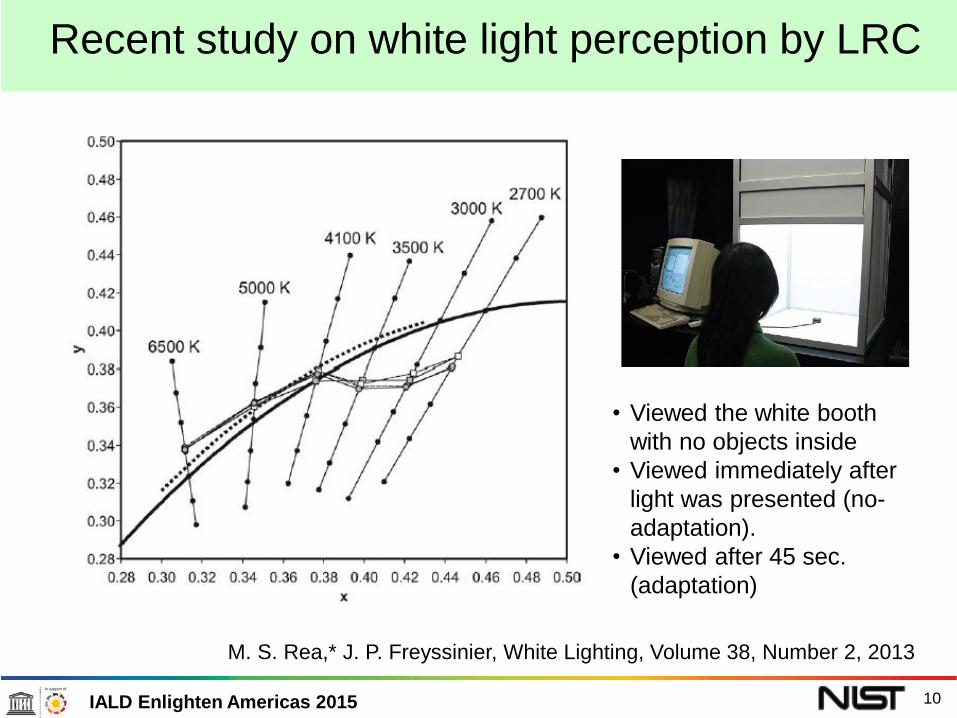
Recent study on white light perception by LRC
M. S. Rea,* J. P. Freyssinier, White Lighting, Volume 38, Number 2, 2013
• Viewed the white booth
with no objects inside
• Viewed immediately after
light was presented (no-
adaptation).
• Viewed after 45 sec.
(adaptation)
11 IALD Enlighten Americas 2015
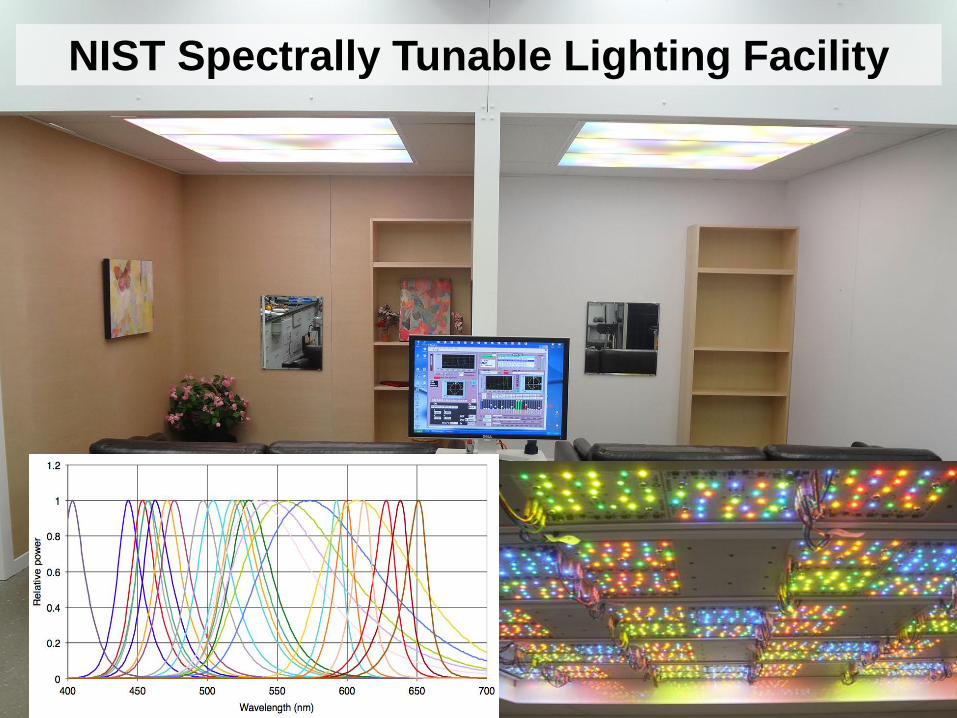
NIST Spectrally Tunable Lighting Facility

12 IALD Enlighten Americas 2015

13 IALD Enlighten Americas 2015
6 Duv points at each
CCT,
4 CCTs,
at total 23 points.
Total 50 spectra used.
• Real interior room setting with NIST STLF
at ~ 300 lx. (off-white walls)
• 18 subjects (20 to 70 yrs old)
• Viewed fruits/vegetables on the table,
his/her skin tone and the whole room.
• Judged which light is “more natural”.
2013 Vision Experiment at NIST
on Preferred and Acceptable level of Duv

14 IALD Enlighten Americas 2015
Light spectra
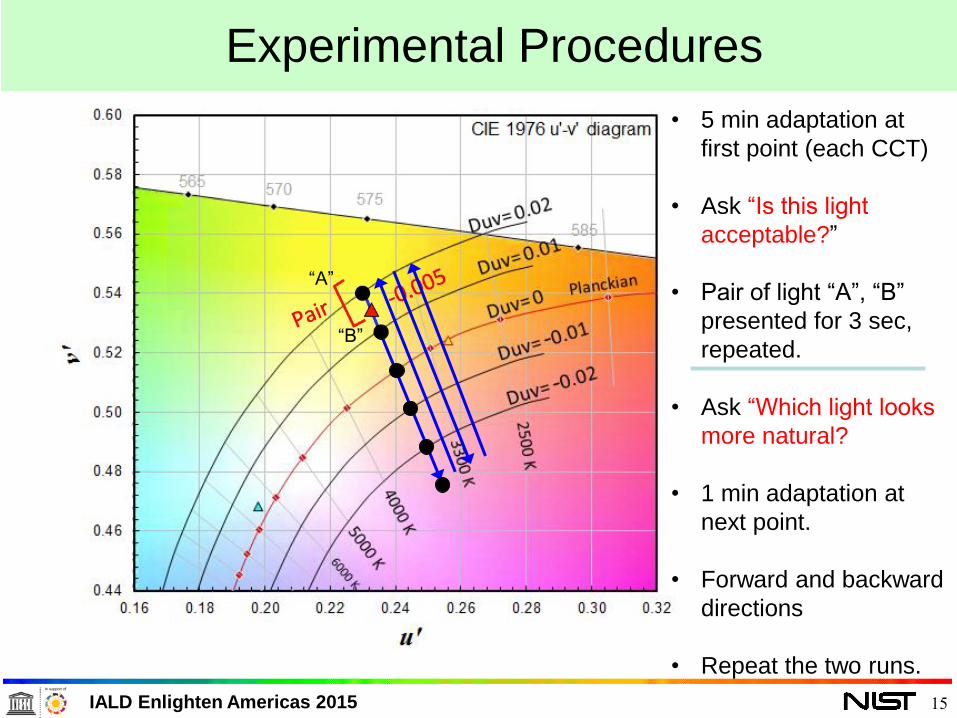
15 IALD Enlighten Americas 2015
• 5 min adaptation at
first point (each CCT)
• Ask “Is this light
acceptable?”
• Pair of light “A”, “B”
presented for 3 sec,
repeated.
• Ask “Which light looks
more natural?
• 1 min adaptation at
next point.
• Forward and backward
directions
• Repeat the two runs.
3500 K
Experimental Procedures
“A”
“B”

16 IALD Enlighten Americas 2015
Which light looks more natural?

17 IALD Enlighten Americas 2015
Experimental Procedures
• 6 Duv points at each
CCT
• 2 directions for each
CCT
• 4 CCTs
• 2 repeated runs for
each condition
Total 16 runs,
96 comparisons of pairs
of lights per subject.
Took ~ 4 h per subject.
18 subjects.
Whole experiment took
one month.
2700 K
3500 K
4500 K
6500 K

18 IALD Enlighten Americas 2015
-0.04
-0.03
-0.02
-0.01
0
0.01
0.02
0.03
0.04
6500K 4500K 3500K 2700K
Du
v
CCT
AVERAGE
1001
1002
1003
1004
1005
1006
1007
1009
1010
1011
1013
1014
1015
1016
1017
1018
1019
Results of 2013 Experiment 50 % crossover points of Duv (all subjects)
Std.de
v.

19 IALD Enlighten Americas 2015
Results of “Is this light acceptable?”
Y. Ohno and M. Fein, Vision Experiment on Acceptable and Preferred White
Light Chromaticity for Lighting, CIE x029:2014, pp. 192 – 199 (2014)
Duv ≈
-0.015
Results of 2013 Experiment Average crossover points of Duv

20 IALD Enlighten Americas 2015
Additional experiments with brownish walls with 6 subjects

21 IALD Enlighten Americas 2015
Discussion by M Wei & Kevin Houser
Leukos, April 2015 http://dx.doi.org/10.1080/15502724.2015.1029131
“We infer that the preference expressed by participants in the
studies by Dikel and others [2014] and Ohno and Fein
[2014] may not be solely related to chromaticity.”
“aspects of color rendition (that is, color fidelity and relative
gamut) may also influence preference.”

22 IALD Enlighten Americas 2015
Color rendering characteristics at different Duv levels
23 IALD Enlighten Americas 2015
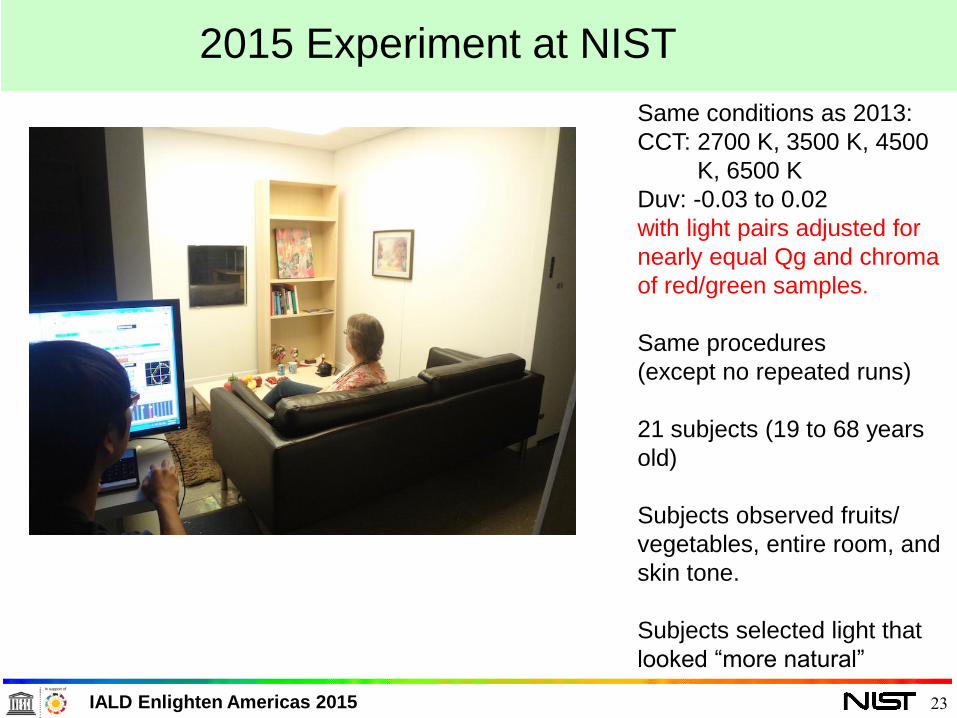
2015 Experiment at NIST
Same conditions as 2013:
CCT: 2700 K, 3500 K, 4500
K, 6500 K
Duv: -0.03 to 0.02
with light pairs adjusted for
nearly equal Qg and chroma
of red/green samples.
Same procedures
(except no repeated runs)
21 subjects (19 to 68 years
old)
Subjects observed fruits/
vegetables, entire room, and
skin tone.
Subjects selected light that
looked “more natural”

24 IALD Enlighten Americas 2015
Lights used in the 2013 experiment

25 IALD Enlighten Americas 2015
2015 Experiment settings
26 IALD Enlighten Americas 2015
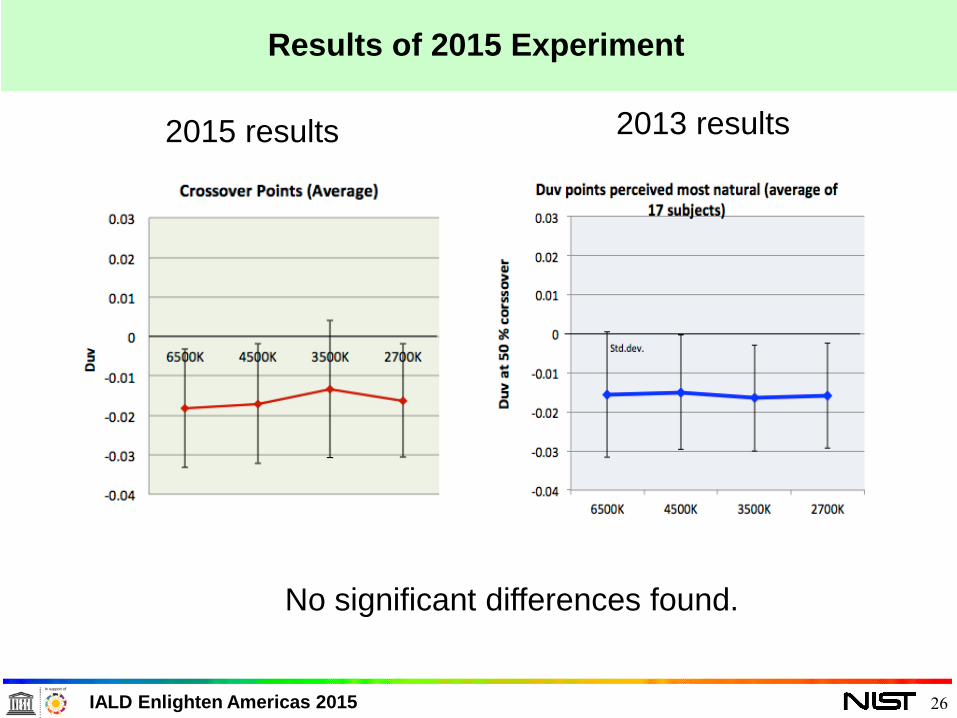
Results of 2015 Experiment
2013 results 2015 results
No significant differences found.

27 IALD Enlighten Americas 2015
Color Quality of Lighting
Chromaticity (white light)
Color Rendering
Color Quality
400 450 500 550 600 650 700
400 500 600 700
• CCT, Duv
• Chromaticity
coordinates
(x,y), (u’,v’)
• Color fidelity (CRI)
• Color preference

CRI Ra=94 CRI Ra=78
• CRI is a color fidelity metric.
• CRI score does not correlate well with perception when chroma is
more saturated.
Plots of 15
CQS samples
on CIELAB
(a*,b*)
The size of
plotted area is
“Gamut area”
Test
light
Referenc
e
Color contrast enhanced

29 IALD Enlighten Americas 2015
Gamut increased by LED sources
Negative
Duv RGB RGBA Hybrid

30 IALD Enlighten Americas 2015
Color Quality Scale (CQS)
Score is decreased for the
full color difference (same
as CRI)
Ref Test
Ref Test
Score is not penalized for
increase of chroma.
(Score is decreased for hue and
lightness shifts)
with limit of DC*ab<10 (CQS 9.0)
n Saturation factor
Davis, W. & Ohno, Y., “Color Quality Scale,” Optical Engineering, Optical
Engineering 033602-1 March 2010/Vol. 49_3 (2010)

31 IALD Enlighten Americas 2015
CQS is designed to improve CRI and to measure “perceived fidelity”
CQS is not a color preference metric.
<Saturated> <De-saturated>
Ra
Qa
How CQS works
Increase of chroma
not penalized

32 IALD Enlighten Americas 2015
Most saturated
Most de-saturated -80
-60
-40
-20
0
20
40
60
80
100
-80 -60 -40 -20 0 20 40 60 80
a*
CIELAB
b*
DC*ab = -16
DC*ab = 16
2014 Vision Experiment at NIST on preferred chroma saturation level
• 20 subjects
• 3 CCTs (2700, 3500, 5000 K) +
Duv= -0.015 (3500 K only)
• 4 different kinds of targets

33 IALD Enlighten Americas 2015
Spectra of light
Duv= 0, Ra=92
at DC=0
Duv= 0, Ra=94
at DC=0
Duv= 0, Ra=89
at DC=0
Ra=90
at DC=0
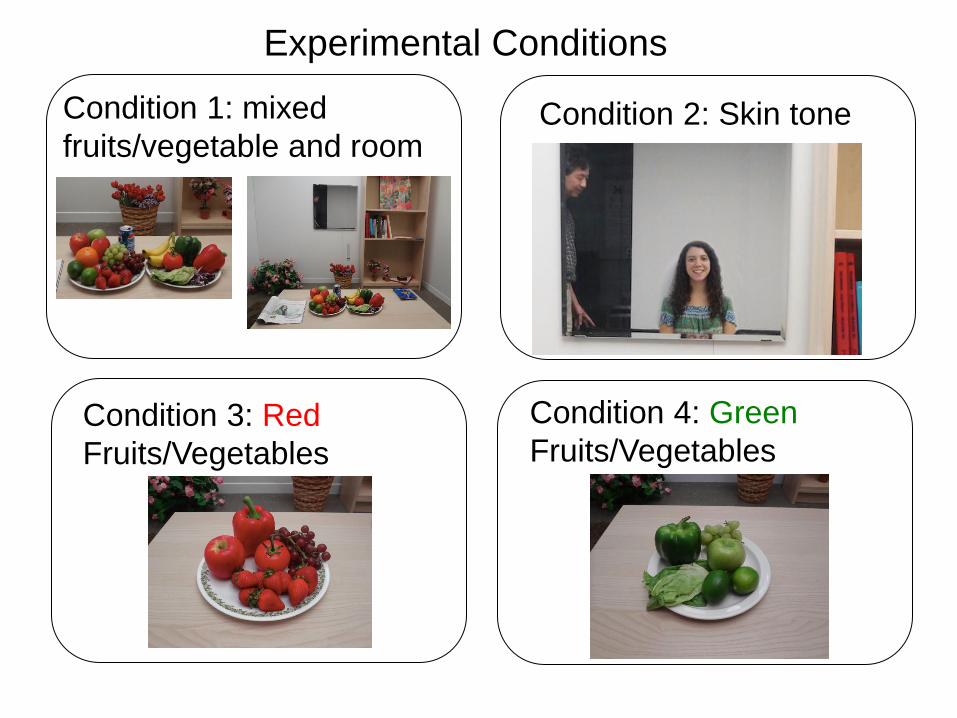
Experimental Conditions
Condition 1: mixed
fruits/vegetable and room Condition 2: Skin tone
Condition 3: Red
Fruits/Vegetables
Condition 4: Green
Fruits/Vegetables

35 IALD Enlighten Americas 2015
A Pair of Light presented sequentially
One was always
neutral one (DC=0).
Each light was
called “A” and “B”
“A” and “B”
assigned randomly.
Each light presented
for a few seconds.
Light was switched
back and forth for a
few times as
necessary.
36 IALD Enlighten Americas 2015
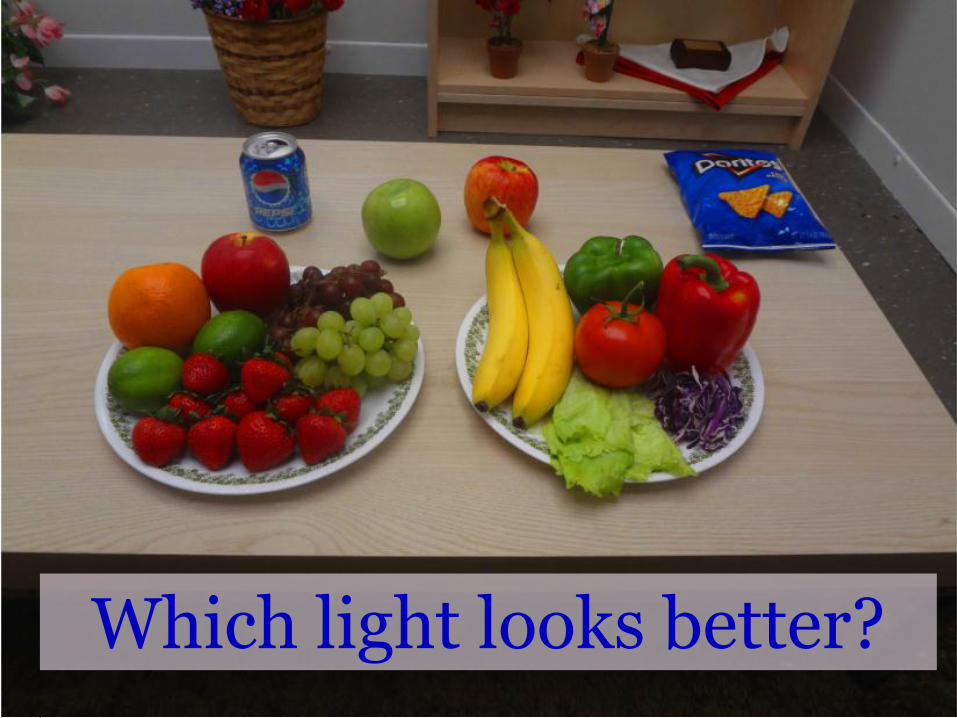
Which light looks better?

37 IALD Enlighten Americas 2015
Average Results for all subjects, all CCTs
0%
10%
20%
30%
40%
50%
60%
70%
80%
90%
100%
-16 -12 -8 -4 0 4 8 12 16Perc
en
t o
f P
art
icip
an
ts w
ho
pre
ferr
ed
P
oin
t Average Preference for DC
Average
Room
Skin
Green
Red
<Saturated> <De-saturated> Neutral
Y. Ohno, M. Fein, C. Miller, Vision Experiment on Chroma Saturation for
Color Quality Preference, CIE 216 :2015, pp. 60 – 69 (2015)
DCab
*

38 IALD Enlighten Americas 2015
Expected Color Preference Scale
Preference reference
Illuminant
<Saturated> <De-saturated>
Fidelity reference
Illuminant

39 IALD Enlighten Americas 2015
TC 1-90: Colour Fidelity Index
Chair: H. Yaguchi (JP)
Developing an updated color fidelity metric (for future
replacement of CRI).
TC 1-91: New Methods for Evaluating the Colour
Quality of White-Light Sources
Chair: Y. Lin (CN)
Developing a technical report on the studies on color qualities
other than color fidelity.
Two committees in CIE on Color Quality
CQS is included in TC 1-91 draft.
TC1-91 report will not recommend a color-preference metric.

40 IALD Enlighten Americas 2015
From presentation by Michael Royer at Lightfair 2015
IES TM-30 IES Method for Evaluating Light
Source Color Rendition
New color fidelity metric (using 99 test samples)
Relative gamut area
High CRI
sources do not
have much
design flexibility

41 IALD Enlighten Americas 2015
Summary
More preferred lights exist outside current standards. CRI
unduly penalizes preferred lights.
Lights with chromaticity below Planckian locus (Duv≈ -0.015)
are generally preferred (in all CCT ranges).
ANSI C78.377 WG is considering adding “perception-based”
chromaticity specifications.
Lights with slightly saturated chroma (peak at DC*ab ≈ 5) are
generally preferred. De-saturating lights are not preferred.
A color-preference metric is needed (in addition to color
fidelity metric). Such a work should start in CIE.
Verification of these effects in real applications is desired.


