Download - Neurophysiological basis of MEG/EEG
Jyväskylä Summer School 2013
COM7: Electromagnetic Signals from The Human Brain: Fundamentals and Analysis (TIEJ659)
Neurophysiological basis of MEG/EEG
Lauri Parkkonen
Dept. Biomedical Engineeringand Computational ScienceAalto [email protected]
Elekta OyHelsinki, [email protected]
MEG/EEG signalsMEG/EEG signals
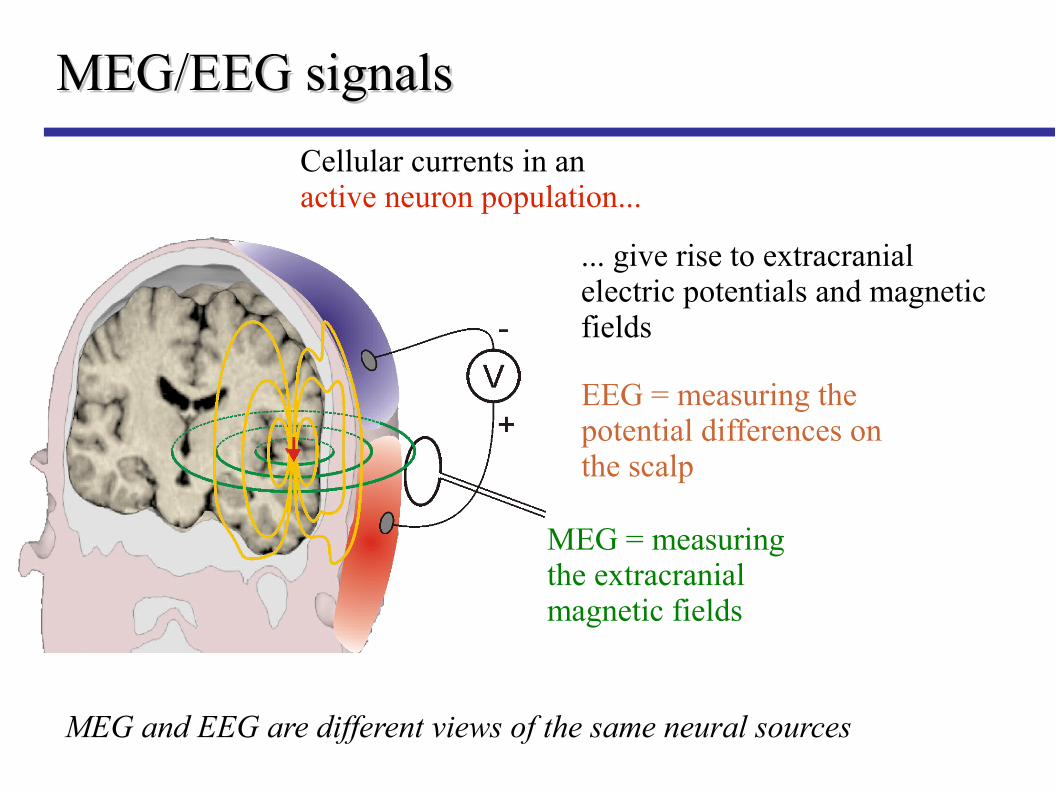
Cellular currents in an active neuron population...
MEG = measuring the extracranial magnetic fields
MEG and EEG are different views of the same neural sources
... give rise to extracranial electric potentials and magnetic fields
EEG = measuring the potential differences on the scalp
The first EEG measurementThe first EEG measurement
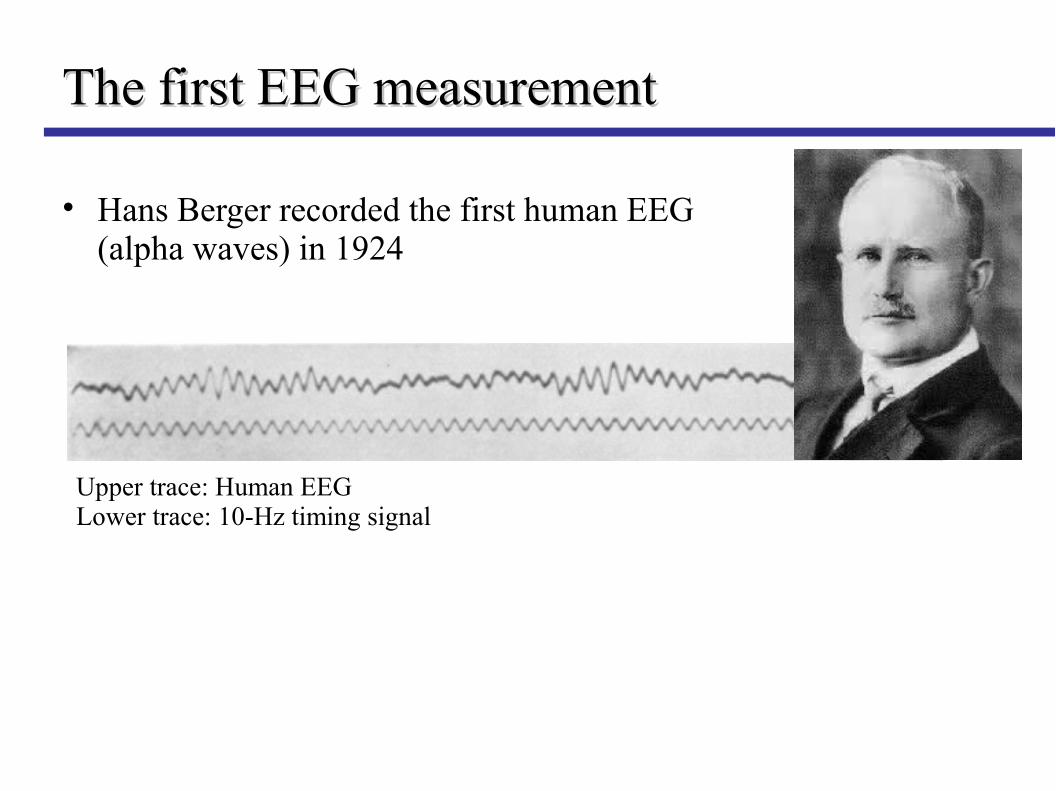
• Hans Berger recorded the first human EEG (alpha waves) in 1924
Upper trace: Human EEGLower trace: 10-Hz timing signal
The first MEG measurementThe first MEG measurement
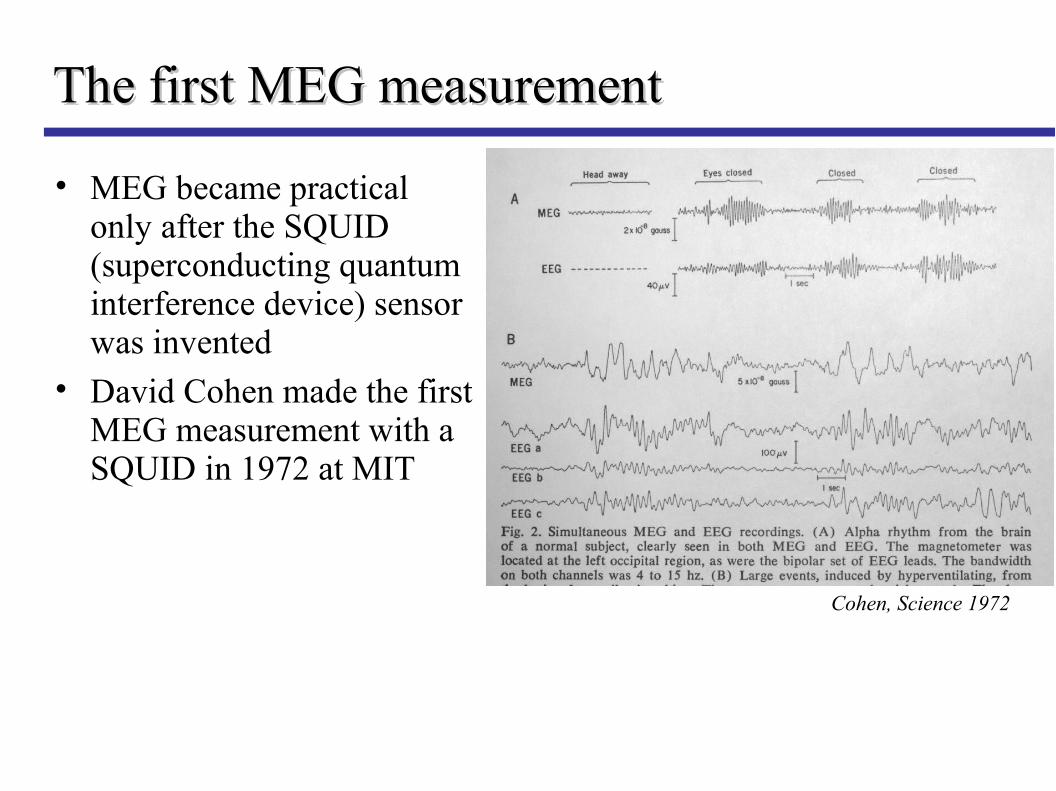
Cohen, Science 1972
• MEG became practical only after the SQUID (superconducting quantum interference device) sensor was invented
• David Cohen made the first MEG measurement with a SQUID in 1972 at MIT
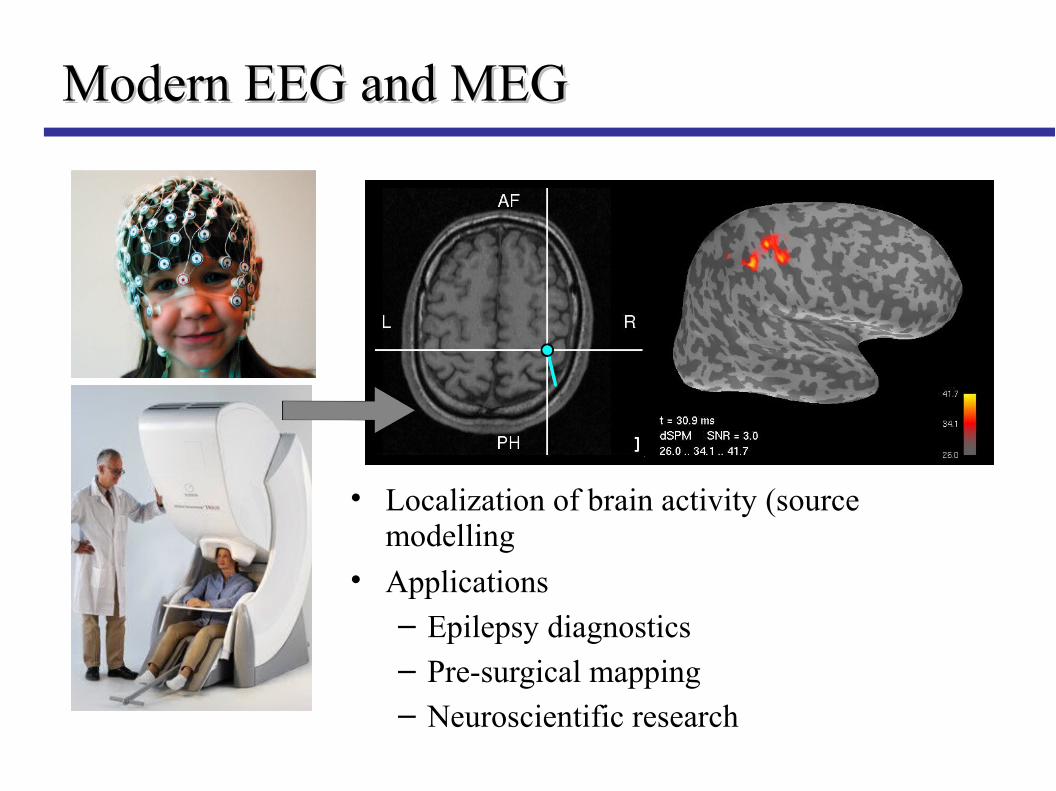
Modern EEG and MEGModern EEG and MEG
• Localization of brain activity (source modelling
• Applications– Epilepsy diagnostics– Pre-surgical mapping– Neuroscientific research
Courtesy of Dr. R. Paetau, Helsinki Univ. Central Hospital
MEG+video recording of an epileptic MEG+video recording of an epileptic seizureseizure
MEG is expensive... why bother?MEG is expensive... why bother?
Measured quantity
MEG/EEG: Electromagnetic fields due neural currents
fMRI: Hemodynamics modulated by neural activity
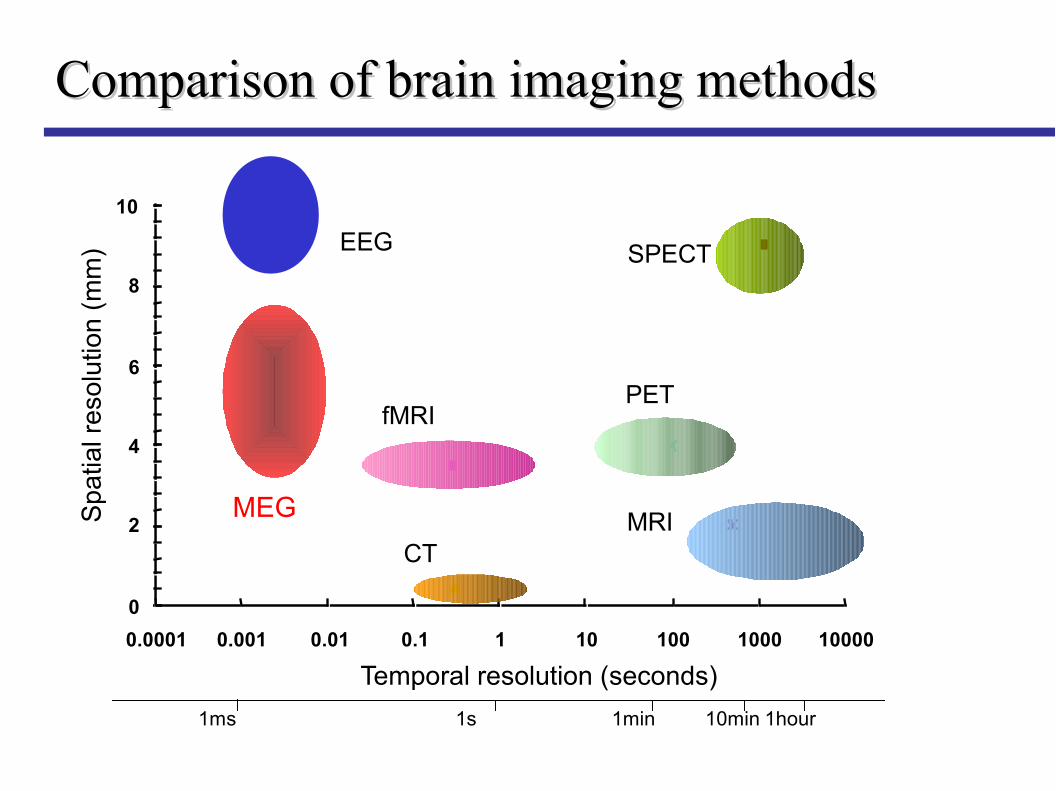
Temporal resolution
MEG & EEG (~1 ms) << fMRI (~1 s)
Spatial resolution
fMRI (~1 mm) < MEG (~1 cm) < EEG (~few cm)
Signal-to-noise ratio
In raw data, comparable among MEG, EEG and fMRI
The niche of MEG: direct measurement of neuronal activity with high temporal resolution and decent spatial resolution
0
2
4
6
8
10
0.0001 0.001 0.01 0.1 1 10 100 1000 10000
??SÔ•ª‰∂”\?i•b?jTemporal resolution (seconds)
Sp
atia
l re
solu
tion
(m
m)
MEG
fMRI
CTMRI
PET
SPECT
1ms 1hour10min1min1s
EEG
Comparison of brain imaging methodsComparison of brain imaging methods
OutlineOutline
Genesis and nature of MEG signals
Instrumentation for MEG
MEG data analysis
(More) examples of neuroscience studies with MEG
The genesis & nature of The genesis & nature of MEG signalsMEG signals
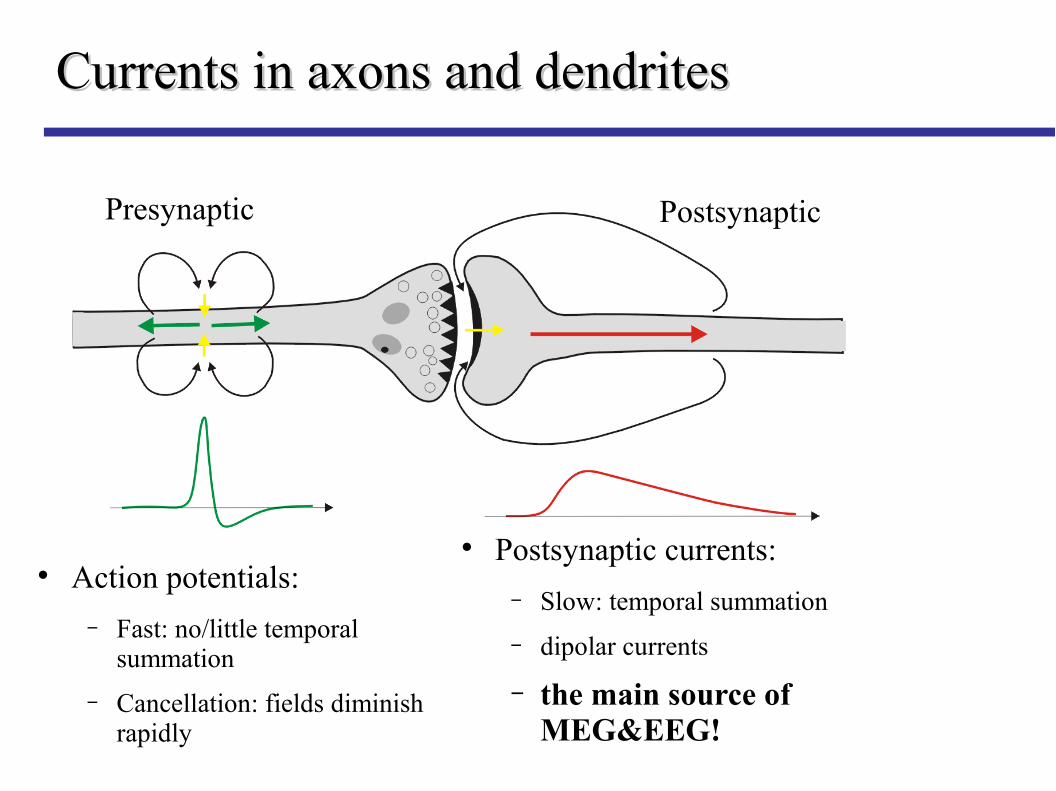
Currents in axons and dendritesCurrents in axons and dendrites
Postsynaptic currents:
− Slow: temporal summation
− dipolar currents
− the main source of MEG&EEG!
Action potentials:
− Fast: no/little temporal summation
− Cancellation: fields diminish rapidly
Presynaptic Postsynaptic
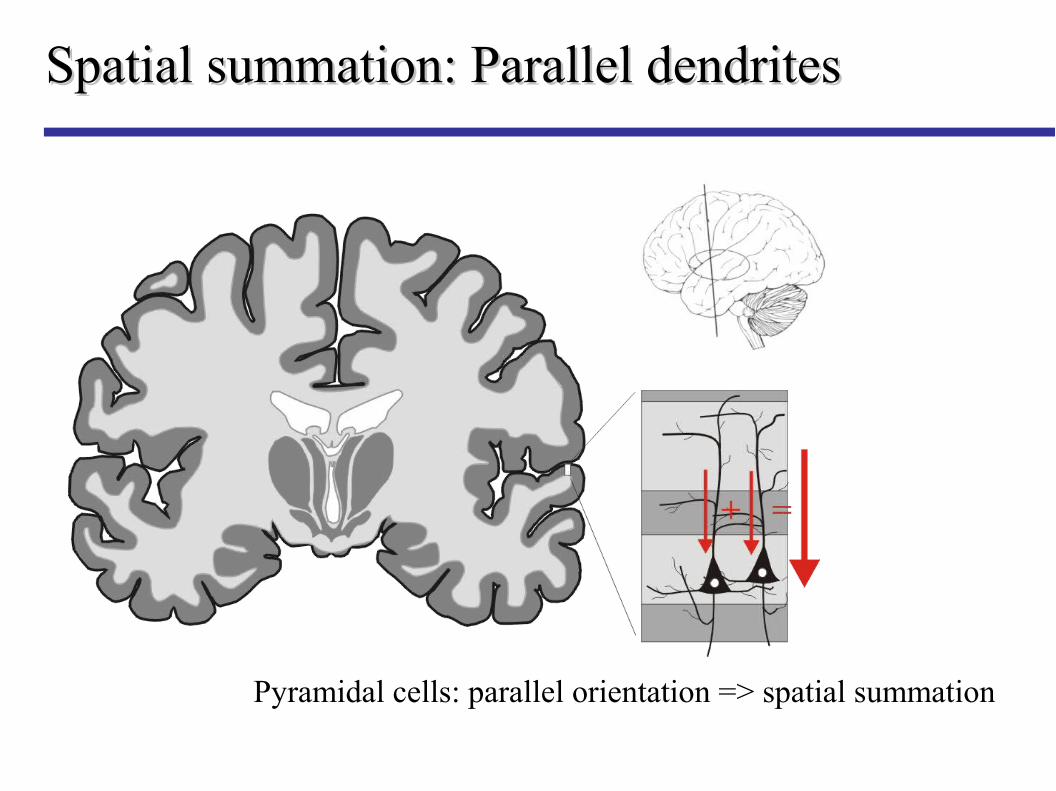
Spatial summation: Parallel dendritesSpatial summation: Parallel dendrites
Pyramidal cells: parallel orientation => spatial summation
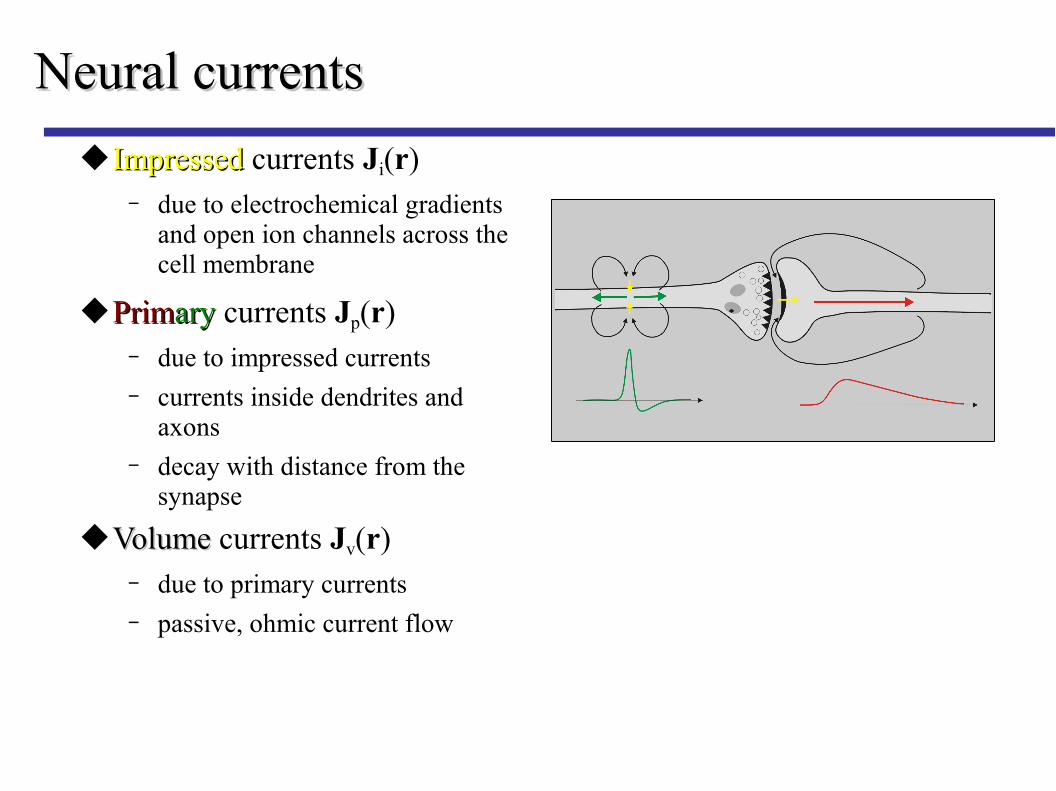
Neural currentsNeural currents
ImpressedImpressed currents Ji(r)− due to electrochemical gradients
and open ion channels across the cell membrane
PrimPrimaryary currents Jp(r)− due to impressed currents− currents inside dendrites and
axons− decay with distance from the
synapse
VolumeVolume currents Jv(r)− due to primary currents− passive, ohmic current flow
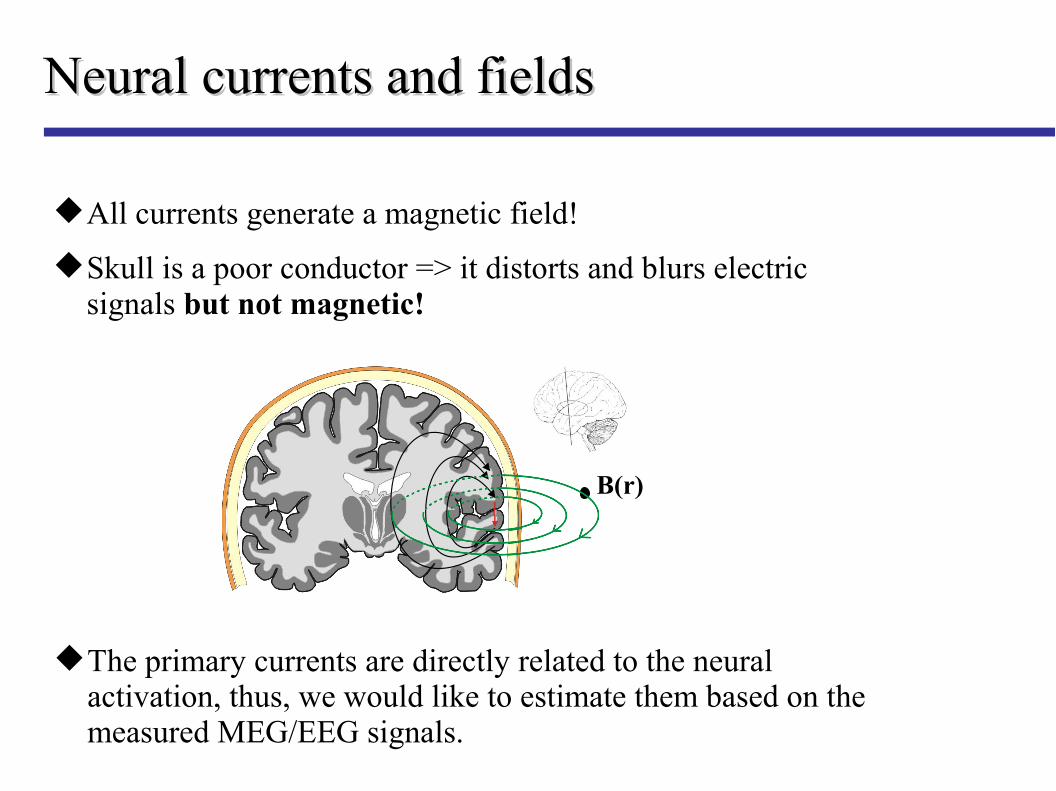
Neural currents and fieldsNeural currents and fields
All currents generate a magnetic field!
Skull is a poor conductor => it distorts and blurs electric signals but not magnetic!
The primary currents are directly related to the neural activation, thus, we would like to estimate them based on the measured MEG/EEG signals.
B(r)
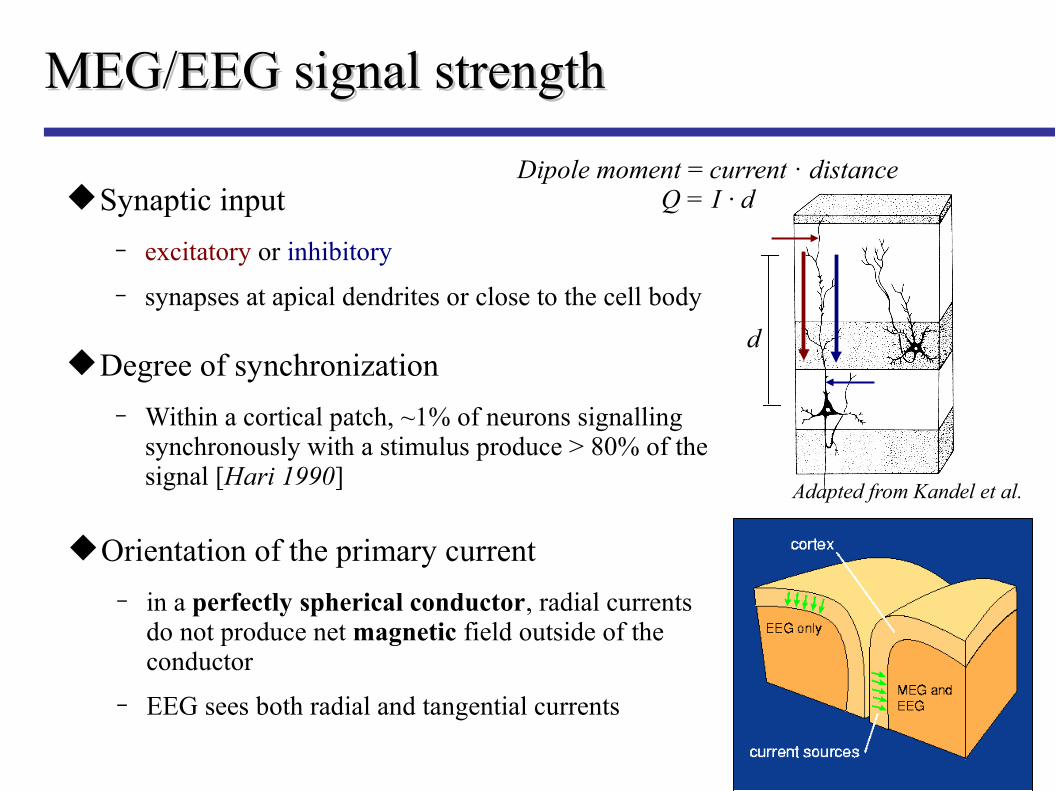
MEG/EEG signal strengthMEG/EEG signal strength
Synaptic input
− excitatory or inhibitory
− synapses at apical dendrites or close to the cell body
Orientation of the primary current
− in a perfectly spherical conductor, radial currents do not produce net magnetic field outside of the conductor
− EEG sees both radial and tangential currents
Degree of synchronization
− Within a cortical patch, ~1% of neurons signalling synchronously with a stimulus produce > 80% of the signal [Hari 1990]
Dipole moment = current · distanceQ = I · d
d
Adapted from Kandel et al.
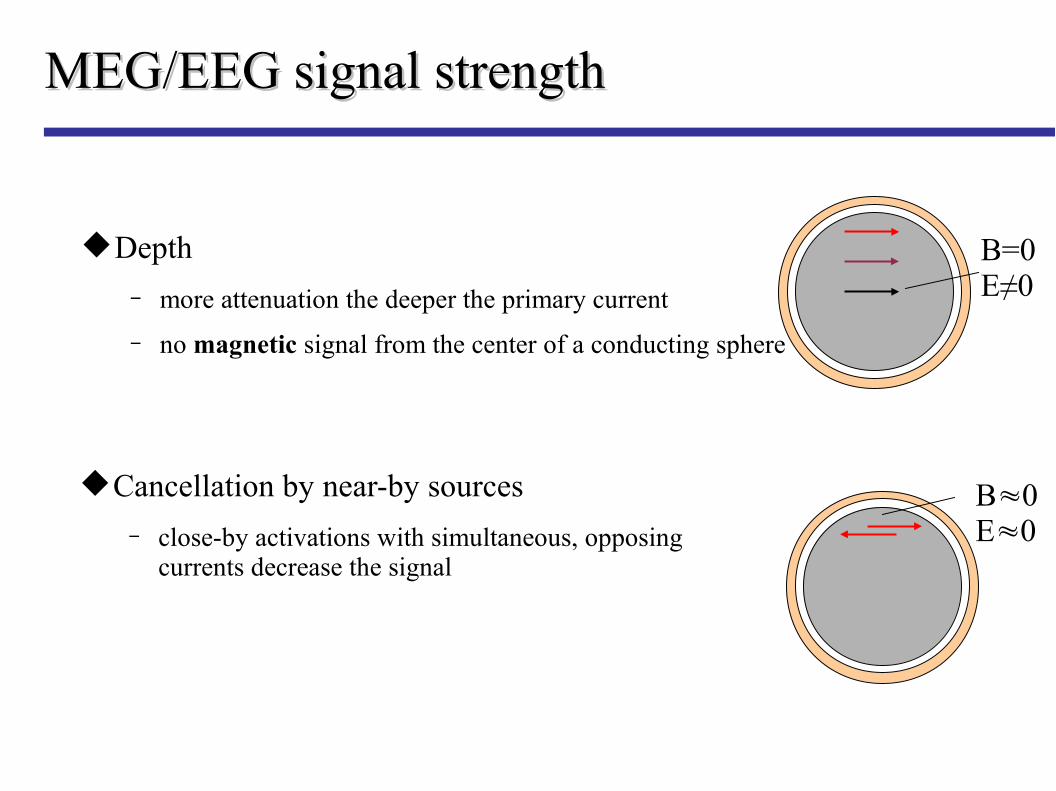
MEG/EEG signal strengthMEG/EEG signal strength
Depth
− more attenuation the deeper the primary current
− no magnetic signal from the center of a conducting sphere
B=0E≠0
B≈0E≈0
Cancellation by near-by sources
− close-by activations with simultaneous, opposing currents decrease the signal
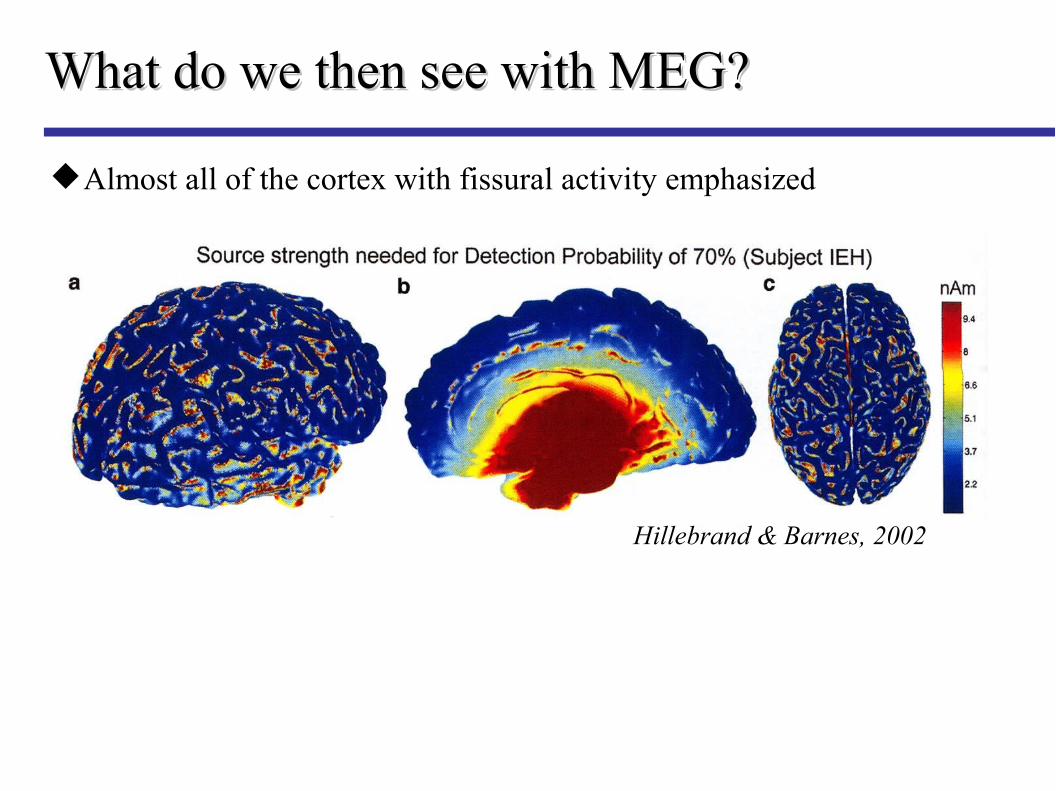
What do we then see with MEG?What do we then see with MEG?
Almost all of the cortex with fissural activity emphasized
Hillebrand & Barnes, 2002
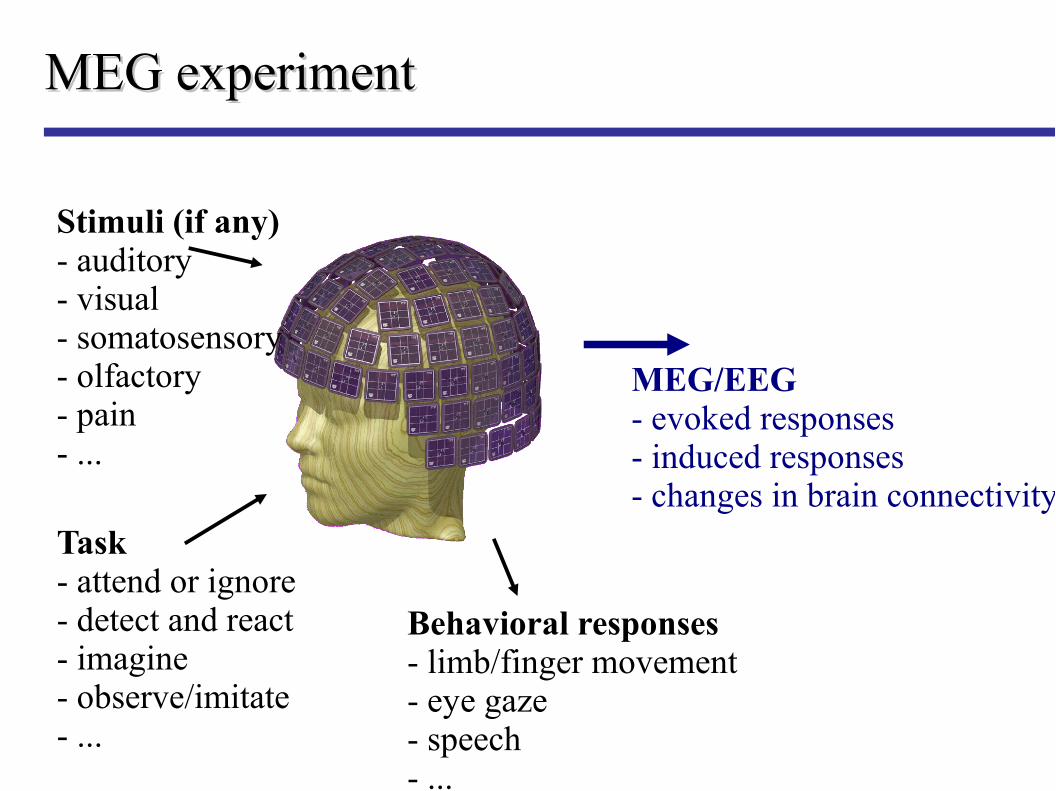
MEG experimentMEG experiment
Stimuli (if any)- auditory- visual- somatosensory- olfactory- pain- ...
Task- attend or ignore- detect and react- imagine- observe/imitate- ...
Behavioral responses- limb/finger movement- eye gaze- speech- ...
MEG/EEG- evoked responses- induced responses- changes in brain connectivity
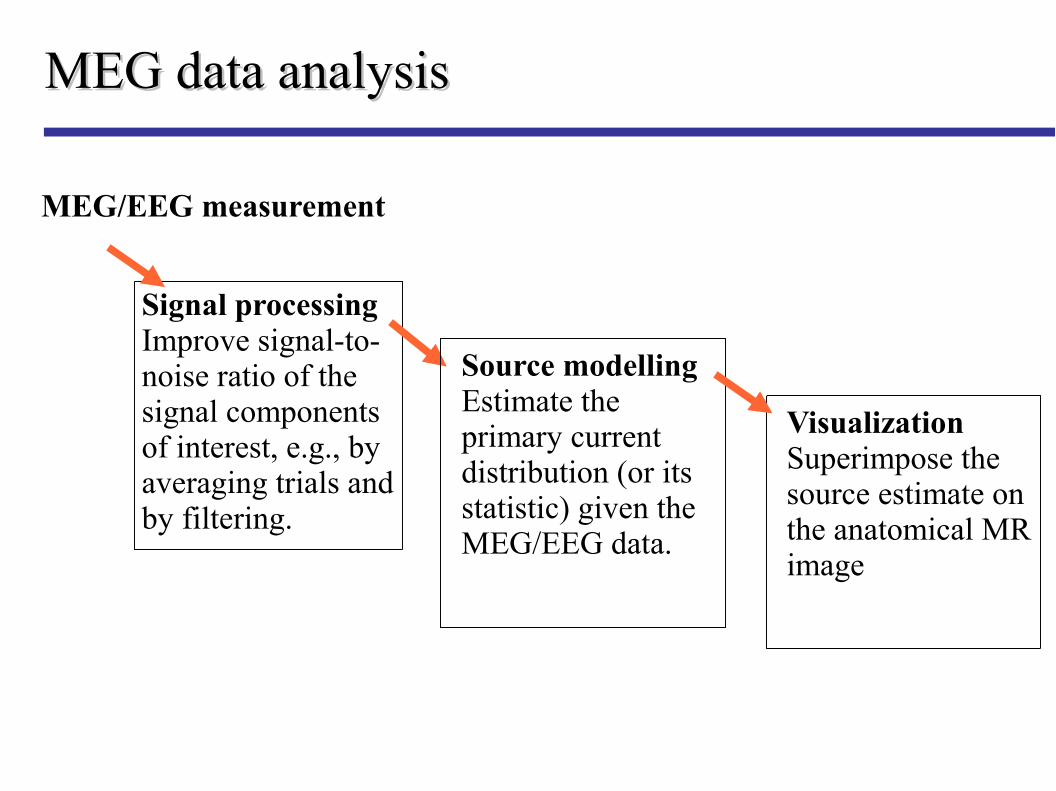
MEG data analysisMEG data analysis
VisualizationSuperimpose the source estimate on the anatomical MR image
Signal processingImprove signal-to-noise ratio of the signal components of interest, e.g., by averaging trials and by filtering.
Source modellingEstimate the primary currentdistribution (or its statistic) given the MEG/EEG data.
MEG/EEG measurement
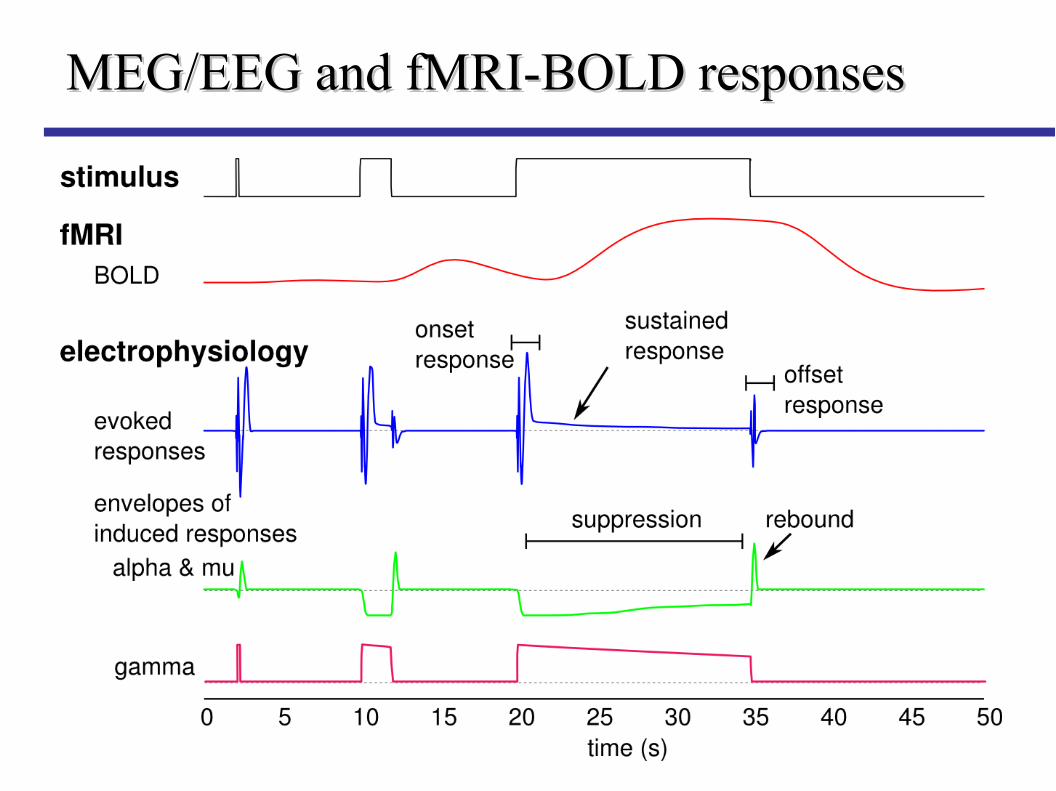
MEG/EEG and fMRI-BOLD responsesMEG/EEG and fMRI-BOLD responses
Evoked responsesEvoked responses
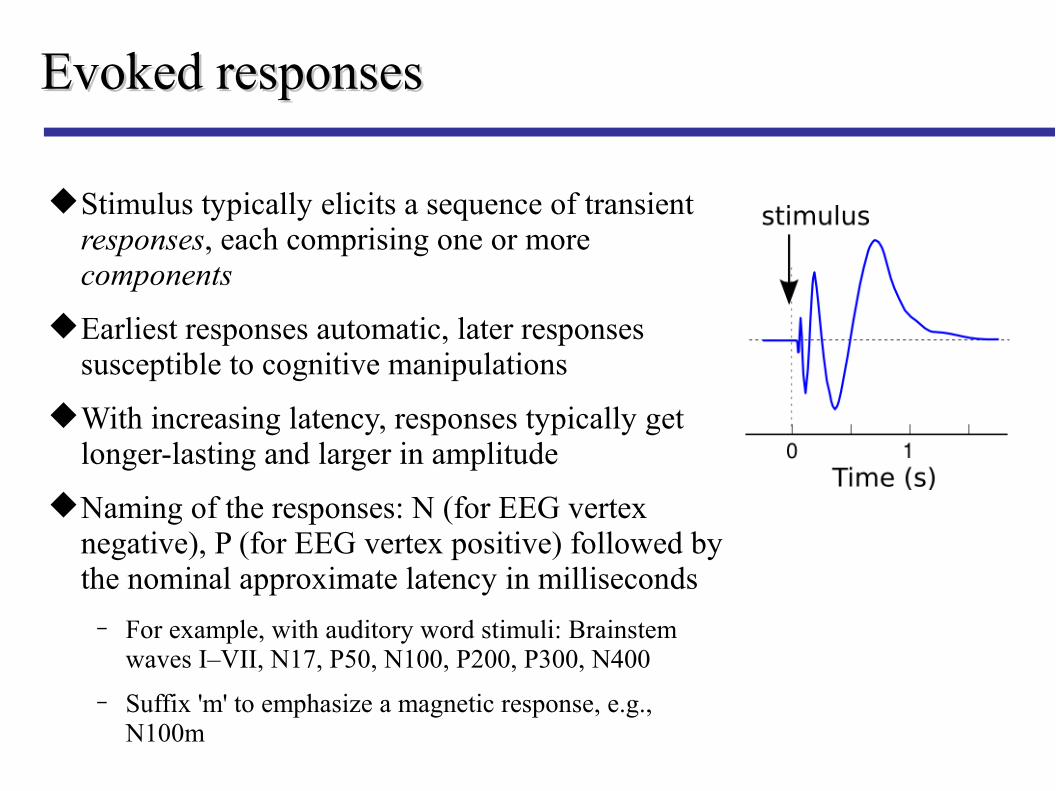
Stimulus typically elicits a sequence of transient responses, each comprising one or more components
Earliest responses automatic, later responses susceptible to cognitive manipulations
With increasing latency, responses typically get longer-lasting and larger in amplitude
Naming of the responses: N (for EEG vertex negative), P (for EEG vertex positive) followed by the nominal approximate latency in milliseconds
− For example, with auditory word stimuli: Brainstem waves I–VII, N17, P50, N100, P200, P300, N400
− Suffix 'm' to emphasize a magnetic response, e.g., N100m
Evoked responses: AveragingEvoked responses: Averaging
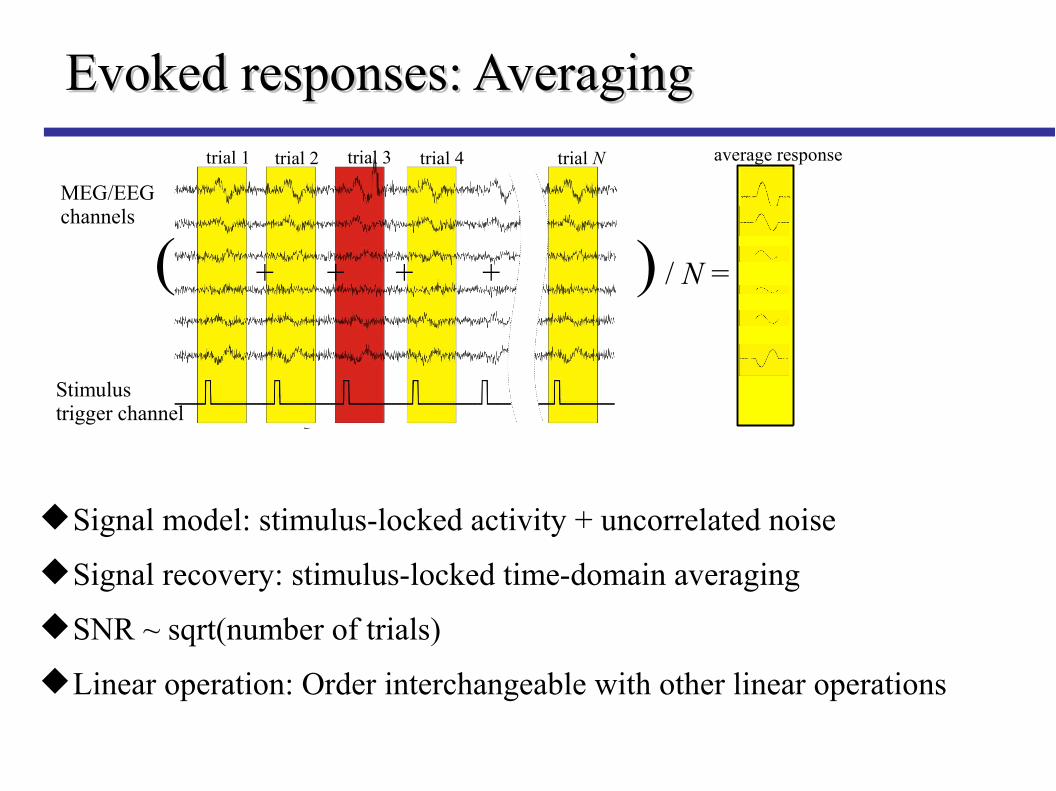
Stimulustrigger channel
MEG/EEGchannels
trial 1 trial 2 trial 3 trial 4 trial N
+ + + +
Signal model: stimulus-locked activity + uncorrelated noise
Signal recovery: stimulus-locked time-domain averaging
SNR ~ sqrt(number of trials)
Linear operation: Order interchangeable with other linear operations
average response
( ) / N =
Evoked responses: Evoked responses: Timing/synchronization mattersTiming/synchronization matters
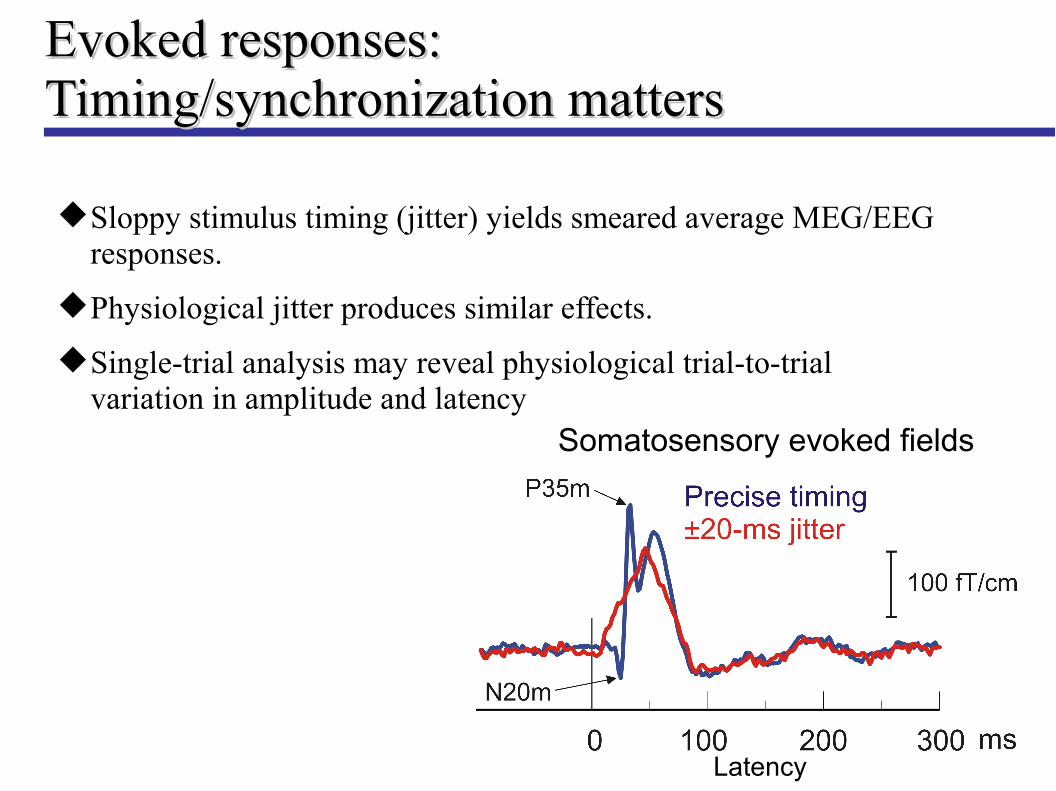
Sloppy stimulus timing (jitter) yields smeared average MEG/EEG responses.
Physiological jitter produces similar effects.
Single-trial analysis may reveal physiological trial-to-trial variation in amplitude and latency
Somatosensory evoked fields
Latency
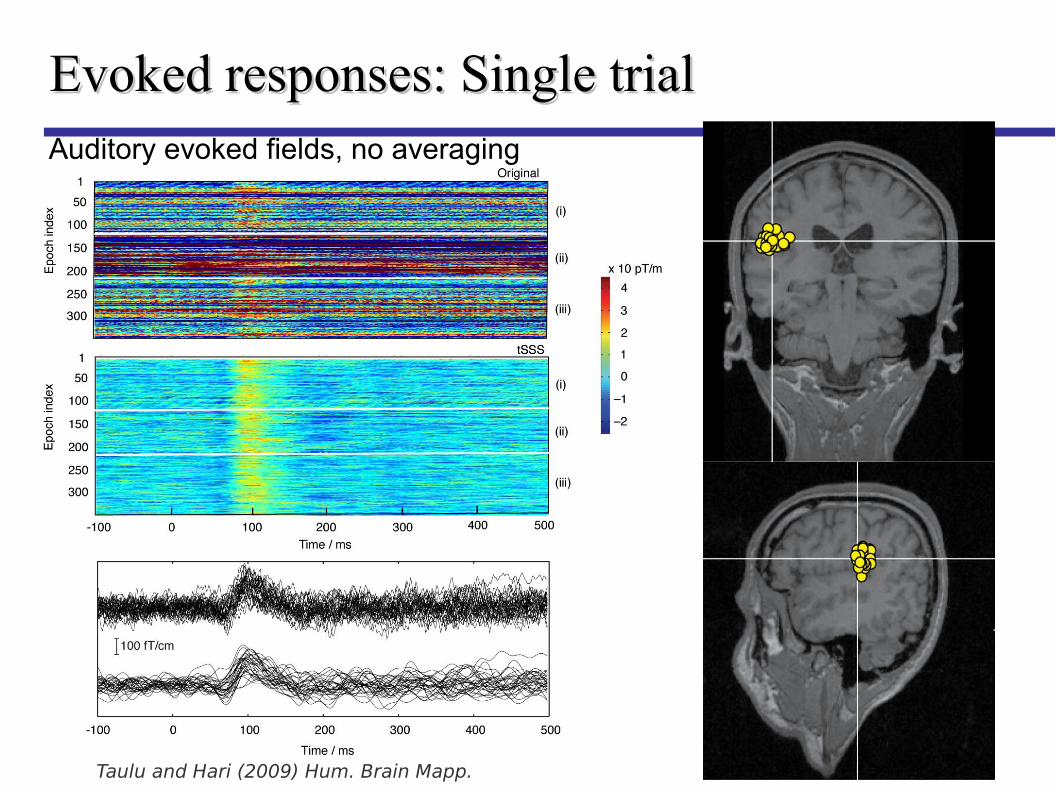
Evoked responses: Single trialEvoked responses: Single trial
Taulu and Hari (2009) Hum. Brain Mapp.
Auditory evoked fields, no averaging
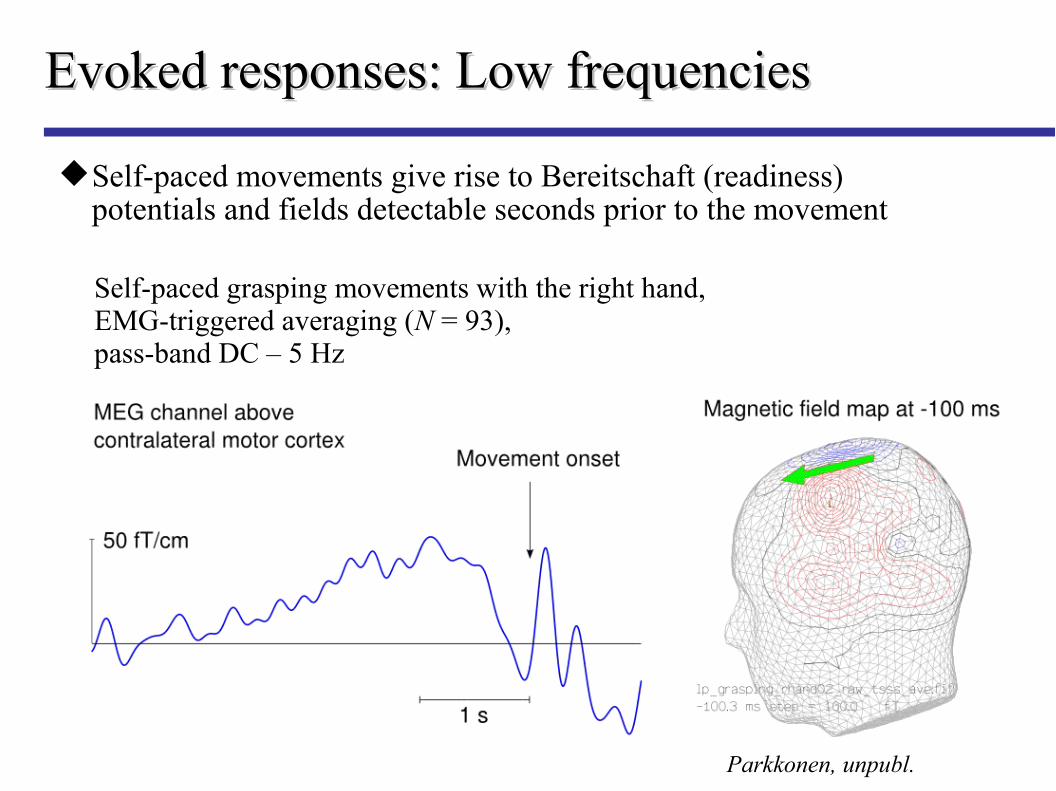
Evoked responses: Low frequenciesEvoked responses: Low frequencies
Self-paced movements give rise to Bereitschaft (readiness) potentials and fields detectable seconds prior to the movement
Self-paced grasping movements with the right hand,EMG-triggered averaging (N = 93),pass-band DC – 5 Hz
Parkkonen, unpubl.
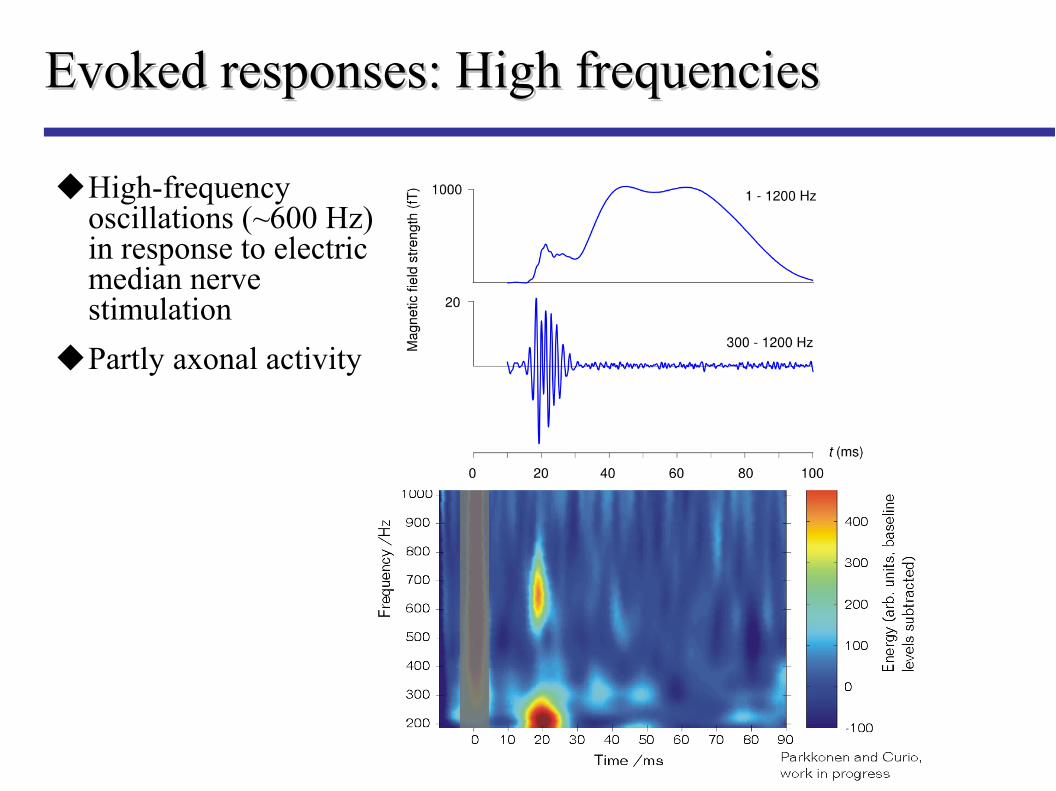
Evoked responses: High frequenciesEvoked responses: High frequencies
The high-frequencycomponent: signalsup to 900 Hz
High-frequency oscillations (~600 Hz) in response to electric median nerve stimulation
Partly axonal activity
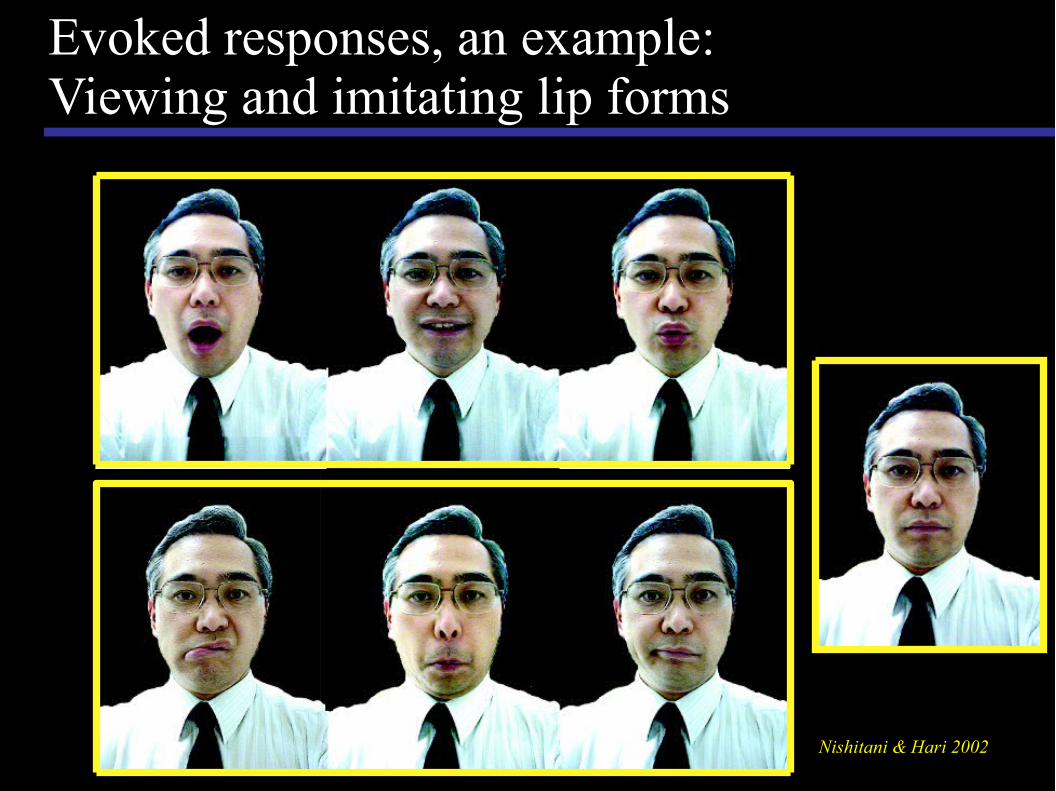
Evoked responses, an example:Evoked responses, an example:Viewing and imitating lip formsViewing and imitating lip forms
Nishitani & Hari 2002
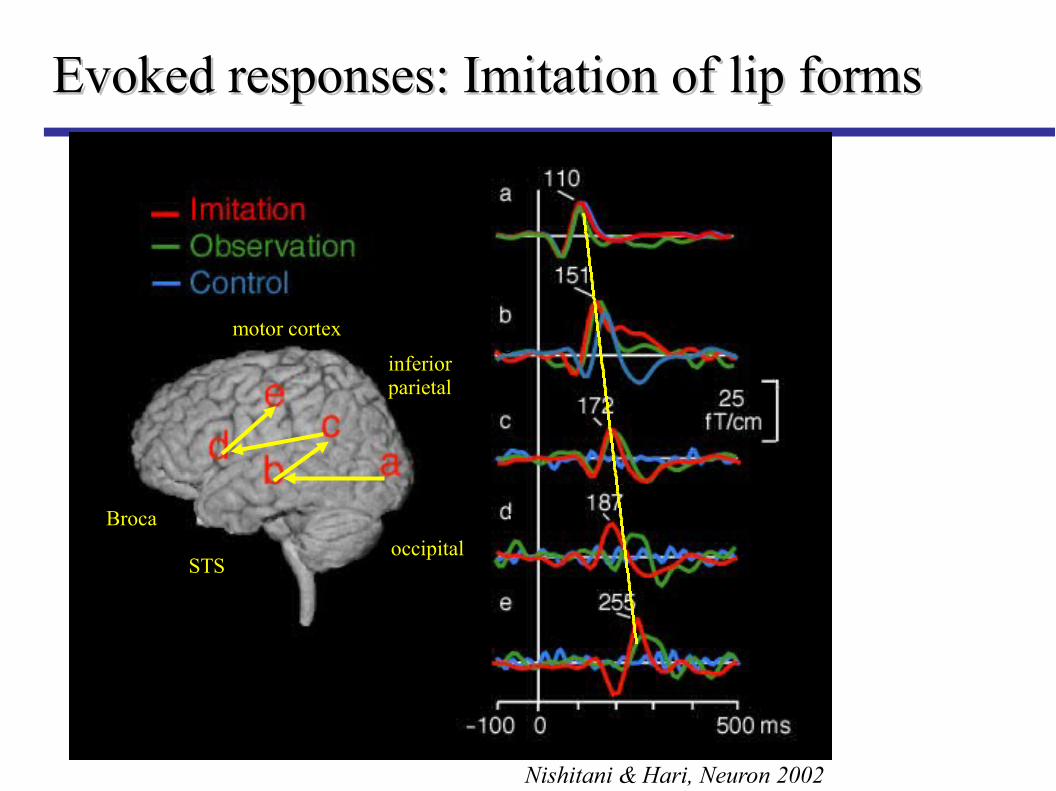
occipitalSTS
inferior parietal
Broca
motor cortex
a
b
d
e
Nishitani & Hari, Neuron 2002
Evoked responses: Imitation of lip formsEvoked responses: Imitation of lip forms
Induced responsesInduced responses
Stimulus/task modulates the amplitude of an oscillatory signal
The oscillation is not phase-locked to the stimulus
– Trial averaging destroys the response rather than improves the SNR unless phase information is removed
Induced responses (cont'd)Induced responses (cont'd)
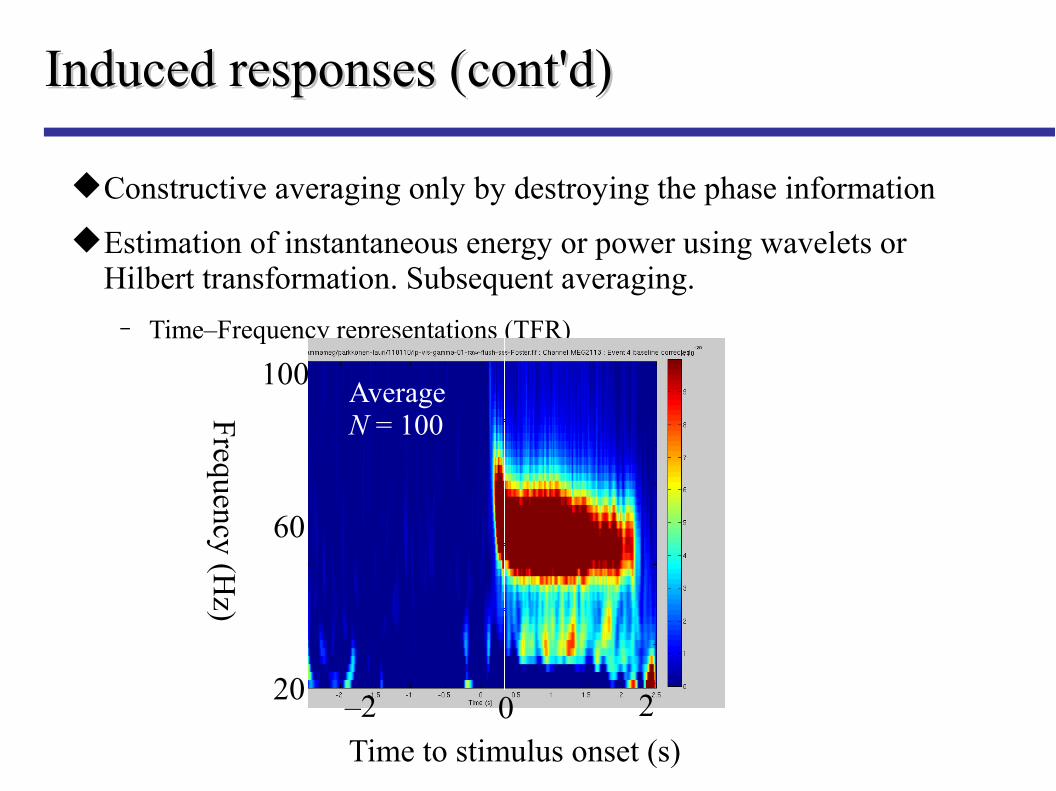
Constructive averaging only by destroying the phase information
Estimation of instantaneous energy or power using wavelets or Hilbert transformation. Subsequent averaging.
− Time–Frequency representations (TFR)
AverageN = 100
20
100
60
Frequency (H
z)
Time to stimulus onset (s)0 2–2
Single trialN = 1
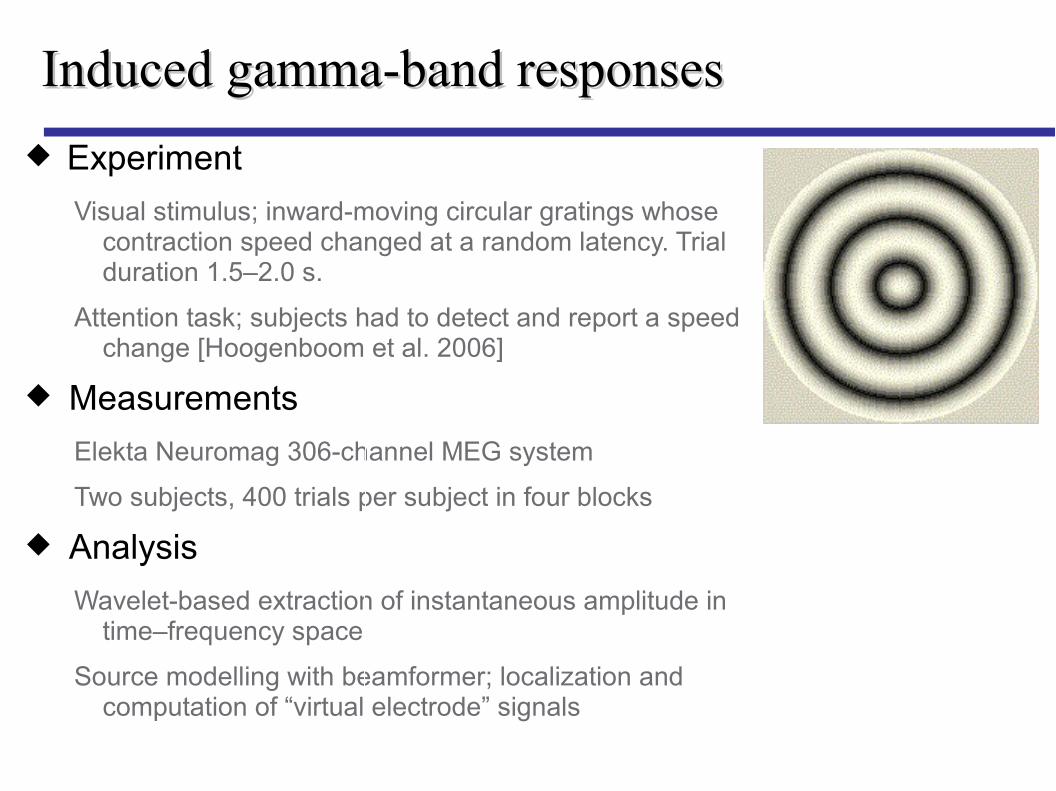
Experiment
Visual stimulus; inward-moving circular gratings whose contraction speed changed at a random latency. Trial duration 1.5–2.0 s.
Attention task; subjects had to detect and report a speed change [Hoogenboom et al. 2006]
Measurements
Elekta Neuromag 306-channel MEG system
Two subjects, 400 trials per subject in four blocks
Analysis
Wavelet-based extraction of instantaneous amplitude in time–frequency space
Source modelling with beamformer; localization and computation of “virtual electrode” signals
Induced gamma-band responsesInduced gamma-band responses
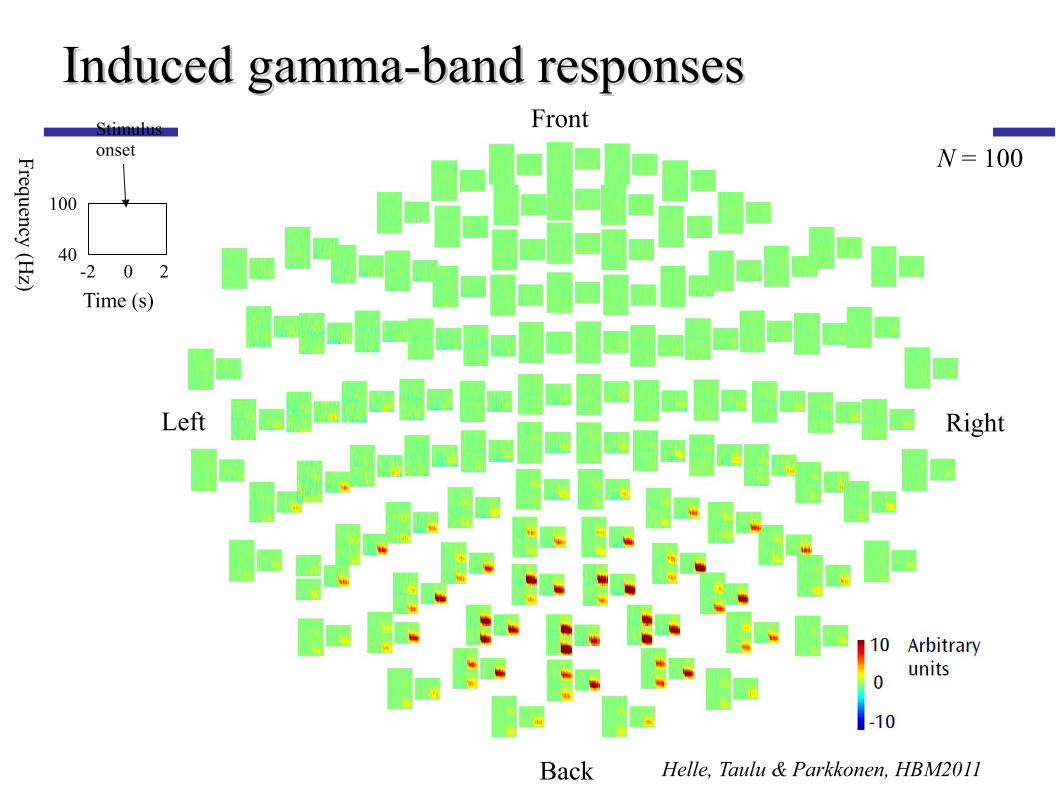
Helle, Taulu & Parkkonen, HBM2011
N = 100
-2 0 2
Time (s)
40
100
Frequency (H
z)
Back
Front
RightLeft
Stimulusonset
Induced gamma-band responsesInduced gamma-band responses

Beamforming
Filtering to 55–80 Hz
Dual-state construct (baseline vs. active)
Scanning of the entire cranial volume
Subject 1
Subject 2
Helle, Taulu & Parkkonen, HBM2011
Gamma-band responses: Neural sourcesGamma-band responses: Neural sources
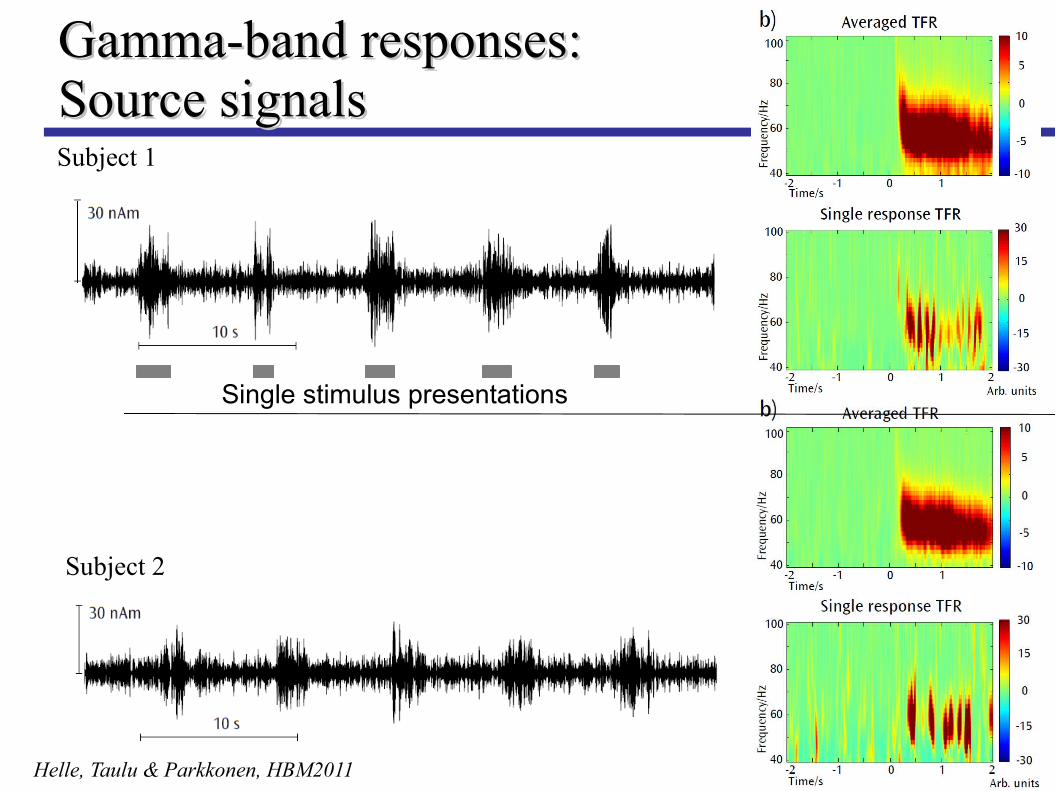
Subject 1
Subject 2
Helle, Taulu & Parkkonen, HBM2011
Single stimulus presentations
Gamma-band responses: Gamma-band responses: Source signalsSource signals
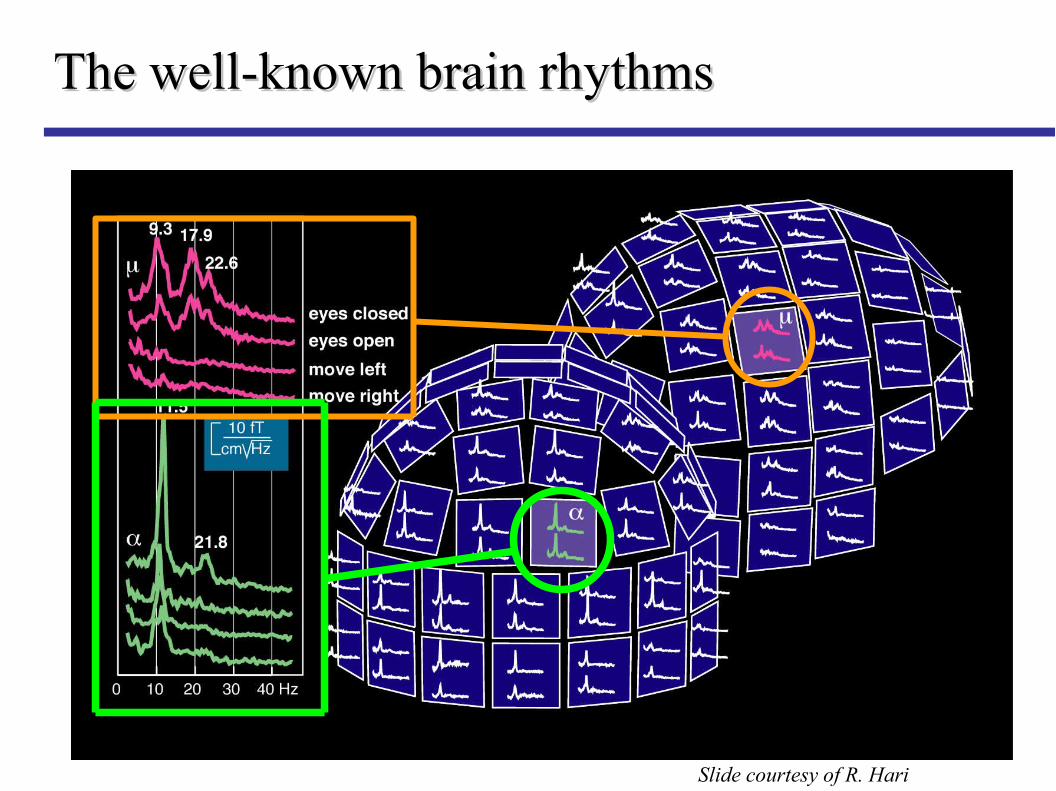
The well-known brain rhythmsThe well-known brain rhythms
Slide courtesy of R. Hari
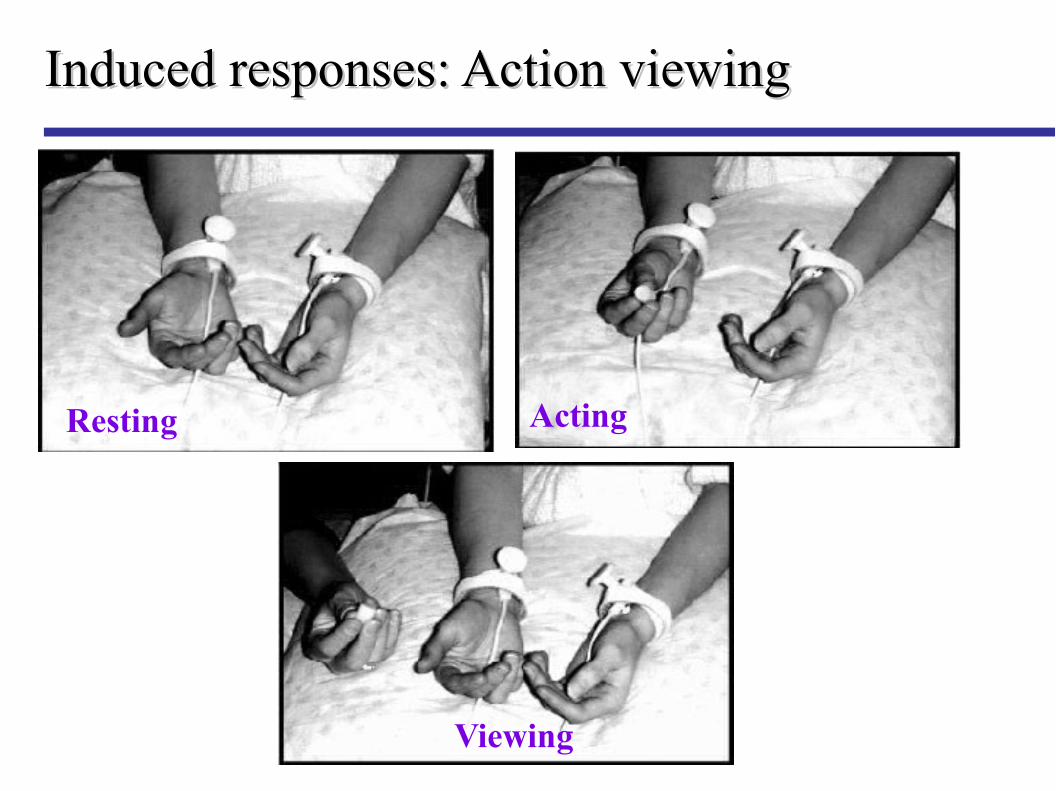
Induced responses: Action viewingInduced responses: Action viewing
Resting Acting
Viewing
Right mediannerve
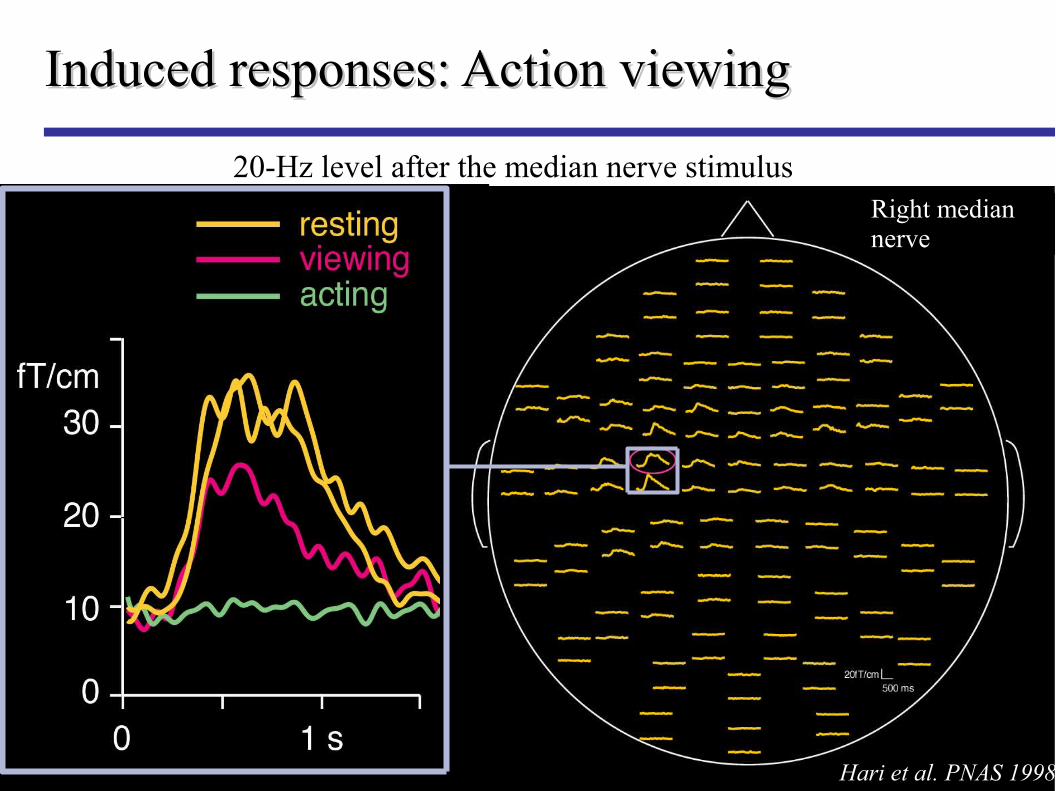
Hari et al. PNAS 1998
Induced responses: Action viewingInduced responses: Action viewing
20-Hz level after the median nerve stimulus
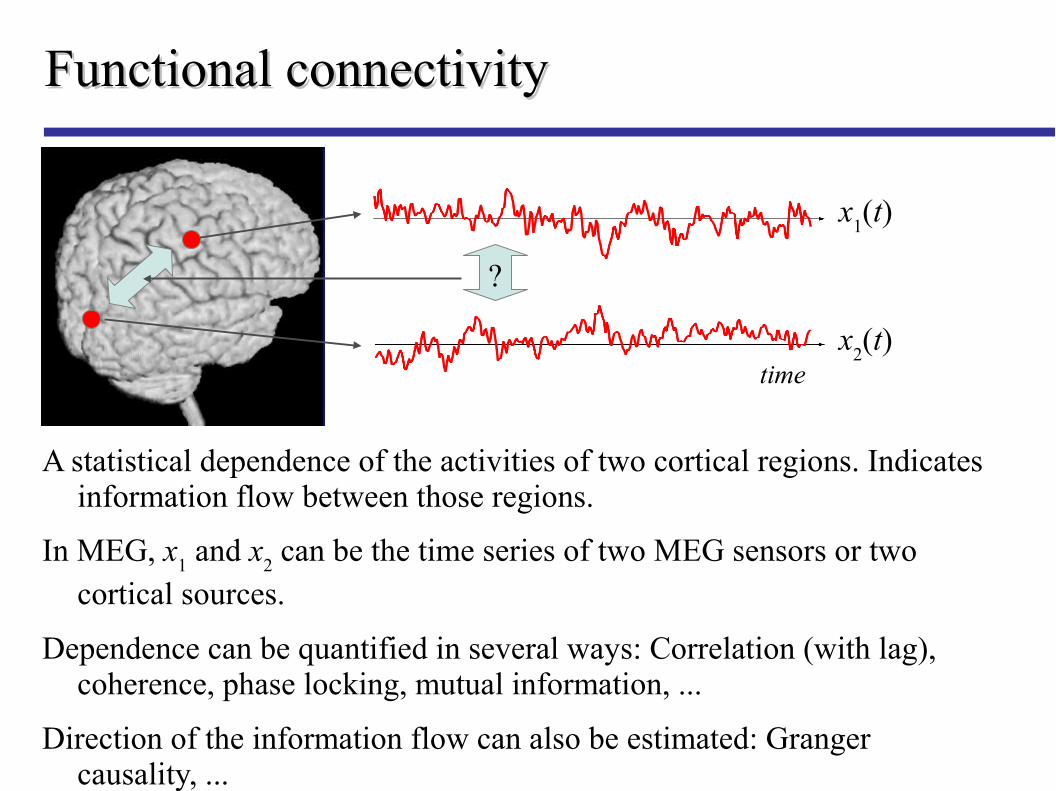
Functional connectivityFunctional connectivity
A statistical dependence of the activities of two cortical regions. Indicates information flow between those regions.
In MEG, x1 and x
2 can be the time series of two MEG sensors or two
cortical sources.
Dependence can be quantified in several ways: Correlation (with lag), coherence, phase locking, mutual information, ...
Direction of the information flow can also be estimated: Granger causality, ...
?
x1(t)
timex
2(t)
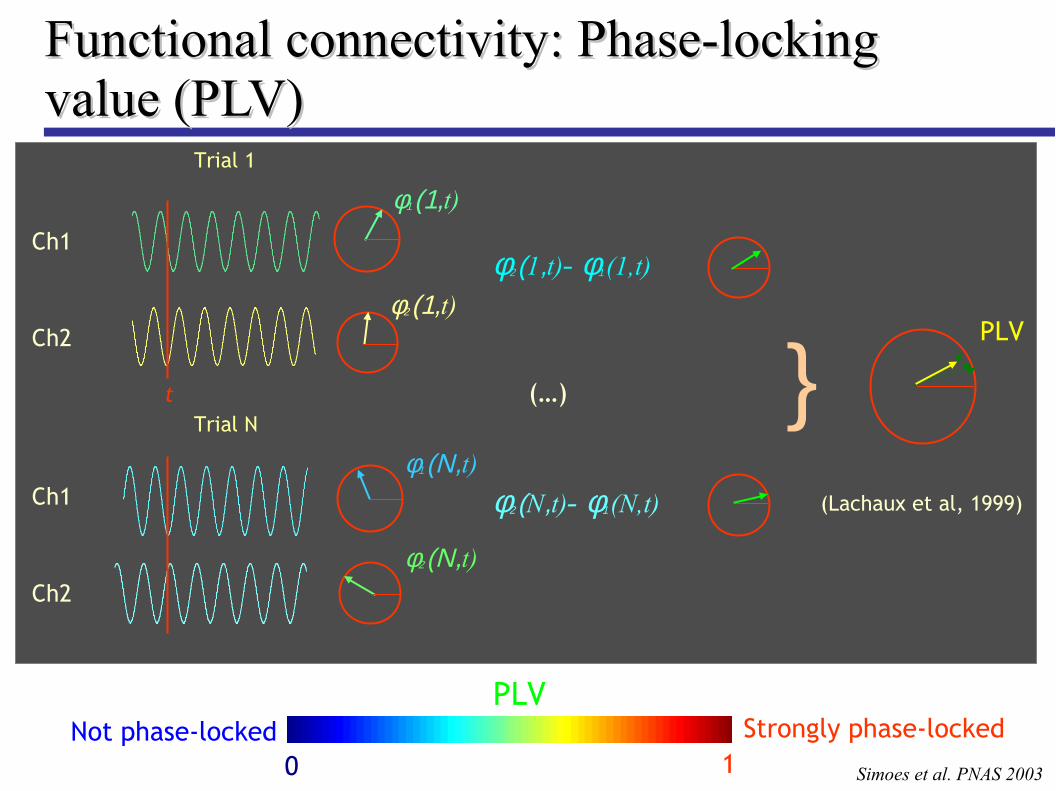
φ2 (1,t)- φ1 (1,t)
(…)
Ch2
Ch1
Trial 1
φ1 (1,t)
φ2 (1,t)
tTrial N
Ch2
Ch1φ1 (Ν,t)
φ2 (Ν,t)
φ2 (N,t)- φ1 (N,t)
}PLV
(Lachaux et al, 1999)
PLV
0Not phase-locked
1Strongly phase-locked
Simoes et al. PNAS 2003
Functional connectivity: Phase-locking Functional connectivity: Phase-locking value (PLV)value (PLV)
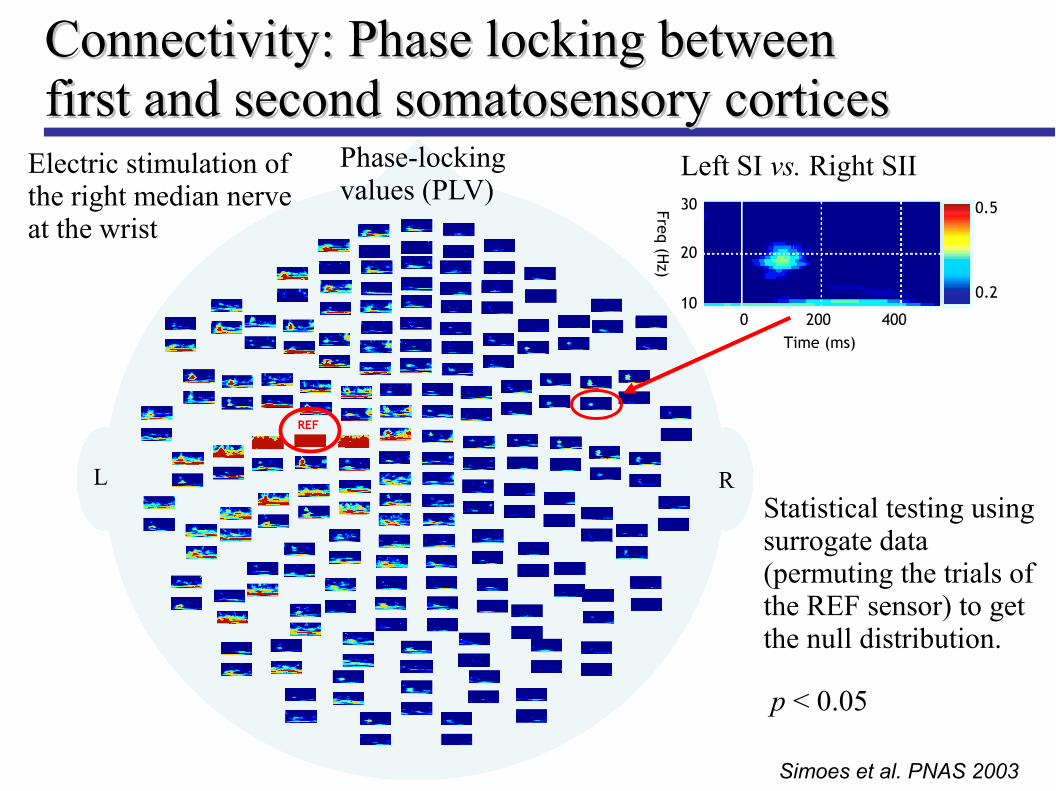
REF
Left SI vs. Right SII
0 200 40010
20
30
Time (ms)
Freq (Hz)
0.2
0.5
p < 0.05
Simoes et al. PNAS 2003
Connectivity: Phase locking between Connectivity: Phase locking between first and second somatosensory corticesfirst and second somatosensory cortices
Phase-lockingvalues (PLV)
Electric stimulation of the right median nerve at the wrist
RLStatistical testing using surrogate data (permuting the trials of the REF sensor) to get the null distribution.
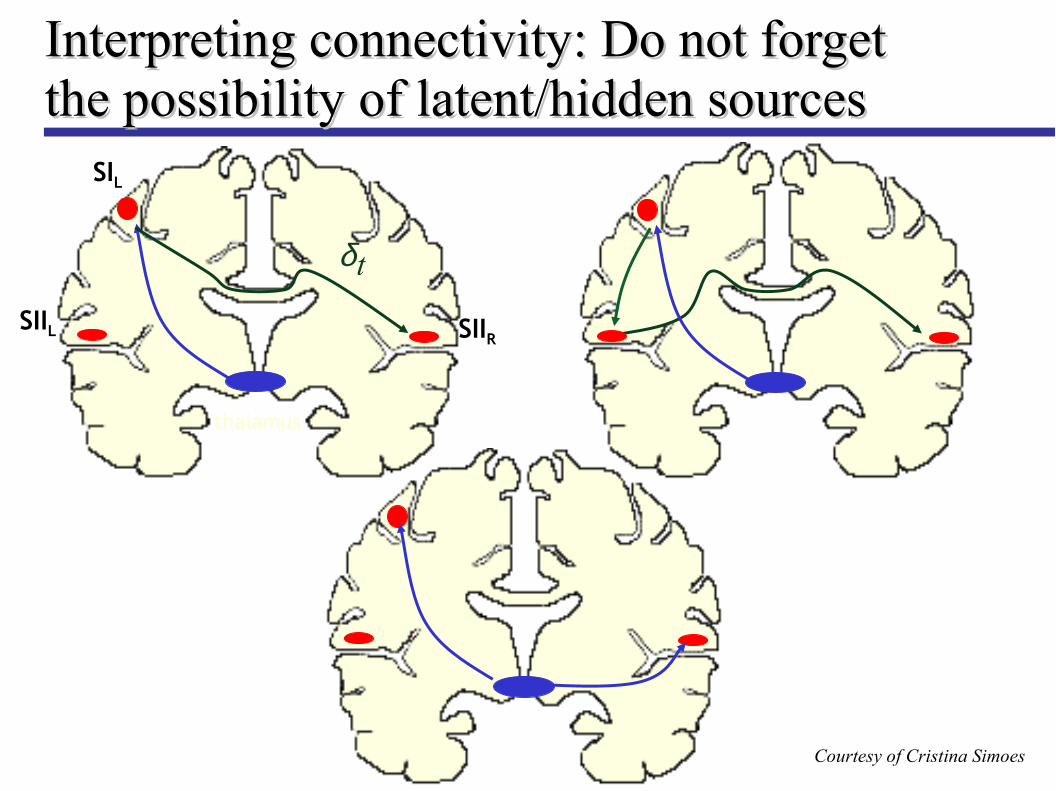
SIL
SIIL SIIR
thalamus
δt
Courtesy of Cristina Simoes
SIIR
Interpreting connectivity: Do not forget Interpreting connectivity: Do not forget the possibility of latent/hidden sourcesthe possibility of latent/hidden sources
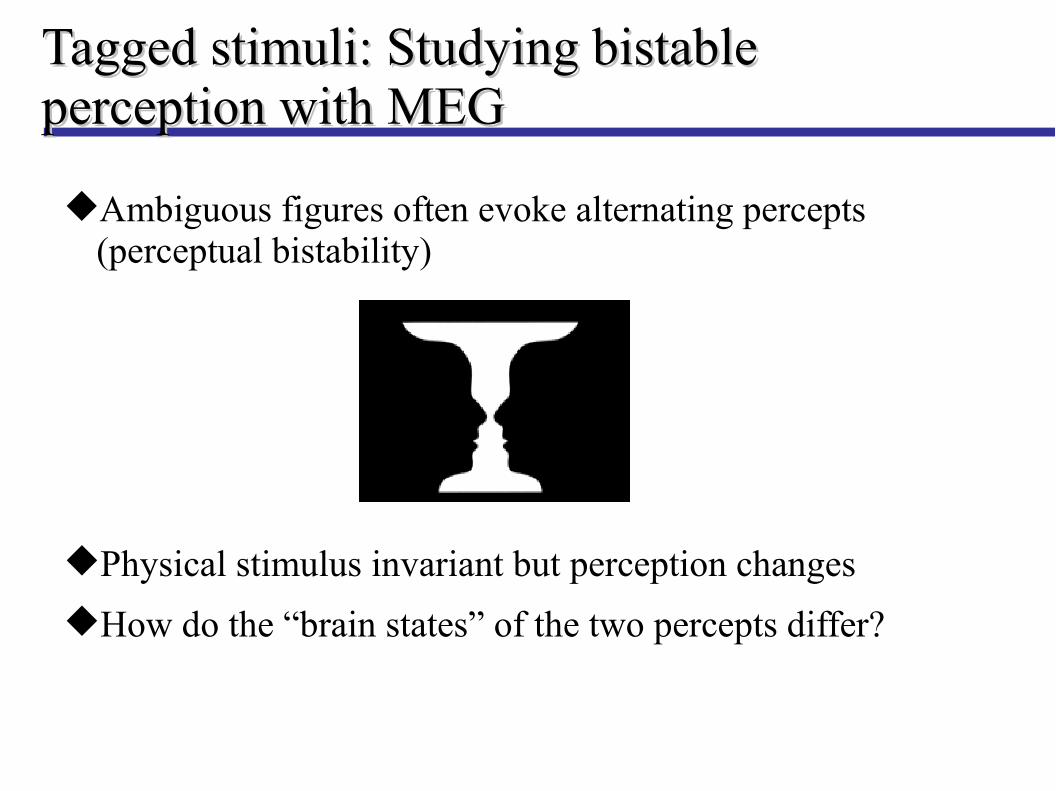
Tagged stimuli: Studying bistable Tagged stimuli: Studying bistable perception with MEGperception with MEG
Ambiguous figures often evoke alternating percepts (perceptual bistability)
Physical stimulus invariant but perception changes
How do the “brain states” of the two percepts differ?
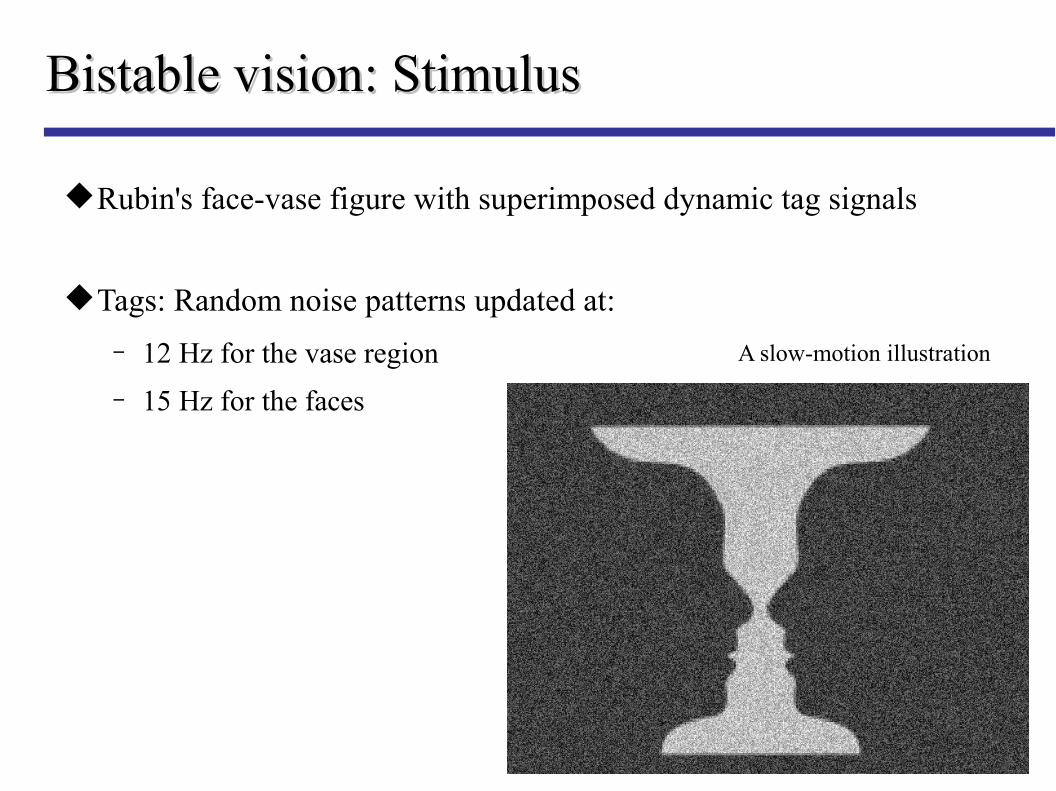
Bistable vision: StimulusBistable vision: Stimulus
Rubin's face-vase figure with superimposed dynamic tag signals
Tags: Random noise patterns updated at:
− 12 Hz for the vase region
− 15 Hz for the faces
A slow-motion illustration
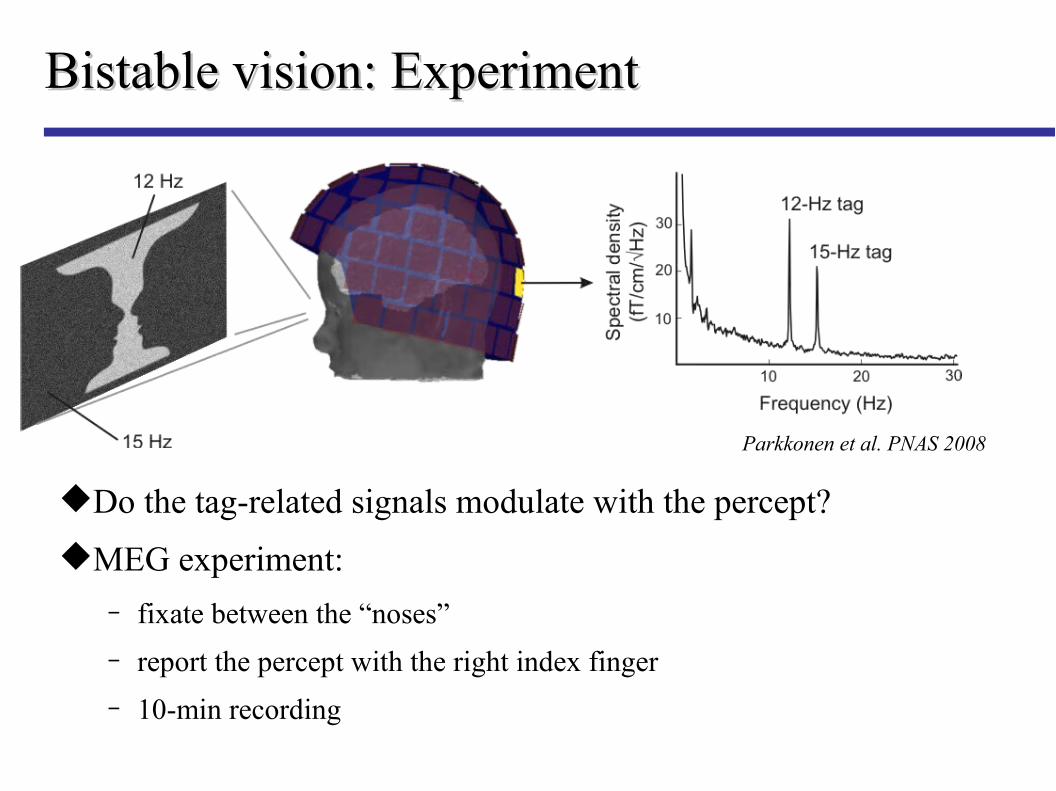
Bistable vision: ExperimentBistable vision: Experiment
Do the tag-related signals modulate with the percept?
MEG experiment:
− fixate between the “noses”
− report the percept with the right index finger
− 10-min recording
Parkkonen et al. PNAS 2008
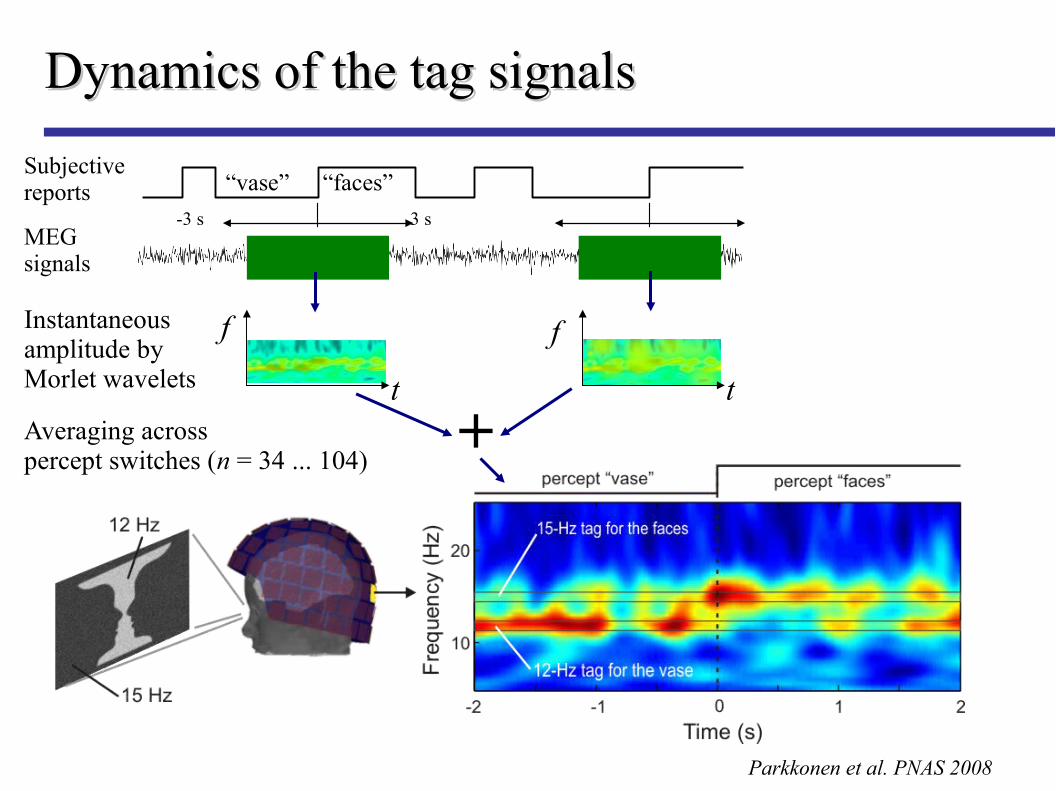
Dynamics of the tag signalsDynamics of the tag signals
Subjectivereports
MEGsignals
“vase” “faces”
-3 s 3 s
tt
Instantaneousamplitude byMorlet wavelets
f f
+Averaging acrosspercept switches (n = 34 ... 104)
Parkkonen et al. PNAS 2008
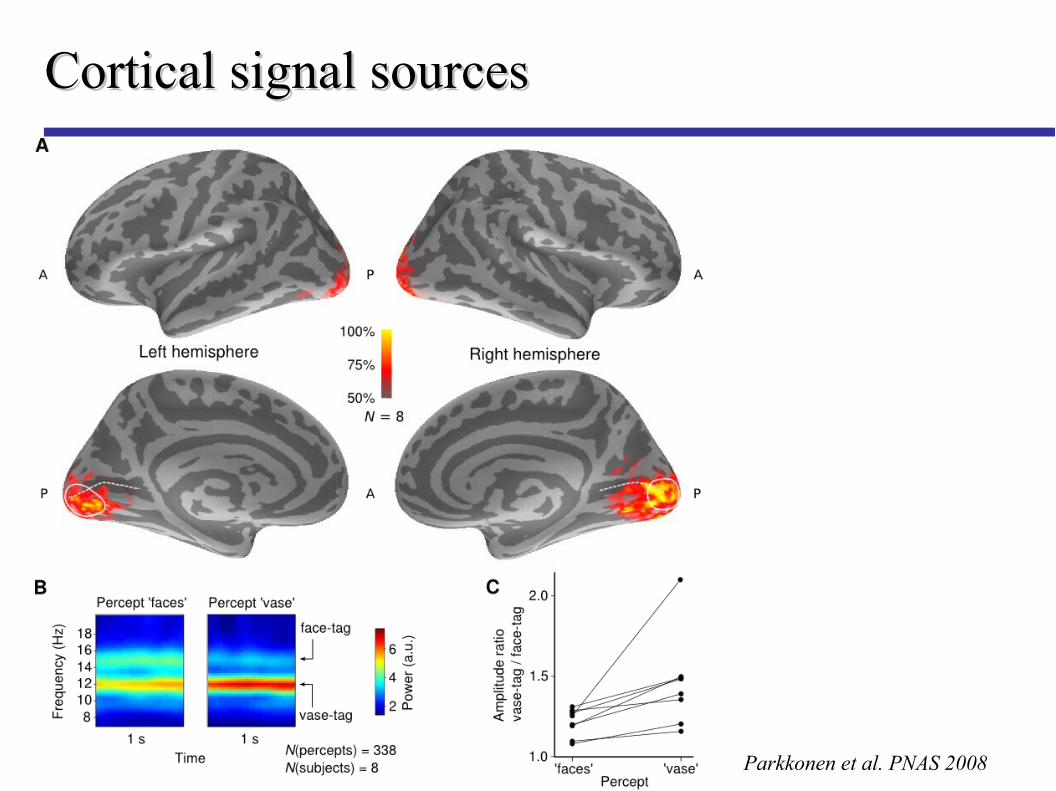
Cortical signal sourcesCortical signal sources
Parkkonen et al. PNAS 2008
Bistable perception: DiscussionBistable perception: Discussion
Perceptual bistability is manifested in the activity of the early visual cortices
The observed modulation is most likely a top-down effect that accentuates the “object part” of the visual field and suppresses the background, cf. figure–ground segregation.
Early visual areas contribute directly to visual awareness and conscious vision.
ConclusionsConclusions
MEG and EEG excel in studies that require high temporal resolution
Ideal applications: Tracking cortical activation sequences and functional connectivity at short time scales
MEG generally allows better localization than EEG
MEG/EEG data can be looked at in many ways
Evoked responses: transients to, e.g., changes in sensory input Induced responses: changes in the amplitude of ongoing neural
oscillations Functional connectivity changes Responses to tagged stimuli

Thank you for the attention


