
Network visualization and analysis with Cytoscape
Based on slides by Gary Bader (U Toronto)

Network Analysis Workflow• Load Networks e.g. PPI data
– Import network data into Cytoscape
• Load Attributes e.g. gene expression data– Get data about networks into Cytoscape
• Analyze and Visualize Networks• Prepare for Publication• A specific example of this workflow:
• Cline, et al. “Integration of biological networks and gene expression data using Cytoscape”, Nature Protocols, 2, 2366-2382 (2007).

Network Visualization and Analysis Outline
• Network introduction• Network visualization• Cytoscape software tool for network visualization and
analysis• Network analysis

Networks
• Represent relationships– Physical, regulatory, genetic, functional interactions
• Useful for discovering relationships in large data sets– Better than tables in Excel
• Visualize multiple data types together– See interesting patterns
• Network analysis


Biological Pathways/Networks?
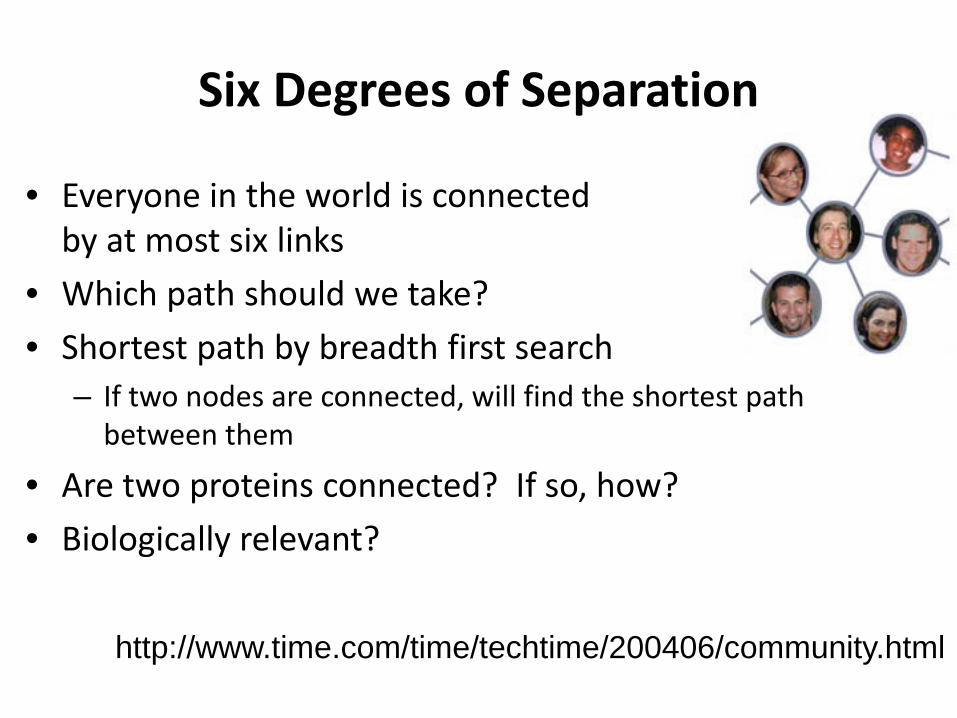
Six Degrees of Separation
• Everyone in the world is connectedby at most six links
• Which path should we take?• Shortest path by breadth first search
– If two nodes are connected, will find the shortest path between them
• Are two proteins connected? If so, how?• Biologically relevant?
http://www.time.com/time/techtime/200406/community.html
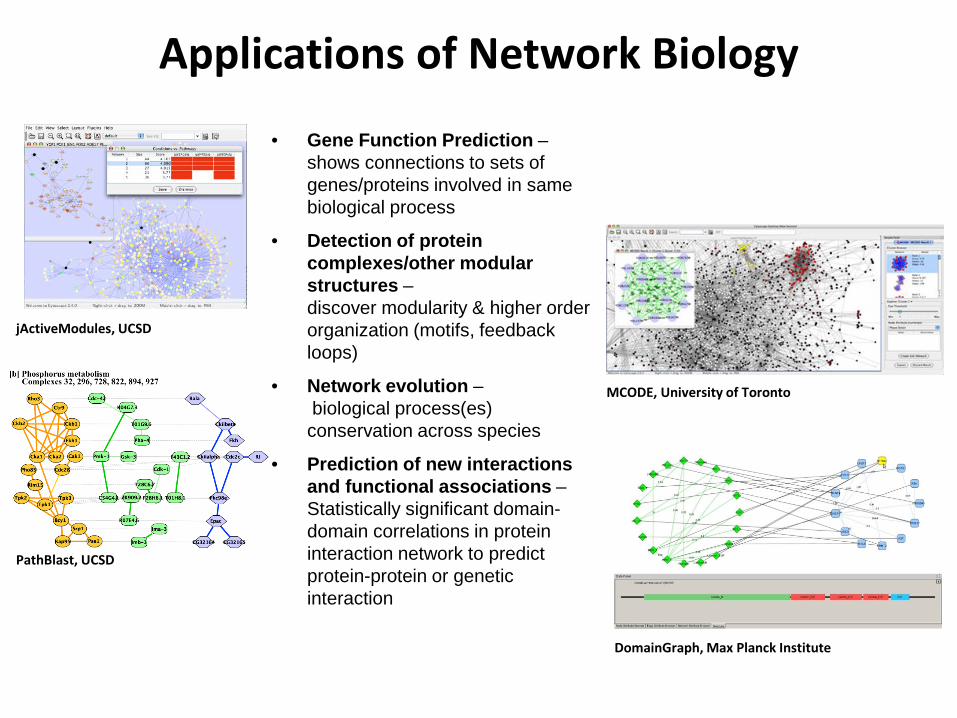
• Gene Function Prediction –shows connections to sets of genes/proteins involved in same biological process
• Detection of protein complexes/other modular structures –discover modularity & higher order organization (motifs, feedback loops)
• Network evolution –biological process(es) conservation across species
• Prediction of new interactions and functional associations –Statistically significant domain-domain correlations in protein interaction network to predict protein-protein or genetic interaction
jActiveModules, UCSD
PathBlast, UCSD
MCODE, University of Toronto
DomainGraph, Max Planck Institute
Applications of Network Biology
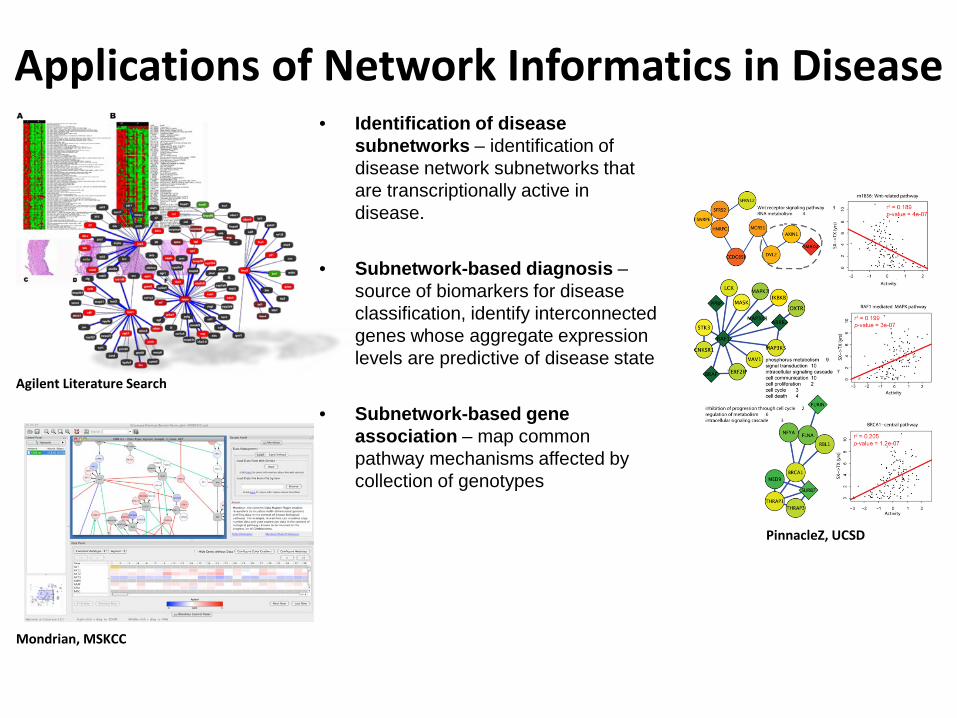
• Identification of disease subnetworks – identification of disease network subnetworks that are transcriptionally active in disease.
• Subnetwork-based diagnosis –source of biomarkers for disease classification, identify interconnected genes whose aggregate expression levels are predictive of disease state
• Subnetwork-based gene association – map common pathway mechanisms affected by collection of genotypes
June 2009
Agilent Literature Search
Mondrian, MSKCC
PinnacleZ, UCSD
Applications of Network Informatics in Disease
What’s Missing?
• Dynamics– Pathways/networks represented as static processes
• Difficult to represent a calcium wave or a feedback loop
– More detailed mathematical representations exist that handle these e.g. Stoichiometric modeling, Kinetic modeling (VirtualCell, E-cell, …)
• Need to accumulate or estimate comprehensive kinetic information
• Detail – atomic structures• Context – cell type, developmental stage

What Have We Learned?
• Networks are useful for seeing relationships in large data sets
• Important to understand what the nodes and edges mean
• Important to define the biological question - know what you want to do with your gene list or network
• Many methods available for gene list and network analysis– Good to determine your question and search for a solution– Or get to know many methods and see how they can be applied
to your data

Network Visualization Outline
• Automatic network layout• Visual features• Visually interpreting a network

Network Representations

Automatic network layout

Automatic network layout
• Force-directed: nodes repel and edges pull• Good for up to 500 nodes
– Bigger networks give hairballs - Reduce number of edges
• Advice: try force directed first, or hierarchical for tree-like networks
• Tips for better looking networks– Manually adjust layout– Load network into a drawing program (e.g. Illustrator) and
adjust labels

Focus
Dealing with ‘hairballs’: zoom or filter
Zoom
PKC Cell Wall Integrity

Visual Features
• Node and edge attributes– Text (string), integer, float,
Boolean, list– E.g. represent gene, interaction
attributes
• Visual attributes– Node, edge visual properties– Colour, shape, size, borders,
opacity...

Visually Interpreting a Network
Data relationshipsGuilt-by-associationDense clustersGlobal relationships

What Have We Learned?
• Automatic layout is required to visualize networks• Networks help you visualize interesting relationships in
your data• Avoid hairballs by focusing analysis• Visual attributes enable multiple types of data to be
shown at once – useful to see their relationships

Network Visualization and Analysis using Cytoscape
• Network visualization and analysis using Cytoscape software
• Cytoscape basics• Cytoscape network analysis examples

Network visualization and analysis
UCSD, ISB, Agilent, MSKCC, Pasteur, UCSF, Unilever, UToronto, U Texas
http://cytoscape.org
Pathway comparisonLiterature miningGene Ontology analysisActive modulesComplex detectionNetwork motif search

Network Analysis using Cytoscape
Databases
Literature
Expert knowledge
Experimental Data
Find biological processesunderlying a phenotype
NetworkInformation
NetworkAnalysis

Manipulate Networks Filter/Query
Automatic LayoutInteraction Database Search

Active Community
• Help– Tutorials, case studies– Mailing lists for discussion– Documentation, data sets
• Annual Conference: Paris, Oct 8-11, 2013• 10,000s users, 5000 downloads/month• >160 Plugins/Apps Extend Functionality
– The app store: http://apps.cytoscape.org/– Build your own, requires programming
http://www.cytoscape.orgCline MS et al. Integration of biological networks and gene expression data using Cytoscape Nat Protoc. 2007;2(10):2366-82

What Have We Learned?
• Cytoscape is a useful, free software tool for network visualization and analysis
• Provides basic network manipulation features• Plugins/Apps are available to extend the functionality

Cytoscape Demo
Version 2.8.2www.cytoscape.org

Desktop
Canvas
Network overview
Network manager
Attribute browser
CytoPanels

yFiles Organic

yFiles Circular
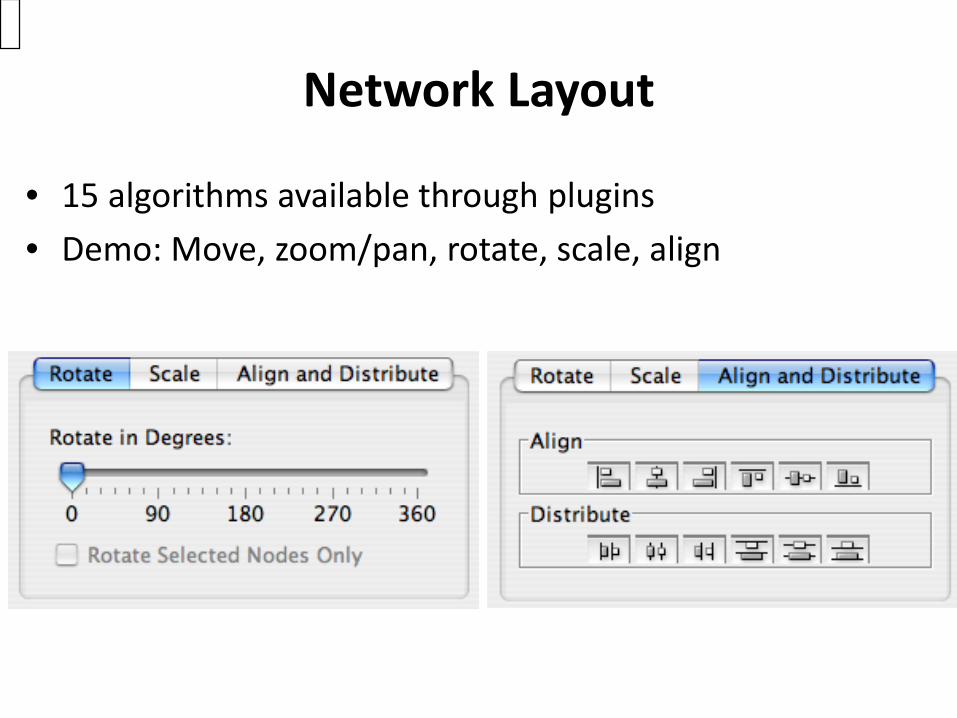
Network Layout
• 15 algorithms available through plugins• Demo: Move, zoom/pan, rotate, scale, align

Create Subnetwork

Create Subnetwork

Visual Style
• Customized views of experimental data in a network context
• Network has node and edge attributes• E.g. expression data, GO function, interaction type
• Mapped to visual attributes• E.g. node/edge size, shape, colour…
• E.g. Visualize gene expression data as node colour gradient on the network

Visual Style
Load “Your Favorite Network”
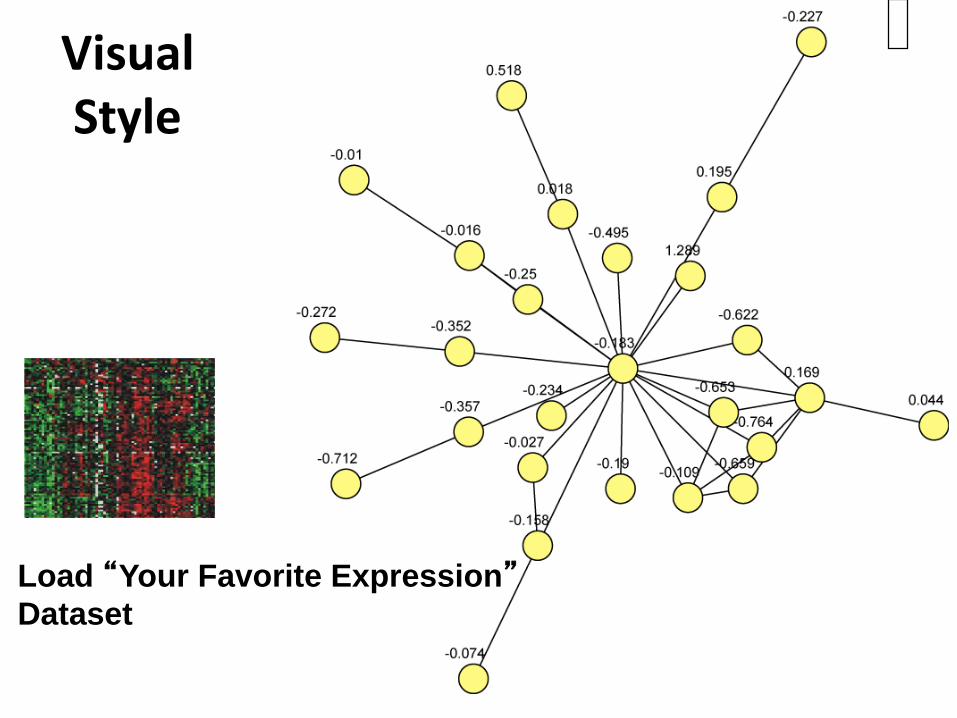
Visual Style
Load “Your Favorite Expression”Dataset
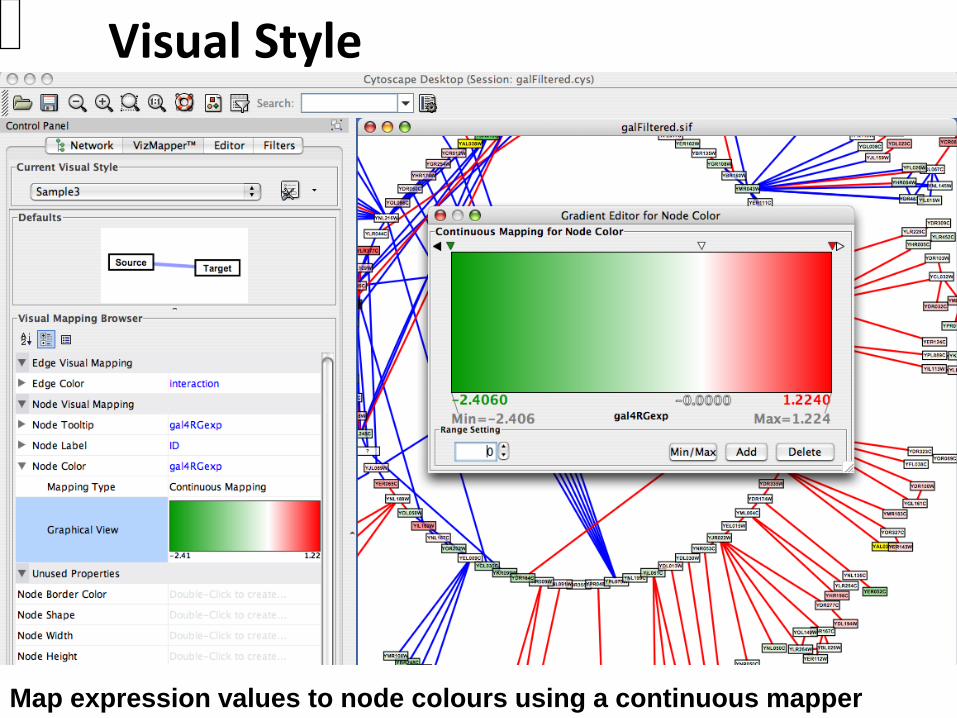
Visual Style
Map expression values to node colours using a continuous mapper

Visual Style
Expression data mappedto node colours

Network Filtering

Interaction Database Search


VistaClara• Visualization for gene expression data• Heat maps, sorting, animation

Cytoscape Lab
• Cytoscape – expression data visualization– Load the sample network file: galFiltered.sif– Lay it out – try different layouts– Load expression data - galExpData.pvals
• Use File->Import->Attribute from Table
– Examine node attributes– Visualize gene expression data using the Visual Mapper– Install the VistaClara plugin from the plugin manager– Play the expression data as a movie

BiNGO plugin
• Calculates over-representation of a subset of genes with respect to a background set in a specific GO category
• Input: subnetwork, or list– Background set by user
• Output: tree with nodes color reflecting overrepresentation; also as lists
• Caveats: Gene identifiers must match; low GO term coverage, GO bias, Background determining

BiNGO
Maere, S., Heymans, K. and Kuiper, MBioinformatics 21, 3448-3449, 2005
Hypergeometric p-valueMultiple testing correction(Benjamini-Hochberg FDR)

Cerebral
http://www.pathogenomics.ca/cerebral/

Find Active Subnetworks• Active modules
– Input: network + p-values for gene expression values e.g. from GCRMA
– Output: significantly differentially expressed subgraphs• Method
– Calculate z-score/node, ZA score/subgraph, correct vs. random expression data sampling
– Score over multiple experimental conditions– Simulated annealing used to find high scoring networks
Ideker T, Ozier O, Schwikowski B, Siegel AFBioinformatics. 2002;18 Suppl 1:S233-40

Active Module ResultsNetwork: yeast protein-protein and protein-DNA networkExpression data: 3 gene knock out conditions (enzyme, TF activator, TF repressor)
Note: non-deterministic, multiple runsrequired for confidence of result robustness Ideker T et al. Science. 2001 May
4;292(5518):929-34.

Network Clustering
• Clusters in a protein-protein interaction network have been shown to represent protein complexes and parts of pathways
• Clusters in a protein similarity network represent protein families
• Network clustering is available through the ClusterMaker Cytoscape plugin
Bader & Hogue, BMC Bioinformatics 2003 4(1):2
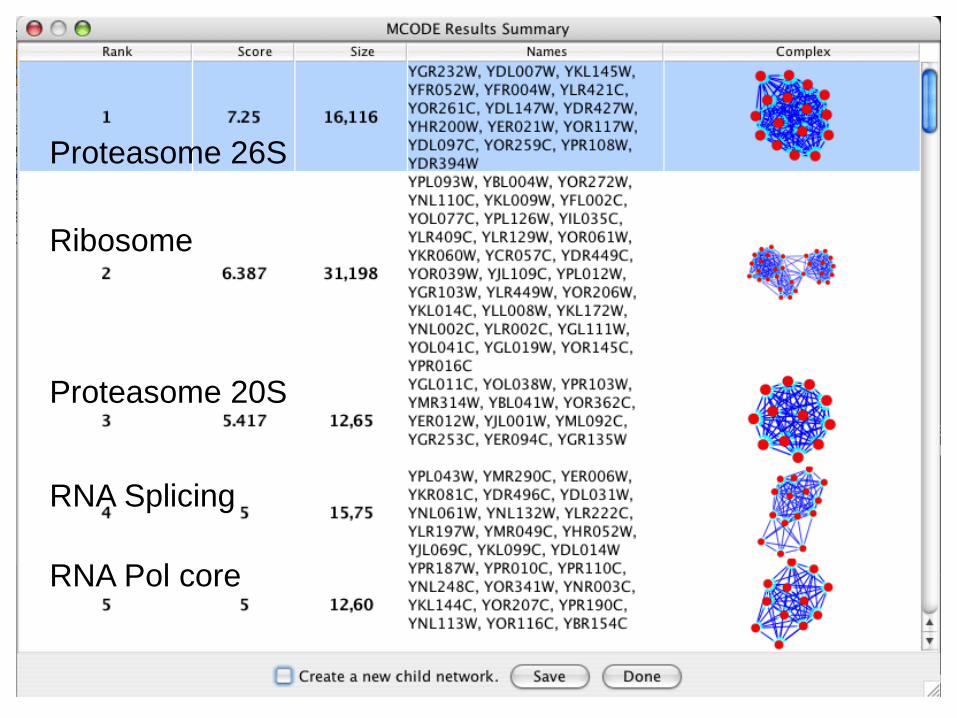
Proteasome 26S
Proteasome 20S
Ribosome
RNA Pol core
RNA Splicing
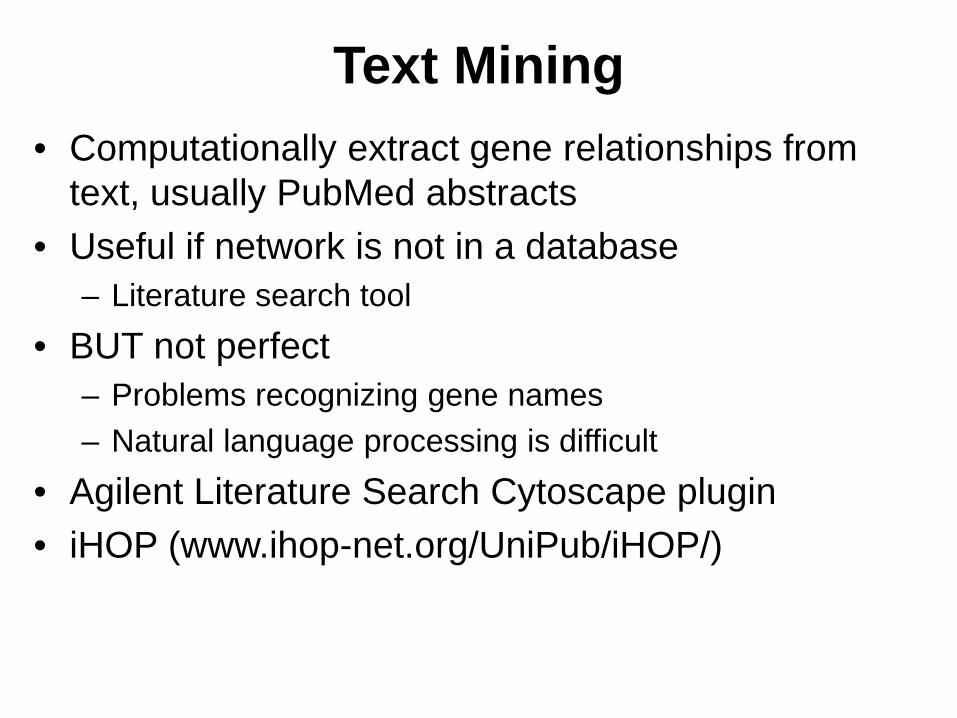
Text Mining• Computationally extract gene relationships from
text, usually PubMed abstracts• Useful if network is not in a database
– Literature search tool• BUT not perfect
– Problems recognizing gene names– Natural language processing is difficult
• Agilent Literature Search Cytoscape plugin• iHOP (www.ihop-net.org/UniPub/iHOP/)

Agilent Literature
Search
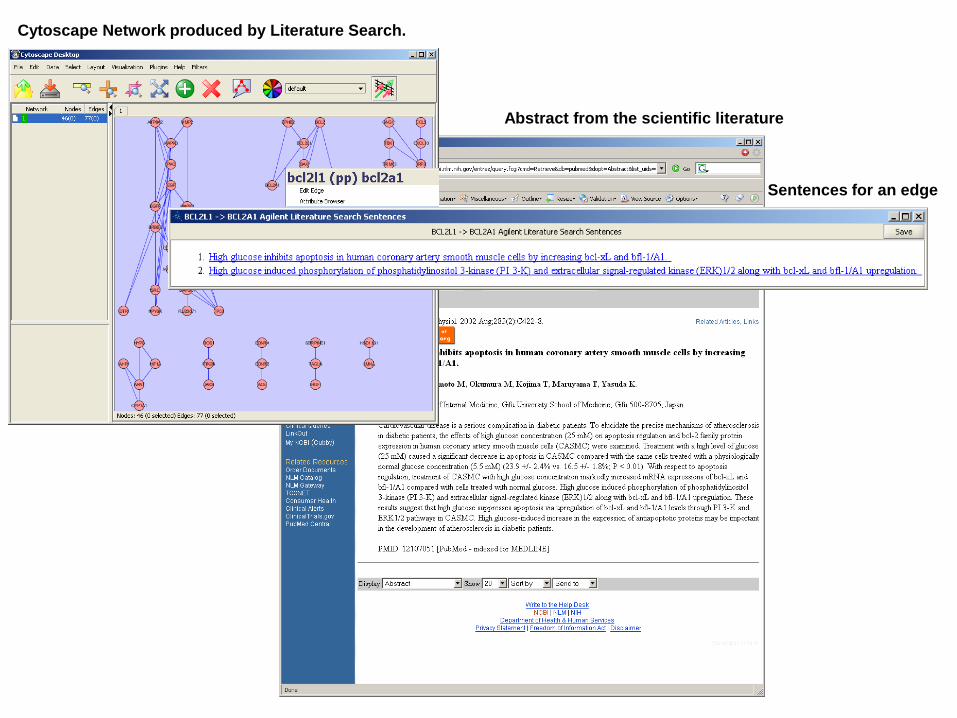
Cytoscape Network produced by Literature Search.
Abstract from the scientific literature
Sentences for an edge

Analysis LabFind Network Motifs - Netmatch plugin
• Network motif is a sub-network that occurs significantly more often than by chance alone
• Input: query and target networks, optional node/edge labels
• Output: topological query matches as subgraphs of target network
• Supports: subgraph matching, node/edge labels, label wildcards, approximate paths
• http://alpha.dmi.unict.it/~ctnyu/netmatch.html
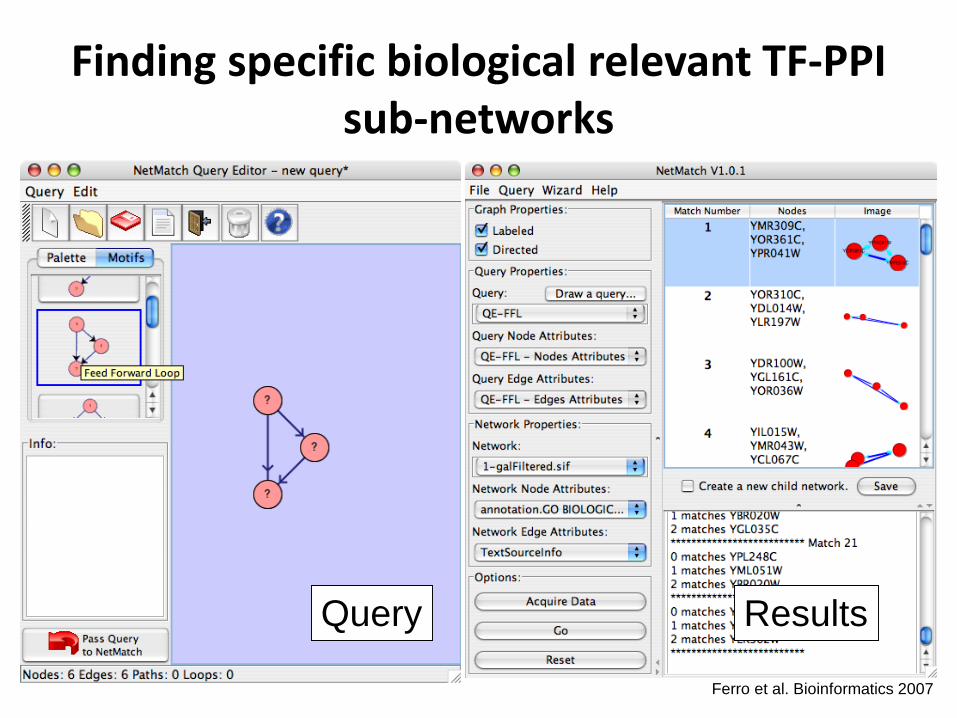
Finding specific biological relevant TF-PPI sub-networks
Query Results
Ferro et al. Bioinformatics 2007
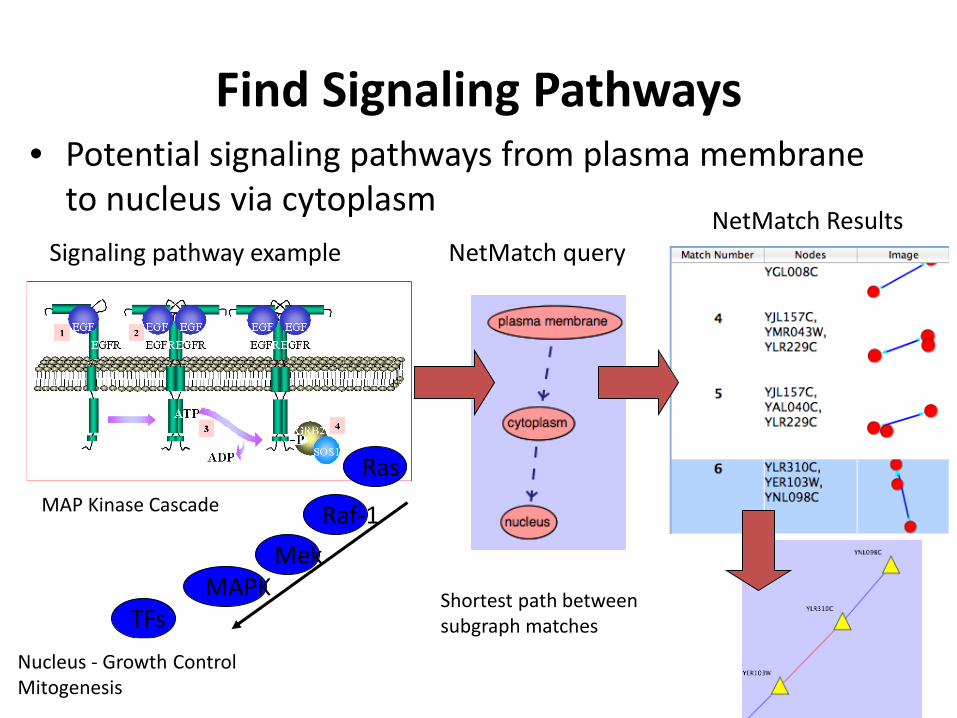
Find Signaling Pathways• Potential signaling pathways from plasma membrane
to nucleus via cytoplasm
Raf-1Mek
MAPKTFs
Nucleus - Growth ControlMitogenesis
MAP Kinase Cascade
Ras
NetMatch query
Shortest path betweensubgraph matches
Signaling pathway exampleNetMatch Results

Find Expressed Motifs
Protein Differential Expression SignificanceYLR075W 1.7255E-4YGR085C 2.639E-4YPR102C 3.7183E-4
NetMatch queryNetMatch Results
Find specificsubgraphs wherecertain nodes aresignificantly differentiallyexpressed

Cytoscape 2.8 Tips & Tricks
• “Root graph”
– “There is one graph to rule them all….”– The networks in Cytoscape are all “views” on a single graph.– Changing the attribute for a node in one network will also
change that attribute for a node with the same ID in all other loaded networks
– There is no way to “copy” a node and keep the same ID– Make a copy of the session
Cytoscape 2.8 Tips & Tricks
• Network views– When you open a large network, you will not get a view by
default– To improve interactive performance, Cytoscape has the concept
of “Levels of Detail”• Some visual attributes will only be apparent when you zoom in• The level of detail for various attributes can be changed in the
preferences• To see what things will look like at full detail:
– ViewShow Graphics Details
Cytoscape 2.8 Tips & Tricks
• Sessions– Sessions save pretty much everything:
• Networks• Properties• Visual styles• Screen sizes
– Saving a session on a large screen may require some resizing when opened on your laptop

Cytoscape 2.8 Tips & Tricks
• Logging– By default, Cytoscape writes it’s logs to the Error Dialog:
HelpError Dialog– Can change a preference to write it to the console
• EditPreferencesProperties…• Set logger.console to true• Don’t forget to save your preferences• Restart Cytoscape
– (can also turn on debugging: cytoscape.debug, but I don’t recommend it)
Cytoscape 2.8 Tips & Tricks
• Memory– Cytoscape uses lots of it– Doesn’t like to let go of it– An occasional restart when working with large networks is a
good thing– Destroy views when you don’t need them– Java doesn’t give us a good way to get the memory right at start
time• Since version 2.7, Cytoscape does a much better job at “guessing” good
default memory sizes than previous versions
Cytoscape 2.8 Tips & Tricks
• .cytoscape directory– Your defaults and any plugins downloaded from the plugin
manager will go here– Sometimes, if things get really messed up, deleting (or
renaming) this directory can give you a “clean slate”
• Plugin manager– “Outdated” doesn’t necessarily mean “won’t work”
– Plugin authors don’t always update their plugins immediately after new releases

Cytoscape 3.0


