
NCDOT Cash Balances & Financial ManagementBobby Lewis, Chief Operating Officer, NCDOTEvan Rodewald, Chief Financial Officer, NCDOTMarch 5, 2020

Presentation Outline
• History of Cash Flow Financing & NCDOT Budget Characteristics
• Trends in Cash Balances
• Impacts of Recent Legislation on Cash
• Current Cash Forecast
• Current Status of Build NC Implementation
• Highlights from S.L. 2019-251 Financial Management Report
2
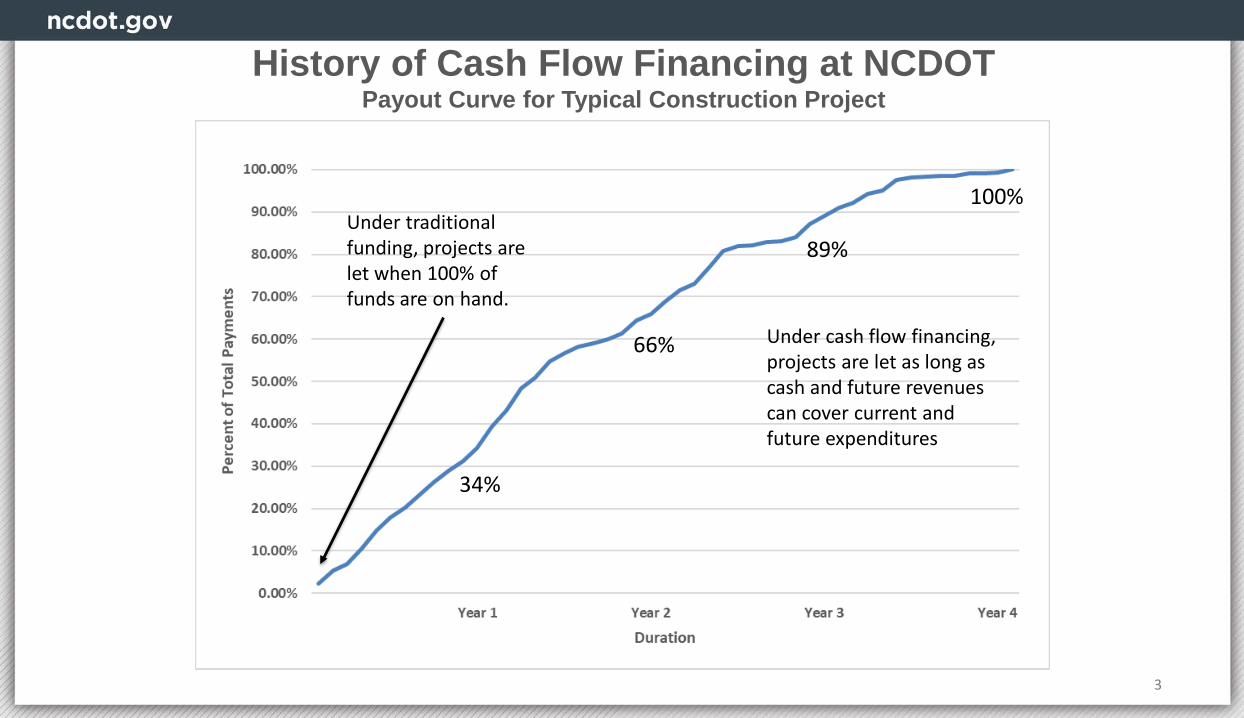
History of Cash Flow Financing at NCDOTPayout Curve for Typical Construction Project
3
34%
66%
89%
100% Under traditional funding, projects are let when 100% of funds are on hand.
Under cash flow financing, projects are let as long as cash and future revenues can cover current and future expenditures
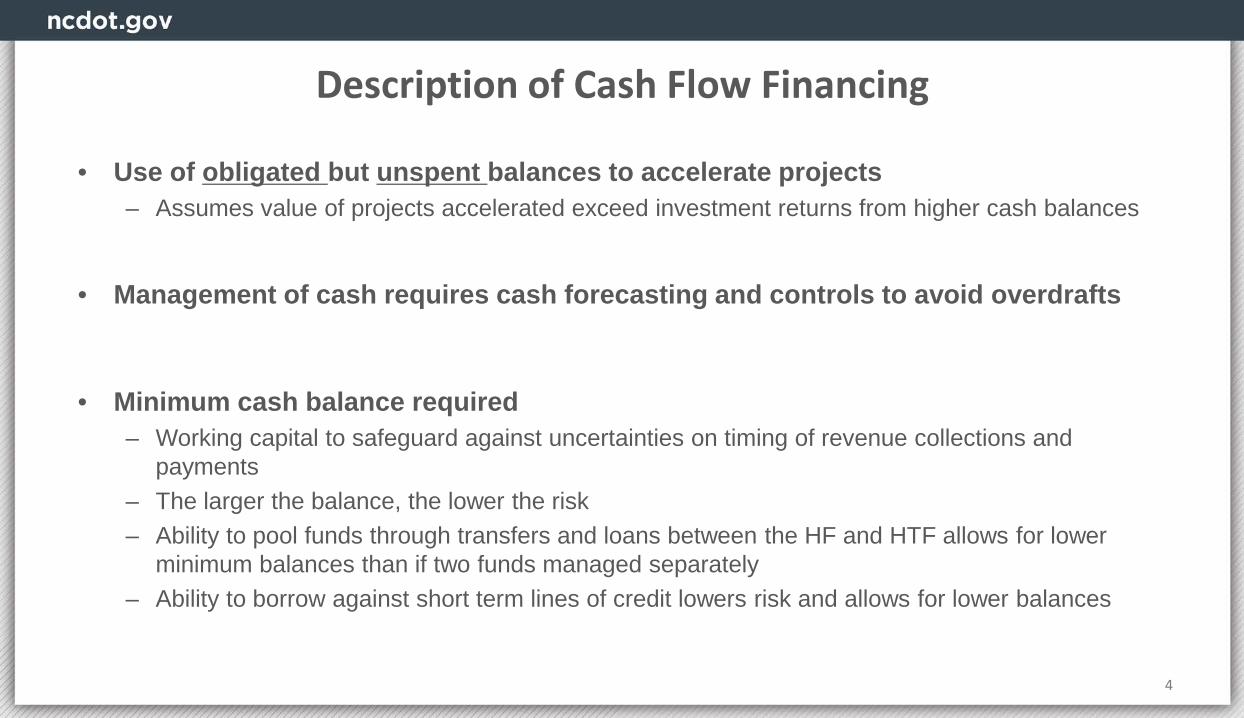
Description of Cash Flow Financing
• Use of obligated but unspent balances to accelerate projects – Assumes value of projects accelerated exceed investment returns from higher cash balances
• Management of cash requires cash forecasting and controls to avoid overdrafts
• Minimum cash balance required – Working capital to safeguard against uncertainties on timing of revenue collections and
payments– The larger the balance, the lower the risk– Ability to pool funds through transfers and loans between the HF and HTF allows for lower
minimum balances than if two funds managed separately– Ability to borrow against short term lines of credit lowers risk and allows for lower balances
4
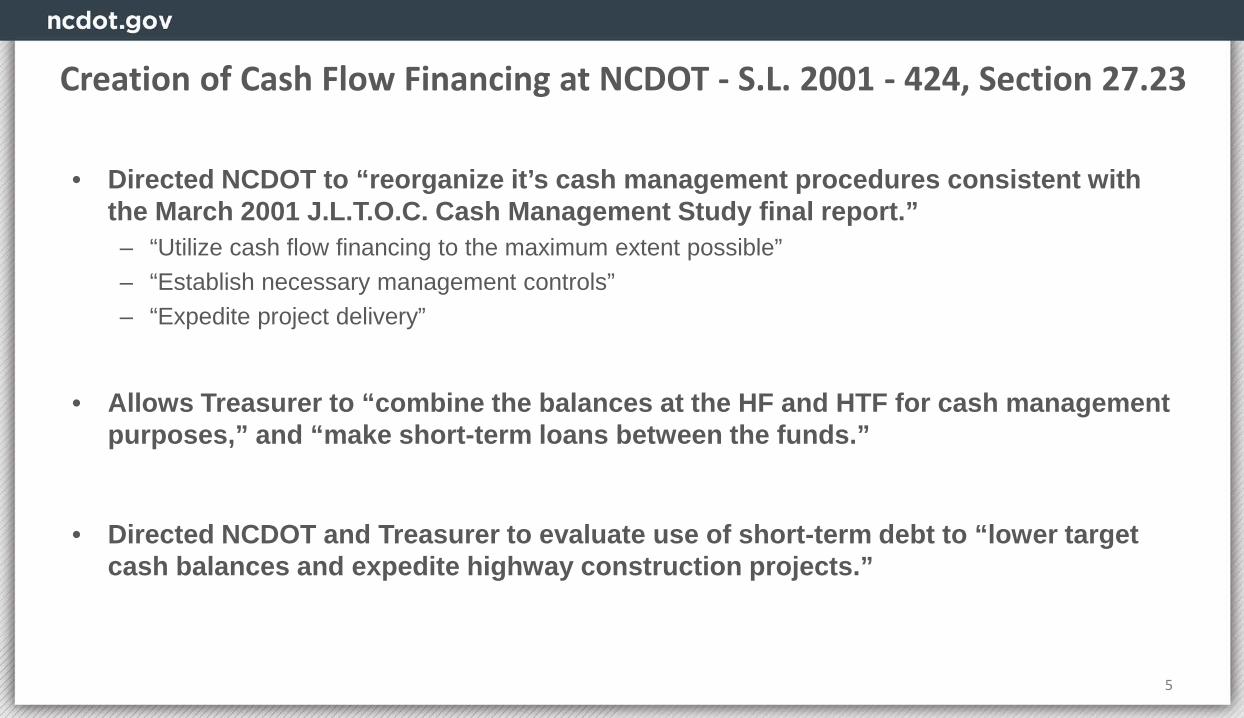
• Directed NCDOT to “reorganize it’s cash management procedures consistent with the March 2001 J.L.T.O.C. Cash Management Study final report.”– “Utilize cash flow financing to the maximum extent possible”– “Establish necessary management controls”– “Expedite project delivery”
• Allows Treasurer to “combine the balances at the HF and HTF for cash management purposes,” and “make short-term loans between the funds.”
• Directed NCDOT and Treasurer to evaluate use of short-term debt to “lower target cash balances and expedite highway construction projects.”
5
Creation of Cash Flow Financing at NCDOT - S.L. 2001 - 424, Section 27.23

Current NCDOT Budget Structure, SFY 2019-20
Unaudited Financial Report 6

7
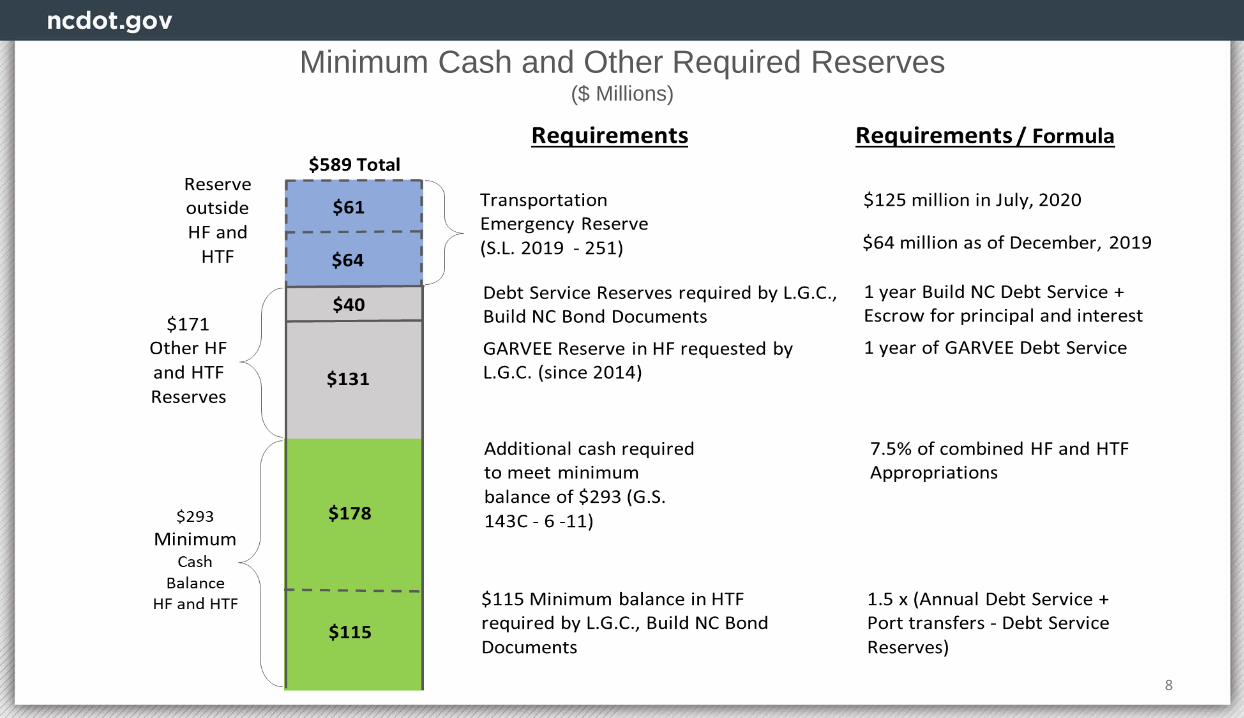
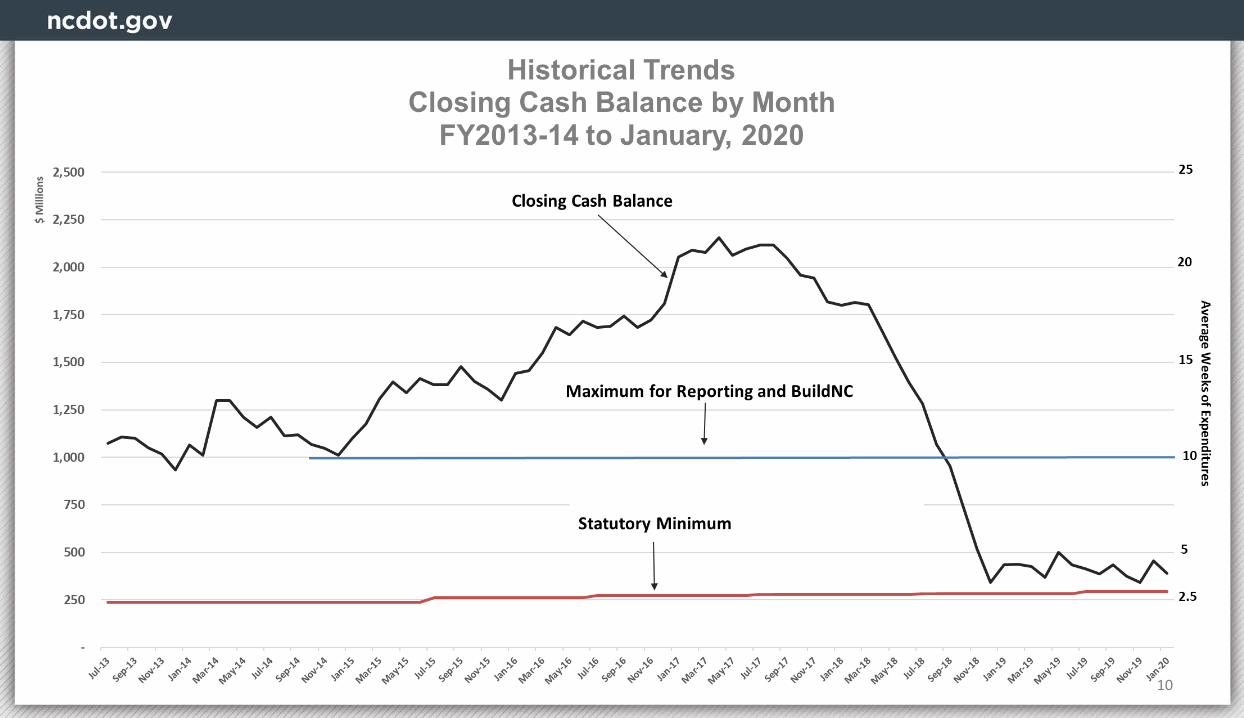
Minimum Cash and Other Required Reserves($ Millions)
8
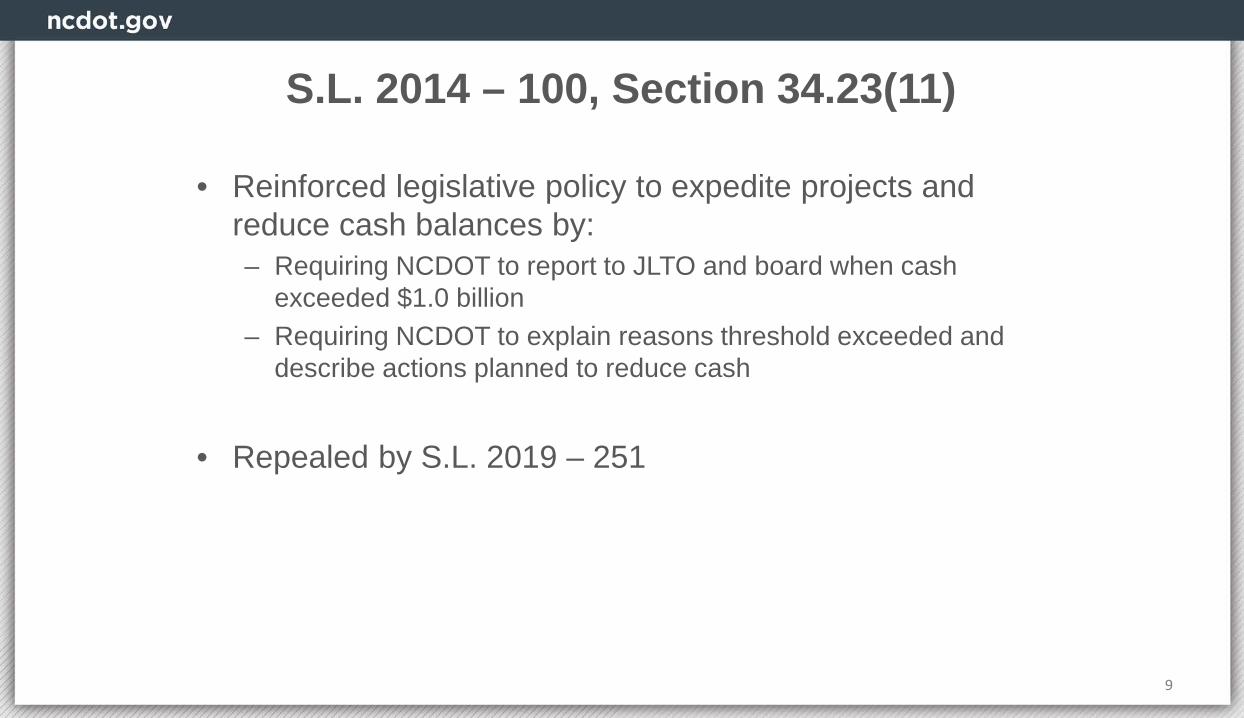
S.L. 2014 – 100, Section 34.23(11)
• Reinforced legislative policy to expedite projects and reduce cash balances by:– Requiring NCDOT to report to JLTO and board when cash
exceeded $1.0 billion– Requiring NCDOT to explain reasons threshold exceeded and
describe actions planned to reduce cash
• Repealed by S.L. 2019 – 251
9
10
11
12

13
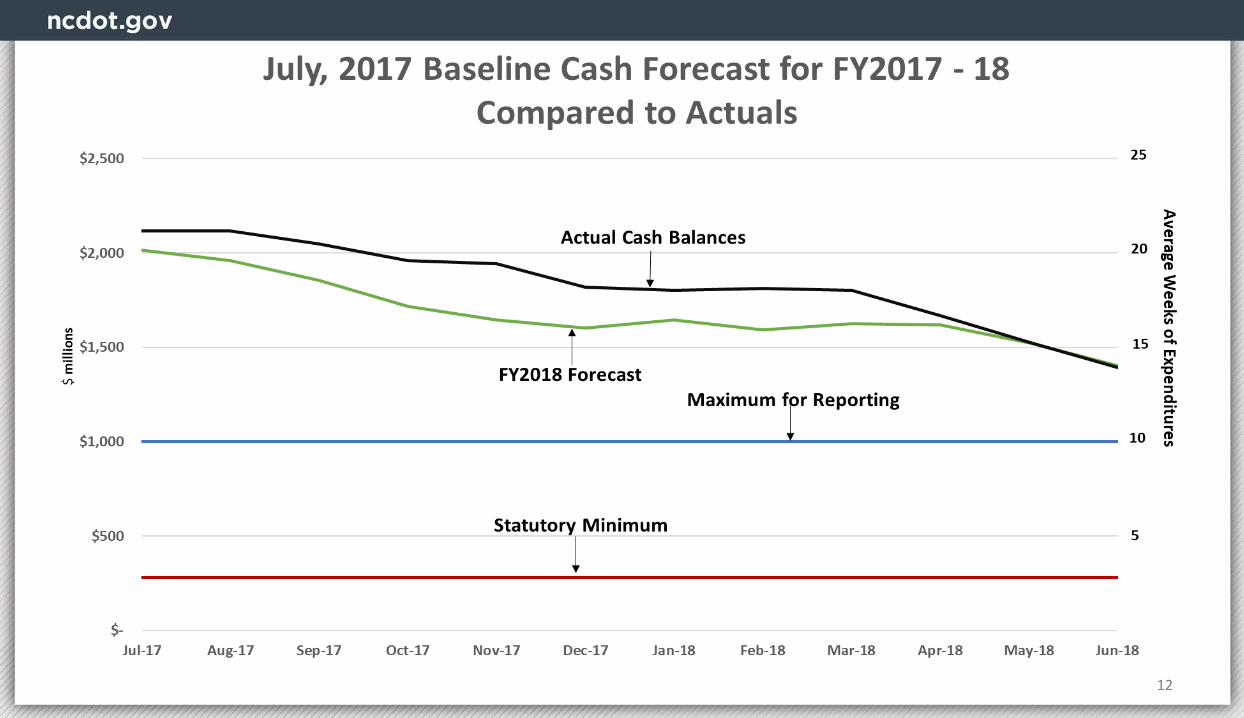
Monthly Projected Ending Cash BalanceAs presented to J.L.T.O.C. on November 2018
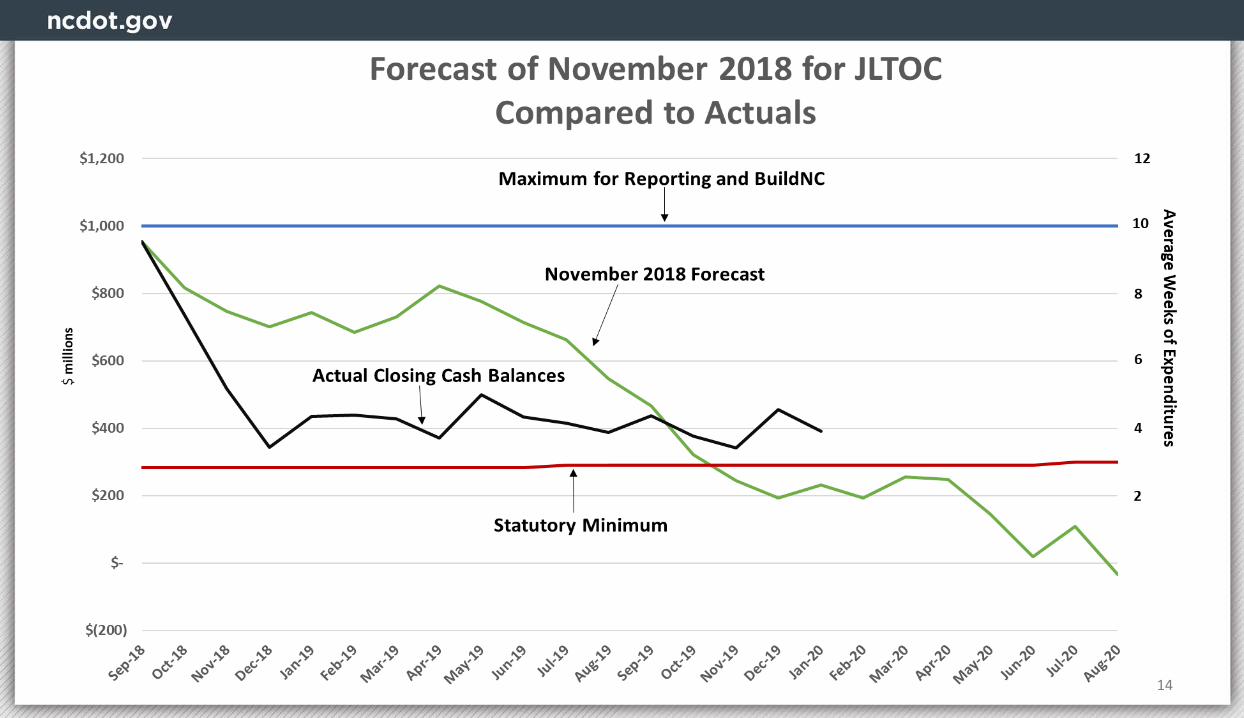
14
15
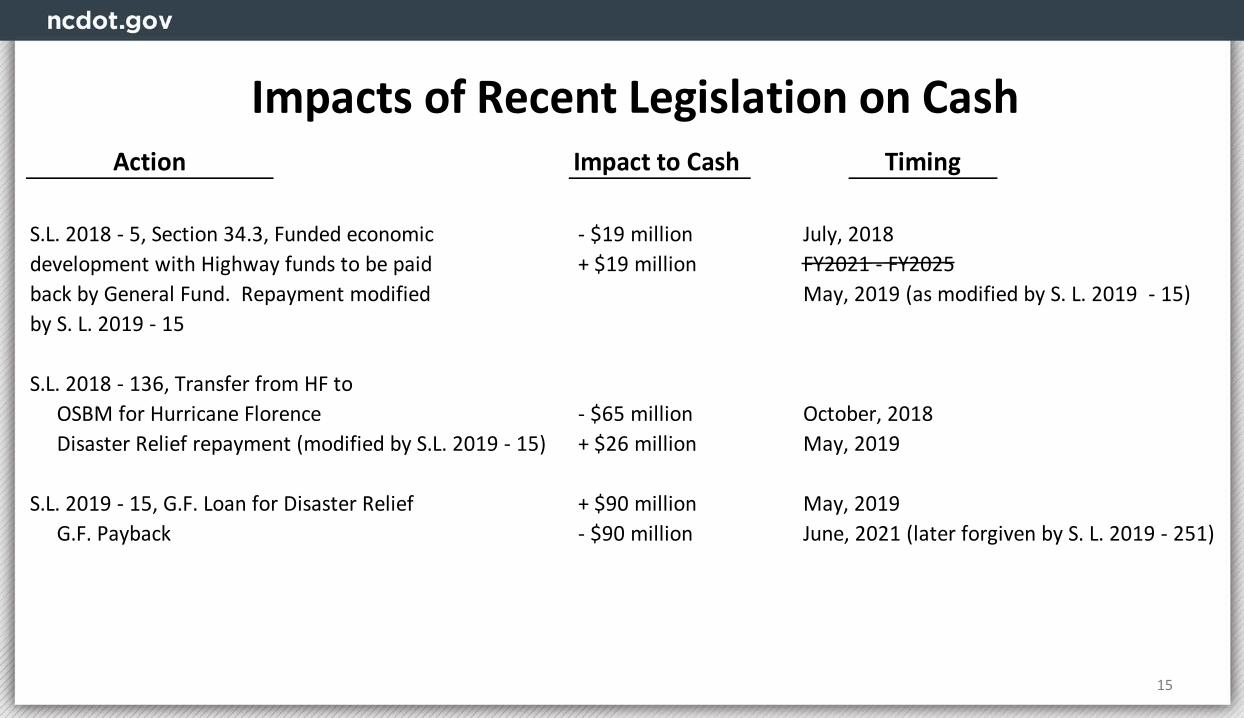
Impact to Cash
S.L. 2018 - 5, Section 34.3, Funded economic - $19 million July, 2018 development with Highway funds to be paid + $19 million FY2021 - FY2025 back by General Fund. Repayment modified May, 2019 (as modified by S. L. 2019 - 15)by S. L. 2019 - 15
S.L. 2018 - 136, Transfer from HF to OSBM for Hurricane Florence - $65 million October, 2018 Disaster Relief repayment (modified by S.L. 2019 - 15) + $26 million May, 2019
S.L. 2019 - 15, G.F. Loan for Disaster Relief + $90 million May, 2019 G.F. Payback - $90 million June, 2021 (later forgiven by S. L. 2019 - 251)
TimingAction
Impacts of Recent Legislation on Cash

16
Impact to CashBuild NC $400 Million* + $100 Million July, 2020 - June, 2022
Emergency Reserve established with $64 Millionfrom G. F., and $61 Million transfer from H.F. - $61 Million July, 2020
Forgiveness of G. F. Loan under S. L. 2019 -15 + $90 Million June, 2021
Disaster Relief Funding + $36 Million December, 2019 Net Impact of All Actions + $165 Million December, 2019 - June, 2022
* Build NC impacts assume council of State and Treasurer approval of bond issuance, and also assume $100 million in proceeds would supplant expenditures from revenues.
Timing
Impacts of S.L. 2019 - 251 on CashAction
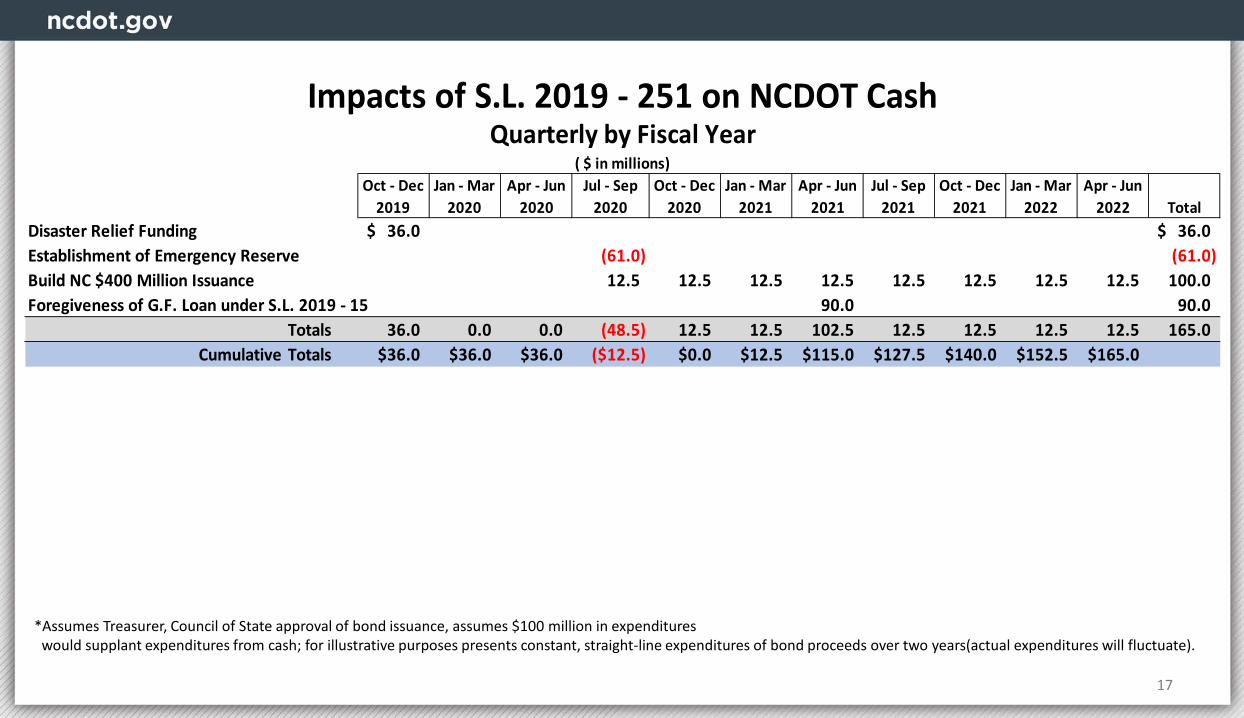
17
Oct - Dec 2019
Jan - Mar 2020
Apr - Jun 2020
Jul - Sep 2020
Oct - Dec 2020
Jan - Mar 2021
Apr - Jun 2021
Jul - Sep 2021
Oct - Dec 2021
Jan - Mar 2022
Apr - Jun 2022 Total
Disaster Relief Funding 36.0$ 36.0$ Establishment of Emergency Reserve (61.0) (61.0)Build NC $400 Million Issuance 12.5 12.5 12.5 12.5 12.5 12.5 12.5 12.5 100.0Foregiveness of G.F. Loan under S.L. 2019 - 15 90.0 90.0
Totals 36.0 0.0 0.0 (48.5) 12.5 12.5 102.5 12.5 12.5 12.5 12.5 165.0Cumulative Totals $36.0 $36.0 $36.0 ($12.5) $0.0 $12.5 $115.0 $127.5 $140.0 $152.5 $165.0
Impacts of S.L. 2019 - 251 on NCDOT CashQuarterly by Fiscal Year
( $ in millions)
*Assumes Treasurer, Council of State approval of bond issuance, assumes $100 million in expenditures would supplant expenditures from cash; for illustrative purposes presents constant, straight-line expenditures of bond proceeds over two years(actual expenditures will fluctuate).

18
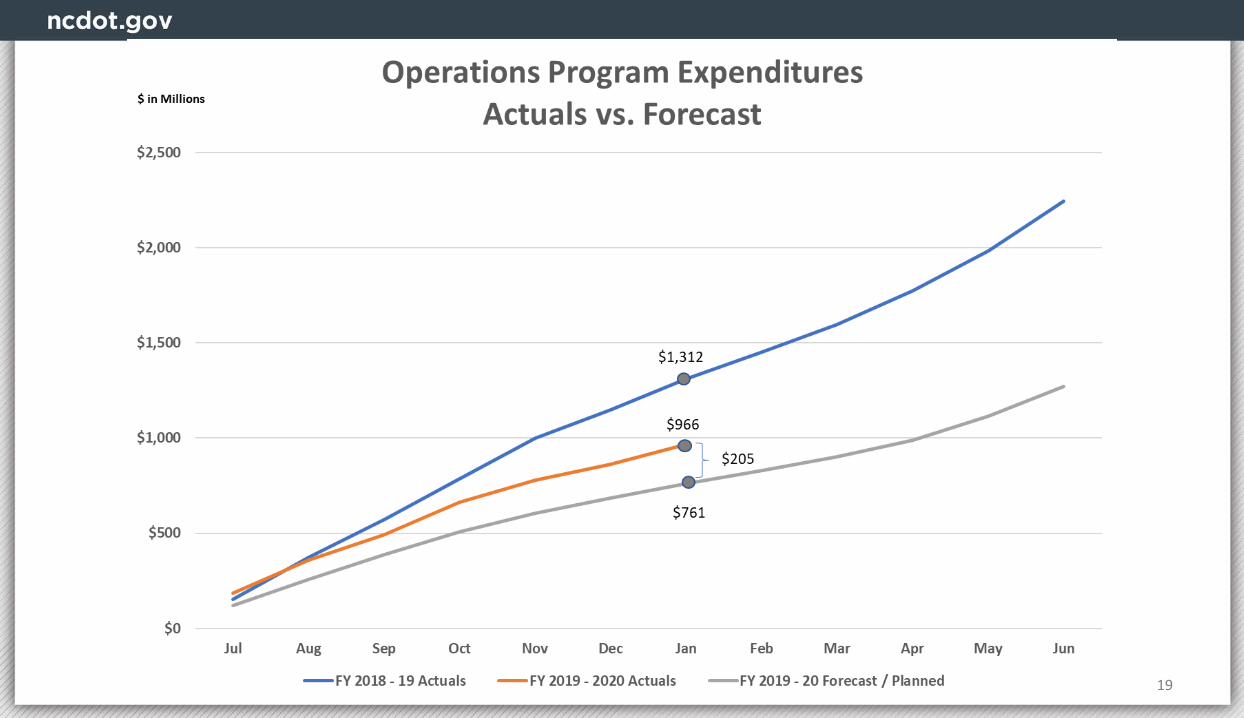
19

21
Monthly Projected Ending Cash Balance(Assumes immediate invoice payment, FY2020 spend plan, $61M transfer to Emergency Reserves)

Monthly Projected Ending Cash Balance(Assumes invoices paid in 30 days, FY2020 spend plan, $61M transfer to Emergency Reserve)
21

Report on Cash Balances – Key Points
• In 2001, Cash flow financing established by the General Assembly to accelerate projects.- In 2014, legislation again emphasized importance of reducing cash and accelerating projects.- Cash flow financing differs from traditional funding throughout state government.
• Critical component of legislative policy on cash flow financing is pooling of HF and HTF cash through transfers, inter-fund loans, and combined reporting.
- This pooling allows NCDOT to maintain lower minimum balances.- If policy of pooling HF and HTF cash balances is discontinued either through legislative action or through
executive branch policies, then higher minimum cash balances will be required.
• NCDOT thanks General Assembly for recent legislation to provide G.F. loans and assistance to NCDOT. Positive impacts on cash are mostly FY 2020-21 and FY 2021-22.
• Cash balances will be low for the foreseeable future.
• NCDOT continues to work to reduce expenditures, increase revenues, until cash balances are increased, and expenditures can be restored to steady rates.
22

• Governed by S.L. 2018-16
• 50% of proceeds for Regional Tier, 50% for Division Tier
• Limitations:- $300 million annually, S.L. 2019 – 251. Increased to $400 million for FY2019 - 20
- $3.0 billion over 10 years
- Maximum term: 15 years
- Debt Affordability Advisory Committee targets (Debt service ≤ to 6% of Revenues)
23
Build N.C. Bond Program

• Issuance requires recommendation from Treasurer and determination that following conditions met:
- Average ending cash Balance less than $1.0 billion (January - March).- Debt affordability targets not exceeded.- NCDOT has consulted with Treasurer, JLTOC and Gov. Ops.
• Council of State approval required per G.S. 142-84.- Requires involvement of NCDOT, Treasurer,
Department of Administration and OSBM.
24
Build N.C. – Other Legal Requirements

• First Issuance closed June 2019:- AA+ Credit Rating – highest for debt that is not General Obligation- True Interest Cost: 2.26%- $329 million in proceeds net of debt service reserves- $110 million in proceeds from trustee through Jan. 2020- $28.6 million in debt service annually
• NCDOT notified Treasurer and General Assembly in November 2019 of intention to issue second series of Build NC bonds.
• L.G.C. staff and OSBM working with NCDOT to issue $400 million in bonds priorto June 30, 2020
• Yield on AAA bond maturing in 10 years: 1.02%
(Source: Thomson Reuters Municipal Market Data as of February 25, 2020)
25
Build NC Summary Data
S.L. 2019-251Financial Management Report
Highlights
26

27
FHWA Reimbursements
Event Anticipated Reimbursement
Reimbursement Received*
2020 February 6 Rains $ - $ -
2019 Nov Coastal Storm $ - $ -
2019 Hurricane Dorian $3,004,737 $ -
2019 June Rains $711,969 $ -
2019 February Rains $9,228,398 $ (2,000,000)
2018 Hurricane Michael $1,765,520 $ (1,500,000)
2018 Hurricane Florence $32,567,910 $ (33,189,506)
2018 TS Alberto $7,631,425 $ (7,841,787)
2016 Hurricane Matthew $46,703,507 $ (46,441,533)
Total $101,613,467 $ (90,972,826)
*As of 3/01/2020
28
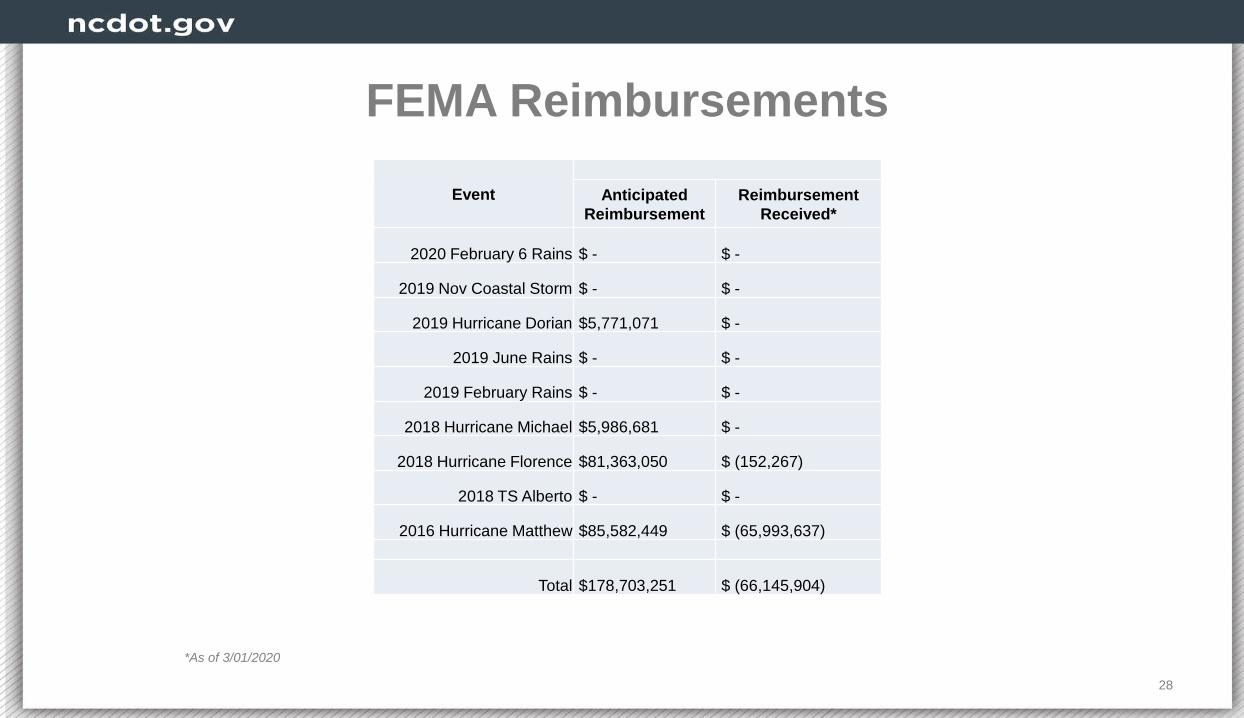
FEMA Reimbursements
*As of 3/01/2020
Event Anticipated Reimbursement
Reimbursement Received*
2020 February 6 Rains $ - $ -
2019 Nov Coastal Storm $ - $ -
2019 Hurricane Dorian $5,771,071 $ -
2019 June Rains $ - $ -
2019 February Rains $ - $ -
2018 Hurricane Michael $5,986,681 $ -
2018 Hurricane Florence $81,363,050 $ (152,267)
2018 TS Alberto $ - $ -
2016 Hurricane Matthew $85,582,449 $ (65,993,637)
Total $178,703,251 $ (66,145,904)
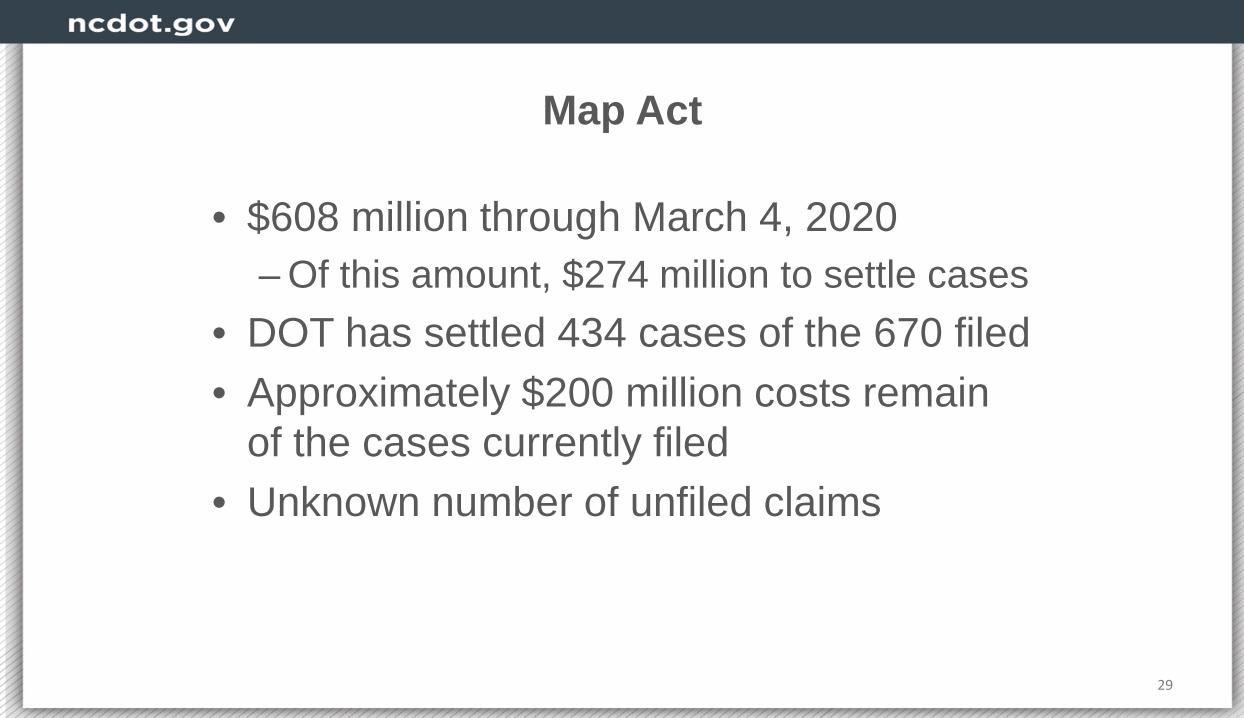
Map Act
• $608 million through March 4, 2020– Of this amount, $274 million to settle cases
• DOT has settled 434 cases of the 670 filed• Approximately $200 million costs remain
of the cases currently filed• Unknown number of unfiled claims
29
Program Delivery
30
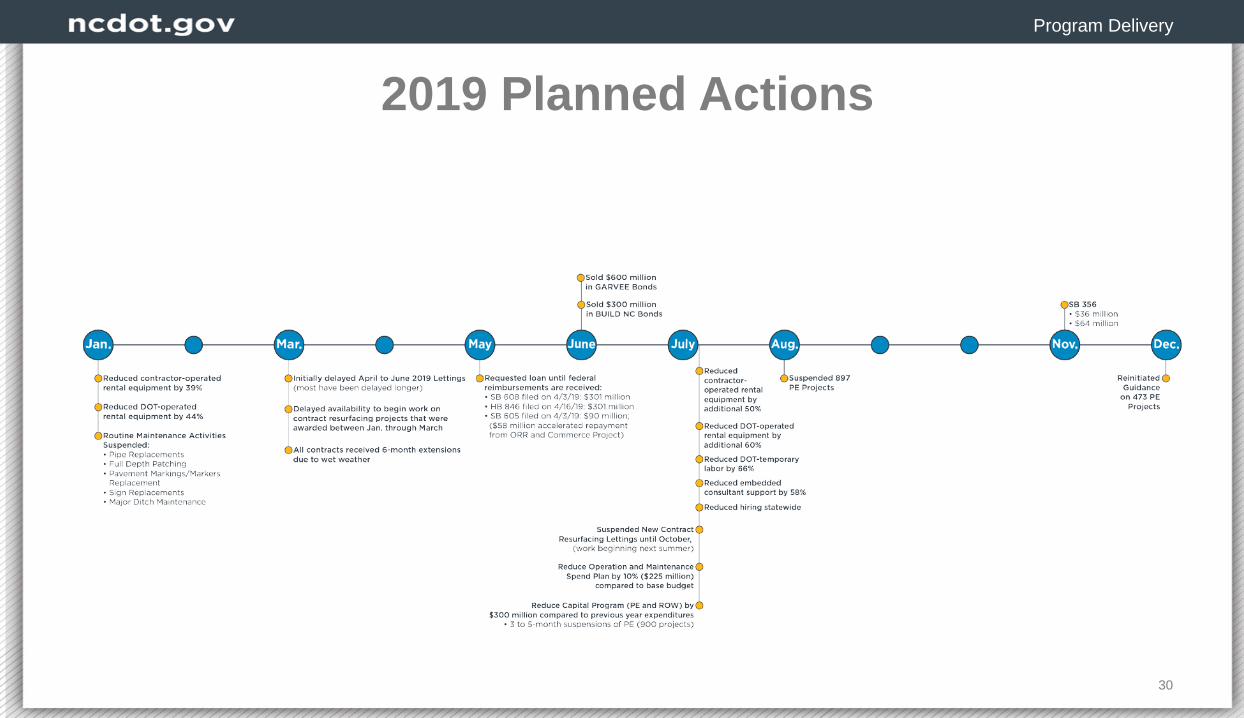
2019 Planned Actions

McKinsey Recommendations Implementation
• Developing better cash models for highway and programmatic divisions through monthly expenditure projections updated quarterly
• Formalized Financial Planning Committee to review spend plan targets and actual expenditures
• Increased communication between financial and operational staff
• Adjust contract language to allow flexibility to address fund availability
31
Program Delivery
32
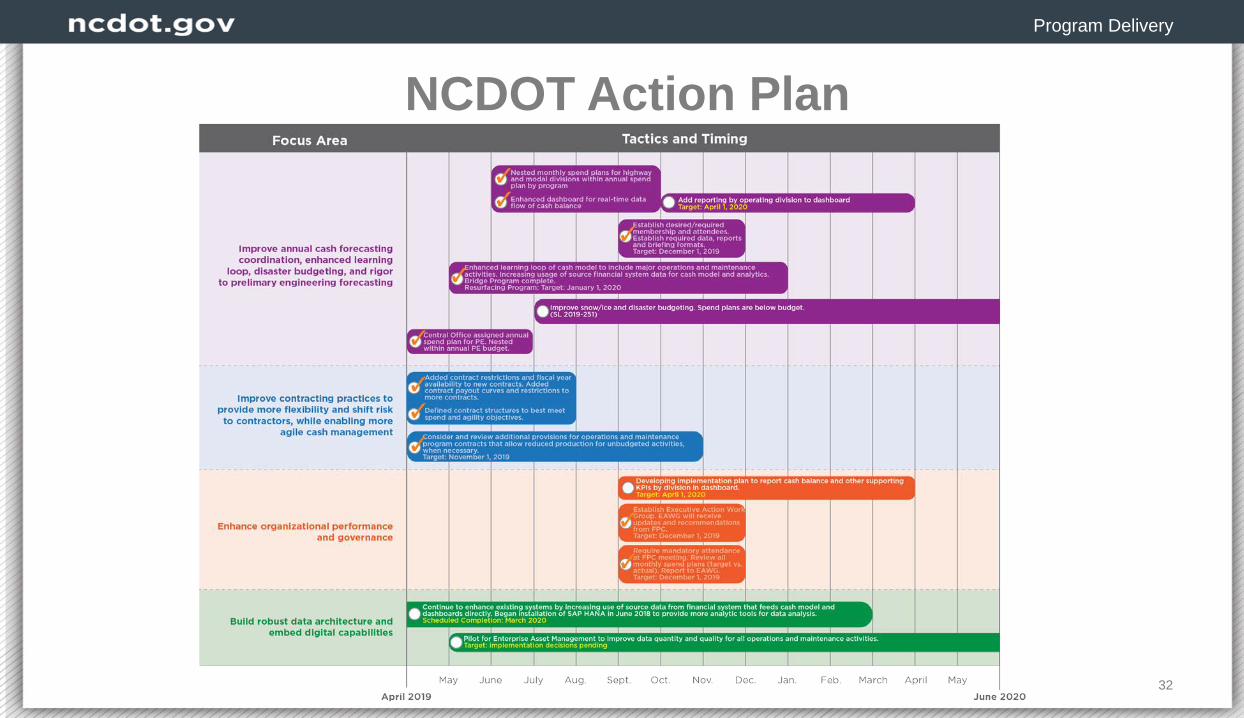
NCDOT Action Plan

Actions to Keep Cash Balance Above Floor
33
Spending Reductions• Operations and Maintenance Spend Plan for FY 2020
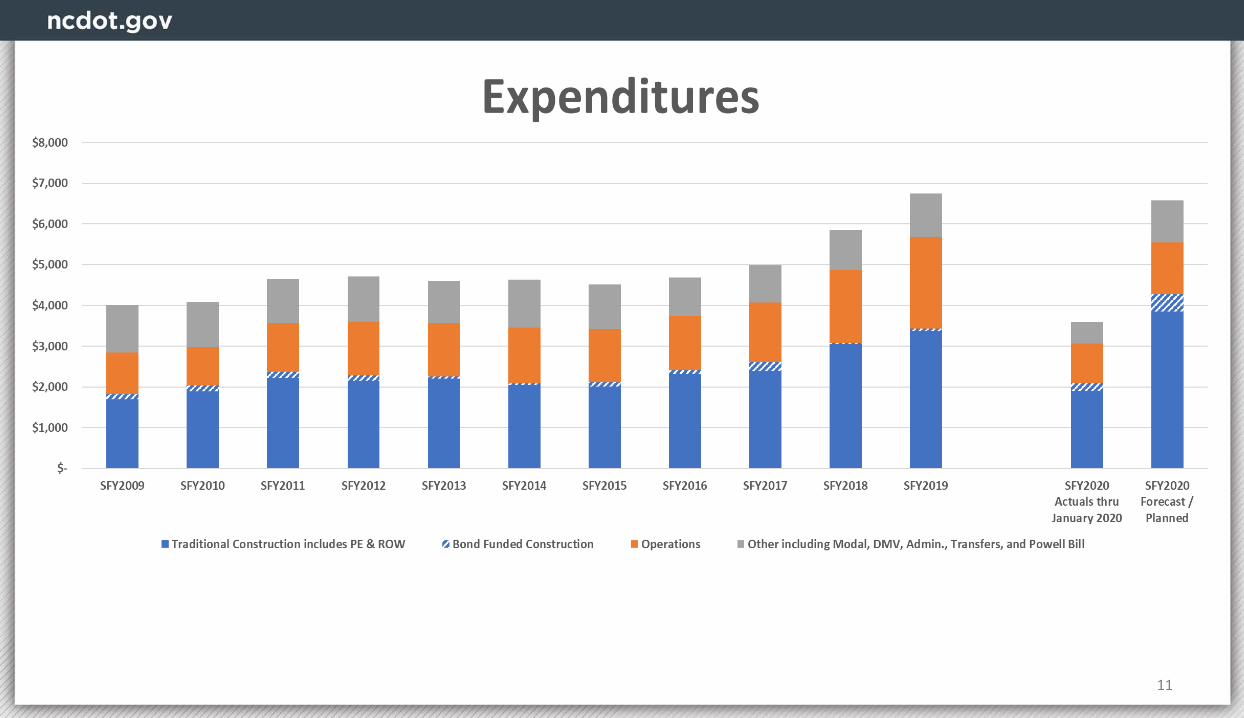
capped spending at $1.9B– Approximately 15% reduction – Conference Budget appropriations is approximately $2.25B
• Capital Program Spend Plan for FY 2020 capped at $3.7B– PE = $375M – R/W = $473M– Construction = $2,835M
• Expended approximately $3.5B of $5.3B thru 02/28/20
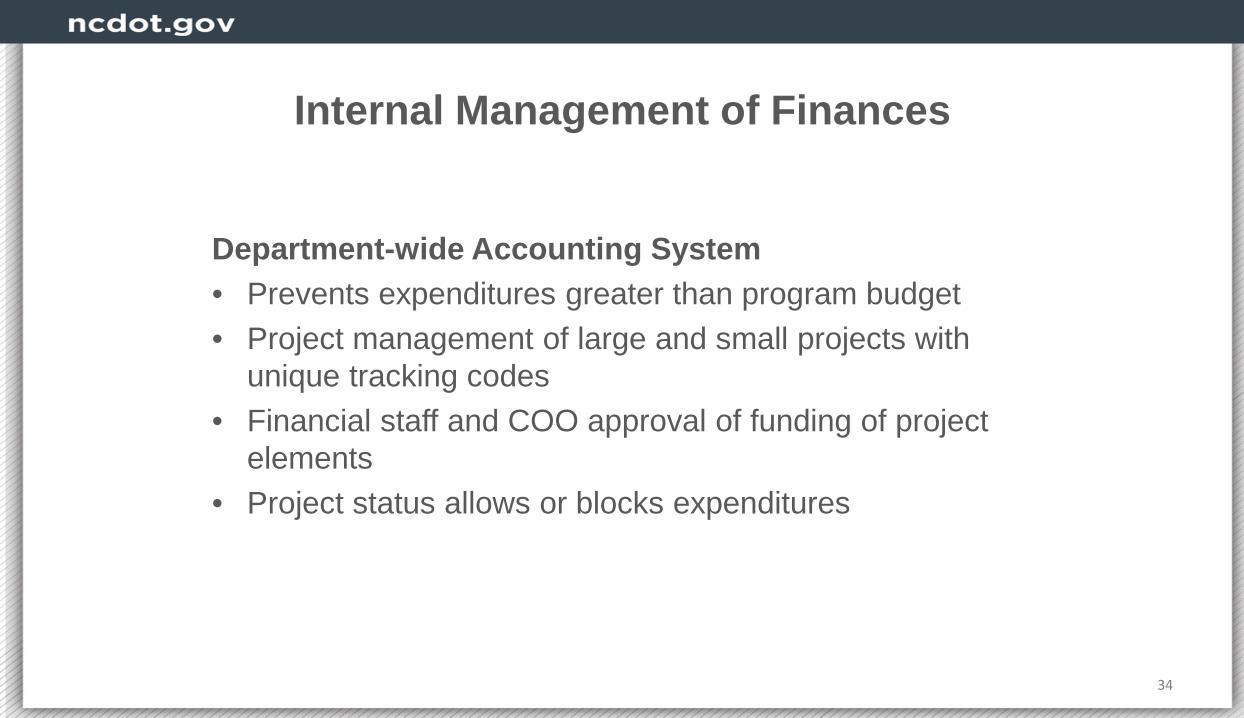
Internal Management of Finances
Department-wide Accounting System• Prevents expenditures greater than program budget• Project management of large and small projects with
unique tracking codes• Financial staff and COO approval of funding of project
elements• Project status allows or blocks expenditures
34

Internal Management of Finances
Department-wide Invoice Approval• Three levels of review• Unit reviews invoice to verify accuracy, places into
accounting system• Inspector General staff review consultant and grant
invoices for compliance; construction, ROW and municipal invoices reviewed by appropriate office
• Financial Management staff conduct final review before payment
35

Internal Management of Finances
Division of Highways• Chief Engineer and staff weekly review requests > $1000• Divisions projecting and modeling expenditures through
FY, updating quarterly• Cash Analytics for Operations and Maintenance
Activities• Financial management measures part of performance
reviews
36
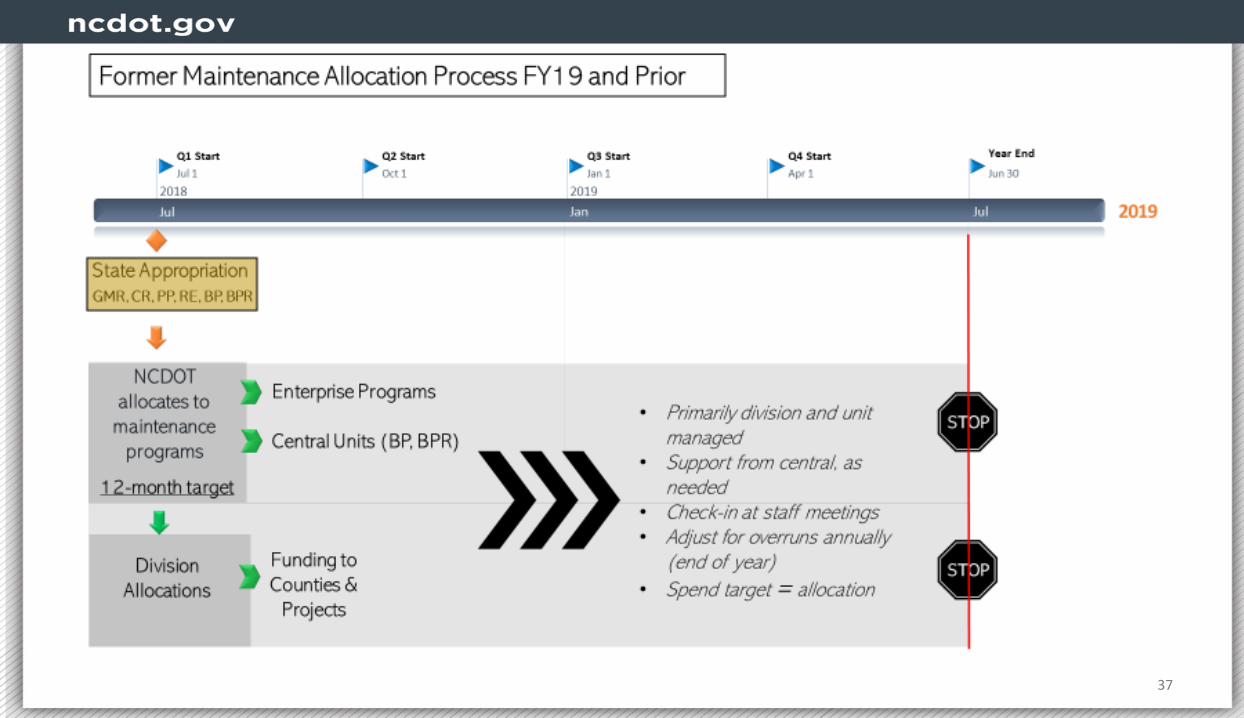
37

38

Contract Resurfacing Forecasting
39

Bridge Replacement
40

Internal Management of Finances
Division of Motor Vehicles• All procurements approved by Deputy Commissioner• Procurements over $5000 approved by Commissioner &
Chief Deputy Secretary
Ferry/Aviation/Rail/Integrated Mobility• Expenditures limited & approved by Deputy Secretary for
Multimodal• Each division provides monthly cash flow forecast• Financial management measures part of division
directors’ performance reviews
41

Reporting Required by S.L. 2019 - 251
• Weekly Reports– Beginning and ending cash balance (posted on web site)
• Monthly Reports– Federal disaster reimbursement status– When department’s cash balance outside target range (replacing when
balance above $1B)– HF and HTF balance sheet
• Biennial report– Emergency Reserve evaluation
• As needed report – Unanticipated budget adjustments when dept. reduces program budgets
to meet emergency needs• One-time reports
– Performance Audit (conducted by State Auditor)– Financial Management
42

43
Questions?
Bobby LewisChief Operating Officer
Evan RodewaldChief Financial Officer


