
Calhoun: The NPS Institutional Archive
Reports and Technical Reports All Technical Reports Collection
1993-12
Navy Nuclear Recruiting Markets:
Race-Ethnic/gender Qualification Rates
Thomas, George W.
Monterey, California. Naval Postgraduate School
http://hdl.handle.net/10945/29404

S23
NPS-AS-93-031
NAVAL POSTGRADUATE SCHOOL
Monterey, California
Navy Nuclear Recruiting Markets:
Race-Ethnic/Gender Qualification Rates
George Thomas
&Kathryn Kocher
December, 1993
Approved for public release; distribution unlimited.
Prepared for: Navy Recruiting CommandCode 22
801 N.Randolph St.
PedDocs Arlington, VA 22203
D 208.14/2NPS-AS-93-031

NAVAL POSTGRADUATE SCHOOLMonterey, CA
RADM T.A. Mercer Harrison ShullSuperintendent Provost
The report was prepared for and funded by the NavyRecruiting Command, Arlington, VA.
Reproduction of all or part of this report is authorized
This report was prepared by:

REPORT DOCUMENTATION PAGE Form ApprovedOMB No. 0704-0188 Is
3Public reporting burden for this collection of information is estimated to average 1 hour per response, including the time for reviewing instructions, searching existing data sources, gathenni
and maintaining the data needed, and completing and reviewing the collection of information Send comments regarding this burden estimate or any other aspect of this collection
information, including suggestions for reducing this burden, to Washington Headquarters Services, Directorate for inlnformation Operations and Reports, 1215 Jefferson Davis Highway, Suite
1204, Arlington, VA 22202-4302, and to the Office of Management Budget, Paper Reduction Project (0704-0188), Washington, DC 20503
ofi n O3no
> 73
OX1. AGENCY USE ONLY (Leave Blank) REPORT DATE
December, 1993
REPORT TYPE AND DATES COVEREDTechnical Report, December, 1993 » 6 00
3 oi
4. TITLE AND SUBTITLE
Navy Nuclear Recruiting Markets:
Race-Ethnic/Gender Qualification Rates
6. AUTHOR(S)
George Thomas & Kathryn Kocher
5. FUNDING NUMBERS
N6671592WR02063
PERFORMING ORGANIZATION NAMES(S) AND ADDRESS(ES)
Naval Postgraduate School
Department of Systems Management
555 Dyer Rd., Rm. 229
Monterey, CA 93943-5103
8. PERFORMING ORGANIZATIONREPORT NUMBER
NPS-AS-93-031
9. SPONSORING /MONITORING AGENCY NAME(S) AND ADDRESS(ES)
Naval Postgraduate School
Department of Systems Management
555 DyerRd., Rm. 229
Monterey, CA 93943-5103
10. SPONSORING/MONITORINGAGENCY REPORT NUMBER
11. SUPPLEMENTARY NOTES
12a. DISTRIBUTION / AVAILABILITY STATEMENT
Approved for public release; distribution unlimited
12b. DISTRIBUTION CODE
13. ABSTRACT (Maximum 200 words)
This report presents exploratory model-building for identifying and analyzing the recruiting market for Navy
occupations in the highly technical nuclear field. Variation in eligibility for nuclear occupations by race and
gender subsets of the recruiting market is examined. Logistic regression models for race/gender market
segments estimate the relationship of socioeconomic factors and geographic location to four classifications
of mental qualifications: (1) high quality (mental category IMA and above) eligible for Navy nuclear
occupations, (2) high quality not eligible for these highly technical occupations, (3) mental category IIIB, and
(4) not eligible for the military labor market (mental category IV and below). The results of these models are
then used to estimate the size of nuclear qualified markets of 17 to 21 year old high school graduates at the
county level. Great variation in nuclear qualification by gender and race-ethnic group is apparent in these
estimates with white males qualifying at rates substantially above all other groups. Regional variation
reflects these demographic characteristics.
14. SUBJECT TERMS
Navy nuclear occupations, gender race-ethnic group differences, mental group
categories, recruiting markets.
15. NUMBER OF PAGES
69
16. PRICE CODE
17. SECURITY CLASSIFICATIONOF REPORT
Unclassified
18. SECURITY CLASSIFICATIONOF THIS PAGE
Unclassified
19. SECURITY CLASSIFICATIONOF ABSTRACT
Unclassified
20. LIMITATION OF ABSTRACT
Unlimited
NSN 7540-01-280-5500 Standard Form 298 (Rev 2-89)
Prescribed by ANSI Std 23908
298-102


NAVY NUCLEAR RECRUITING MARKETSRace-Ethnic/Gender Qualification Rates
By
George W. Thomasand
Kathryn M. KocherNaval Postgraduate SchoolMonterey, CA 93943-5103
(408) 656-2741
December 1993
The opinions expressed are solely those of the authors.

ABSTRACT
This report presents exploratory model-building for identifying and analyzing the
recruiting market for Navy occupations in the highly technical nuclear field. Variation in
eligibility for nuclear occupations by race and gender subsets of the recruiting market is
examined. Logistic regression models for race/gender market segments estimate the relationship
of socioeconomic factors and geographic location to four classifications of mental qualifications:
(1) high quality (mental category IIIA and above) eligible for Navy nuclear occupations, (2) high
quality not eligible for these highly technical occupations, (3) mental category IIIB, and (4) not
eligible for the military labor market (mental category IV and below). The results of these
models are then used to estimate the size of nuclear qualified markets of 17 to 21 year old high
school graduates at the county level. Great variation in nuclear qualification by gender and race-
ethnic group is apparent in these estimates with while males qualifying at rates substantially
above all other groups. Regional variation reflects these demographic characteristics.
n

TABLE OF CONTENTS
Page
Abstract iiTable of Contents iii
List of Tables ivList of Figures v
I. INTRODUCTION 1II. OCCUPATIONAL CHANNELING AND ASVAB SCORES 4
A. ASVAB and AFQT 4B. Categories of Technical Occupations 5C. The Navy Nuclear Field Program 6
III. THE NLSY DATA 8IV. NAVY NUCLEAR MARKET ESTIMATING MODELS 10
A. Theoretical Model 1©B. Selection of Explanatory Variables 10C. Empirical Models 11
V. APPLICATION OF NAVY NUCLEAR MODELS TO NATIONAL MARKETS . 14A. County Level Estimating Procedure 14B. Population Data 15
VI. ESTIMATES OF MENTAL GROUP/NUCLEAR QUALIFICATION RATES. . 18A. National Estimates by Gender and Race/Ethnic Group. ISB. Regional Estimates 22C. Underlying ASVAB Subtest Score Differentials. ... 25
VIII. MENTAL GROUP/NUCLEAR RATING ELIGIBILITY FOR 1990ACCESSIONS 27A. Qualification at Accession by Gender and
Race/Ethnic Group 27B. Qualification by Region 32C. Underlying Enlistee ASVAB Subtest Scores 37
IX. CONCLUSIONS 39A. Summary 39»
B. Implications and Recommendations 40
REFERENCES 43APPENDIX A REGIONAL NUCLEAR RATING/MENTAL GROUP
QUALIFICATION DISTRIBUTIONS 45APPENDIX B SHRINKAGE OF 199 ALL-SERVICE AND NAVY
ACCESSIONS 53DISTRIBUTION LIST 60
111

LIST OF TABLESPage
Table 1
Table 2
Table 3
Table 4
Table 5
Table 6
ASVAB Test Format and Skill Areas 4
Distribution of the NLSY Sample by Gender andRace/Ethnic Group 9
Standardized Logistic Regression Coefficients forNavy Nuclear Qualification by Gender and Race/Ethnic Group, NLSY High School Graduates Age 17-21. 121990 Estimated Occupational Qualification HighSchool Graduates Age 17 to 21 by Gender and Race-Ethnic Group 19Nuclear Rating/Mental Group Qualification 1990High School Graduate All-Service Accessions Age17 to 21 By Gender and Race/ Ethnic Group 28Nuclear Rating/Mental Group Qualification 1990High School Graduate Navy Accessions Age 17 to21 By Gender and Race/Ethnic Group 29
IV

LIST OF FIGURESPage
Figure 1 Shrinkage of Hypothetical Pool of 20 Million HighSchool Graduates Age 17 to 21 By Gender 20
Figure 2 Estimated Nuclear Rating/Mental Group Qualifica-tion, High School Graduates Age 17 to 21 By Raceand Gender 21
Figure 3 Estimated Nuclear Rating/Mental Group Qualifica-tion, Civilian Male High School Graduates Age 17to 21 for Selected Counties 23
Figure 4 Estimated Nuclear Rating/Mental Group Qualifica-tion, Civilian Female High School Graduates Age 17to 21 for Selected Counties 24
Figure 5 Percent Nuclear Rating/Mental Group Qualification,1990 High School Graduate All-Service AccessionsAge 17 to 21 by Gender 30
Figure 6 Percent Nuclear Rating/Mental Group Qualification,1990 High School Graduate Navy Accessions Age 17to 21 by Gender 31
Figure 7 Nuclear Rating/Mental Group Qualification by Raceand Gender, 1990 All-Service Accessions, HighSchool Graduates Age 17 to 21 33
Figure 8 Nuclear Rating/Mental Group Qualification by Raceand Gender, 1990 Navy Accessions, High SchoolGraduates Age 17 to 21 34
Figure 9 Nuclear Rating/Mental Group Qualification, 1990Male High School Graduate All-Service AccessionsAge 17 to 21 for Selected Counties 35
Figure 10 Nuclear Rating/Mental Group Qualification, 1990Male High School Graduate Navy Accessions Age 17to 21 for Selected Counties 36


I. INTRODUCTION
Recruiting success is dependent predominantly on the nature of the civilian labor market,
the level of military requirements, the quality mix of requirements, the availability of recruiting
resources, and competition from colleges and civilian employers. As the U.S. domestic
economy improves, a major issue for the military is whether it will be able to attract enough
people who are able to handle complex weapon systems. The rivalry between civilian and
military employers will become even more intense. Current population forecasts indicate that
the workforce entry-age cohort will decline until the mid 1990s. The level of general intellectual
achievement of high school graduates has been predicted to decline during this same period
(Kocher and Thomas 1991). The Office of Technology Assessment (1990) estimates that 20%
to 30% of the workforce is already deficient in the basic skills required to perform effectively
in the workplace.
The recruiting environment will continue to change radically during the remainder of the
1990s. The desired quality mix of recruits will be revised as the military employs a smaller,
smarter, more resilient force to match sophisticated weapon systems. The demand for high
quality recruits may even increase while total requirements are decreasing. At the same time,
national budget deficit reduction measures will substantially reduce recruiting resources available
to the military. In addition, interest in the military has declined since the end of the cold war,
and will probably continue to decline as the mission of the U.S. military remains unclear. If
the dominant mission becomes intervention in regional conflicts, general interest in the military
may decline even further.
Efficient recruiting for highly specialized military occupations requires identification of
1

the qualified military available and interested market for those occupations. The target market
for military recruits generally is defined on the basis of age (17 to 21 years old), high school
graduation, and physical, moral, and mental qualification. Mental qualification is usually
indicated by a sufficiently high score on the Armed Forces Qualification Test (AFQT), an
arithmetic composite of several sublists of the Armed Services Vocational Aptitude Battery
(ASVAB). A distinct subset of the general qualified military available (QMA) market is eligible
for highly technical military occupations. Qualification for technical occupational fields,
including the nuclear field program, is based primarily on a candidate's score on specific subsets
of the ASVAB. After passing additional qualification screens, some QMA recruits are eligible
for the lengthy and expensive training that leads to the more technical and complex military
occupations. Nuclear field rating also requires a minimum score on the Nuclear Field
Qualification Test (NFQT), as well as educational background qualification.
The purpose of this report is to develop prototype models for identifying and analyzing
the recruiting market for the highly technical Navy nuclear occupations. These econometric
recruit qualification models are then used in determining what portion of the youth labor market
in a local geographic region will qualify for these occupations. Recruiter management decisions
such as recruiter allocation and goal setting are dependent upon appropriate measures of local
recruiting markets. By providing improved market measures, these models can be used as a
basis for more efficient use of recruiting resources.
This study develops statistical models for the achievement of the minimum test score
required for entry into training for highly technical Navy nuclear ratings. Sociodemographic
characteristics such as age, gender, race/ethnic group, educational background, economic status,

and family background have been shown to influence an individual's performance on the ASVAB
(Gorman and Thomas 1993). These characteristics are utilized as explanatory variables in
modeling eligibility for nuclear ratings. Because our ultimate goal is the application of the
results to local labor markets, the explanatory variables are restricted to those for which
measures are available nationwide at the local level (county and/or zipcode).
As updated forecasts of market segment population size and measures of local level
explanatory variables become available over time, changes in qualification for these occupations
can be predicted by county. Estimates developed from our models can also be compared with
historical county level Navy nuclear enlistments.

II. OCCUPATIONAL CHANNELING AND ASVAB SCORES
A. ASVAB and AFQT
All four military services use the Armed Services Vocational Aptitude Battery, or
ASVAB, to screen applicants (U.S. Department of Defense 1992). As shown in Table 1, the
ASVAB contains ten subtests designed to measure the ability of recruits in separate general skill
areas. The Armed Forces Qualification Test, or AFQT, is used by all the services as their
primary screening device for mental qualification for entrance into the military. AFQT is a
specific aptitude composite based on three ASVAB subtests:
• arithmetic reasoning
• word knowledge
• paragraph comprehension.
TABLE 1
ASVAB TEST FORMAT AND SKILL AREAS
SUBTEST Minutes/Questions
11 / 2536 / 3011 / 3513 / 153 / 507 / 84
11 / 2524 / 2519 / 259 / 20
Description ofSubtest Content
1. General Science (GS)2. Arithmetic Reasoning (AR)3. Word Knowledge (WK)4. Paragraph Comprehension (PC)5. Numerical Operations (NO)6. Coding Speed (CS)7. Auto and Shop Info. (AS)8. Mathematics Knowledge (MK)9. Mechanical Comprehension (MC)
10. Electronics Information (EI)
Physics and biology.Arithmetic word problems.Meaning of words.Obtain written inform.Arithmetic speed test.Speed test.Knowledge about cars.High school mathematics.Mechanical & physical principles.Electricity & electronics.
Although the Air Force, Army, Marine Corps and Navy use the AFQT for their general
recruit screening, separate ASVAB subtest or subtest composite scores are used to filter recruits
into training pipelines for various occupational fields. Specific subfunctional areas each require
4

a specific set of minimum scores. However, the branches do not use uniform composites to
screen recruits for similar training. ASVAB composites with the same aggregate classification
may be composed of different groups of subtests for different branches; for example, the
mechanical composites for Navy and Air Force are constructed in different ways (Eitelberg
1988, p. 71).
B. Categories of Technical Occupations
The services do not use uniform groupings of military occupations nor do they use
uniform ASVAB composites for recruit screening and assignment. At present, the Navy uses
11 ASVAB classification composites: GT (General Technical), MECH (Mechanical), ELEC
(Electronics), CLER (Clerical), AM (Aviation Structural Mechanic), BE/E (Basic Electricity/
Electronics), BT/EN/MM (Boiler Technician/Engineman/Machinists Mate), MR (Machinery
Repairman), SUB (Submarine), CT (Communications Technician) and HM (Hospitalman). The
recruiter encourages the applicant to sign up for the field to which he or she is best suited, given
the surplus or shortage of personnel for different occupational specialties.
The Navy is the only service that differentiates occupations into the three general
categories: semitechnical, technical, and highly technical. Data provided by the Defense
Manpower Data Center indicate that about one third of all Navy enlisted personnel are assigned
to the least technical job category (semitechnical). This category includes boatswains mate,
boiler technician, ship's serviceman, and postal clerk. At the other end of the technical
occupations are the highly technical Navy jobs. Examples include sonar technician, data systems
technician, missile technician, air traffic controller, and cryptologic technician, as well as those
occupations in the nuclear field program. Approximately 20 percent of all enlisted personnel
are assigned to jobs of this kind.
C. The Navy Nuclear Field Program
The Navy Nuclear Field Program was designed to recruit, assign, and train enlisted
personnel to serve as propulsion plant operators on either nuclear submarines or nuclear surface
warships. Because highly trained and qualified individuals are required to staff the nuclear
powered fleets, screening, selection, and training are rigorous. Eligibility criteria for personnel
operating nuclear engineering plants have been developed jointly by the Navy and the
Department of Energy (U.S. Department of the Navy 1992).
Completion of the Nuclear Field Program leads to qualification as a mechanical operator,
electrical operator, or reactor operator. These three operator ratings are drawn from the
Machinist's Mate (MM), Electrician's Mate (EM), and Electronics Technician (ET) ratings,
respectively. Nuclear operators are expected to serve ultimately as senior enlisted nuclear
propulsion plant watch supervisors. All three operator positions require an understanding of all
aspects of reactor plant design and thus must be cross-trained.
In order to be considered for the Navy nuclear field, an enlistee must be between 17 and
25 years of age, must not have a total active military service exceeding four years at time of
enlistment, and must meet the Navy's physical and moral standards. In addition, candidates
must be high school diploma graduates who have completed one year of high school or college
level algebra with a grade of at least "C". There are additional ASVAB test score requirements,
as well as a minimum achievement level on an additional test, the Nuclear Field Qualification
Test (NFQT). Currently, the nuclear field is closed to women.
The required ASVAB scores include:

VE + AR = 113 with NFQT = 49 or higher, or
VE + AR = 108 to 112 with NFQT = 55 or higher.
These additional minimum ASVAB scores must also be achieved:
1. MK + AS = 96
2. AR + 2MK + GS = 196
3. MK + EI + GS = 156
4. MK + El + GS + AR = 218,
as well as:
VE + NFQT = J 10 or higher.
Our approach to estimating the size of the Navy nuclear field recruiting market is based
on the results of a national sample survey of civilian youth that includes respondents' scores on
the ASVAB. This survey, however, does not include a national sample of scores on the NFQT.
Consequently, the criteria for Navy Nuclear Field Program eligibility for this report have been
restricted to the minimum ASVAB requirement, VE + AR = 108 or higher, as well as the
above four additional composite scores.

III. THE NLSY DATA
From 1979 to 1987 the National Longitudinal Survey of Youth (NLSY) collected data
nationwide on education, training, labor force experience, financial status, and other
characteristics for a statistically representative sample of the U.S. youth population (Center for
Human Resources Research 1991). In 1980, sponsored by the Department of Defense, the
Armed Services Aptitude Battery (ASVAB) was administered to both the civilian and military
youth samples in the NLSY. The Department of Defense used these test results to develop
current norms for the ASVAB (U.S. Department of Defense 1982).
The NLSY sample consists of three groups: (1) a cross-section national sample of
American youth, aged 14 to 21 as of January 1, 1979 in their proper population proportions; (2)
a sample designed to over represent civilian Hispanics, blacks, and economically disadvantaged
whites, and (3) a military sample designed to represent the population aged 17 - 21 as of January
1, 1979 who were serving in the military as of September 30, 1978. Of the original 12,686
NLSY respondents, 11,914 took the ASVAB in 1980. Of this group, 5,969 respondents were
male and 5,945 respondents were female. The military sample took the ASVAB test a second
time, accounting for 823 males and 457 females. (They had taken the ASVAB for the first time
on entering military service). Table 2 shows the distribution of the NLSY sample by race/ethnic
group and gender.
Studies of test performance on the AFQT and the development of estimating equations
for regional QMA has been pioneered in a research program at The Naval Postgraduate School:
Sinkiewicz (1990), Peterson (1990), Snyder (1990), Woods (1990), Moreau (1991), Uslar
(1991), Bicakaiz (1992), and Schultz (1992). Thomas and Gorman (1991) used a combination
8

TABLE 2
DISTRIBUTION OF THE NLSY SAMPLE BY GENDER AND RACE/ETHNIC GROUP
Cross-SectionSample6,111
SupplementalSample5,295
MilitarySample1,280
TOTAL
12,686
MalesWhite 2,439Black 346Hisp. 218
FemalesWhite 2,477Black 405Hisp. 226
MalesPoor White 742Black 1,105Hisp. 729
FemalesPoor White 901Black 1,067Hisp. 751
MalesWhite 609Black 162Hisp. 53
FemalesWhite 342Black 89Hisp. 25
MalesWhite 3,790Black 1,613Hisp. 1,000
FemalesWhite 3,720Black 1,561Hisp. 1,002
Source: NLSY Handbook 1991
of AFQT scores and sociodemographic variables to predict both qualified military available for
enlistment, and the size of local civilian labor markets likely to join the military for 1990 to the
year 2010.

IV. NAVY NUCLEAR MARKET ESTIMATING MODELS
A. Theoretical Model
The ordered multinomial logit model was used to estimate nuclear rating/mental group
distributions (Maddala 1983). The logit function
g(P) = logp̂
is the inverse of the cumulative logistic distribution, which is given by F(X) = , 1-_x
X I C
Suppose Yj can take on ordered values 1 m where m is an integer greater than 1. Pij5
the
probability that the ith individual has made choice j given the vector of personal characteristics
X;, is
'F(a, + b'Xj) forj = l
F(aj + b'Xj) - V{aiA + b'Xj) for 1< j <m
1-F(am., +b'Xj) forj=m.
B. Selection of Explanatory Variables
Selection of explanatory variables was based on the joint criteria of (i) behavioral
soundness, (ii) inclusion in the NLSY data set and (iii) the availability of similar county level
variables on a nationwide basis. Socioeconomic and regional background characteristics
influence the eligibility of the respondents for the prime market. Research by Bock and Moore
(1984) has shown that parents' educational attainment, and especially mother's education,
influences individual performance on the AFQT. Parents' education strongly affects certain
ASVAB subtests such as Word Knowledge, Mathematics Knowledge, General Science,
10
Pij - P(YH|X,) = <

Arithmetic Reasoning, and Paragraph Comprehension, but the effect on other subtests is more
limited. A variable called "parents education" was constructed. If both parents' education was
available, the average was used. If one parent's education was missing, the educational
attainment of the other was used in order to maintain sample size. Higher parental educational
level was expected to increase the probability of nuclear qualification.
The socioeconomic status of a respondent also was accounted for by a proxy variable
indicating whether or not the individual's family was living in poverty. This poverty status
variable was expected to have a negative influence on eligibility for the prime market and hence
also for the nuclear high tech ratings.
As shown in the previous section, when the continental states are grouped into regions
identified as Northeast, South, North Central and West, variation in the distribution of eligibility
for the nuclear categories throughout the four regions is apparent. Eligibility was lowest in the
South. In order to capture this effect, a dichotomous variable ("South") was used to indicate
whether or not an individual resided in the South census region.
C. Empirical Models
The Navy nuclear qualification model estimates the likelihood of an individual being in
each of four mental groups (1) Nuclear, (2) High Quality/Not Nuclear, (3) mental category IIIB,
and (4) mental category IV or below, not eligible for the military labor market.
Separate models were estimated by gender and race/ethnic group. A priori, it was
expected that being black or Hispanic would decrease the likelihood of being eligible for
technical military occupations for both males and females. Furthermore, poverty status (0=not
poverty, 1 =poverty) and the residence in the South census region were expected to decrease the
11
probability of classification in the higher mental groups.
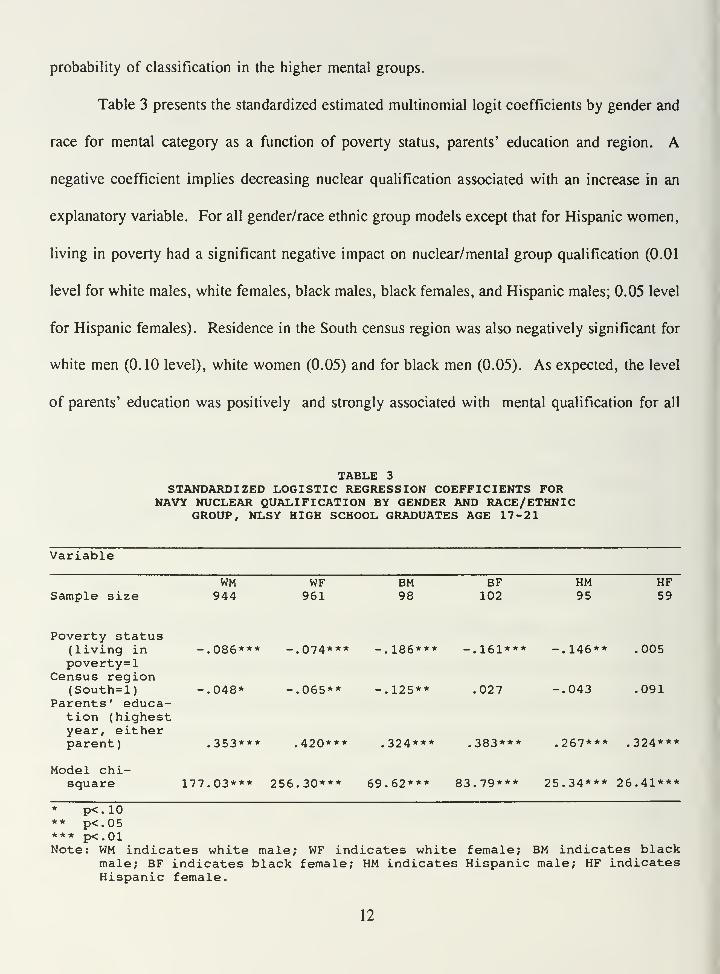
Table 3 presents the standardized estimated multinomial logit coefficients by gender and
race for mental category as a function of poverty status, parents' education and region. A
negative coefficient implies decreasing nuclear qualification associated with an increase in an
explanatory variable. For all gender/race ethnic group models except that for Hispanic women,
living in poverty had a significant negative impact on nuclear/mental group qualification (0.01
level for white males, white females, black males, black females, and Hispanic males; 0.05 level
for Hispanic females). Residence in the South census region was also negatively significant for
white men (0.10 level), white women (0.05) and for black men (0.05). As expected, the level
of parents' education was positively and strongly associated with mental qualification for all
TABLE 3STANDARDIZED LOGISTIC REGRESSION COEFFICIENTS FOR
NAVY NUCLEAR QUALIFICATION BY GENDER AND RACE/ETHNICGROUP, NLSY HIGH SCHOOL GRADUATES AGE 17-21
Variable
WM WF BM BF HM HFSample size 944 961 98 102 95 59
Poverty status(living in -.086*** -.074*** -.186*** -.161*** -.146** .005poverty=l
Census region(South=l) -.048* -.065** -.125** .027 -.043 .091
Parents' educa-tion (highestyear, eitherparent) .353*** .420*** .324*** .383*** .267*** .324***
Model chi-square 177.03*** 256.30*** 69.62*** 83.79*** 25.34*** 26.41***
* p<.10** p<.05*** p<.01Note: WM indicates white male; WF indicates white female; BM indicates black
male; BF indicates black female; HM indicates Hispanic male; HF indicatesHispanic female.
12

models (0.01 level). The model chi-square (difference between full model and intercepts only)
was significant (0.01 level) for all models.
13

V. APPLICATION OF NAVY NUCLEAR MODELS TO NATIONAL MARKETS
A. County Level Estimating Procedure
The logistic regression equations derived in section IV were used to calculate the
probabilities of a county's high school graduate population being classified into each mental
group for each gender/race-ethnic group segment of a county's population using the values for
poverty and parent's education 1
for each market segment in the county. For example, the
percent of blacks in poverty in county K, average parents' education for blacks in county K, and
South/not South location for county K were substituted in the logit equation to yield probabilities
for mental group category membership for black males in county K. (Probabilities sum to one
across mental groups for black males in county K).
The model results were then combined with county-level population estimates for
each gender/race-ethnic group segment to estimate the number of high school graduates
qualifying for each mental category by gender, race, and geographic region in a particular year.
The number of high school graduates of a gender/race-ethnic group residing in a county was
multiplied by the probability of belonging to a particular mental group category within a
gender/race-ethnic group segment:
CATjjk= (HSG^PCAT^
jcounty
jk),
where CATijk
is the number of individuals in mental group/nuclear qualification category i in
each market segment j (gender/race-ethnic group) in county k. HSGjk is the number of high
school graduates in market segment j in county k, and PCATijlc
is the probability of an
1 The county value of educational attainment of adults 25years or older was used as a proxy for parent's education for eachrace-ethnic category.
14

individual being classified in CAT i given the socioeconomic characteristics of market segment
j in county k.
Thus, the number of black male high school graduates in county K in 1990 was
multiplied by the probability of a black male with the average black male socioeconomic
characteristics in county K scoring in a particular mental group to yield an estimate of the
number of black males who would meet this criterion in county K in 1990. Estimates for each
mental group/nuclear qualification category were then summed across a county to yield total high
school graduates for the gender/race-ethnic group segment.
B. Population Data
Woods & Poole Econometrics, Inc. (W&P) 2 provided estimates of high school
graduates between 17 and 21 who were not in the military for each county in the continental
United States for 1990-2010. Six estimates for each county were included, one for each race-
ethnic group (white, black, Hispanic) within gender groups. (Estimates of high school graduate
gender/race population segments from other sources can be used in conjunction with our nuclear
rating/mental group estimating equations).
The population estimates developed by W&P are for high school graduates (both
diploma graduates and GED holders). This population is appropriate for this study because, in
recent years, the military services have limited recruiting almost exclusively to high school
graduates. Such a restriction, however, does give rise to some confusion when these estimates
2 The W&P population estimates used for this report are notbased on the 199 census results. We recommend that updatedpopulation and sociodemographic estimates be used to update thespecific county level market estimates. However, such updateswould have no effect on the race/gender relationships in ourestimating models.
15

are compared with alternative data sources that include all residents, regardless of degree status.
Many 17 to 21 year olds are not high school graduates - some are enrolled in high school and
will eventually receive a diploma; others will eventually obtain a GED; and still others will not
achieve either a diploma or a certificate. W&P estimates for 17 and 18 year olds are much
smaller than those based on total residents, since a large proportion of total residents in this age
group are high school students who have not yet graduated. This will tend to understate market
size.
Another area in which the version of W&P estimates used for this report differ
from other estimates used for estimating recruit market size is the inclusion of college students
in the W&P forecasts. While recruiting resources tend to be directed at high school seniors, the
prime market age group considered here includes those up to 21 years old, many of whom are
full-time or part-time college students. This will tend to overstate market size.
The starting point for the W&P forecasts for total white, black and other
population are the Current Population Reports Series P-25 No. 952. Total Hispanic population
estimates are based on CPR Series P-25, No. 995. The forecast for total Hispanic population
assumes that counties with large Hispanic populations in the early 1980s will experience the
largest growth in Hispanic population through 2010. The Census Bureau defines Hispanic
population as persons of Spanish origin, regardless of race and W&P take the same approach.
We have adjusted the W&P forecasts to prevent double counting by treating Hispanics as a
separate, mutually exclusive race/ethnic group category. Our white category includes all
nonblacks and nonHispanics.
County residential population forecasts are derived from W&P's proprietary
16

forecasting models. This approach is largely econometric, rather than strictly an extrapolation
of demographic trends. The models have three components:
(1) County employment by industry forecasts based on a macroeconomic
model of total U.S. employment by industry, a regional export-base model
for 183 "Economic Areas," and county export-base employment models.
(2) Initial estimates of total county population based on changes in
employment derived from (1) above.
(3) Estimates of county population by age, gender, and race based on a
cohort-survival model and a net migration model that is employment
driven, rather than an extrapolation of historical migration patterns.
Based on the W&P forecasts, the 17 to 21 year old population is expected to
decline during the 1990s and to begin to increase early in the next century. The race/ethnic
group composition of the youth population is anticipated to reflect a larger proportion of blacks
and Hispanics and thus a smaller proportion of whites. Educational attainment is expected to
fall through 2010 with a slight decline in the proportion of high school graduates among 17 to
21 year olds.
Largely due to the fact that the W&P county forecasting model is based on
employment driven migration rather than on historical migration patterns, the regional
distribution of the forecast youth population differs somewhat from the Census projections.
W&P forecasts greater population growth for the West, Midwest and Northeast, and somewhat
slower growth for the South.
17

VI. ESTIMATES OF MENTAL GROUP/NUCLEAR QUALIFICATION RATES
A. National Estimates by Gender and Race/Ethnic Group
Table 4 shows the gender/race-ethnic group distribution of nuclear qualification estimated
for 1990. One view of the pattern of qualification rates for the U.S. as a whole may be gained
from the "shrinkage" of a pool of qualified individuals as the qualification criteria become more
stringent. Figure 1 traces a hypothetical group of 20 million high school graduates 17 to 21
years old, from the qualification criteria for membership in mental category IV and below
through eligibility for Navy nuclear ratings. Race-ethnic group proportions for these 20 million
reflect the race-ethnic group distribution of the civilian population of 17-21 year old high school
graduates. Men and women show similar qualification patterns until the nuclear qualification
stage is reached. Out of 10 million males and 10 million females, there would be 7.3 million
men and 7. 1 million women who qualify as IIIB and above. The IIIA and above group would
have 800 thousand more men than women. For the nuclear category, 2.6 million out of 10
million men qualify, but only 300 thousand women from an original group of the same size
qualify. That is, over eight times as many male high school graduates would qualify for such
highly technical ratings as would women.
Figure 1 masks the disparity in qualification rates among race-ethnic groups. Figure 2
illustrates the distribution of nuclear qualification rates and mental categories within gender/race-
ethnic group segments using W&P population estimates for 1990. It is striking that white males
qualify for the highly technical nuclear ratings at three times the rate of the next largest group,
Hispanic males. White females qualify at less than half the rate of Hispanic males, and black
males at less than a third the rate of white females. Black and Hispanic women have extremely
18

TABLE 4
1990 ESTIMATED OCCUPATIONAL QUALIFICATIONHIGH SCHOOL GRADUATES AGE 17 TO 21BY GENDER AND RACE-ETHNIC GROUP
(percent)
Nuclear High Quality/Qualified Not-Nuclear IIIB
BelowIIIB Total
White male(n=3,587,232)
White female(n=4,252,084)
Black male(n=476,423)
Black female(n=726,924)
Hispanic male(n=386,468)
Hispanic female(n=414,645)
All males(n=4,450,121)
All females(n=5,393,653)
Total(n=9, 843,776)
30.8 31.1 19.2 18.9 100.0
3.7 50.7 25.8 19.7 100.0
2.1 12.3 15.6 70.0 100.0
0.3 11.3 18.2 70.2 100.0
10.5 23.3 22.8 43.4 100.0
0.6 19.1 27.5 52.8 100.0
26.0 28.4 19.1 26.5 100.0
3.0 43.0 24.9 29.1 100.0
13.4 36.4 22.3 27.9 100.0
19

co—
t—:e CM
o O
H— Is*.
o T_"
___ CDo D)oCL<CO
co CD
o CO--• DCD T7jl:
o 2
>%—X o
oH— c~o OCD CO
CO
CD
c
c X
CO co
"U
H^
CO13
C D"o k—
</i -1—
»
(0CD co CD
(0 o OE M— D
"coz
LL
oCL
o
>oCO
(3 "O iH
c 0)
"co(0 in
< OX)• »•
CD'"
t*
^ ^
D)C >"-* o
0) CO .Q
DC (0
(0 XJ^ CO c
CO
CM O CO CD ^t CM O
O CD
20

coIBM+-»
COo
O o
o t-
c coOCD CD
^ •£ "O
— 3 CO
O)^ CDC i_ Q'5 CD <oco q:cc oi- oCO _c
oo co
2 D)
"P =C•«—
•
co
E•-•
CO
UU
co
wJ)(0
E0)LL
O"c(0Q.</)
CO
co
ECD
o
CD
to
_a>
ca
EQ)LL
CD
1c
$s as
CO
co
o"cCO
°- c
COo
co
oQ.D
co Oa) x_
"co C5
o_co
CO
t/)
JDCO
CD
1c
CO-f-»
c
D)Cco
DC
CO
_0o
CO
V
CO
CO
O"i—
CO_CD
ODC•-•
Oc
T30)
*^"(0
CT
CO
o
4)UsWD
fa
co
21

low qualification rates, less than one percent.
At the lower end of the mental group distribution, white men and women fail to qualify
above category IV at about the same rates (18.9% and 19.7%, respectively). Black males and
females are much less likely to score above Category IV, with 70.0% and 70.2%, respectively,
failing to meet this criterion and, consequently, ineligible for military service. Hispanic youth
fall between the two extremes, with 43.4% of men and 52.8% of women in this lowest
category.
B. Regional Estimates
Variation in mental group qualification and nuclear rating by census region is described
in the tables in Appendix A. The East and North Central census regions display very similar
rates of nuclear qualification while the South has a slightly lower percent eligible for nuclear
occupations and the West has a slightly higher percent. These distributions within regions are
similar for male and female high school graduates. Appendix A identifies the states in each
census region.
It is difficult to appreciate the differences in occupational qualification among geographic
areas from such a broad aggregate as census region. To demonstrate local market variation in
occupational qualification, we show the distributions of nuclear rating and mental group
qualification for men and women civilian high school graduates between 17 and 21 years of age
for three counties in Figures 3 and 43. Los Angeles county, with 22 percent of males nuclear
3As shown in Figure 1, the national male civilian nuclearqualification rate is about 26%.
22

cotoo
Csl
Co +-•
StZ3 D)O <
58 8CO CO +i
.E o <»
CD -C v-
o .2>p=5 X lJ-
COo
T~ c"D CO
CD =to >
CO
LU
CO
Vco %"f-» onCOo ^^
"cO
13 CO
O 13
cr
a.
oCO
_0U
O 3c
CO oc L.
a> <^D)C
*+-» T3CO
DC h^
v_ (0CO 13
CD cr
o13
como13
upDX)
23

o v^
H= OHZ *-•
Q. O)=3 <2 CO
CD £ <s>
_ to <D
S 2 gSO Q
.E o ©
CO -C COCD D) j_
O tO) .CD
"° 5(D CO•*-* zz
.E oCOLU
<OCO
_Q)
D)C<CO
o
<(3
co
Li.
CQ
co %
*•*-* COCOo "^—
•
75D CO
o cr
Q_
Oco
OoC 0>
15+-
•
c•4-*
oc
P
CD < feSD) >C
• IWIII-I uCO
DCCD
it:
i_ COCO D
cr
o13
COmoZ3
24

qualified, falls between Fulton county (16 percent) and Johnson county (40 percent)4
.
The county distributions for women show only 2 percent of female high school graduates
to be nuclear qualified in Fulton and Los Angeles counties, whereas 6 percent are qualified for
nuclear occupations in Johnson county5.
C. Underlying ASVAB Subtest Score Differentials
A pattern of differential ASVAB subtest and subtest composite scores accounts for these
estimated disparities in nuclear qualification by gender and race-ethnic group. When ASVAB
subtest scores for men and women civilian high school graduates ages 17 to 21 are compared,
within each race-ethnic group, men scored significantly higher than women on all composites
used to channel enlistees into highly technical jobs. These composites are: (i) VE+AR, where
VE=(PC+WK), scaled to the mean for individual subtests; (ii) MK+ AS; (iii) AR+2MK+GS;
(iv) MK+EI+ GS; and (v) MK+EI+GS + AR. Of the subtests in these screens, women scored
significantly lower on AR, AS, GS and EI, while their scores on MK and VE were not
significantly different from those of men. Those subtests on which women's scores are
significantly higher than men's (PC,NO, and CS), or where there is no significant difference
(VE, MK, and WK), have very limited (MK and VE), or no (NO and CS) influence on
composites used for nuclear screenings (based on Bonferroni t-tests for all six gender/race-ethnic
groups, p<0.05). The arithmetic reasoning (AR) subtest has by far the greatest differential
effect on qualification by gender, followed to a much more limited extent by electronics
4If highly technical enlistees are a target market, thenrecruiting resources should parallel these markets, afteraccounting for size and other market differences.
5The national female civilian nuclear qualifications rate isabout 3%, as shown in Figure 1.
25

information (EI) and auto shop information (AS).
When race-ethnic group scores within gender groups are compared (based on the same
Bonferroni t-tests), white civilian high school graduates between 17 and 21 years old have
significantly higher scores than Hispanics or blacks on all subtests (and composites) for men and
women. High school graduate Hispanics, in turn, have significantly higher scores than blacks
on all subtests (and composites) for men and all but four subtests (MK, GS, EI, and MC) for
women. The arithmetic reasoning (AR) subtest, again, has the most influential role in nuclear
qualification differentials by race-ethnic group.
26

VIII. MENTAL GROUP/NUCLEAR RATING ELIGIBILITYFOR 1990 ACCESSIONS
The pool of civilian youth qualified for miliary service discussed in Section VII provides
a base population for recruiting purposes. Interest in joining the military, physical and moral
qualification standards, alternative civilian labor market and educational opportunities, and
recruiting practices are all influential in determining who actually will enlist in the armed
services. High quality recruits are needed to fill the Navy's highly technical jobs but they are
also the subset of the youth population that schools and civilian employers are anxious to attract.
A comparison of the estimated national civilian distribution of nuclear rating and mental group
qualification with actual accessions for 1990 yields a picture of a very high quality cohort
entering the military. A great diversity by gender and race is readily apparent in the qualifica-
tion of actual accessions for highly technical occupations such as those in the Navy nuclear
program.
A. Qualification at Accession by Gender and Race/Ethnic Group
Tables 5 and 6 show nuclear rating/mental group qualification rates for 1990 actual
accessions. The "shrinkage" of the pool of all-service enlistees as qualification criteria become
more stringent as can be seen in Figure 5. There was a much higher proportion of nuclear
qualified among men (34 percent for all-service accessions) than among women (20 percent for
all-service accessions). Navy accessions (Figure 6) followed the same pattern, with 33 percent
of male enlistees and 18 percent of female enlistees eligible for nuclear ratings. Figure 1
indicated that only 26 percent of male and 3 percent of female high school graduates in the
civilian population would qualify on the same basis.
27

TABLE 5
NUCLEAR RATING/MENTAL GROUP QUALIFICATION1990 HIGH SCHOOL GRADUATE ALL-SERVICE ACCESSIONS AGE 17 TO 21
BY GENDER AND RACE/ETHNIC GROUP(Percent)
Nuclear High Qual ity/ BelowQualified Not Nucl ear IIIB IIIB Total
White Male(n=119,719) 41.0 32.5 24.0 2.5 100.0
White Female(n=15,040) 26.3 55.9 17.4 0.4 100.0
Black Male(n=30,748) 10.3 31.2 48.9 9.6 100.0
Black Female(n=6,280) 6.2 58.3 34.4 1.1 100.0
Hispanic Male(n=10,844) 22.1 37.2 35.7 5.0 100.0
Hispanic Female(n=l,344) 12.5 63.4 23.7 0.4 100.0
All Males(n=161,311) 33.9 32.6 29.5 4.0 100.0
All Females(n=22,664) 19.9 57.0 22.5 0.6 100.0
All Accessions(n=183,975) 32.2 35.6 28.6 3.6 100.0
28

TABLE 6
NUCLEAR RATING/MENTAL GROUP QUALIFICATION1990 HIGH SCHOOL GRADUATE NAVY ACCESSIONS AGE 17 TO 21
BY GENDER AND RACE/ETHNIC GROUP(Percent
)
Nuclear High Quality/Qualified Not Nuclear IIIB
BelowIIIB Total
White Male(n=37,520)
White Female(n=3,968)
Black Male(n=10,351)
Black Female(n=l,605)
Hispanic Male(n=4,568)
Hispanic Female(n=585)
All Males(n=52,439)
All Females(n=6,158)
40.9 28.8 24.8 5.5 100.0
23.0 48.7 27.4 0.9 100.0
9.1 23.6 48.5 18.8 100.0
5.5 49.5 42.5 2.5 100.0
27.6 34.4 29.4 8.4 100.0
14.5 60.0 24.6 0.9 100.0
33.4 28.3 29.9 8.4 100.0
17.7 50.0 31.0 1.3 100.0
All Navy Accessions(n=58,590) 31.8 30.6 30.0 7.6 100.0
29

CM
O
.2 CD
o <itz co
w CO
§-8
O a)
"£ £ 7355 CD C^ CO CD
•J= CD CO
DC §h5
"°CO coCD *-
Q- [?Xo
• »—H—•MM
DCT
to CC
0) CD
cc OF D
zli.
CD>OJQCO
DCCO In
= ta
SCD
> CMCM
to II
CD r. zCO cc
1
^ "C ^c (0
cc 1DQ ":
; ; :
;
T—CO
T-
< II
z% to
(0
<D
oz
30

CM
oc ««-»
o r^+-* —
—
05o CD
D)• mmmtm <05D CO
o co
Q. 'co13 CO
O CDi— oO o<
05 CD
v* g
CD
D)C 05
1303 "ODC 05
v_
05 oCD aaa
O13
ooo
+-* COcCD szO O)*
cd:
n o0>O)
T3CD
» — —
cr
CO
o
-Z
CD>OJQCO
*UCCO fc-
•—I
fa
CD>
03
O <o~
JQ II
CO c
T3 </>"
C Q)
CO(0
ECD <D
IJ-
cvi
CO
cm"inII
c(00)
<0
<D
oz
31
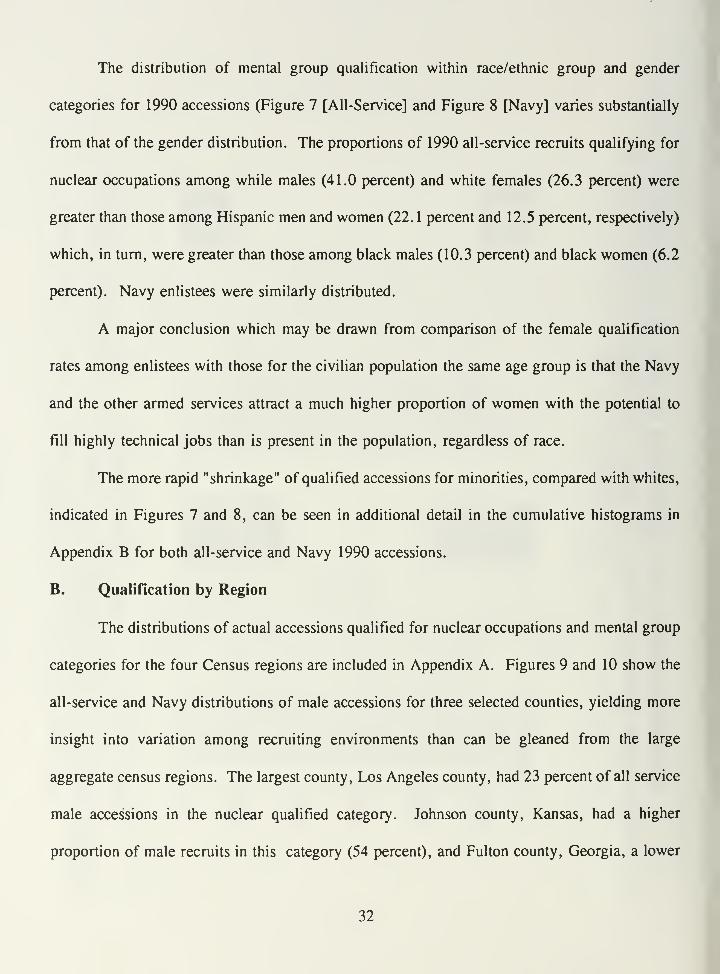
The distribution of mental group qualification within race/ethnic group and gender
categories for 1990 accessions (Figure 7 [All-Service] and Figure 8 [Navy] varies substantially
from that of the gender distribution. The proportions of 1990 all-service recruits qualifying for
nuclear occupations among while males (41.0 percent) and white females (26.3 percent) were
greater than those among Hispanic men and women (22. 1 percent and 12.5 percent, respectively)
which, in turn, were greater than those among black males (10.3 percent) and black women (6.2
percent). Navy enlistees were similarly distributed.
A major conclusion which may be drawn from comparison of the female qualification
rates among enlistees with those for the civilian population the same age group is that the Navy
and the other armed services attract a much higher proportion of women with the potential to
fill highly technical jobs than is present in the population, regardless of race.
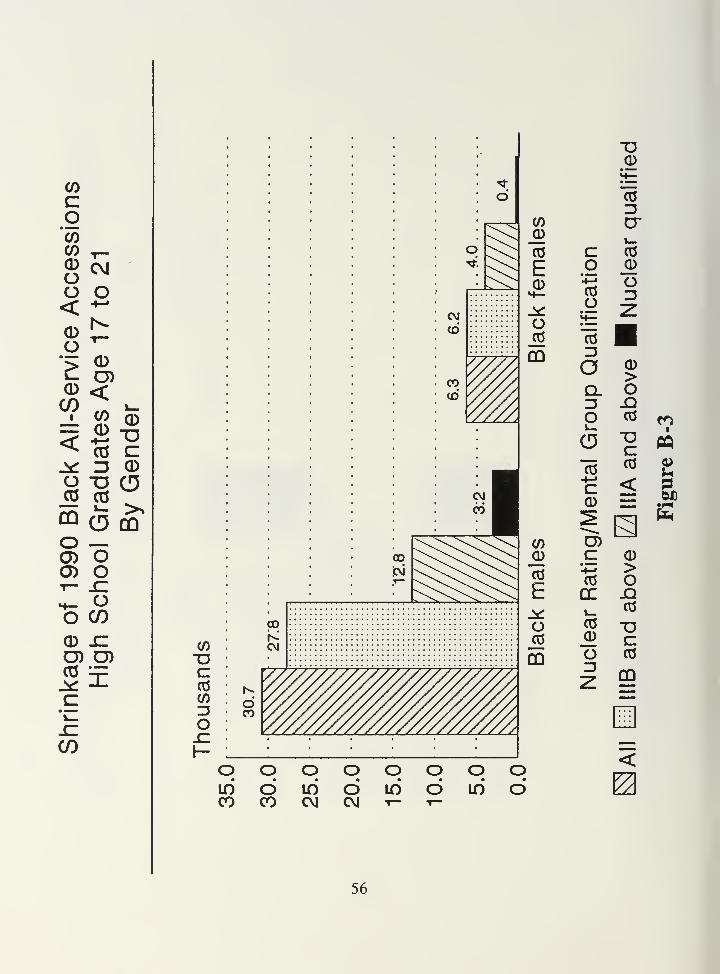
The more rapid "shrinkage" of qualified accessions for minorities, compared with whites,
indicated in Figures 7 and 8, can be seen in additional detail in the cumulative histograms in
Appendix B for both all-service and Navy 1990 accessions.
B. Qualification by Region
The distributions of actual accessions qualified for nuclear occupations and mental group
categories for the four Census regions are included in Appendix A. Figures 9 and 10 show the
all-service and Navy distributions of male accessions for three selected counties, yielding more
insight into variation among recruiting environments than can be gleaned from the large
aggregate census regions. The largest county, Los Angeles county, had 23 percent of all service
male accessions in the nuclear qualified category. Johnson county, Kansas, had a higher
proportion of male recruits in this category (54 percent), and Fulton county, Georgia, a lower
32

CD CMTD OC •*-»
CD V^
T3 CD
c D)CO <CD COO CDCO •*—
•
oc CO
>*"*
JD CO
o __
8°S oloco
O D)
Q.IO CO
o— (0CO CO
cCD
CDOO<
cCDO
CO£o
EL COi— 1
COCD <O oD CD7" O)
to
(0
£
OC(0
(0
JDCO
£0)Ll_
ojo
00
JD(0
£
CD
'sz
5
to
JD(0
c(0ato
toji>
(0
oJODO
tO
JD(0
CD
1c
o'•4—
»
COO
03ZJ
O
OO+-»
c:CD
C%—»CO
DCi—03
O
DQ
V
CO
CO
crv_
CO
oC-•oc
CD
CO
cr
CO
o
2
c(D
EO)(D(0
a.
2^D)
l
O 4>
5 S3
(0
0)
oca>O)
.co(0
EC
©jQ
CDCD
CO
Q)
o
33

ft 2CD O)
SS >* CO
£ CD"» d
0>J
CO
ECDLL
OCCOQ.
£ CO
o
CO0)
co
ECDLL
o_cg
m
CO_CD
CO
ECD
CD
CO
CO
o'cCOQ.CO
COCD
oJOCO
CO
CO
CD
'jz
5
(0
Doao
co C5
co
C
C*—
*
co
CO
o
GQ
V
g ^co 99o =
CO
D"i__
CO_CD
ODC»-»
Oc
CD
CODQ"
u-CO_CD
O
ca>
ED)<D
a.
Oo>oo.2 v
? OX)
(0
Q)
c<DD>
JCo(da>
.a
EDC
©
©
co
<D«-•
oz
34

co'•-•
COo
CM
o
CD<COCD•*—
»
CO13
DCO
o^ O CO
Clsz £=3 9 3o co o
2X0)c - o
CO (D
C (0 i-5= .?CO O LL
CO CD0) CJ
z CO
<CO
OCDCD
CO
coCOcx:o
<OC0~
_0
D)c<CO
o
<CD
co
UL
m
V
o £• —
COCOo mmm
• »'-
loZJ CO
o cr
3V—
CO
()1— O
c
13
C•-»
Oc n=167)
igure
9
(D < o</>
cCDC s
JCo-3
• —
—
"D <o
CO in
DC• •—H—•— CO
t.
.
CO II
CO D C
CD D" </>
<D
OCO
©
Cz O <D oz _J
II
c
co-•
35

CM
O+-»
h*T-
<DD)
C<O CO+3 CD
n%•— D05 05
o^ COCD
CL OD O DO -C Oo£ O^ £,
T3CD
•*^ D) •-•c ^= OCD X CD
CD
COc o v_
•HH • —
—
o+-• CO03 co U_GC^. o05 O<
O >,3 >z: iSz
CD
05
2OoO)
CO
coCOcSZo"3
<OCO0)
c<CO
o
<Oco+^
LL
05
o
15
050)
o13
CD
Vco '/,
» m im
CD05O
• — 1—
^^™
CODQ"
I §ZJ
C
Oc
CD <
D)C'5 "°05
CC iECODcr
CO
o
z
CO 0)
o "(0cx:o~3
CO
CM
II
c
©COCDc<o
CO
c
co

percentage (17 percent). Navy male enlistees from these three counties were similarly distri-
buted among nuclear rating/mental group qualification categories. The number of female
accessions in all but the largest counties was so small that similar county comparisons were not
feasible.
C. Underlying Enlistee ASVAB Subtest Scores
Underlying the greater similarity in qualification rates among men and women enlistees
when compared with their civilian counterparts are more limited gender differences in ASVAB
subtest scores used in the composites that screen for highly technical jobs. The relevant
composites are: (i) VE+AR; (ii) MK+ AS; (iii) AR+2MK+ GS; (iv) MK+EI+GS; and (v)
MK+EI +GS + AR. Among white all-service enlistees, men score significantly higher than
women on all but one (i) of these composites (based on Bonferroni t-tests for all six gender/race-
ethnic groups, p<0.05). Black women recruits score significantly higher than black men on two
(i and iii) of five composites, but significantly lower on the others. Hispanic women enlistees'
scores are not significantly different from Hispanic men's for one (iii) of the composites, but are
significantly higher for one (i) and significantly lower for the remainder. For accessions, the
electronics information (EI) subtest contributes most to differences in qualification between men
and women in all race-ethnic groups.
For male all-service accessions, race-ethnic group differences in subtest scores which
affect qualification for highly technical jobs show the same pattern as for civilians, i.e., whites
score significantly higher than Hispanics who, in turn, score significantly higher than blacks
(based on the same Bonferroni t-tests). Among women all-service accessions, the pattern is the
same, with whites' scores significantly higher than Hispanics' on all composites and blacks
37

scoring significantly lower than Hispanics on all relevant composites. Differences in scores for
the arithmetic reasoning (AR) subtest largely accounted for lower qualification rates for black
recruits and the general science (GS) and electronic information (EI) subtests contributed to
lower rates for Hispanics as well as blacks.
38

IX. CONCLUSIONS
A. Summary
Estimates of nuclear rating/mental group qualification for counties by gender and
race/ethnic group segment were constructed on the basis of ASVAB component scores from the
NLSY. A method was developed to utilize county-level sociodemographic values in logistic
regression equations estimated with the NLSY data base. Resulting probability estimates for
each nuclear rating/mental group category in each gender/race-ethnic group segment in each
county were then multiplied by county population projections for each segment to yield county
level forecasts. These forecasts of the civilian population distribution among nuclear
rating/mental group qualification categories for 1990 were then aggregated and compared with
Navy and all-service enlistments for the same year.
Great variation in qualification rates was observed in the civilian population estimates on
the basis of gender and race. While 26 percent of men qualified for nuclear occupations, only
3 percent of women were similarly qualified. Eligibility for highly technical jobs was more
limited for minorities than for whites. Almost 31 percent of white males and about 4 percent
of white females qualified, but only 2. 1 percent of black males and 0.3 percent of black females
were eligible for nuclear ratings. Hispanics in the civilian population fell between blacks and
whites with 10.5 percent of males and 0.6 percent of females in the nuclear qualified category.
Enlistments categorized by nuclear rating/mental group qualification show a pattern of
variation by gender and race-ethnic group similar to that found in the civilian population.
However, a much greater proportion of enlistees than civilians were nuclear qualified. Almost
34 percent of men and 20.0 percent of women joining the military services in 1990 were nuclear
39

qualified. The disparity between men and women is strikingly smaller than among the civilian
population of high school graduates between 17 and 21 years old. Navy male accessions were
33.5 percent nuclear qualified and women entering the Navy were 17.7 percent qualified for
these ratings.
White males were the most likely gender/race-ethnic group segment to be nuclear
qualified among all-service recruits, with 41.0 percent in this category. White women were next
highest with 26.3 percent, followed by Hispanic males (22.1 percent), Hispanic females (12.5
percent), black males (10.3 percent) and black women (6.2 percent). Qualification rates for
nuclear occupations were thus much higher for enlistees than for the civilian population for all
gender/race-ethnic group segments. Navy accessions showed the same pattern as all-service
accessions by gender and race-ethnic group, but with Hispanic males qualifying at slightly higher
rates than white women (27.6 percent vs. 23.0 percent).
B. Implications and Recommendations
A comparison of the 17 to 21 year old civilian high school graduate population with 17
to 21 year old high school graduate enlistments on the basis of nuclear qualification indicates that
the pool of qualified white women and minorities of both genders is relatively limited, but that
the services, including the Navy, have attracted a very "technically trainable" force with
representation from all gender/race-ethnic group segments including larger proportions of nuclear
rating eligible recruits in each segment than are present in the civilian population.
Enlistment standards, for the most part, limit recruits to mental categories IIIB and
above. Recruiting effort and enlistment incentives directed toward high quality (IIIA and above)
youth help in attracting these targeted individuals as may such exogenous factors as poor civilian
40

labor market conditions and the stagnant or slow growing level of general economic activity.
As the youth labor force changes in race-ethnic group composition over the next decade
to include a larger proportion of minority members, the nuclear qualified civilians will make up
a smaller percentage of the total market. Thus, the pool of qualified individuals will be
(relatively) smaller at a time when technical requirements for military occupations are expected
to increase.
The opening up of some nuclear fields to women may help to meet the demand for those
qualified for highly technical fields, though a much smaller percentage of women than men in
the civilian population are eligible. Although young women tend to have limited interest in
nontraditional jobs, higher-ability women show a greater tendency to choose sex-atypical
occupations (Waite and Berryman 1985). In addition, a larger percentage of the female youtn
labor force will be accounted for by minority women who have the lowest qualification rates
among gender/race-ethnic group segments. Despite these barriers, minority women comprise
a larger proportion of the military work force than they do of the civilian labor force and they
are more likely to work in nontraditional jobs than their civilian counterparts (Moore 1991;
Firestone 1992).
The evolution to a system of job placement which favors white males is not surprising,,
given the historical predominance of white men in the U.S. military. It is similar to that found
in the selection procedures of educational institutions and civilian employers and it challenges
the military to construct cost effective screening criteria for technical training that permit an
expanded opportunity for women and minorities. The Navy has made great strides in recent
years in opening career fields to women and in recognizing the need to increase minority
41

representation in many occupations. Continued reliance on occupational screens emphasizing
such dimensions as arithmetic reasoning, electronics information, and auto shop knowledge goes
counter to the egalitarian philosophy of reducing gender and race-ethnic group membership as
a basis for occupational eligibility in today's Navy. Such reliance should be altered or augmented
to assure the acquisition and training of a highly skilled Navy of the future. A closer evaluation
of the ASVAB subtest scores which are effectively screening out women and minorities from
technical training and occupations is warranted. Alternative cost effective screening criteria and
training programs that permit an expanded opportunity for females and minorities for technical
occupations should be explored.
42

REFERENCES
Bicaksiz, Adnan (1992). A PC-Based Model For Estimating Regional Recruit Markets .
Master's thesis. Monterey CA: Naval Postgraduate School.
Bishop, John H. (1989). "Is the Test Score Decline Responsible for the Productivity Growth
Decline?," American Economic Review , vol. 79, no. 1, pp. 178-197.
Bock, Darrel R. and Moore, Elsie G. (1984). The Profile of American Youth: Demographic
Influences on ASVAB Test Performance . Washington DC: Office of the Assistant Secretary of
Defense (Manpower, Installations and Logistics).
Center for Human Resources Research (1991). NLS Handbook 1991 . Columbus OH: the Ohio
State University.
Eitelberg, Mark J. (1988). Manpower for Military Occupations . Alexandria VA: Office of the
Assistant Secretary of Defense (Force Management and Personnel).
Firestone, Juanita M. (1992). "Occupational Segregation: Comparing the Civilian and Military
Work Force," Armed Forces and Society . Vol. 18(3), pp. 363-381.
Gorman, Linda and Thomas, George W. (1993). "General Intellectual Achievement, Enlistment
Intentions, and Racial Representativeness in the U.S. Military," Armed Forces & Society , vol.
19, no. 4.
Kocher, Kathryn M. and Thomas, George W. (1992). Youth Labor Force in the 21st Century .
Technical report. Monterey CA: Naval Postgraduate School.
Maddala, G.S. (1983). Limited Dependent and Qualitative Variables in Econometrics . NewYork NY: Cambridge University Press.
Moore, Brenda I. (1991). "African-American Women in the U.S. Military," Armed Forces and
Society . Vol. 17(3), pp. 363-384.
Moreau, Ellen (1991). Forecasting High Tech ASVAB Scores . Master's thesis. Monterey CA:Naval Postgraduate School.
Office of Technology Assessment, U.S. Congress (1990). Worker Training: Competing in the
New International Economy . Washington DC: U.S. Congress.
Peterson, Jeffery M. (1990). AFOT Score Forecasting Models For Regional Estimation of
Qualified Military Available . Master's thesis. Monterey CA: Naval Postgraduate School.
43

Schulz, David S. (1993). A Comparison of Alternative Measures of the Qualified Military
Available and Interested Recruit Market . Master's thesis. Monterey CA: Naval Postgraduate
School.
Sinkiewitz, James A. (1990). Predicting Enlistment Behavior From Stated Intentions and
Demographic Characteristics. Master's thesis. Monterey CA: Naval Postgraduate School.
Snyder, Paul R. (1990). An Empirical Analysis of Enlistment Intentions and Subsequent
Enlistment Behavior . Master's thesis. Monterey CA: Naval Postgraduate School.
Thomas, George W. and Gorman, Linda (1991). Estimation of High Quality Military Available
and Interested. Technical report. Monterey CA: Naval Postgraduate School.
U.S. Department of Defense (1992). ASVAB 18/19 Educator and Counselor Guide .
Washington DC: Department of Defense.
U.S. Department of Defense (1982). Profile of American Youth: 1980 Nationwide
Administration of the Armed Services Vocational Aptitude Battery . Washington DC: Office of
the Assistant Secretary of Defense (Manpower, Reserve Affairs and Logistics).
U.S. Department of the Navy (1992). BUPERS Instruction 1306.78. Pers-403f - Nuclear Field
Program .
Uslar, Hans J. (1991). A Prototype Model for Estimating High Tech Navy Recruiting Markets.
Master's thesis. Monterey CA: Naval Postgraduate School.
Waite, Linda J. and Berryman, Sue E. (1985). Women in Nontraditional Occupations: Choice
and Turnover . Santa Monica, CA: RAND.
Woods, Willis A. (1990). Analysis of Enlistment Incentives For High Quality Recruits to the
U.S. Army . Master's thesis. Monterey CA: Naval Postgraduate School.
44

APPENDIX AREGIONAL NUCLEAR RATING/MENTALGROUP QUALIFICATION DISTRIBUTIONS
45
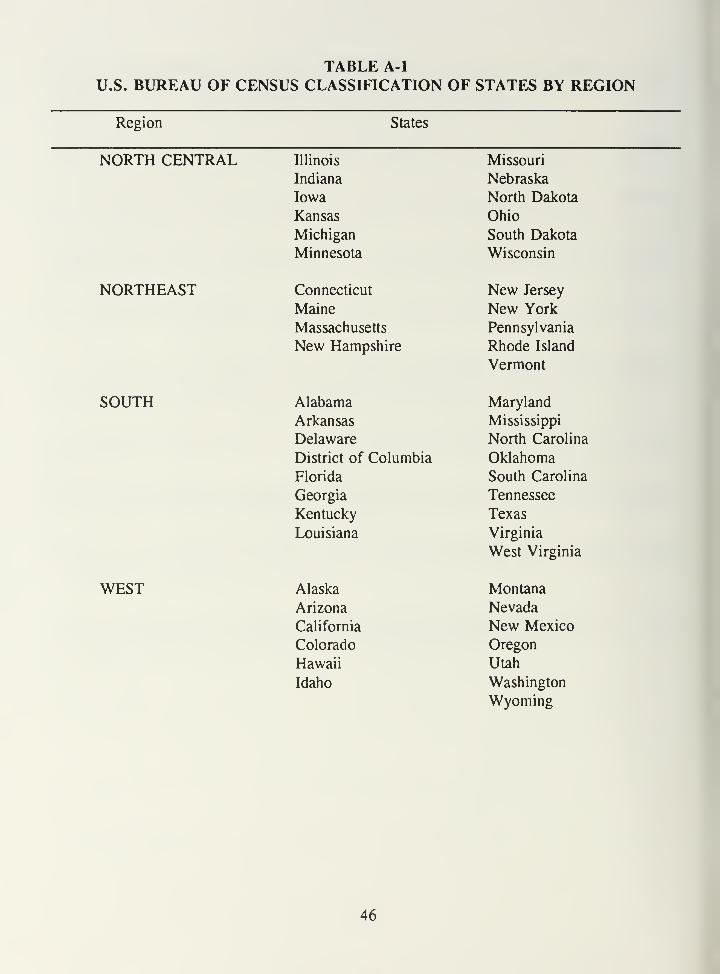
TABLE A-l
U.S. BUREAU OF CENSUS CLASSIFICATION OF STATES BY REGION
Region States
NORTH CENTRAL Illinois Missouri
Indiana Nebraska
Iowa North Dakota
Kansas Ohio
Michigan South Dakota
Minnesota Wisconsin
NORTHEAST Connecticut New Jersey
Maine New York
Massachusetts Pennsylvania
New Hampshire Rhode Island
Vermont
SOUTH Alabama Maryland
Arkansas Mississippi
Delaware North Carolina
District of Columbia Oklahoma
Florida South Carolina
Georgia Tennessee
Kentucky Texas
Louisiana Virginia
West Virginia
WEST Alaska Montana
Arizona Nevada
California New Mexico
Colorado Oregon
Hawaii Utah
Idaho Washington
Wyoming
46

cg
g T_
03 OD +-
co
OO
cCD
CD
D)< CCO O© '5)
05 CD
D DC
05
D)0C _05 X
CO
COcCD
O
CD
o JZO)
Z XDCD
05
05
2E-•COLU
co<LU
<DC
LUOz:
coLU
5
XHoCO
Vco %*-• CO05O ^^™
4—
05
oQ.13O(5
05-•cCD
05
OZJ
CO
cri_
CO
J0ODC
Oc
4>
fa
D)C05DC itz
CO
CO
o13
47

C T-g cm
o _.
• <»*»
§ CD
O <Q. co
°-§
cOoc<D —^ O
C O
DC -C
^ -^ CDCO "T
73 oTS ®
CO CDUJ Li-
Co
CO13COcCD
o
CO03
LU
CO
Ccd
O
a)
OCO
eg
v
§0'5 goCD =o —
CO0)
o
CO
oQl
o
"co -g
CODCTi—CO^D
O fS
C <- 2
9bi)
CCO ODC £
CODcri_
CO
O
48

COcg"toCO
oo<o
CO
CM
O
- COC
COCO
LUCO
.2 -g
g
DC
ToO
o °
o"co
CO13COc
o CO
x:
XC^^ CO
c!-»
CO
dci_CO
o3
CO
c
O3OCO
co
»—-»03O
0313
oQ.13
OO•4—
»
c
D)C•-»
CO
DCi—COOo13
CO
V
CO
CO
CTi_
CO
oc
oc
T3
oo
O)CVJ
II
(0
I
lO <
Z J3_- WD
OCO
6"CDoCM
* 2.
-> wCX <o
UJ
? Z..
O o3 °.
I"(0
*->
cCD
o
49

COco
*(/>
COCDOO<CD
CD OCO
+-
-1 h-
- .9
o D
o 2 CO
= ^ COCO —O3 O d)
13 CO CD
— X
CD <S
^.D)LLCV-»CO
cc
CO
o
CO(0LLI
CO
c
O
CD
+-»
co
CO • MM-1—
•
CDCO
5 oII
|i
To COCO
D To CM
o II
Q.
OCO
oWest,
N
4o C o^J"(0 o
CO 4)0>~ *H
c c I ^2
<
D)—
r
OC/5
"P T3ih"O)
CO «—
DC J*;;co"
II
i_ "(0 2-C CO D 4-T
13cr 0)
(0
O oCO
111
CO D z2 o 0>*
D T-
z 0>in
caV-
c©O
50

COco'coCOCDoo<
o
O h-O) T-
O)
c<O CO
<D+-
•
0313
~U03
03O
03
Q. OD Oor >
03
co
CD
a:
COZ3COcCD
O
COCO
LUCO
© x
03
DC
CO
c
O
co03o
0313
aQ.13Oa
cCD
D)C
• — i n -
03
DC
.c 03•*-»
D CD
O OCO 13
m
v
co
oC+-»
Oc
CD
CO13
ooCO
ammm oCO T~
~J II
CT -d
*->i_ (0
CO a>
CD £
UJ
.-
O k5* CNI
a3OCO
II
zJ
03a)
o(0v_+»c0)
O
51

COcO"COCOCDOO< r>*C\I
a o
O T-
C CO £O CD O'frt 03 O)
^ 2 od x: '-'
o o >,
x:CO .c?
Ex
D) £.E o03
DCv_03
o13
COcd
LUCO
033oQ.
OO75+-•
cCD
O)c+-!
<£ ^ •vX) 03r- ?-
«̂<i- DC1 CMCO i—
JZ 03c CDCD
Or-
^s*"s^ ^^^»
J
'. 1
oCO
*•—
O
z z:
go
vco'£ CD03 =O J—
03
U cvj
v- <M.
CO
OC
Oc< z
CO
cr
03
O
| NO
*<CO ?>cvj faCM
" .SJa
JZ»-»
Do
"S «CVJ
*ZI CJ)
w111
00
(0i_*-•
c(1)
O
52

APPENDIX B
SHRINKAGE OF 1990 ALL-SERVICE AND NAVY ACCESSIONS
53

COcoCOCO TM
o CM
o O< -»-»
0)N
-• 1
-C CD
£ O)<
a) 1—
o COCD
CD"> Ui_ CO cCD 13 CDCO "D C5
CO
< O CDo __O) oO) o1
—
SIH—ooCO
CD -CD) D)
• i
Xcv_x:CO
CO cCI) oCO +-»
E 03O
CDLL
H^
CODOQL
OO16•-»
c
C'*->
CO
CODCX
co
JDO
CD>On(0
cCO
CD>oJQCO
CO ~n® cO CO
-5 CD
* afa
54

(0cOr-CO CM
OO ^o r-< *-
> O)03 <
CO
•4-*
D05
C
OO) O COO) __*- oM- OO JC
U) UJ
05 x:
•iix:CO
in
d
d
d
"U
05Dcri—
CO c 05
o* ——05 -»-» OE 05
o zL±_
"ctf
a >Q_ o3 nO 05 <Nu_ i
O c CO
To 05-»c <
gon • p-^
^ ^ lH
O)Q^J
c*+-» >
CO 05 Oa: .Q
05 v_ CO
^ 05 T3C
O 05
D
55
COcoCOCO -r-® CMoo o< *-
0>£o> R£- o>^ <co 7r i_
i CO= CDCD
T3C^ ZJ CD
9 "^ oCO CO
•~"-~ * *>.
£Q(5ffio —O) oO) oT- XI*- 9o co
szD) O)5 TCi_JdCD
o inCM t-
coCOo
CO
OQ.
OO"c6+-»
cCD
+= >CO O
(0 X55 CO CO
3 m
CO
cr
CO
o
>o(0
"DCCO
COI
Mu
i §0r^fe
56

COco T-CO CMCOCD O
4—
»
oo r^
< i~
>* CD
> U)03 <-* 2 -a£ ^ c15 D CD
Cu
O) 00
T~ o«*- oo
oco
03 JdJ£ O)L. •mIMM X-CCO
COucCOCO
o
c0
CD
"D
«—CO13
CO cr&_
CO c CO
E oCD
(0o
=5
O
oCO
z
CQ Da >Q. oD &O CO rrV- 1
o c W"CO
CO
c <s,
• **
:> to
CO CDC
CO
E
•-» >CO O<r _Q
-^ i_ CO
o CO "OCO cgo O
zCO
CQ
o oo q
COqCD
o qcvi
oo n
57

COco'coCOCD
8w< o
o f^
COI
D)<
< $£C 3 CD
Q. CO ^
oO)
ooo
O jzCD .D)
CO -1-
.*:
cI—JZCO
en"DcCOco
o
"C1
H-CM •—° "cO
C/) D: r* - cr
^> CO i_
:°s: E c co,T" ^> o CD
: ^ ^ COo
O D<° ::::: E
o Z,J (0
::::: Q. "cO; ; ;
j co 13
oQ.
o
>Onco i/>
i
O T3 ^^^^_ "cO
CO <W
-»-»
c < P^
<Dzz M)
V
a ta
^SX ^^^^ "CO
:^^ EC
"•-»
co
cc
(0
>o
w :::::::::::::; *C:::::::::::::
(fl
CO
d i:;;;:::!:!:;! Q. CD c•;;;;•:::::::: CO O (0
•-*»
°°. '^M^MM^'/////// ^• CO
^^^yy^^^w^%m : :
:
* ' ' *
^t*
•
VJ
o 9 P 9CO CD «fr
q qc\i d
<
58

COcOCO ,—CO CM
o Oo *-»
< h-
>^1~
>o$ O)z: <o
•— CO1_
c "D05 05 cQ. DCO "D (DX 03
>*o oO) ___
O) o1
—
oH— JZo o
o-cco O)
c X%mm
szCO
TJCD
»—CO
CO DQ-
co L.
ECD
c CO
o CD
4— *-> oo CO
oif—
Dc zCO
"co
CO ZJ
r o CD>
Q. O13 JDO CO v©i_ 1
(3 C tt
"coCO v
ucCD £ &
C*+-»
CO
DC
>OCO
CO tj® cO CO
Z £9
ta
59
DISTRIBUTION LIST
Agency No. of Copies
Defense Technical Information Center 2
Cameron Station
Alexandria, VA 22314
Dudley Knox Library, Code 52 2
Naval Postgraduate School
Monterey, CA 93943-5103
Office of Research Administration 1
Code 81
Naval Postgraduate School
Monterey, CA 93943-5103
Department of Systems Management Library 1
Code SM/AhNaval Postgraduate School
555 Dyer RD RM 229 Bldg 330
Monterey, CA 93943-5103
Library, Center for Naval Analyses 1
4401 Ford Avenue
Alexandria, VA 22302-0268
CDR John Repicky 1
Commander, Navy Recruiting CommandCode 22
801 Randolph Street
Arlington, VA 22203-1991
Ed Schmitz 1
Navy Recruiting Command801 Randolph Street
Arlington, VA 22203-1991
Steven Cylke 1
BUPERSPERS-233
Arlington Annex
Washington, DC 20370
60

Jerry D. Lehnus 1
DMDC, Suite 400
1600 Wilson Blvd.
Arlington, VA 22209
H. Wallace Sinaiko, Program Director 1
Manpower Research and Advisory Service
Smithsonian Institution
801 N. Pitt Street
Alexandria, VA 22304
Dr. Jules J. Borack, Code 11 1
Navy Personnel R&D Center
53335 Ryne Road
San Diego, CA 92152-7250
Dr. W. S. Sellman 1
Director, Accession Policy
OASD (FM & P) DASD (MM & PP)/AP
The Pentagon, Rm. 2B271
Washington, DC 20301-4000
Robert Tinney 1
Defense Manpower Data Center - East
1600 N. Wilson Blvd., Ste. 400
Arlington, VA 22209-2593
George Germandik 1
Air Force Recruiting Service
550 D Street West, Ste. 1
Randolph AFB, TX 78150
Robert J. Brandewie, Deputy Director 1
Defense Manpower Data Center
99 Pacific Street, Suite 15AMonterey, CA 93940
George W. Thomas, Code SM/Te 10
Associate Professor of Economics
Systems Management Department
Naval Postgraduate School
555 Dyer RD RM 229
Monterey, CA 93943-5103
61

Kathryn Kocher, Code SM/Kk 20
Systems Management Department
Naval Postgraduate School
555 Dyer RD RM 229
Monterey, CA 93943-5103
James Hosek 1
The RAND Corporation
1700 Main Street
P. O. Box 2138
Santa Monica, CA 90407-2138
Professor Roger Little 1
Department of Economics
U.S. Naval Academy589 McNair Road
Annapolis, MD 21402
62


DUDLEY KNOX LIBRARY
3 2768 00336461 3


