
NAVAL POSTGRADUATE
SCHOOL
MONTEREY, CALIFORNIA
THESIS
Approved for public release. Distribution is unlimited.
AUTOMATED CONTROL OF A SOLAR MICROGRID–POWERED AIR COMPRESSOR FOR USE IN A SMALL-
SCALE COMPRESSED AIR ENERGY STORAGE SYSTEM
by
Joshua N. Williams
June 2017
Thesis Advisor: Anthony J. Gannon Co-Advisor: Andrea Holmes

THIS PAGE INTENTIONALLY LEFT BLANK

i
REPORT DOCUMENTATION PAGE Form Approved OMB No. 0704-0188
Public reporting burden for this collection of information is estimated to average 1 hour per response, including the time for reviewing instruction, searching existing data sources, gathering and maintaining the data needed, and completing and reviewing the collection of information. Send comments regarding this burden estimate or any other aspect of this collection of information, including suggestions for reducing this burden, to Washington headquarters Services, Directorate for Information Operations and Reports, 1215 Jefferson Davis Highway, Suite 1204, Arlington, VA 22202-4302, and to the Office of Management and Budget, Paperwork Reduction Project (0704-0188) Washington DC 20503. 1. AGENCY USE ONLY (Leave blank)
2. REPORT DATE June 2017
3. REPORT TYPE AND DATES COVERED Master’s thesis
4. TITLE AND SUBTITLE AUTOMATED CONTROL OF A SOLAR MICROGRID–POWERED AIR COMPRESSOR FOR USE IN A SMALL-SCALE COMPRESSED AIR ENERGY STORAGE SYSTEM
5. FUNDING NUMBERS
6. AUTHOR(S) Joshua N. Williams
7. PERFORMING ORGANIZATION NAME(S) AND ADDRESS(ES) Naval Postgraduate School Monterey, CA 93943-5000
8. PERFORMING ORGANIZATION REPORT NUMBER
9. SPONSORING /MONITORING AGENCY NAME(S) AND ADDRESS(ES)
Office of Naval Research with Technical Monitor of Marissa Brand and Richard Carlin
10. SPONSORING / MONITORING AGENCY REPORT NUMBER
11. SUPPLEMENTARY NOTES The views expressed in this thesis are those of the author and do not reflect the official policy or position of the Department of Defense or the U.S. Government. IRB number ____N/A____.
12a. DISTRIBUTION / AVAILABILITY STATEMENT Approved for public release. Distribution is unlimited.
12b. DISTRIBUTION CODE
13. ABSTRACT (maximum 200 words)
As part of the Office of Naval Research’s study of advanced energy technologies, this research examined the development and implementation of a control system for the compression phase of a small-scale compressed air energy storage system, using a solar-powered microgrid to store energy as compressed air for later use. The compression system is composed of numerous commercial-off-the-shelf components wherever possible. All electronic components must also be able to communicate with the control system for proper operation. An industrial control system was selected for robustness, with an attached human-machine interface for system indications.
The compression system is powered by a solar microgrid that temporarily stores energy in ultracapacitors. This allows the compression system to run even when the available solar radiance is not sufficient to power the compressor directly. By monitoring the ultracapacitors and the available solar radiance, the control system can maximize the compressor run time during a given solar cycle, enabling the system to store the maximum amount of energy possible. This research demonstrates the use of a small-scale compressed air energy storage system as a viable long-term energy storage solution for microgrid applications.
14. SUBJECT TERMS compressed air, solar, energy storage, automation, industrial control
15. NUMBER OF PAGES
115 16. PRICE CODE
17. SECURITY CLASSIFICATION OF REPORT
Unclassified
18. SECURITY CLASSIFICATION OF THIS PAGE
Unclassified
19. SECURITY CLASSIFICATION OF ABSTRACT
Unclassified
20. LIMITATION OF ABSTRACT
UU NSN 7540-01-280-5500 Standard Form 298 (Rev. 2-89)
Prescribed by ANSI Std. 239-18

ii
THIS PAGE INTENTIONALLY LEFT BLANK

iii
Approved for public release. Distribution is unlimited.
AUTOMATED CONTROL OF A SOLAR MICROGRID–POWERED AIR COMPRESSOR FOR USE IN A SMALL-SCALE COMPRESSED AIR ENERGY
STORAGE SYSTEM
Joshua N. Williams Lieutenant, United States Navy
B.S., University of South Carolina, 2010
Submitted in partial fulfillment of the requirements for the degree of
MASTER OF SCIENCE IN MECHANICAL ENGINEERING
from the
NAVAL POSTGRADUATE SCHOOL June 2017
Approved by: Anthony J. Gannon, Ph.D. Thesis Advisor
Andrea Holmes Co-Advisor
Garth V. Hobson, Ph.D. Chair, Department of Mechanical and Aerospace Engineering

iv
THIS PAGE INTENTIONALLY LEFT BLANK
v
ABSTRACT
As part of the Office of Naval Research’s study of advanced energy technologies,
this research examined the development and implementation of a control system for the
compression phase of a small-scale compressed air energy storage system, using a solar-
powered microgrid to store energy as compressed air for later use. The compression
system is composed of numerous commercial-off-the-shelf components wherever
possible. All electronic components must also be able to communicate with the control
system for proper operation. An industrial control system was selected for robustness,
with an attached human-machine interface for system indications.
The compression system is powered by a solar microgrid that temporarily stores
energy in ultracapacitors. This allows the compression system to run even when the
available solar radiance is not sufficient to power the compressor directly. By monitoring
the ultracapacitors and the available solar radiance, the control system can maximize the
compressor run time during a given solar cycle, enabling the system to store the
maximum amount of energy possible. This research demonstrates the use of a small-scale
compressed air energy storage system as a viable long-term energy storage solution for
microgrid applications.

vi
THIS PAGE INTENTIONALLY LEFT BLANK

vii
TABLE OF CONTENTS
I. INTRODUCTION..................................................................................................1 A. OBJECTIVES ............................................................................................4 B. LITERATURE REVIEW .........................................................................4
1. Operating Utility-Scale Energy Storage ......................................5 2. Conceptual Utility-Scale CAES Systems .....................................7 3. Small-Scale Energy Storage ........................................................10
II. EQUIPMENT AND COMMUNICATIONS .....................................................13 A. EQUIPMENT ...........................................................................................14
1. Electricity Production ..................................................................14 2. Charge Controller ........................................................................15 3. Temporary Energy Storage Medium .........................................16 4. DC to AC Inversion .....................................................................18 5. Inverter Monitoring .....................................................................18 6. Air Compressor ............................................................................19 7. Air Storage Tanks ........................................................................20 8. Air Dryer .......................................................................................21 9. Plant Control System ...................................................................22
B. SYSTEM AND EQUIPMENT LIMITATIONS ...................................23 C. METHODS OF COMMUNICATION ...................................................25
1. Multi-protocol Ethernet ..............................................................25 2. Allen-Bradley CIP via Ethernet .................................................25 3. Modbus via TCP/IP .....................................................................27 4. SMA Fieldbus ...............................................................................28
III. METHODS AND TESTING ...............................................................................29 A. CONTROL APPROACH ........................................................................29
1. Loss of Power Protection .............................................................29 2. Indication of Program Stall.........................................................29 3. Solar Power Production Status ...................................................31 4. Inverter State ................................................................................32 5. Compressor Restart Delay ..........................................................32 6. Manual Control Capability .........................................................33 7. Other Considerations...................................................................33
B. TESTING ..................................................................................................35
IV. CONCLUSIONS AND RECOMMENDATIONS .............................................37

viii
APPENDIX A. TANK VOLUME AND ENERGY CALCULATIONS ....................39
APPENDIX B. CONTROLLER SOFTWARE SETUP ..............................................43
APPENDIX C. CONTROLLER PROGRAM. ............................................................45 A. CONTROLLER WIDE SETTINGS ......................................................45
1. Settings ..........................................................................................45 2. Global Variables...........................................................................46 3. User-Defined Data Types ............................................................47
B. PROGRAMS ............................................................................................47 1. StartupReset .................................................................................47 2. UpdateSettings..............................................................................49 3. ProgHeartbeat ..............................................................................51 4. VerifySunState .............................................................................52 5. CompressorRestartDelay ............................................................54 6. CheckInverterStatus ....................................................................55 7. InverterOffHold ...........................................................................57 8. AutomaticInverterControl ..........................................................59 9. ManualInverterControl ...............................................................60 10. AutomaticCompressorControl ...................................................62 11. ManualCompressorControl ........................................................64 12. UpdateCompressorState..............................................................65
C. USER-DEFINED FUNCTION BLOCKS..............................................65 1. SunUp ............................................................................................66 2. IfTwoButtons ................................................................................67 3. LogicUDINT .................................................................................68 4. LogicUINT ....................................................................................69 5. F_OneSecTrigger .........................................................................69 6. R_OneSecTrigger .........................................................................70
APPENDIX D. SCREEN PROGRAM ..........................................................................71 A. NETWORK SETUP ................................................................................71 B. TAGS .........................................................................................................72 C. SCREENS .................................................................................................73
1. Operation ......................................................................................73 2. Settings ..........................................................................................75
APPENDIX E. MODBUS TESTING ............................................................................77 A. CONTROLLER PROGRAM .................................................................77
1. Controller Wide Settings .............................................................77

ix
2. Global Variables...........................................................................78 3. Function Block Diagram .............................................................79 4. Local Variables .............................................................................80
B. USER-DEFINED FUNCTION BLOCKS..............................................80 1. ModbusWrite: ..............................................................................80 2. modbus_ip_check .........................................................................81
C. HMI PROGRAM .....................................................................................82 1. HMI Settings.................................................................................82 2. HMI Tags ......................................................................................82 3. HMI Screens .................................................................................83
APPENDIX F. SUNNY WEBBOX UPDATE PROCEDURE ....................................85 A. FORMATTING SD CARD AS FAT-16 ................................................85 B. FLASHING NEW FIRMWARE ............................................................86
LIST OF REFERENCES ................................................................................................89
INITIAL DISTRIBUTION LIST ...................................................................................95

x
THIS PAGE INTENTIONALLY LEFT BLANK
xi
LIST OF FIGURES
Figure 1. Globally Averaged Greenhouse Gas Concentrations. Source: [3]. ..............1
Figure 2. Renewable Power Generation and Capacity as a Share of Global Power from 2007–2016. Adapted from [10]................................................3
Figure 3. General Hybrid CAES System Components. Adapted from [25]. ..............6
Figure 4. CAES Motor/Generator Clutch Arrangement. Adapted from [25]. ............7
Figure 5. Function Diagram of an Adiabatic CAES Power Plant in Single-Stage Configuration (Basic Layout). Source: [33]. .....................................9
Figure 6. Schematic of an Adiabatic CAES System with Packed Bed TES. Source: [36]. ...............................................................................................10
Figure 7. Power Flow Diagram for Electrical Microgrid. Source: [39]. ...................11
Figure 8. Simplified Diagram for Supply Side of Solar-Powered, SS-CAES. Source: [42]. ...............................................................................................13
Figure 9. SS-CAES PV Array at NPS IMPEL ..........................................................14
Figure 10. MidNite Classic 150 Charge Controller and E-Panel ................................15
Figure 11. Typical Maximum Power Point Tracking Controller Advantage. Adapted from [45]......................................................................................16
Figure 12. Maxwell BMOD0130 P056 B03 Ultracapacitor. Source: [47]. .................17
Figure 13. Sunny Island 4585-US-10 Inverter ............................................................18
Figure 14. SMA Sunny WebBox ................................................................................19
Figure 15. Powerex Oil-less Scroll Air Compressor ...................................................19
Figure 16. Air Storage Tanks at NPS IMPEL .............................................................21
Figure 17. Parker K-MT2 Air Dryer ...........................................................................22
Figure 18. Allen-Bradley Micro850 Controller ..........................................................23
Figure 19. Allen-Bradley PanelView 400 HMI ..........................................................23
Figure 20. Communications Map ................................................................................26
xii
Figure 21. Simplified Control Program Flowchart .....................................................30
Figure 22. NPS IMPEL Building Layout ....................................................................34
Figure 23. Sunrise Compressor Run Data ...................................................................35
Figure 24. StartupReset FBD ......................................................................................48
Figure 25. UpdateSettings FBD ..................................................................................50
Figure 26. Heartbeat Program Function Block Diagram ............................................51
Figure 27. VerifySunState FBD ..................................................................................53
Figure 28. CompressorRestartDelay FBD...................................................................55
Figure 29. CheckInverterStatus FBD ..........................................................................56
Figure 30. InverterOffHold FBD.................................................................................58
Figure 31. AutomaticInverterControl FBD .................................................................59
Figure 32. ManualInverterControl FBD ......................................................................61
Figure 33. AutomaticCompressorControl FBD ..........................................................63
Figure 34. ManualCompressorControl FBD ...............................................................64
Figure 35. UpdateCompressorState FBD ....................................................................65
Figure 36. F_OneSecTrigger FBD ..............................................................................69
Figure 37. R_OneSecTrigger FBD ..............................................................................70
Figure 38. HMI Operation Screen ...............................................................................73
Figure 39. HMI Settings Screen ..................................................................................75
Figure 40. AssignID Function Block Diagram ...........................................................79
Figure 41. Main Screen ...............................................................................................83
Figure 42. Windows Format Utility ............................................................................86

xiii
LIST OF TABLES
Table 1 Classes of Energy Storage. Adapted from [19]. ..........................................5
Table 2 Settings .......................................................................................................45
Table 3 Global Variables ........................................................................................46
Table 4 User-Defined Structure Data Type ............................................................47
Table 5 StartupReset Local Variables .....................................................................49
Table 6 UpdateSettings Local Variables .................................................................50
Table 7 Heartbeat Local Variables ..........................................................................51
Table 8 VerifySunState Local Variables ................................................................54
Table 9 CompressorRestartDelay Local Variables .................................................55
Table 10 CheckInverterStatus Local Variables ........................................................57
Table 11 InverterOffHold Local Variables ...............................................................58
Table 12 AutomaticInverterControl Local Variables ...............................................60
Table 13 ManualInverterControl Local Variables ....................................................62
Table 14 ManualCompressorControl Local Variables .............................................64
Table 15 UpdateCompressorState Local Variables ..................................................65
Table 16 SunUp Local Variables ..............................................................................67
Table 17 IfTwoButtons Local Variables ...................................................................68
Table 18 LogicUDINT Local Variables ...................................................................69
Table 19 F_OneSecTrigger Local Variables ............................................................70
Table 20 R_OneSecTrigger Local Variables ............................................................70
Table 21 HMI Network Setup ...................................................................................71
Table 22 External Tags .............................................................................................72
Table 23 Global Connection Tags ............................................................................72
xiv
Table 24 HMI Momentary Pushbutton Items ...........................................................74
Table 25 HMI Multistate Indicator Items .................................................................74
Table 26 Maintained Pushbutton Items ....................................................................75
Table 27 Numeric Increment Decrement Items ........................................................75
Table 28 Numeric Display Items ..............................................................................76
Table 29 Ethernet Settings ........................................................................................77
Table 30 Global Variables ........................................................................................78
Table 31 AssignID Local Variables ..........................................................................80
Table 32 ModbusWrite Local Variables ...................................................................81
Table 33 modbus_ip_check Local Variables ............................................................82
Table 34 Communication Settings ............................................................................82
Table 35 AssignUnitID Tags ....................................................................................82
Table 36 Numeric Entry Items ..................................................................................83
Table 37 Momentary Push Button Items ..................................................................83
Table 38 Numeric Display Items ..............................................................................84

xv
LIST OF ACRONYMS AND ABBREVIATIONS
AA-CAES Advanced Adiabatic Compressed Air Energy Storage
AC Alternating Current
CAES Compressed Air Energy Storage
CCW Connected Components Workbench
DC Direct Current
DOD Department of Defense
DON Department of the Navy
ESTEP Energy Systems Technology and Evaluation Program
FBD Function Block Diagram
HMI Human Machine Interface
IMPEL Integrated Multi-physics Energy Lab
J Joules
kWh Kilowatt-hour
MPPT Maximum Power Point Tracking
NPS Naval Postgraduate School
ONR Office of Naval Research
PLC Programmable Logic Controller
PSS-CAES Polygeneration Small Scale Compressed Air Energy Storage
PV Photovoltaic
SS-CAES Small Scale Compressed Air Energy Storage
TCP/IP Transmission Control Protocol/Internet Protocol
USNO United States Naval Observatory
VAC Volts Alternating Current
VDC Volts Direct Current
Wh Watt-hour

xvi
THIS PAGE INTENTIONALLY LEFT BLANK

xvii
ACKNOWLEDGMENTS
I would like to thank my advisors, Dr. Gannon and Andrea Holmes, for providing
the opportunity to work on this project as well as extensive technical assistance with the
solar-powered microgrid. Lastly, but most importantly, I would like to thank my
wonderful wife, Ashley, for her tremendous support during this process.

xviii
THIS PAGE INTENTIONALLY LEFT BLANK
1
I. INTRODUCTION
Energy is the foundation upon which our modern society is built. Without vast
energy production capability, most modern amenities, which consume this energy, would
become obsolete. In 2015, the United States consumed 28.529 trillion kilowatt-hours
(kWh) (97.344 quadrillion BTU) of energy [1]. While over 80% of the energy consumed
was fossil fuels, this accounts for fossil fuels used to produce electricity as well as other
energy consumption means, such as automobiles and industrial processes. Fossil fuels
accounted for 66.9% of the national electricity production during 2015 [1]. There has
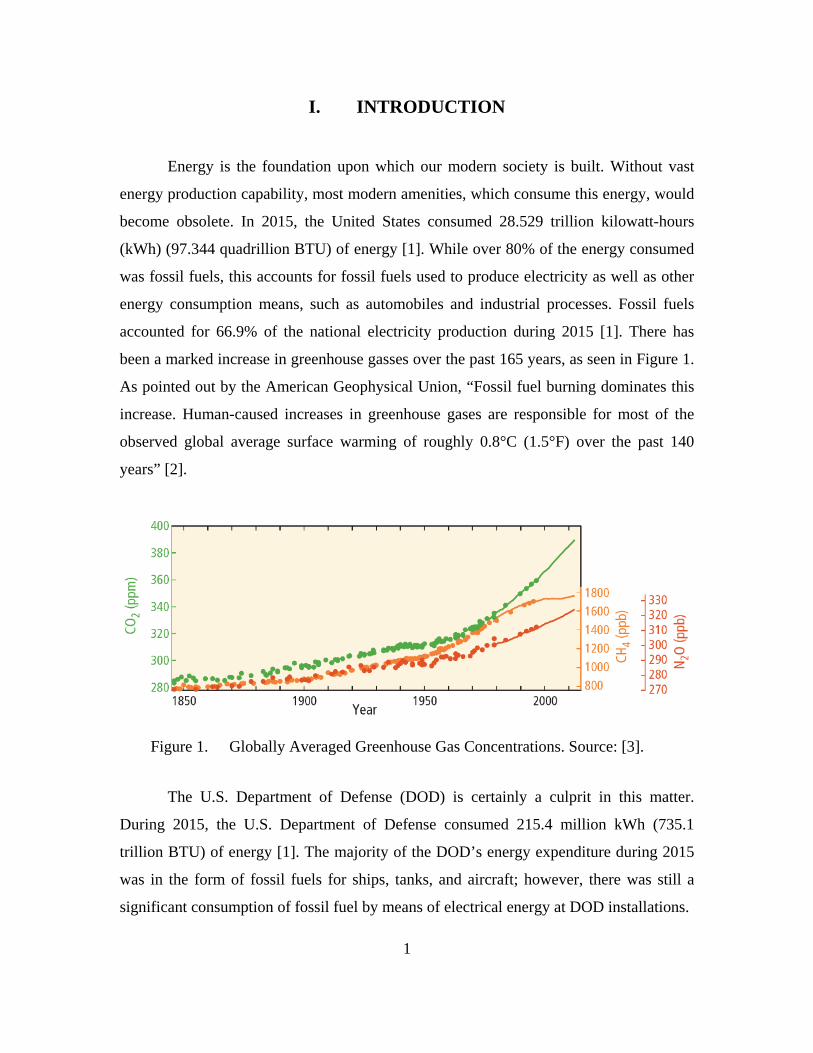
been a marked increase in greenhouse gasses over the past 165 years, as seen in Figure 1.
As pointed out by the American Geophysical Union, “Fossil fuel burning dominates this
increase. Human-caused increases in greenhouse gases are responsible for most of the
observed global average surface warming of roughly 0.8°C (1.5°F) over the past 140
years” [2].
Figure 1. Globally Averaged Greenhouse Gas Concentrations. Source: [3].
The U.S. Department of Defense (DOD) is certainly a culprit in this matter.
During 2015, the U.S. Department of Defense consumed 215.4 million kWh (735.1
trillion BTU) of energy [1]. The majority of the DOD’s energy expenditure during 2015
was in the form of fossil fuels for ships, tanks, and aircraft; however, there was still a
significant consumption of fossil fuel by means of electrical energy at DOD installations.

2
DOD installations consumed 29.37 billion kWh of electricity during 2015, at a
cost of $2.59 billion [4]. The Office of Naval Research (ONR) created the Energy
Systems Technology and Evaluation Program (ESTEP) in fiscal year 2013 to promote the
study of advanced energy technologies in real-world military installation settings [5].
ESTEP was created, through partnerships with educational institutions and industry, to
develop and test advanced energy technologies that can be deployed to existing
installations to reduce the financial burden of electricity consumption. The main
objectives of the ESTEP program are [6]:
• Reduce costs
• Increase energy security
• Increase the reach and persistence of the warfighter
Recently, military commanders renewed their commitment to “forge ahead …
with a decade-long effort to convert [their] fuel-hungry operations to renewable
power” [7]. To put it succinctly, renewable energy is the future, and the impact that clean,
renewable energy can have on our future as a nation and, ultimately, as a planet is
unquestionable. The Sierra Club recently reported that “Nationally, clean energy jobs
outnumber all fossil fuel jobs by over 2.5 to 1,” which is a clear indicator of the trend
toward clean energy production [8]. The renewable energy sector is constantly pushing
the boundaries of innovation and production capacity, with “record-breaking generation”
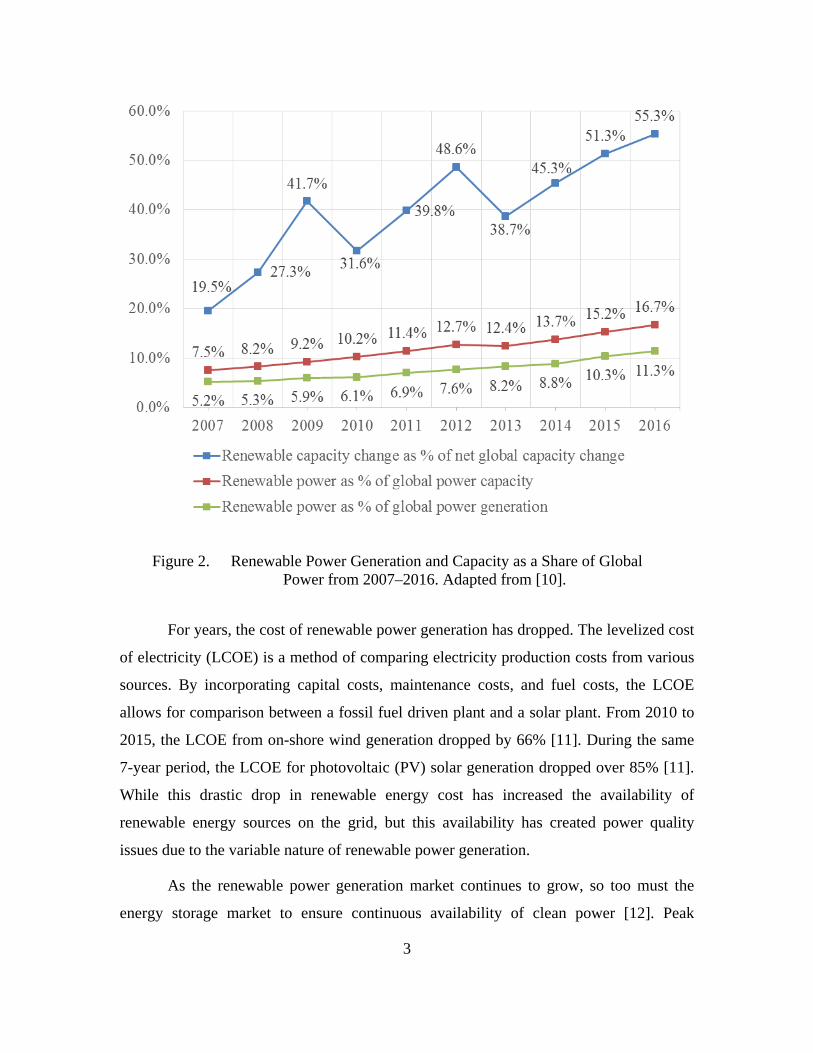
the new norm [9]. The portion of global energy produced from renewable sources
continues to grow, with renewable sources accounting for more than half of the new
production methods for the past two years, as seen in Figure 2 [10]. “Last year brought a
hectic series of milestones for declining costs,” further driving the market toward
renewable energy [10].
3
Figure 2. Renewable Power Generation and Capacity as a Share of Global Power from 2007–2016. Adapted from [10].
For years, the cost of renewable power generation has dropped. The levelized cost
of electricity (LCOE) is a method of comparing electricity production costs from various
sources. By incorporating capital costs, maintenance costs, and fuel costs, the LCOE
allows for comparison between a fossil fuel driven plant and a solar plant. From 2010 to
2015, the LCOE from on-shore wind generation dropped by 66% [11]. During the same
7-year period, the LCOE for photovoltaic (PV) solar generation dropped over 85% [11].
While this drastic drop in renewable energy cost has increased the availability of
renewable energy sources on the grid, but this availability has created power quality
issues due to the variable nature of renewable power generation.
As the renewable power generation market continues to grow, so too must the
energy storage market to ensure continuous availability of clean power [12]. Peak
4
production, from solar specifically, has led to a glut of power due to the “high costs of
restarting” conventional plants [13]. The grid currently relies on a costly system to
minimize grid fluctuations, whereby some power plants remain in a “standby” state,
ready to act as a “supplemental balancing reserve” [14]. This generally occurs since most
renewable power sources produce outputs that vary according to numerous environmental
factors. Wind power, for example, can be highly irregular and wind forecasting cannot
completely mitigate this issue due to prediction errors [15]. When using PV cells,
electricity production occurs as long as the sun is shining on the solar panels, which
generally occurs during most daylight hours. If non-constant renewable power sources
like wind and solar are to be used for major electricity production needs, there has to be a
way to mitigate the variability in production capability [16]. Lazard projects that the
levelized cost of energy storage will, over the next several years, incur a cost decline
similar to the LCOE from renewable power generation [17].
A. OBJECTIVES
The Naval Postgraduate School (NPS) Integrated Multi-Physics Energy Lab
(IMPEL) houses several past, present, and future projects to study advanced energy
production and storage systems in order to meet the future energy needs of the DOD.
Some of these systems require automation to function properly, specifically, an off-grid
solar powered microgrid and Small-Scale Compressed Air Energy Storage (SS-CAES)
system. This thesis examines the development of an automated control system that stores
energy as compressed air when the renewable energy produced by a solar microgrid
exceeds the compressor power requirements. This energy can be stored indefinitely, until
converted back to electricity through an expansion process. The expansion process is
being similarly automated through work by Vranas [18].
B. LITERATURE REVIEW
The most logical method for mitigating variable generation from renewable
sources is to capture the excess energy during peak production times. Several studies
have similarly concluded that power storage technologies are required to maintain stable
power output from renewable sources [12, 19–22]. The energy storage technologies that
5
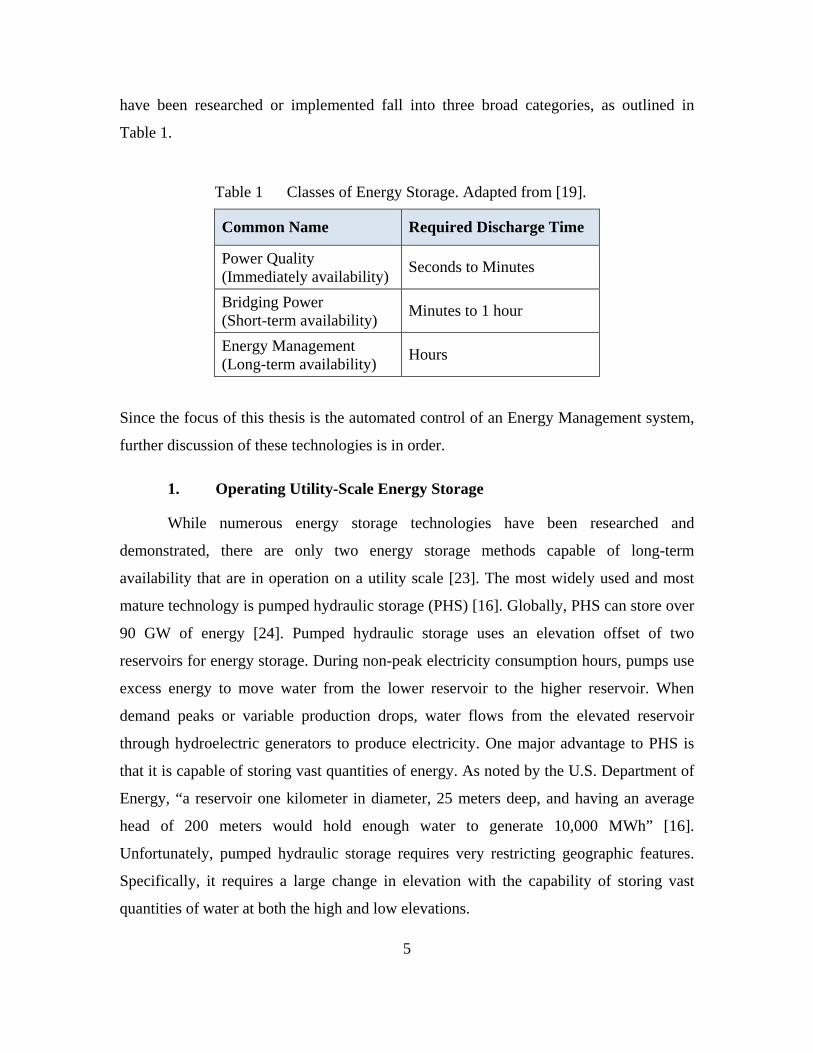
have been researched or implemented fall into three broad categories, as outlined in
Table 1.
Table 1 Classes of Energy Storage. Adapted from [19].
Common Name Required Discharge Time
Power Quality (Immediately availability) Seconds to Minutes
Bridging Power (Short-term availability) Minutes to 1 hour
Energy Management (Long-term availability) Hours
Since the focus of this thesis is the automated control of an Energy Management system,
further discussion of these technologies is in order.
1. Operating Utility-Scale Energy Storage
While numerous energy storage technologies have been researched and
demonstrated, there are only two energy storage methods capable of long-term
availability that are in operation on a utility scale [23]. The most widely used and most
mature technology is pumped hydraulic storage (PHS) [16]. Globally, PHS can store over
90 GW of energy [24]. Pumped hydraulic storage uses an elevation offset of two
reservoirs for energy storage. During non-peak electricity consumption hours, pumps use
excess energy to move water from the lower reservoir to the higher reservoir. When
demand peaks or variable production drops, water flows from the elevated reservoir
through hydroelectric generators to produce electricity. One major advantage to PHS is
that it is capable of storing vast quantities of energy. As noted by the U.S. Department of
Energy, “a reservoir one kilometer in diameter, 25 meters deep, and having an average
head of 200 meters would hold enough water to generate 10,000 MWh” [16].
Unfortunately, pumped hydraulic storage requires very restricting geographic features.
Specifically, it requires a large change in elevation with the capability of storing vast
quantities of water at both the high and low elevations.
6
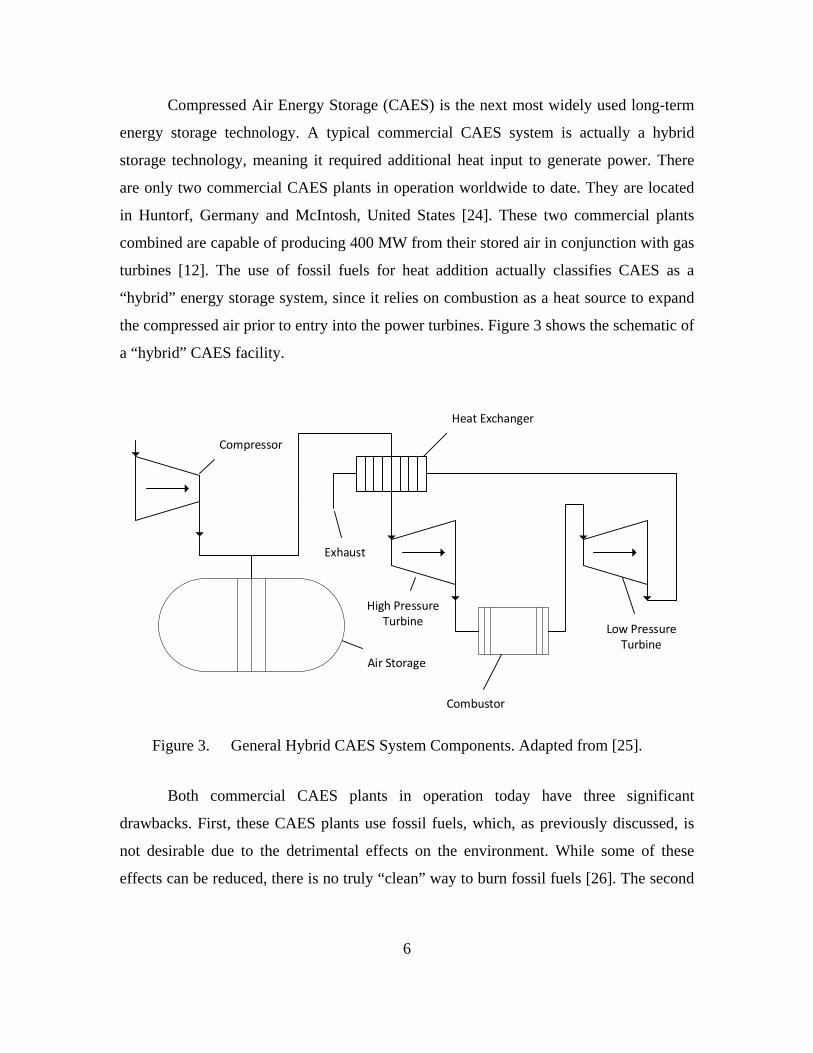
Compressed Air Energy Storage (CAES) is the next most widely used long-term
energy storage technology. A typical commercial CAES system is actually a hybrid
storage technology, meaning it required additional heat input to generate power. There
are only two commercial CAES plants in operation worldwide to date. They are located
in Huntorf, Germany and McIntosh, United States [24]. These two commercial plants
combined are capable of producing 400 MW from their stored air in conjunction with gas
turbines [12]. The use of fossil fuels for heat addition actually classifies CAES as a
“hybrid” energy storage system, since it relies on combustion as a heat source to expand
the compressed air prior to entry into the power turbines. Figure 3 shows the schematic of
a “hybrid” CAES facility.
Compressor
Heat Exchanger
High Pressure Turbine Low Pressure
Turbine
Combustor
Air Storage
Exhaust
Figure 3. General Hybrid CAES System Components. Adapted from [25].
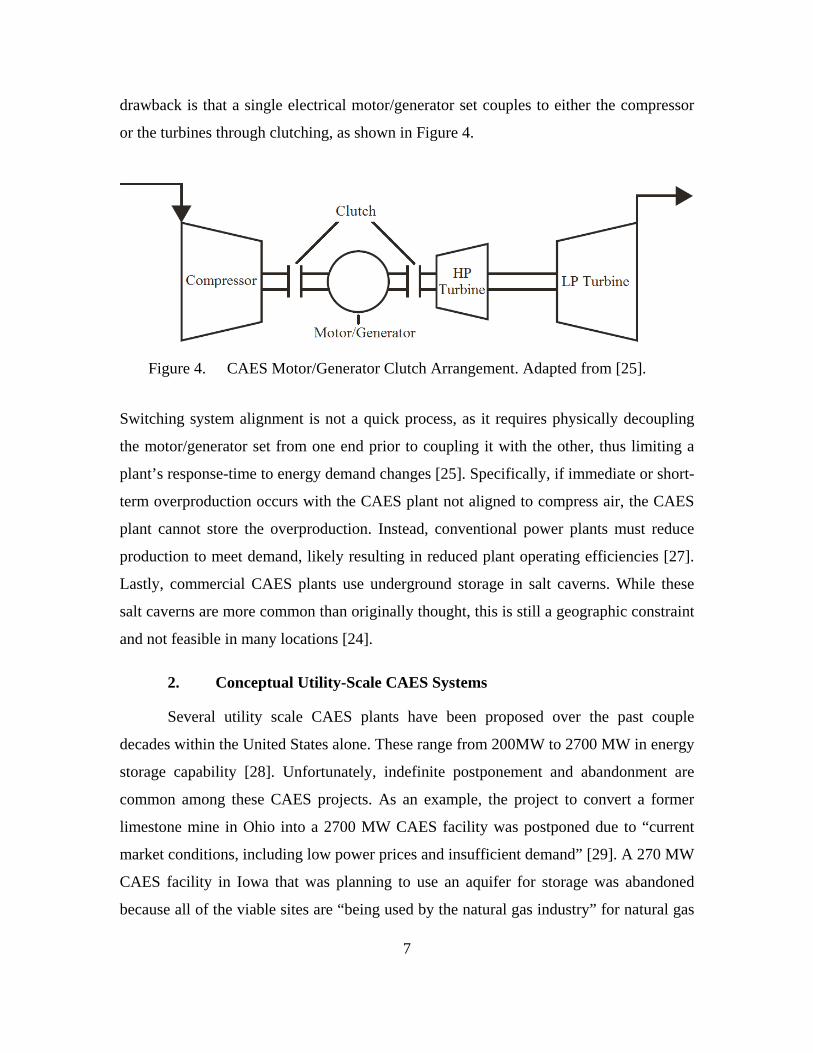
Both commercial CAES plants in operation today have three significant
drawbacks. First, these CAES plants use fossil fuels, which, as previously discussed, is
not desirable due to the detrimental effects on the environment. While some of these
effects can be reduced, there is no truly “clean” way to burn fossil fuels [26]. The second
7
drawback is that a single electrical motor/generator set couples to either the compressor
or the turbines through clutching, as shown in Figure 4.
Figure 4. CAES Motor/Generator Clutch Arrangement. Adapted from [25].
Switching system alignment is not a quick process, as it requires physically decoupling
the motor/generator set from one end prior to coupling it with the other, thus limiting a
plant’s response-time to energy demand changes [25]. Specifically, if immediate or short-
term overproduction occurs with the CAES plant not aligned to compress air, the CAES
plant cannot store the overproduction. Instead, conventional power plants must reduce
production to meet demand, likely resulting in reduced plant operating efficiencies [27].
Lastly, commercial CAES plants use underground storage in salt caverns. While these
salt caverns are more common than originally thought, this is still a geographic constraint
and not feasible in many locations [24].
2. Conceptual Utility-Scale CAES Systems
Several utility scale CAES plants have been proposed over the past couple
decades within the United States alone. These range from 200MW to 2700 MW in energy
storage capability [28]. Unfortunately, indefinite postponement and abandonment are
common among these CAES projects. As an example, the project to convert a former
limestone mine in Ohio into a 2700 MW CAES facility was postponed due to “current
market conditions, including low power prices and insufficient demand” [29]. A 270 MW
CAES facility in Iowa that was planning to use an aquifer for storage was abandoned
because all of the viable sites are “being used by the natural gas industry” for natural gas
8
storage [30]. As can be seen from just these two examples, the influx of cheap natural gas
has threatened the advancement of CAES projects on multiple fronts [29, 30]. This
implies that a cheaper type of CAES system with a different type of air storage system is
required.
In 2002, the European Union commissioned a study titled Advanced Adiabatic –
Compressed Air Energy Storage (AA-CAES) Project to develop a “zero CO2 emissions”
CAES system [31]. An adiabatic CAES plant eliminates the largest drawback of
traditional CAES plants: fossil fuel use. By examining Equation (1), we see that as air
pressure rises during compression, air temperature will rise as well. Although Equation
(1) is specific to ideal gases, it provides a simplified explanation of what happens to non-
ideal gases undergoing compression [32].
( )1
22 1
1
PT TP
γγ
−
=
(1)
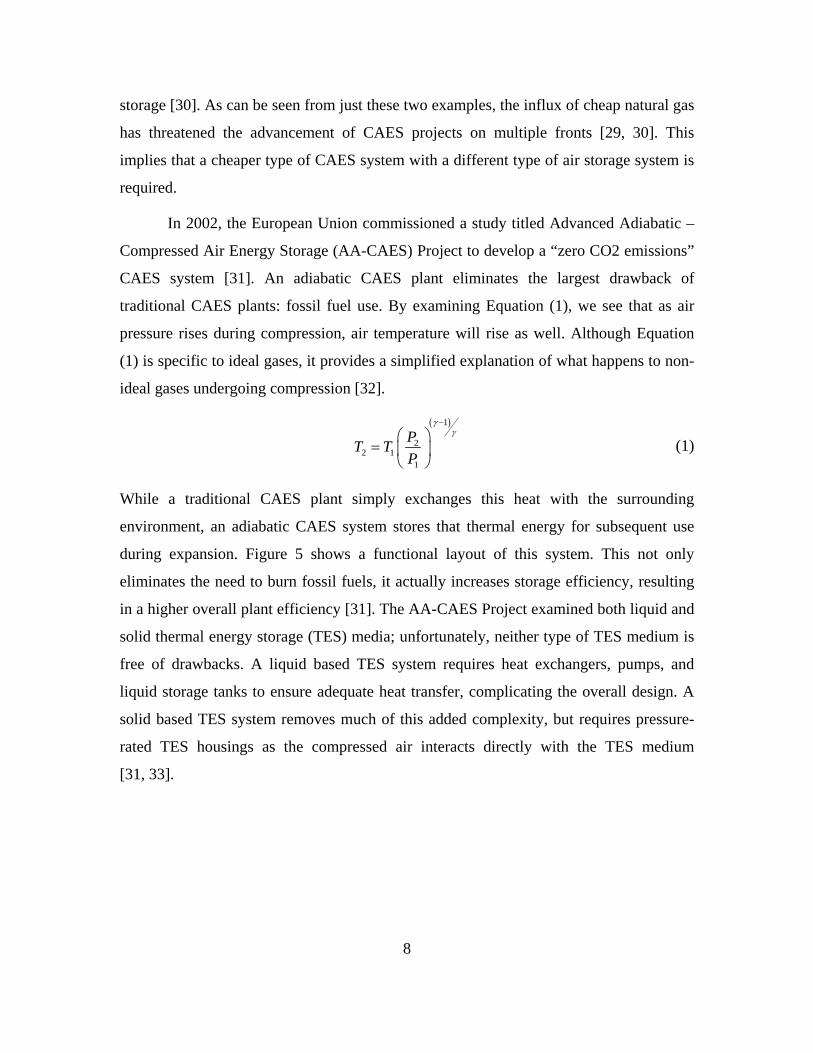
While a traditional CAES plant simply exchanges this heat with the surrounding
environment, an adiabatic CAES system stores that thermal energy for subsequent use
during expansion. Figure 5 shows a functional layout of this system. This not only
eliminates the need to burn fossil fuels, it actually increases storage efficiency, resulting
in a higher overall plant efficiency [31]. The AA-CAES Project examined both liquid and
solid thermal energy storage (TES) media; unfortunately, neither type of TES medium is
free of drawbacks. A liquid based TES system requires heat exchangers, pumps, and
liquid storage tanks to ensure adequate heat transfer, complicating the overall design. A
solid based TES system removes much of this added complexity, but requires pressure-
rated TES housings as the compressed air interacts directly with the TES medium
[31, 33].
9
Figure 5. Function Diagram of an Adiabatic CAES Power Plant in Single-Stage Configuration (Basic Layout). Source: [33].
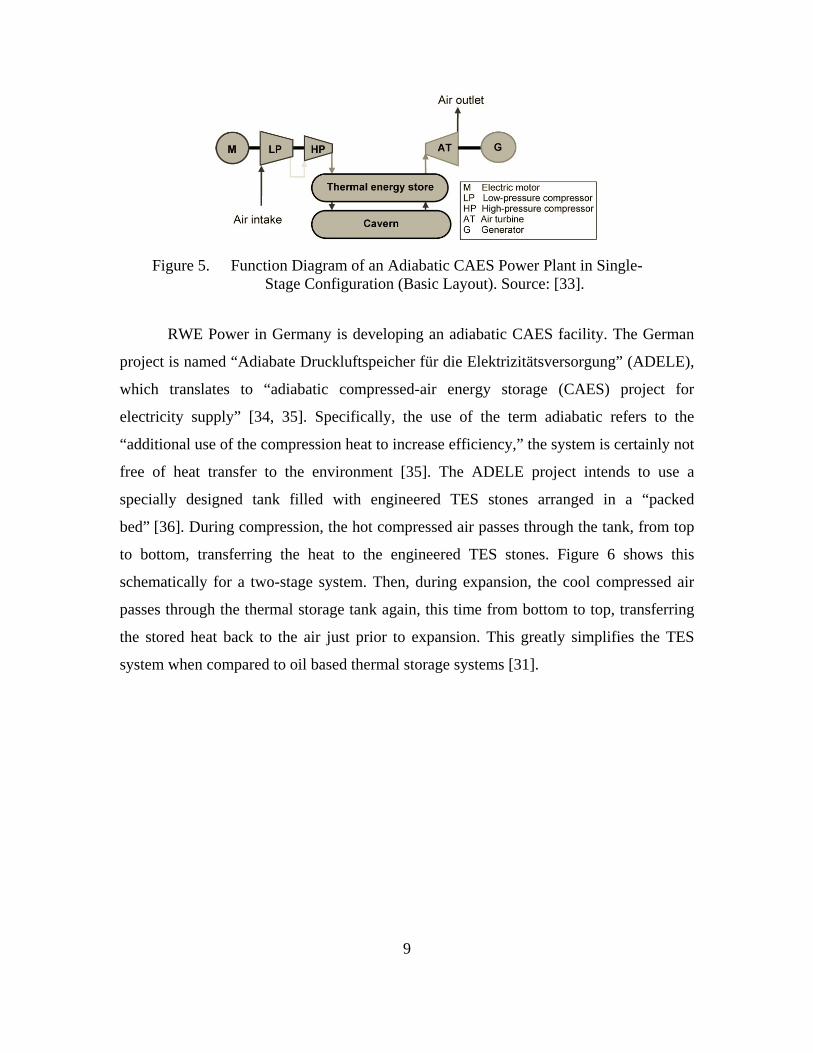
RWE Power in Germany is developing an adiabatic CAES facility. The German
project is named “Adiabate Druckluftspeicher für die Elektrizitätsversorgung” (ADELE),
which translates to “adiabatic compressed-air energy storage (CAES) project for
electricity supply” [34, 35]. Specifically, the use of the term adiabatic refers to the
“additional use of the compression heat to increase efficiency,” the system is certainly not
free of heat transfer to the environment [35]. The ADELE project intends to use a
specially designed tank filled with engineered TES stones arranged in a “packed
bed” [36]. During compression, the hot compressed air passes through the tank, from top
to bottom, transferring the heat to the engineered TES stones. Figure 6 shows this
schematically for a two-stage system. Then, during expansion, the cool compressed air
passes through the thermal storage tank again, this time from bottom to top, transferring
the stored heat back to the air just prior to expansion. This greatly simplifies the TES
system when compared to oil based thermal storage systems [31].

10
Figure 6. Schematic of an Adiabatic CAES System with Packed Bed TES. Source: [36].
3. Small-Scale Energy Storage
A study in 2013 by Petrov et al. examined a distributed CAES system as a means
of providing balancing power to the grid. The concept examined the use of multiple SS-
CAES plants distributed across the grid at “residential homes” and “commercial
buildings” to offset the variability in energy production inherent with wind and solar
power [37]. In this study, the SS-CAES plants examined were purely adiabatic, meaning
that there was no heat exchange occurring during or after compression. Instead, the
proposed aboveground air storage tanks store the hot compressed air, maintaining its heat
through use of insulating materials. While not as efficient at power conversion as battery
storage, this approach yielded a theoretical energy storage efficiency of 75.2%, which is
significantly higher than current CAES systems and “matches the efficiency of low-tech
battery systems” [25, 37]. Even taking into account potential real-world losses, the
efficiency of this system at least matches currently available CAES systems. This
increased efficiency, paired with the significant cost advantage of SS-CAES over
comparably-sized battery storage, looks rather promising for grid energy storage [37].
In 2014 Jannelli, et al. examined the use of an adiabatic SS-CAES for powering a
remote radio communications tower in Italy. In addition to providing the electrical power
for the communications tower, the authors examined the use of the cool turbine exhaust
to cool sensitive electronic equipment. The resulting cycle was termed a Polygeneration
11
SS-CAES (PSS-CAES) due to the multiple methods of energy output. The proposed PSS-
CAES system stores the heat of compression in a TES oil, allowing more air mass storage
per unit volume when compared to the system devised by Petrov, et al. [37, 38].
Although this PSS-CAES system uses a more complex TES oil system, the ability to
compress the air in stages and remove the heat of compression produces a more efficient
system overall [38].
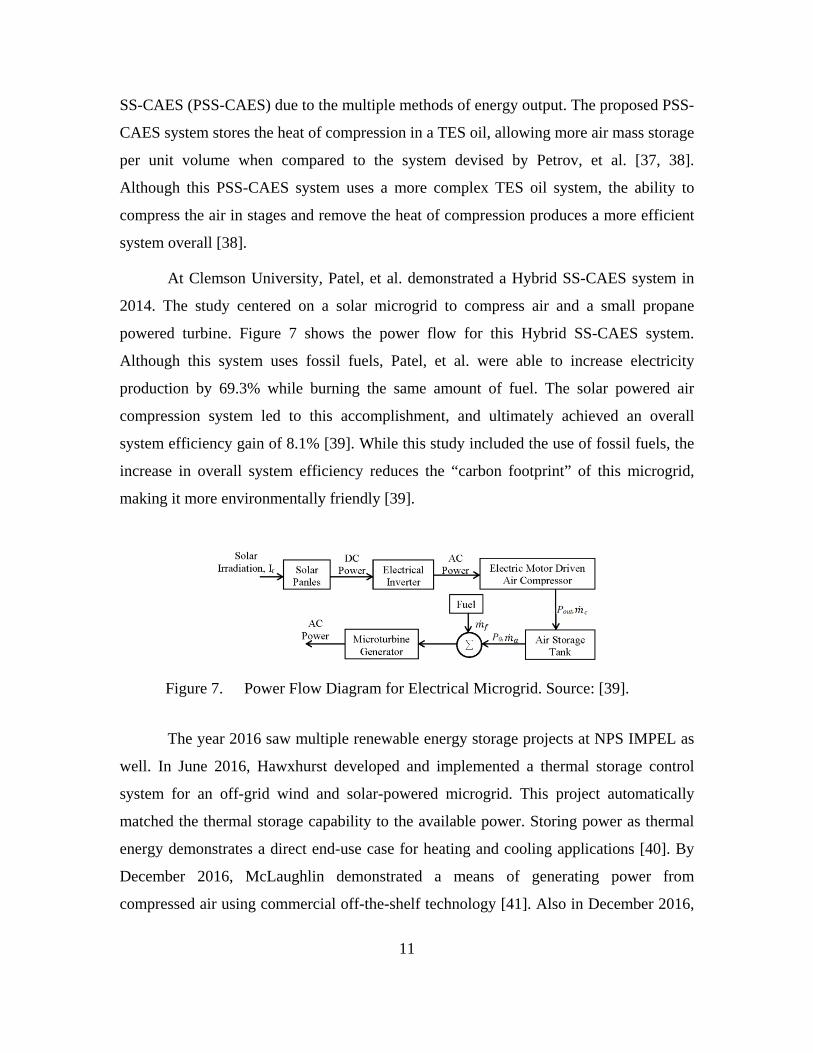
At Clemson University, Patel, et al. demonstrated a Hybrid SS-CAES system in
2014. The study centered on a solar microgrid to compress air and a small propane
powered turbine. Figure 7 shows the power flow for this Hybrid SS-CAES system.
Although this system uses fossil fuels, Patel, et al. were able to increase electricity
production by 69.3% while burning the same amount of fuel. The solar powered air
compression system led to this accomplishment, and ultimately achieved an overall
system efficiency gain of 8.1% [39]. While this study included the use of fossil fuels, the
increase in overall system efficiency reduces the “carbon footprint” of this microgrid,
making it more environmentally friendly [39].
Figure 7. Power Flow Diagram for Electrical Microgrid. Source: [39].
The year 2016 saw multiple renewable energy storage projects at NPS IMPEL as
well. In June 2016, Hawxhurst developed and implemented a thermal storage control
system for an off-grid wind and solar-powered microgrid. This project automatically
matched the thermal storage capability to the available power. Storing power as thermal
energy demonstrates a direct end-use case for heating and cooling applications [40]. By
December 2016, McLaughlin demonstrated a means of generating power from
compressed air using commercial off-the-shelf technology [41]. Also in December 2016,

12
Prinsen designed, and performed thermodynamic analysis of the NPS IMPEL SS-CAES
plant [42]. This thesis further examines the implementation of the system designed by
Prinsen, and the automation thereof.

13
II. EQUIPMENT AND COMMUNICATIONS
The development of the SS-CAES system at NPS IMPEL is propagating along
two separate, but related paths. McLaughlin initially implemented the power generation
or expansion phase with further automation by Vranas [18, 41]. Prinsen examined the
overall theoretical SS-CAES system performance and selected the exact components
required for the compression system based on the already available air storage tanks [42].
Figure 8 shows a simplified diagram of the energy flow for the supply side of the solar-
powered SS-CAES system at NPS IMPEL. This thesis continues with the supply side, or
compression phase development.
Figure 8. Simplified Diagram for Supply Side of Solar-Powered, SS-CAES. Source: [42].

14
A. EQUIPMENT
The various mechanical and electrical devices that facilitate the capture,
conversion, and storage of energy for the solar-powered SS-CAES are described herein.
1. Electricity Production
The PV array that constitutes the source of electricity for this project is comprised
of 12 panels, each rated at 280 watts of peak power, for a maximum power generation of
3.36kW. The array covers an area of 19.3 m2 (207.7 ft2) and is arranged in six parallel
strands, each with two panels in series, to provide a maximum of 79 Volts Direct Current
(VDC) to the charge controller [43]. Figure 9 shows the PV array used for the NPS
IMPEL SS-CAES system.
Figure 9. SS-CAES PV Array at NPS IMPEL
Vertical Axis Wind Turbines
Solar Panels

15
2. Charge Controller
The power produced by the PV array is supplied to a MidNite Solar Classic 150
charge controller. The Classic 150, shown in Figure 10, is a Maximum Power Point
Tracking (MPPT) charge controller. An MPPT controller continuously samples the
available voltage and current from both the PV array and the storage medium. It then
determines the optimum voltage and current to output to the storage medium in order to
achieve maximum power transfer from the PV array to the storage medium. Using an
MPPT controller provides the maximum power possible to the storage medium, which
greatly increases the power availability and efficiency of the entire microgrid
system [44]. Figure 11 illustrates the further power extraction capable with an MPPT type
charge controller. Additionally, the Classic 150 supports Modbus protocol via TCP/IP for
communication.
Figure 10. MidNite Classic 150 Charge Controller and E-Panel

16
Figure 11. Typical Maximum Power Point Tracking Controller Advantage. Adapted from [45].
3. Temporary Energy Storage Medium
The temporary energy storage medium for the solar microgrid is composed of an
array of ultracapacitors. Six Maxwell BMOD0130 P056 B03 ultracapacitors, shown in
Figure 12, rated at 56 VDC arranged in parallel provide a total of 780 farads of
capacitance. The total energy stored in the capacitor bank in watt-hours (Wh) can be
obtained from Equation (5), which is derived from a combination of Equations (2)
through (4) [46].
QCV
= (2)
C is capacitance in farads. Q is the charge on the capacitor at full voltage in coulombs. V
is the voltage.

17
21
2QEC
= (3)
E is energy stored in the capacitor in joules (J). Q and C are as in Equation (2).
212
E CV= (4)
Finally, Equation (5) converts the energy in J to the more useful Wh units.
[ ] [ ]3600
s hE Wh E J WJ s
=
(5)
It is important to note that the capacitors only charge to 54.5 VDC to prevent exceeding
their rated voltage. While this prevents damage to the capacitors through the process of
dielectric breakdown, it also reduces the total energy storage possible. Based on the
maximum charged voltage of the capacitor bank, 321.8 Wh are available for energy
storage.
Figure 12. Maxwell BMOD0130 P056 B03 Ultracapacitor. Source: [47].

18
4. DC to AC Inversion
An SMA Sunny Island 4585-US-10 inverter, shown in Figure 13, produces a
single 120 volts alternating current (VAC) phase. This 120 VAC feeds into an SMA SI-
TD-BOX-10 Smartformer to transform the 120 VAC to a 240 VAC supply, which
ultimately powers the compressor and air dryer.
Figure 13. Sunny Island 4585-US-10 Inverter
5. Inverter Monitoring
A critical component for monitoring the PV plant is the SMA Sunny WebBox,
shown in Figure 14. This device provides Modbus support for the connected SMA Sunny
Island inverter via Ethernet cable. Since the Sunny Island inverter does not support the
Modbus protocol, the WebBox acts as a communication interface to allow
communication with the controller. Additionally, the WebBox provides a means of
monitoring and modifying SMA equipment parameters through a web-based interface
that can be accessed via computer. The WebBox required both a firmware update and a
device profile update to support Modbus communication, the details of which are
contained in Appendix F.
19
Figure 14. SMA Sunny WebBox
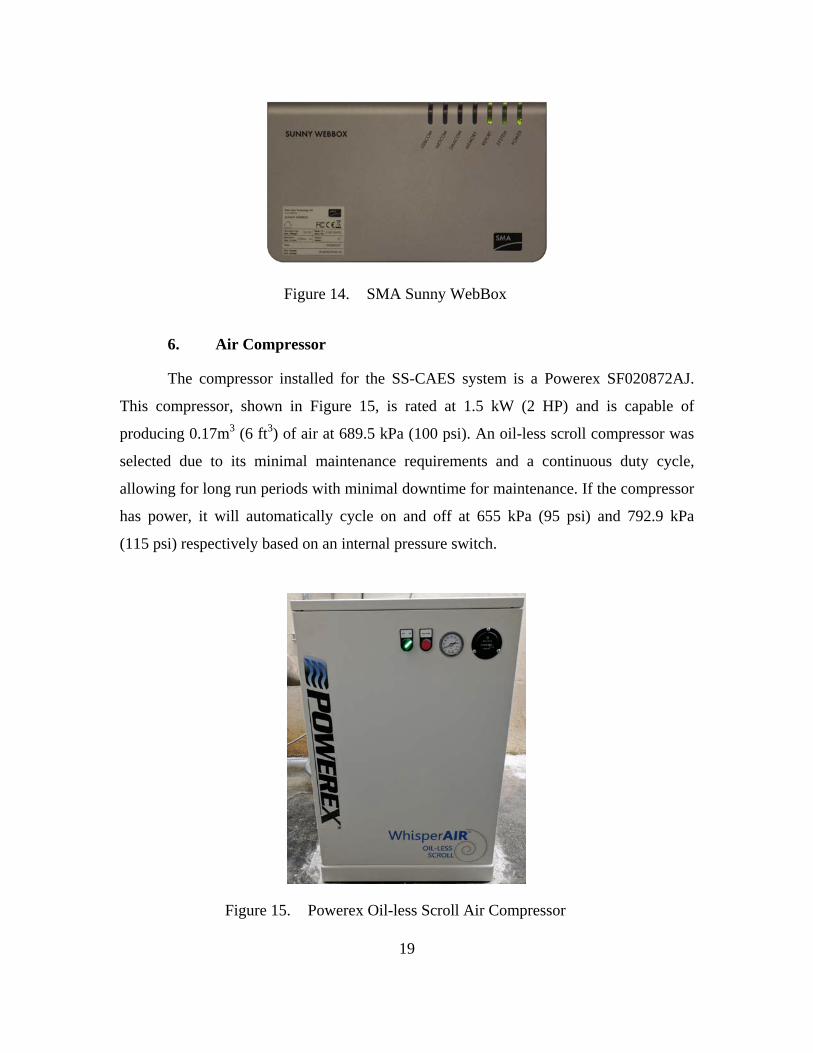
6. Air Compressor
The compressor installed for the SS-CAES system is a Powerex SF020872AJ.
This compressor, shown in Figure 15, is rated at 1.5 kW (2 HP) and is capable of
producing 0.17m3 (6 ft3) of air at 689.5 kPa (100 psi). An oil-less scroll compressor was
selected due to its minimal maintenance requirements and a continuous duty cycle,
allowing for long run periods with minimal downtime for maintenance. If the compressor
has power, it will automatically cycle on and off at 655 kPa (95 psi) and 792.9 kPa
(115 psi) respectively based on an internal pressure switch.
Figure 15. Powerex Oil-less Scroll Air Compressor
20
7. Air Storage Tanks
The backbone of the SS-CAES system at NPS IMPEL is the air storage tanks.
While there are four tanks shown in Figure 16, only three of them are in use. They are
capable of holding approximately 133 m3 (4697 ft3) at 2068 kPa (300 psi) and initially
supported just the operation of the supersonic wind tunnel at the NPS Turbomachinery
Lab [42]. The calculations of tank volume and total stored energy for the SS-CAES
system are in Appendix A. By approximating the expansion process as adiabatic, a
relatively valid assumption, Equations (6) through (8) can be used to determine the total
energy stored in these air tanks [32]. The main IMPEL compressor has the capability to
compress air to 792.9 kPa (115 psi). Thus the installed air tanks were calculated to
contain approximately 32.63 kWh of energy in the form of compressed air.
constantPV γ = (6)
1
12 1
2
PV VP
γγ
=
(7)
2 2 1 11 2 1
PV PVW PdVγ−
= =−∫ (8)

21
Figure 16. Air Storage Tanks at NPS IMPEL
8. Air Dryer
Additional considerations for humidity were necessary due to the required air
quality for use during supersonic wind tunnel operations. This resulted in the need for an
air dryer to be incorporated into this system. As this system is a proof-of-concept, these
limitations, as well as the occasional use of the supersonic wind tunnel are simply
accepted due to the significant investment what would be required to procure a complete
set of air storage tanks. The air for the supersonic wind tunnel is required to be extremely
dry, with a dew point below -40 °C. To achieve this, the air passes through a Parker K-
MT2 non-heated regenerative desiccant type air dryer, shown in Figure 17. A non-heated
regenerative desiccant type dryer was selected since it requires significantly less power to
operate than a heated regenerative desiccant air dryer.

22
Figure 17. Parker K-MT2 Air Dryer
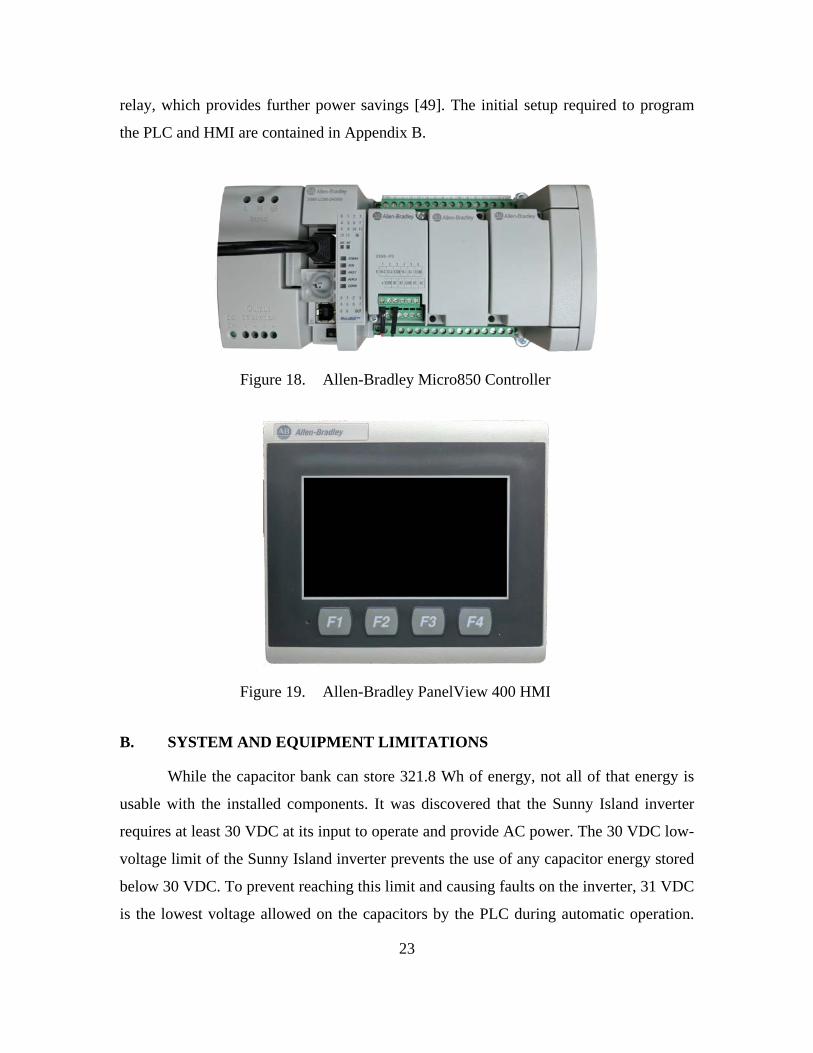
9. Plant Control System
The controller selected for automation was an Allen-Bradley Micro850
programmable logic controller (PLC). Additionally, an Allen-Bradley PanelView 800
Human Machine Interface (HMI) Terminal provides indication of the overall plant status
and the ability to manually operate the equipment. The PLC and HMI are shown in
Figure 18 and Figure 19, respectively. PLC type controllers have several advantages over
personal computer (PC) based controllers, and these advantages are the main drive for the
selection of a PLC type controller [48]. Ensuring that a power failure would not cause
data corruption and ultimately render the entire system inoperable was the primary
concern, and is something that occurs with traditional PC based control systems. An
additional advantage of the Micro850 is that it provides direct relay control without any
additional components, while still having several expansion ports to allow for added
functionality if required. Both the compressor and air dryer receive power through
Crydom CMRD4845 solid-state relays. The PLC provides the required signal to operate
the relays, thereby providing power to both the compressor and air dryer. A solid-state
relay requires significantly less power to operate than a comparably sized mechanical
23
relay, which provides further power savings [49]. The initial setup required to program
the PLC and HMI are contained in Appendix B.
Figure 18. Allen-Bradley Micro850 Controller
Figure 19. Allen-Bradley PanelView 400 HMI
B. SYSTEM AND EQUIPMENT LIMITATIONS
While the capacitor bank can store 321.8 Wh of energy, not all of that energy is
usable with the installed components. It was discovered that the Sunny Island inverter
requires at least 30 VDC at its input to operate and provide AC power. The 30 VDC low-
voltage limit of the Sunny Island inverter prevents the use of any capacitor energy stored
below 30 VDC. To prevent reaching this limit and causing faults on the inverter, 31 VDC
is the lowest voltage allowed on the capacitors by the PLC during automatic operation.
24
By again using Equations (4) and (5), the total capacitor energy available for conversion
to usable power is determined to be only 217.7 Wh, a reduction of 32.4%.
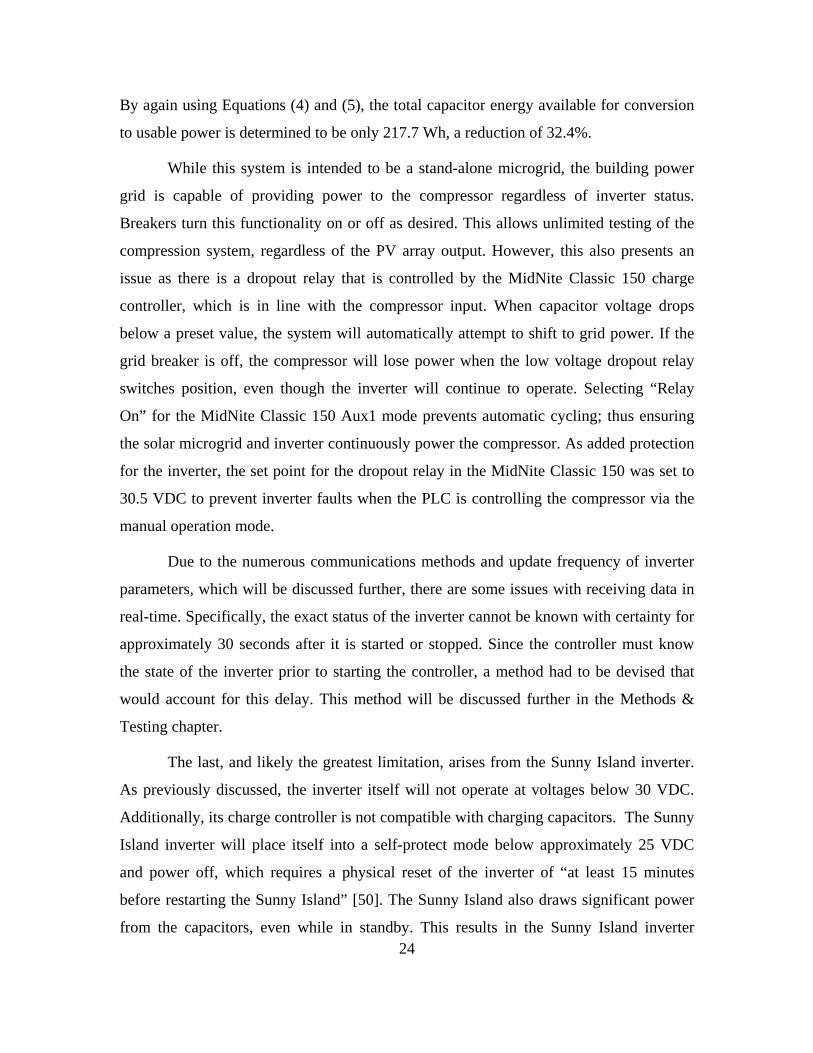
While this system is intended to be a stand-alone microgrid, the building power
grid is capable of providing power to the compressor regardless of inverter status.
Breakers turn this functionality on or off as desired. This allows unlimited testing of the
compression system, regardless of the PV array output. However, this also presents an
issue as there is a dropout relay that is controlled by the MidNite Classic 150 charge
controller, which is in line with the compressor input. When capacitor voltage drops
below a preset value, the system will automatically attempt to shift to grid power. If the
grid breaker is off, the compressor will lose power when the low voltage dropout relay
switches position, even though the inverter will continue to operate. Selecting “Relay
On” for the MidNite Classic 150 Aux1 mode prevents automatic cycling; thus ensuring
the solar microgrid and inverter continuously power the compressor. As added protection
for the inverter, the set point for the dropout relay in the MidNite Classic 150 was set to
30.5 VDC to prevent inverter faults when the PLC is controlling the compressor via the
manual operation mode.
Due to the numerous communications methods and update frequency of inverter
parameters, which will be discussed further, there are some issues with receiving data in
real-time. Specifically, the exact status of the inverter cannot be known with certainty for
approximately 30 seconds after it is started or stopped. Since the controller must know
the state of the inverter prior to starting the controller, a method had to be devised that
would account for this delay. This method will be discussed further in the Methods &
Testing chapter.
The last, and likely the greatest limitation, arises from the Sunny Island inverter.
As previously discussed, the inverter itself will not operate at voltages below 30 VDC.
Additionally, its charge controller is not compatible with charging capacitors. The Sunny
Island inverter will place itself into a self-protect mode below approximately 25 VDC
and power off, which requires a physical reset of the inverter of “at least 15 minutes
before restarting the Sunny Island” [50]. The Sunny Island also draws significant power
from the capacitors, even while in standby. This results in the Sunny Island inverter

25
draining the capacitor bank after sunset if the inverter is left on. Therefore, if the inverter
breaker is not switched off at the end of each day, the inverter will enter self-protect
mode, power off, and the control system will fail to operate as intended. Unfortunately,
there is no simple way to bypass this limitation; however, this issue will be eliminated
once the expansion and compression portions of the NPS IMPEL SS-CAES system are
fully integrated.
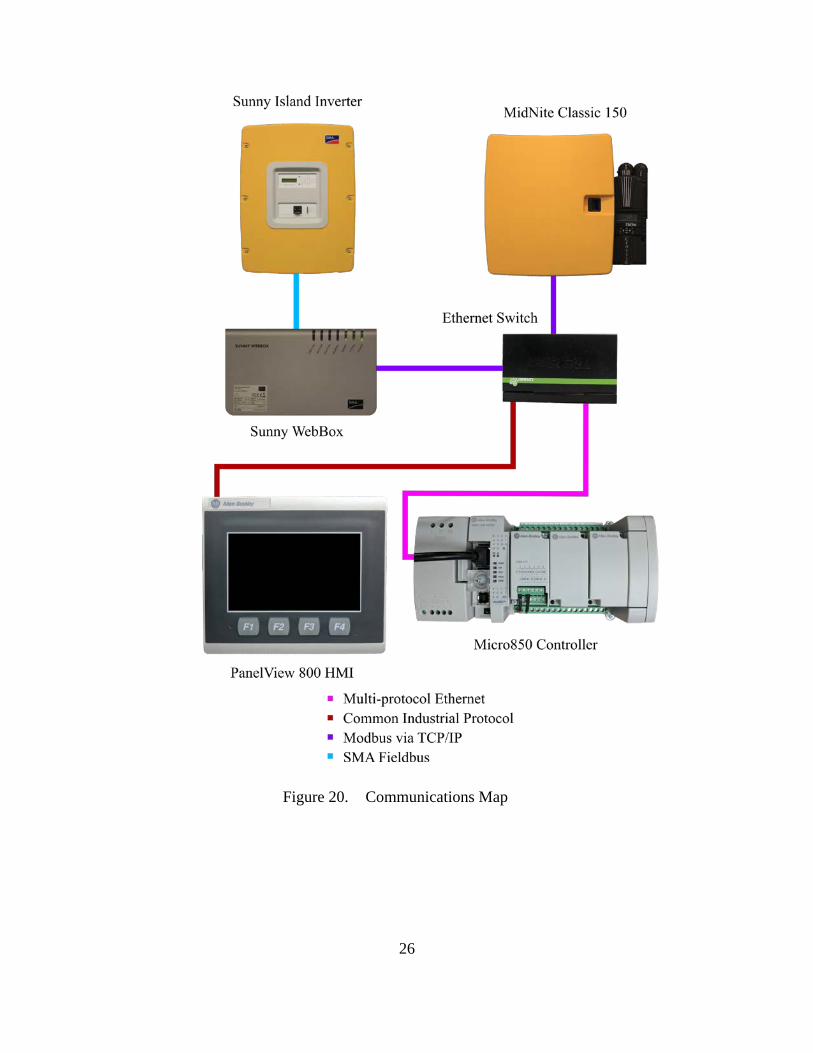
C. METHODS OF COMMUNICATION
Numerous communications protocols allow communication between the
electronic components of the power and control systems. Figure 20 shows a graphical
representation of these communication protocols as they apply to the power and control
system.
1. Multi-protocol Ethernet
The Allen-Bradley Micro850 controller uses an Ethernet cable to communicate
via Transmission Control Protocol/Internet Protocol (TCP/IP). The Micro850 is able to
communicate with multiple devices using supplementary protocols that rely on the
TCP/IP structure for data transmission.
2. Allen-Bradley CIP via Ethernet
The Micro850 controller and the PanelView 800 HMI communicate with each
other via an industrial network that uses “Control an Information Protocol” (CIP) over
Ethernet, which transmits data between the devices using TCP/IP. While Allen-Bradley
CIP via Ethernet was developed to “allow for plug-and-play among complex devices
from multiple vendors,” only Allen-Bradley controllers commonly use it due to strict
licensing requirements [51].
26
Figure 20. Communications Map

27
3. Modbus via TCP/IP
The Modbus protocol allows for communications between the controller and both
the Sunny WebBox and the MidNite Classic 150 charge controller. Modbus has been
widely used throughout industry since its inception in 1978. Modbus makes
communication between controllers and sensors in factories easy to implement. Its
standardization ensures equipment from different manufacturers can communicate
effectively. This allows for rapid deployment of large networks of connected devices.
Modbus operates in a master/slave type system where one master controls all slaves [52].
The Modbus network created for this thesis is comprised of three devices, the Allen-
Bradley Micro850 controller, the Sunny WebBox, and the MidNite Classic 150. The
Micro850 controller serves as the network master, while the remaining two devices are
slaves. The Sunny WebBox can only function as a slave and serves as a gateway to the
devices attached to it [53]. Modbus is not enabled by default on the WebBox, and must
be enabled via the web interface. Details for enabling Modbus on the WebBox are
contained in Appendix F. Modbus is enabled by default on the MidNite Classic 150.
A separate program titled AssignID was written for the Allen-Bradley Micro850
and the Allen-Bradley PanelView 800 HMI Terminal to ensure that the correct Modbus
addresses were being used, and verify Modbus parameters prior to implementation in the
full-system control program. This was necessary to determine if the listed addresses for
components were memory addresses or register locations. As noted by MidNite Solar:
The Modbus specification adds one (1) to the “address” sent to the unit in the packet command to access a “register”. This is so that Modbus registers start at 1 rather than 0. The main Classic address map starts at register 4101 but the packet itself sends out address 4100. Some Modbus software and libraries will go by register number and some will go by address so make sure which one it works with. [54]
This program allows the user to change in real-time the client being accessed, the
Modbus register being accessed, the access mode, the expected command, and the
command or response size. Additionally, it allows the user to see real-time data contained
within the Modbus response, which allows the user to verify the correct Modbus address
is in use. The details of this program are contained in Appendix E.

28
4. SMA Fieldbus
The SMA Sunny Island inverter and the SMA Sunny WebBox communicate
through a dedicated connection called the SMA fieldbus. This proprietary connection
allows communication between SMA devices only. Only the WebBox is directly
accessible via Modbus, but it does serve as a gateway for Modbus communication to
other SMA connected equipment via the SMA fieldbus. The SMA fieldbus utilizes a
master/slave type system similar to Modbus; however, it differs in that the WebBox is the
master on the SMA fieldbus and the remaining SMA devices are slaves.

29
III. METHODS AND TESTING
This chapter covers the basic approach to the programming and testing of the
control system for the compressor used in the CAES system at the NPS IMPEL.
A. CONTROL APPROACH
Since the added complexity of a variable speed drive would outweigh any real-
world benefits for a system of this size, a single speed compressor was chosen [55]. This
greatly simplifies the overall system design, and the coding required by restricting the
compressor to be either running or secured. However, numerous real-world variables can
only be determined in real-time for full automation. These variables include available
sunlight for power generation, the status of the inverter, the voltage of the capacitor bank,
and the desire for manual operation. Figure 21 shows the overall control program
flowchart. The details of the PLC and the HMI programs are contained in Appendix C
and Appendix D respectively.
1. Loss of Power Protection
One feature of the Micro850 is that it will retain global variables after power is
lost and subsequently restored. Global variables are the only variables that can transmit
between the Micro850 and the PanelView 800. This leads to a problem where several
variables do not reset following a loss and subsequent restoration of power, which may
lead to undesired equipment operation. Using the SYSVA_POWERUP_BIT, which is
only TRUE during the first run through the code after power-up, any variables that may
lead to undesired equipment operation are set to safe values prior to any other code
execution, thus ensuring a safe power-on state [56].
2. Indication of Program Stall
Another issue that might arise is the stalling of either the Micro850 or the
PanelView 800 HMI. To provide the user with indication that the system is operating as
intended, a heartbeat indicator is present in the top right of the screen. By flashing on and
off, this heartbeat indicator demonstrates that there is continuous communication between

30
the Micro850 and the PanelView 800 HMI and that no lock-up or stall has occurred on
either device.
Figure 21. Simplified Control Program Flowchart

31
3. Solar Power Production Status
Since the air compressor cannot function without sufficient solar power, it is
imperative that proper tests are conducted to ensure sufficient power is available prior to
and during operation of the compressor. A combination of three tests ensures that there is
sufficient solar power available.
The first test performed checks the date and time against a stored value of sunrise
and sunset times. The Micro850 does not contain a real-time clock; however, the
PanelView HMI does contain a real-time clock, and is able to communicate the current
date and time to the Micro850 for use during the following checks. The sunrise and
sunset times were obtained from the United States Naval Observatory (USNO), and are
specific to the location of the installed PV array at the Naval Postgraduate School Multi-
Physics Renewable Energy Laboratory [57]. The most limiting sunrise and sunset times
throughout the month were determined. These are the latest sunrise time and the earliest
sunset time within the month. This resulted in 12 conservative sunrise and sunset times
for use during the year. Using the limiting values ensures that the sun is at least above the
horizon prior to commencing the second test.
The second test specifically looks at the voltage across the PV array. Verifying
that the voltage across the PV array is at least 55 VDC ensures that sufficient power
production exists to keep the capacitors above the 30 VDC cutoff voltage of the Sunny
Island inverter. The cutoff voltage was determined by allowing the Sunny Island inverter
to run continuously until it automatically shut off, which occurred at a capacitor voltage
of 25 VDC, with the initial faults occurring at 30 VDC. To prevent any faults that might
affect system operation, an operational limit of 31 VDC has been imposed. Verifying the
PV array voltage directly allows the system to compensate for variable conditions such as
cloud cover. To prevent rapid cycling of the system in the event of intermittent clouds,
the system will not shut down the compressor or inverter until PV array voltage drops
below 50 VDC. The upper PV array voltage limit is based on the minimum observed
voltage capable of continuous compressor operation. The lower PV array voltage limit is
based on the PV array producing enough power to maintain the capacitor bank voltage
above the inverter shut-off limit of 30 VDC.

32
The last test performed verifies that sufficient power is available by directly
measuring the capacitor voltage. The state of charge of the capacitor bank is determined
directly through its voltage. The previous test examined the PV array voltage, which
ultimately charges the capacitors; however, the state of charge of the capacitor bank is
equally important. Verifying that the capacitor voltage is above 33 VDC prior to starting
the compressor ensures that there is sufficient reserve power in the capacitors to continue
inverter and compressor operation without fear of an automatic inverter shutdown. Again,
to prevent rapid cycling, the compressor will not shut down until the capacitor voltage
drops below 32 VDC.
4. Inverter State
As previously discussed, the delay in real-time inverter status causes some issues.
Specifically, the controller may attempt starting the compressor when no power is
actually present. To eliminate this issue, an inverter-commanded-off bit is set indicating
that the inverter is off after the shutdown command has been sent. A delay of 45 seconds
is implemented to ensure the true status of the inverter is updated prior to resetting the
inverter-commanded-off bit. This prevents the controller from attempting to start the
compressor when no input power is available.
5. Compressor Restart Delay
After the first time the compressor has run on a given day, a compressor-run-
today bit is set. This bit in conjunction with a minimum-voltage-to-run set point, or shut-
off set point, account for the possibility of the compressor drawing more power than is
available. Should running the compressor lower the voltage of the capacitors to the shut-
off set point, the compressor will be turned off to allow the capacitors to recharge. The
capacitors must subsequently charge above a minimum-voltage-to-restart set point before
the controller will restart the compressor. Additionally, a minimum charge time of ten
minutes is enforced to ensure sufficient power is stored in the capacitors prior to
restarting the compressor. The ten minute delay and minimum-voltage-to-restart set point
combine to ensure the compressor has sufficient power for a substantial run prior to
starting again.

33
6. Manual Control Capability
The HMI provides users with an option to place the system into manual mode.
While in manual mode, the system will not automatically start or stop the compressor or
inverter. This mode provides the user a method for turning off the compressor and/or the
inverter when they would normally be automatically controlled, to allow for system
maintenance and troubleshooting. The manual mode will not allow the inverter to start
without appropriate voltage on both the PV array and on the capacitors; however, there is
no automatic off to prevent faults on the inverter. Additionally, while in manual mode, it
is possible to start and stop the compressor from the grid with the inverter off.
Continuous monitoring is required if the system is operated in this mode. Should the
controller lose power while in manual mode, it will resume operation in manual mode
upon power restoration; however, the compressor and inverter will not automatically
restart if they were previously running.
7. Other Considerations
The control system performs no direct pressure monitoring since the compressor
will automatically turn on and off as previously discussed. As shown in Figure 22, the
existing building arrangements dictated the location for installing the compression
equipment. The significant distance between the power and control center and the
compression equipment presented multiple obstacles to implementing direct pressure
measurement. As such, the cycling of the compressor by pressure switch combined with
the low power consumption of the solid-state relay present an adequate pressure control
with minimal power requirements for this proof-of-concept system.

34
Figure 22. NPS IMPEL Building Layout
35
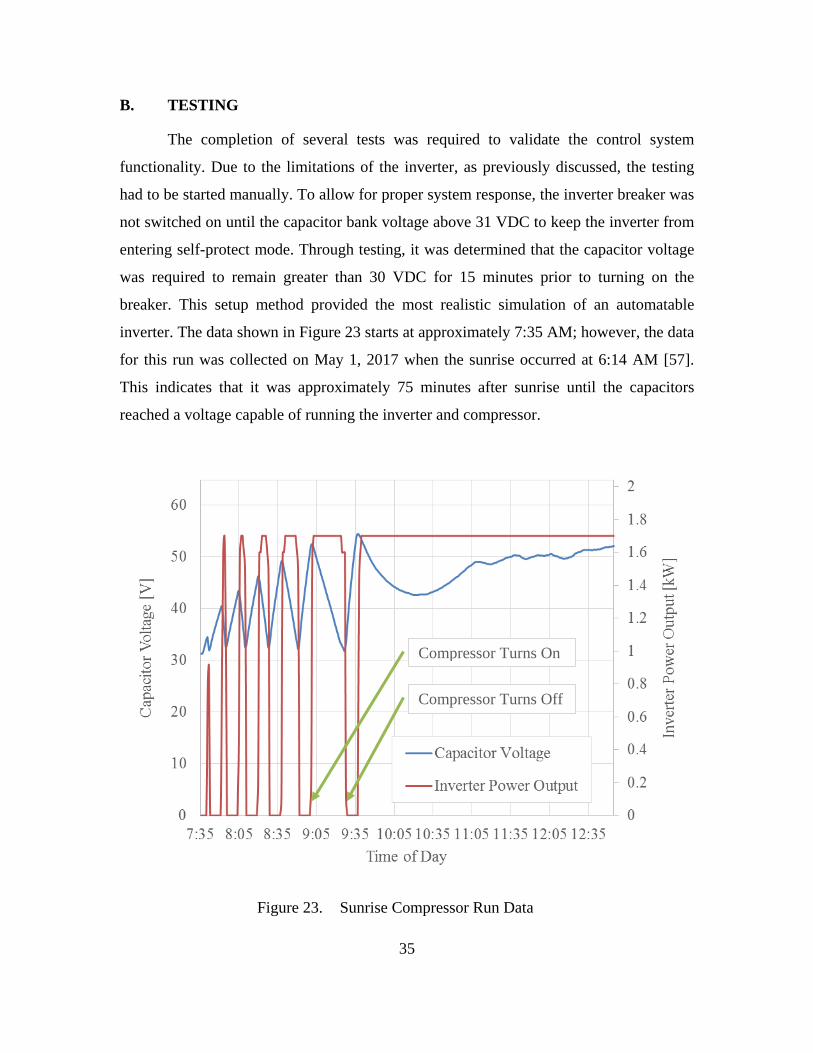
B. TESTING
The completion of several tests was required to validate the control system
functionality. Due to the limitations of the inverter, as previously discussed, the testing
had to be started manually. To allow for proper system response, the inverter breaker was
not switched on until the capacitor bank voltage above 31 VDC to keep the inverter from
entering self-protect mode. Through testing, it was determined that the capacitor voltage
was required to remain greater than 30 VDC for 15 minutes prior to turning on the
breaker. This setup method provided the most realistic simulation of an automatable
inverter. The data shown in Figure 23 starts at approximately 7:35 AM; however, the data
for this run was collected on May 1, 2017 when the sunrise occurred at 6:14 AM [57].
This indicates that it was approximately 75 minutes after sunrise until the capacitors
reached a voltage capable of running the inverter and compressor.
Figure 23. Sunrise Compressor Run Data
Compressor Turns On
Compressor Turns Off

36
As Figure 23 shows, the compressor runs for short periods, reducing capacitor
voltage to the compressor shut-off point six times over the course of approximately 120
minutes. During this time, the compressor ran for approximately 56 minutes, or just short
of half the time. Following the compressor start that occurred at approximately 9:35,
there is a significant dip in capacitor voltage, indicating that the incident solar radiance
was not quite enough to compensate for the running compressor. However, the solar
radiance incident upon the PV array eventually produced enough power to compensate
for the running compressor, preventing further automatic shutoffs during this data run.
The data shows that the system is capable of automatic operation, as intended.

37
IV. CONCLUSIONS AND RECOMMENDATIONS
The purpose of this research was to develop and implement an automated control
system for the SS-CAES compression cycle. Achieving this goal required a combination
of monitoring available solar radiance and available temporary power to ensure the
system was maximizing available runtimes. By demonstrating the functionality of this
system, the NPS IMPEL is now capable of producing compressed air from a purely
renewable source. Additionally, this project will result in significant energy savings for
future supersonic wind tunnel testing, as it maintains the air tanks at 33% of required
capacity. This project, when combined with a compressed air generator, paves the way
for a complete SS-CAES system. Implementing more systems similar to this SS-CAES
system across military installations will reduce reliance on fossil fuels and greatly
enhance the renewable energy profile of the DOD.
The following sections contain recommendations for future enhancement of the
NPS IMPEL SS-CAES system.
(1) Fully Automated Inverter
The voltage limitations and lack of automatic restart of the Sunny Island inverter
presented an insurmountable obstacle during this project. Specifically, the issue of
inverter’s self-protect mode and subsequent physical switch manipulation to enable
restarting was not solved. While thought was given to implementing a linear actuator to
automatically manipulate the breaker, it was determined that automatic operation of a
safety device was potentially unsafe and therefore not performed. However, three
possible solutions exist for this problem. The first would be to replace the Sunny Island
inverter completely with one that does not enter a self-protect mode at low input voltages.
By installing an inverter that is also capable of producing 240 VAC directly, the
Smartformer could also be eliminated, further increasing system efficiency. The second
possible solution would be to add more temporary energy storage to ensure that the input
voltage to the Sunny Island inverter never drops below the required 30 VDC after the sun
sets. This would likely require the installation of an additional 12 ultracapacitors, for a

38
usable system storage capability of 653 Wh. The third possible solution, and likely the
most effective, is explored further in the next section.
(2) Combine SS-CAES Compression and Expansion
By combining the SS-CAES compression and expansion systems together, it
would be possible to negate any issues with the Sunny Island inverter. Specifically, by
having the expansion system maintain voltage on the capacitor bank at or above the
minimum required for inverter operation, true automation can be accomplished.
Additionally, the control systems for the compression and expansion systems are virtually
identical [18]. This would allow further automation and integration with each other.
(3) Implement TES for Improved Efficiency
Using TES, as in the case of the ADELE Project, would further increase the
system efficiency. This would allow the NPS IMPEL SS-CAES system to more closely
approximate a system with isothermal expansion, which results in nearly twice the energy
storage per unit volume within the air tanks.
39
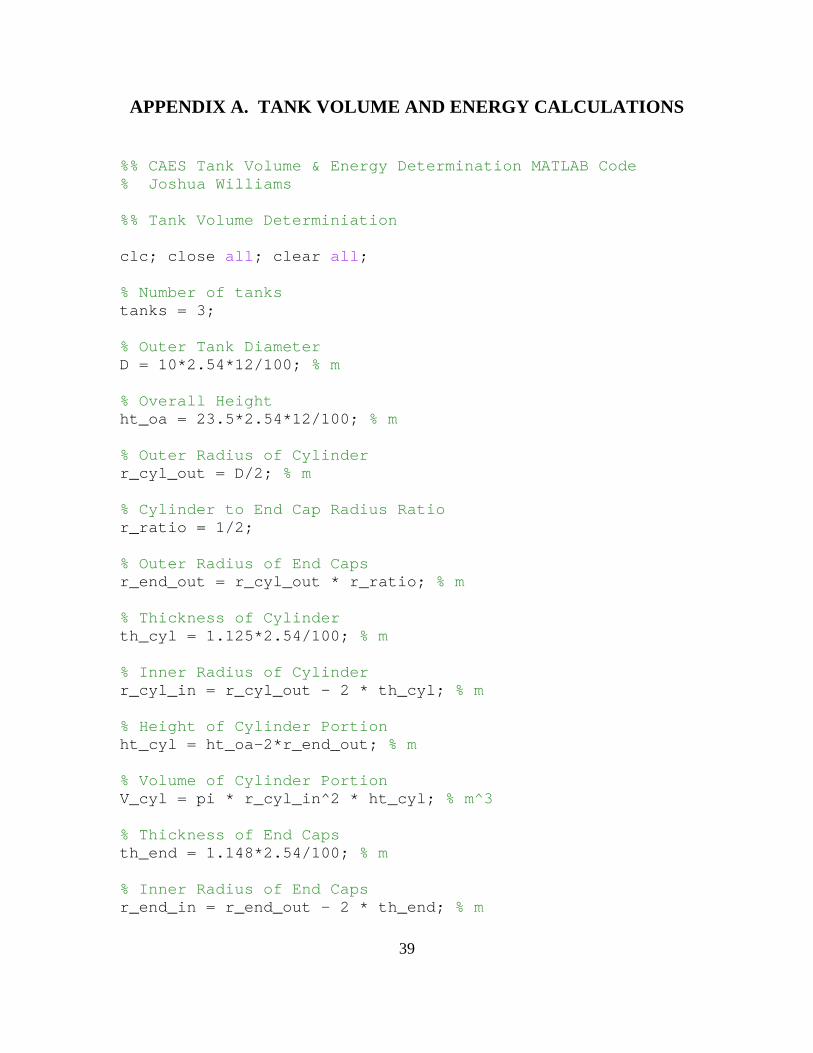
APPENDIX A. TANK VOLUME AND ENERGY CALCULATIONS
%% CAES Tank Volume & Energy Determination MATLAB Code % Joshua Williams %% Tank Volume Determiniation clc; close all; clear all; % Number of tanks tanks = 3; % Outer Tank Diameter D = 10*2.54*12/100; % m % Overall Height ht_oa = 23.5*2.54*12/100; % m % Outer Radius of Cylinder r_cyl_out = D/2; % m % Cylinder to End Cap Radius Ratio r_ratio = 1/2; % Outer Radius of End Caps r_end_out = r_cyl_out * r_ratio; % m % Thickness of Cylinder th_cyl = 1.125*2.54/100; % m % Inner Radius of Cylinder r_cyl_in = r_cyl_out - 2 * th_cyl; % m % Height of Cylinder Portion ht_cyl = ht_oa-2*r_end_out; % m % Volume of Cylinder Portion V_cyl = pi * r_cyl_in^2 * ht_cyl; % m^3 % Thickness of End Caps th_end = 1.148*2.54/100; % m % Inner Radius of End Caps r_end_in = r_end_out - 2 * th_end; % m

40
% Volume of Ellipsoidal End Caps (combined) V_ends = 4/3 * pi * r_cyl_in^2 * r_end_in; % m^3 % Volume of One Tank: Vol_one = V_cyl + V_ends; % m^3 % Volume of all Tanks: Vol_tot = Vol_one * tanks; % m^3 %% Energy Content of Tanks % Tank Pressure P1 = 792.897; % kPa % Atmospheric Pressure P2 = 101.325; % kPa % Tank Volume (from above) V1 = Vol_tot; % m^3 % Ambient Temperature T1 = 293; % K % Constant Pressure Specific Heat Cp = 1.004; % kJ/kg-K % Constant Volume Specific Heat Cv = 0.717; % kJ/kg-K % Specific Heat Ratios gamma = Cp/Cv; % Ideal Gas Constant R = Cp-Cv; % Volume After Isothermal Expansion V2_iso = P1*V1/P2; % m^3 % Isothermal Work W_iso = P1*V1 * log(P1/P2); % kJ % Isothermal Temperature (no change) T2_iso = T1; % K % Isothermal Work in kWh W_iso_kWh = W_iso/3600 % kWh

41
% Volume After Adiabatic Expansion V2_ad = ((P1*V1^gamma)/P2)^(1/gamma); % m^3 % Adiabatic Work W_ad = (P2*V2_ad-P1*V1)/(1-gamma); % kJ % Adiabatic Exit Temperature T2_ad = T1*(P2/P1)^((gamma-1)/gamma); % K % Adiabatic Work in kWh W_ad_kWh = W_ad/3600 % kWh

42
THIS PAGE INTENTIONALLY LEFT BLANK

43
APPENDIX B. CONTROLLER SOFTWARE SETUP
This appendix covers obtaining the supporting software for programming the PLC
and HMI. The software for programming the PLC and HMI is called Rockwell
Automation Connected Components Workbench. It can be obtained from the downloads
section at the following web address: http://rockwellautomation.com/global/support/
connected-components/workbench.page. The user may be required to create an account
to download the software, but the standard edition of the software is free of charge.
Connected Components Workbench version 9 was used to program the PLC and HMI for
the SS-CAES compression system. The user is required to have administrator privileges
on the PC to complete the installation. The installation requires approximately 5 GB of
storage space on the hard drive.

44
THIS PAGE INTENTIONALLY LEFT BLANK

45
APPENDIX C. CONTROLLER PROGRAM.
This appendix contains all settings and programs that run on the Micro850
Controller. The intent is that the reader will be able to take this information and fully
recreate the control system.
A. CONTROLLER WIDE SETTINGS
This section contains all controller settings, global variables, and user-defined
data types.
1. Settings
Table 2 Settings
Setting Value Controller General
Name: AutomatedCAES Ethernet Configure IP address and settings Selected
IP Address: 192.168.0.1 Subnet Mask 255.255.255.0 Gateway Address 192.168.0.0

46
2. Global Variables
Table 3 Global Variables
Name Data Type Initial Value allow_inverter_off BOOL TRUE allow_inverter_on BOOL FALSE batt_abs_min WORD 310 batt_min_start WORD 325 batt_voltage_abs_min REAL 31.0 batt_voltage_min_start REAL 33.0 batt_voltage_min_stop REAL 32.0 battery_status_charged BOOL FALSE battery_voltage REAL battery_voltage_max REAL 53.0 battery_voltage_min_restart REAL 40.0 button_visible BOOL cmd_start_compressor BOOL cmd_start_inverter BOOL cmd_stop_compressor BOOL cmd_stop_inverter BOOL compressor_allow_restart BOOL TRUE compressor_run_today BOOL FALSE compressor_running BOOL FALSE compressor_status UINT day UINT day_run UINT 1 error_charger_modbus BOOL FALSE error_inverter_modbus BOOL FALSE HeartBeat BOOL hour UINT inverter_recent_off BOOL FALSE inverter_status_online BOOL inverter_status_running BOOL FALSE ManualControlEnabled BOOL min_restart_time REAL 10.0 minute UINT modbus_offset UDINT 1 month UINT month_run UINT 1 pv_abs_min WORD 500 pv_min_start WORD 550 pv_voltage REAL
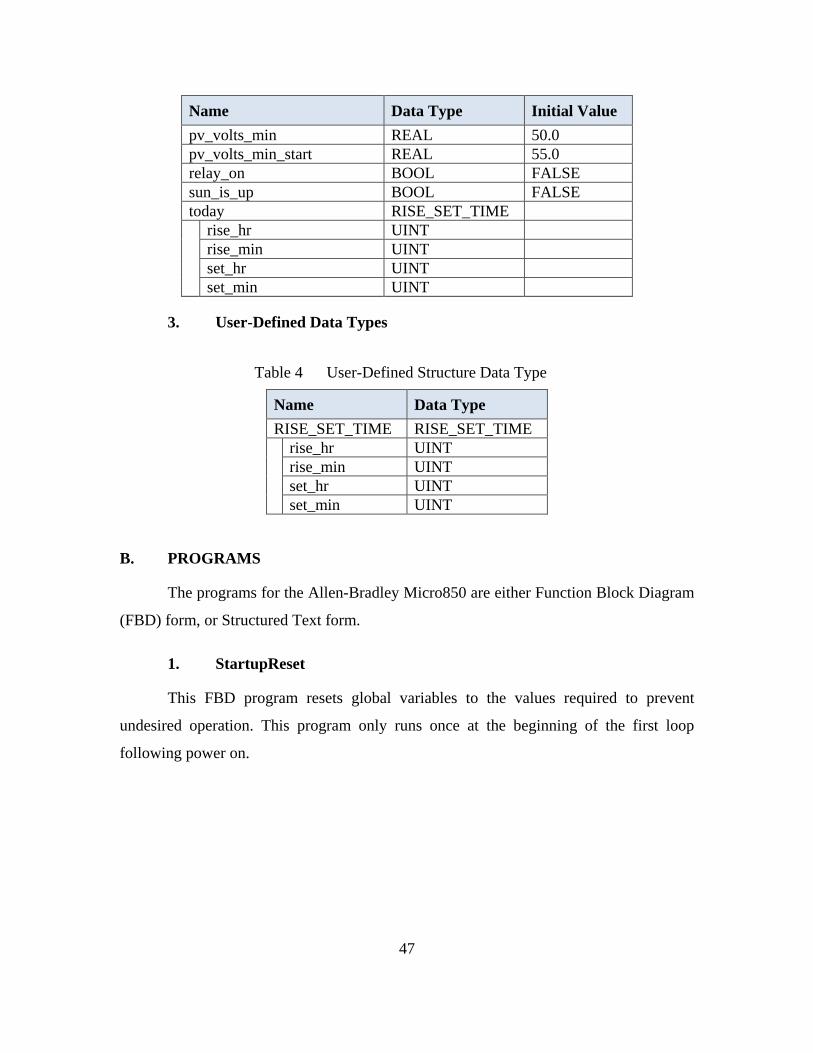
47
Name Data Type Initial Value pv_volts_min REAL 50.0 pv_volts_min_start REAL 55.0 relay_on BOOL FALSE sun_is_up BOOL FALSE today RISE_SET_TIME rise_hr UINT
rise_min UINT set_hr UINT set_min UINT
3. User-Defined Data Types
Table 4 User-Defined Structure Data Type
Name Data Type RISE_SET_TIME RISE_SET_TIME rise_hr UINT
rise_min UINT set_hr UINT set_min UINT
B. PROGRAMS
The programs for the Allen-Bradley Micro850 are either Function Block Diagram
(FBD) form, or Structured Text form.
1. StartupReset
This FBD program resets global variables to the values required to prevent
undesired operation. This program only runs once at the beginning of the first loop
following power on.
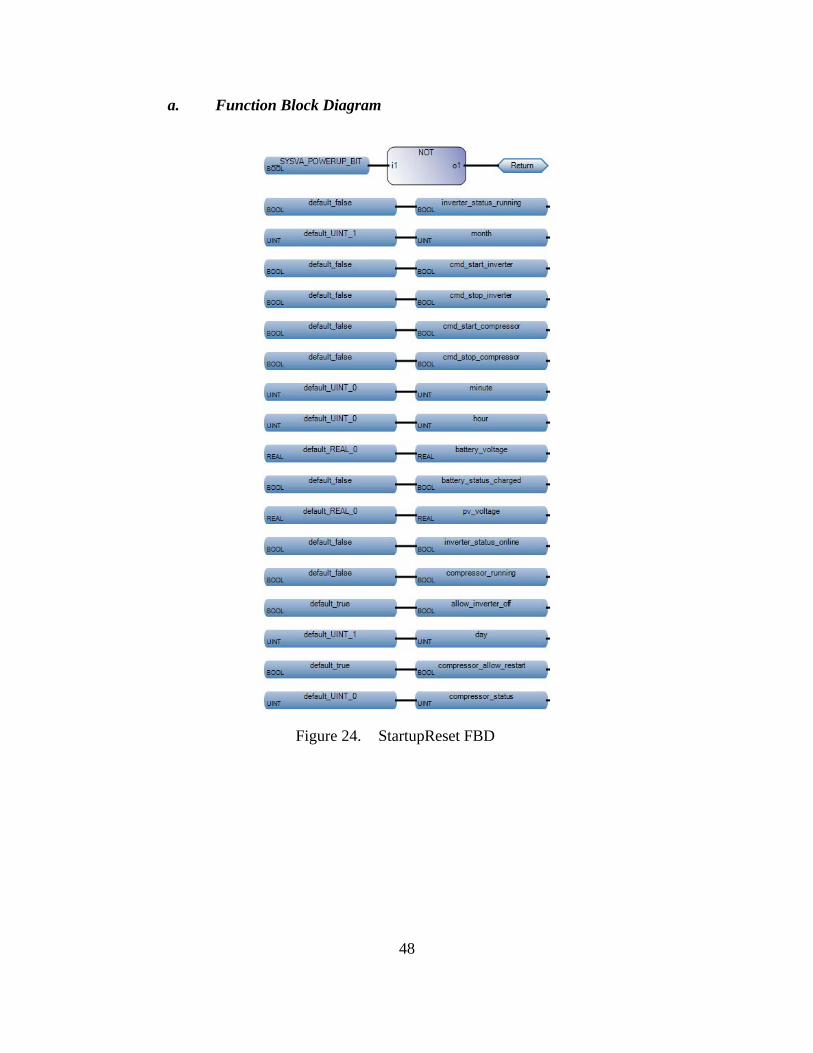
48
a. Function Block Diagram
Figure 24. StartupReset FBD
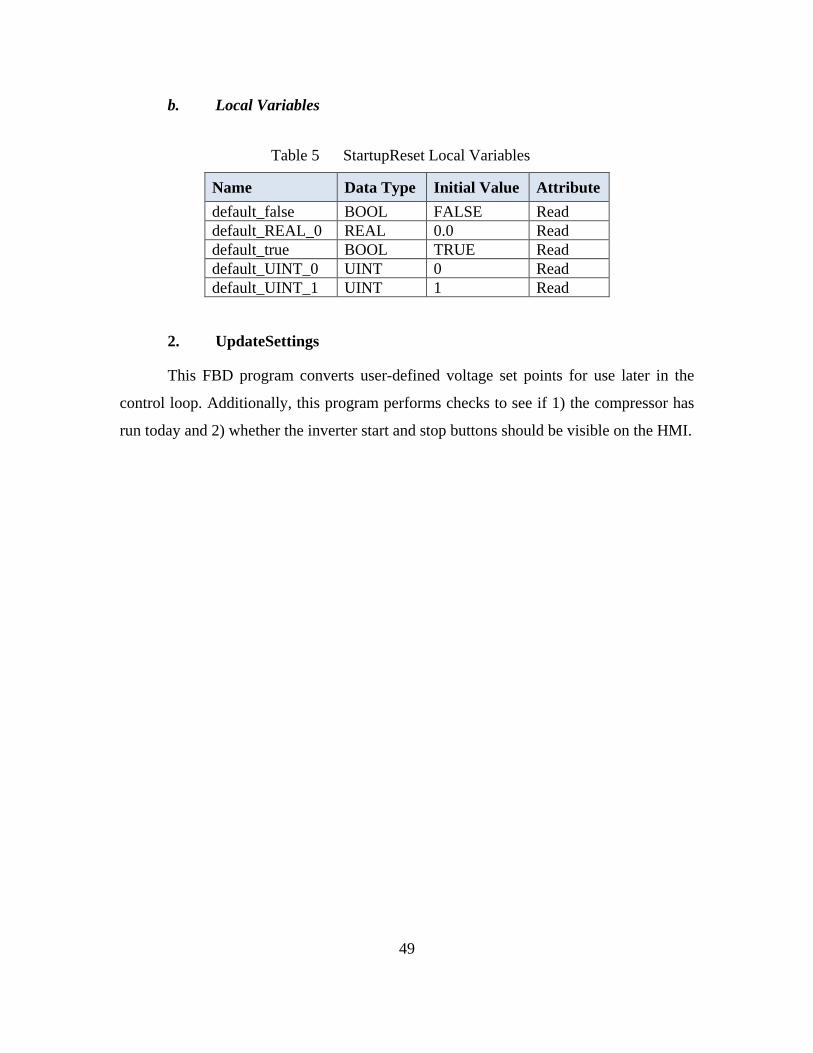
49
b. Local Variables
Table 5 StartupReset Local Variables
Name Data Type Initial Value Attribute default_false BOOL FALSE Read default_REAL_0 REAL 0.0 Read default_true BOOL TRUE Read default_UINT_0 UINT 0 Read default_UINT_1 UINT 1 Read
2. UpdateSettings
This FBD program converts user-defined voltage set points for use later in the
control loop. Additionally, this program performs checks to see if 1) the compressor has
run today and 2) whether the inverter start and stop buttons should be visible on the HMI.

50
a. Function Block Diagram
Figure 25. UpdateSettings FBD
b. Local Variables
Table 6 UpdateSettings Local Variables
Variable Name Data Type Initial Value mult_ten_x REAL 10.0

51
3. ProgHeartbeat
This FBD program provides a graphical indication of connectivity between the
controller and the HMI.
a. Function Block Diagram
Figure 26. Heartbeat Program Function Block Diagram
b. Local Variables
Table 7 Heartbeat Local Variables
Variable Name Data Type Initial Value CheckSunDelay DINT 60 heartbeat_ctu DINT 2 heartbeat_time Time T#1s start_timer BOOL TRUE

52
4. VerifySunState
This FBD program retrieves PV array voltage and capacitor voltage from the
MidNite Classic 150 charge controller via Modbus. Comparing these values to set points
ensures that there is sufficient sunlight (in the form of PV voltage) and charge (in the
form of capacitor voltage) to run the equipment. Additionally, this FBD checks the status
of the drop-out relay, to determine the proper indication to display for the status of the
compressor while running.

53
a. Function Block Diagram
Figure 27. VerifySunState FBD

54
b. Local Variables
Table 8 VerifySunState Local Variables
Variable Name Data Type Initial Value dint_mask DINT 16384 divisor REAL 10.0 modbus_buffer MODBUSLOCADDR modbus_location MODBUS2LOCPARA Channel UINT 4 TriggerType UDINT 10000 Cmd USINT 3 ElementCnt UINT 2 modbus_target MODBUS2TARPARA Addr UDINT 4115
NodeAddress MODBUS2NODEADDR NodeAddress[0] USINT 192
NodeAddress[1] USINT 168 NodeAddress[2] USINT 0 NodeAddress[3] USINT 50
Port UINT 0 UnitId USINT 1 MsgTimeout UDINT 0 ConnTimeout UDINT 0 ConnClose BOOL TRUE
read_modbus BOOL TRUE
5. CompressorRestartDelay
This FBD program sets a bit to ensure the compressor is off for a user-defined
length of time prior to restarting.

55
a. Function Block Diagram
Figure 28. CompressorRestartDelay FBD
b. Local Variables
Table 9 CompressorRestartDelay Local Variables
Variable Name Data Type Initial Value min_to_ms REAL 60000.0 real_five REAL 5.0 restart_time TIME T#10m
6. CheckInverterStatus
This FBD program checks if the inverter has power and if it is running.

56
a. Function Block Diagram
Figure 29. CheckInverterStatus FBD
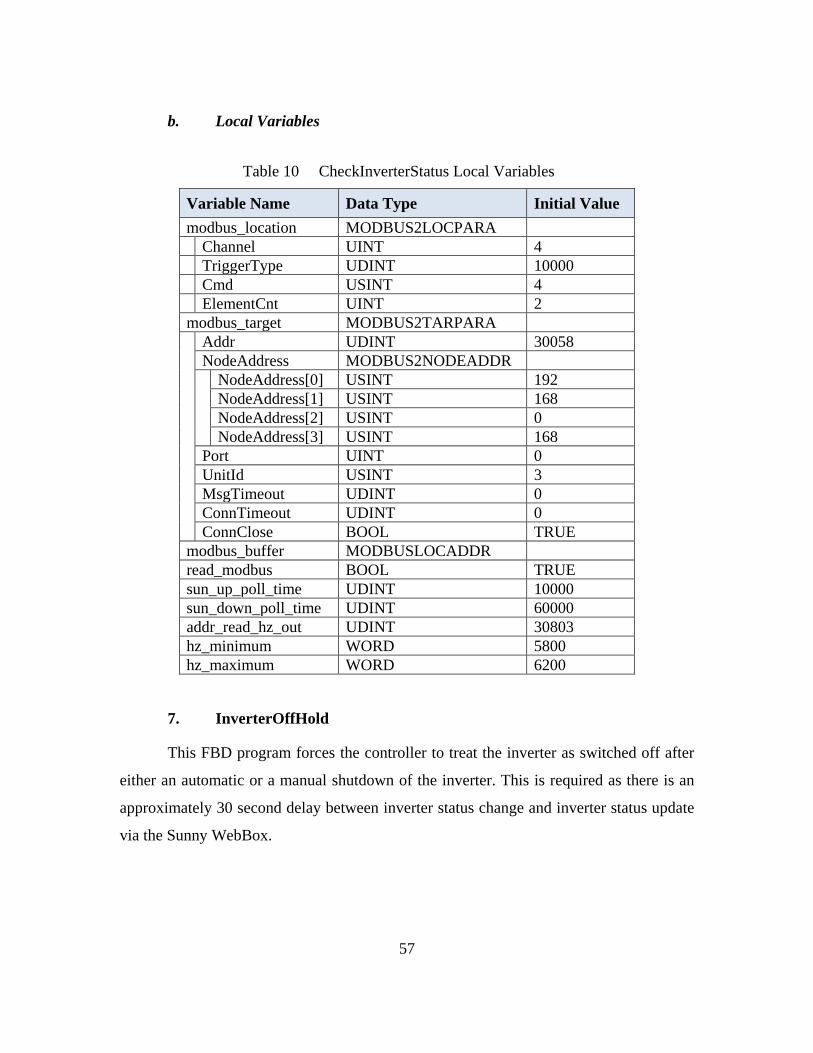
57
b. Local Variables
Table 10 CheckInverterStatus Local Variables
Variable Name Data Type Initial Value modbus_location MODBUS2LOCPARA Channel UINT 4 TriggerType UDINT 10000 Cmd USINT 4 ElementCnt UINT 2 modbus_target MODBUS2TARPARA Addr UDINT 30058
NodeAddress MODBUS2NODEADDR NodeAddress[0] USINT 192
NodeAddress[1] USINT 168 NodeAddress[2] USINT 0 NodeAddress[3] USINT 168
Port UINT 0 UnitId USINT 3 MsgTimeout UDINT 0 ConnTimeout UDINT 0 ConnClose BOOL TRUE
modbus_buffer MODBUSLOCADDR read_modbus BOOL TRUE sun_up_poll_time UDINT 10000 sun_down_poll_time UDINT 60000 addr_read_hz_out UDINT 30803 hz_minimum WORD 5800 hz_maximum WORD 6200
7. InverterOffHold
This FBD program forces the controller to treat the inverter as switched off after
either an automatic or a manual shutdown of the inverter. This is required as there is an
approximately 30 second delay between inverter status change and inverter status update
via the Sunny WebBox.

58
a. Function Block Diagram
Figure 30. InverterOffHold FBD
b. Local Variables
Table 11 InverterOffHold Local Variables
Variable Name Data Type Initial Value start_timer BOOL TRUE one_sec TIME T#1s delay DINT 45 reset_timer BOOL FALSE

59
8. AutomaticInverterControl
This FBD program automatically starts and stops the inverter based on the
available power.
a. Function Block Diagram
Figure 31. AutomaticInverterControl FBD

60
b. Local Variables
Table 12 AutomaticInverterControl Local Variables
Variable Name Data Type Initial Value inverter_local_cfg MODBUS2LOCPARA Channel UINT 4 TriggerType UDINT 0 Cmd USINT 16 ElementCnt UINT 2 inverter_address MODBUS2TARPARA Addr UDINT 40010
NodeAddress MODBUS2NODEADDR NodeAddress[0] USINT 192
NodeAddress[1] USINT 168 NodeAddress[2] USINT 0 NodeAddress[3] USINT 168
Port UINT 0 UnitId USINT 3 MsgTimeout UDINT 0 ConnTimeout UDINT 0 ConnClose BOOL TRUE
inverter_cmd MODBUSLOCADDR start_command WORD 569 stop_command WORD 381 ManualModeReset BOOL FALSE
9. ManualInverterControl
This FBD program allows for manual control of the inverter.

61
a. Function Block Diagram
Figure 32. ManualInverterControl FBD
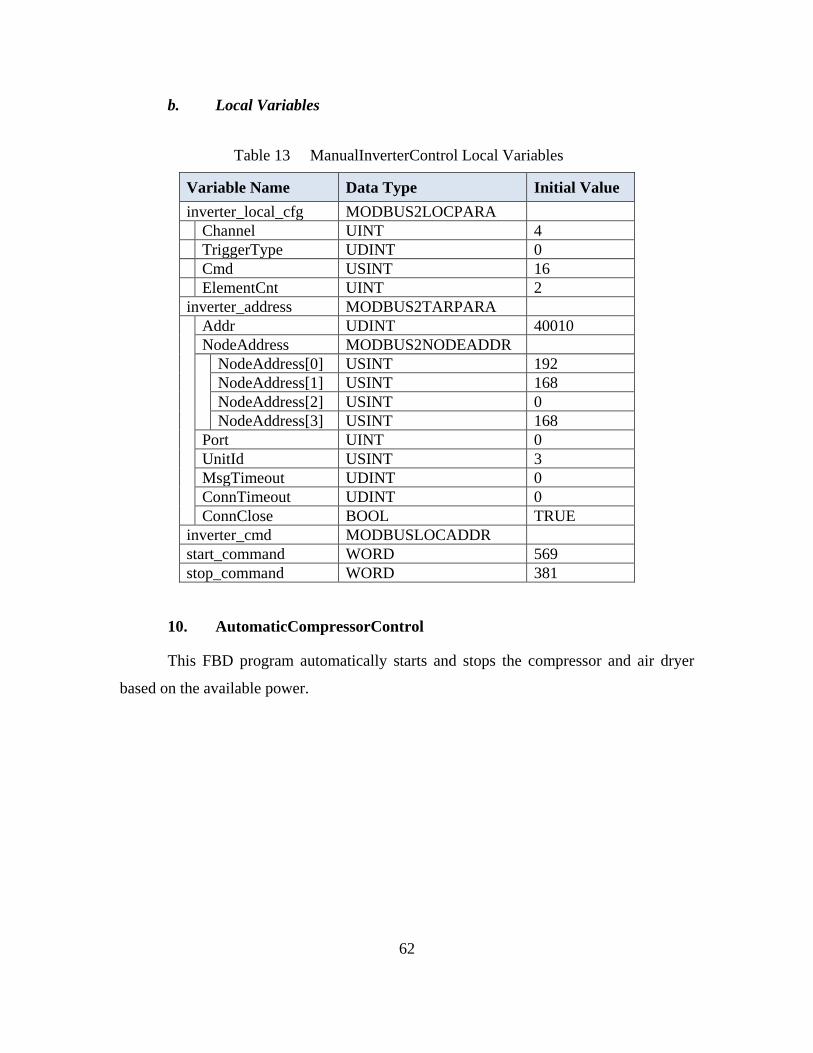
62
b. Local Variables
Table 13 ManualInverterControl Local Variables
Variable Name Data Type Initial Value inverter_local_cfg MODBUS2LOCPARA Channel UINT 4 TriggerType UDINT 0 Cmd USINT 16 ElementCnt UINT 2 inverter_address MODBUS2TARPARA Addr UDINT 40010
NodeAddress MODBUS2NODEADDR NodeAddress[0] USINT 192
NodeAddress[1] USINT 168 NodeAddress[2] USINT 0 NodeAddress[3] USINT 168
Port UINT 0 UnitId USINT 3 MsgTimeout UDINT 0 ConnTimeout UDINT 0 ConnClose BOOL TRUE
inverter_cmd MODBUSLOCADDR start_command WORD 569 stop_command WORD 381
10. AutomaticCompressorControl
This FBD program automatically starts and stops the compressor and air dryer
based on the available power.
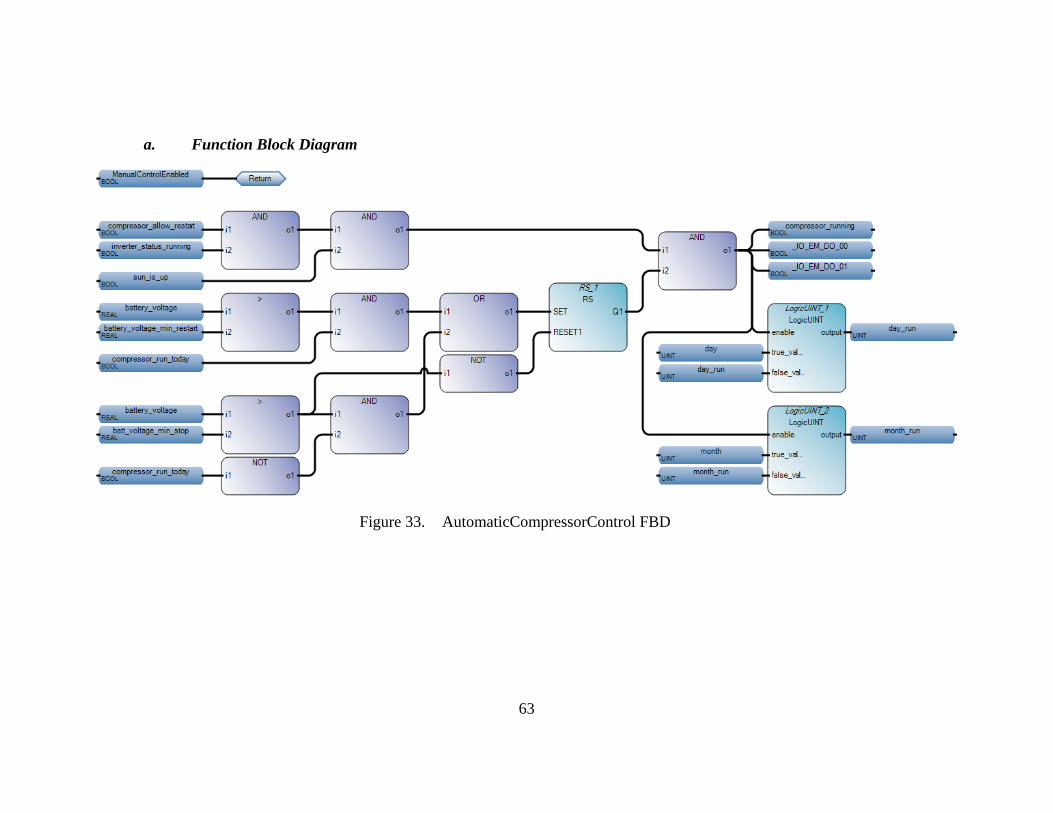
63
a. Function Block Diagram
Figure 33. AutomaticCompressorControl FBD
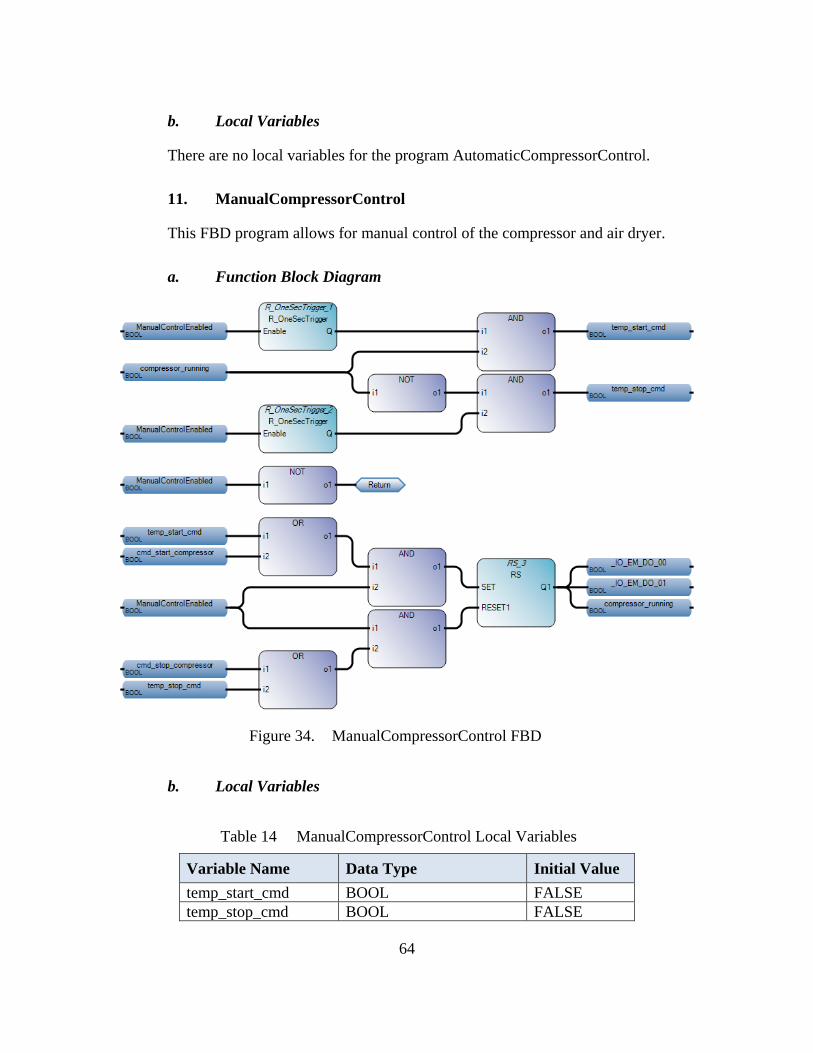
64
b. Local Variables
There are no local variables for the program AutomaticCompressorControl.
11. ManualCompressorControl
This FBD program allows for manual control of the compressor and air dryer.
a. Function Block Diagram
Figure 34. ManualCompressorControl FBD
b. Local Variables
Table 14 ManualCompressorControl Local Variables
Variable Name Data Type Initial Value temp_start_cmd BOOL FALSE temp_stop_cmd BOOL FALSE

65
12. UpdateCompressorState
This FBD program checks the power output of the inverter to determine if the
compressor is running from the inverter since there is no direct indication of the
compressor running.
a. Function Block Diagram
Figure 35. UpdateCompressorState FBD
b. Local Variables
Table 15 UpdateCompressorState Local Variables
Variable Name Data Type Initial Value pwr_min WORD 1000
C. USER-DEFINED FUNCTION BLOCKS
In some instances, a function does not exist that will perform the desired function.
In these cases, the user must create a function in the User-Defined Function Blocks
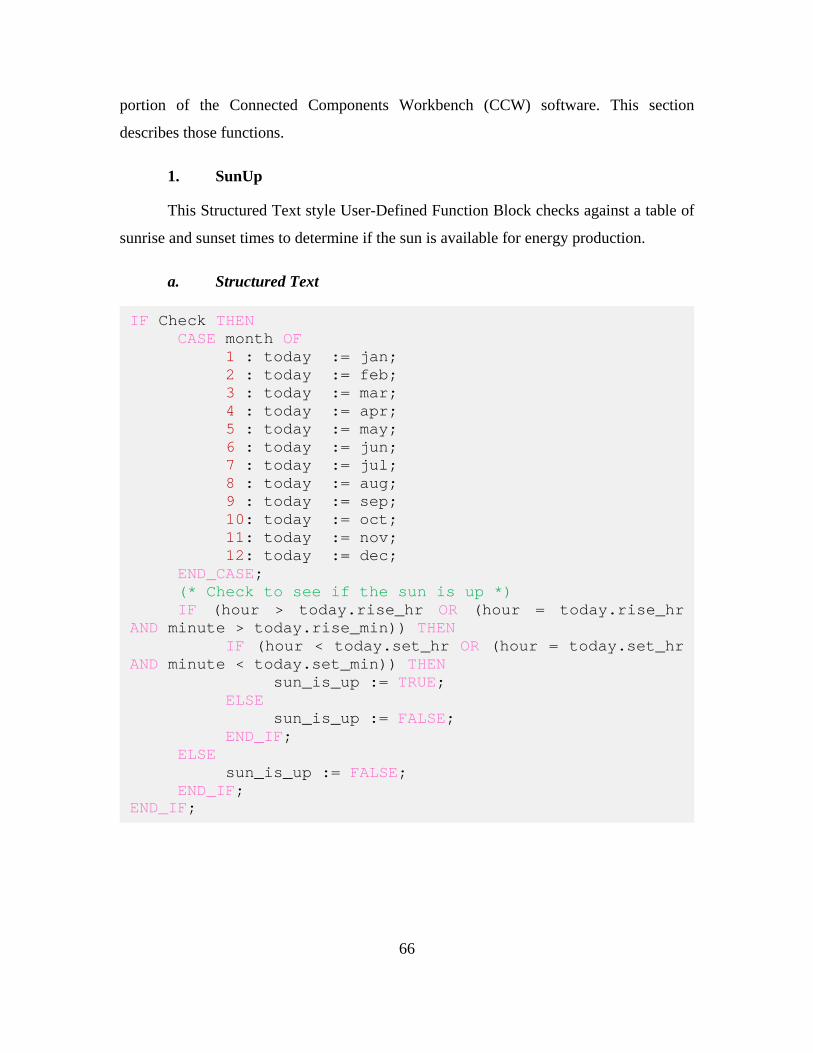
66
portion of the Connected Components Workbench (CCW) software. This section
describes those functions.
1. SunUp
This Structured Text style User-Defined Function Block checks against a table of
sunrise and sunset times to determine if the sun is available for energy production.
a. Structured Text
IF Check THEN CASE month OF 1 : today := jan; 2 : today := feb; 3 : today := mar; 4 : today := apr; 5 : today := may; 6 : today := jun; 7 : today := jul; 8 : today := aug; 9 : today := sep; 10: today := oct; 11: today := nov; 12: today := dec; END_CASE; (* Check to see if the sun is up *) IF (hour > today.rise_hr OR (hour = today.rise_hr AND minute > today.rise_min)) THEN IF (hour < today.set_hr OR (hour = today.set_hr AND minute < today.set_min)) THEN sun_is_up := TRUE; ELSE sun_is_up := FALSE; END_IF; ELSE sun_is_up := FALSE; END_IF; END_IF;
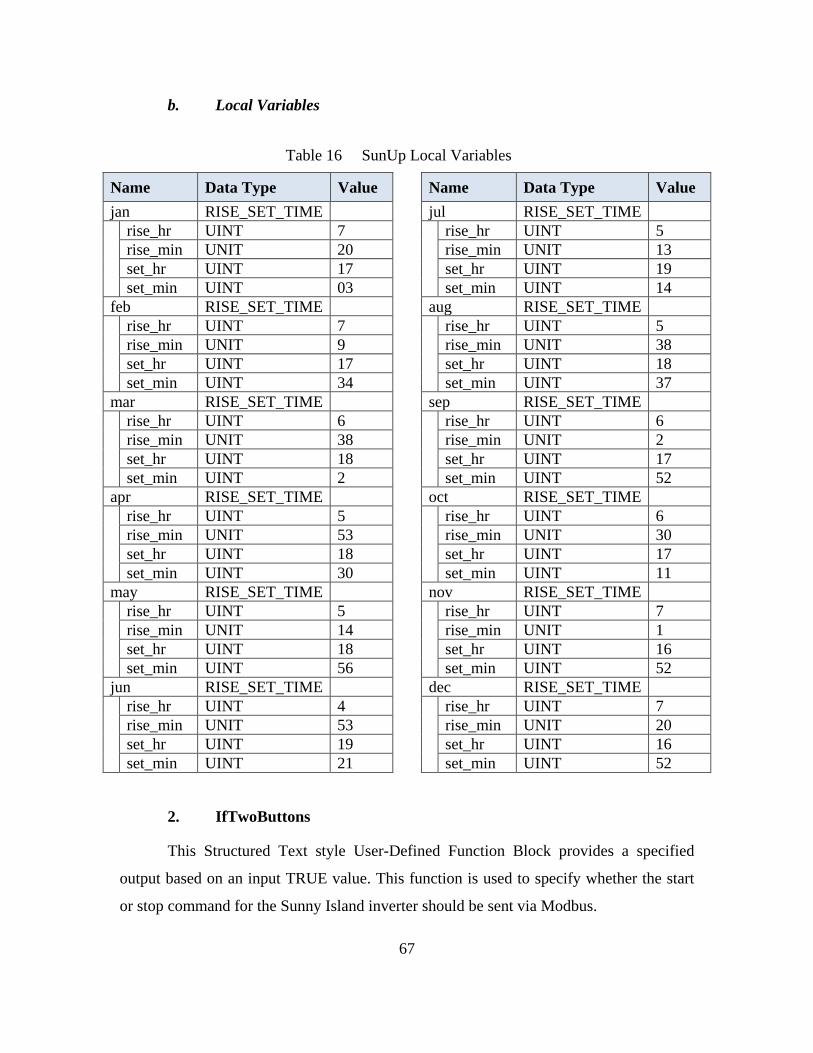
67
b. Local Variables
Table 16 SunUp Local Variables
Name Data Type Value Name Data Type Value jan RISE_SET_TIME jul RISE_SET_TIME rise_hr UINT 7 rise_hr UINT 5
rise_min UNIT 20 rise_min UNIT 13 set_hr UINT 17 set_hr UINT 19 set_min UINT 03 set_min UINT 14
feb RISE_SET_TIME aug RISE_SET_TIME rise_hr UINT 7 rise_hr UINT 5
rise_min UNIT 9 rise_min UNIT 38 set_hr UINT 17 set_hr UINT 18 set_min UINT 34 set_min UINT 37
mar RISE_SET_TIME sep RISE_SET_TIME rise_hr UINT 6 rise_hr UINT 6
rise_min UNIT 38 rise_min UNIT 2 set_hr UINT 18 set_hr UINT 17 set_min UINT 2 set_min UINT 52
apr RISE_SET_TIME oct RISE_SET_TIME rise_hr UINT 5 rise_hr UINT 6
rise_min UNIT 53 rise_min UNIT 30 set_hr UINT 18 set_hr UINT 17 set_min UINT 30 set_min UINT 11
may RISE_SET_TIME nov RISE_SET_TIME rise_hr UINT 5 rise_hr UINT 7
rise_min UNIT 14 rise_min UNIT 1 set_hr UINT 18 set_hr UINT 16 set_min UINT 56 set_min UINT 52
jun RISE_SET_TIME dec RISE_SET_TIME rise_hr UINT 4 rise_hr UINT 7
rise_min UNIT 53 rise_min UNIT 20 set_hr UINT 19 set_hr UINT 16 set_min UINT 21 set_min UINT 52
2. IfTwoButtons
This Structured Text style User-Defined Function Block provides a specified
output based on an input TRUE value. This function is used to specify whether the start
or stop command for the Sunny Island inverter should be sent via Modbus.
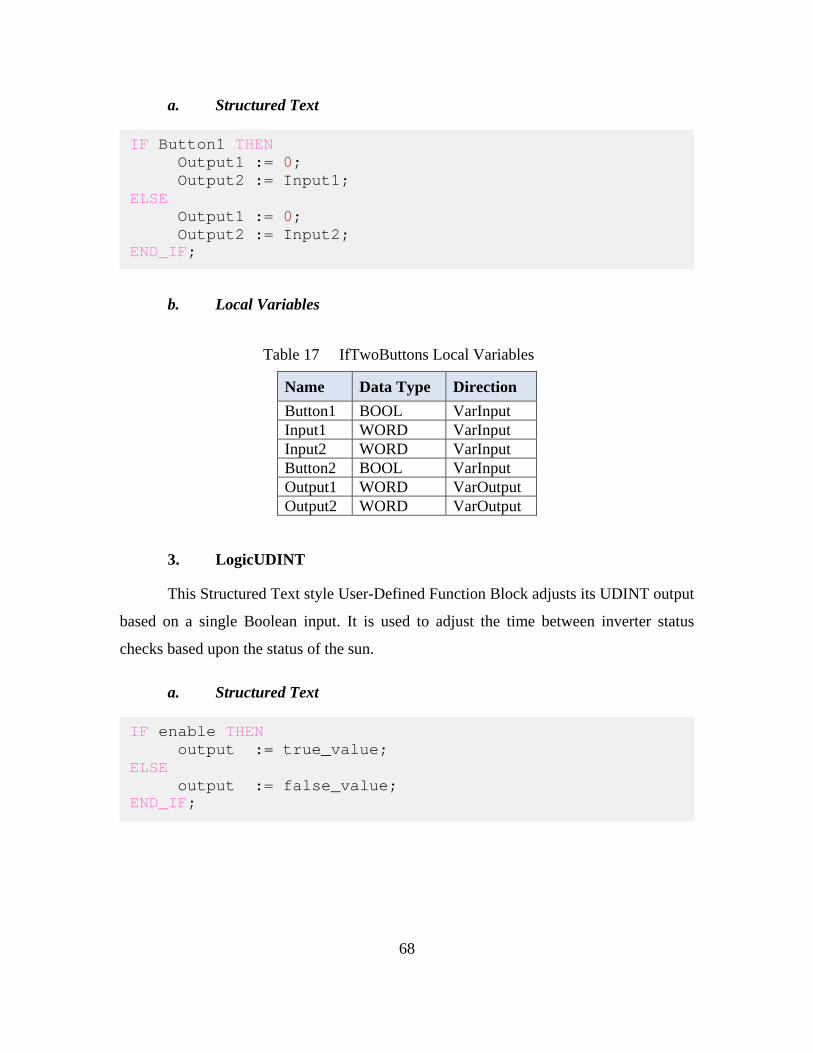
68
a. Structured Text
b. Local Variables
Table 17 IfTwoButtons Local Variables
Name Data Type Direction Button1 BOOL VarInput Input1 WORD VarInput Input2 WORD VarInput Button2 BOOL VarInput Output1 WORD VarOutput Output2 WORD VarOutput
3. LogicUDINT
This Structured Text style User-Defined Function Block adjusts its UDINT output
based on a single Boolean input. It is used to adjust the time between inverter status
checks based upon the status of the sun.
a. Structured Text
IF Button1 THEN Output1 := 0; Output2 := Input1; ELSE Output1 := 0; Output2 := Input2; END_IF;
IF enable THEN output := true_value; ELSE output := false_value; END_IF;

69
b. Local Variables
Table 18 LogicUDINT Local Variables
Name Data Type Direction enable BOOL VarInput true_value UDINT VarInput false_value UDINT VarInput output UDINT VarOutput
4. LogicUINT
This Structured Text style User-Defined Function Block is identical to
LogicUDINT with the exception that all local variables of UDINT data type are now
UINT data types.
5. F_OneSecTrigger
This FBD style User-Defined Function Block modifies the provided falling-edge
trigger and maintains the output for a duration of one second. This longer trigger time is
required for condition based Modbus queries to succeed.
a. Function Block Diagram
Figure 36. F_OneSecTrigger FBD
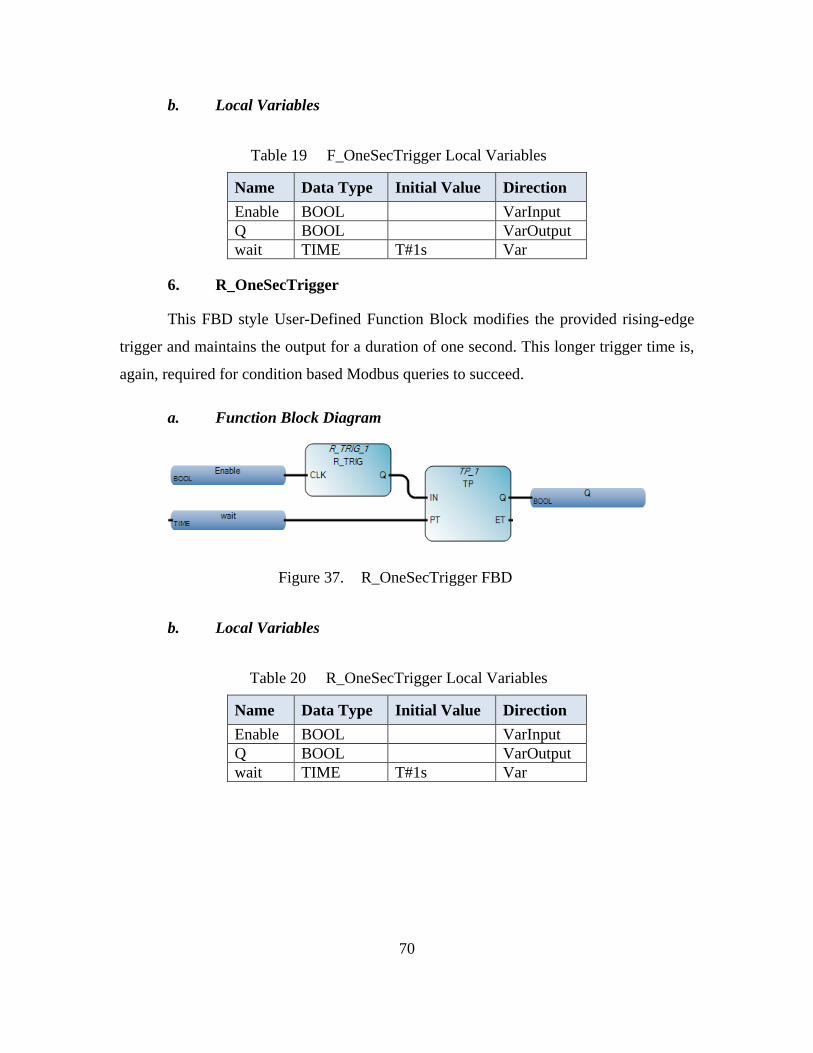
70
b. Local Variables
Table 19 F_OneSecTrigger Local Variables
Name Data Type Initial Value Direction Enable BOOL VarInput Q BOOL VarOutput wait TIME T#1s Var
6. R_OneSecTrigger
This FBD style User-Defined Function Block modifies the provided rising-edge
trigger and maintains the output for a duration of one second. This longer trigger time is,
again, required for condition based Modbus queries to succeed.
a. Function Block Diagram
Figure 37. R_OneSecTrigger FBD
b. Local Variables
Table 20 R_OneSecTrigger Local Variables
Name Data Type Initial Value Direction Enable BOOL VarInput Q BOOL VarOutput wait TIME T#1s Var

71
APPENDIX D. SCREEN PROGRAM
This appendix covers the both the settings changed on the HMI directly, as well as the HMI program that was created in Connected Components Workbench.
A. NETWORK SETUP
The network setup was conducted from the screen of the HMI. By accessing the “Main” screen, and setting the values as indicated in Table 21.
Table 21 HMI Network Setup
Setting Name Value Main Communication
Set Static IP Address IP Address 192.168.0.2
Mask 255.255.255.0 Gateway 192.168.0.1
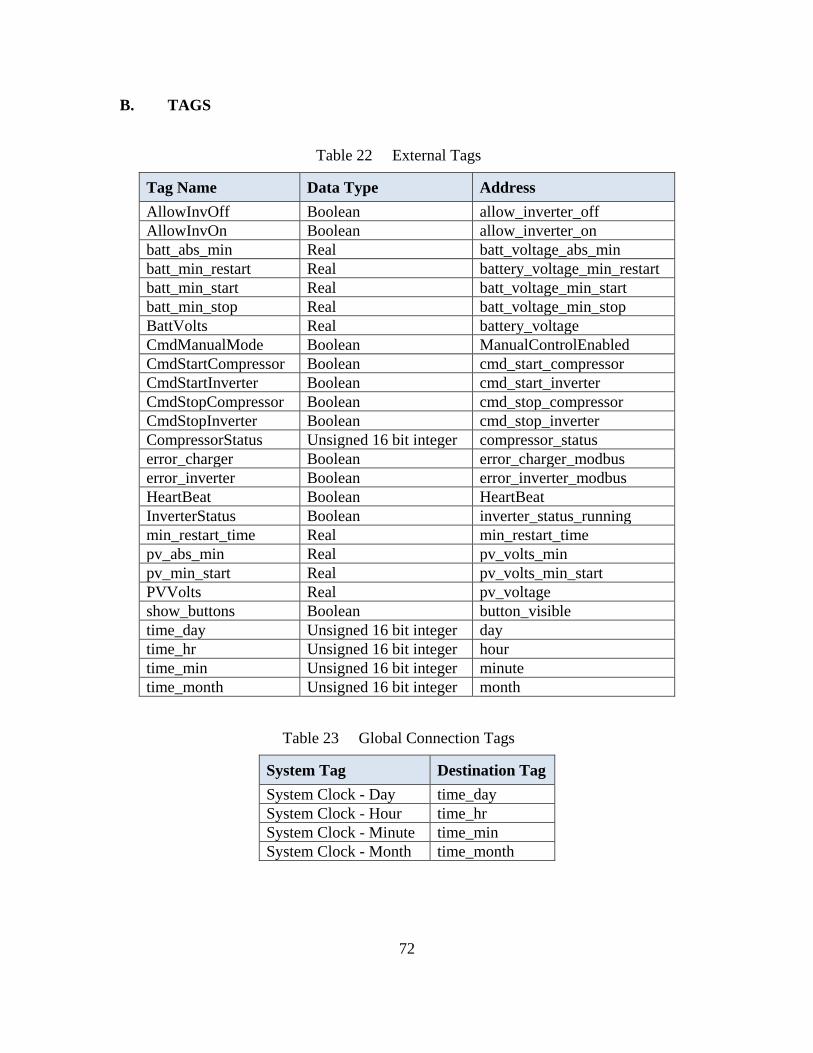
72
B. TAGS
Table 22 External Tags
Tag Name Data Type Address AllowInvOff Boolean allow_inverter_off AllowInvOn Boolean allow_inverter_on batt_abs_min Real batt_voltage_abs_min batt_min_restart Real battery_voltage_min_restart batt_min_start Real batt_voltage_min_start batt_min_stop Real batt_voltage_min_stop BattVolts Real battery_voltage CmdManualMode Boolean ManualControlEnabled CmdStartCompressor Boolean cmd_start_compressor CmdStartInverter Boolean cmd_start_inverter CmdStopCompressor Boolean cmd_stop_compressor CmdStopInverter Boolean cmd_stop_inverter CompressorStatus Unsigned 16 bit integer compressor_status error_charger Boolean error_charger_modbus error_inverter Boolean error_inverter_modbus HeartBeat Boolean HeartBeat InverterStatus Boolean inverter_status_running min_restart_time Real min_restart_time pv_abs_min Real pv_volts_min pv_min_start Real pv_volts_min_start PVVolts Real pv_voltage show_buttons Boolean button_visible time_day Unsigned 16 bit integer day time_hr Unsigned 16 bit integer hour time_min Unsigned 16 bit integer minute time_month Unsigned 16 bit integer month
Table 23 Global Connection Tags
System Tag Destination Tag System Clock - Day time_day System Clock - Hour time_hr System Clock - Minute time_min System Clock - Month time_month

73
C. SCREENS
1. Operation
Figure 38. HMI Operation Screen
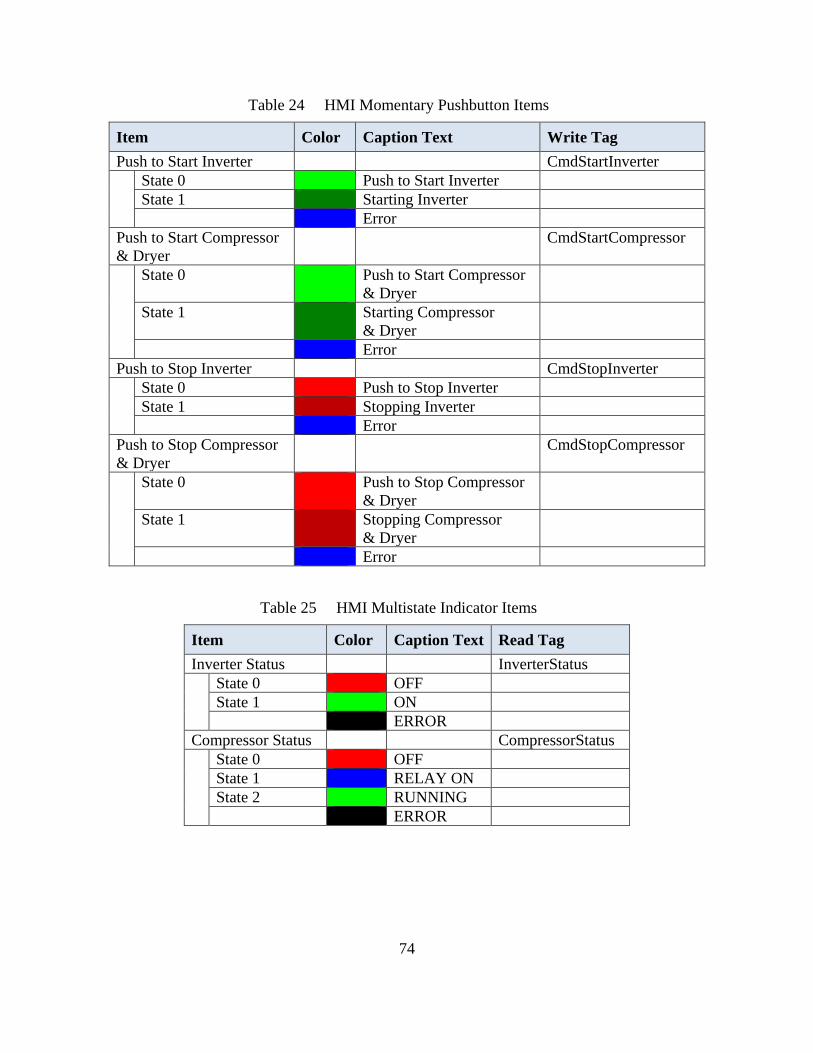
74
Table 24 HMI Momentary Pushbutton Items
Item Color Caption Text Write Tag Push to Start Inverter CmdStartInverter State 0 Push to Start Inverter
State 1 Starting Inverter Error
Push to Start Compressor & Dryer
CmdStartCompressor
State 0 Push to Start Compressor & Dryer
State 1 Starting Compressor & Dryer
Error Push to Stop Inverter CmdStopInverter State 0 Push to Stop Inverter
State 1 Stopping Inverter Error
Push to Stop Compressor & Dryer
CmdStopCompressor
State 0 Push to Stop Compressor & Dryer
State 1 Stopping Compressor & Dryer
Error
Table 25 HMI Multistate Indicator Items
Item Color Caption Text Read Tag Inverter Status InverterStatus State 0 OFF
State 1 ON ERROR
Compressor Status CompressorStatus State 0 OFF
State 1 RELAY ON State 2 RUNNING ERROR
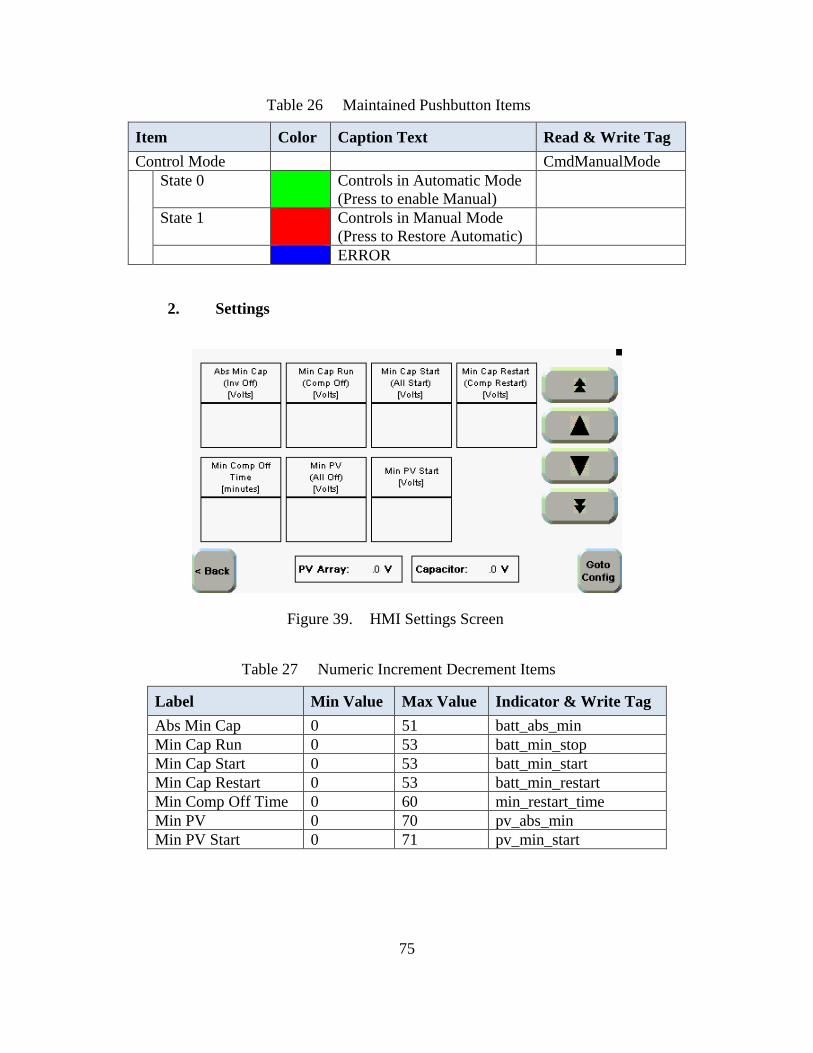
75
Table 26 Maintained Pushbutton Items
Item Color Caption Text Read & Write Tag Control Mode CmdManualMode State 0 Controls in Automatic Mode
(Press to enable Manual)
State 1 Controls in Manual Mode (Press to Restore Automatic)
ERROR
2. Settings
Figure 39. HMI Settings Screen
Table 27 Numeric Increment Decrement Items
Label Min Value Max Value Indicator & Write Tag Abs Min Cap 0 51 batt_abs_min Min Cap Run 0 53 batt_min_stop Min Cap Start 0 53 batt_min_start Min Cap Restart 0 53 batt_min_restart Min Comp Off Time 0 60 min_restart_time Min PV 0 70 pv_abs_min Min PV Start 0 71 pv_min_start

76
Table 28 Numeric Display Items
Label Read Tag PV Array PVVolts Capacitor BattVolts

77
APPENDIX E. MODBUS TESTING
This program is for the Allen-Bradley Micro850 to test Modbus communications. It allows the user to rapidly change the parameters of the Modbus message that is being sent, without having to compile and download the program to the controller repeatedly. Where a setting or variable property is not explicitly stated, it is in the default state.
A. CONTROLLER PROGRAM
This section contains all of the information for the Micro850 controller Modbus
testing program, AssignID.
1. Controller Wide Settings
Table 29 Ethernet Settings
Setting Value Controller Ethernet
Configure IP address and settings Selected IP Address: 192.168.0.1 Subnet Mask 255.255.255.0 Gateway Address 192.168.0.0

78
2. Global Variables
Table 30 Global Variables
Variable Name Data Type Initial Value modbus_register UDINT modbus_error BOOL FALSE modbus_read BOOL FALSE modbus_buffer MODBUSLOCADDR modbus_run USINT 0 modbus_cmd USINT 4 modbus_data_cnt UINT 1 modbus_read_data UINT 0 modbus_buffer_loc DINT modbus_write_data UINT 0 modbus_write USINT 0 modbus_unit_id USINT 0 modbus_ip_ending USINT 168
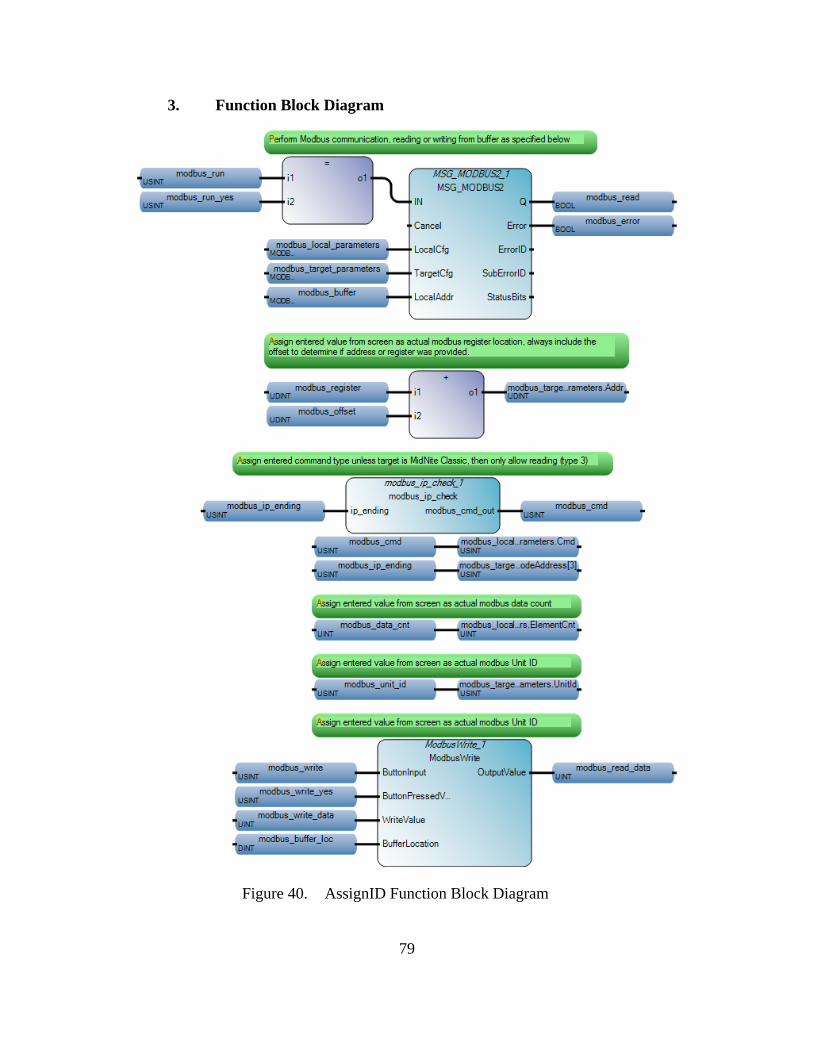
79
3. Function Block Diagram
Figure 40. AssignID Function Block Diagram

80
4. Local Variables
Table 31 AssignID Local Variables
Name Data Type Initial Value modbus_local_parameters MODBUS2LOCPARA Channel UINT 4
TriggerType UDINT 0 Cmd USINT 3 ElementCnt UINT
modbus_target_parameters MODBUS2TARPARA Addr UDINT
NodeAddress MODBUS2NODEADDR NodeAddress[0] USINT 192
NodeAddress[1] USINT 168 NodeAddress[2] USINT 0 NodeAddress[3] USINT 168
Port UINT 0 UnitId USINT MsgTimeout UDINT 0 ConnTimeout UDINT 0 ConnClose BOOL TRUE
modbus_run_yes USINT 1 modbus_write_yes USINT 1 modbus_offset UDINT 1
B. USER-DEFINED FUNCTION BLOCKS
This section describes the user-defined function blocks used in the Modbus testing program AssignID.
1. ModbusWrite:
This Structured Text style User-Defined Function Block will only write the
specified data chunk (WORD) to the defined buffer location, provided all requirements
are met. The buffer value then outputs for display.

81
a. Structured Text
b. Local Variables
Table 32 ModbusWrite Local Variables
Name DataType Direction ButtonInput USINT VarInput ButtonPressedValue USINT VarInput WriteValue UINT VarInput BufferLocation DINT VarInput OutputValue UINT VarOutput
2. modbus_ip_check
This Structured Text style User-Defined Function Block only allows reading
Modbus data if accessing the MidNite Classic charge controller. This is to prevent any
problems due to accidentally overwriting important data on the controller, since the
MidNite Classic will allow you to “write to any register in the system” [54].
a. Structured Text
IF ButtonInput = ButtonPressedValue AND BufferLocation > 0 AND BufferLocation < 126 THEN modbus_buffer[BufferLocation] := WriteValue; END_IF; IF BufferLocation > 0 AND BufferLocation < 126 THEN OutputValue := modbus_buffer[BufferLocation]; ELSE OutputValue := 0; END_IF;
IF modbus_ip_ending = 50 THEN modbus_cmd_out := 3; ELSE modbus_cmd_out := modbus_cmd; END_IF;

82
b. Local Variables
Table 33 modbus_ip_check Local Variables
Name DataType Direction ip_ending USINT VarInput modbus_cmd_out USINT VarOutput
C. HMI PROGRAM
This section contains all of the information for the PanelView 800 HMI Modbus
testing program. The HMI network was previously set up as indicated in Appendix B.
1. HMI Settings
Table 34 Communication Settings
Name Controller Type Address PLC-1 Micro800 192.168.0.1
2. HMI Tags
Table 35 AssignUnitID Tags
Tag Name Data Type Address modbus_address Unsigned 32 bit integer modbus_register modbus_error Boolean modbus_error modbus_cmd Unsigned 8 bit integer modbus_cmd modbus_read_data Unsigned 16 bit integer modbus_read_data modbus_buffer_loc Unsigned 8 bit integer modbus_buffer_loc modbus_write_data Unsigned 16 bit integer modbus_write_data modbus_run Unsigned 8 bit integer modbus_run modbus_write Unsigned 8 bit integer modbus_write modbus_unit_id Unsigned 8 bit integer modbus_unit_id modbus_data_size Unsigned 16 bit integer modbus_data_cnt modbus_ip_ending Unsigned 8 bit integer modbus_ip_ending
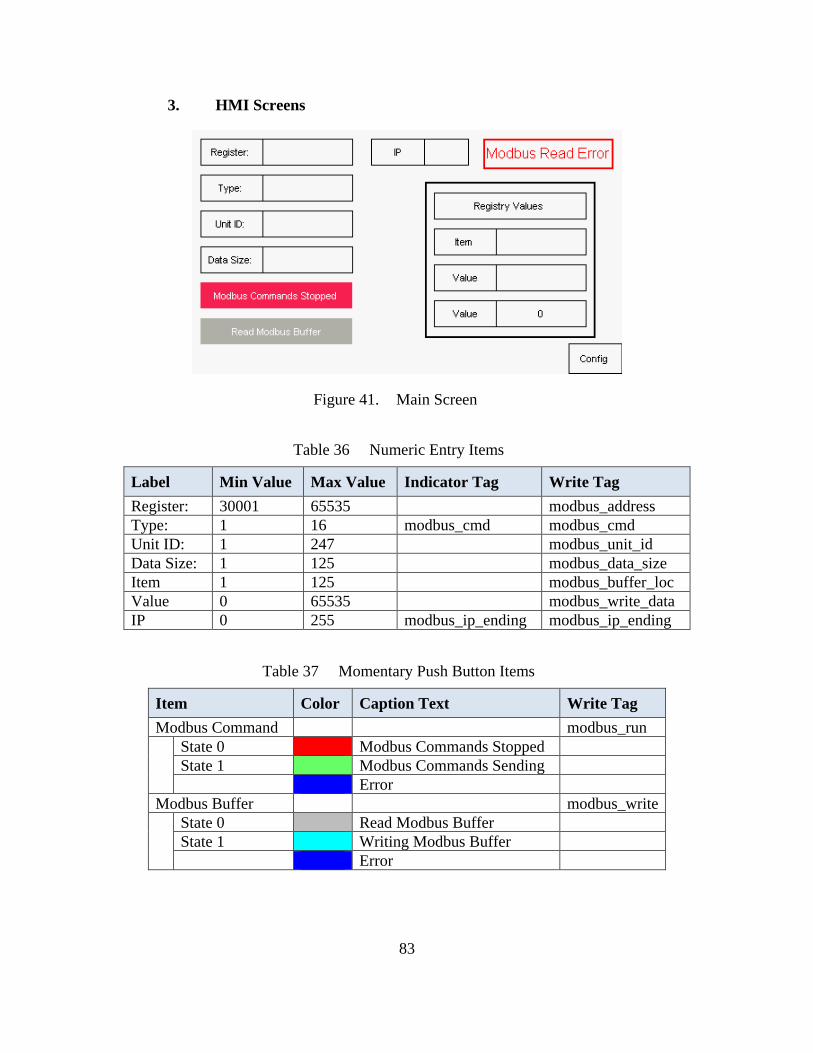
83
3. HMI Screens
Figure 41. Main Screen
Table 36 Numeric Entry Items
Label Min Value Max Value Indicator Tag Write Tag Register: 30001 65535 modbus_address Type: 1 16 modbus_cmd modbus_cmd Unit ID: 1 247 modbus_unit_id Data Size: 1 125 modbus_data_size Item 1 125 modbus_buffer_loc Value 0 65535 modbus_write_data IP 0 255 modbus_ip_ending modbus_ip_ending
Table 37 Momentary Push Button Items
Item Color Caption Text Write Tag Modbus Command modbus_run State 0 Modbus Commands Stopped
State 1 Modbus Commands Sending Error
Modbus Buffer modbus_write State 0 Read Modbus Buffer
State 1 Writing Modbus Buffer Error

84
Table 38 Numeric Display Items
Label Read Tag Value modbus_read_data

85
APPENDIX F. SUNNY WEBBOX UPDATE PROCEDURE
Use the same procedure to update either the firmware or the device profiles for
the Sunny WebBox. This update procedure requires an SD card that is no larger than
2GB formatted with the FAT-16 file system. When performing multiple updates, the card
does not need reformatting between updates. These instructions were adapted from [58].
A. FORMATTING SD CARD AS FAT-16
• Insert the SD card into the computer’s SD card reader.
• Open Windows Explorer and right click on the SD card to be formatted.
WARNING: ALL DATA ON THE SD CARD WILL BE LOST DURING
FORMATTING. IF THE SD CARD CONTAINS IMPORTANT DATA, MAKE A
BACKUP OF THE SD CARD FIRST.
• Click on “Format…”
• Set the File system to “FAT” and the Allocation unit size to “Default allocation size” as shown in Figure 42.
• Click Start.
• Read and acknowledge the warning dialog by pressing “OK.”
• When the formatting process is complete, click “OK” to close the information window.
• Click “Close” to exit the formatting program.

86
Shown with the appropriate selections made for formatting an SD card for use while updating WebBox firmware.
Figure 42. Windows Format Utility
B. FLASHING NEW FIRMWARE
Firmware update files for the WebBox are only available by contacting SMA directly via
their customer support portal.
• Insert the SD card into the computer’s SD card reader.
• Open Windows Explorer and navigate to the root directory of the SD card.
• Create a directory titled “Update” at the root of the SD card.
• Place the desired update file into the “Update” folder.
Note: If the “Update” folder contains more than one file, the update will not occur.

87
• Remove the SD card from the computer’s SD card slot.
• Insert the SD card into the WebBox SD card slot.
• Continue attempting to access the WebBox via the web interface at approximately 30-second intervals. The firmware update process is complete if the page loads.

88
THIS PAGE INTENTIONALLY LEFT BLANK
89
LIST OF REFERENCES
[1] U.S. Energy Information Administration, 2017, “Monthly Energy Review,” DOE/EIA-0035(2017/1), http://www.eia.gov/totalenergy/data/monthly/ archive/00351701.pdf
[2] American Geophysical Union, 2013, “Human-Induced Climate Change Requires Urgent Action,” Washington, DC, https://sciencepolicy.agu.org/files/2013/07/ AGU-Climate-Change-Position-Statement_August-2013.pdf
[3] Pachauri, R. K., et al., 2014, “Climate Change 2014: Synthesis Report," IPCC, Geneva, Switzerland, doi:10.1515/igbp-2015-0001
[4] U.S. Department of Energy, 2017, “Comprehensive Annual Energy Data and Sustainability Performance,” http://ctsedwweb.ee.doe.gov/Annual/Report/ HistoricalFederalEnergyConsumptionDataByAgencyAndEnergyTypeFY1975ToPresent.aspx
[5] Smalley, D., 2012, “News: Energize: ONR Supports New Energy Partnership,” Office of Naval Research, https://www.onr.navy.mil/en/Media-Center/Press-Releases/2012/Energy-Systems-Technology-ESTEP-ONR.aspx
[6] Carlin, R., and Curtis, S., 2015, “ONR Program Evaluates Emerging Energy Technologies at Naval Facilities,” Currents: The Navy's Energy & Environmental Magazine, Fall 2015, pp. 40-47.
[7] Gardner, T, “U.S. military marches forward on green energy, despite Trump,” 2017, http://www.reuters.com/article/us-usa-military-green-energy-insight-idUSKBN1683BL
[8] Beitman, A, 2017, “Report: Clean Energy Jobs Overwhelm Coal, Oil & Gas in 41 States and D.C.,” http://content.sierraclub.org/press-releases/2017/03/attention-donald-trump-new-report-shows-clean-energy-employs-far-more-workers
[9] Cuff, M, 2016, “5 things to know about the $329 billion clean energy boom,” https://www.greenbiz.com/article/5-things-know-about-329-billion-clean-energy-boom
[10] Frankfurt School of Finance & Management gGmbH, 2017, “Global Trends in Renewable Energy Investment 2017,” 2017, http://fs-unep-centre.org/sites/ default/files/publications/globaltrendsinrenewableenergyinvestment2017.pdf.
[11] Lazard LTD., 2016, “Levelized Cost of Energy Analysis 10.0,” https://www.lazard.com/media/438038/levelized-cost-of-energy-v100.pdf
90
[12] Kondoh, J, et al., 2000, “Electrical Energy Storage Systems for Energy Networks,” Energy Conversion and Management, 41(17), pp. 1863-1874.
[13] Werber, C, 2017, “California is getting so much power from solar that electricity prices are turning negative,” https://qz.com/953614/california-produced-so-much-power-from-solar-energy-this-spring-that-wholesale-electricity-prices-turned-negative/
[14] Vaughan, A., 2017, “UK households spent £180m on 'unnecessary' power capacity – report,” https://www.theguardian.com/business/2017/mar/13/uk-households-unnecessary-power-capacity-energy-climate-intelligence-unit-report
[15] Foley, A. M., et al., 2012, “Current methods and advances in forecasting of wind power generation,” Renewable Energy, 37(1), pp. 1-8.
[16] U.S. Department of Energy, 2013, “Grid Energy Storage,” Washington, DC, https://energy.gov/sites/prod/files/2014/09/f18/Grid%20Energy%20Storage%20December%202013.pdf
[17] Lazard LTD., 2016, “Levelized Cost of Storage Analysis 2.0,” www.lazard.com/ media/438042/lazard-levelized-cost-of-storage-v20.pdf.
[18] Vranas, T, 2017, “Control System Development for Power Generation From Small-Scale Compressed Air Energy Storage,” M.S. thesis, Dept. of Mech. Eng., Naval Postgraduate School, Monterey, CA.
[19] Denholm, P., et al., 2010, “Role of Energy Storage with Renewable Electricity Generation,” NREL/TP-6A2-47187, http://www.osti.gov/scitech/biblio/972169
[20] Luo, X., et al., 2015, “Overview of current development in electrical energy storage technologies and the application potential in power system operation,” Applied Energy, 137, pp. 511-536
[21] Sullivan, P., Short, W., and Blair, N., 2008, “Modeling the Benefits of Storage Technologies to Wind Power,” Wind Engineering, 32(6), pp. 603-615.
[22] van der Linden, S., 2007, “Integrating Wind Turbine Generators (WTG’s) With GT-CAES (Compressed Air Energy Storage) Stabilizes Power Delivery With the Inherent Benefits of Bulk Energy Storage,” IMECE2007-41853, ASME 2007 International Mechanical Engineering Congress and Exposition, 6, pp. 379-386.
[23] Dunn, B., Kamath, H., and Tarascon, J.-M., 2011, “Electrical Energy Storage for the Grid: A Battery of Choices,” Science, 334(6058), pp. 928-935.
[24] Arnulfi, G. L., and Marini, M., 2006, “Management Strategies for a Compressed Air Energy Storage Plant,” GT2006-90437, ASME Turbo Expo 2006: Power for Land, Sea and Air, 4, pp. 133-142.
91
[25] Ter-Gazarian, A. G., 2011, Energy Storage for Power Systems (2nd Edition), The Institution of Engineering and Technology, London, United Kingdom, Chap. 7.
[26] Junkermann, W., Vogel, B., and Sutton, M. A., 2011, “The climate penalty for clean fossil fuel combustion,” Atmospheric Chemistry and Physics, 11(24), pp. 12917-12924.
[27] Kurz, R., 2005, "Gas Turbine Performance," Proceedings of the Thirty-Fourth Turbomachinery Symposium, Texas A&M University System, Houston, Texas, pp. 131-146.
[28] van der Linden, S., 2006, “Bulk energy storage potential in the USA, current developments and future prospects,” Energy, 31(15), pp. 3446-3457.
[29] Funk, J., 2013, “FirstEnergy postpones project to generate elecricity with compressed air,” http://www.cleveland.com/business/index.ssf/2013/07/ firstenergy_postpones_project.html
[30] Haugen, D., 2012, “Scrapped Iowa project leaves energy storage lessons,” http://midwestenergynews.com/2012/01/19/scrapped-iowa-project-leaves-energy-storage-lessons/
[31] Bullough, C., et al., 2004, “Advanced Adiabatic Compressed Air Energy Storage for the Integration of Wind Energy,” APL000053, Proceedings of the European Wind Energy Conference, pp. 1-8.
[32] Moran, M. J., and Shapiro, H. N., 2008, Fundamentals of Engineering Thermodynamics, John Wiley & Sons Inc., Hoboken, NJ, Chap. 6.
[33] Jakiel, C., Zunft, S., and Nowi, A., 2007, “Adiabatic compressed air energy storage plants for efficient peak load power supply from wind energy: the European project AA-CAES,” International Journal of Energy Technology and Policy, 5(3), pp. 296-306.
[34] Energiespeicher Forschungsinitiative der Bundesregierung, 2016, “Druckluft- statt Pumpspeicher,” http://forschung-energiespeicher.info/projektschau/ gesamtliste/projekt-einzelansicht/95/Druckluft_statt_Pumpspeicher/
[35] RWE Power AG, 2010, “ADELE - Adiabatic Compressed-Air Energy Storage for Electricity Supply,” Spohr’s Büro für Kommunikation GmbH, Cologne, Germany.
[36] Barbour, E., et al., 2015, “Adiabatic Compressed Air Energy Storage with packed bed thermal energy storage,” Applied Energy, 155, pp. 804-815.

92
[37] Petrov, M. P., Arghandeh, R., and Broadwater, R., 2013, “Concept and Application of Distributed Compressed Air Energy Storage Systems Integrated in Utility Networks,” POWER2013-98113, Proceedings of the ASME Power Conference, 2, pp. 1-8.
[38] Jannelli, E., et al., 2014, “A small-scale CAES (compressed air energy storage) system for stand-alone renewable energy power plant for a radio base station: A sizing-design methodology,” Energy, 78, pp. 313-322.
[39] Patel, S. M., Freeman, P. T., and Wagner, J. R., 2014, “An Electrical Microgrid: Integration of Solar Panels, Compressed Air Storage, and a Micro-Cap Gas Turbine," DSCC2014-6058, Proceedings of the ASME 2014 Dynamic Systems and Control Conference, 2, pp. 1-10.
[40] Hawxhurst, K. L. J., 2016, “Microgrid Control Strategy Utlizing Thermal Energy Storage With Renewable Solar and Wind Power Generation,” M.S. thesis, Dept. of Mech. Eng., Naval Postgraduate School, Monterey, CA.
[41] McLaughlin, C. S., 2016, “Small-Scale Air-Driven Generator,” M.S. thesis, Dept. of Mech. Eng., Naval Postgraduate School, Monterey, CA.
[42] Prinsen, T. H., 2016, “Design and Analysis of a Solar-Powered Compressed Air Energy Storage System,” M.S. thesis, Dept. of Mech. Eng., Naval Postgraduate School, Monterey, CA.
[43] Solarworld AG, 2017, “Sunmodule Plus,” http://www.solarworld.de/fileadmin/ downloads_new/produkt/sunmodule/datenblaetter/en/mono/sw_sunmodule_plus_280-290_monoblack_5bb_en.pdf
[44] Salas, V., et al., 2006, “Review of the maximum power point tracking algorithms for stand-alone photovoltaic systems,” Solar Energy Materials and Solar Cells, 90(11), pp. 1555-1578.
[45] Home Power Inc., 2017, “Maximum Power Point Tracking (MPPT),” https://www.homepower.com/maximum-power-point-tracking-mppt
[46] Nave, C. R., 2017, “Energy Stored on a Capacitor,” http://hyperphysics.phy-astr.gsu.edu/hbase/electric/capeng2.html
[47] Maxwell Technologies Inc., 2013, “Datasheet | 56V Module,” http://www.maxwell.com/images/documents/56vmodule_ds_1017119-3.pdf
[48] Daggett, R., 2013, “PC-Based Controls vs. PLC-Based Controls for Machine Automation,” https://www.bastiansolutions.com/blog/index.php/2013/04/24/pc-based-controls-vs-plc-based-controls-for-machine-automation/

93
[49] Mahaffey, T.R., 2002, “Electromechanical Relays Versus Solid-State: Each Has Its Place,” http://electronicdesign.com/components/electromechanical-relays-versus-solid-state-each-has-its-place
[50] SMA America LLC, 2012, “Off-grid Inverter Sunny Island 4548-US/6048-US Technical Description,” http://www.midnitesolar.com/pdfs/SI45_60-eng-TB-TUS120812.pdf
[51] Brooks, P., 2001, “EtherNet/IP: Industrial Protocol White Paper,” Institute of Electrical and Electronic Engineers, http://literature.rockwellautomation.com/idc/ groups/literature/documents/wp/enet-wp001_-en-p.pdf
[52] Siemens Corporation, 2007, “History of the Modbus protocol,” http://w3.usa.siemens.com/us/internet-dms/btlv/CircuitProtection/Molded CaseBreakers/docs_MoldedCaseBreakers/Modbus%20Information.doc
[53] SMA America L.L.C., 2014, “SUNNY WEBBOX Modbus® Interface,” http://files.sma.de/dl/2585/WEBBOX-MODBUS-TB-en-19.pdf
[54] MidNite Solar Inc., 2013, “MidNite Solar MODBUS Network Spec,” http://www.midnitesolar.com/pdfs/classic_register_map_Rev-C5-December-8-2013.pdf
[55] Saidur, R., et al., 2012, “Applications of variable speed drive (VSD) in electrical motors energy savings,” Renewable and Sustainable Energy Reviews, 16(1), pp. 543-550.
[56] Rockwell Automation Inc., 2015, “Connected Components Workbench 9.0 Help.”
[57] The United States Naval Observatory, 2016, “Sun or Moon Rise/Set Table for One Year,” http://aa.usno.navy.mil/data/docs/RS_OneYear.php
[58] SMA America L.L.C., 2013, “SUNNY WEBBOX,” http://files.sma.de/dl/4253/SWebBox-BA-US-en-34.pdf

94
THIS PAGE INTENTIONALLY LEFT BLANK

95
INITIAL DISTRIBUTION LIST
1. Defense Technical Information Center Ft. Belvoir, Virginia 2. Dudley Knox Library Naval Postgraduate School Monterey, California


