1
Steven Simmons
Gillian Charles
Northwest Power and Conservation Council
GRAC
October 16, 2013
Natural Gas Combined Cycle
Combustion Turbines
Natural Gas Combined Cycle
Combustion Turbines Dispatchable baseload power Can provide flexibility – ability to ramp up
and down, supplemental peaking capacity, complements renewable development
Highly efficient and lowest per-MW CO2 production of fossil fuel resources
Plentiful natural gas supplies and low prices Relatively easy to site and permit Recent CCCT addition in Idaho (Langley
Gulch) and announced in Oregon (Carty)
2
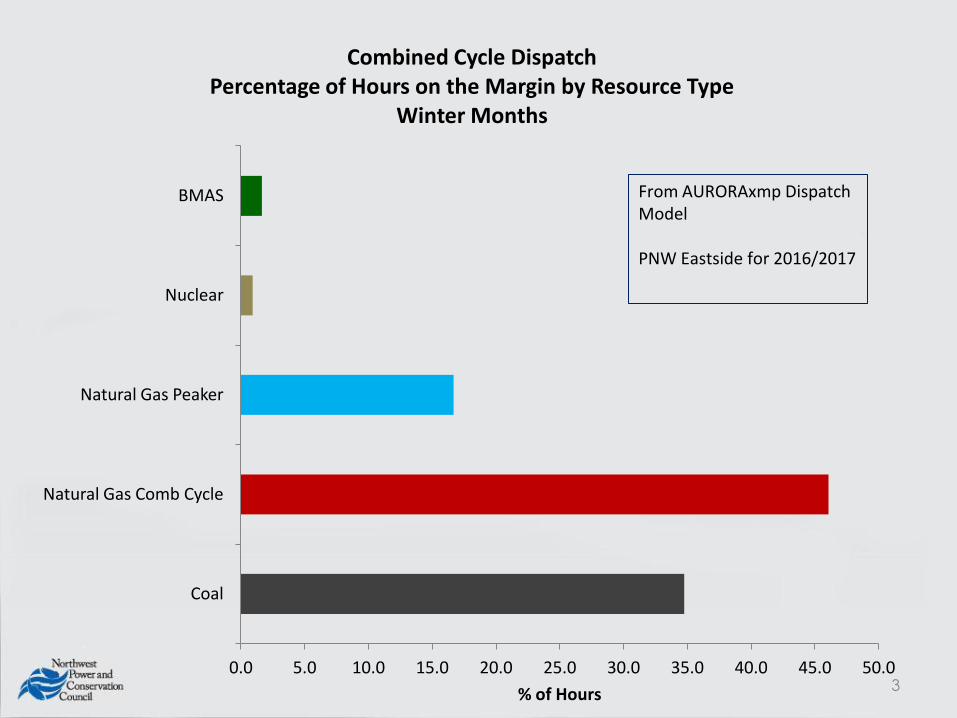
0.0 5.0 10.0 15.0 20.0 25.0 30.0 35.0 40.0 45.0 50.0
Coal
Natural Gas Comb Cycle
Natural Gas Peaker
Nuclear
BMAS
% of Hours
Combined Cycle Dispatch Percentage of Hours on the Margin by Resource Type
Winter Months
From AURORAxmp Dispatch Model PNW Eastside for 2016/2017
3
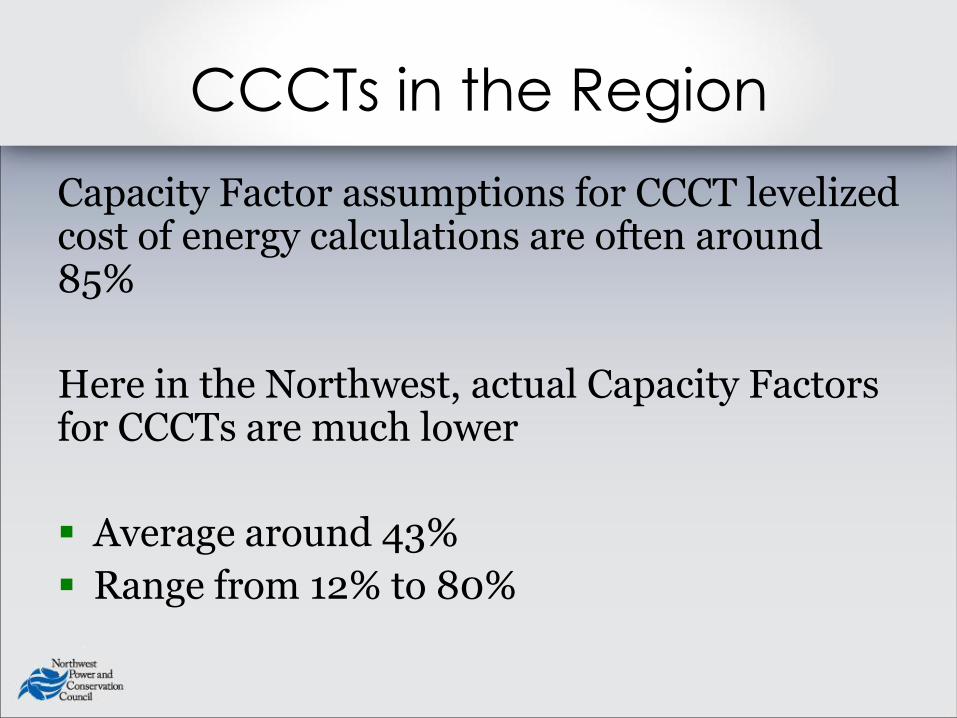
CCCTs in the Region
Capacity Factor assumptions for CCCT levelized cost of energy calculations are often around 85%
Here in the Northwest, actual Capacity Factors for CCCTs are much lower
Average around 43%
Range from 12% to 80%
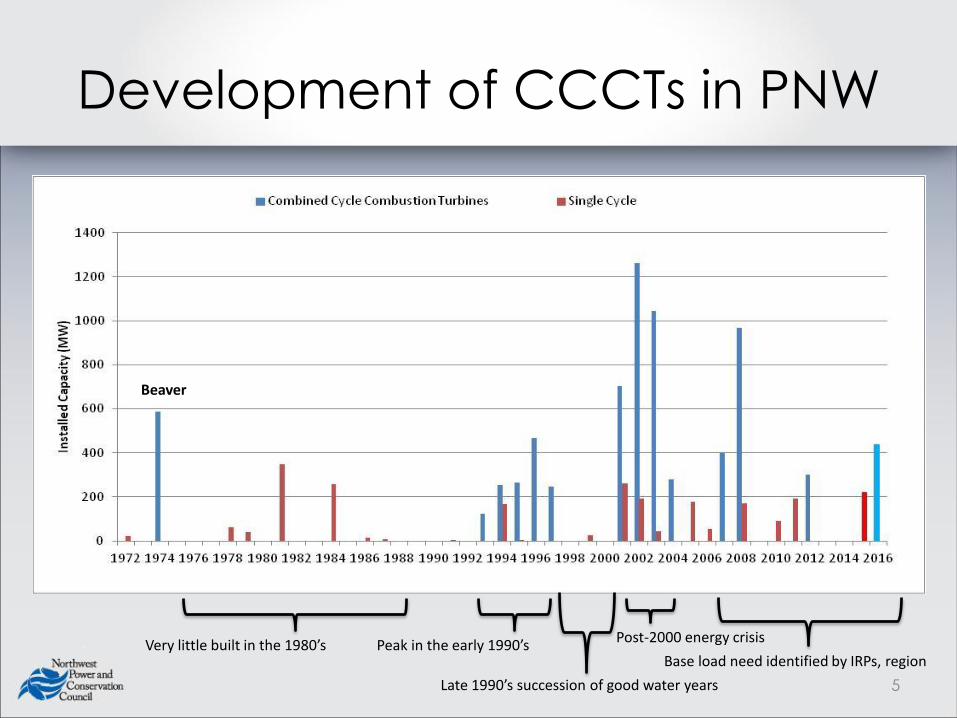
Development of CCCTs in PNW
5
Very little built in the 1980’s Peak in the early 1990’s Post-2000 energy crisis
Base load need identified by IRPs, region
Beaver
Late 1990’s succession of good water years
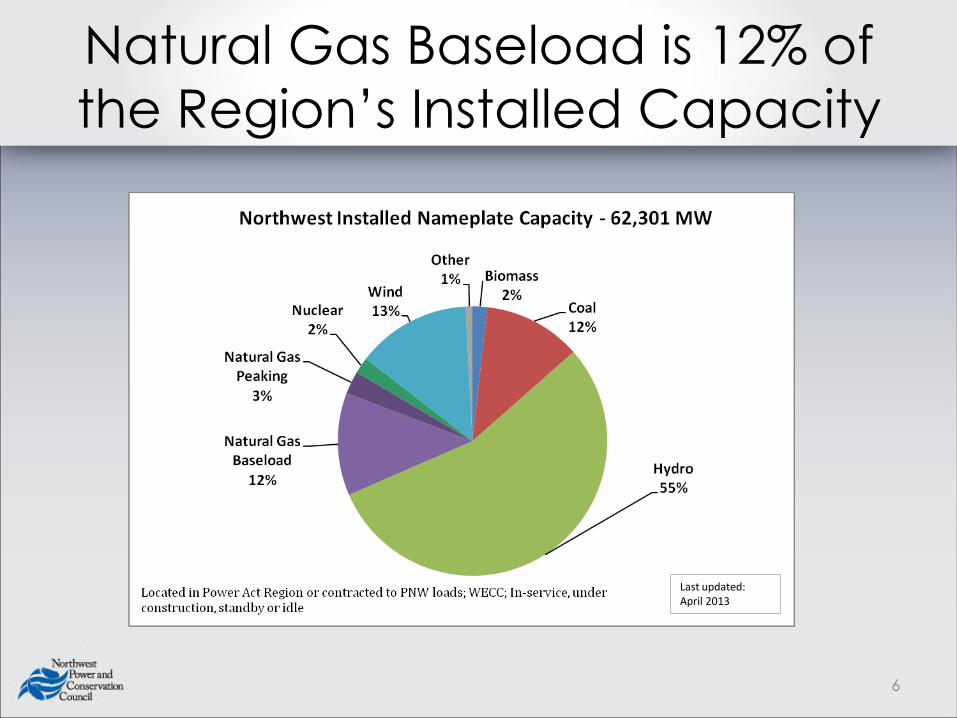
Natural Gas Baseload is 12% of
the Region’s Installed Capacity
Last updated: April 2013
6
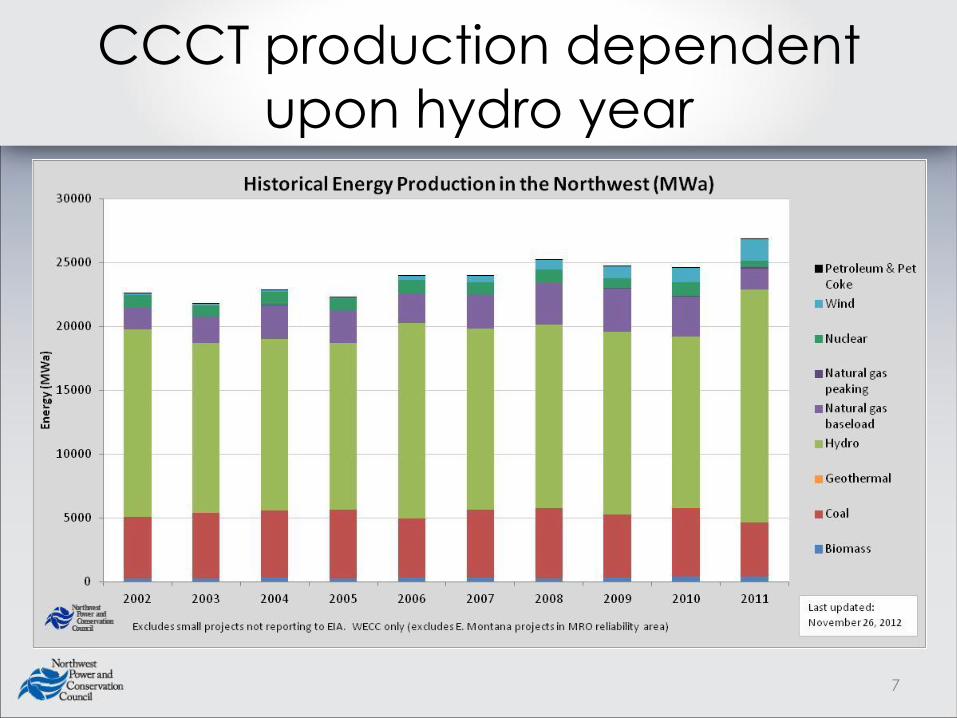
CCCT production dependent
upon hydro year
7
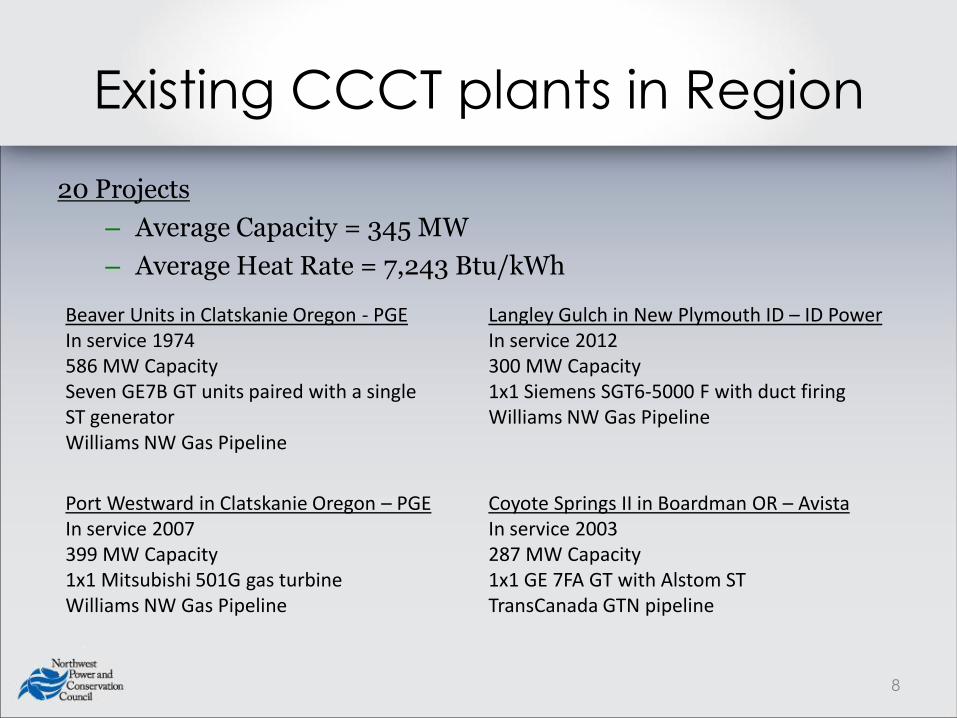
Existing CCCT plants in Region
20 Projects
– Average Capacity = 345 MW
– Average Heat Rate = 7,243 Btu/kWh
Beaver Units in Clatskanie Oregon - PGE In service 1974 586 MW Capacity Seven GE7B GT units paired with a single ST generator Williams NW Gas Pipeline
Langley Gulch in New Plymouth ID – ID Power In service 2012 300 MW Capacity 1x1 Siemens SGT6-5000 F with duct firing Williams NW Gas Pipeline
Port Westward in Clatskanie Oregon – PGE In service 2007 399 MW Capacity 1x1 Mitsubishi 501G gas turbine Williams NW Gas Pipeline
Coyote Springs II in Boardman OR – Avista In service 2003 287 MW Capacity 1x1 GE 7FA GT with Alstom ST TransCanada GTN pipeline
8
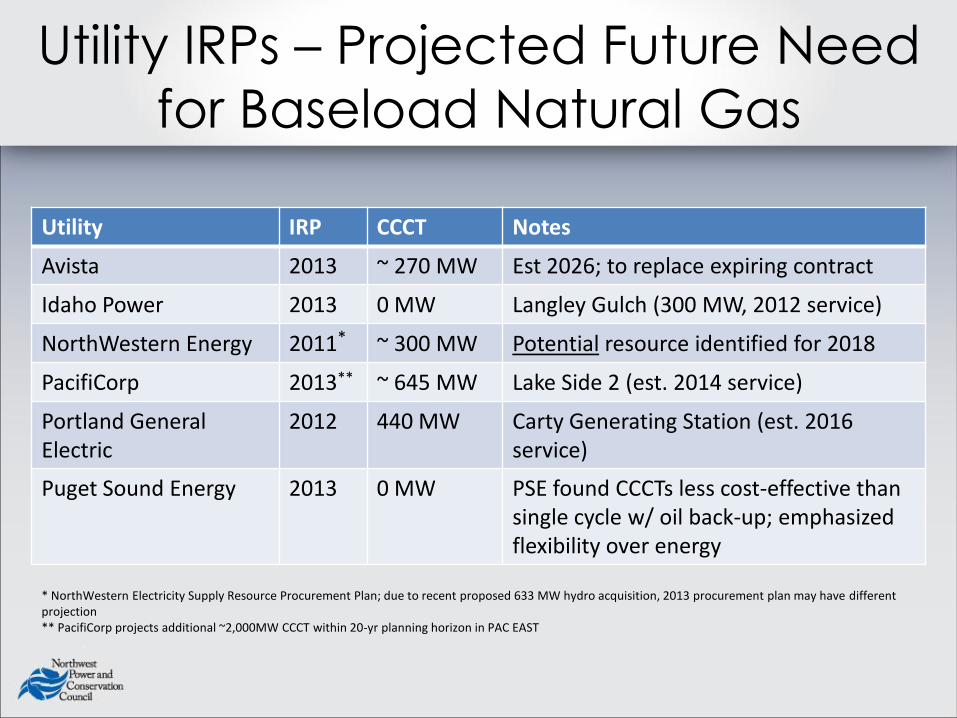
Utility IRPs – Projected Future Need
for Baseload Natural Gas
Utility IRP CCCT Notes
Avista 2013 ~ 270 MW Est 2026; to replace expiring contract
Idaho Power 2013 0 MW Langley Gulch (300 MW, 2012 service)
NorthWestern Energy 2011* ~ 300 MW Potential resource identified for 2018
PacifiCorp 2013** ~ 645 MW Lake Side 2 (est. 2014 service)
Portland General Electric
2012 440 MW Carty Generating Station (est. 2016 service)
Puget Sound Energy 2013 0 MW PSE found CCCTs less cost-effective than single cycle w/ oil back-up; emphasized flexibility over energy
* NorthWestern Electricity Supply Resource Procurement Plan; due to recent proposed 633 MW hydro acquisition, 2013 procurement plan may have different projection ** PacifiCorp projects additional ~2,000MW CCCT within 20-yr planning horizon in PAC EAST
State of the Art Summary
Combined Cycle Combustion
Turbine
10
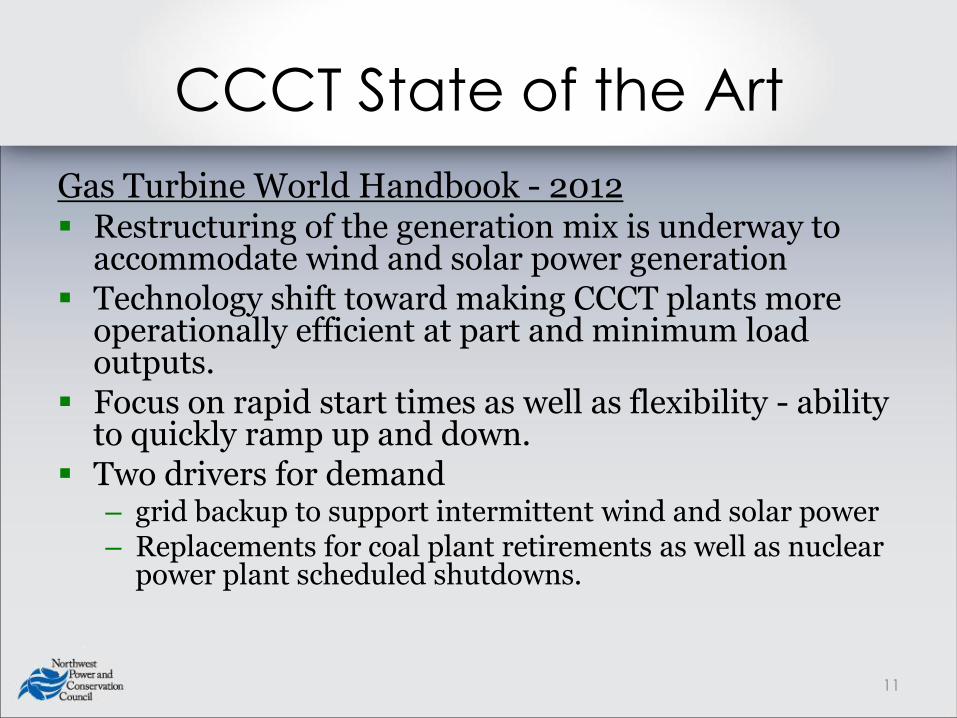
CCCT State of the Art
Gas Turbine World Handbook - 2012 Restructuring of the generation mix is underway to
accommodate wind and solar power generation Technology shift toward making CCCT plants more
operationally efficient at part and minimum load outputs.
Focus on rapid start times as well as flexibility - ability to quickly ramp up and down.
Two drivers for demand – grid backup to support intermittent wind and solar power – Replacements for coal plant retirements as well as nuclear
power plant scheduled shutdowns.
11
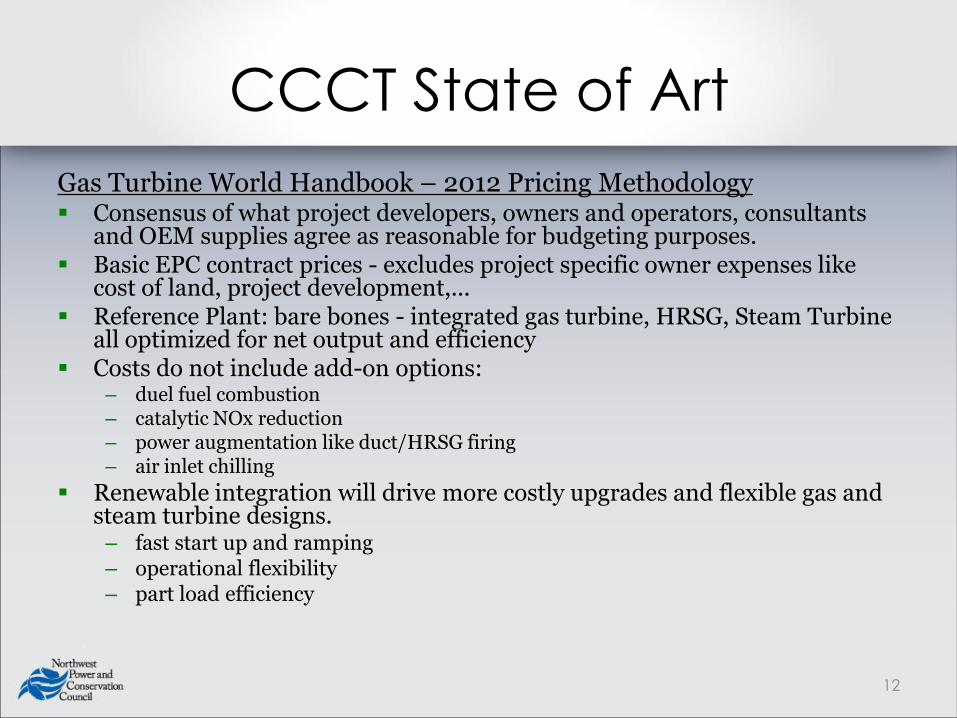
CCCT State of Art
Gas Turbine World Handbook – 2012 Pricing Methodology Consensus of what project developers, owners and operators, consultants
and OEM supplies agree as reasonable for budgeting purposes. Basic EPC contract prices - excludes project specific owner expenses like
cost of land, project development,... Reference Plant: bare bones - integrated gas turbine, HRSG, Steam Turbine
all optimized for net output and efficiency Costs do not include add-on options:
– duel fuel combustion – catalytic NOx reduction – power augmentation like duct/HRSG firing – air inlet chilling
Renewable integration will drive more costly upgrades and flexible gas and steam turbine designs. – fast start up and ramping – operational flexibility – part load efficiency
12
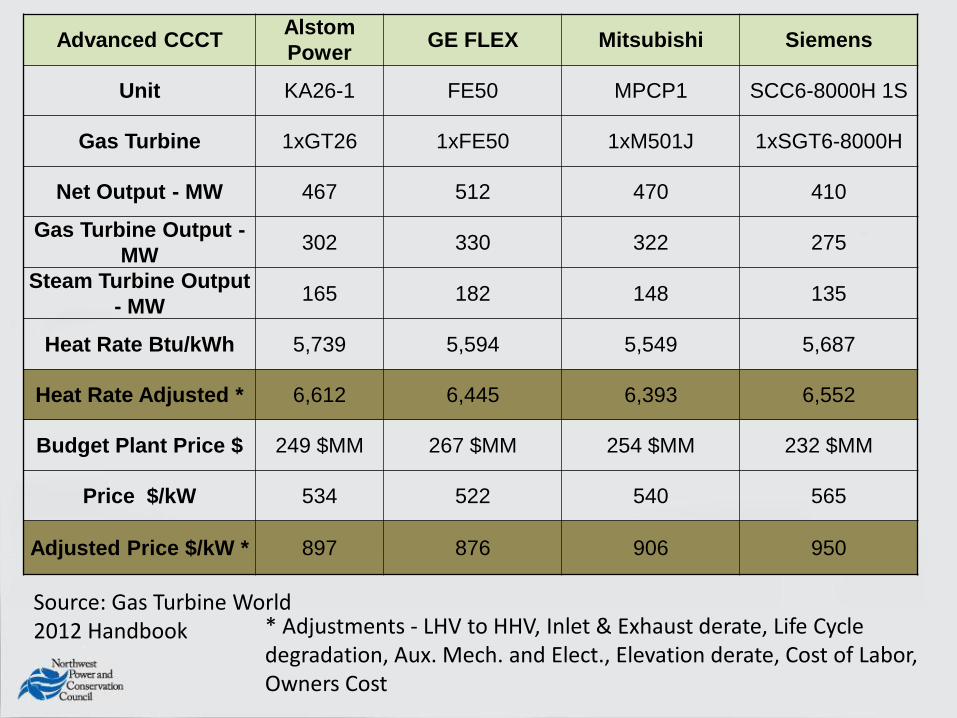
Advanced CCCT Alstom
Power GE FLEX Mitsubishi Siemens
Unit KA26-1 FE50 MPCP1 SCC6-8000H 1S
Gas Turbine 1xGT26 1xFE50 1xM501J 1xSGT6-8000H
Net Output - MW 467 512 470 410
Gas Turbine Output -
MW 302 330 322 275
Steam Turbine Output
- MW 165 182 148 135
Heat Rate Btu/kWh 5,739 5,594 5,549 5,687
Heat Rate Adjusted * 6,612 6,445 6,393 6,552
Budget Plant Price $ 249 $MM 267 $MM 254 $MM 232 $MM
Price $/kW 534 522 540 565
Adjusted Price $/kW * 897 876 906 950
* Adjustments - LHV to HHV, Inlet & Exhaust derate, Life Cycle degradation, Aux. Mech. and Elect., Elevation derate, Cost of Labor, Owners Cost
Source: Gas Turbine World 2012 Handbook
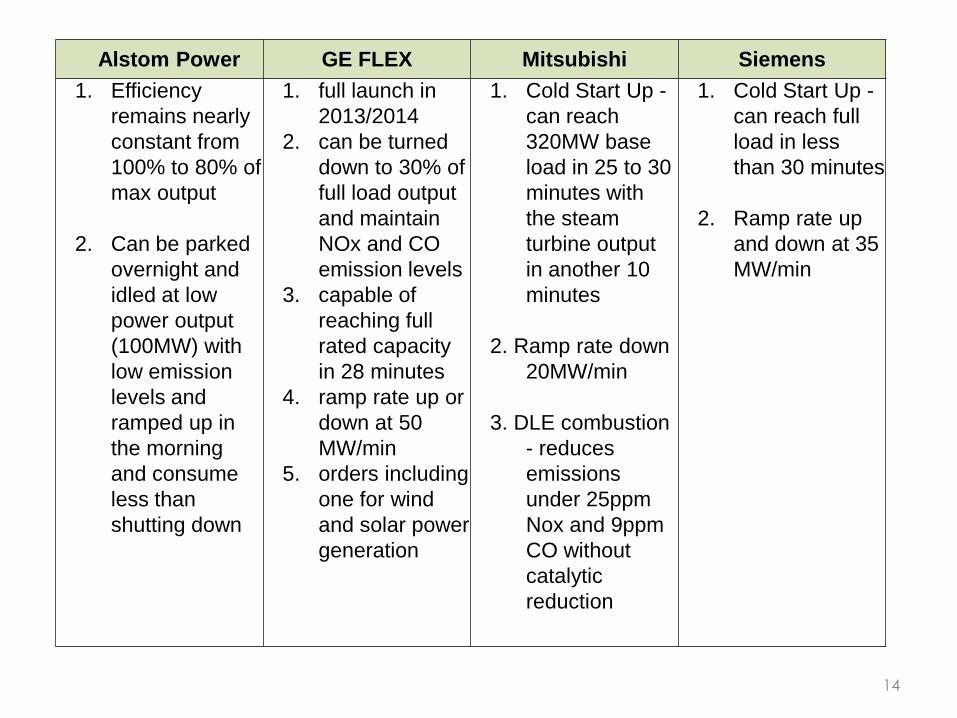
Alstom Power GE FLEX Mitsubishi Siemens
1. Efficiency
remains nearly
constant from
100% to 80% of
max output
2. Can be parked
overnight and
idled at low
power output
(100MW) with
low emission
levels and
ramped up in
the morning
and consume
less than
shutting down
1. full launch in
2013/2014
2. can be turned
down to 30% of
full load output
and maintain
NOx and CO
emission levels
3. capable of
reaching full
rated capacity
in 28 minutes
4. ramp rate up or
down at 50
MW/min
5. orders including
one for wind
and solar power
generation
1. Cold Start Up -
can reach
320MW base
load in 25 to 30
minutes with
the steam
turbine output
in another 10
minutes
2. Ramp rate down
20MW/min
3. DLE combustion
- reduces
emissions
under 25ppm
Nox and 9ppm
CO without
catalytic
reduction
1. Cold Start Up -
can reach full
load in less
than 30 minutes
2. Ramp rate up
and down at 35
MW/min
14
500
510
520
530
540
550
560
570
580
590
600
300 350 400 450 500 550 600
$/k
W
MW
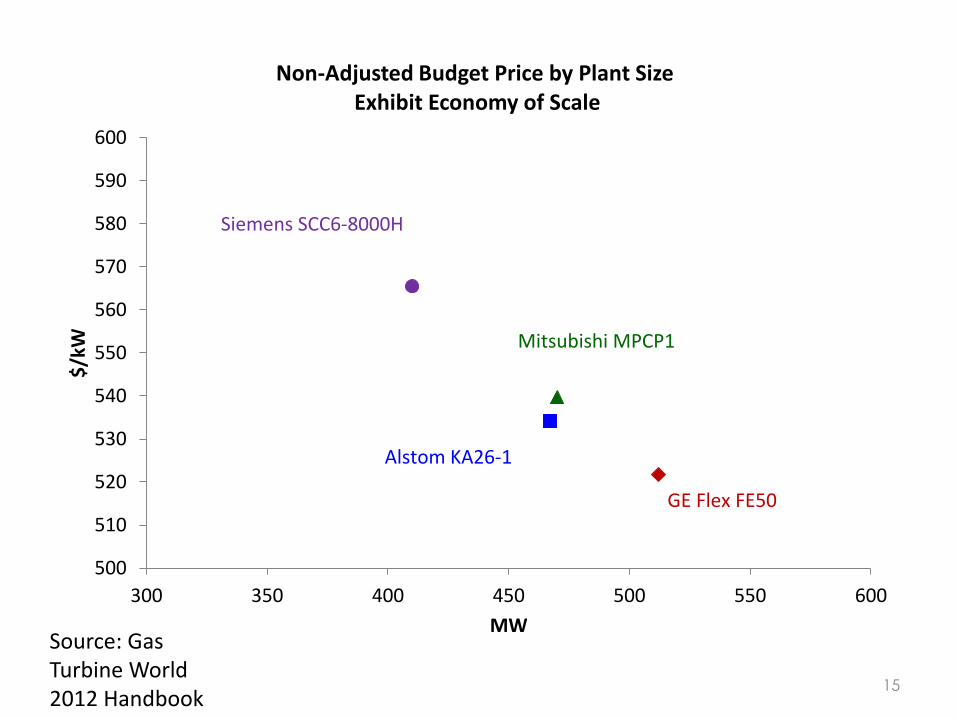
Non-Adjusted Budget Price by Plant Size Exhibit Economy of Scale
Siemens SCC6-8000H
Mitsubishi MPCP1
Alstom KA26-1
GE Flex FE50
15
Source: Gas Turbine World 2012 Handbook
16
0
200
400
600
800
1000
1200
1400
2008 2009 2010 2011 2012 2013 2014 2015
$/k
W
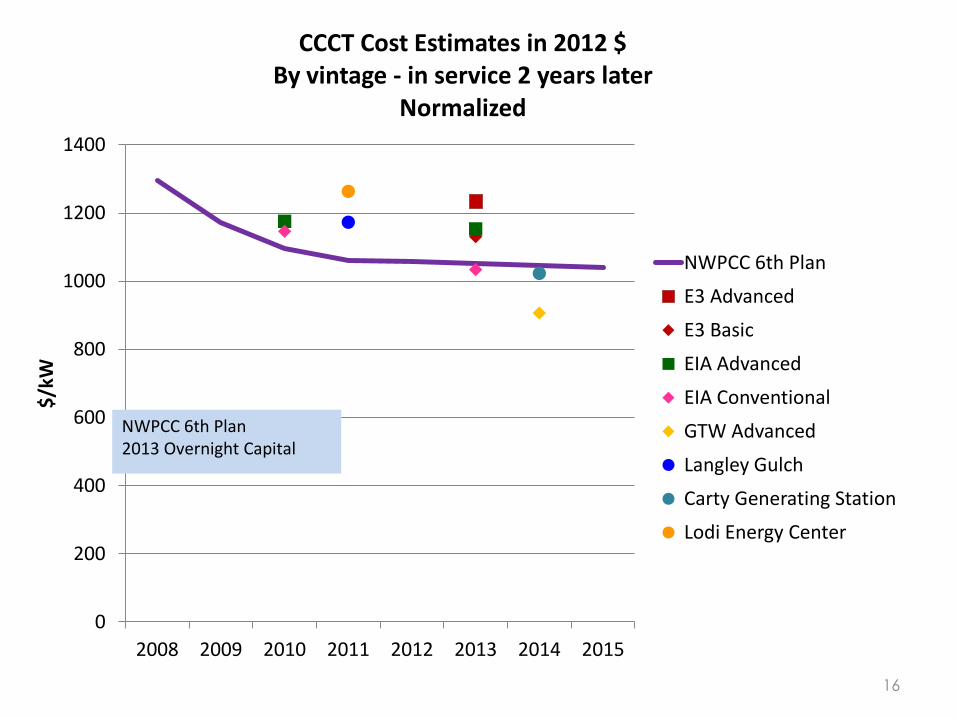
CCCT Cost Estimates in 2012 $ By vintage - in service 2 years later
Normalized
NWPCC 6th Plan
E3 Advanced
E3 Basic
EIA Advanced
EIA Conventional
GTW Advanced
Langley Gulch
Carty Generating Station
Lodi Energy Center
NWPCC 6th Plan 2013 Overnight Capital
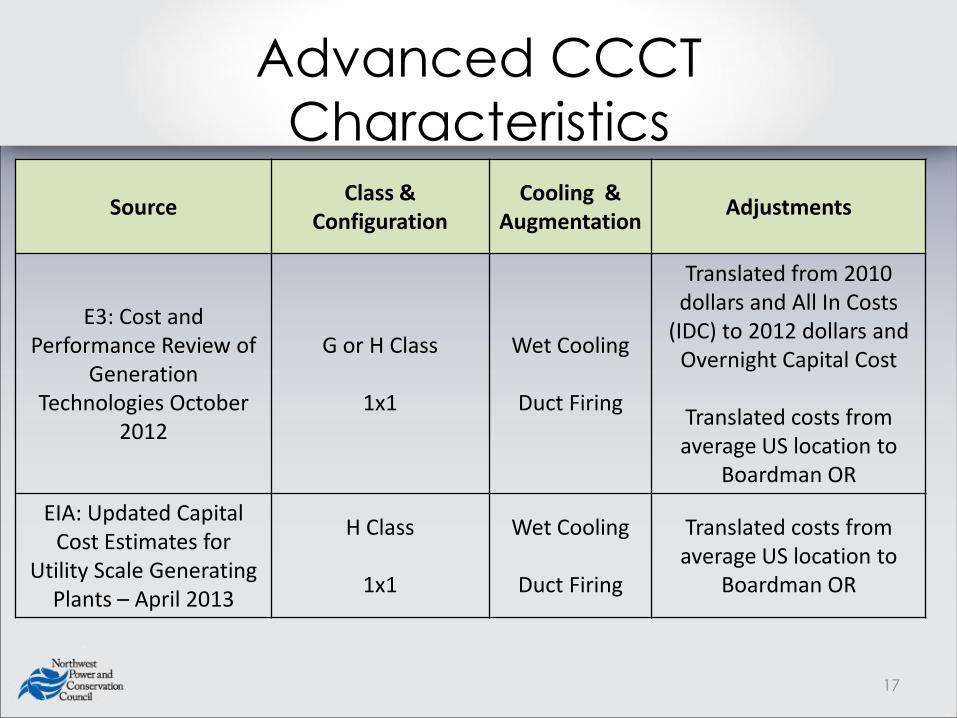
Advanced CCCT
Characteristics
Source Class &
Configuration Cooling &
Augmentation Adjustments
E3: Cost and Performance Review of
Generation Technologies October
2012
G or H Class
1x1
Wet Cooling
Duct Firing
Translated from 2010 dollars and All In Costs
(IDC) to 2012 dollars and Overnight Capital Cost
Translated costs from average US location to
Boardman OR
EIA: Updated Capital Cost Estimates for
Utility Scale Generating Plants – April 2013
H Class
1x1
Wet Cooling
Duct Firing
Translated costs from average US location to
Boardman OR
17
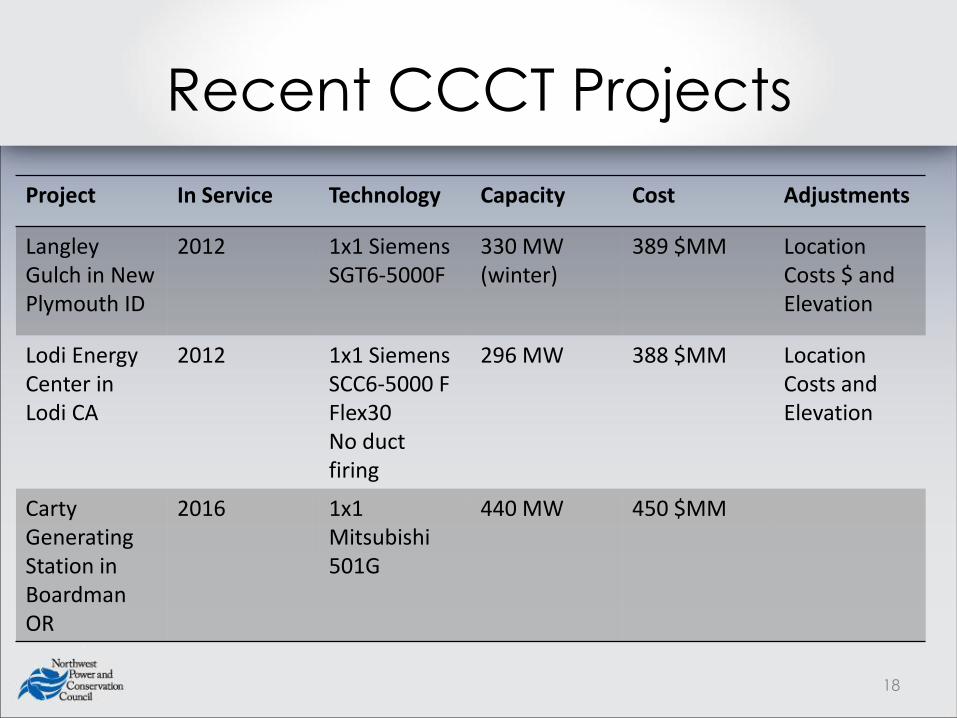
Recent CCCT Projects
Project In Service Technology Capacity Cost Adjustments
Langley Gulch in New Plymouth ID
2012 1x1 Siemens SGT6-5000F
330 MW (winter)
389 $MM Location Costs $ and Elevation
Lodi Energy Center in Lodi CA
2012 1x1 Siemens SCC6-5000 F Flex30 No duct firing
296 MW 388 $MM Location Costs and Elevation
Carty Generating Station in Boardman OR
2016 1x1 Mitsubishi 501G
440 MW 450 $MM
18
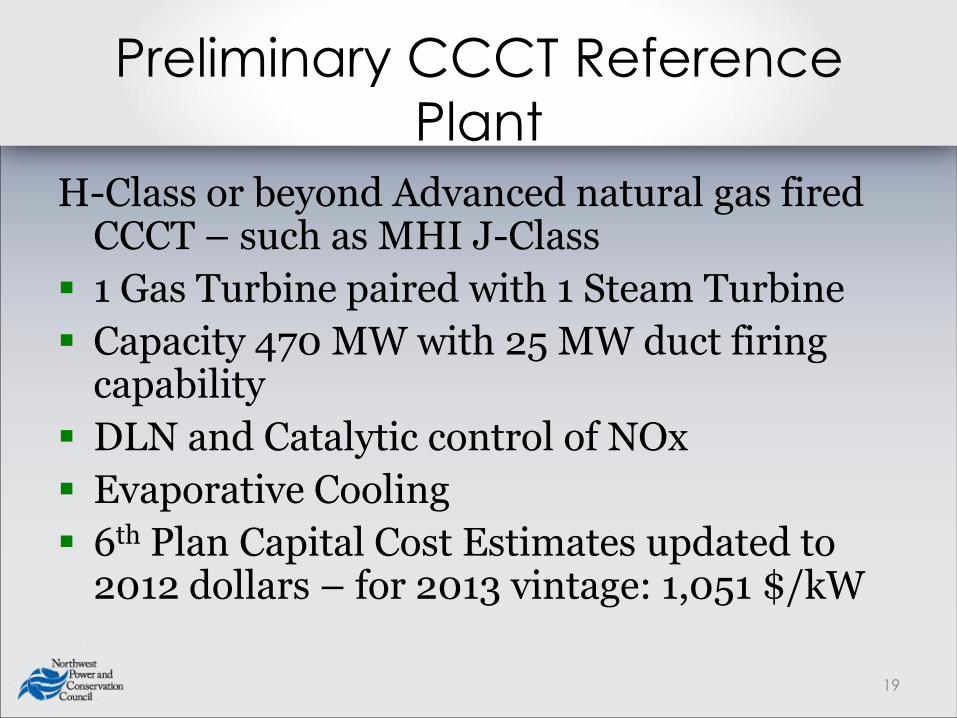
Preliminary CCCT Reference
Plant
H-Class or beyond Advanced natural gas fired CCCT – such as MHI J-Class
1 Gas Turbine paired with 1 Steam Turbine
Capacity 470 MW with 25 MW duct firing capability
DLN and Catalytic control of NOx
Evaporative Cooling
6th Plan Capital Cost Estimates updated to 2012 dollars – for 2013 vintage: 1,051 $/kW
19
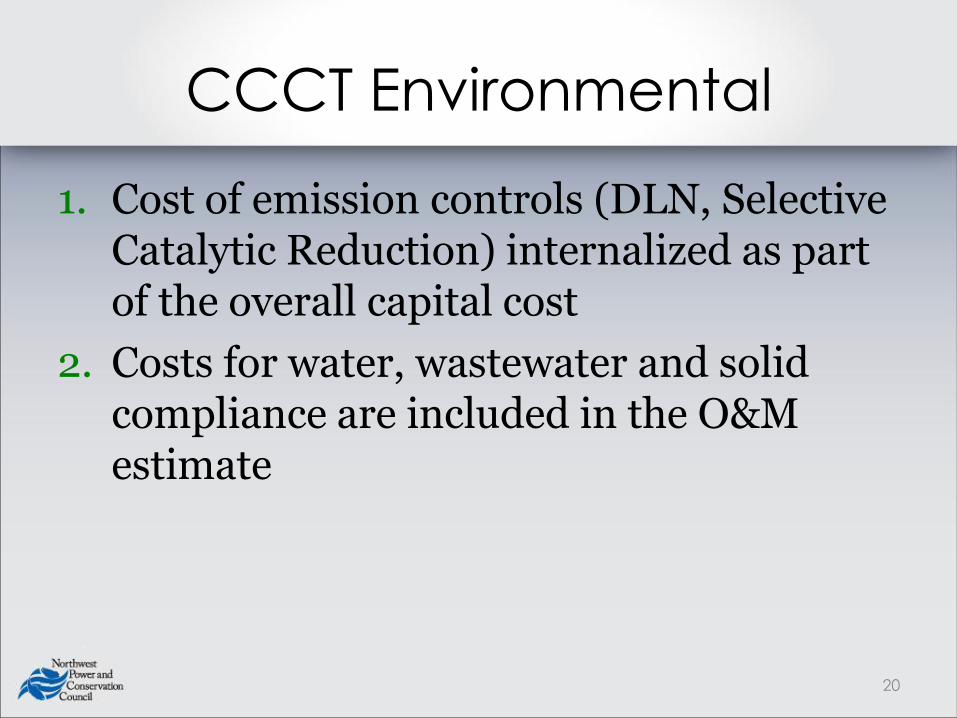
CCCT Environmental
1. Cost of emission controls (DLN, Selective Catalytic Reduction) internalized as part of the overall capital cost
2. Costs for water, wastewater and solid compliance are included in the O&M estimate
20
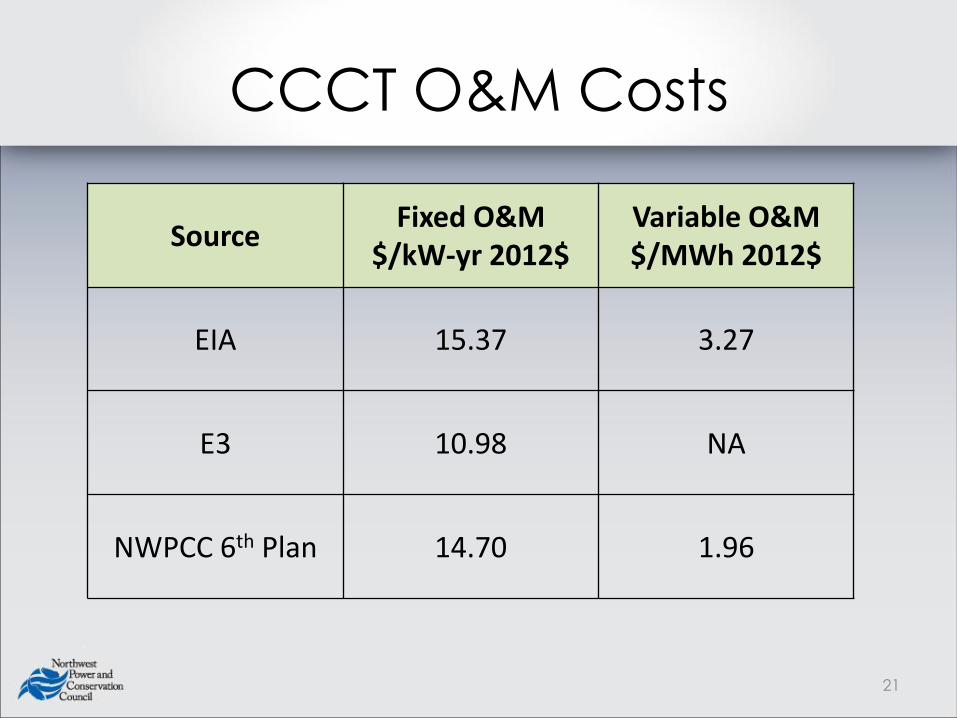
CCCT O&M Costs
Source
Fixed O&M $/kW-yr 2012$
Variable O&M $/MWh 2012$
EIA 15.37 3.27
E3 10.98 NA
NWPCC 6th Plan 14.70 1.96
21
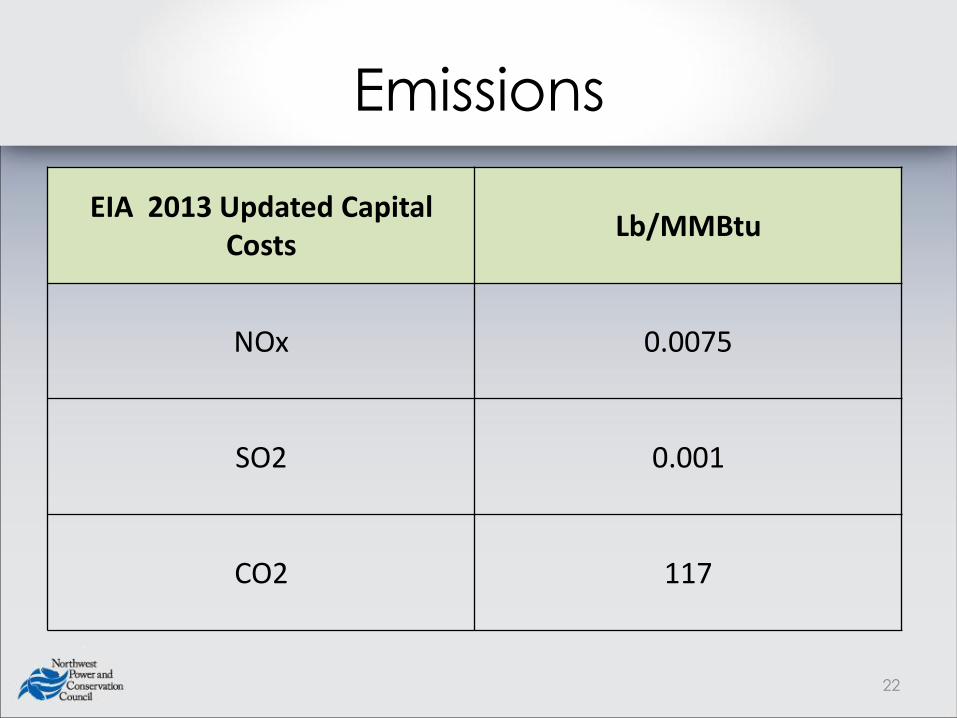
Emissions
EIA 2013 Updated Capital Costs
Lb/MMBtu
NOx 0.0075
SO2 0.001
CO2 117
22
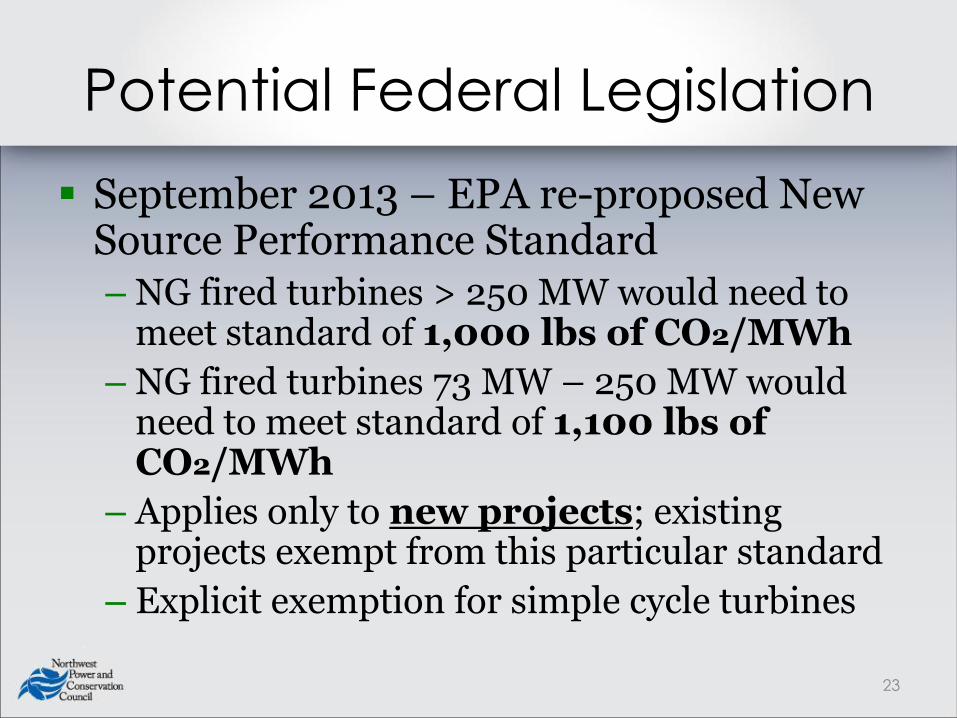
Potential Federal Legislation
September 2013 – EPA re-proposed New Source Performance Standard – NG fired turbines > 250 MW would need to
meet standard of 1,000 lbs of CO2/MWh
– NG fired turbines 73 MW – 250 MW would need to meet standard of 1,100 lbs of CO2/MWh
– Applies only to new projects; existing projects exempt from this particular standard
– Explicit exemption for simple cycle turbines
23
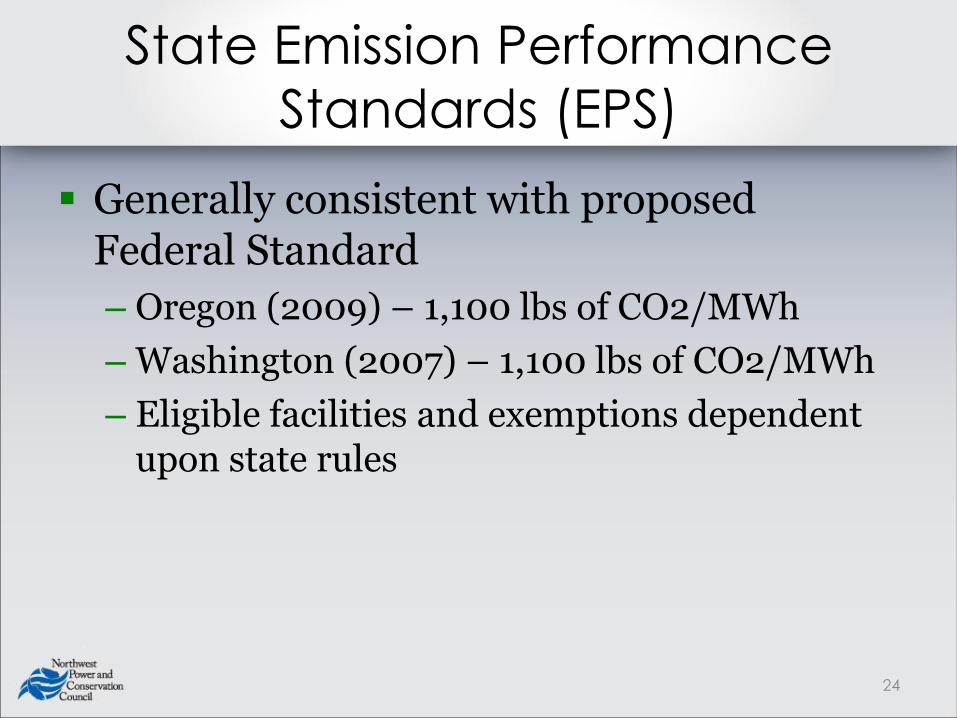
State Emission Performance
Standards (EPS)
Generally consistent with proposed Federal Standard
– Oregon (2009) – 1,100 lbs of CO2/MWh
– Washington (2007) – 1,100 lbs of CO2/MWh
– Eligible facilities and exemptions dependent upon state rules
24
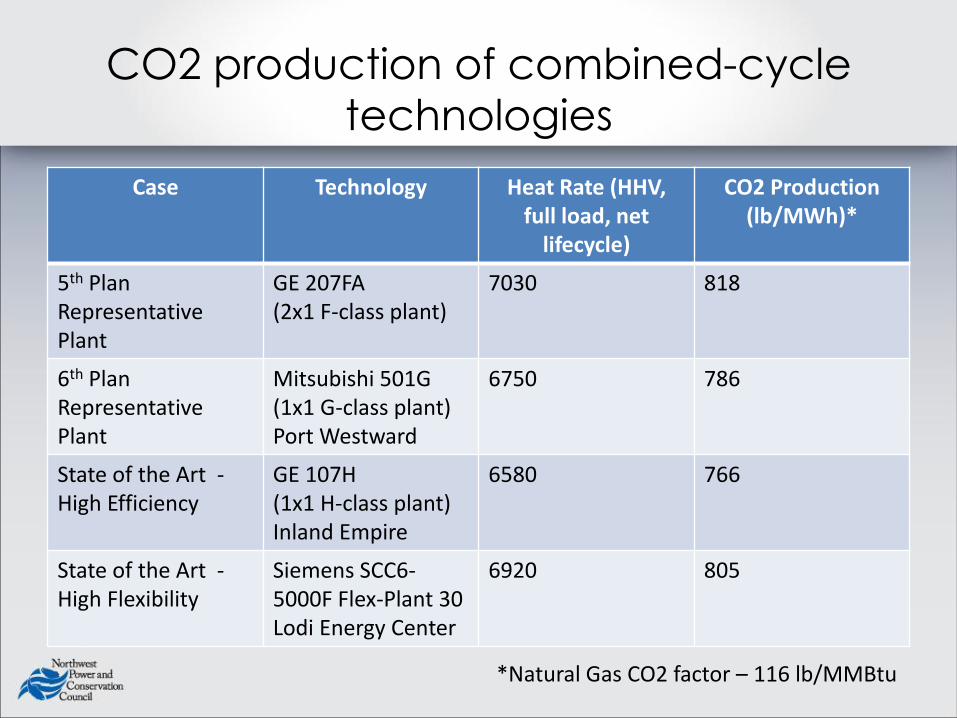
CO2 production of combined-cycle
technologies
Case Technology Heat Rate (HHV, full load, net
lifecycle)
CO2 Production (lb/MWh)*
5th Plan Representative Plant
GE 207FA (2x1 F-class plant)
7030
818
6th Plan Representative Plant
Mitsubishi 501G (1x1 G-class plant) Port Westward
6750 786
State of the Art - High Efficiency
GE 107H (1x1 H-class plant) Inland Empire
6580 766
State of the Art - High Flexibility
Siemens SCC6-5000F Flex-Plant 30 Lodi Energy Center
6920
805
*Natural Gas CO2 factor – 116 lb/MMBtu
Dispatch for Natural Gas Fired
Power
When bidding into the market – how are natural gas costs accounted for?
Is dispatch based on the full natural gas cost (commodity & pipeline charges) or just on variable or commodity cost?
26
Next Steps
Gather input and feedback from GRAC members on preliminary assumptions
Finalize a reference plant – capacity, heat rate,…
Finalize a capital cost and cash flow schedule for the reference plant as of 2012
Finalize forecasts for capital costs, O&M costs, and Levelized Costs across the Seventh Power Plan horizon (2015 – 2035)
Revisit at January GRAC meeting
27


