
March 2011
National Oil Companies and Value Creation
Volume II
Case Studies
Silvana Tordowith Brandon S. Tracyand Noora Arfaa


W O R L D B A N K P A P E R
National Oil Companies
and Value Creation
Silvana Tordo
with
Brandon S. Tracy and Noora Arfaa
Volume II

Copyright © 2011
The International Bank for Reconstruction and Development/The World Bank
1818 H Street, NW
Washington, DC 20433
Telephone: 202-473-1000
Internet: www.worldbank.org
World Bank and ESMAP papers are published to communicate the results of the Bank’s work to the
development community with the least possible delay. The manuscript of this paper therefore has not been
prepared in accordance with the procedures appropriate to formally-edited texts. Some sources cited in this
paper may be informal documents that are not readily available. This volume is a product of the staff of the
International Bank for Reconstruction and Development/The World Bank and ESMAP. The findings,
interpretations, and conclusions expressed in this volume do not necessarily reflect the views of the
Executive Directors of The World Bank or the governments they represent. They are entirely those of the
author(s) and should not be attributed in any manner to the World Bank, or its affiliated organizations, or to
members of its board of executive directors for the countries they represent, or to ESMAP.
The World Bank and ESMAP do not guarantee the accuracy of the data included in this publication and
accepts no responsibility whatsoever for any consequence of their use. The boundaries, colors,
denominations, other information shown on any map in this volume do not imply on the part of the World
Bank Group any judgment on the legal status or any territory or the endorsement of acceptance of such
boundaries.
Rights and Permissions
The material in this publication is copyrighted. Copying and/or transmitting portions or all of this work
without permission may be a violation of applicable law. The International Bank for Reconstruction and
Development / The World Bank encourages dissemination of its work and will normally grant permission to
reproduce portions of the work promptly.
Queries on rights and licenses, including subsidiary rights, should be addressed to the Office of the
Publisher, The World Bank, 1818 H Street NW, Washington, DC 20433, USA; fax: 202-522-2422; e-mail:
2
Contents
1. Ecopetrol (Colombia) ........................................................................................................................ 4
2. Kazmunaigaz Exploration and Production (Kazakhstan) ......................................................... 14
3. Oil and Natural Gas Corporation Ltd (India) ............................................................................. 22
4. Petróleos de Venezuela, S.A. (Venezuela) ................................................................................... 31
5. Petróleos Mexicanos (Mexico) ....................................................................................................... 42
6. Petróleos Brasileiro S.A. (Brazil) ................................................................................................... 54
7. Petro China Company Limited (China) ....................................................................................... 66
8. Petroliam Nasional Berhad (Malaysia) ........................................................................................ 76
9. The Petroleum Oil and Gas Corporation of South Africa (South Africa) ................................ 86
10. PTT Public Company Limited (Thailand) ................................................................................... 96
11. Sonatrach S.A. (Algeria) ............................................................................................................... 106
12. StatoilHydro ASA. (Norway) ...................................................................................................... 118
3
Acknowledgments
National Oil Companies and Value Creation, Volume II, is part of a
study aimed to explore the determinants of value creation by national
oil companies (NOCs). The study comprises three volumes: volume I
presents the findings of the study, volume II contains detailed case
studies on the NOCs analyzed in the study, and volume III contains the
full dataset and calculation of the value creation indices and value
drivers for each NOC in the study sample. The study was undertaken
and written by Silvana Tordo (lead energy economist – Oil, Gas, and
Mining Policy Division, World Bank), with contributions from Brandon
S. Tracy (econometrician, consultant), and Noora Arfaa (consultant),
both with the Oil, Gas, and Mining Policy Division of the World Bank.
The study draws on earlier drafts of chapters 1, 2, and 3 prepared by
Christian O. Wolf (Economist, Cambridge University, United
Kingdom). The data and material utilized in the calculation of the value
creation index and value drivers were collected by Michelle M. Foss,
Gurcan Gulen, Miranda Wainberg, Ruzanna Makaryan, and Dmitry
Volkov (Center for Energy Economics, Bureau of Economic Geology,
University of Texas at Austin – CEE), who also contributed to the
definition of the statistical model of value creation and prepared the
original version of the case studies. The comments of peer reviewers
Alan H. Gelb (Center for Global Development ), Robert W. Bacon and
Charles McPherson, both consultants (Oil, Gas, and Mining Policy
Division, World Bank), Sunita Kikeri (Corporate Governance
Department, World Bank), and Andre Plourde (professor, department
of economics, University of Alberta) are gratefully acknowledged.
Comments were also provided by PRMSP. Steven B. Kennedy and
Fayre Makeig edited the paper.
4
1. Ecopetrol (Colombia)
Colombia has largely succeeded in revitalizing its hydrocarbon sector, and increasing its once
declining oil production through governance and regulatory reforms and the partial privatization of
its NOC - Ecopetrol. The government currently owns 89.9 percent of the share capital in Ecopetrol, and
plans to reduce its ownership holding to 80 percent. The NOC’s experience underscores the
importance of sector governance in the creation of value. Reserves addition and cost control remain
the focus of Ecopetrol’s strategy.
Company and country sector evolution
Business activities
Ecopetrol is the only vertically integrated hydrocarbon company in Colombia and the largest in the
country in terms of revenue, profits, assets, and equity.1 The company has five major business
segments: (i) oil and gas exploration and production (E&P) in Colombia and, more recently, abroad;
(ii) domestic oil refining and petrochemical production; (iii) domestic transport of oil and refined
products; (iv) the development, marketing, and sale of natural gas in Colombia and to export markets;
and (v) the marketing and distribution of refined and feedstock products, both in Columbia and for
export. Ecopetrol dominates much of Columbia’s hydrocarbon production and processing:
Ecopetrol accounted for 66 percent of the nation’s crude oil production and 56 percent of its
natural gas production at end 2008.
Ecopetrol’s exports of crude oil and refined products represented 48 percent of the country’s
total exports of such products in 2008.
Ecopetrol controlled all refining capacity in Colombia in 2008 and is the largest wholesale
marketer in the country (Coleman and others, 2009).2
With the acquisition of Propilco in 2008, Ecopetrol is the largest petrochemical producer in
Colombia, mainly in polypropylene.
Ecopetrol has access to 69 percent of the country’s crude oil pipeline shipping capacity and
owns 99 percent of the total product pipeline shipping capacity.
Equity ownership
Ecopetrol’s equity was wholly owned by the Colombian government until November 2007 when 10
percent of the company’s equity was issued and sold on the Colombian stock market. In September
2008, Ecopetrol’s American Depositary Receipts began trading on the New York Stock Exchange.
Ecopetrol was authorized by the government in 2006 to issue up to 20 percent of its capital stock in
Colombia, subject to the condition that the government retain control of at least 80 percent of the
company’s capital stock.
1 Information in this section comes from the Ecopetrol 2008 SEC Form 20F and Coleman and others (2009). 2 Ecopetrol does not engage in the retail marketing of refined products.
5
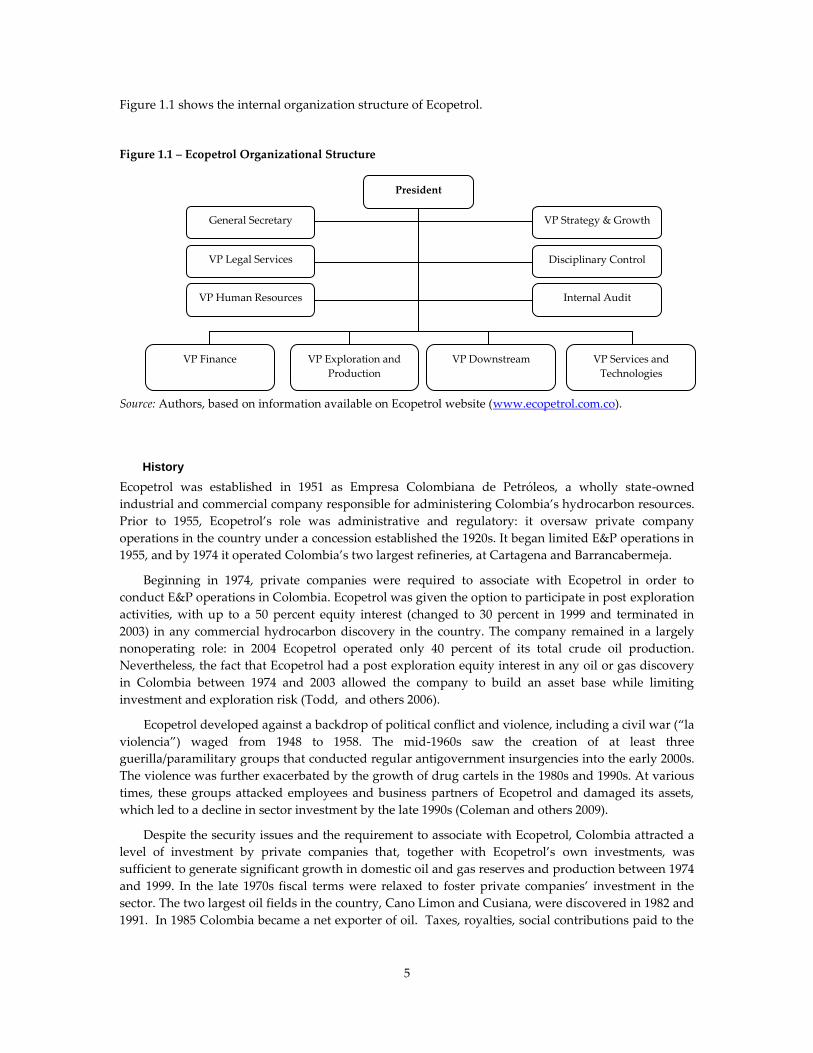
Figure 1.1 shows the internal organization structure of Ecopetrol.
Figure 1.1 – Ecopetrol Organizational Structure
Source: Authors, based on information available on Ecopetrol website (www.ecopetrol.com.co).
History
Ecopetrol was established in 1951 as Empresa Colombiana de Petróleos, a wholly state-owned
industrial and commercial company responsible for administering Colombia’s hydrocarbon resources.
Prior to 1955, Ecopetrol’s role was administrative and regulatory: it oversaw private company
operations in the country under a concession established the 1920s. It began limited E&P operations in
1955, and by 1974 it operated Colombia’s two largest refineries, at Cartagena and Barrancabermeja.
Beginning in 1974, private companies were required to associate with Ecopetrol in order to
conduct E&P operations in Colombia. Ecopetrol was given the option to participate in post exploration
activities, with up to a 50 percent equity interest (changed to 30 percent in 1999 and terminated in
2003) in any commercial hydrocarbon discovery in the country. The company remained in a largely
nonoperating role: in 2004 Ecopetrol operated only 40 percent of its total crude oil production.
Nevertheless, the fact that Ecopetrol had a post exploration equity interest in any oil or gas discovery
in Colombia between 1974 and 2003 allowed the company to build an asset base while limiting
investment and exploration risk (Todd, and others 2006).
Ecopetrol developed against a backdrop of political conflict and violence, including a civil war (‚la
violencia‛) waged from 1948 to 1958. The mid-1960s saw the creation of at least three
guerilla/paramilitary groups that conducted regular antigovernment insurgencies into the early 2000s.
The violence was further exacerbated by the growth of drug cartels in the 1980s and 1990s. At various
times, these groups attacked employees and business partners of Ecopetrol and damaged its assets,
which led to a decline in sector investment by the late 1990s (Coleman and others 2009).
Despite the security issues and the requirement to associate with Ecopetrol, Colombia attracted a
level of investment by private companies that, together with Ecopetrol’s own investments, was
sufficient to generate significant growth in domestic oil and gas reserves and production between 1974
and 1999. In the late 1970s fiscal terms were relaxed to foster private companies’ investment in the
sector. The two largest oil fields in the country, Cano Limon and Cusiana, were discovered in 1982 and
1991. In 1985 Colombia became a net exporter of oil. Taxes, royalties, social contributions paid to the
President
General Secretary
VP Legal Services
VP Human Resources
VP Strategy & Growth
Disciplinary Control
Internal Audit
VP Finance VP Exploration and
Production
VP Downstream VP Services and
Technologies

6
state increased from $747 million in 1995 to $1.4 billion in 2000 (ESMAP, 2005). By 2003 Ecopetrol was
a party to 76 exploration and production sharing agreements with third parties.
Hydrocarbon sector policy and regulatory issues have, for the most part, remained under the
purview of the Ministry of Mines and Energy and the Comision de Regulación de Energia y Gas. The
latter is a special administrative unit of the Ministry of Mines and Energy established in 1994 and
responsible for regulating and establishing energy sector standards, fostering the development of the
energy services industry, promoting competition, and addressing consumer and industry needs.3
By 2003 foreign direct investment in the hydrocarbon sector had dropped to about $300 million
annually; production and reserves continued to decline and Colombia was in danger of losing its self-
sufficiency in oil production as well as its oil-exporting status. Only 15 percent of the country’s
sedimentary basins had been explored. To avert this risk, the Colombian government embarked on a
major restructuring of the hydrocarbon sector. Decree 1760 of 2003 introduced measures aimed at
fostering private investment to increase Colombian reserves and production, gaining access to
international capital markets, and relieving Ecopetrol of its regulatory and policy responsibilities.
These changes were welcomed and, in some cases, initiated by Ecopetrol.
An independent upstream regulatory agency, the National Hydrocarbons Agency (ANH), was
created in 2003 to take over Ecopetrol’s administrative and regulatory functions. The new agency was
tasked with promoting petroleum exploration, drafting and negotiating E&P agreements, creating
attractive conditions for private investment in the sector, and collecting royalty payments. Ecopetrol
retained its role as a marketing agent for royalties in kind, which it sold on behalf of the ANH in
addition to a large portion of third-party production in Colombia (Coleman and others 2009). The
fiscal regime was revised to make Colombia one of the most attractive places for petroleum E&P in
Latin America (Zamora Reyes 2009). At the same time, the Colombian government made significant
improvements in the security situation, with a focus on protecting vital oil infrastructure (ANH 2008).
Even after the reforms and its partial privatization took effect, Ecopetrol has remained a
counterparty to all existing petroleum contracts with private companies, and retained its rights in all
directly operated producing properties. All existing contracts have clauses that provide, at Ecopetrol’s
sole option, for extensions. If Ecopetrol does not extend the contracts, the hydrocarbon reserves revert
to Ecopetrol. Extensions granted by Ecopetrol are subject to the review of the ANH. With respect to
new exploration licenses post-2003, Ecopetrol must compete with private companies in the ANH
exploration bidding rounds. Ecopetrol’s right to a postexploration equity participation option in any
commercial oil and gas discovery in Colombia was terminated in 2003.
By becoming a joint stock company in 2007, Ecopetrol was permitted to separate its investment
budget from Colombia’s national budget. Prior to 2007, Ecopetrol had to compete with other national
programs for limited treasury investment funds, and its ability to issue debt was capped by national
limits. In 2007 Ecopetrol was essentially debt-free and it retained the total $2.8 billion realized at the
time of the initial public offer (ANH, 2008). With access to international capital markets, the company’s
capital expenditures increased from $617 million in 2004 to close to $3 billion in 2008. In addition to
gaining access to increased investment capital, Ecopetrol’s initial public offer aimed to improve its
competitiveness by subjecting it to national and international capital markets discipline (Carta
Petrolera, 2006).
Ecopetrol’s competition and growth prospects were largely dependent on the Colombian
government’s ability to address the issue of fuel price subsidies. Up to Through 2007, Ecopetrol
provided significant gasoline and diesel price subsidies to domestic consumers, which cost the
company about $10 billion annually. Law 1151/2007, provided for the government to reimburse
3 Ecopetrol 2008 SEC Form 20F.

7
Colombian refiners annually for the price subsidies provided. But the government reimbursement of
the 2008 fuel subsidy (approximately $7 billion) provided by Ecopetrol was significantly delayed.4
Although much remains to be done, the restructuring begun in 2003 has had a positive impact on
Columbia’s hydrocarbon sector overall and on Ecopetrol’s performance in particular: the NOC is in
the top quartile of our 20 company samples in terms of its value creation index, and Colombia has seen
its oil and gas production grow since 2003 (Figure 1.2).
In 2008 oil reserves saw a substantial increased compared to 2007 levels (1.7 versus 1.4 billion
barrels), interrupting the downward trend of the previous 5 years. Gas reserves also increased over the
period 2003 to 2008, from 6.7 trillion cubic feet of recoverable natural gas and 4.0 trillion cubic feet of proven
natural gas reserves in 2003 to 7.3 trillion cubic feet of recoverable and 4.4 trillion cubic feet of proven
natural gas in 2008 (Zamora Reyes 2009).
Figure 1.2 – Colombia oil and natural gas production and consumption
Source: Authors and CEE, based on data from U.S. Energy Information Administration (EIA), International
Statistics.
In 2008, 86 companies were operating in Colombia’s hydrocarbon sector; foreign direct investment
in the sector had grown from $278 million in 2003 to $3.4 billion in 2008 (Zamora Reyes 2009).
Value Creation Index
Operational performance
Operational performance
indicators
Ecopetrol 5-Yr Avg.,
All NOCs 2004 2005 2006 2007 2008 5-Yr
Avg.
E&P Production Growth (%) -8.50 2.28 -15.19 3.81 12.34 -1.1 10.4
Reserves Replacement Rate (%) 95.56 90.23 99.46 66.04 46.53 79.6 95.8
Refinery Utilization Rate (%) 91.22 88.45 94.01 93.51 93.30 92.0 90.3
Output/total assets (BOE/000$) 20.88 17.07 12.23 7.88 6.17 12.9 16.2
Output/total employees (000 BOE) 40.56 41.68 38.60 38.53 38.14 39.5 20.6
Source: Authors, CEE.
Note: BOE = barrels of oil equivalent.
4 Ecopetrol 2008 SEC Form 20F.
0
100
200
300
400
500
600
700
800
900Colombia Oil Production, Consumption
Oil Production ('000 b/d)
Oil Consumption ('000 b/d)
0
100
200
300
400
500
600
700Colombia Natural Gas Production, Consumption
Natural Gas Production (BCF)
Natural Gas Consumption (BCF)

8
Following the restructuring, Ecopetrol increased its upstream capital spending with the goal of
increasing hydrocarbon production and reserves. Development drilling tripled between 2006 and
2008, and production growth was finally achieved (Coleman and others 2009). But the company’s
reserve base declined, with the reserve replacement rate (RRR) falling from 96 percent in 2004 to 47
percent by 2008, owing to underinvestment in exploration prior to 2006. Domestic gas production was
largely associated with crude oil production, and heavy crude accounted for about 30 percent of total
oil production in 2008. To diversify its investment portfolio, the NOC became active in Brazil, the
deepwater Gulf of Mexico, and Peru by partnering with experienced operators (Coleman and others
2009).
Future spending plans are aggressive and aim to reach 1 million barrels of oil equivalent (boe) per
day by 2015. Industry analysts, however, point at significant execution risks and suggest that for
Ecopetrol to achieve its goal, reserve additions will need to be larger and more consistent than in the
recent past (Coleman and others 2009; Fitch Ratings 2009).
With respect to refining, Ecopetrol plans to increase throughput capacity from 335,000 barrels per
day (bpd) to 650,000 bpd by 2015. It plans to increase conversion capabilities to process heavier crude
oils while meeting tougher environmental standards (Gutierrez 2009).
Ecopetrol’s productivity measured by the ratio of output to total assets appears to have
deteriorated over the period of our analysis, falling well short of the NOC sample average. But output
per employee is quite high relative to the other NOCs in our sample, and suggests an attention to costs
and leanness that will serve the company well going forward.
Financial performance
Financial performance indicators
Ecopetrol 5-Yr Avg.,
All NOCs 2004 2005 2006 2007 2008 5-Yr
Avg.
EBRTN/revenues (%) 48.77 48.12 41.10 49.55 53.51 48.4 45.3
EBRTN/assets (%) 22.76 22.87 16.57 23.00 37.24 24.6 34.9
Net cash flow / CAPEX (%) 82.60 70.43 233.70 191.28 113.41 138.2 131.4
Source: Authors, CEE.
Note: EBRTN = earnings before interest, taxes, and noncommercial expenditures; CAPEX = capital
expenditure.
Ecopetrol’s financial performance measures have improved considerably and, all financial indicators
shown in the table above exceed the NOCs sample 5-year average ((with the exception of earnings
before interest, taxes, and noncommercial expenditures as a percentage of assets)).
Revenues increased significantly over the period due to production volume and price increases,
and the NOC has been able to control its upstream costs, while refinery efficiency is expected to
improve (Coleman and others 2009). In addition, at the beginning of 2007 the government reimbursed
the NOC for fuel price subsidies, albeit after a delay.
Capital spending, particularly in the upstream sector, has increased significantly since 2007 and, in
accordance with the company’s strategic plan, will continue to grow between 2008 and 2015.5
5 Ecopetrol plans to spend US$60 billion between 2008 and 2015, 63 percent of which is targeted at the upstream
sector (Gutierrez 2009).
9
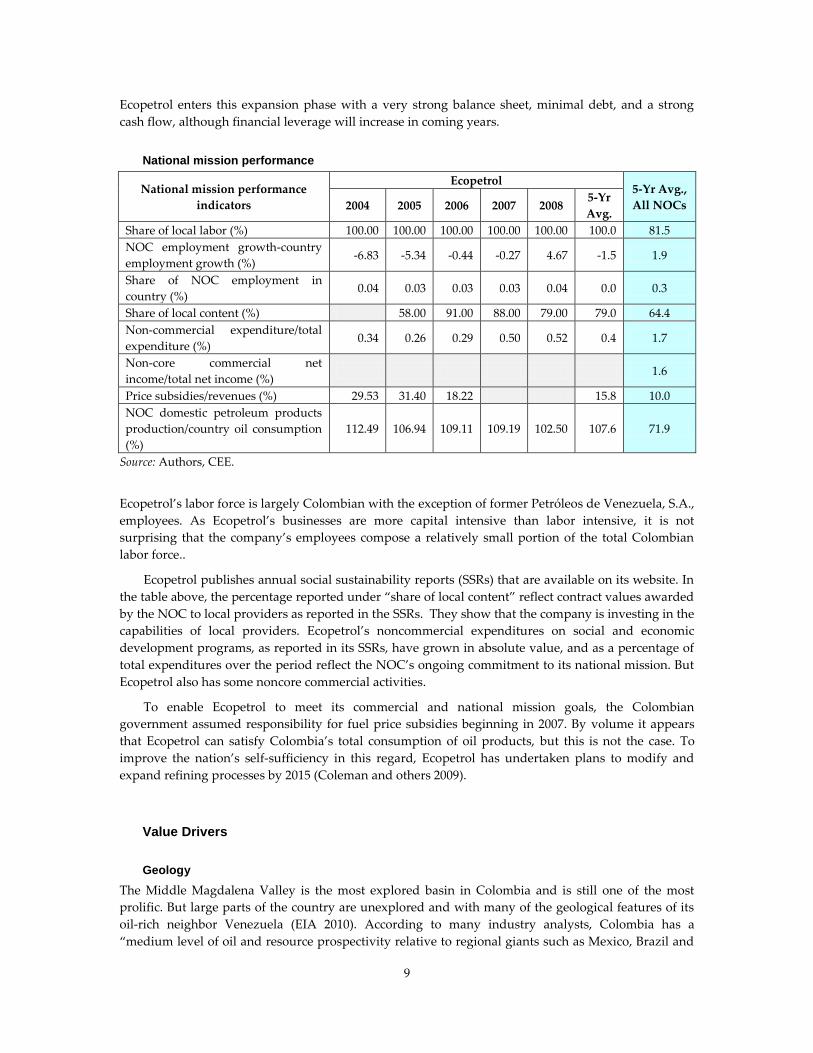
Ecopetrol enters this expansion phase with a very strong balance sheet, minimal debt, and a strong
cash flow, although financial leverage will increase in coming years.
National mission performance
National mission performance
indicators
Ecopetrol 5-Yr Avg.,
All NOCs 2004 2005 2006 2007 2008 5-Yr
Avg.
Share of local labor (%) 100.00 100.00 100.00 100.00 100.00 100.0 81.5
NOC employment growth-country
employment growth (%) -6.83 -5.34 -0.44 -0.27 4.67 -1.5 1.9
Share of NOC employment in
country (%) 0.04 0.03 0.03 0.03 0.04 0.0 0.3
Share of local content (%) 58.00 91.00 88.00 79.00 79.0 64.4
Non-commercial expenditure/total
expenditure (%) 0.34 0.26 0.29 0.50 0.52 0.4 1.7
Non-core commercial net
income/total net income (%) 1.6
Price subsidies/revenues (%) 29.53 31.40 18.22 15.8 10.0
NOC domestic petroleum products
production/country oil consumption
(%)
112.49 106.94 109.11 109.19 102.50 107.6 71.9
Source: Authors, CEE.
Ecopetrol’s labor force is largely Colombian with the exception of former Petróleos de Venezuela, S.A.,
employees. As Ecopetrol’s businesses are more capital intensive than labor intensive, it is not
surprising that the company’s employees compose a relatively small portion of the total Colombian
labor force..
Ecopetrol publishes annual social sustainability reports (SSRs) that are available on its website. In
the table above, the percentage reported under ‚share of local content‛ reflect contract values awarded
by the NOC to local providers as reported in the SSRs. They show that the company is investing in the
capabilities of local providers. Ecopetrol’s noncommercial expenditures on social and economic
development programs, as reported in its SSRs, have grown in absolute value, and as a percentage of
total expenditures over the period reflect the NOC’s ongoing commitment to its national mission. But
Ecopetrol also has some noncore commercial activities.
To enable Ecopetrol to meet its commercial and national mission goals, the Colombian
government assumed responsibility for fuel price subsidies beginning in 2007. By volume it appears
that Ecopetrol can satisfy Colombia’s total consumption of oil products, but this is not the case. To
improve the nation’s self-sufficiency in this regard, Ecopetrol has undertaken plans to modify and
expand refining processes by 2015 (Coleman and others 2009).
Value Drivers
Geology
The Middle Magdalena Valley is the most explored basin in Colombia and is still one of the most
prolific. But large parts of the country are unexplored and with many of the geological features of its
oil-rich neighbor Venezuela (EIA 2010). According to many industry analysts, Colombia has a
‚medium level of oil and resource prospectivity relative to regional giants such as Mexico, Brazil and

10
Venezuela‛ (Coleman and others 2009). Its light-crude-oil-producing fields are now in decline, and the
country still suffers from the lack of upstream investment made prior to 2003. Geology and
underinvestment have clearly impacted Ecopetrol’s capacity to replace its reserves. Ecopetrol is
looking at long-term deepwater exploration potential in the Caribbean, frontier areas, and
nonconventional resources—but these are investment targets post-2013 (Gutierrez 2009). In the
meantime, the company is attempting to diversify its reserve base by expanding internationally with
experienced local industry partners.
State context
Notwithstanding the country's commitment to democratic institutions, Colombia's history also has
been characterized by widespread, violent conflict. The 1991 Constitution brought about major
reforms to Colombia's political institutions. While the new constitution preserved a presidential, three-
branch system of government, it created new institutions such as the Inspector General, a Human
Rights Ombudsman, a Constitutional Court, and a Superior Judicial Council. Guerilla activity has
declined since the early 2000s, and stepped-up military and security oversight of oil and gas
infrastructure has reduced attacks on assets and personnel significantly. But many of the frontier areas
for exploration lie in remote areas where some guerilla activity is ongoing (Coleman and others 2009).
Although much attention has been focused on the security aspects of Colombia's situation, the
country has made significant efforts on issues such as expanding international trade, strengthening
rule of law, protecting human rights, promoting governance, and reducing poverty. Five of the six
World Bank World Governance Indicators for Colombia improved between 2005 and 2008.
Petroleum Sector Organization and Governance
Sector organization and governance arrangements have been improving (by international standards)
since the 2003 restructuring. Colombia and Ecopetrol have a long history of cooperation with private
investors. The 1974 requirement that private companies associate with Ecopetrol, together with
Ecopetrol’s post-exploration equity participation option in any commercial discovery provided it with
a low-risk opportunity to build a meaningful asset base. The company’s partnerships with private
companies have contributed to its technical, operational, and managerial development.
The regulatory and institutional reforms introduced by the Colombian government in 2003 have
reversed a period of underinvestment, and positive effects on production and growth—both for
Ecopetrol and for private investors—are already visible. Ecopetrol’s fiscal burden (royalties,
production taxes, income taxes, and dividends) averaged around 40 percent of revenues in the period
of observation, slightly more than that of Kazmunaigas E&P (37 percent) and approximately 17
percentage points above Statoil. But the country’s fiscal and regulatory regimes have improved
substantially, and received high ratings in the 2007 and 2008 Fraser Institute Global Petroleum
Surveys.6
With respect to Ecopetrol’s ability to create value through backward linkages, the company scores
well relative to other NOCs in our sample. It appears the national mission contribution required from
Ecopetrol is meaningful but, to date, commercially manageable.
NOC Strategy and Behavior
Ecopetrol’s recent strategy has clearly added value. Capital expenditures have increased significantly
since the partial privatization of Ecopetrol in 2007 and are expected to total $60 billion between 2008
6 Fraser Institute rankings: Weighted average of 1-Encourages investment; 2-Not a deterrent to investment; 3-Mild
deterrent to investment; 4-Strong deterrent to investment; 5-Would not invest. Colombia: 1.98; Kazakhstan: 2.72;
Norway: 2.37.
11
and 2015, with 63 percent targeted at the upstream sector. The company has already seen success in
hydrocarbon production growth and will hopefully see growth in its reserve base as well. In addition,
its plans for international expansion in the deepwater Gulf of Mexico and offshore near Brazil and
Peru should contribute to future reserve and production growth.
Ecopetrol is a significant operator in its own right: hydrocarbon production increased from 40
percent in 2004 to almost 50 percent in 2008, and Ecopetrol operates all of Colombia’s refining
capacity. Ecopetrol’s equity oil production is adequate for most of its refining throughput. Future
improvements are expected following the NOC’s decision to improve its refineries’ capability of for
processing heavier, indigenous crude oils.
With respect to technical and managerial capabilities, responses from an expert survey that was
carried out as part of our investigation (WB-CEE, 2010), ranks Ecopetrol’s skills as ‚adequate‛. But
experts suggest that the company lost talent to competitors during the 2007–08 period of high oil
prices, and that it now faces a ‚massive retirement challenge.‛ Conscious of this risk, the NOC has
improved work conditions to attract professionals from other local operators. One expert shared the
following assessment: ‚My prognosis is that in 8–10 years, Ecopetrol may be considered among the
handful of best managed NOCs in developing countries.‛
Corporate Governance
The partial privatization of the company in 2007 enabled it to access the investment capital needed to
meet its value creation goals. While Ecopetrol is a majority state-owned company, management,
nonetheless, independently decides about its investments based on project assessment without
affecting the Colombian government’s fiscal position (CIPE 2010). As a mixed-share company,
Ecopetrol is now exempt from public contracting requirements and can negotiate salaries and other
benefits, union or non-union, autonomously (Coleman and others 2009).
The board of directors includes nine principal members without alternates, which are appointed
by the General Shareholders Assembly for a term of one year according to provisions established by
the company’s by-laws. Six of the nine members of Ecopetrol’s board of directors are independent, and
include representatives of minority interest equity holders and petroleum industry professionals. The
board of directors has four permanent institutional committees that are tasked with establishing
guidelines in their area of expertise, monitoring their implementation, and proposing improvements in
the management of the company. The committees include the: i) Audit Committee, for which all
members must be independent and at least one must be an expert in finance and accounting; ii)
Nomination and Compensation Committee; iii) Corporate Government Committee; and iv) Business
Committee.
Financial and reserve auditing transparency also improved after the NOC’s partial privatization:
financial statements and reserves are audited by an independent international auditor with reports
filed in Bogota, Lima, and New York.
Conclusions
The Colombian government and Ecopetrol have taken positive, transformative steps in the areas of
petroleum sector governance and organization, and in NOC strategy, behavior, and corporate
governance. These have succeeded in enhancing Ecopetrol’s ability to create operational, financial, and
national mission value.
Overall, the institutional and regulatory reforms undertaken by the Colombian government have
created conditions for Ecopetrol to improve its commercial efficiency and competitiveness while
continuing to meet some key national mission goals. Ecopetrol has been freed from regulatory and
12
policy functions, and is no longer required to sell petroleum products at subsidized prices. The reform
of the fiscal regime has improved the attractiveness of Columbia to investors, and provided the basis
for Ecopetrol’s partnering and risk-sharing strategy. The NOC’s capitalization appears adequate for its
investment program, and its low financial leverage provides sufficient flexibility to raise additional
debt. Ecopetrol is clearly creating value, but in order to meet its ambitious growth targets, particularly
in the upstream sector, it will have to consistently add reserves while continuing to control costs.
13
References
ANH (National Hydrocarbons Agency). 2008. Politica de Consolidacion de la Seguridad Democratica:
Resultados y Retos. http://www.anh.gov.co/media/salaPrensa/juan_carlos_pinzon.ppt.
Carta Petrolera, Edition 115, October–November 2006.
http://www.ecopetrol.com.co/especiales/carta_petrolera_115/rev_english.htm.
Coleman, T., S. Wood, G. French, and W. Congdon. 2009. Ecopetrol, S.A. Moody’s Global Corporate
Finance, Pre-Sale Report (July). http://www.moodys.com.
Ecopetrol 2008 SEC Form 20F. http://www.ecopetrol.co.com/english.
EIA (US Energy Information Administration). 2010. Country Analysis Briefs: Columbia.
http://www.eia.doe.gov/cabs/Colombia/Oil.html
ESMAP (Energy Sector Management Assistance Programme). 2005. Comparative Study on the
Distribution of Oil Rents in Bolivia, Colombia, Ecuador and Peru. Joint UNDP/World Bank Energy Sector
Management Assistance Programme, January.
Fitch Ratings. 2009. ‚Fitch Affirms Ecopetrol’s FC IDR at BB+; Outlook Remains Stable.‛
http://www.fitchratings.com.
Fraser Institute. 2007. ‚Global Petroleum Survey 2007.‛ Vancouver, British Columbia.
http://www.fraserinstitute.org.
———. 2008. ‚Global Petroleum Survey 2008.‛ Vancouver, British Columbia.
http://www.fraserinstitute.org.
Gutierrez, Javier, CEO Ecopetrol. 2009. ‚Ecopetrol: Making Our Vision a Reality.‛ Presentation at
Louisiana Gulf Coast Oil Exposition (LAGCOE).
Gutierrez, Javier, CEO Ecopetrol, 2009 ‚Ecopetrol: Making Our Vision a Reality,‛ presentation at
Louisiana Gulf Coast Oil Exposition (LAGCOE). http://www.ecopetrol.com.co/documentos
Todd, J., L. Aristizabal, and C. Martinez. 2006. Ecopetrol S.A. Fitch Ratings, Latin American Corporates
(July 18). http://www.fitchratings.com.
WB-CEE (World Bank/Centre for Energy Economics). 2008. A Citizen’s Guide to National Oil
Companies—Part A: Technical Report. Washington, DC: University of Texas.
Zamora Reyes, Armando, ANH director general, 2009 presentation at the Herold Pacesetters Energy
Conference. www.anh.gov.co/media/presentaciones
14
2. Kazmunaigaz Exploration and
Production (Kazakhstan)
Established in 2004, Kazmunaigaz Exploration and Production (KMG EP) is the national oil and gas
exploration and production (E&P) company of Kazakhstan. KMG EP appears to be successful in its
dual role of creating significant operational and financial value while also meeting key national
mission goals. The company has increased or maintained production in mature fields, and has
achieved growth through acquisitions. Moreover, KMG EP has performed well above the other
national oil companies (NOCs) in our sample on a number of key financial measures.
Company and sector evolution
Business activities
KMG EP is an upstream oil and gas company. In 2009 it was the second largest Kazakh oil producing
company, focusing primarily on onshore upstream oil operations. 7 Key features of its business
include:
At the end of 2008 KMG EP’s proved and probable oil reserves were 2.133 billion barrels, and
annual oil production was 87.6 million barrels, including equity oil from associates.
Exports account for about 77 percent of total sales volumes in 2008.
At the end of 2006 the NOC had 16.3 BCF natural gas reserves (Olcott 2007).
KMG EP’s core production operations are in 41 mature fields in Uzen and Emba, in western
Kazakhstan, which have been in production since 1965, and require enhanced production
technologies.
Asset acquisition in Kazakhstan is a key element in the company’s growth strategy. In April 2007
KMG EP acquired a 50% stake in JV Kazgermunai LLP. In December 2007 KMG EP acquired a
50% stake in CCEL (Karazhanbasmunai). The two acquisitions enabled the NOC to increase
production by 25 percent and reserves by 20 percent in 20078.
KMG EP has the right of first refusal on the sale of any existing or future onshore Kazakh oil and
gas rights offered or obtained by its parent company, NC KMG (Kirk, R., 2008). It also has
preferential access to exploration acreage obtained by NC KMG via direct negotiations with the
Kazakh government.
In 2008, NC KMG, KMG EP and BG Group signed an upstream cooperation agreement that
provides KMG EP with an opportunity to join large-scale international projects and achieve a new
level of development.
In 2009, KMG EP accounted for 54 percent of NC KMG’s earnings before interest, taxes and
depreciation (EBITDA); it is the most profitable subsidiary in the NC KMG group of companies
(Anankina and Nikolaev 2010).
7 Information in this section was taken from KMG EP’s annual reports and other information available online
(http://www.kmgep.kz/eng). 8 In December 2009 the company acquired 33 percent in PetroKazakhstan, Inc., and another domestic acquisition is
expected in 2010.
15
Equity ownership
Created in March 2004 through the merger of JSС Uzenmunaigas and JSС Embamunaigas, KMG EP is
a subsidiary of NC KMG (itself wholly owned by the government of Kazakhstan). 9 Since October 2006
NC KMG has owned 63 percent of KMG EP’s equity; China Investment Corporation has owned 11
percent since September 2009. The remaining 26 percent is owned by private investors. The privately
owned shares are listed on the Kazakh Stock Exchange and the London Stock Exchange.
Prior to 2006, 100 percent of NC KMG’s equity was owned by the Kazakh government. In 2006 NC
KMG became a subsidiary of a new 100 percent government-owned holding company, Samruk
Holding.10 In 2009 Samruk was merged with Kazakhstan’s sustainable development fund, Kazyna, to
form the sovereign wealth fund Samruk-Kazyna, whose mission is to: (i) contribute to the
modernization and diversification of the national economy, (ii) perform stabilization functions, and
(iii) increase the efficiency of state-owned enterprises. KMG EP’s equity and group structure as
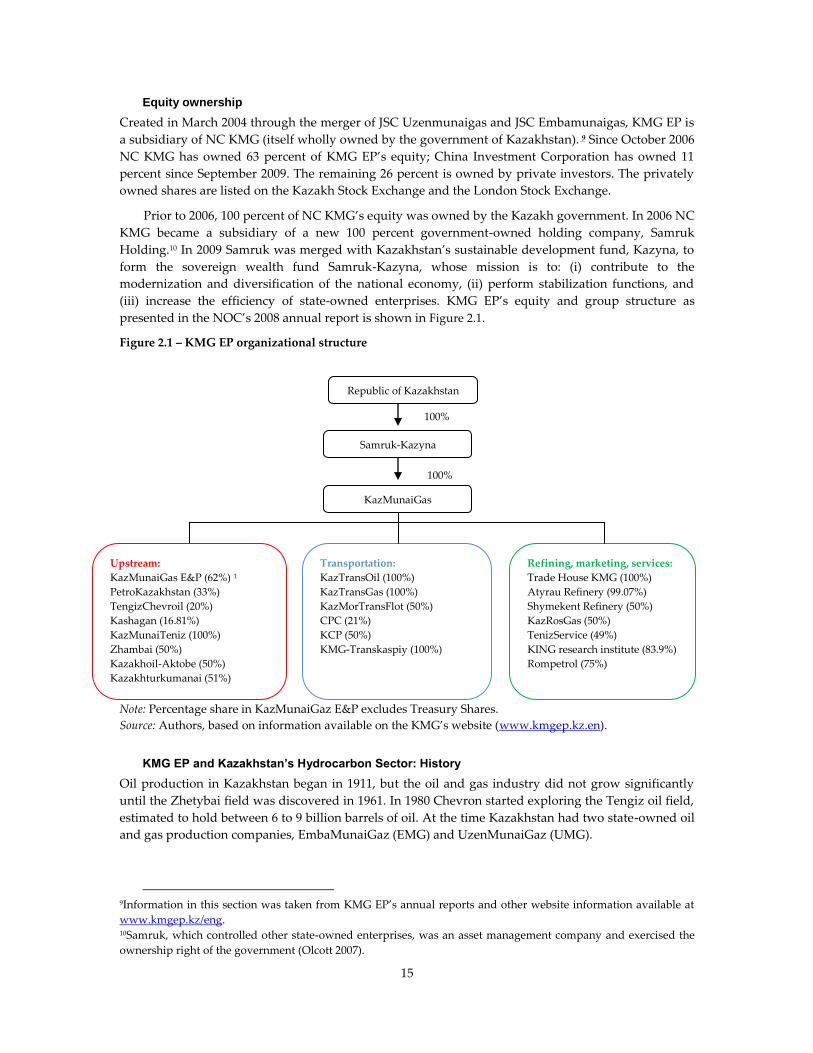
presented in the NOC’s 2008 annual report is shown in Figure 2.1.
Figure 2.1 – KMG EP organizational structure
Note: Percentage share in KazMunaiGaz E&P excludes Treasury Shares.
Source: Authors, based on information available on the KMG’s website (www.kmgep.kz.en).
KMG EP and Kazakhstan’s Hydrocarbon Sector: History
Oil production in Kazakhstan began in 1911, but the oil and gas industry did not grow significantly
until the Zhetybai field was discovered in 1961. In 1980 Chevron started exploring the Tengiz oil field,
estimated to hold between 6 to 9 billion barrels of oil. At the time Kazakhstan had two state-owned oil
and gas production companies, EmbaMunaiGaz (EMG) and UzenMunaiGaz (UMG).
9Information in this section was taken from KMG EP’s annual reports and other website information available at
www.kmgep.kz/eng. 10Samruk, which controlled other state-owned enterprises, was an asset management company and exercised the
ownership right of the government (Olcott 2007).
Republic of Kazakhstan
Samruk-Kazyna
KazMunaiGas
Transportation:
KazTransOil (100%)
KazTransGas (100%)
KazMorTransFlot (50%)
CPC (21%)
KCP (50%)
KMG-Transkaspiy (100%)
Refining, marketing, services:
Trade House KMG (100%)
Atyrau Refinery (99.07%)
Shymekent Refinery (50%)
KazRosGas (50%)
TenizService (49%)
KING research institute (83.9%)
Rompetrol (75%)
100%
100%
Upstream:
KazMunaiGas E&P (62%) 1
PetroKazakhstan (33%)
TengizChevroil (20%)
Kashagan (16.81%)
KazMunaiTeniz (100%)
Zhambai (50%)
Kazakhoil-Aktobe (50%)
Kazakhturkumanai (51%)
16
Rapid growth of Kazakhstan’s oil and gas industry occurred after the country became
independent in 1991 and opened the industry to foreign investors. Between 1991 and 2002, foreign
companies negotiated production-sharing agreements (PSAs) with state-owned KazakhOil (KO).11
International oil companies including ExxonMobil, Shell, TotalFinaElf, BG Group, Statoil, AGIP (ENI),
and Phillips Petroleum became active operators in the country. The Kashagan field, the fifth largest oil
field in the world in terms of reserves, was discovered in 2000 and was operated by AGIP (ENI) and
later by a consortium of major interest holders (EIA, 2009). As a result, both oil and gas production
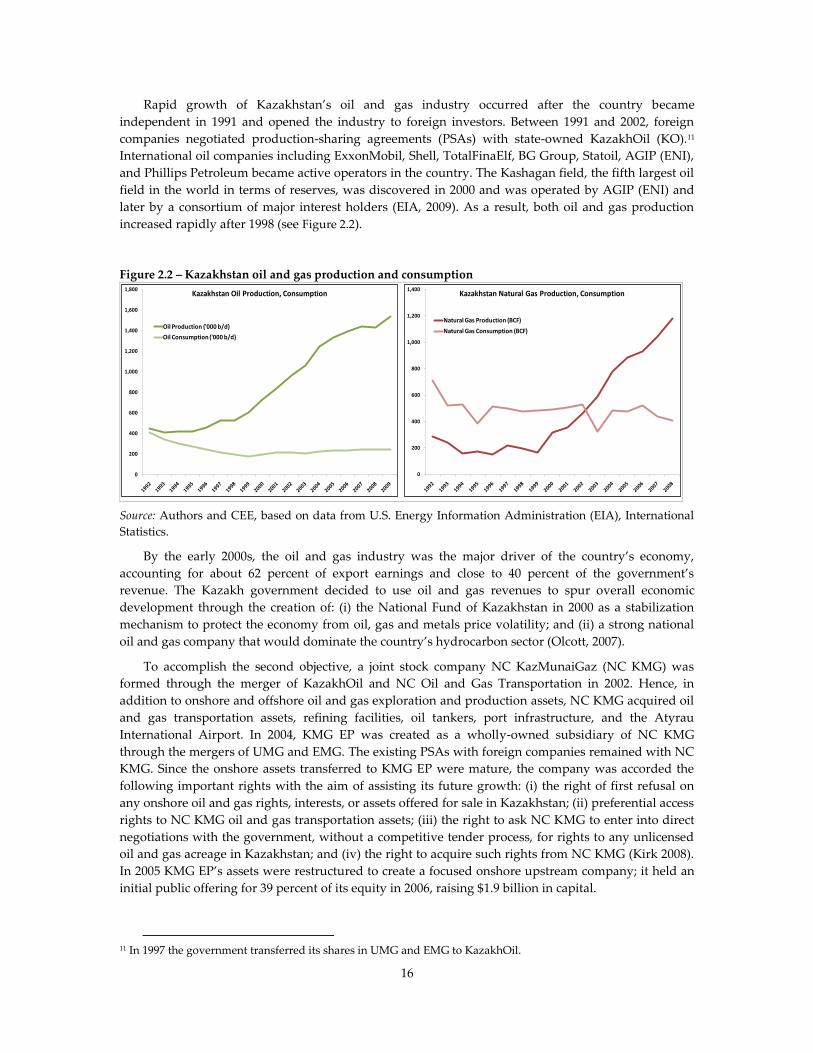
increased rapidly after 1998 (see Figure 2.2).
Figure 2.2 – Kazakhstan oil and gas production and consumption
Source: Authors and CEE, based on data from U.S. Energy Information Administration (EIA), International
Statistics.
By the early 2000s, the oil and gas industry was the major driver of the country’s economy,
accounting for about 62 percent of export earnings and close to 40 percent of the government’s
revenue. The Kazakh government decided to use oil and gas revenues to spur overall economic
development through the creation of: (i) the National Fund of Kazakhstan in 2000 as a stabilization
mechanism to protect the economy from oil, gas and metals price volatility; and (ii) a strong national
oil and gas company that would dominate the country’s hydrocarbon sector (Olcott, 2007).
To accomplish the second objective, a joint stock company NC KazMunaiGaz (NC KMG) was
formed through the merger of KazakhOil and NC Oil and Gas Transportation in 2002. Hence, in
addition to onshore and offshore oil and gas exploration and production assets, NC KMG acquired oil
and gas transportation assets, refining facilities, oil tankers, port infrastructure, and the Atyrau
International Airport. In 2004, KMG EP was created as a wholly-owned subsidiary of NC KMG
through the mergers of UMG and EMG. The existing PSAs with foreign companies remained with NC
KMG. Since the onshore assets transferred to KMG EP were mature, the company was accorded the
following important rights with the aim of assisting its future growth: (i) the right of first refusal on
any onshore oil and gas rights, interests, or assets offered for sale in Kazakhstan; (ii) preferential access
rights to NC KMG oil and gas transportation assets; (iii) the right to ask NC KMG to enter into direct
negotiations with the government, without a competitive tender process, for rights to any unlicensed
oil and gas acreage in Kazakhstan; and (iv) the right to acquire such rights from NC KMG (Kirk 2008).
In 2005 KMG EP’s assets were restructured to create a focused onshore upstream company; it held an
initial public offering for 39 percent of its equity in 2006, raising $1.9 billion in capital.
11 In 1997 the government transferred its shares in UMG and EMG to KazakhOil.
0
200
400
600
800
1,000
1,200
1,400
1,600
1,800Kazakhstan Oil Production, Consumption
Oil Production ('000 b/d)
Oil Consumption ('000 b/d)
0
200
400
600
800
1,000
1,200
1,400Kazakhstan Natural Gas Production, Consumption
Natural Gas Production (BCF)
Natural Gas Consumption (BCF)
17
The 1996 Subsurface Use Act (Law 2828), the 1995 Petroleum Law (Law 2350), the 2001 Tax Code
and the 2004 PSA Law (L68-III) provide the legal and regulatory frameworks for the hydrocarbon
sector. Most relevant to KMG EP is the 2004 PSA Law that requires all production sharing
arrangements to include NC KMG with a minimum fifty percent interest carried through exploration.
In addition, PSAs were restricted to offshore acreage, only effectively limiting the competition faced by
NC KMG/ KMG EP for onshore acreage. In 2005 the law was amended to provide the government
with the right to prevent transfers of participating interests if they threatened Kazakhstan’s economic
interests. This amendment, which affected transfers to or among private companies, created potential
investment opportunities for the NOC (Kirk 2008).
In 2006 the Statute on the Ministry of Energy and Mineral Resources (Law 1105) was amended to
clarify the duties of the ministry, which included policy making, contract negotiation and
administration, and the exercise of the government’s shareholder rights in NC KMG (Ministry of
Energy and Mineral Resources Kazakhstan 2010).
Value Creation Index
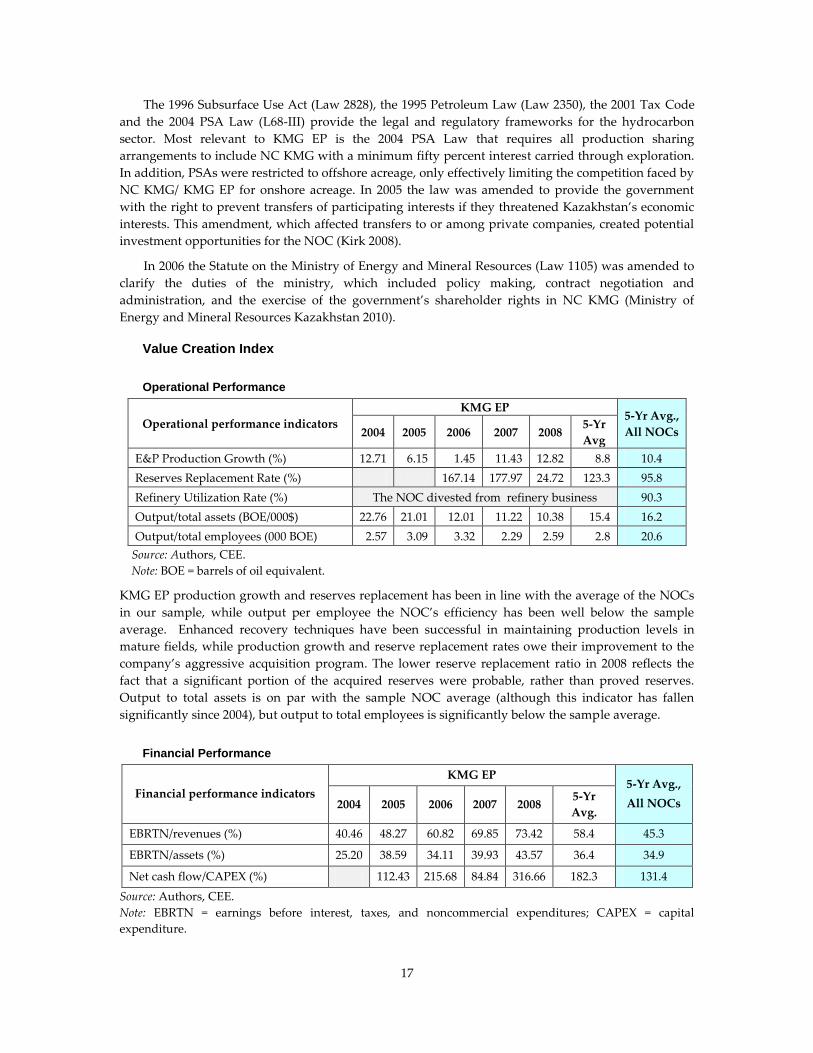
Operational Performance
Operational performance indicators
KMG EP 5-Yr Avg.,
All NOCs 2004 2005 2006 2007 2008 5-Yr
Avg
E&P Production Growth (%) 12.71 6.15 1.45 11.43 12.82 8.8 10.4
Reserves Replacement Rate (%) 167.14 177.97 24.72 123.3 95.8
Refinery Utilization Rate (%) The NOC divested from refinery business 90.3
Output/total assets (BOE/000$) 22.76 21.01 12.01 11.22 10.38 15.4 16.2
Output/total employees (000 BOE) 2.57 3.09 3.32 2.29 2.59 2.8 20.6
Source: Authors, CEE.
Note: BOE = barrels of oil equivalent.
KMG EP production growth and reserves replacement has been in line with the average of the NOCs
in our sample, while output per employee the NOC’s efficiency has been well below the sample
average. Enhanced recovery techniques have been successful in maintaining production levels in
mature fields, while production growth and reserve replacement rates owe their improvement to the
company’s aggressive acquisition program. The lower reserve replacement ratio in 2008 reflects the
fact that a significant portion of the acquired reserves were probable, rather than proved reserves.
Output to total assets is on par with the sample NOC average (although this indicator has fallen
significantly since 2004), but output to total employees is significantly below the sample average.
Financial Performance
Financial performance indicators
KMG EP 5-Yr Avg.,
All NOCs 2004 2005 2006 2007 2008 5-Yr
Avg.
EBRTN/revenues (%) 40.46 48.27 60.82 69.85 73.42 58.4 45.3
EBRTN/assets (%) 25.20 38.59 34.11 39.93 43.57 36.4 34.9
Net cash flow/CAPEX (%) 112.43 215.68 84.84 316.66 182.3 131.4
Source: Authors, CEE.
Note: EBRTN = earnings before interest, taxes, and noncommercial expenditures; CAPEX = capital
expenditure.

18
All financial performance metrics increased significantly over the period of observation, owing to an
extraordinary rise in revenue resulting from the increase in energy prices and production levels. Costs
also increased, but well below revenues, leaving KMG EP with a comfortable cash flow to fund its
acquisition campaign and future expansion plans. By fall 2009, the company had a net cash position
of $4 billion (Shvyrkovand Pastoukhova 2009).
National Mission Performance
National mission performance
indicators
KMG EP 5-Yr
Avg., All
NOCs 2004 2005 2006 2007 2008 5-Yr
Avg.
Share of local labor (%) 99.00 99.00 99.00 99.00 99.00 99.0 81.5
NOC employment growth-country
employment growth (%) -13.70 -7.52 58.90 -2.03 6.88 1.9
Share of NOC employment in country
(%) 0.32 0.28 0.26 0.41 0.40 0.3 0.3
Share of local content (%) 67.30 67 64.4
Non-commercial expenditure/total
expenditure (%) 0.66 3.22 0.94 0.48 1.3 1.7
Non-core commercial net income/total
net income (%) 1.6
Price subsidies/revenue (%) 10.0
NOC domestic petroleum products
production/country oil consumption
(%)
23.19 27.11 3.17 17.67 71.9
Source: Authors, CEE.
According to industry experts, KMG EP’s workforce almost entirely consists of Kazakh nationals. This
is not unexpected given the company’s domestic focus to date.
KMG EP does not have non-oil and gas related commercial operations: all non-core commercial
activities remained with KMG. However, the company has implemented a diverse social program
including social partnerships, education projects, and various forms of social and economic aid. KMG
EP spent $30 million on such projects in 2008. In addition, the company is required to hold 95 percent
of its cash in domestic banks to help boost the local banking sector (Shvyrkov and Pastoukhova 2009).
Domestic prices for refined oil products in Kazakhstan are controlled at levels below international
prices (Anakina and Nikolaev 2010). As a result, KMG EP is obligated by written intercompany
agreements to provide up to 1.9 million metric tons of crude oil to KMG-owned domestic refineries at
a price equal to its cost of production and transportation plus a margin of 3 percent. Although KMG
EP may not incur actual cash or accounting losses on such sales, it lost potential earnings from 2006
through 2008 equal to the difference between international crude oil prices and the specified pricing
formula.

19
Value Drivers
Geology
Kazakhstan’s relatively immature but large oil and gas resource base offers plenty of domestic growth
opportunities for KMG EP. In 2009, the U.S. Energy Administration (EIA) noted that ‚full
development of its major oil fields could make Kazakhstan one of the world’s top five oil producers in
the next decade.‛ According to BP statistical review at the end of 2008 Kazakhstan’s proven oil
reserves were 30 billion barrels – although probable reserves could be much higher (EIA, 2009). The
main oil fields are in the western part of the country, where KMG EP is active. The same is true for the
location of the country’s proven gas reserves, which stood at 85 trillion cubic feet at the end of 2008.
The large exploration and development potential of the Kazakh resource base, combined with KMG
EP’s right to a carried exploration interest in all PSAs post-2004 and its right of first refusal on assets
acquired by KMG, have allowed the company to grow despite the relatively mature profile of its initial
portfolio.
State Context
The country’s economy is heavily reliant on the oil and gas sector: the sector accounts for 11 percent of
gross domestic product (GDP) and 40 percent of government revenues. It is not surprising that the
government has taken an active role in managing the sector. The many privileges afforded to KMG EP
by law place the NOC in a strong competitive position. But such protectionist policies must be
balanced against the need to attract foreign investors with the technology and exploration expertise
that KMG EP requires.
Exchange rate volatility driven by fluctuations in oil prices, pressing development needs, and
limited implementation and absorptive capacities are among Kazakhstan’s key policy challenges. But
over the past several years the government has created a vision for its future built around two key
goals: to become a full member of the global economy through the adoption of international standards
for its productive, financial and public sectors and to diversify the economy away from oil and
minerals. Kazakhstan’s Governance Indicators have been improving over the period 2004-08.
Although within regional average, the control of corruption and voice and accountability indicators
rank in the 10th to 25th percentile.
Petroleum Sector Organization and Governance
As discussed earlier, the Law on Subsoil and Subsoil Use, which governs the transfer of subsoil use
rights, was amended in 2005 to grant NC KMG pre-emption rights on oil assets for sale. In 2007 the
law was amended to allow the government to make retrospective changes to existing oil contracts or
and terminate contracts for reasons of national security. Since early 2008 joint ventures became the
most common form of investment. Instead of running licensing rounds for the award of petroleum
E&P rights, the NOC is tasked with negotiating with potential investors. This policy initially
dampened private oil company interest (EIA, 2010). According to the Fraser Institute’s global
petroleum survey, private investors indicated that the level of regulatory uncertainty in Kazakhstan
was a ‚mild deterrent to investment‛ in 2007 and 2008.
In Kazakhstan there is a clear separation of responsibility between policy making, regulation, and
commercial activities. The country has opened its petroleum sector to private companies. Over the
study period about 89 percent of oil and gas production in Kazakhstan came from private oil
companies. This competition in turns puts continuing pressure on KMG EP to strive for excellence as
the government can compare its performance to others.
20
NOC Strategy and Behavior
The company has a clear focus on the upstream sector. Through a combination of savvy management
and commercial privileges, KMG EP has been able to stabilize production from its mature asset base,
to undertake several strategic asset acquisitions in the domestic market, and successfully integrate
such acquisitions in its existing portfolio.
NOC Corporate Governance
The company’s corporate governance arrangements were reformed prior to its partial privatization.
Particularly noticeable is the level of transparency with respect to the relationship between KMG EP
and its parent, NC KMG. A contractual arrangement defines KMG EP’s preferential acquisition rights,
for which the NOC pays a management fee to its parent company. Thirty-eight percent of the
company’s board of directors, ‚have a track record of balancing the influence of the majority
shareholder effectively and performing close management oversight‛ (Shvyrkov and Pastoukhova
2009).
KMG EP appears to have full budget and financial management autonomy, but its flexibility is
somewhat impaired by the government’s requirement to hold 95 percent of its considerable cash
reserves in domestic banks.
Conclusions
With no significant local content obligations, and helped by good geology and the many privileges,
KMG EP has been able to create significant operational and financial value. The company appears to
be comfortably positioned to continue on this trajectory, at least in terms of financial capacity. As long
as the government’s protectionist policy remains in place, there is no real incentive for the NOC to
diversify its portfolio internationally or to venture into exploration risk. As long as Kazakhstan’s
investment conditions remain attractive to private investors, this policy may be one of the most
effective ways for the government to help the KMG EP achieve the size and economies of scale
necessary to become a full fledged oil and gas corporation.

21
References
Anakina, E. and Nikolaev A., 2010. ‚JSC KazMunaiGas Exploration Production,‛ Standard&Poors,
May 26, 2010.
EIA (U.S. Energy Information Administration), 2009. Kazakhstan Country Analysis Brief, November
2009, http://www.eia.doe.gov/cabs/Kazakhstan .
Fraser Institute. 2007 and 2008. ‚Global Petroleum Surveys.‛ Vancouver, British Colombia.
http://www.fraserinstitute.org.
KMG EP (Kazmunaigaz Exploration and Production). 2004–08. KMG EP’s annual reports and other
Web site information. http://www.kmgep.kz/eng.
Kirk, R. 2008. ‚Analysis: Kazakhstan’s Flagship Oil Company KazMunaiGas E&P Expected to
Significantly Increase Reserves and Production.‛ Silk Road Intelligencer, July 16.
Ministry of Energy and Mineral Resources, Kazakhstan. 2010. The Statute on the Ministry of Energy
and Mineral Resources. http://www.memr.gov.kz/?mod=pol&lng=eng&year=2007.
Olcott, M. B. 2007. ‚Kazmunaigaz: Kazakhstan’s National Oil and Gas Company.‛ Carnegie
Endowment for International Peace, prepared in conjunction with an energy study sponsored by the
James A. Baker III Institute for Public Policy, Rice University and Japan Petroleum Energy Center,
March.
Shvyrkov, O., and Pastoukhova E. 2009. ‚KMG EP Gamma Score.‛ Standard & Poor’s, December 22.

22
3. Oil and Natural Gas Corporation Ltd
(India)
Oil and Natural Gas Corporation Ltd. (ONGC), a Fortune Global 500 company, was listed twenty-fifth
in the Platts Top 250 Global Energy company rankings for 2008 based on assets, revenues, profits, and
return on invested capital. But the national oil company (NOC) appears to be experiencing some
challenges with respect to production growth and reserves replacement, and the high level of
petroleum product price subsidies absorbed by it (highest among the NOCs analyzed in our sample)
appears to be affecting its capacity to invest in its core business.
Company and country sector evolution
Business activities
ONGC is the largest oil company in India and is the dominant player in the upstream hydrocarbon
sector, accounting for about 71 percent of the country’s production (EIA 2009). The ONGC engages in:
(i) oil and gas exploration and production (E&P) in India, where it has the largest exploration acreage;
(ii) oil and gas E&P overseas through its subsidiary ONGC Videsh Ltd. (OVL); and (iii) refining and
petrochemicals through its subsidiary Mangalore Refinery and Petrochemicals Ltd. Following are
business highlights from 2007–08:
The ONGC made 35 discoveries in India, with estimated reserves in place of 182 million tonnes of
oil equivalent. Its exploration success ratio of 50 percent was its best in seven years.
Oil and gas production reached a new high of 62 tonnes of oil equivalent, thanks to the successful
use of improved and enhanced oil recovery techniques in mature fields, the production of new
and marginal fields, and the expansion of the NOC’s overseas assets portfolio.
The ONGC signed its first contract to supply coalbed methane gas at the end of 2008.
The company’s Mangalore refinery was used to its full capacity.
The ONGC retained the status of the highest dividend-paying company in India—public or
private—while it increased capital investment to its highest level to date.
Equity ownership and organization
Directly and indirectly, the Indian government controls 84.2 percent of ONGC’s equity. The
company’s organizational structure is shown in Figure 3.1. In 1993, the Oil and Natural Gas
Commission became ONGC. The company later expanded its equity by two percent by offering shares
to its employees. In 1999, ONGC, Indian Oil Corporation – (a downstream giant) and Gas Authority of
India Limited – (the only gas marketing company in India), agreed to exchange shares, paving the way
for a long-term strategic alliance for domestic and overseas business opportunities. Indian Oil
Corporation acquired 10 percent equity in ONGC and the Gas Authority of India acquired 2.5 percent.

23
Figure 3.1 - ONGC Organization
Source: Authors, based on information available on ONGC website (www.ongcindia.com).
History
After India attained independence in 1947, government-owned companies were established to
undertake hydrocarbon E&P activities pursuant to the Industrial Policy Resolution of 1954. To that
end, the Oil and Natural Gas Directorate was formed in 1955.
In 1956 the Oil and Natural Gas Directorate became the Oil and Natural Gas Commission, part of
the Geologic Survey of India. Three years later, it was transformed into a statutory body under the
Ministry of Petroleum and Natural Gas. In 1994 the Oil and Natural Gas Commission became a
corporation, and its name changed to Oil and Natural Gas Corporation Ltd. Another government-
owned oil and gas E&P company was established as well: Oil India Ltd (OIL).
In the early 1970s ONGC and OIL supplied nearly 70 percent of domestic oil and gas
consumption (Consult Club 2010). In 1974 a large oil field, Mumbai High, was discovered by ONGC
and its Russian partners. In 1976, after the first oil shock, India nationalized all foreign oil marketing
companies and restricted downstream investment to government-owned companies. In the 1980s
domestic oil and gas production began to decline while demand grew. ONGC’s reserves were
declining and its fields were deteriorating. The company’s use of financial resources was not efficient
CMD
MD, ONGC Videsh Ltd. Company Secretary
Corporate Affairs
Chief Vigilance Office
.
Off-shore On-shore Exploration Human
Resources
Technology
and Field
Services
Finance To be
filled
Infocom
Planning and
Capital
Budget
Business
Development,
JVs and Mktg
Safety, Health
and
Environment
Technical
audit and QA
Engineering
Internal Audit
Performance
Mgmt &
Benchmarking
Commercial
Drilling
Services
Well Services
Logging
HR Planning
Employees
Relations
Security
Legal
Medical
Corporate
Communication
Western Off-
shore
Western On-
shore
Assam &
Assam
Arakam
Cauvery
KG-PG
GVK frontier
IRS
Geological
Services
Ahmedabad
Ankleshwar
Mehsana
Assam
Karalkal
(Cauvery)
Rajamundhry
(KG)
Tripura
Mumbai High
Bassein &
Satellite
Heera &
Neelam
Supply Bases
Uran Plant
Off-shore PSC
-JV

24
partially due to organizational problems and gaps in planning. By the early 1990s ONGC and OIL
were able to supply only 35 percent of domestic consumption (Consult Club, 2010).
Following the foreign exchange crisis in 1991, India negotiated special assistance loans with the
World Bank and the Asian Development Bank, requiring it to improve economic efficiency through
increased competition and private sector participation in the economy. In the hydrocarbon sector, the
government swiftly launched a liberalized oil and gas exploitation and exploration policy. In 1992 and
1993, oil and gas fields discovered by ONGC and OIL were offered, in a competitive bidding
arrangement, under development contracts to foreign oil companies. Indian companies were forced to
partner as non-operators in these development arrangements with the more experienced foreign oil
companies.
In 1993 the Directorate General of Hydrocarbons (DGH) was established under the administrative
control of the Ministry of Petroleum and Natural Gas to manage domestic oil and gas resources and to
conduct competitive bidding rounds for exploration blocks (IBEF 2007). A number of competitive
bidding rounds were conducted beginning in 1995, but India’s NOCs were required to have a
minimum 25 percent interest in all exploration blocks. The bidding rounds were unsuccessful in
attracting private capital overall, owing to unclear bidding parameters and a lack of competitive
commercial terms. In an effort to accelerate the development of India’s hydrocarbon resources, the
DGH instituted a New Exploration Licensing Policy (NELP) in 1999 with more favorable fiscal terms,
including the elimination of the requirement for the NOCs’ participation (Kaul 2001). NOCs could bid
against private companies for exploration blocks, but private companies were not required to include
NOCs in their bidding consortia.
To date, eight NELP exploration licensing rounds have been held. In the first five rounds, over 150
exploration blocks were awarded to domestic and foreign companies, entailing an investment
commitment of more than $12 billion. Though this process did not attract the large international oil
companies, there have been some encouraging results. Today, NOCs account for about 52 percent of
exploration activities and private companies and joint ventures account for the remaining.
Non-NOC oil and gas production increases have helped to offset some of the production
decreases from ONGC. This substitution effect is most noticeable for natural gas production. The
share of gas production by private producers independently or via JVs increased from nearly 11
percent in 2000-01 to about 23 percent of the total in 2005-06. For crude oil, the share of private
producers was about 14 percent in 2005-06, up only slightly from the 2000-01 timeframe (IBEF 2007).
While oil production remains substantially higher than internal consumption, India is a net importer
of natural gas (see figure 3.2).
Following the implementation of the NELP and the increase in competition for exploration
acreage in India, ONGC began to expand internationally, particularly in the upstream sector. As of
mid-2009, OVL was participating in 40 E&P projects in 16 countries. By 2008 ONGC’s oil and gas
production from international projects accounted for about 14 percent of its total production, and the
NOC was an operator in 43 percent of its international projects and a joint operator in an additional 12
percent. Current international production comes from the Sudan, Vietnam, Syria, Russia, Colombia,
Venezuela, and Brazil. Exploration projects in Myanmar, Egypt, and Iran resulted in some discoveries,
and appraisal work is in progress.

25
Figure 3.2 – India crude oil and natural gas production, consumption
Source: Authors and CEE, based on data from U.S. Energy Information Administration (EIA), International
Statistics.
In 2006 a new Regulatory Board (RB) was established to regulate activities in the downstream oil
and gas sectors pursuant to the Oil and Natural Gas Regulatory Board Act. With respect to natural gas
distribution, the RB determines the length of the access exclusivity period for builders and operators of
pipeline networks. With respect to oil, oil products, and natural gas, the RB monitors transportation
rates and product prices to deter restrictive trade practices and secure equitable distribution. The RB
establishes technical and safety standards for pipelines and other infrastructure projects as well as
codes of conduct for companies that are engaged, directly or through an affiliate, in both pipeline
transport and the marketing of natural gas.
Total refining capacity grew from 63 million metric tonnes in 1998 to 149 million metric tonnes in
2007. ONGC is the smallest refiner in India, and is a relative newcomer to the business. In 2004 ONGC
bought a 72 percent equity stake in publicly traded (on Indian stock exchanges) Mangalore Refinery &
Petrochemicals Ltd. (MRPL). The Mangalore refinery consistently operates in excess of its rated
capacity and has maintained profitability: its export orientation helps to shield it from the negative
impact of domestic price subsidies. Joint ventures are expected to contribute to refining capacity
growth in the future. The government would like India to be a competitive refining destination with
significant refined product exports, particularly to Asia.
In 2002 the government attempted to phase out domestic refined product price subsidies by
replacing the administered price mechanism with a new market-determined price mechanism,
benchmarked to international oil prices. But domestic prices of oil products such as diesel, liquefied
petroleum gas (LPG), and kerosene have been heavily subsidized over the period analyzed. The cost of
the subsidies is shared by the upstream and downstream NOCs and the government, with the NOCs
bearing most of the burden (Kojima 2009). Predominantly upstream NOCs such as the ONGC
subsidize refiners’ losses by providing discounts on crude oil sales. Since 2004 it is estimated that the
ONGC provided about $20 billion in price subsidies through discounted sales of oil (Katakey 2009).
The persistent use by the government of domestic refined product price subsidies explains the
dominance of state-owned enterprises in the refining sector. The few private companies that operate in
India have a clear export focus in order to avoid suffering significant financial losses in the domestic
market.
-
500
1,000
1,500
2,000
2,500
3,000
3,500 India Oil Production, Consumption
Oil Production ('000 b/d)
Oil Consumption ('000 b/d)
-
200
400
600
800
1,000
1,200
1,400
1,600 India Natural Gas Production, Consumption
Natural Gas Production (BCF)
Natural Gas Consumption (BCF)
26
Value Creation Index
Operational performance
Operational performance indicators ONGC
5-Yr Avg.,
All NOCs 2004 2005 2006 2007 2008 5-Yr
Avg
E&P Production Growth (%) 0.20 -4.34 3.20 0.26 -2.84 -0.7 10.4
Reserves Replacement Rate (%) 72.96 27.20 151.16 137.37 90.98 95.8 95.8
Refinery Utilization Rate (%) 123.71 124.92 129.20 129.35 129.75 127.4 90.3
Output/total assets (BOE/000$) 30.18 25.97 23.29 17.44 17.20 22.6 16.2
Output/employees (000 BOE) 13.25 13.35 14.15 14.53 14.19 13.8 20.6
Source: Authors, CEE.
Note: boe = barrel of oil equivalent.
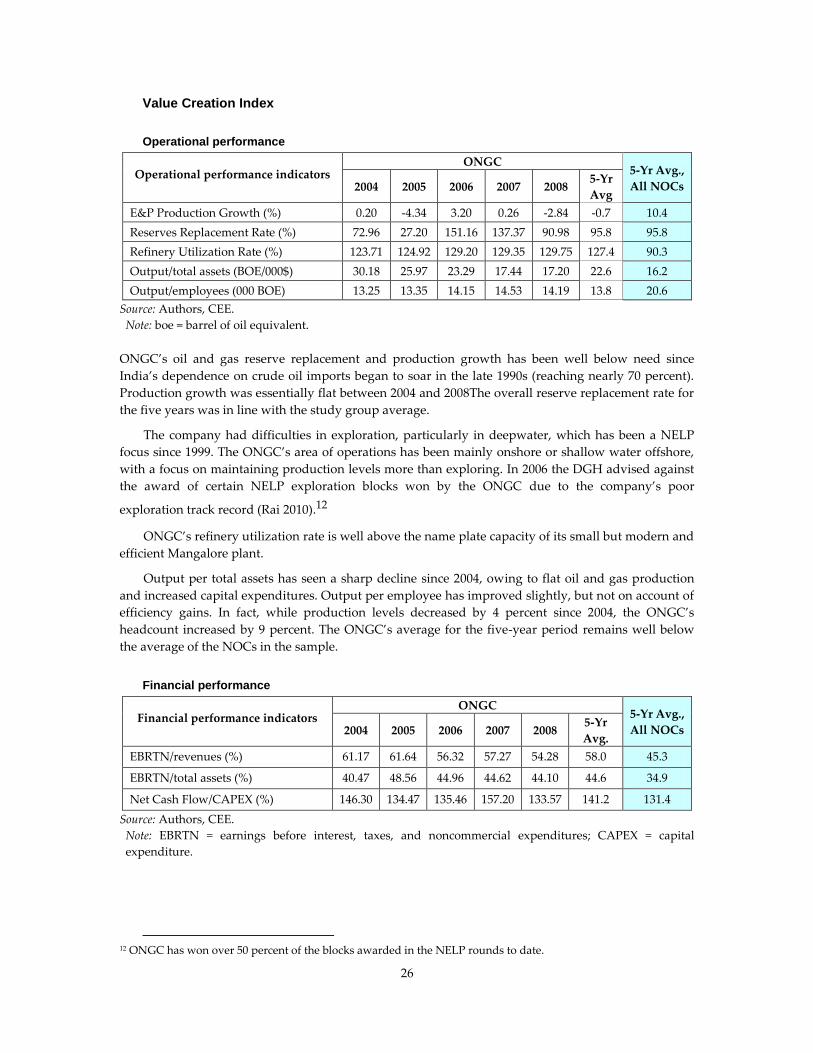
ONGC’s oil and gas reserve replacement and production growth has been well below need since
India’s dependence on crude oil imports began to soar in the late 1990s (reaching nearly 70 percent).
Production growth was essentially flat between 2004 and 2008The overall reserve replacement rate for
the five years was in line with the study group average.
The company had difficulties in exploration, particularly in deepwater, which has been a NELP
focus since 1999. The ONGC’s area of operations has been mainly onshore or shallow water offshore,
with a focus on maintaining production levels more than exploring. In 2006 the DGH advised against
the award of certain NELP exploration blocks won by the ONGC due to the company’s poor
exploration track record (Rai 2010).12
ONGC’s refinery utilization rate is well above the name plate capacity of its small but modern and
efficient Mangalore plant.
Output per total assets has seen a sharp decline since 2004, owing to flat oil and gas production
and increased capital expenditures. Output per employee has improved slightly, but not on account of
efficiency gains. In fact, while production levels decreased by 4 percent since 2004, the ONGC’s
headcount increased by 9 percent. The ONGC’s average for the five-year period remains well below
the average of the NOCs in the sample.
Financial performance
Financial performance indicators ONGC
5-Yr Avg.,
All NOCs 2004 2005 2006 2007 2008 5-Yr
Avg.
EBRTN/revenues (%) 61.17 61.64 56.32 57.27 54.28 58.0 45.3
EBRTN/total assets (%) 40.47 48.56 44.96 44.62 44.10 44.6 34.9
Net Cash Flow/CAPEX (%) 146.30 134.47 135.46 157.20 133.57 141.2 131.4
Source: Authors, CEE.
Note: EBRTN = earnings before interest, taxes, and noncommercial expenditures; CAPEX = capital
expenditure.
12 ONGC has won over 50 percent of the blocks awarded in the NELP rounds to date.
27
For all of the company’s operational challenges, financial performance metrics are relatively strong
and, overall, above the NOC study group average. The ONGC’s earnings before taxes and
noncommercial expenditures (excluding price subsidies) as a percentage of revenues and total assets
have been healthy, but declining due to higher operating costs caused by expanding activities and
increasing employee compensation.
Even after accounting for the exponential growth of price subsidies (from $500 million in 2004 to
almost $8 billion in 2007), ONGC’s net operating cash flow after dividends comfortably covered a
capital expenditure program that doubled in size over the study period.
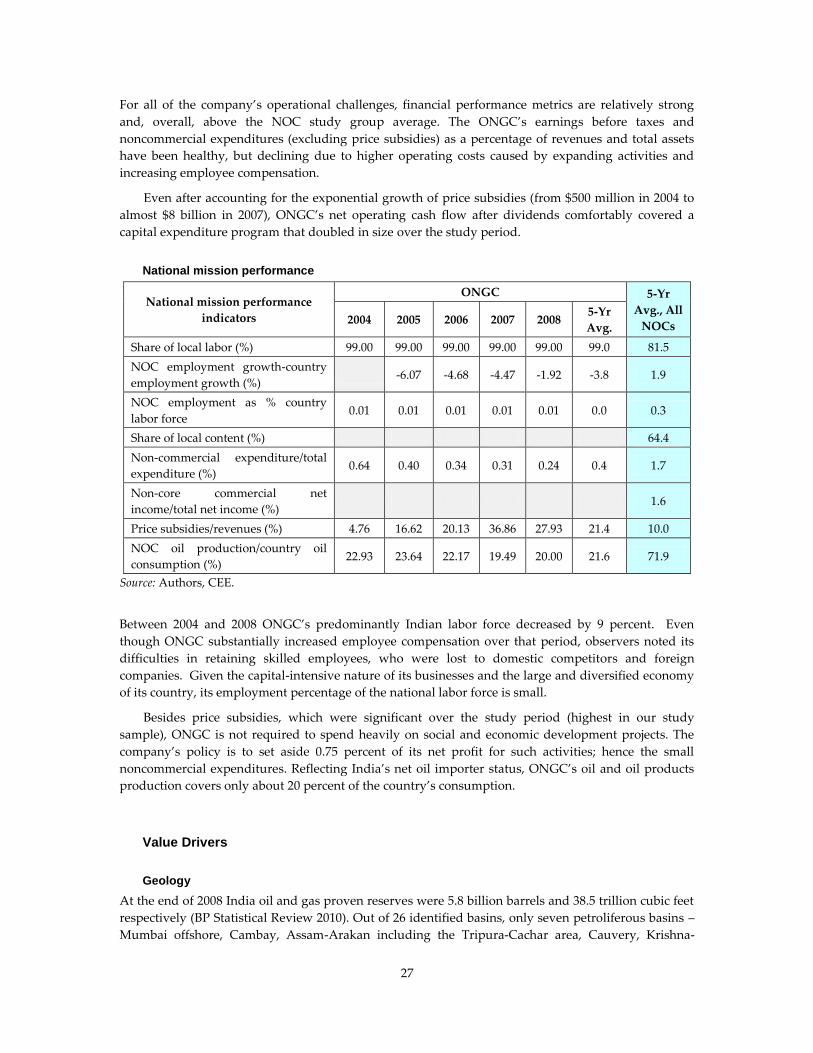
National mission performance
National mission performance
indicators
ONGC 5-Yr
Avg., All
NOCs 2004 2005 2006 2007 2008
5-Yr
Avg.
Share of local labor (%) 99.00 99.00 99.00 99.00 99.00 99.0 81.5
NOC employment growth-country
employment growth (%) -6.07 -4.68 -4.47 -1.92 -3.8 1.9
NOC employment as % country
labor force 0.01 0.01 0.01 0.01 0.01 0.0 0.3
Share of local content (%) 64.4
Non-commercial expenditure/total
expenditure (%) 0.64 0.40 0.34 0.31 0.24 0.4 1.7
Non-core commercial net
income/total net income (%) 1.6
Price subsidies/revenues (%) 4.76 16.62 20.13 36.86 27.93 21.4 10.0
NOC oil production/country oil
consumption (%) 22.93 23.64 22.17 19.49 20.00 21.6 71.9
Source: Authors, CEE.
Between 2004 and 2008 ONGC’s predominantly Indian labor force decreased by 9 percent. Even
though ONGC substantially increased employee compensation over that period, observers noted its
difficulties in retaining skilled employees, who were lost to domestic competitors and foreign
companies. Given the capital-intensive nature of its businesses and the large and diversified economy
of its country, its employment percentage of the national labor force is small.
Besides price subsidies, which were significant over the study period (highest in our study
sample), ONGC is not required to spend heavily on social and economic development projects. The
company’s policy is to set aside 0.75 percent of its net profit for such activities; hence the small
noncommercial expenditures. Reflecting India’s net oil importer status, ONGC’s oil and oil products
production covers only about 20 percent of the country’s consumption.
Value Drivers
Geology
At the end of 2008 India oil and gas proven reserves were 5.8 billion barrels and 38.5 trillion cubic feet
respectively (BP Statistical Review 2010). Out of 26 identified basins, only seven petroliferous basins –
Mumbai offshore, Cambay, Assam-Arakan including the Tripura-Cachar area, Cauvery, Krishna-
28
Godavari, Mahanadi and Rajasthan basins – have been put on commercial production. The remaining
basins are in different stages of exploration. Out of the total sedimentary area only 20 percent is
moderately to well explored, around 36 percent remains poorly explored to unexplored, and the rest is
under different stages of initial exploration (IBEF 2007).
Between 2000 and 2007, at least 97 ‚significant discoveries‛ were made in the country; the most
noteworthy are in the offshore east coast basins (Krishna-Godavari and Mahanadi-NEC basins) and in
the western offshore and onshore basins (Rajasthan, Cambay and Assam-Arakan basins).
State Context
In the past decade, India has managed to accelerate its economic growth, make improvement on most
of the Millennium development goals (MDGs), and maintained a vibrant democracy. India's GDP
grew at more than 9 percent per annum over the past four years with high rates of investment and
savings, and strong export growth. With high economic growth rates, India is a significant consumer
of energy resources. Oil accounts for nearly 24 percent of total energy consumption. But the country
relies on oil imports for over 70 percent of its consumption. Despite the steady increase in India’s
natural gas production, demand has outstripped supply and the country has been a net importer of
natural gas since 2004. A central element of India's foreign affairs agenda is 'energy diplomacy', which
relates to the need to secure energy supplies to meet rapidly growing industrial and consumer
demand.
With the exception of political stability, India’s Governance Indicators are above the regional
average and have been fairly stable over the period 2004-08. But regulatory quality and control of
corruption remain key concerns.
Petroleum Sector Organization and Governance
The petroleum sector is dominated by state-owned enterprises, and reforms to reduce state control
have been slow. The introduction of more competition into the Indian E&P sector through the NELP
reforms appears to have had a positive impact on ONGC. Although Indian NOCs dominate the
country’s oil and gas production, the threat of competition from global operators may be one of the
reasons behind ONGC’s move toward the adoption of technical and managerial international best
practices. In addition, the emergence of Reliance, an Indian private sector conglomerate, as ONGC’s
major competitor in domestic E&P allows comparative performance benchmarking of two Indian
competitors, increasing the pressure on the ONGC for improved performance.
ONGC has begun to form technology partnerships and joint ventures with international
companies that include BP, Arrow Energy, Weatherford, and Rocksource (Norway). In 2008 an
international petroleum engineering consultant, DeGolyer and MacNaughton, helped ONGC to
establish exploration performance benchmarks, and conducted postdrill analysis of 350 wells drilled
between 2002 and 2005 (Rai 2010). This exercise provided useful guidance to the NOC in stabilizing its
oil and gas production and reserves.
ONGC provides among the highest, if not the highest, level of price subsidies as a percentage of
revenues of all the companies in our study sample. Although this is a positive contribution to the
national mission, it illustrates the difficult trade-offs in balancing the NOC’s objectives.
NOC Strategy and Behavior
ONGC’s accelerated efforts to enhance domestic production and to find equity oil abroad helped the
company to stabilize oil and gas reserves and production. On the other hand, the company has used its
strong cash flow from operations to diversify into refining, petrochemicals, liquefied natural gas
29
(LNG), and alternative and renewable fuels. Such diversification could distract management from
improving its core exploration expertise.
ONGC’s research and development expenditures increased over the study period. The NOC
conducts most of its research and development through nine independently managed research centers,
but only two of them focus on exploration. In an effort to acquire technology and exploration prowess
as well as reserves and production growth, ONGC acquired the British-owned Imperial Energy for
almost $2 billion in late 2008, after a bidding war with Sinopec and Gazprom.
Industry observers claim that ONGC’s lack of exploration success does not indicate that India’s
hydrocarbon resources are mature; rather it is the reflection of the NOC’s area of expertise. Based on
recent discoveries, India has potential, but the size of these discoveries may be too small to be
attractive to and efficiently developed by ONGC. Indeed, it may make strategic sense for ONGC to
focus on bigger, higher impact opportunities abroad, perhaps making strategic alliances with
operators that have the desired deep water exploration and production capability.
NOC Corporate Governance
As a condition of special assistance loans from the World Bank and Asian Development Bank in the
early 1990s, the government committed to divesting 20 percent of its equity in ONGC. The move was
meant to improve the government’s net treasury position, and to improve the NOC’s efficiency by
submitting it to market discipline. Despite several equity offerings, the Indian government still
controls 84.2 percent of ONGC.
Although ONGC’s financial and organizational independence was greatly enhanced when it
gained Navratna status as a publicly owned company in India, the government exercises strong control
over ONGC’s daily affairs, including through hiring restrictions (Rai 2010).13
ONGC’s functional organization has been criticized for overlapping responsibilities and lack of
accountability. Observers note that performance-based employee compensation structures have not
been widely implemented (Rai 2010).
Reserve assessment and reporting is opaque which could obscure the company’s actual
performance on the critical objective of reserve growth. Reserves are not independently audited and
reserve replacement rates quoted by the company include proved, probable and possible reserves.
Conclusions
With respect to its financial performance and national mission objectives, ONGC appears to have
created significant value over the study period. Like many NOCs, ONGC’s core expertise seems to be
in production activities. This may be a natural response to its shareholders’ short-term drive to
increasing production levels, but if continued, it may pose threats to the NOC’s future sustainability.
ONGC faces challenges typical of other large oil companies with respect to the size of its opportunity
for impact and efficient development. It also faces all of the risks and uncertainties of the global oil and
gas industry. Outside India, ONGC needs access to resources (just as private oil companies do), must
manage rising costs, and must face the complications of geopolitics and conflict in the countries and
regions where it operates or explores. The considerable burden placed on ONGC by government-
mandated petroleum price subsidies further complicates the picture. Overall, the NOC seems to be
trying to achieve several of its shareholders’ conflicting objectives at the same time. Perhaps a more
arm’s-length approach on the part of government would provide the NOC’s management necessary
space for strategic decision making.
13 ‚Navratna‛ status grants ONGC’s board of directors power over capital expenditures, technology acquisition,
strategic alliances, organizational restructuring, and investment of funds.
30
References
Consult Club (Kasturi & Khushboo), 2010. “Evolution of Oil & Gas Industry in India,”
http://www.iimcal.ac.in/community/consclub/reports/petroleum.doc
Energy Information Administration, 2009. India Country Analysis Brief, March, 2009
http://www.eia.doe.gov/emeu/cabs/India/pdf.pdf
India Brand Equity Foundation, 2007. “Oil and Gas: October 2007,” presentation www.ibef.org.
Ishida Hiroyuki, 2006. “Energy Situation and Policy in India.” Presentation available at
http://eneken.ieej.or.jp/en/data/pdf/357.pdf.
Katakey, Rakteen, 2009. ‚India Rejects Goldman Sachs Criticism on ONGC Subsidy,”
http://www.bloomberg.com/apps/news?pid=newsarchive&sid=a1S1lDPF8uC8
Kaul, Vijayendra N, 2001. ‚New Exploration Licensing Policy,” Press Information Bureau, Government of
India.
Kojima, Masami, 2009. “Government Response to Oil Price Volatility,” Extractive Industries for
Development Series #10, July 2009, The World Bank Group.
ONGC, 2004-2008. ONGC Annual Reports and presentations www.ongcindia.com
Rai, Varun, April 2010, “Adapting to Shifting Government Priorities: An Assessment of the
Performance and Strategy of India’s ONGC,” Program on Energy and Sustainable Development, Working
Paper #91, Stanford University http://pesd.stanford.edu.

31
4. Petróleos de Venezuela, S.A. (Venezuela)
Petróleos de Venezuela, S.A. (PDVSA), is an integrated petroleum company wholly owned by the government
of Venezuela. It is the world’s third-largest oil company, behind Saudi Aramco and ExxonMobil.
PDVSA is a holding company with a large number of affiliates, some of which focus on government-
directed programs outside the oil and gas sector. PDVSA’s operations are supervised by Venezuela’s Ministry
of Energy and Petroleum. The minister also serves as the president of PDVSA. The Ministry of Energy and
Petroleum establishes general policies and approves production levels, capital expenditures, and operating
budgets annually, while the board of directors (BOD) is responsible for implementing the policies established
by the government of Venezuela.
Since its establishment in 1975, the national oil company’s (NOC’s) role has gone through several
transformations, which have seen it evolve from a purely commercial operator to an influential player in sector
policy making to a provider of wide-ranging social and developmental services. But such adaptation and
flexibility comes at a cost. The NOC’s operational performance appears to show some strain, with erratic
capacity to replace its reserves, declining refinery utilization rates, and declining efficiency ratios. Financial
performance remained strong but declined over the period 2004 to 2008. Cash flow to finance the NOC’s
capital investment expansion also declined, and the debt-to-equity ratio deteriorated considerably. On the
other hand, the NOC achieved impressive results with respect to its national mission goals.
Company and country sector evolution
Business activities
PDVSA is responsible for the development of Venezuela’s hydrocarbon industry. Since 1978 it has been
responsible for the petrochemical sector, and in 1985 it was entrusted with the development of the country’s
coal resources located in Western Venezuela. The NOC oversees the exploration, production, refining, and
transportation and sales of hydrocarbons and products. Its activities are mainly domestic; international
investments are minor but strategic.
PDVSA is required by law to have a minimum 60 percent interest in any crude-oil-exploration and
production activity in Venezuela. Production activities with respect to natural gas, where there is no legal
requirement that the NOC have majority participation, have been led by private oil companies and are
located mainly offshore.
In the domestic downstream sector, the NOC operates all pipeline, storage, and cabotage operations,
including natural gas distribution and related activities (compression had been partially outsourced, but
those contracts were terminated). There are no natural gas storage facilities in Venezuela.
Following the nationalization of the power generation sector in 2007, PDVSA bought 82.14 percent of
Electricidad de Caracas from the AES Corporation. Subsequently its ownership share rose to 93.62 percent.
Internationally, the NOC has a number of cooperation agreements with other regional NOCs, in which it
assumes a minority stake. It also has interest in storage facilities and pipelines in the United States terminal
and storage facilities in the Bahamas, and owns the downstream company CITGO. In addition, it has
entered into small joint ventures in countries in the Caribbean and South America for retail sales of
petroleum products tied to the PetroCaribe and PetroAmerica initiatives. The LNG value chain and natural
gas exports are missing.

32
PDVSA: Equity ownership and organization
According to PSDA’s 2007 and 2008 financial reports, its most significant wholly-owned subsidiaries include:
PDVSA Petróleo, S.A., which undertakes exploration, extraction, transportation, manufacturing,
refining, storage, marketing, or any other activity relating to oil and other hydrocarbons in Venezuela.
Corporación Venezolana del Petróleo, S.A., which guides and manages all aspects relating to the
business that PDVSA may carry out with oil companies of national or foreign capital and is
responsible for maximizing the value of hydrocarbons for the Venezuelan state.
PDVSA Gas, S.A., which conducts exploration, extraction, recovery, storage, processing, and
industrialization activities of natural and liquid gas, both industrial and domestic, as well as
transportation, distribution, and sales.
Deltaven, S.A., which engages in the purchase, sale, import, export, supply, transportation, storage,
distribution, mixing, filling, and retail provision of products derived from hydrocarbons and assets for
use in the industrial, commercial, household, and transportation sectors.
PDVSA Agrícola, S.A., which is involved in production activities of raw materials of agricultural
nature for agrifood and agrienergy industrial processing.
PDV Holding, Inc. and its main subsidiary PDV America, Inc. (PDV America), which operate in the
United States. Their main activity is represented by CITGO Petroleum Corporation and its subsidiaries
(CITGO), wholly owned by PDV America. (PDV America also includes 50 percent of Chalmette
Refining through PDV Chalmette, Inc. and 50 percent of Merey Sweeny through PDV Sweeny, L.P.
These companies are associated with ExxonMobil Corporation and ConocoPhillips, respectively.)
In accordance with the strategic objectives and guidelines of the national government, the stockholder’s
meeting of PDVSA in 2007 authorized the purchase of shares of the following companies operating in the
electricity sector (assets held for sale and discontinued operations): C.A. La Electricidad de Caracas (EDC);
Sistema Eléctrico del Estado Nueva Esparta, C.A. (SENECA); C.A. Electricidad de Valencia (ELEVAL); and
C.A. Luz y Fuerza Eléctrica de Puerto Cabello (CALIFE).
PDVSA and Venezuela’s hydrocarbon sector: History
Venezuela holds the western hemisphere’s largest conventional proven oil reserves, estimated at 172 billion
barrels (as of year-end 2009), or 12.9 percent of the world’s proven oil reserves (BP statistical review 2010). The
country also holds 5.67 trillion cubic meters of proven natural gas reserves, which correspond to approximately
3 percent of the world’s natural gas reserves. Much of Venezuela’s resource endowment consists of extra-heavy
crude oil and bitumen deposits—most of which are situated in the Orinoco Belt—which require more
specialized and costly refining processes in order to obtain desirable end products such as gasoline and
aviation fuel.
As shown in Figure 4.1, Venezuela is a net exporter of crude oil. The petroleum industry consumes the
majority of Venezuela’s gross natural gas production, with the largest share of that consumption in the form of
gas re-injection to aid crude oil extraction. In addition to being a major supplier to the United States, Venezuela
also provides significant quantities of oil under the San Jose Accord to 11 Central American and Caribbean
nations under preferential terms. The San Jose Petroleum Accord was originally implemented in 1980 and is
renewed annually. The accord was expanded with the Caracas Energy Accord. Through these and other
mechanisms, such as PetroCaribe, Venezuela also supplies petroleum products to a number of nations in the
Caribbean region, on favorable terms.

33
Figure 4.1 – Venezuela crude oil and natural gas production and consumption
Source: Authors and CEE, based on data from U.S. Energy Information Administration (EIA), International Statistics.
Oil has been known and used in Venezuela since seepages were found on the shores of Lake Maracaibo
during the colonial period, which ended in 1810. The first formal concession for its exploitation, however, was
not awarded until mid-1865. A succession of grants followed during the nineteenth century, and the systematic
exploitation of the country’s reserves was then led by major foreign oil companies. The investment
environment was favorable in Venezuela: E&P costs were substantially lower than in the United States (then
the major producer), and the country’s political stability compared well with the rest of Latin America.
Venezuela had a concessionary system whereby most oil companies could operate, regardless of their
nationality. In 1943 the parliament enacted the first integrated hydrocarbon law. A few years later, changes to
the fiscal regime were introduced that reflected a new 50-50 arrangement introduced by Agip (the Italian NOC,
in Egypt). In 1959 the government decided to suspend the granting of further concessions, and a few months
later it created the Corporación Venezolana de Petroleo (CVP), the first national oil company. The CVP was to
operate in competition with foreign concessionaires in the country and was to be the official instrument of the
country’s petroleum policy. The Service Contracts system was introduced in 1967 through a partial reform of
the Hydrocarbons Law.
Corporate taxes were gradually increased, and a debate started on whether the service contracts were the
best instrument to develop the country’s reserves, since private companies’ production and investments
appeared to be declining. As a result, in 1971 the Hydrocarbons Reversion Law was enacted, aimed at ensuring
the continuity and efficiency of the country's oil activities. The law provided for all industry assets to revert to
the nation upon the expiration of the concession (which was to occur in 1983), and for the government to
appropriate all concessions not being exploited.
In 1975, the Organic Law Reserving to the State the Industry and Commerce of Hydrocarbons was enacted,
allowing the government to take full control of the oil industry on January 1, 1976. The nationalization of the
industry required the creation of an entity that would take over existing operations. A holding company,
PDVSA, was established to coordinate, supervise, control, and plan the activities of its subsidiaries made up of
former operating companies. Following nationalization of the oil industry, the rights to all hydrocarbons were
reserved to the Venezuelan state. The Ministry of Energy and Mines was given responsibility for setting oil
policy and oversight of the hydrocarbons sector, while PDVSA was established to develop the country’s
hydrocarbon resources.
PDVSA, the holding company, was responsible for the strategic planning, coordination, and supervision
that would lead to the achievement of the Ministry of Energy and Mines’s policies, while PDVSA’s operating
subsidiaries were charged with the execution of these plans and programs. PDVSA, the holding company, was
responsible for the strategic planning, coordination, and supervision that would lead to the achievement of the
-
500
1,000
1,500
2,000
2,500
3,000
3,500
4,000 Venezuela Oil Production, Consumption
Oil Production ('000 b/d)
Oil Consumption ('000 b/d)
-
500
1,000
1,500
2,000
2,500
3,000 Venezuela Natural Gas Production, Consumption
Natural Gas Production (BCF)
Natural Gas Consumption (BCF)
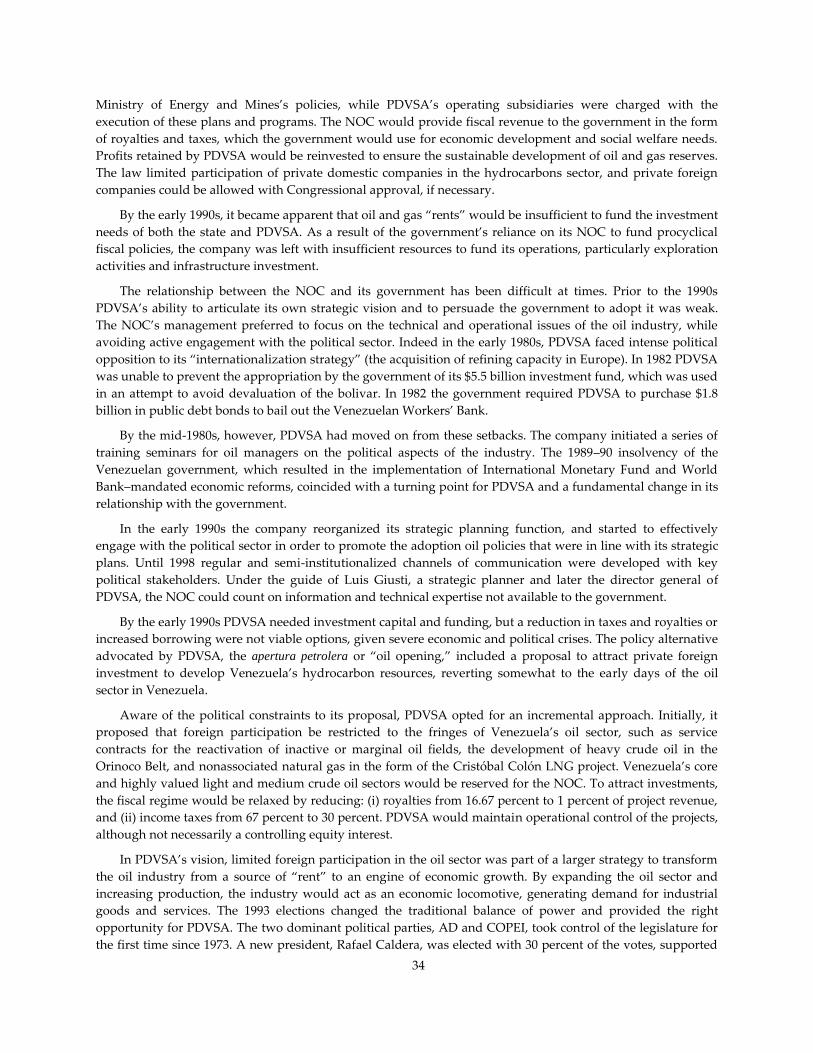
34
Ministry of Energy and Mines’s policies, while PDVSA’s operating subsidiaries were charged with the
execution of these plans and programs. The NOC would provide fiscal revenue to the government in the form
of royalties and taxes, which the government would use for economic development and social welfare needs.
Profits retained by PDVSA would be reinvested to ensure the sustainable development of oil and gas reserves.
The law limited participation of private domestic companies in the hydrocarbons sector, and private foreign
companies could be allowed with Congressional approval, if necessary.
By the early 1990s, it became apparent that oil and gas ‚rents‛ would be insufficient to fund the investment
needs of both the state and PDVSA. As a result of the government’s reliance on its NOC to fund procyclical
fiscal policies, the company was left with insufficient resources to fund its operations, particularly exploration
activities and infrastructure investment.
The relationship between the NOC and its government has been difficult at times. Prior to the 1990s
PDVSA’s ability to articulate its own strategic vision and to persuade the government to adopt it was weak.
The NOC’s management preferred to focus on the technical and operational issues of the oil industry, while
avoiding active engagement with the political sector. Indeed in the early 1980s, PDVSA faced intense political
opposition to its ‚internationalization strategy‛ (the acquisition of refining capacity in Europe). In 1982 PDVSA
was unable to prevent the appropriation by the government of its $5.5 billion investment fund, which was used
in an attempt to avoid devaluation of the bolivar. In 1982 the government required PDVSA to purchase $1.8
billion in public debt bonds to bail out the Venezuelan Workers’ Bank.
By the mid-1980s, however, PDVSA had moved on from these setbacks. The company initiated a series of
training seminars for oil managers on the political aspects of the industry. The 1989–90 insolvency of the
Venezuelan government, which resulted in the implementation of International Monetary Fund and World
Bank–mandated economic reforms, coincided with a turning point for PDVSA and a fundamental change in its
relationship with the government.
In the early 1990s the company reorganized its strategic planning function, and started to effectively
engage with the political sector in order to promote the adoption oil policies that were in line with its strategic
plans. Until 1998 regular and semi-institutionalized channels of communication were developed with key
political stakeholders. Under the guide of Luis Giusti, a strategic planner and later the director general of
PDVSA, the NOC could count on information and technical expertise not available to the government.
By the early 1990s PDVSA needed investment capital and funding, but a reduction in taxes and royalties or
increased borrowing were not viable options, given severe economic and political crises. The policy alternative
advocated by PDVSA, the apertura petrolera or ‚oil opening,‛ included a proposal to attract private foreign
investment to develop Venezuela’s hydrocarbon resources, reverting somewhat to the early days of the oil
sector in Venezuela.
Aware of the political constraints to its proposal, PDVSA opted for an incremental approach. Initially, it
proposed that foreign participation be restricted to the fringes of Venezuela’s oil sector, such as service
contracts for the reactivation of inactive or marginal oil fields, the development of heavy crude oil in the
Orinoco Belt, and nonassociated natural gas in the form of the Cristóbal Colón LNG project. Venezuela’s core
and highly valued light and medium crude oil sectors would be reserved for the NOC. To attract investments,
the fiscal regime would be relaxed by reducing: (i) royalties from 16.67 percent to 1 percent of project revenue,
and (ii) income taxes from 67 percent to 30 percent. PDVSA would maintain operational control of the projects,
although not necessarily a controlling equity interest.
In PDVSA’s vision, limited foreign participation in the oil sector was part of a larger strategy to transform
the oil industry from a source of ‚rent‛ to an engine of economic growth. By expanding the oil sector and
increasing production, the industry would act as an economic locomotive, generating demand for industrial
goods and services. The 1993 elections changed the traditional balance of power and provided the right
opportunity for PDVSA. The two dominant political parties, AD and COPEI, took control of the legislature for
the first time since 1973. A new president, Rafael Caldera, was elected with 30 percent of the votes, supported
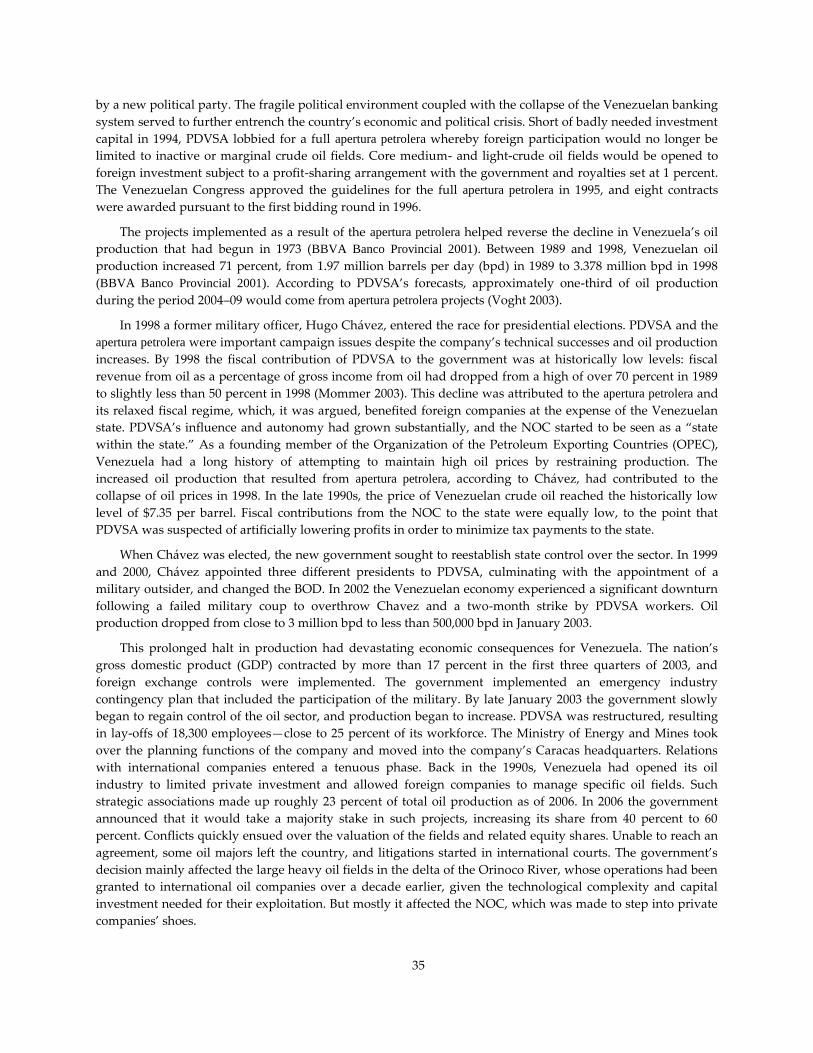
35
by a new political party. The fragile political environment coupled with the collapse of the Venezuelan banking
system served to further entrench the country’s economic and political crisis. Short of badly needed investment
capital in 1994, PDVSA lobbied for a full apertura petrolera whereby foreign participation would no longer be
limited to inactive or marginal crude oil fields. Core medium- and light-crude oil fields would be opened to
foreign investment subject to a profit-sharing arrangement with the government and royalties set at 1 percent.
The Venezuelan Congress approved the guidelines for the full apertura petrolera in 1995, and eight contracts
were awarded pursuant to the first bidding round in 1996.
The projects implemented as a result of the apertura petrolera helped reverse the decline in Venezuela’s oil
production that had begun in 1973 (BBVA Banco Provincial 2001). Between 1989 and 1998, Venezuelan oil
production increased 71 percent, from 1.97 million barrels per day (bpd) in 1989 to 3.378 million bpd in 1998
(BBVA Banco Provincial 2001). According to PDVSA’s forecasts, approximately one-third of oil production
during the period 2004–09 would come from apertura petrolera projects (Voght 2003).
In 1998 a former military officer, Hugo Chávez, entered the race for presidential elections. PDVSA and the
apertura petrolera were important campaign issues despite the company’s technical successes and oil production
increases. By 1998 the fiscal contribution of PDVSA to the government was at historically low levels: fiscal
revenue from oil as a percentage of gross income from oil had dropped from a high of over 70 percent in 1989
to slightly less than 50 percent in 1998 (Mommer 2003). This decline was attributed to the apertura petrolera and
its relaxed fiscal regime, which, it was argued, benefited foreign companies at the expense of the Venezuelan
state. PDVSA’s influence and autonomy had grown substantially, and the NOC started to be seen as a ‚state
within the state.‛ As a founding member of the Organization of the Petroleum Exporting Countries (OPEC),
Venezuela had a long history of attempting to maintain high oil prices by restraining production. The
increased oil production that resulted from apertura petrolera, according to Chávez, had contributed to the
collapse of oil prices in 1998. In the late 1990s, the price of Venezuelan crude oil reached the historically low
level of $7.35 per barrel. Fiscal contributions from the NOC to the state were equally low, to the point that
PDVSA was suspected of artificially lowering profits in order to minimize tax payments to the state.
When Chávez was elected, the new government sought to reestablish state control over the sector. In 1999
and 2000, Chávez appointed three different presidents to PDVSA, culminating with the appointment of a
military outsider, and changed the BOD. In 2002 the Venezuelan economy experienced a significant downturn
following a failed military coup to overthrow Chavez and a two-month strike by PDVSA workers. Oil
production dropped from close to 3 million bpd to less than 500,000 bpd in January 2003.
This prolonged halt in production had devastating economic consequences for Venezuela. The nation’s
gross domestic product (GDP) contracted by more than 17 percent in the first three quarters of 2003, and
foreign exchange controls were implemented. The government implemented an emergency industry
contingency plan that included the participation of the military. By late January 2003 the government slowly
began to regain control of the oil sector, and production began to increase. PDVSA was restructured, resulting
in lay-offs of 18,300 employees—close to 25 percent of its workforce. The Ministry of Energy and Mines took
over the planning functions of the company and moved into the company’s Caracas headquarters. Relations
with international companies entered a tenuous phase. Back in the 1990s, Venezuela had opened its oil
industry to limited private investment and allowed foreign companies to manage specific oil fields. Such
strategic associations made up roughly 23 percent of total oil production as of 2006. In 2006 the government
announced that it would take a majority stake in such projects, increasing its share from 40 percent to 60
percent. Conflicts quickly ensued over the valuation of the fields and related equity shares. Unable to reach an
agreement, some oil majors left the country, and litigations started in international courts. The government’s
decision mainly affected the large heavy oil fields in the delta of the Orinoco River, whose operations had been
granted to international oil companies over a decade earlier, given the technological complexity and capital
investment needed for their exploitation. But mostly it affected the NOC, which was made to step into private
companies’ shoes.
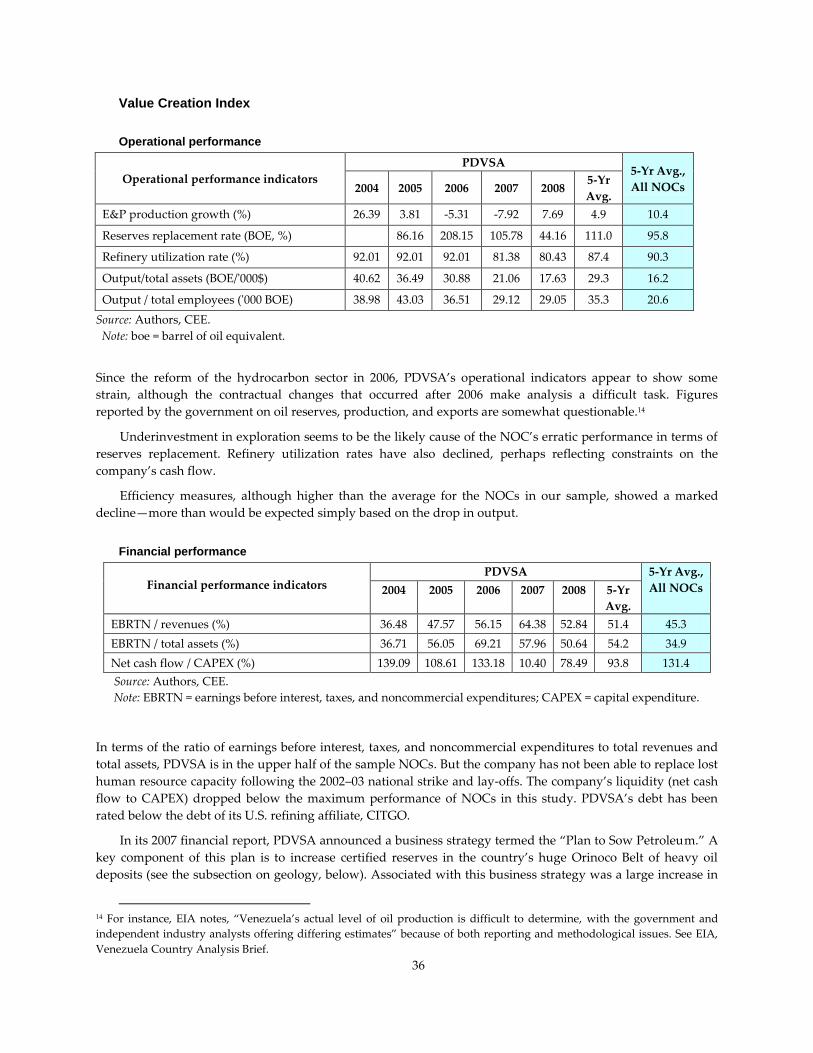
36
Value Creation Index
Operational performance
Operational performance indicators
PDVSA 5-Yr Avg.,
All NOCs 2004 2005 2006 2007 2008 5-Yr
Avg.
E&P production growth (%) 26.39 3.81 -5.31 -7.92 7.69 4.9 10.4
Reserves replacement rate (BOE, %) 86.16 208.15 105.78 44.16 111.0 95.8
Refinery utilization rate (%) 92.01 92.01 92.01 81.38 80.43 87.4 90.3
Output/total assets (BOE/'000$) 40.62 36.49 30.88 21.06 17.63 29.3 16.2
Output / total employees ('000 BOE) 38.98 43.03 36.51 29.12 29.05 35.3 20.6
Source: Authors, CEE.
Note: boe = barrel of oil equivalent.
Since the reform of the hydrocarbon sector in 2006, PDVSA’s operational indicators appear to show some
strain, although the contractual changes that occurred after 2006 make analysis a difficult task. Figures
reported by the government on oil reserves, production, and exports are somewhat questionable.14
Underinvestment in exploration seems to be the likely cause of the NOC’s erratic performance in terms of
reserves replacement. Refinery utilization rates have also declined, perhaps reflecting constraints on the
company’s cash flow.
Efficiency measures, although higher than the average for the NOCs in our sample, showed a marked
decline—more than would be expected simply based on the drop in output.
Financial performance
Financial performance indicators PDVSA 5-Yr Avg.,
All NOCs 2004 2005 2006 2007 2008 5-Yr
Avg.
EBRTN / revenues (%) 36.48 47.57 56.15 64.38 52.84 51.4 45.3
EBRTN / total assets (%) 36.71 56.05 69.21 57.96 50.64 54.2 34.9
Net cash flow / CAPEX (%) 139.09 108.61 133.18 10.40 78.49 93.8 131.4
Source: Authors, CEE.
Note: EBRTN = earnings before interest, taxes, and noncommercial expenditures; CAPEX = capital expenditure.
In terms of the ratio of earnings before interest, taxes, and noncommercial expenditures to total revenues and
total assets, PDVSA is in the upper half of the sample NOCs. But the company has not been able to replace lost
human resource capacity following the 2002–03 national strike and lay-offs. The company’s liquidity (net cash
flow to CAPEX) dropped below the maximum performance of NOCs in this study. PDVSA’s debt has been
rated below the debt of its U.S. refining affiliate, CITGO.
In its 2007 financial report, PDVSA announced a business strategy termed the ‚Plan to Sow Petroleum.‛ A
key component of this plan is to increase certified reserves in the country’s huge Orinoco Belt of heavy oil
deposits (see the subsection on geology, below). Associated with this business strategy was a large increase in
14 For instance, EIA notes, ‚Venezuela’s actual level of oil production is difficult to determine, with the government and
independent industry analysts offering differing estimates‛ because of both reporting and methodological issues. See EIA,
Venezuela Country Analysis Brief.
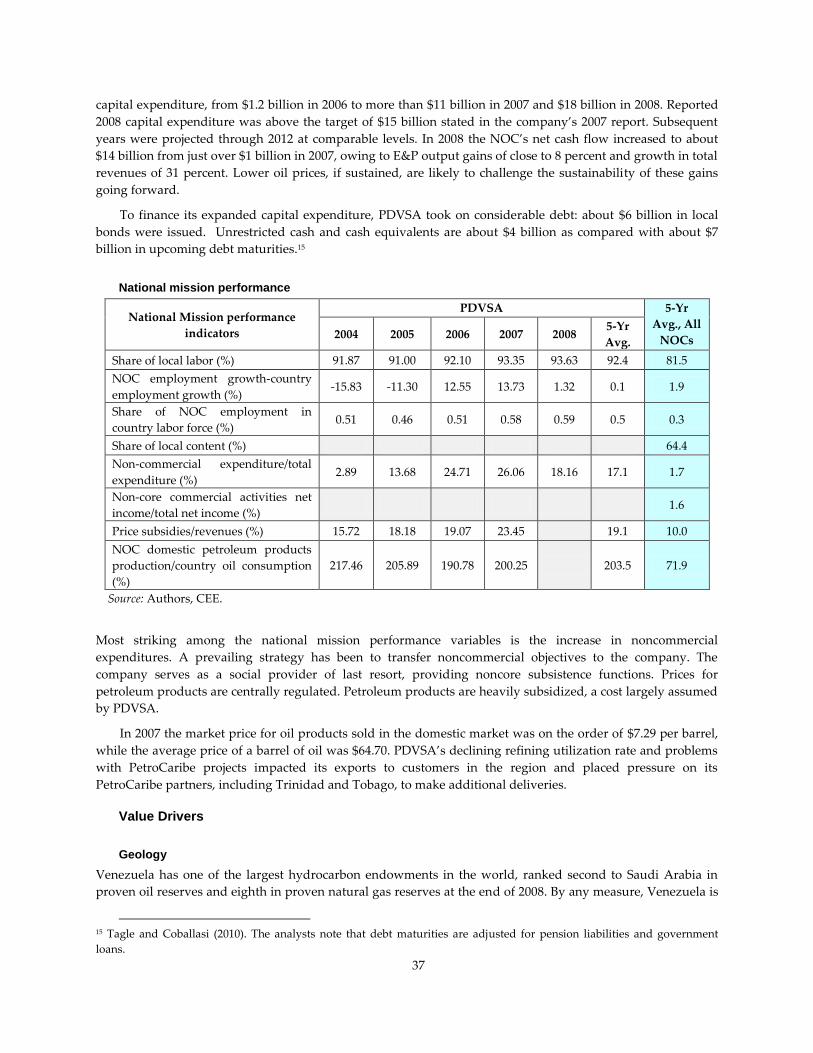
37
capital expenditure, from $1.2 billion in 2006 to more than $11 billion in 2007 and $18 billion in 2008. Reported
2008 capital expenditure was above the target of $15 billion stated in the company’s 2007 report. Subsequent
years were projected through 2012 at comparable levels. In 2008 the NOC’s net cash flow increased to about
$14 billion from just over $1 billion in 2007, owing to E&P output gains of close to 8 percent and growth in total
revenues of 31 percent. Lower oil prices, if sustained, are likely to challenge the sustainability of these gains
going forward.
To finance its expanded capital expenditure, PDVSA took on considerable debt: about $6 billion in local
bonds were issued. Unrestricted cash and cash equivalents are about $4 billion as compared with about $7
billion in upcoming debt maturities.15
National mission performance
National Mission performance
indicators
PDVSA 5-Yr
Avg., All
NOCs 2004 2005 2006 2007 2008 5-Yr
Avg.
Share of local labor (%) 91.87 91.00 92.10 93.35 93.63 92.4 81.5
NOC employment growth-country
employment growth (%) -15.83 -11.30 12.55 13.73 1.32 0.1 1.9
Share of NOC employment in
country labor force (%) 0.51 0.46 0.51 0.58 0.59 0.5 0.3
Share of local content (%) 64.4
Non-commercial expenditure/total
expenditure (%) 2.89 13.68 24.71 26.06 18.16 17.1 1.7
Non-core commercial activities net
income/total net income (%) 1.6
Price subsidies/revenues (%) 15.72 18.18 19.07 23.45 19.1 10.0
NOC domestic petroleum products
production/country oil consumption
(%)
217.46 205.89 190.78 200.25 203.5 71.9
Source: Authors, CEE.
Most striking among the national mission performance variables is the increase in noncommercial
expenditures. A prevailing strategy has been to transfer noncommercial objectives to the company. The
company serves as a social provider of last resort, providing noncore subsistence functions. Prices for
petroleum products are centrally regulated. Petroleum products are heavily subsidized, a cost largely assumed
by PDVSA.
In 2007 the market price for oil products sold in the domestic market was on the order of $7.29 per barrel,
while the average price of a barrel of oil was $64.70. PDVSA’s declining refining utilization rate and problems
with PetroCaribe projects impacted its exports to customers in the region and placed pressure on its
PetroCaribe partners, including Trinidad and Tobago, to make additional deliveries.
Value Drivers
Geology
Venezuela has one of the largest hydrocarbon endowments in the world, ranked second to Saudi Arabia in
proven oil reserves and eighth in proven natural gas reserves at the end of 2008. By any measure, Venezuela is
15 Tagle and Coballasi (2010). The analysts note that debt maturities are adjusted for pension liabilities and government
loans.

38
favored by inherent geology and offers oil and gas attributes that could provide for tremendous value creation.
Unlike its other top-ranked peers with respect to reserves, Venezuela was ranked fifteenth in oil equivalent
production for 2009.16
As the EIA notes: ‚Venezuela contains billions of barrels in extra-heavy crude oil and bitumen deposits,
most of which are situated in the Orinoco Belt in central Venezuela‛ (EIA, 2010). According to a study released
by the U.S. Geological Survey (USGS), the mean estimate of recoverable oil resources from the Orinoco Belt is
513 billion barrels of crude oil – if costs are not a constraint – and 135 tcf of natural gas (USGS 2010).
As noted earlier, in 2006 the government restructured the former strategic associations that controlled the
Orinoco Belt oil production. The associations were reorganized into empresa mixtas. PDVSA incurred a liability
of $1.7 billion for the former joint ventures operated by international companies that declined to participate in
the program (ConocoPhillips and ExxonMobil), and paid a settlement of $1.1 billion to Total and Statoil, who
agreed to participate but had to relinquish interests to PDVSA in accordance with the new statutes (2008
financial report).17
Most of the companies participating in the new joint ventures are foreign national companies such as
Petrobras (Brazil), Petropars (Iran), CNPC (China), and ONGC (India). The fields tend to be small and
marginal, with steep decline rates. The strategic associations convert the extra heavy crude and bitumen from
approximately 9° API to lighter, sweeter crude, known as syncrude. According to industry estimates, four
projects have installed production capacity of about 600,000 bpd of syncrude (EIA, 2010).
In its Plan to Sow Petroleum, PDVSA also announced the magna reserva project, the goal of which was to
quantify and certify reserves in the Boyacá, Junín (with ENI holding 40 percent), and the Ayacucho and
Carabobo blocks of the Orinoco Oil Belt (with Chevron holding 34 percent of Carabobo 3 and Spain’s Repsol
holding 11 percent of Carabobo 1). Thus far, a 22.5 percent increase in reserves has been reported, with a
projected 316 billion barrels of proven reserves (as compared with the current 172). This would put Venezuela
ahead of Saudi Arabia’s reported 265 billion barrels of proven reserves. But numerous questions have been
raised about the Orinoco reserves statements.18
State context
Venezuela scores poorly in terms of the World Governance Indicators, especially with respect to rule of law.
The country has become increasingly dependent on hydrocarbon revenues, which have grown as a percent of
GDP from roughly 15 percent in 2004 to 33 percent in 2008. Rising oil prices until 2008 offset the effect of
declining production. In addition, declining production led to declining production costs (since higher-cost
areas did not receive investment), resulting in windfalls to government accounts.
Of considerable importance to Venezuela is its role as a founding member of the OPEC and the influence it
continues to exert. Because of the higher cost of Venezuela’s Orinoco production and its large dependence
upon hydrocarbon export revenues, Venezuela tends to favor the OPEC policies that support higher price
16 Rankings based on compilation of data from various sources, including the EIA (http://www.eia.doe.gov) and BP Annual
Statistical Review (http://www.bp.com). 17 ExxonMobil entered arbitration proceedings against Venezuela, with US$10 billion in claims and a request to freeze assets.
The case continues; in June 2010 the panel ruled that Exxon could proceed in its litigation. See Ordonez and Molinksi (2010).
Other companies are also seeking claims against Venezuela, including service companies that had equipment and other
assets expropriated. See sections on state context and petroleum sector governance. 18 See Wallis (2010). An expert commented: ‚There are ‘political’ reserves. The U.S. Securities and Exchange Commission
would not call them reserves much less proven reserves until a project has been sanctioned and wells drilled. For now they
are resources that will not be produced for a very long time. Breakeven prices with a typical discount rate of 10 percent are
on the order of US$20 barrel before royalty and taxes. That would make the projects viable at prices greater than US$40
barrel. However the rate of return of such a project would be on the low end given the large investment in the midstream
upgraders ($10 billion per 100,000 barrel per day of production).‛

39
levels. On the other hand, Saudi Arabia (which has traditionally played the role of swing producer) and most
OPEC members favor policies that support global demand for their commodity exports. The growth in Iraqi oil
production and the revenues lost by OPEC members as oil prices have fallen may exacerbate tension.
In addition to the expropriation of the former Orinoco strategic associations, Venezuela also expropriated
approximately 76 oil service companies in May 2009. This followed the Drilling Rig Nationalization Plan by
two years and included taking control of international oil service company assets.19 While the country’s vast, if
costly, resource endowment should attract sizable investment, uncertainty with regards to contractual and
property rights may deter it.
Petroleum sector organization and governance
Venezuela’s petroleum sector is largely state controlled. Technically, regulatory functions are divided between
PDVSA and the ministry. Hence, there is no independent regulatory body for the oil sector. An attempt was
made to establish a regulator for the natural gas sector, which ultimately was incorporated into the ministry.
PDVSA controls about 80 percent of Venezuela’s oil equivalent production and essentially all refining
capacity, and contributes about a third of its total revenues in fiscal contributions to the state.
Venezuela ranked third in the Fraser Institute Global Petroleum Survey 2009 for the number of factors
serving as a deterrent to upstream investment. The fiscal regime limits investment in certain high-cost areas or
areas that require large investments with long payout periods. The imposition of new windfall taxes is an
additional challenge. In 2008 the government enacted a windfall profits tax of 50 percent when Brent crude
rises above $70 per barrel and 100 percent when it rises above $100 (Gallegos and Luhnow 2008). But
Venezuela’s vast resource base includes extra-heavy crude and offshore natural gas, and current fiscal regimes
do not accommodate the huge investment that their development would require. Indeed, since the
introduction of the new fiscal regime, there have been no new projects with significant investment by either
PDVSA or its partners.
Company strategy and behavior
PDVSA’s upstream capital investment has remained relatively robust at about 60 percent of total capital
investment, and grew to 70 percent of the total in 2008. The company continues to implement its Plan to Sow
Petroleum to sustain and expand hydrocarbon revenues. Refining expenditures declined, however, from about
20 percent of total capital expenditure to 9 percent in 2008. This is largely a function of heavily subsidized
petroleum products. While PDVSA continues to maintain joint ventures, the quality of its partnerships
deteriorated with the exit of many international companies following the government’s intervention in PDVSA
and its expropriation of many existing contracts.
It would seem that the NOC is having problems rebuilding its workforce following the 2002–03
reorganization. Agreements were signed with Venezuelan institutions for higher education to provide two-
year undergraduate degrees for workers. English programs were contracted with universities in Jamaica and
Barbados.
19 In PDVSA’s 2007 financial report, the nationalization plan is explained as follows: ‚Considering that the Venezuelan oil
business has been marked by technological dependence, after 30 years of nationalization of the Oil Industry and that, for
strategic reasons and domestic security, Venezuela must have its own fleet of equipment and drilling rigs to decrease
vulnerability arising from hiring third parties, in 2007 a nationalization plan of drilling rigs was launched as well as new
PDVSA subsidiaries were created, namely, PDVSA Industrial and PDVSA Servicios, whose conceptualization, development,
governing bodies and staff began its operations with the staff of PDVSA.‛ The May 2009 expropriations followed threats by
service companies to suspend operations until back invoices were paid. PDVSA accused the operators of overcharging
(Barillas 2009). The service company claims are also in arbitration (Morgan 2010).

40
Corporate governance
The corporate governance structure of the NOC implies no separation of responsibilities between the minister
of energy and mines as policy maker and representative of the ownership rights of the state, and the NOC as a
commercial entity. The minister of energy and mines is the CEO and Chairman of the Board of Directors
(BOD). Of the 10 members of the BOD, two are independent directors.
All BOD members are appointed by the President of Venezuela for a period of two years by presidential
decree. They can be removed at any time and can be reappointed indefinitely by the president.
The BOD is responsible for calling the annual and special meetings of shareholders, preparing and
presenting the operational results of the company at the end of the fiscal year, and formulating and executing
the operational, economic, financial and social strategies of the company. The company’s budget proposal is
first approved at the shareholder meeting. The minister of energy acts as the sole agent for all shareholders.
The actual independence and decision making power of the BOD seems quite limited. The NOC financial
and investment autonomy is basically minimal. This type of governance arrangement, although clearly
effective in ensuring that the NOC’s strategy reflects the desire of its government and that information
asymmetries between the government and the NOC are minimized, is unlikely to incentivize accountability
and transparency.
Since 2005 audited data are no longer submitted to the U.S. Securities and Exchange Commission (SEC).
Rather, annual reports are now issued and audited by the company. Reporting noncommercial activities has
become an important priority for the company as reflected in its annual report. Noncommercial obligations are
estimated, in the most recent annual report, to be on the order of $14 billion annually.
Conclusions
A large reserves base and a more or less sustained oil price have allowed the NOC to support a drastic change
in its priorities and objectives. But recent government reforms have shifted a larger share of the E&P risk to the
NOC by reducing foreign investments and the NOC’s ability to partner with private companies. Given the
limited amount of financial and technical resources available to most NOCs, these measures may result in
erratic operational and financial performance, which may threaten the sustainability of the PDVSA and its
national mission.

41
References
Barillas, Martin. 2009. ‚Expropriations in Venezuela Threaten Oil Supply.‛ Spero News, May 10.
BBVA Banco Provincial. 2001. El Reto de Venezuela: De Una Economía Petrolera Hacia Una Diversificada, Junio.
CEE-UT (Center for Energy Economics, University of Texas). From ‚Apertura Petrolera to Apertura Gas
Natural? The Case of Venezuela.‛ http://www.beg.utexas.edu/energyecon/publications.
EIA (U.S. Energy Information Administration). Venezuela Country Analysis Brief.
http://www.eia.doe.gov/emeu/cabs/Venezuela/Background.html.
Gallegos, Raul, and David Luhnow. 2008. ‚Venezuela Passes New Oil Tax.‛ The Wall Street Journal, April 16.
Ordonez, Isabel, and Dan Molinksi. 2010. ‚Exxon Comes Out Ahead in Arbitration Despite Venezuela’s
Claims.‛ Dow Jones Newswires, June 25. http://online.wsj.com/article/BT-CO-20100625-704543.html.
Mommer, Bernard. 2002. “Subversive Oil.” In Steve Ellner and Daniel Hellinger (eds.) Venezuelan Politics in the Chávez
Era: Polarization and Social Conflict, Lynne Rienner.
Morgan, Jeremy. 2010. ‚Venezuela Seen Paying High Price for Chavez Expropriation of Oil Contractors.‛ Latin
American Herald Tribune, July 16. http://www.laht.com/article.asp?ArticleId=334300&CategoryId=10718.
Nevaer, Louis. 2007. ‚Mexico-Venezuela Clash over Oil as Foreign Aid.‛ New America Media (June).
Tagle, Enrique Gomez, and Jose Coballasi. 2010. ‚Research Update: PDVSA Outlook Revised to Stable from
Negative; ‘B+’ Corporate Credit Rating Affirmed.‛ Standard & Poor’s Global Credit Portal, Ratings Direct, January
13.
USGS (U.S. Geological Survey). 2010. ‚Venezuela Holds One of the Largest Oil Accumulations.‛ Technical
Announcement, January 22. http://www.usgs.gov/newsroom/article.asp?ID=2386.
Voght, David. 2003. “The Venezuelan Energy Sector.” Presentation to the Institute of the Americas, May.
Wallis, Daniel. 2010. ‚Venezuela Revels in Oil Reserves, Challenges Remain.‛ Reuters, July 13.

42
5. Petróleos Mexicanos (Mexico)
Petroleos Mexicanos (Pemex) is the national oil company (NOC) of Mexico. The Constitution stipulates that
the ownership of hydrocarbon resources be vested in the nation. This ownership is inalienable, and the
exploitation, use, or appropriation of hydrocarbons is to be carried out by the government through the NOC.
Since its establishment in 1938, Pemex has held a monopoly on the exploitation, refining, transport, processing,
and distribution of oil, gas, and related products. This privileged position has allowed the NOC to build a
significant asset base and production expertise. But its inability to partner with other companies has deprived
Pemex of access to technological and managerial expertise, and left it to shoulder drill risks on its own.
While oil revenue is a relatively small percentage of the gross domestic product (GDP), it is the single
largest contributor (about 40 percent) to Mexico’s treasury. This motivates the government’s strict control of
and involvement in the NOC’s affairs. Most of the NOC’s cash flow is captured by the state, leaving the
company no other choice than to run up its debt ratio to be able to finance core production maintenance
operations. Years of underinvestment have eroded the company’s production and reserve base. The NOC
needs to invest in exploration in order to find new reserves. The most prospective acreage is thought to be in
the deep waters of the Gulf of Mexico. But the NOC lacks the expertise and financial strength to explore alone
and is unable to share risk by partnering with other oil companies.
In October 2008 the Mexican Congress approved 10 bills in an effort to reform its petroleum sector. The
reforms included changes to the NOC’s corporate structure, aimed to improve its efficiency and decision-
making process. At the same time, changes to the fiscal regime were introduced to attract private investment in
high-priority projects. The implementation of the reforms has been difficult, not least because the preexisting
intricacies of Mexico’s oil history leave energy sector elites and management in disagreement about how best
to structure new service contracts.
Company and country sector evolution
Business activities
Pemex is a fully integrated oil and gas company, and the sole oil and gas upstream company in Mexico, with
exclusive rights to refine, process, transport, and distribute crude oil, natural gas (with exceptions), and
petroleum products. Pemex’s business is described below.
Pemex is ranked as the third largest in total liquid output among the 50 largest oil companies (Petroleum
Intelligence Weekly 2009). About 80 percent of Mexico’s oil production and 45 percent of its natural gas
production is located offshore.
The company operates 34,865 kilometers of oil and refined product pipelines, most of which are in the
southern part of the country. Excluding liquid petroleum gas (LPG) there are no cross-border pipelines for
oil or other petroleum products. Exports, most of which go to the United States, leave Mexico via tanker
from three export terminals in the south of Mexico.
Pemex is the sole participant in refining and operates six refineries with a primary distillation capacity of
1.5 million barrels per day (bpd), which saw no growth over the period 2004–09. Nonetheless, owing to the
configuration of Pemex’s refineries, Mexico is a net importer of refined products; gasoline represents 60
percent of product imports. Pemex also owns 50 percent of the Deer Park refinery in Texas (340,000 bpd
capacity) with Shell Oil. This international joint venture was designed to provide additional coking
capacity for the treatment of Pemex’s heavy Mayan crude.
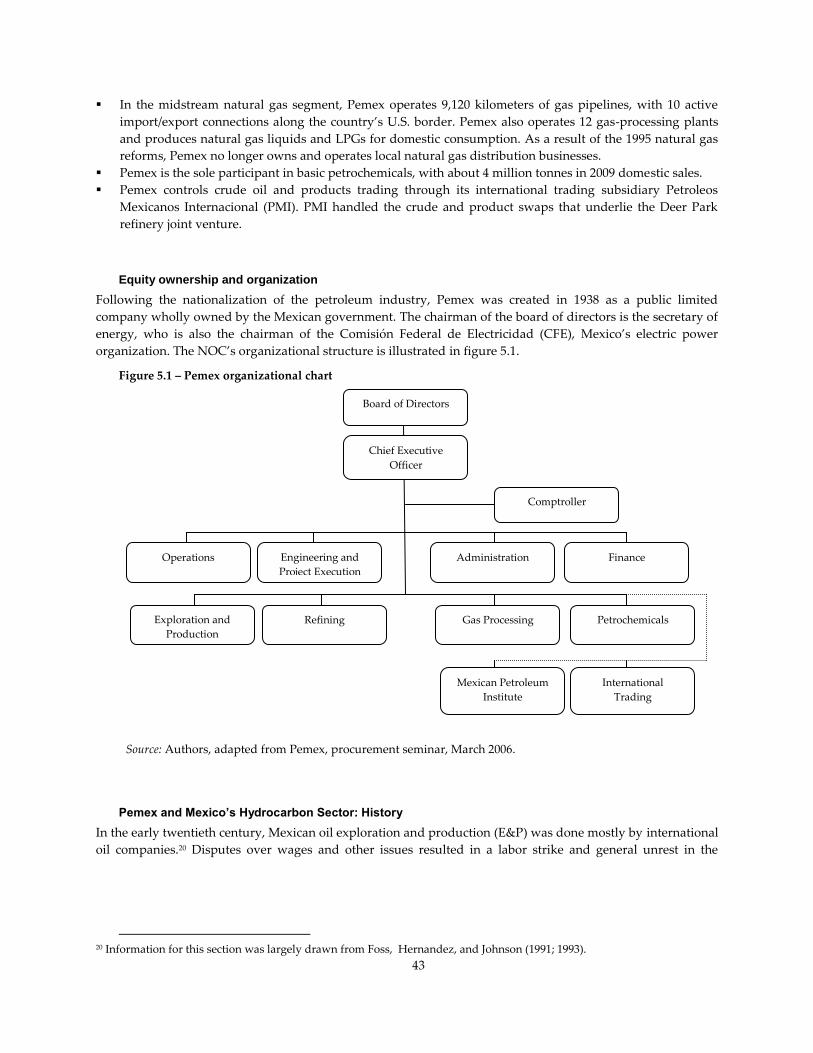
43
In the midstream natural gas segment, Pemex operates 9,120 kilometers of gas pipelines, with 10 active
import/export connections along the country’s U.S. border. Pemex also operates 12 gas-processing plants
and produces natural gas liquids and LPGs for domestic consumption. As a result of the 1995 natural gas
reforms, Pemex no longer owns and operates local natural gas distribution businesses.
Pemex is the sole participant in basic petrochemicals, with about 4 million tonnes in 2009 domestic sales.
Pemex controls crude oil and products trading through its international trading subsidiary Petroleos
Mexicanos Internacional (PMI). PMI handled the crude and product swaps that underlie the Deer Park
refinery joint venture.
Equity ownership and organization
Following the nationalization of the petroleum industry, Pemex was created in 1938 as a public limited
company wholly owned by the Mexican government. The chairman of the board of directors is the secretary of
energy, who is also the chairman of the Comisión Federal de Electricidad (CFE), Mexico’s electric power
organization. The NOC’s organizational structure is illustrated in figure 5.1.
Figure 5.1 – Pemex organizational chart
Source: Authors, adapted from Pemex, procurement seminar, March 2006.
Pemex and Mexico’s Hydrocarbon Sector: History
In the early twentieth century, Mexican oil exploration and production (E&P) was done mostly by international
oil companies.20 Disputes over wages and other issues resulted in a labor strike and general unrest in the
20 Information for this section was largely drawn from Foss, Hernandez, and Johnson (1991; 1993).
Board of Directors
Chief Executive
Officer
Comptroller
Operations Engineering and
Project Execution
Administration Finance
Exploration and
Production
Refining Gas Processing Petrochemicals
International
Trading
Mexican Petroleum
Institute
44
industry. Such unrest led then-president Lázaro Cárdenas to issue a decree on March 18, 1938, ordering the
expropriation of the assets of all companies and leading to the creation of Pemex.21
In 1971 a fisherman (Rudesindo Cantarell) reported oil fouling his fishing nets in Mexico’s Gulf of
Campeche.22 That information led to the discovery of Cantarell, one of the world’s largest oil fields. Cantarell
entered production in 1979. Mexico took advantage of high crude oil prices following the Arab oil embargo: it
increased income and fostered investments in various schemes in attempts to diversify and grow the economy.
Pemex also began marketing its crude in international markets. Although in a favorable position during the
1970s oil crises, by the time of the oil price collapse in 1986 Mexico carried excessive foreign debt.
In 1992 Mexico signed the North American Free Trade Agreement (NATFA) with Canada and the United
States, which triggered a number of market-oriented reforms in the country’s public sector. Although the
petroleum sector was not liberalized, Pemex underwent important organizational and financial management
reforms. Business rationalization led to the creation of four domestic operating subsidiaries, the elimination of
ancillary businesses, and a large reduction in staff. Instead of transferring all its profits to the government,
Pemex was allowed to pay taxes as any other industrial company, and reinvest its profits. This offered great
potential for increased efficiencies (Foss, Wainberg, and Volkov 2007).
President Ernesto Zedillo (1995–2001) continued the reform process. Natural gas reforms were approved
by the Mexican Congress in May 1995. These amendments authorized the private sector to construct, operate,
and own natural gas transportation, storage, and distribution systems. Pemex remained the only domestic
natural gas producer. A complicated formula was created to give new importers a chance to compete with
Pemex’s domestic production, and import tariffs were eliminated.
By the end of this period, Mexico had achieved a somewhat modernized NOC and an opening for private
investment in natural gas storage, pipeline transportation, and local distribution. (But Pemex remained, and
remains, the sole producer of natural gas.) The government selectively privatized 10 petrochemical complexes
that manufacture secondary products. The remaining basic petrochemicals businesses were combined with
natural gas to form a new Pemex subsidiary. By 1995, as Mexico faced its worst economic crisis in 60 years, the
government was even more reliant on Pemex’s resources. The NOC’s tax rate rose to 67 percent, leaving little
cash flow for reinvestment in crucial field maintenance and development projects.
Over this same period, Pemex came under increasing pressure to make crucial downstream investments
that would provide a better slate of light petroleum products and thus reduce imports. The company
implemented refinery expansion projects from 1996 to 2004 that encompassed new investment worth about
$5.8 billion, and this improved its petroleum products slate. To help finance its investment program, Pemex
went to the international capital markets in 1996, placing several issues of Eurobonds, obtaining underwriting
for the renewal of its bank acceptance programs, issuing commercial paper, and structuring bilateral or
syndicated lines for financing foreign trade. Mexico’s downstream industry had been nationalized in the 1950s.
Existing rules limiting foreign and private ownership constrained Pemex’s ability to attract outside investors to
refinery projects within Mexico. The company had turned to possibilities for participating in refinery
expansions outside of Mexico. It was announced in August 1992 that Pemex was acquiring half of Shell’s Deer
Park refinery near Houston. (Deer Park had been running a relatively light crude oil purchased from Mexico.)
Under the new arrangement, and with a $1 billion injection of capital from Pemex, the companies added
coking capacity to enable the refinery to process heavy Maya crude. The goal for Pemex was to be able to place
more than 100,000 bpd of Maya crude—about one-tenth of Mexico’s total exports of Maya—in the U.S. market,
achieving better returns for that production.
21 A small number of operating licenses in the Tampico area were allowed to remain in private hands but were later
nationalized. 22 See, for instance, http://whiskeyandgunpowder.com/mexican-oil.

45
The mid-1990s witnessed an experiment with investment in energy and infrastructure through the use of
internally issued debt. In 1995 Mexico’s Public Debt Law and Federal Public Budgetary, Accounting and
Expenditures Law were modified to create a new category of long-term public debt to support priority
infrastructure investment—the PIDIREGAS program.23 PIDIREGAS afforded Pemex and other state entities a
means of engaging in critical investment by having third parties bear the costs, to be reimbursed over time. But
Pemex proved unable to pay these reimbursements out of its cash flow, given its heavy government tax rate.
This meant that Pemex had to continue to borrow to meet its PIDIREGAS obligations. Meanwhile, PIDIREGAS
spending became the dominant share of Pemex capital expenditure; in practice the government transferred
responsibility for capital expenditures to outside parties while maximizing its share of Pemex’s cash flow
through taxation.24
Pemex was able to raise its external and PIDIREGAS’s debt financing on the basis of reserve holdings and
its sovereign guarantees, but questions surrounded the company’s (and government’s) reserves reporting.
Increased scrutiny of Pemex data led to a substantial restatement of the reserves information that the company
and government had long used to borrow against debt. In 2002 both crude oil and natural gas reserves were
restated to conform to U.S. Securities and Exchange Commission rules, with reductions of about 40 percent
(Moody’s 2003). By 2004, taking into account both production and restatement, crude oil reserves declined by
nearly half and natural gas reserves by more than half (Lajous 2005). In addition to the restatement, Cantarell
production peaked at about 2.1 million bpd in 2004 and has since entered a pronounced decline.
As the 2000s opened, the first major challenge that Pemex faced in its upstream businesses was natural gas
production and reserves replacement. In recognition of these problems, in December 2001 Pemex announced a
scheme of multiple service contracts (MSCs) designed to attract private companies to develop nonassociated
natural gas fields pursuant to a contractual arrangement with Pemex. Under a competitive bidding process that
began in 2002, contractors would perform work for Pemex at their own expense and would be paid a cash fee
for the work performed and services rendered. Pemex retained the rights to all extracted hydrocarbons,
consistent with Mexican law. The MSC scheme was implemented for two reasons: (i) to relieve a heavily debt-
laden Pemex from the initial investment burden, and (ii) to increase natural gas production in order to reduce
imports from the United States. Investor interest in the MSCs was muted, and production from the awarded
blocks in the Burgos and Chicontopec basins did not eliminate Mexico’s need to import natural gas, although
Chicontopec oil production did help offset Cantarell declines (Foss, Wainberg, and Volkov 2007).
Since licensing of petroleum E&P rights is not permitted by law, a new form of financed public works
contracts—also known as MSCs—was created to procure the services necessary to carry out natural gas E&P
activities. This pseudo-licensing practice has, however, resulted in significant bureaucratic delays and complex
management and oversight arrangements (Tordo 2009). Persistent court challenges to the MSCs’ legality and to
inadequate returns to contractors have plagued the program (Millard 2007).
Given that the bulk of Pemex’s capital expenditures (upwards of 90 percent by 2008) was derived from
PIDIREGAS spending, reserves were increasingly leveraged. By 2003 Pemex debt constituted $2.50 per barrel
of oil equivalent reserves, higher than any of the international oil companies at the time. In response, the
Mexican Congress, in the fall of 2005, approved a proposal to reduce, albeit modestly, the tax burden on
Pemex. The approximately $2 billion in tax savings represented 20–25 percent of Pemex’s annual capital
budget. It was a positive step, but did not resolve Pemex’s capital dilemma. Over the period 2003–06, Pemex
could fund only 60 percent of its capital expenditures from operating cash flow, resulting in a consolidated
gross debt/total capital employed ratio of 99 percent. Luckily, as oil prices soared past $100 per barrel, Pemex’s
financial performance improved and debt was repaid.
But years of underinvestment and lax attitudes toward replacing Cantarell reserves had eroded the
company’s production and reserve base. The first cracks appeared as Cantarell production declines accelerated
23 ‚Alert_Mexico_City_PIDREGAS_PEMEX_0209‛, White & Case Publications (http://www.whitecase.com). 24 The PIDREGAS program was terminated with the 2008 energy reforms.
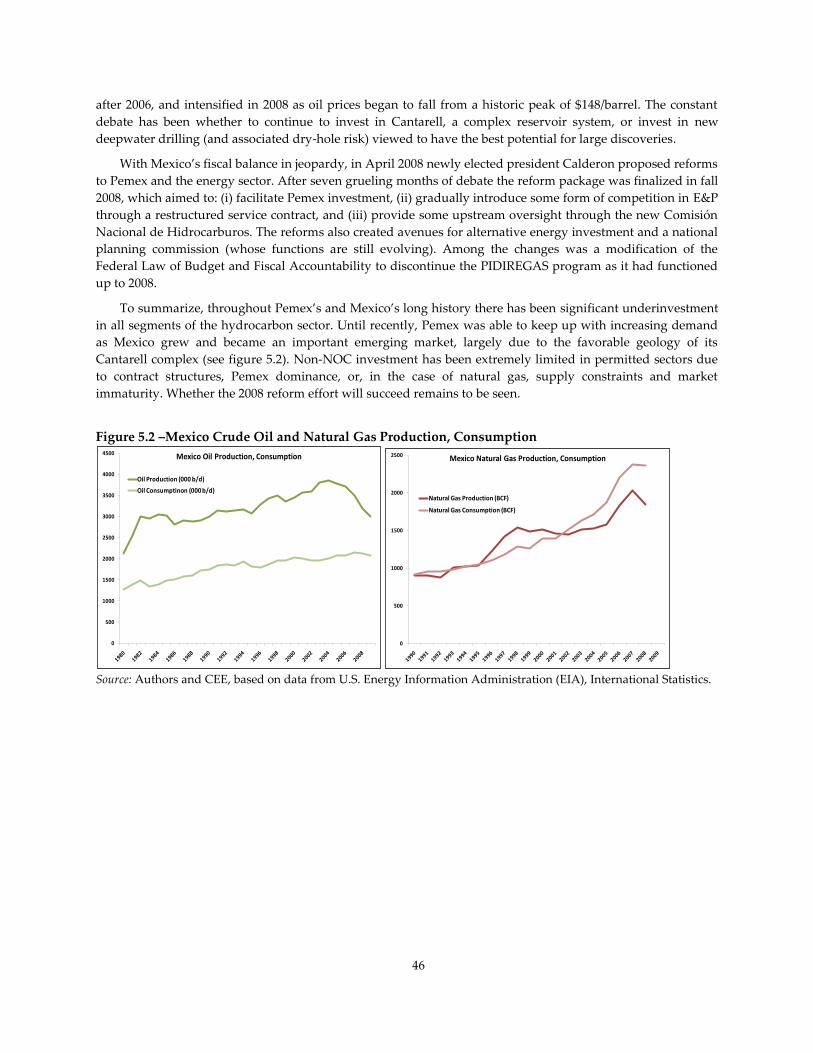
46
after 2006, and intensified in 2008 as oil prices began to fall from a historic peak of $148/barrel. The constant
debate has been whether to continue to invest in Cantarell, a complex reservoir system, or invest in new
deepwater drilling (and associated dry-hole risk) viewed to have the best potential for large discoveries.
With Mexico’s fiscal balance in jeopardy, in April 2008 newly elected president Calderon proposed reforms
to Pemex and the energy sector. After seven grueling months of debate the reform package was finalized in fall
2008, which aimed to: (i) facilitate Pemex investment, (ii) gradually introduce some form of competition in E&P
through a restructured service contract, and (iii) provide some upstream oversight through the new Comisión
Nacional de Hidrocarburos. The reforms also created avenues for alternative energy investment and a national
planning commission (whose functions are still evolving). Among the changes was a modification of the
Federal Law of Budget and Fiscal Accountability to discontinue the PIDIREGAS program as it had functioned
up to 2008.
To summarize, throughout Pemex’s and Mexico’s long history there has been significant underinvestment
in all segments of the hydrocarbon sector. Until recently, Pemex was able to keep up with increasing demand
as Mexico grew and became an important emerging market, largely due to the favorable geology of its
Cantarell complex (see figure 5.2). Non-NOC investment has been extremely limited in permitted sectors due
to contract structures, Pemex dominance, or, in the case of natural gas, supply constraints and market
immaturity. Whether the 2008 reform effort will succeed remains to be seen.
Figure 5.2 –Mexico Crude Oil and Natural Gas Production, Consumption
Source: Authors and CEE, based on data from U.S. Energy Information Administration (EIA), International Statistics.
0
500
1000
1500
2000
2500
3000
3500
4000
4500 Mexico Oil Production, Consumption
Oil Production (000 b/d)
Oil Consumptinon (000 b/d)
0
500
1000
1500
2000
2500 Mexico Natural Gas Production, Consumption
Natural Gas Production (BCF)
Natural Gas Consumption (BCF)

47
Value Creation Index
Operational performance
Operational performance
indicators
Pemex 5-Yr Avg.,
All NOCs 2004 2005 2006 2007 2008 5-Yr Avg.
E&P production growth (%) -1.43 -0.41 0.70 -1.07 -9.55 -2.35 10.4
Reserves replacement rate (BOE,
%)
22.04 26.01 40.86 50.21 71.79 42.2 95.8
Refinery utilization rate (%) 84.61 83.38 83.38 82.47 81.88 83.0 90.3
Output / total assets (BOE/'000$) 23.93 20.70 18.71 16.74 21.19 20.3 16.2
Output / total employees ('000
BOE)
15.02 14.77 14.63 14.52 13.21 14.4 20.6
Source: Authors, CEE.
Note: boe = barrel of oil equivalent.
As suggested by the table above, of most concern is Pemex’s lack of production growth and a reserves
replacement rate that is well below a level of long-term sustainability for one of the largest NOCs in the world.
The company is well below the average of our sample NOCs in its reserves replacement rate; improvement has
mainly come from natural gas investments. The lack of investment capital bears directly on the company’s
inability to replace its reserves and to achieve production growth.
Financial performance
Financial performance indicators Pemex 5-Yr Avg.,
All NOCs 2004 2005 2006 2007 2008 5-Yr Avg.
EBRTN / revenues (%) 59.53 54.42 61.24 59.75 57.93 58.4 45.3
EBRTN / total assets (%) 49.30 49.09 56.13 51.17 62.24 53.4 34.9
Net cash flow / CAPEX (%) -0.70 46.20 119.58 158.28 43.27 73.3 131.4
Source: Authors, CEE.
Note: EBRTN = earnings before interest, taxes, and noncommercial expenditures; CAPEX = capital expenditure.
Pemex’s pretax earnings reflect its ability to efficiently produce its existing reserves: they are within the range
of better-performing NOCs and compare well with other major oil companies. But the ratio of net cash flow to
capital expenditure reflects the effects on production levels of years of underinvestment, rising costs, and debt
servicing. A reversal in Pemex’s indebtedness, like the improvement of net cash flow to capital expenditures in
2006 and 2007, prove short-lived—a function of oil prices and the company’s fiscal contribution to the state.

48
National mission performance
National Mission performance
indicators
Pemex 5-Yr
Avg.,
All
NOCs
2004 2005 2006 2007 2008 5-Yr
Avg.
Share of local labor (%) 99.00 99.00 99.00 99.00 99.00 99.0 81.5
NOC employment growth-country
employment growth (%) -5.09 -0.55 -1.88 -2.29 -0.71 -2.1 1.9
Share of NOC employment in
country labor force (%) 0.32 0.32 0.31 0.31 0.30 0.32 0.3
Share of local content (%) 64.4
Non-commercial expenditure/total
expenditure (%) 0.20 0.24 0.32 0.27 0.31 0.27 1.7
Non-core commercial activities net
income/total net income (%) 1.6
Price subsidies/revenues (%) 0.20 0.50 0.21 0.11 0.29 0.3 10.0
NOC domestic petroleum products
production/country oil consumption
(%)
93.33 76.31 76.41 78.73 93.766 83.6 71.9
Source: Authors, CEE.
Pemex is no longer a major source of employment or employment growth in Mexico. Nor is it a source of
substantial, direct, noncommercial investment. Price subsidies, although provided, are well below the average
of the NOCs in our sample. Pemex’s downstream investment programs have closed the gap on meeting
Mexico’s petroleum products demand, but the company still does not meet 100 percent of its internal
requirements. A central energy policy debate is whether building additional refining capacity within Mexico
should be a strategic imperative for Pemex.25
Petroleum product prices are mainly set by a committee that includes the office of the president of Mexico;
the energy, finance, and economy ministries; and executives from Pemex and CFE. Natural gas, LPG, and
electricity are regulated by the Comisión Reguladora de Energía (CRE).26
Value Drivers
Geology
Mexico is considered to have favorable geology for reserve additions and the expansion of production.
Extensive oil discoveries in the 1970s increased Mexico’s domestic output and export revenues. In 1972
explorers discovered oil in the states of Chiapas and Campeche that showed huge reservoirs of petroleum
extending for 200 kilometers northeast below the Bahía de Campeche, and possibly in the opposite direction
toward Guatemala. Almost every drilling operation conducted after 1972 struck oil. In 1973 oil production
surpassed the peak of 190 million barrels achieved in the early 1920s. In 1974 Pemex announced additional
petroleum discoveries in Veracruz, Baja California Norte, Chiapas, and Tabasco. In 1993 Mexico had the
world’s eighth largest crude petroleum reserves, amounting to some 5 percent of the world’s total. Its proven
25 PEMEX eventually announced the selection of Hidalgo state as the location for a new, roughly 300,000-bpd refining
complex pegged at $10 billion (Campbell 2009, and Martinez 2009). 26 While CRE’s decisions have largely been independent, from time to time the price committee has had some influence.
CRE’s independence was strengthened in the 2008 energy reforms.

49
crude oil reserves amounted to some 51 billion barrels in 1993, and it had potential reserves of some 250 billion
barrels. According to a BP statistical review at the end of 2008 proven crude oil reserves amounted to 11.8
billion barrels, and proven reserves of natural gas stood at 17.6 trillion cubic feet, sufficient to guarantee
current production levels for approximately 11 years. The Gulf of Mexico contains more than two-fourths of
Mexico’s proven reserves; approximately one-fourth is located in the Chicontepec region and most of the rest is
located in Tabasco and Chiapas.
State context
Mexico has become more open, democratic, and integrated with world trade (Mexico is a member of the World
Trade Organization and has negotiated other trade agreements in addition to NAFTA). While oil revenue is a
relatively small percentage of GDP, it is the single-largest contributor (about 40 percent) to Mexico’s treasury.
Of all the countries of the Organisation for Economic Co-operation and Development (OECD), Mexico collects
the lowest percentage of its government revenues (about 12 percent), from individual and non-oil corporate
taxes. Without overall tax reform, it is very difficult to reduce the fiscal burden on Pemex. The company’s
dominance as a fiscal contributor is a key motivator for government intervention in the hydrocarbons sector.
With the exception of control of corruption, Mexico’s Governance Indicators have been deteriorating over
the study period. But voice and accountability, government effectiveness and regulatory quality remain above
the regional average.
Petroleum sector organization and governance
As set forth in article 27 of the Mexican Constitution, the ownership of hydrocarbon resources is vested in the
nation. No concession or contract can be granted to private companies, even if incorporated in Mexico. Pemex
was created in 1938 following the nationalization of the petroleum industry.
Ley reglementaria del articulo 27 constitucional en el ramo del petroleo (November 29, 1958, as amended) provides
for Pemex to conduct the exploitation, refining, transportation, processing, and distribution of oil, gas, and
products (considered as strategic activities by the Constitution). Pemex has the right to enter into contracts
with natural and legal persons for the provision of services and works that enable it to better perform its
activities. But in accordance with the law, Pemex’s contractors must be paid in cash. In no event can
compensation for such services and works be established in kind (as a percentage of products) or as a
percentage participation in the result of the exploitation (Tordo 2009).
Initially the monopoly granted to Pemex had a positive impact on its value creation capability, allowing it
to build a significant asset base and production expertise. But by precluding the participation of private
investors, the NOC has effectively been deprived of access to world-class technologies and managerial
expertise.
The NOC is regulated by the Ministry of Energy (Secretaría de Energía, or SENER), and its budget is
authorized annually by the Ministry of Finance and Public Credit (Secretaría de Hacienda y Crédito Público).
There is another government body established by decree in 1993, the CRE, vested with powers to regulate the
natural gas and power sectors. In 2008 a new regulatory body was created—the National Energy Council—to
advise the executive (president) regarding the course of energy policy in Mexico. The 16-member body is to
coordinate with yet another entity, the National Energy Forum, which includes members of the private and
public sectors. It is unclear how these bodies, especially the council, will interact with the SENER, whether the
SENER functions will be duplicated, and what the outputs and outcomes should be.27
27 SENER already has an Under Secretariat of Planning, whose manager is also a member of the council. This office is
mainly responsible for the preparation of 10-year annual forecasts of different segments of the energy sector, natural gas,
LPG, and so on.

50
Natural gas production has been growing largely as a result of service contract arrangements. Non-Pemex
participants in natural gas upstream operate pursuant to contracts for fees, not equity participation in reserves
or production. The use of MSCs to stimulate oil and gas production has existed since 1995 and the creation of
the PIDIREGAS program. Yet even with production growth, domestic natural gas sales still are not sufficient to
meet growing demand. As a result Mexico continues to import natural gas from the United States and also has
licensed new liquefied natural gas (LNG) import terminals under various arrangements.
Mexico has two operating LNG terminals: Altamira, with 500 billion cubic feet per day (bcfd) capacity, and
Costa Azul, with 1 bcfd capacity. Both terminals are owned by foreign company consortia, subject to regulation
by the CRE. Gas supply contracts are between foreign suppliers and Mexico’s state-owned electricity company,
CFE. Pemex does not participate in the LNG sector. Other LNG terminals are under development.
Although third parties have the right to construct, operate, and ship gas pipelines (and facilities connected
with their usage), Pemex continues to be the dominant player. Other natural gas pipelines are operated or
under development by Mexican and international companies. Pemex’s dominance is a result of its exclusive
authority over the first-hand sales of natural gas as well as the transportation and storage linked with this
function.
The only example of privatized Pemex assets are local distribution companies (LDCs) for natural gas. At
one time, Pemex operated 19 LDCs to deliver LPG. Except for assets held in trust and those located within
Veracruz, local gas distribution now resides in the private sector (largely foreign companies), subject to
regulation by the CRE, an institutional arrangement created with the 1994 reform.
NOC strategy and behavior
Pemex’s activities span the entire petroleum sector value chain. At the end of 2008 Pemex’ activities included
1323 strategic facilities, 6 refineries, 8 petrochemical plants, 10 gas processing plants, 77 storage and
distributions centers, 60,568 kilometers of pipelines, 16 liquefied natural gas facilities, and a large number of
gas stations and health centers (Pemex 2009).
The NOC transfers 60 percent of its net cash flow to the government in taxes. The dominant proportion,
about 90 percent, of upstream capital expenditures has been provided by Pemex through the various capital
market and service contract vehicles described above.
Pemex has no domestic joint ventures, and international ventures are concentrated in PMI and refining
partnerships. Under a new fiscal scheme approved by Congress in 2008 (although there are currently proposed
amendments awaiting Congressional approval) and aimed at incentivizing investment in the sector, oil fields
located in the Chicontepec region and in deep waters fall under a separate tax regime that accounts for their
complex geological conditions and higher exploration and exploitation costs. The new scheme includes a lower
tax rate and higher costs caps for petroleum-related activities in these fields.
Another major element of the 2008 reform is the ability to issue bonos ciudadanos (citizen bonds) linked to
Pemex’s performance. If successful, the debt issued will provide Pemex with needed financial flexibility to
implement its maintenance and expansion plans.
To maximize the benefits of the 2008 reforms, the NOC has reformulated its strategy to include four axes:
operational excellence, growth, modernization of management, and social responsibility. On the first axis, the
NOC aims to achieve greater execution capabilities by improving planning, management, and the construction
of projects. The NOC is counting on its Institutional System for Project Development, launched in 2007, to
facilitate project design and evaluation, as well as to monitor actual costs of execution and implementation. The
NOC has also invested in the design of information systems and procedures aimed at monitoring project
execution efficiency. These instruments and measures are expected to improve the effectiveness and timeliness
of the NOC’s decision-making process, a key ingredient of its growth strategy. Along the second axis, the
company aims to: (i) step up exploration activities, particularly in the Chicotepec basin and deepwater, with

51
the aim to improve its reserves replacement ratio; (ii) improve production of existing reserves; and (iii) invest
in technology to create competitive advantages. The modernization of its refineries is also planned to meet
growing domestic demand for oil products, and reliability of supply. On the third axis, the NOC is striving to
create an entrepreneurial culture focused on results. Finally, Pemex has defined social responsibility as the
fourth axis, comprising guidelines and actions to enhance industrial safety, occupational health and industrial
protection indexes, and the incorporation of sustainability and community development as key elements of
operations and infrastructure projects.28
NOC corporate governance
In October 2008 the Mexican Congress approved a series of reforms to PEMEX’s governance structure aimed at
improving the company’s decision-making process and execution capabilities. The reform included the
appointment of new professional members to the boards of directors of Pemex and each one of its four
subsidiary entities, and the creation of seven executive committees to support the boards. Reforms to PEMEX’s
governance structure sought to increase the company’s autonomy from the federal government, while also
improving its transparency, oversight, and control mechanisms.
Pemex’s board of directors consists of 15 members, of whom the president of Mexico appoints 10,
including the independent directors; the Petroleum Workers Union appoints 5. The president of Mexico also
appoints the director general of Pemex. The union-selected directors are chosen from among Pemex
employees.
Historically, clearly defined and publicly stated goals and objectives for the company have not been
expressed in ways that ensure accountability. In line with best practices, several new board committees have
been created:
The Audit and Performance-Evaluation Committee verifies the achievement of goals, objectives, plans, and
programs; evaluates the financial and operational performance; appoints, supervises, and evaluates the
external auditor; and informs the board about the system of internal controls and proposes improvements
to it. It consists of three professional board members and a representative from the Ministry of Public
Function; the chairman is a professional board member.
The Transparency and Accountability Committee proposes the criteria to determine which information is
considered relevant for disclosure. The chairman is a professional board member. The Strategy and Investments Committee analyzes, evaluates, and follows up on the business plan and the
investment portfolio to reduce gaps in the execution of projects. The chairman is a professional board
member.
The Compensation Committee proposes compensation and incentive mechanisms for the Director General
and senior management based on their performance and measurable results. The chairman is a
professional board member. The Acquisitions, Lease, Works and Services Committee reviews, evaluates, follows, and develops
recommendations regarding the annual programs for acquisition, construction, and services contracts. The
chairman is a professional board member.
The Environmental and Sustainable Development Committee promotes the development of environmental
protection and sustainability policies. Three professional board members and a representative of the
Ministry of the Environmental Protection and Natural Resources serve on it.
The Development and Technological Research Committee proposes technological research and
development plans related to the oil industry. The chairman is a professional board member.
The Ministry of Finance and Public Credit approves the NOC’s annual budget and financing program. In
addition, the Pemex budget requires the annual approval of Congress.
28 Information drawn from http://www.ri.pemex.com/files/content/PEMEX%20Strategy.pdf.

52
Conclusions
Pemex is one of the most obvious examples of an NOC that is profitable on an operating, pretax basis, and
unprofitable on an after-tax basis. The company is an efficient producer of existing reserves but lacks the
capital and technology to replace those reserves.
Most of the NOC’s cash flow is captured by the state, leaving the company no other choice than to run up
its debt ratio to be able to finance at least core production maintenance operations. With the decline of its major
producer, Cantarell, the NOC needs to invest in exploration in order to find new reserves. The most promising
reservoirs are expected to be deepwater in the Gulf of Mexico, but the NOC lacks the expertise and financial
strength to exploit this alone, and is unable to share risk by partnering with other oil companies.
The 2008 reform introduced changes to the NOC’s corporate structure that are expected to improve the
autonomy, effectiveness, and timeliness of its decision-making processes, thus improving its operational
performance. More flexibility has been added to the fiscal regime in order to attract investment in and improve
the commercial viability of projects in the Chicontepec basin and the Gulf of Mexico. The implementation of
these measures is, however, marred by delays and controversies. If not resolved, these pose a threat to the
sustainability of not only Pemex but of Mexico’s overall fiscal health.
53
References
Buckley, William, and Lee Harwood. 2002. Pemex’s Draft Multiple Services Contract—Exploring New Ground?
Haynes and Boone (http://www.haynesandboone.com/07-16-2002 )
Business News Americas. 2002. ‚Pemex to Call for First Multiple Service Contracts Nov.—Mexico.‛
(http://www.bnamericas.com/news/oilandgas/Pemex_to_call_for_first_multiple_service_contracts_Nov)
Campbell, Robert. 2009. ‚UPDATE 1—Mexico Unveils New $12.2 Bn Oil Refining Plan.‛ Reuters-India, April
15.
Day, Paul. 2003. ‚Does MSC Stand for Mexico Sold Cheap? Controversial Multiple Service Contracts in Burgos
Basin.‛ Business Mexico.( http://www.allbusiness.com/north-america/mexico/676403-1.html )
Foss, Michelle Michot, Francisco García Hernandez, and William A. Johnson. 1991. ‚The Economics of Natural
Gas in Mexico.‛ Proceedings of the IAEE 13th Annual North American Conference, November.
———. 1993. ‚The Economics of Natural Gas in Mexico—Revisited.‛ The Energy Journal (special edition), North
American Energy after Free Trade, September.
Foss, Michelle Michot, Miranda Ferrell Wainberg, and Dmitry Volkov. 2007. ‚Hydrocarbon Regulation and
Cross-border Trade in the Western Hemisphere.‛ In Energy Cooperation in the Western Hemisphere, ed. Sidney
Weintraub with Annette Hester and Veronica Prado, chapter 16. Center for Strategic and International Studies.
Washington, D.C.
Glinz Férez, Irma, and Idalia Flores de la Mota. 2006. ‚Capital Budgeting Model for Pemex Exploración y
Producción.‛ Oil and Gas Business. (http://www.ogbus.ru/eng/authors/Glinz/Glinz_1.pdf )
Lajous, Adrían. 2005. ‚Mexican Oil and Gas.‛ Presentation to the Energy Forum, New York University.
Martinez, Andres. 2009. ‚Pemex Picks Hidalgo for $10 Billion Oil Refinery (Update 1).‛ Bloomberg, April 14.
Millard, Peter Millard. 2007. ‚Repsol Cuts Back at Mexico Gas Field, Contracts Disappoint.‛ RigZone.
Moody’s. 2003. Petroleos Mexicanos (Pemex): Lack of Fiscal Autonomy Constrains Production Growth and Raises
Financial Leverage. Special Comment.
Pemex 2009. Pemex’s Geographic Information system. Presentation made by Ignacio Lopez, Pemex’s Corporate
Services Director at the Hyderabad International Convention Center, February 2009
(www.gisdevelopment.net/.../2009/.../mwf09_Ignacio_Lopez.pps).
PIW (Petroleum Intelligence Weekly). 2009. ‚2008 World’s Fifty Largest Oil and Gas Companies.‛ Petroleum
Intelligence Weekly.
Rodriquez, C. M., and Black T. 2010. ‚Pemex Performance Contracts May Fail to Attract.‛ Bloomberg, March 29.
Tordo. 2009. ‚Petroleum Exploration and Production Rights: Allocation Strategies and Design Issues‛. World
Bank Working Paper No. 179. Washington, D.C.
54
6. Petróleos Brasileiro S.A. (Brazil)
From its formation in 1953 to the present, Petrobras has dominated all sectors of the hydrocarbon
value chain in Brazil (upstream, midstream, and downstream). Today Petrobras is an integrated oil
and gas company with operations in 27 countries. The company is internationally renowned for its
innovation and expertise in deep and ultradeep water exploration and production (E&P) (Dantas and
Bell 2006).
Petrobras was created as state-owned enterprise (SOE) with majority state participation. The
government deliberately granted the national oil company (NOC) administrative and financial
independence, and a commercial mandate. Although the NOC was granted a monopoly over the
petroleum sector (with the exception of retail distribution), the participation of domestic and foreign
private companies was never prohibited. On the contrary, participation in joint ventures, both
domestic and international, was an important part of the NOC’s strategy to increase its learning curve.
Despite the introduction of competition, however, Petrobras has not lost its dominant role. This is
expected to continue, especially since a new legal framework was established in June 2010, following
large discoveries in a presalt offshore area near Rio de Janeiro. Two bills approved by the Brazilian
congress underline a fundamental policy change with respect to control over, and access to, the
country’s petroleum resources.
Petrobras has exhibited strong performance in all categories (operational, financial, and
achievement of the national mission) over the study time period. Analysts refer to the company’s
proficiency in deepwater exploration and production as the major contributor to its exceptional track
record and to its substantial future growth potential following significant offshore discoveries in
recent years. But Petrobras is not without significant challenges as it faces substantial business,
execution, and financial risks.
Company and country sector evolution
Business activities
Petrobras is an integrated oil and gas company with domestic and international operations. In the
domestic market the NOC is engaged in oil and gas exploration and development, refining, wholesale
and retail distribution of oil products, gas transmission and distribution, petrochemicals and
fertilizers, gas-fired electric power generation, renewable energy, and biofuels. The NOC’s
international activities include petroleum E&P, refining, petrochemicals and fertilizers, and petroleum
products distribution.
Petrobras plays a dominant role in the upstream petroleum sector in Brazil. In 2008 the NOC
produced 822 million barrels of oil equivalent (boe), corresponding to 98.5 percent of Brazil’s total
oil and gas production. The NOC holds approximately 94 percent of Brazil’s proven oil and gas
reserves.
Approximately 92 percent of Petrobras’ proven reserves are located in Brazil, 85 percent of which
are crude oil. Total proven reserves at the end of 2008 were 11 billion BOE.

55
Only 10 percent of Petrobras’ proven reserves are located onshore; the remainder is offshore, with
56 percent in water depths greater than 1,500 meters.
Petrobras operates 22 percent of global deepwater production and 18 percent of all deepwater
operating vessels.
Petrobras operates Brazil’s domestic natural gas transport system. The network has over 1,550
miles of natural gas pipelines, mostly in the southeast and northeast parts of the country.
Transpetro, a wholly owned subsidiary of Petrobras, operates Brazil’s crude oil transport network.
The system consists of 4,000 miles of crude oil pipelines, coastal import terminals, and inland
storage facilities.
Brazil has 1.9 million barrels per day (bpd) of crude-oil-refining capacity spread across 13
refineries. Petrobras operates 11 facilities and sells essentially to the domestic market.
Internationally, Petrobras is active in 27 countries, both upstream and downstream.
Petrobras: Equity ownership and organization
At the end of 2008, the Brazilian government owned 40 percent of Petrobras’s outstanding share
capital and 56 percent of voting rights, giving it majority control of the company. Petrobras’s capital
stock has traded on the Brazilian Bovespa (stock exchange) since 1968, on the New York stock
exchange since 2000, and on the Buenos Aires stock exchange since 2006.
Petrobras’ general organizational structure (Figure 6.1) was approved by its board of directors in
2000 and includes four business areas (E&P, downstream, gas and energy, and international), two
support areas (financial and services), and the corporate units directly linked to the CEO.
Figure 6.1 – Petrobras Organizational Chart
Source: Authors, based on information available on Petrobras website (www.petrobras.com.br).
Audit Committee
Board of Directors
General Ombudsman Internal Audit
Executive Board
President
Corporate Development
Strategy
New Business
General Secretariat Cabinet of the President
Human Resources
Organization, Management
and Governance
Legal Department
Institutional Communications
Finance Gas and Energy Exploration and
Production Downstream International Services
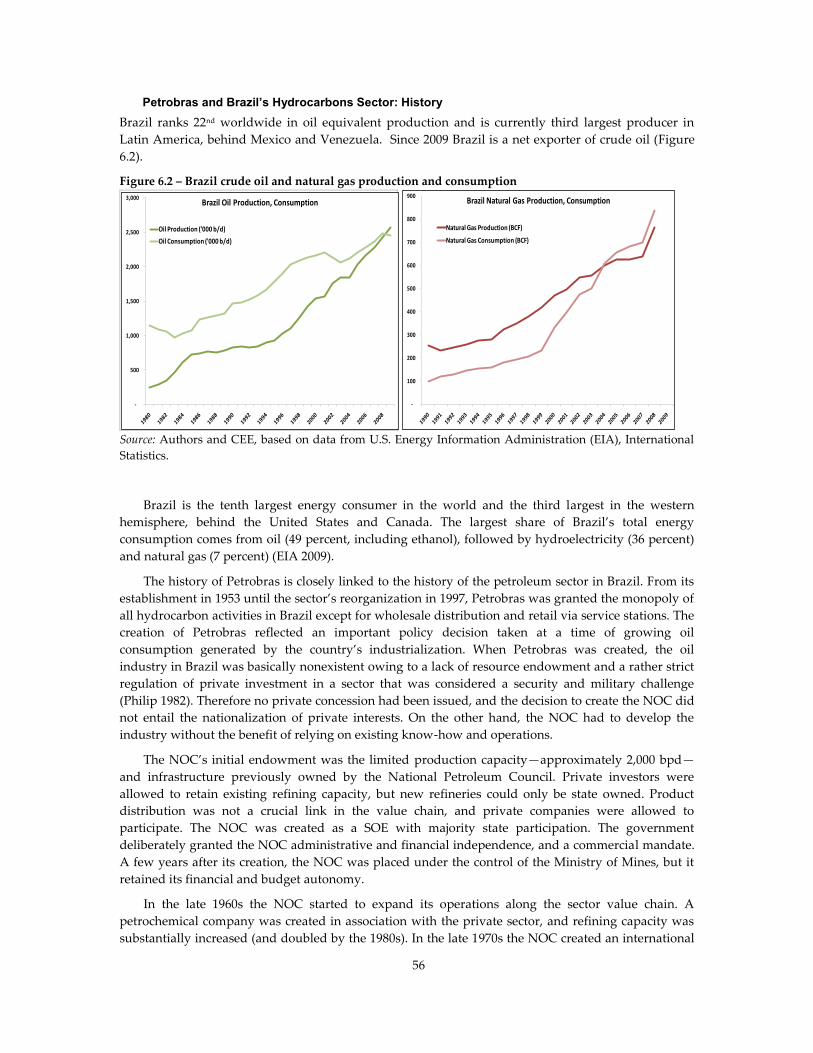
56
Petrobras and Brazil’s Hydrocarbons Sector: History
Brazil ranks 22nd worldwide in oil equivalent production and is currently third largest producer in
Latin America, behind Mexico and Venezuela. Since 2009 Brazil is a net exporter of crude oil (Figure
6.2).
Figure 6.2 – Brazil crude oil and natural gas production and consumption
Source: Authors and CEE, based on data from U.S. Energy Information Administration (EIA), International
Statistics.
Brazil is the tenth largest energy consumer in the world and the third largest in the western
hemisphere, behind the United States and Canada. The largest share of Brazil’s total energy
consumption comes from oil (49 percent, including ethanol), followed by hydroelectricity (36 percent)
and natural gas (7 percent) (EIA 2009).
The history of Petrobras is closely linked to the history of the petroleum sector in Brazil. From its
establishment in 1953 until the sector’s reorganization in 1997, Petrobras was granted the monopoly of
all hydrocarbon activities in Brazil except for wholesale distribution and retail via service stations. The
creation of Petrobras reflected an important policy decision taken at a time of growing oil
consumption generated by the country’s industrialization. When Petrobras was created, the oil
industry in Brazil was basically nonexistent owing to a lack of resource endowment and a rather strict
regulation of private investment in a sector that was considered a security and military challenge
(Philip 1982). Therefore no private concession had been issued, and the decision to create the NOC did
not entail the nationalization of private interests. On the other hand, the NOC had to develop the
industry without the benefit of relying on existing know-how and operations.
The NOC’s initial endowment was the limited production capacity—approximately 2,000 bpd—
and infrastructure previously owned by the National Petroleum Council. Private investors were
allowed to retain existing refining capacity, but new refineries could only be state owned. Product
distribution was not a crucial link in the value chain, and private companies were allowed to
participate. The NOC was created as a SOE with majority state participation. The government
deliberately granted the NOC administrative and financial independence, and a commercial mandate.
A few years after its creation, the NOC was placed under the control of the Ministry of Mines, but it
retained its financial and budget autonomy.
In the late 1960s the NOC started to expand its operations along the sector value chain. A
petrochemical company was created in association with the private sector, and refining capacity was
substantially increased (and doubled by the 1980s). In the late 1970s the NOC created an international
-
500
1,000
1,500
2,000
2,500
3,000 Brazil Oil Production, Consumption
Oil Production ('000 b/d)
Oil Consumption ('000 b/d)
-
100
200
300
400
500
600
700
800
900 Brazil Natural Gas Production, Consumption
Natural Gas Production (BCF)
Natural Gas Consumption (BCF)
57
trading subsidiary and entered into the fertilizer and mining sectors. In the 1980s the NOC expanded
its oil transportation capacity, which was needed to support crude oil imports.
Although the NOC was given the objective to achieve energy independence, finding and
development costs were high compared to other countries. Therefore the NOC decided to look for oil
abroad, and in 1972 created its international subsidiary, BrasPetro. The move proved strategic. By
associating with multinationals the NOC acquired knowledge of international operations and
technical and commercial expertise that were later instrumental to the development of its domestic
operations.
While the NOC was learning the business abroad, the country was importing almost 80 percent of
its total oil consumption with significant impact on its trade balance and foreign exchange reserves. In
an effort to reduce its dependence on oil imports, the government supported the production of ethanol
from sugarcane. The government had already experimented with the use of risk contracts to
incentivize private participation in the upstream oil sector, but the result was a mere 2 percent of total
production.
Price increases in the 1970s and early 1980s finally made the development of domestic resources a
profitable proposition, and Petrobras started to focus on its original mandate to develop domestic
resources. Its success rate was impressive: in over a decade the NOC was able to increase its
production at an average annual rate of 15 percent. By the end of the 1990s, Petrobras’s domestic
production had reached 50 percent of domestic consumption. But it was still not good enough for the
government’s finances.
In 1995 an important reform was enacted: both the upstream and downstream oil and gas sectors
were opened to private participation. After a constitutional change, a new petroleum law was enacted
in August 1997 (Petroleum Law 9478/97). The law provided for the possibility of reducing the
government stake in Petrobras to 50 percent plus one share. Petrobras was allowed to retain its
dominant position—the law allowed the NOC to retain all oil and gas fields producing at the time, as
well as blocks where it had made commercial discoveries or significant exploration investment—but
had to compete with private companies for new blocks (Tordo 2009).
The 1997 bill created the Agencia National do Petroleo (ANP) and the Conselho Nacional de
Politica Energetica (CNPE). Furthermore, the NOC was granted the right to enter into joint ventures
with private companies without congressional approval (although investment plans still had to be
approved by congress together with the federal budget).
The CNPE is part of the government’s executive branch and advises the president in the
formulation of national energy policy. The CNPE includes members from the Ministry of Mines and
Energy (MME) and the ministries of Planning and Budget, Finance, Environment and Industry, as well
as the Secretary of Strategic Affairs of the Presidency, representatives from the states and federal
district, and a Brazilian citizen specialist in the energy sector. The MME minister is the chairman of the
CNPE and a member of Petrobras’s board.
The MME is responsible for implementing the CNPE recommendations and overseeing
development planning for the hydrocarbon sector.
The National Petroleum Agency (ANP) is a regulatory, contracting and monitoring agency
responsible for the licensing of oil and gas E&P rights, including the design of bidding criteria,
evaluation of bids, and award of licenses. The ANP is also responsible for the creation and
maintenance of the Brazilian E&P database (BDEP), the largest seismic database in the world, and for
issuing natural gas pipeline transportation licenses.
Though in 2002 the government deregulated the price of crude oil, oil products, and natural gas
from time to time it exhorts Petrobras to sell at subsidized prices. Law 8/2003 provided for the CNPE
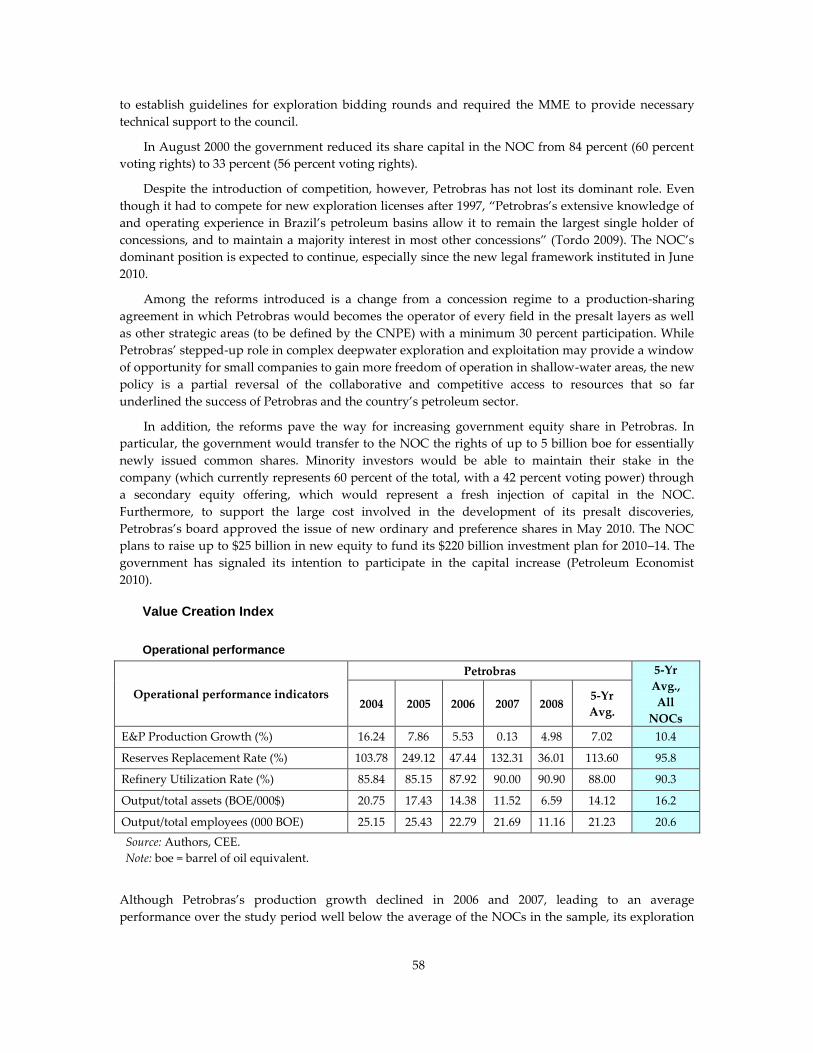
58
to establish guidelines for exploration bidding rounds and required the MME to provide necessary
technical support to the council.
In August 2000 the government reduced its share capital in the NOC from 84 percent (60 percent
voting rights) to 33 percent (56 percent voting rights).
Despite the introduction of competition, however, Petrobras has not lost its dominant role. Even
though it had to compete for new exploration licenses after 1997, ‚Petrobras’s extensive knowledge of
and operating experience in Brazil’s petroleum basins allow it to remain the largest single holder of
concessions, and to maintain a majority interest in most other concessions‛ (Tordo 2009). The NOC’s
dominant position is expected to continue, especially since the new legal framework instituted in June
2010.
Among the reforms introduced is a change from a concession regime to a production-sharing
agreement in which Petrobras would becomes the operator of every field in the presalt layers as well
as other strategic areas (to be defined by the CNPE) with a minimum 30 percent participation. While
Petrobras’ stepped-up role in complex deepwater exploration and exploitation may provide a window
of opportunity for small companies to gain more freedom of operation in shallow-water areas, the new
policy is a partial reversal of the collaborative and competitive access to resources that so far
underlined the success of Petrobras and the country’s petroleum sector.
In addition, the reforms pave the way for increasing government equity share in Petrobras. In
particular, the government would transfer to the NOC the rights of up to 5 billion boe for essentially
newly issued common shares. Minority investors would be able to maintain their stake in the
company (which currently represents 60 percent of the total, with a 42 percent voting power) through
a secondary equity offering, which would represent a fresh injection of capital in the NOC.
Furthermore, to support the large cost involved in the development of its presalt discoveries,
Petrobras’s board approved the issue of new ordinary and preference shares in May 2010. The NOC
plans to raise up to $25 billion in new equity to fund its $220 billion investment plan for 2010–14. The
government has signaled its intention to participate in the capital increase (Petroleum Economist
2010).
Value Creation Index
Operational performance
Operational performance indicators
Petrobras 5-Yr
Avg.,
All
NOCs 2004 2005 2006 2007 2008
5-Yr
Avg.
E&P Production Growth (%) 16.24 7.86 5.53 0.13 4.98 7.02 10.4
Reserves Replacement Rate (%) 103.78 249.12 47.44 132.31 36.01 113.60 95.8
Refinery Utilization Rate (%) 85.84 85.15 87.92 90.00 90.90 88.00 90.3
Output/total assets (BOE/000$) 20.75 17.43 14.38 11.52 6.59 14.12 16.2
Output/total employees (000 BOE) 25.15 25.43 22.79 21.69 11.16 21.23 20.6
Source: Authors, CEE.
Note: boe = barrel of oil equivalent.
Although Petrobras’s production growth declined in 2006 and 2007, leading to an average
performance over the study period well below the average of the NOCs in the sample, its exploration
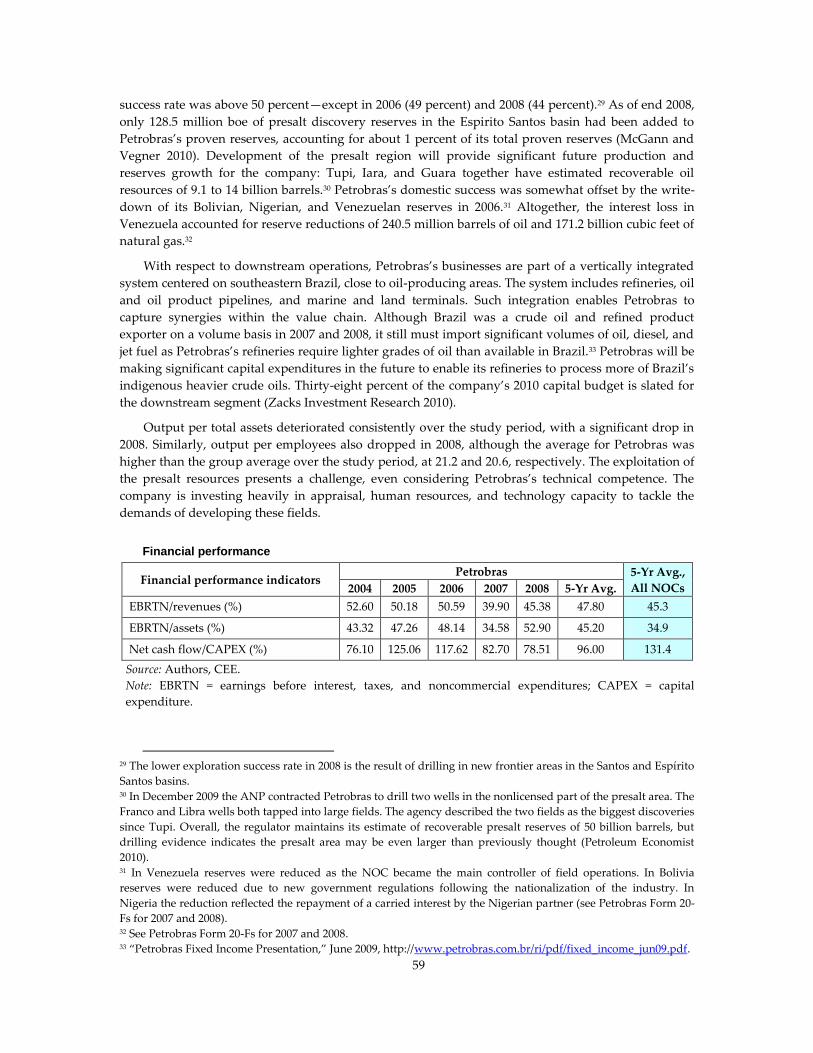
59
success rate was above 50 percent—except in 2006 (49 percent) and 2008 (44 percent).29 As of end 2008,
only 128.5 million boe of presalt discovery reserves in the Espirito Santos basin had been added to
Petrobras’s proven reserves, accounting for about 1 percent of its total proven reserves (McGann and
Vegner 2010). Development of the presalt region will provide significant future production and
reserves growth for the company: Tupi, Iara, and Guara together have estimated recoverable oil
resources of 9.1 to 14 billion barrels.30 Petrobras’s domestic success was somewhat offset by the write-
down of its Bolivian, Nigerian, and Venezuelan reserves in 2006.31 Altogether, the interest loss in
Venezuela accounted for reserve reductions of 240.5 million barrels of oil and 171.2 billion cubic feet of
natural gas.32
With respect to downstream operations, Petrobras’s businesses are part of a vertically integrated
system centered on southeastern Brazil, close to oil-producing areas. The system includes refineries, oil
and oil product pipelines, and marine and land terminals. Such integration enables Petrobras to
capture synergies within the value chain. Although Brazil was a crude oil and refined product
exporter on a volume basis in 2007 and 2008, it still must import significant volumes of oil, diesel, and
jet fuel as Petrobras’s refineries require lighter grades of oil than available in Brazil.33 Petrobras will be
making significant capital expenditures in the future to enable its refineries to process more of Brazil’s
indigenous heavier crude oils. Thirty-eight percent of the company’s 2010 capital budget is slated for
the downstream segment (Zacks Investment Research 2010).
Output per total assets deteriorated consistently over the study period, with a significant drop in
2008. Similarly, output per employees also dropped in 2008, although the average for Petrobras was
higher than the group average over the study period, at 21.2 and 20.6, respectively. The exploitation of
the presalt resources presents a challenge, even considering Petrobras’s technical competence. The
company is investing heavily in appraisal, human resources, and technology capacity to tackle the
demands of developing these fields.
Financial performance
Financial performance indicators Petrobras 5-Yr Avg.,
All NOCs 2004 2005 2006 2007 2008 5-Yr Avg.
EBRTN/revenues (%) 52.60 50.18 50.59 39.90 45.38 47.80 45.3
EBRTN/assets (%) 43.32 47.26 48.14 34.58 52.90 45.20 34.9
Net cash flow/CAPEX (%) 76.10 125.06 117.62 82.70 78.51 96.00 131.4
Source: Authors, CEE.
Note: EBRTN = earnings before interest, taxes, and noncommercial expenditures; CAPEX = capital
expenditure.
29 The lower exploration success rate in 2008 is the result of drilling in new frontier areas in the Santos and Espírito
Santos basins. 30 In December 2009 the ANP contracted Petrobras to drill two wells in the nonlicensed part of the presalt area. The
Franco and Libra wells both tapped into large fields. The agency described the two fields as the biggest discoveries
since Tupi. Overall, the regulator maintains its estimate of recoverable presalt reserves of 50 billion barrels, but
drilling evidence indicates the presalt area may be even larger than previously thought (Petroleum Economist
2010). 31 In Venezuela reserves were reduced as the NOC became the main controller of field operations. In Bolivia
reserves were reduced due to new government regulations following the nationalization of the industry. In
Nigeria the reduction reflected the repayment of a carried interest by the Nigerian partner (see Petrobras Form 20-
Fs for 2007 and 2008). 32 See Petrobras Form 20-Fs for 2007 and 2008. 33 ‚Petrobras Fixed Income Presentation,‛ June 2009, http://www.petrobras.com.br/ri/pdf/fixed_income_jun09.pdf.
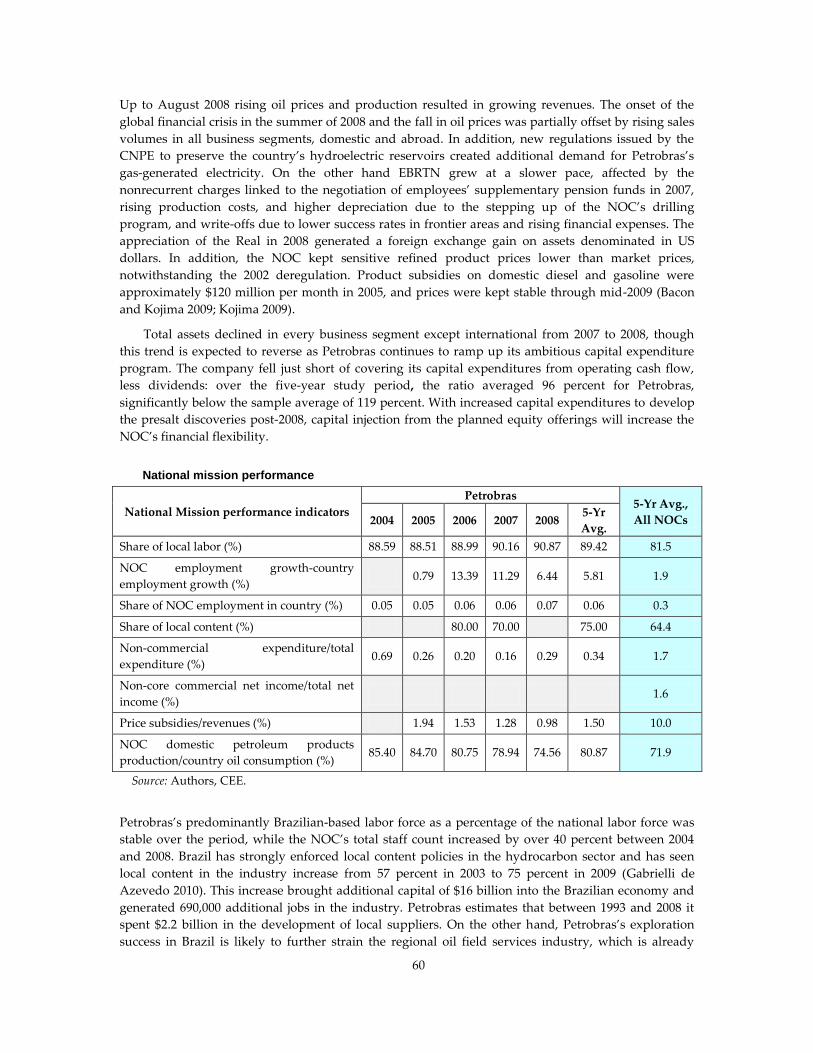
60
Up to August 2008 rising oil prices and production resulted in growing revenues. The onset of the
global financial crisis in the summer of 2008 and the fall in oil prices was partially offset by rising sales
volumes in all business segments, domestic and abroad. In addition, new regulations issued by the
CNPE to preserve the country’s hydroelectric reservoirs created additional demand for Petrobras’s
gas-generated electricity. On the other hand EBRTN grew at a slower pace, affected by the
nonrecurrent charges linked to the negotiation of employees’ supplementary pension funds in 2007,
rising production costs, and higher depreciation due to the stepping up of the NOC’s drilling
program, and write-offs due to lower success rates in frontier areas and rising financial expenses. The
appreciation of the Real in 2008 generated a foreign exchange gain on assets denominated in US
dollars. In addition, the NOC kept sensitive refined product prices lower than market prices,
notwithstanding the 2002 deregulation. Product subsidies on domestic diesel and gasoline were
approximately $120 million per month in 2005, and prices were kept stable through mid-2009 (Bacon
and Kojima 2009; Kojima 2009).
Total assets declined in every business segment except international from 2007 to 2008, though
this trend is expected to reverse as Petrobras continues to ramp up its ambitious capital expenditure
program. The company fell just short of covering its capital expenditures from operating cash flow,
less dividends: over the five-year study period, the ratio averaged 96 percent for Petrobras,
significantly below the sample average of 119 percent. With increased capital expenditures to develop
the presalt discoveries post-2008, capital injection from the planned equity offerings will increase the
NOC’s financial flexibility.
National mission performance
National Mission performance indicators
Petrobras 5-Yr Avg.,
All NOCs 2004 2005 2006 2007 2008 5-Yr
Avg.
Share of local labor (%) 88.59 88.51 88.99 90.16 90.87 89.42 81.5
NOC employment growth-country
employment growth (%) 0.79 13.39 11.29 6.44 5.81 1.9
Share of NOC employment in country (%) 0.05 0.05 0.06 0.06 0.07 0.06 0.3
Share of local content (%) 80.00 70.00 75.00 64.4
Non-commercial expenditure/total
expenditure (%) 0.69 0.26 0.20 0.16 0.29 0.34 1.7
Non-core commercial net income/total net
income (%) 1.6
Price subsidies/revenues (%) 1.94 1.53 1.28 0.98 1.50 10.0
NOC domestic petroleum products
production/country oil consumption (%) 85.40 84.70 80.75 78.94 74.56 80.87 71.9
Source: Authors, CEE.
Petrobras’s predominantly Brazilian-based labor force as a percentage of the national labor force was
stable over the period, while the NOC’s total staff count increased by over 40 percent between 2004
and 2008. Brazil has strongly enforced local content policies in the hydrocarbon sector and has seen
local content in the industry increase from 57 percent in 2003 to 75 percent in 2009 (Gabrielli de
Azevedo 2010). This increase brought additional capital of $16 billion into the Brazilian economy and
generated 690,000 additional jobs in the industry. Petrobras estimates that between 1993 and 2008 it
spent $2.2 billion in the development of local suppliers. On the other hand, Petrobras’s exploration
success in Brazil is likely to further strain the regional oil field services industry, which is already

61
under pressure because of the government’s insistence that more of the equipment used offshore be
owned by Brazilian firms or built in Brazil. Many local companies may not have the financial muscle
to scale up their activities, and access to financing may be harder owing to the global financial crisis.
This may result in increased costs and delays for the NOC and other operators. Some industry
observers have already pointed at the risk that local content requirements together with local service
capacity constraints and a large potential human resources gap could affect the pace of
implementation of Petrobras’s $174 billion investment plan over the next five years (Petroleum
Economist 2010).
The NOC’s subsidy burden is (at 1.5 percent) significantly less than the sample average (at 10.0
percent).34 With respect to Petrobras’s ability to meet Brazil’s oil products demand, the company plans
to make significant refining expenditures post-2008 to increase its ability to process indigenous crude
and to produce products in line with domestic demand. Overall, Petrobras has been able to do much
better than the average of all NOCs in meeting consumption needs domestically.
Value Drivers
Geology
Brazil had 12.8 billion barrels of proven oil reserves in 2008, second in South America only to
Venezuela (BP statistical review 2010). The offshore Campos and Santos Basins, located on the
country’s southeast coast, contain the vast majority of Brazil’s proven reserves. Petrobras announced
that it had discovered an estimated 5 to 8 billion barrels of recoverable reserves (including both oil and
natural gas) in the Tupi field, located in the Santos Basin. The reserves occur in a subsalt zone that is
an average of 18,000 feet below the ocean surface. In addition, oil encountered in the subsalt zones
appears to be lighter and sweeter than most of Brazil’s existing production. Following Tupi, numerous
additional subsalt discoveries were announced, including Carioca, Iara, and Guara, which together
have estimated recoverable oil resources of 9.1 to 14 billion barrels. The subsalt reserves contain a high
concentration of natural gas, along with oil, and proper handling of this gas will require additional
infrastructure and consideration. As a result, production from small pilot projects is possible in the
next several years, but large-scale development of the subsalt reserves will likely not occur until well
into the next decade (EIA 2010).
At the end of 2008 Brazil had 12.7 trillion cubic feet of proven natural gas reserves (BP statistical
review 2010), the largest amount in South America after Venezuela, Bolivia, and Argentina. The
Campos and Santos Basins hold the majority of reserves, but there are also sizable reserves in the
interior stretches of the country. Despite Brazil’s sizable natural gas reserves, natural gas production
has grown slowly in recent years, mainly due to a lack of domestic transportation capacity and low
domestic prices. This has affected in particular the Amazonas state, which contains considerable
unexploited reserves (the Urucu field contains Brazil’s largest onshore natural gas reserves). The
subsalt areas are estimated to contain sizable natural gas reserves as well. According to Petrobras,
Tupi alone could contain 5 to 7 trillion cubic feet of recoverable natural gas, which if proven, could
increase Brazil’s total natural gas reserves by 50 percent (EIA 2010).
Geology has had and will likely continue to have a major influence on Petrobras’s performance.
Four of the 11 producing basins are considered the most prospective from shelf to deepwater. But the
country still has a large number of submature and frontier acreage, including the subsalt province.
34 Subsidies are calculated on the basis of estimates of $120 million per month in 2005 data in Bacon and Kojima
(2009), and may not accurately reflect the subsidies’ burden borne by Petrobras.

62
Only 60 percent of Petrobras’s proven reserves in Brazil are developed. Only 28 percent (Petrobras’s
interest is 24 percent) of the presalt province is under concession. As a result, there is substantial
opportunity for reserve and production growth from both exploration and development activities in
Brazil.
State context
Although upon establishment and until 1997 Petrobras was given the monopoly over petroleum sector
activities, the government has been careful to create a legal and regulatory framework that ensures
Petrobras’s focus on commercial operations, as well as the participation of domestic and foreign
investors. Since the large presalt discoveries of 2007 the government has partially reversed its policy of
cooperative and competitive participation, granting its NOC privileges over the prolific presalt basin
and paving the way for increased participation in the sector. The bills approved by the Brazilian
congress in June 2010 opened new challenges and opportunities for both the NOC and private oil
companies.
Hydrocarbon sector revenues comprised a relatively small part of Brazilian government revenues
over the study time frame. Taxation grew over the same period but remained, on average, about 33
percent of revenues.
Petroleum sector organization and governance
The sector and company reforms undertaken by the government in the late 1990s led to a stronger,
more competitive Petrobras. The creation of the ANP relieved Petrobras of upstream and, eventually,
midstream regulatory burdens and the establishment of a concession system with a fair fiscal regime
enabled profitable upstream investment by Petrobras and others.
Brazil’s intention to promote fair competition was confirmed by the Supreme Court when in July
2007 it ruled in favor of the ANP with respect to the agency’s decision to limit the maximum number
of winning bids that each company could have in some basins offered in the eighth licensing round.
The ANP’s policy aimed to limit the market power of large- and medium-sized oil companies in order
to create more competition. Given the dominant position of the NOC, the decision of the ANP and the
Supreme Court ruling indicated the government’s strong commitment to creating a diversified
investment environment. The effect of the recent reforms on market competition, investors’
confidence, and the NOC’s performance remain to be seen.
Brazil’s local content policies have been instrumental in the creation of a competent and skilled oil
service sector. But the same stringent requirements may prove challenging given the wide gap
between local execution capacity and Petrobras’s investment plans.
Company strategy and behavior
Technology has always been the hallmark of Petrobras’s strategy. Petrobras is world renowned as a
highly competent deepwater operator with world-class technological expertise. The company is one of
the largest investors in research and development (R&D) among the world’s major oil companies, and
is internationally renowned for its innovation and expertise in deep and ultradeep water E&P (Dantas
and Bell 2006). The company dedicates 1 percent of its gross sales to financing new technologies and
since 1966 has operated a dedicated R&D facility that had 2,036 employees in 2008. Petrobras also
conducts R&D through joint projects with universities and other research centers in Brazil and abroad,
in addition to participating in technology exchange and assistance partnerships with other oil and gas
companies. In 2008 its R&D expenditure was $941 million.
The NOC’s strategy relies on three pillars: integrated growth, profitability, and social and
environmental responsibility. These directives apply to all its business activities, with the objective of

63
becoming a model integrated energy company. In order to capitalize on its large petroleum
discoveries, the NOC plans to increase its presence in refining, commercialization, logistics, and
distribution of petroleum products, with a focus on the Atlantic and Far East markets. In the gas and
electricity sectors the NOC envisages further consolidation of its operations in the domestic market.
Stricter synergies between its upstream and petrochemical businesses are also envisaged, as well as the
expansion of its presence in the biofuels market. To support its strategic vision, the NOC has made
and continues to make considerable investment in training and education, as well as support to local
producers and services providers. While contributing to the development of a strong local economy,
the NOC aims to reduce its dependence on imports and its exposure to foreign exchange risks.
Corporate governance
The nine members of the board of directors are appointed at the ordinary general meeting of
shareholders. Various government ministries are represented on Petrobras’s board, which includes the
state minister of mines and energy, the executive secretary for the MME, the military commander for
the southeast, a member of the National Energy Policy Council, and the president of the National
Development Bank. The chairman of the board is the minister of the treasury. Two board members
represent the minority shareholders of common stock and the holders of preferred stock.
The board has three advisory committees: audit, remuneration, and sustainability. The members
of these committees are also board members.
In compliance with Brazilian Corporate Law, the board is overseen by a five-member Fiscal
Council serving a term of one year with the possibility for reelection. Two members represent minority
and preferred shareholders, and three members represent the federal government (of which one is
appointed by the minister of finance). The Fiscal Council is a permanent body, independent of the
NOC’s management. Its task is to supervise and monitor the actions of the NOC’s management, and to
verify compliance with legal and statutory obligations.
The executive board includes the CEO (who is also a board member) and five executive directors
chosen by the board for a three-year term. The executive board is responsible for the management of
the NOC, within the strategic lines determined by the board of directors.
Although Petrobras’s budget processes are separate from that of the government, the company’s
capital budget must be approved by the Brazilian Congress. The new regulatory framework for the
hydrocarbon sector passed by the Senate in June 2010 is expected to increase the government’s share in
Petrobras.
Petrobras complies with the regulations of (i) the Sao Paulo stock exchange (BOVESPA) in Brazil,
(ii) the Securities and Exchange Commission and the New York Stock Exchange in the United States,
(iii) the Madrid stock exchanges’ Latin America Securities Market (Latex) in Spain, and (iv) the
Argentinean Securities’ Commission (CNV) and the Buenos Aires stock exchange in Argentina.
The company has adopted international accounting standards. Its financial statements and proven
reserves are audited by independent international firms. External auditors are changed every five
years.
The NOC has a formal dividend policy. Shareholders shall be entitled in each fiscal year to
dividends and/or additional payment on shareholders’ equity, which must not be less than 25 percent
of the net profit adjusted according to Corporate Law.

64
Conclusions
Since its establishment in 1953 as an SOE with majority state participation, the government has
deliberately granted Petrobas administrative and financial independence and a commercial mandate.
Although the NOC was granted a monopoly of the petroleum sector (with the exception of retail
distribution), the participation of domestic and foreign private companies was never prohibited. On
the contrary, the NOC’s participation in joint ventures, both domestic and international, was an
important part of its strategy.
The sector and company reforms undertaken by the government in the late 1990s further
strengthened competition by lifting the NOC’s monopoly and creating a strong independent regulator,
the ANP. The establishment of a concessionary system with a fair fiscal regime enabled profitable
upstream investment by Petrobras and others, notwithstanding a challenging operational
environment.
Petrobras’s substantial and continuing investments in technology have contributed significantly to
the company’s performance. Among other benefits, they have enabled the company to successfully use
its deepwater expertise to spearhead its international upstream expansion. The company’s ability to
innovate technologically should help it mitigate some of the risks associated with the presalt province.
But Petrobras faces significant challenges and substantial business, execution, and financial risks
to its value creation capacity going forward. Presalt exploration and development is unknown,
technologically complex, and very expensive. The company will have to ramp up capital expenditures
and activity to unprecedented levels, in an environment where it may face services and human
resources shortages. In addition, recent reforms of the country’s hydrocarbon sector organization and
governance could increase the complexity and uncertainty of Petrobras’s operating environment.

65
References
Bacon, Robert, and Masami Kojima. 2009. ‚Coping with Higher Oil Prices.‛ Extractive Sector
Management Assistance Program, World Bank Group, Report 323/06, (August).
BP Statistical Review. 2010. (http://www.bp.com)
Carvalho, F., and A. Goldstein. 2008. ‚The ‘Making of’ National Giants: Technology and Governments
Shaping the International Expansion of Oil Companies from Brazil and China.‛ UNU Working Paper
Series, #2008-021, United Nations University. Maastricht, The Netherlands.
Dantas, Eva, and Martin Bell. 2006. ‚The Development of Firm-Centered Knowledge Networks in
Emerging Economies: The Case of Petrobras in the Offshore Oil Innovation System in Brazil.‛ Paper
presented at the Druid Summer Conference 2006 on Knowledge, Innovation and Competitiveness: Dynamics
of Firms, Networks and Institutions, Copenhagen, June.
Ferreira, P., and C. Del Vecchio. 2007. ‚Pipeline Technology Development.‛ Presentation, May.
http://www.petrobras.com.
Gabrielli de Azevedo, Jose Sergio, Petrobras CEO. 2010. ‚Petrobras.‛ Presentation, The Brazil-Texas
Chamber of Commerce, March 8. http://www.petrobras.com.br.
Kojima, Masami. 2009. ‚Government Response to Oil Price Volatility.‛ Oil, Gas and Mining Policy
Division, World Bank Group (July). http://www.worldbank.org.
McGann, F., and C. Vegner. 2010. ‚Strong 9% Rise in SEC Reserves on Higher Oil Price Assumptions.‛
Bank of America and Merrill Lynch, January 16.
Petrobras. SEC Form 20Fs 2004–08 and company presentations. http://www.petrobras.com.
Philip, G. 1982. ‚Oil and Politics in Latin America: National Movements and State Companies.”
Cambridge: Cambridge University Press.
Tordo, S. 2009. ‚Petroleum Exploration and Production Rights. Allocation Strategies and Design
Issues.‛ World Bank Working Paper No. 179/2009, Washington, DC.
Villanueva, J., R. Carvalho, R. Guedes, and D. Kastholm. 2009. ‚New Exploration and Production
Regulation in the Brazilian Oil and Gas Industry.‛ Fitch Ratings, September 25.
http://www.fitchratings.com.
Zacks Investment Research. 2010 ‚Petroleo Brasileiro SA—ADR C.‛ March 31. http://www.zacks.com.
66
7. Petro China Company Limited
(China)
PetroChina was formed in 1999 as a wholly owned subsidiary of China National Petroleum
Corporation (CNPC) and is now one of the largest companies in China in terms of sales. It is the
largest and, according to some industry observers, the most influential of China’s three national oil
companies (NOCs) (Chen 2008). PetroChina accounts for 60 percent of China’s oil production and 80
percent of its gas production. The company controls 70 percent of China’s oil and gas transmission
pipeline capacity and 35 percent of its refining capacity.
Since its reorganization and partial privatization in 2000, PetroChina is a commercially focused,
profit-oriented company. But it still makes sizeable contributions to the national development agenda
through the sale of refined products and natural gas below the international market price as well as
social expenditures. Petro China’s maturing domestic upstream assets and its reliance on possibly
costly international sources for future upstream growth may limit the NOC’s ability to fulfill its
growing social programs (Wong and Leung 2010).
PetroChina faces challenges in petroleum sector governance and organization. The sector’s policy
and regulatory apparatus is cumbersome, and has been seen by industry observers as a possible
barrier to investment by PetroChina and others. China’s pending Proposed Energy Law and
associated sector governance and institutional reforms are expected to enhance Petro China’s value
creation capability.
Company and country sector evolution
Business activities
PetroChina35 is engaged in a broad range of oil- and natural-gas-related activities, including: (i) oil and
gas exploration and production (E&P) predominantly in China and, to a much lesser extent, abroad;
(ii) oil refining, transportation, storage, and marketing; (iii) production and marketing of basic
petrochemical products and derivative chemical products; and (iv) transmission and storage of crude
oil and natural gas as well as the sale of natural gas. The NOC is:
China’s largest producer of oil and natural gas—in 2008 it produced 871 million barrels of oil
and 1,864 billion cubic feet of gas
A major oil refiner, operating 26 refineries in China at the end of 2008 with throughput of 850
million barrels of oil
A major retail operator, with 16,725 service stations that it owns and operates as well as 731
franchise service stations
A producer of a wide range of basic and derivative petrochemical products through 13
chemical plants and 4 chemical products sales companies
35 Information in this section comes from PetroChina’s SEC Form 20F dated 12/31/08,
http://www.petrochina.com.cn.
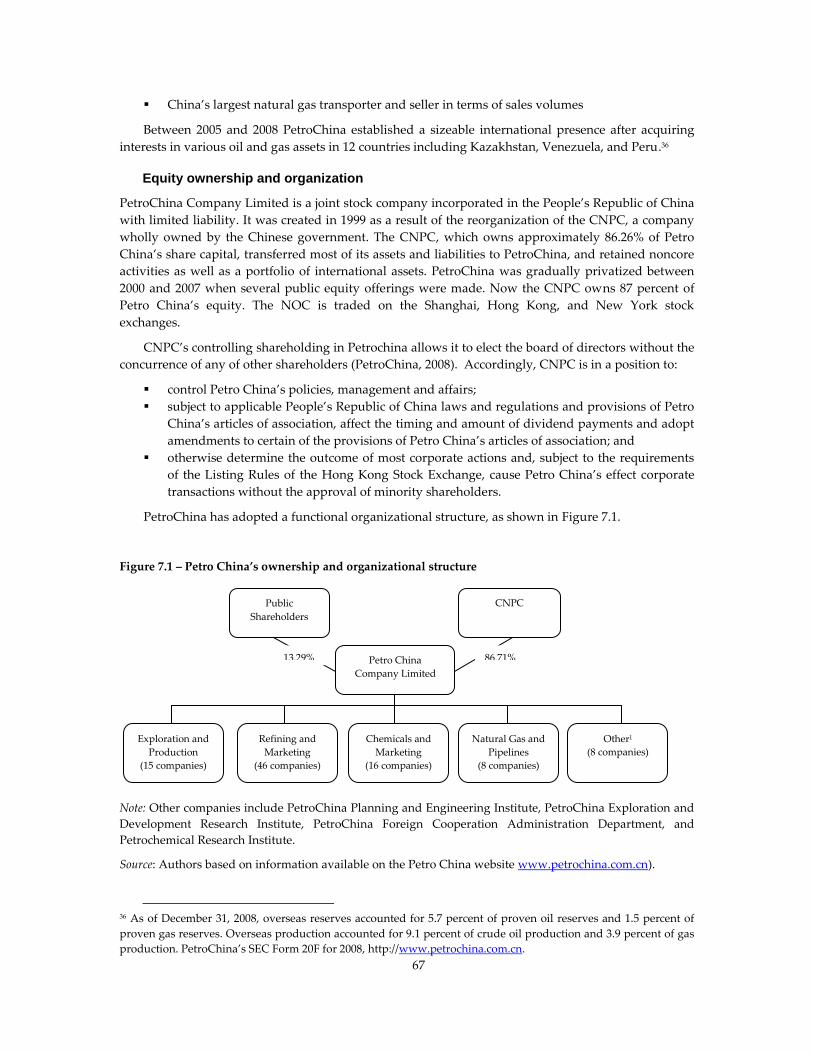
67
China’s largest natural gas transporter and seller in terms of sales volumes
Between 2005 and 2008 PetroChina established a sizeable international presence after acquiring
interests in various oil and gas assets in 12 countries including Kazakhstan, Venezuela, and Peru.36
Equity ownership and organization
PetroChina Company Limited is a joint stock company incorporated in the People’s Republic of China
with limited liability. It was created in 1999 as a result of the reorganization of the CNPC, a company
wholly owned by the Chinese government. The CNPC, which owns approximately 86.26% of Petro
China’s share capital, transferred most of its assets and liabilities to PetroChina, and retained noncore
activities as well as a portfolio of international assets. PetroChina was gradually privatized between
2000 and 2007 when several public equity offerings were made. Now the CNPC owns 87 percent of
Petro China’s equity. The NOC is traded on the Shanghai, Hong Kong, and New York stock
exchanges.
CNPC’s controlling shareholding in Petrochina allows it to elect the board of directors without the
concurrence of any of other shareholders (PetroChina, 2008). Accordingly, CNPC is in a position to:
control Petro China’s policies, management and affairs;
subject to applicable People’s Republic of China laws and regulations and provisions of Petro
China’s articles of association, affect the timing and amount of dividend payments and adopt
amendments to certain of the provisions of Petro China’s articles of association; and
otherwise determine the outcome of most corporate actions and, subject to the requirements
of the Listing Rules of the Hong Kong Stock Exchange, cause Petro China’s effect corporate
transactions without the approval of minority shareholders.
PetroChina has adopted a functional organizational structure, as shown in Figure 7.1.
Figure 7.1 – Petro China’s ownership and organizational structure
Note: Other companies include PetroChina Planning and Engineering Institute, PetroChina Exploration and
Development Research Institute, PetroChina Foreign Cooperation Administration Department, and
Petrochemical Research Institute.
Source: Authors based on information available on the Petro China website www.petrochina.com.cn).
36 As of December 31, 2008, overseas reserves accounted for 5.7 percent of proven oil reserves and 1.5 percent of
proven gas reserves. Overseas production accounted for 9.1 percent of crude oil production and 3.9 percent of gas
production. PetroChina’s SEC Form 20F for 2008, http://www.petrochina.com.cn.
Petro China
Company Limited
CNPC Public
Shareholders
Exploration and
Production
(15 companies)
Chemicals and
Marketing
(16 companies)
Refining and
Marketing
(46 companies)
Natural Gas and
Pipelines
(8 companies)
Other1
(8 companies)
13.29% 86.71%
%

68
PetroChina and China’s Hydrocarbon Sector: History
Between 1949 and 1998, China’s hydrocarbon sector experienced significant institutional change. From
the 1950s to 1988, policy, regulatory, and commercial hydrocarbon sector functions were the
responsibilities of the Ministry of the Petroleum Industry (MPI). The MPI embarked on a large
program to explore and develop oil resources for China’s industrialization. Manpower to support this
effort was initially supplied by the People’s Liberation Army (Zhang 2004). The MPI was also
responsible for the production, transport, and marketing of oil and refined products, which were
carried out in accordance with the State Planning Commission’s national plan. The Petroleum
Administrative Bureaus (PABs), mostly located in remote areas, executed the investment and
production plans (Zhang 2004). As a result of these efforts, in 1965 China’s domestic production
became sufficient to satisfy its consumption needs.
In 1982 foreign oil companies were given access to offshore areas in association with the China
National Offshore Oil Corporation, which was wholly owned by the Chinese government and was
given the exclusive right to enter into offshore E&P arrangements with foreign oil companies. But it
was not until 1985 that foreign oil companies could gain access to Chinese onshore territories.
In 1988 the Chinese government abolished the MPI and transferred its assets and many of its
regulatory functions to the CNPC, a ministry-level corporation under the direct control of the State
Council. The CNPC was also assigned the policy, planning, and organizational responsibilities for
international exploration and development. Large-scale social services that were undertaken by the
PABs in remote producing areas, such as schools, hospitals, public transportation, were temporarily
transferred to the CNPC with the objective to gradually separate them from the core oil and gas
businesses. The CNPC was given the exclusive right to enter into onshore E&P arrangements with
foreign oil companies. Indicators such as profit levels and industrial value added were introduced to
measure its performance (Zhang 2004). By 1998 the CNPC had signed 47 onshore E&P contracts with
foreign oil companies, representing $1.1 billion in foreign investment (Zhang 2004).
By the late 1990s, China’s three major national oil companies—the CNPC, Sinopec (primarily
downstream), and CNOOC (offshore upstream)—were experiencing severe declines in profitability
due to falling oil and petrochemical prices. Investment faltered, and in 1993 China became a net oil
importer. In 1998 the Chinese government embarked on a massive restructuring of the three
companies to reduce their operating and management costs, improve their efficiency, and achieve
economies of scale and scope (Zhang 2004). The government’s goal was to ‚create internationally
competitive large oil companies‛ (Zhang 2004).
Through massive asset swaps, the CNPC and Sinopec became vertically integrated oil companies.
The administrative and regulatory functions of the companies were transferred to a newly created
government entity, the State Petroleum and Chemical Industry Bureau. Noncore businesses were
separated from core oil- and gas-related activities. The CNPC retained the noncore businesses as well
as social functions, employing more than 800,000 people at the time and generating significant losses,
and transferred oil and gas core businesses to PetroChina (Zhang 2004). The CNPC also retained the
exclusive right to enter into onshore E&P contracts with foreign oil companies, although it agreed to
assign to PetroChina ‚all the commercial and operational rights and obligations under the Production
Sharing Contracts‛ (Zhang 2004). Responsibility for international assets and activities remained with
the CNPC, but PetroChina was granted the right to acquire international assets from the CNPC.37 Soon
after, the first international public offering of 10 percent of Petro China’s equity was launched, raising
$2.89 billion on the Hong Kong and New York stock exchanges.
37 PetroChina has an option to purchase, at any time, all of the CNPC’s interests in overseas projects (Zhang 2004).
69
Of the three Chinese national oil companies, PetroChina is the largest and most influential,
accounting for 60 percent of oil production, 80 percent of natural gas production, 70 percent of oil and
gas transmission pipeline capacity, and 35 percent of refining capacity (EIA 2009). Private companies
operating in China accounted for only about 11 percent of oil and gas production and 18 percent of
refining capacity over the period 2005–08.
Following the dissolution of the MPI, sector regulatory and administrative functions were shared
by a large number of government entities and companies; that is, there was no unified ministry
devoted to administering the energy sector (Zhang 2009). As of 2008, primary administration and
policy coordination over China’s hydrocarbon sector was entrusted to the National Development and
Reform Commission (NDRC).38 Two bureaus report to the NDRC: the Energy Bureau and the Price
Bureau. The Energy Bureau approves large energy projects and makes policy recommendations to the
NDRC, and the Price Bureau sets fuel and electricity prices (Chen 2008). The Mineral Resources Law
provides the basic legal framework for the issuance of E&P licenses by the Ministry of Land and
Resources.39 The Ministry of Commerce regulates oil and refined product imports and exports, and
approves Chinese foreign equity investments, cooperative joint ventures, and production sharing
contracts. The Ministry of Environmental Protection sets and enforces environmental standards. The
State-Owned Assets Supervision and Administration Commission exercises the government’s
shareholder rights, and the Ministry of Personnel appoints companies’ senior leadership (Chen 2008).
Despite the plethora of laws, regulations, and administrative entities, China still lacks a unified
energy policy (Zhang 2004). Drafting of a Proposed Energy Law began in 2006 (Greene, Tong, and
Chen 2009), and the law was expected to be submitted to the State Council sometime in 2010.
In the meantime, sector administration is complex and often lacks the tools and resources for
effective administration. Energy policy making and regulation is shared among various government
departments, with conflicting priorities (Chen 2008; Zhang 2004). To complicate the matter, as noted
by industry observers, China’s large energy companies are better funded and have larger research
departments than government regulators. As a result, regulators depend on the companies for key
input on important energy policies and decisions (Chen 2008). To address these issues, the State
Council established a 23-member National Energy Commission in January 2010, headed by Premier
Wen Jiabao, with the responsibilities of formulating national energy development strategy, reviewing
energy security and developments issues, and coordinating international cooperation. Members
include ministers from finance, foreign affairs, commerce, and environmental protection.
38 The NDRC itself is a result of restructuring, replacing the former State Development Planning Commission
(SDPC) in 2003. 39 PetroChina’s SEC Form 20F dated 12/31/08, http://www.petrochina.com.cn.

70
Value creation index
Operational Performance
Operational Performance Indicators
PetroChina 5-Yr Avg.,
All NOCs 2004 2005 2006 2007 2008 5-Yr
Avg.
E&P production growth (%) 10.38 5.40 4.77 1.34 6.62 5.7 10.4
Reserves replacement rate (BOE, %) 162.43 152.61 194.17 166.15 121.25 159.2 95.8
Refinery utilization rate (%) 88.82 88.19 83.89 87.46 89.14 87.4 90.3
Output / total assets (BOE/'000$) 22.33 19.15 17.38 13.89 11.87 16.9 16.2
Output / total employees ('000 BOE) 4.06 4.15 4.27 4.20 4.29 4.2 20.6
Source: Authors, CEE.
Note: boe = barrel of oil equivalent.
Oil and gas production growth and reserve replacement continue to be challenging issues for
PetroChina. Over 34 percent of its current crude oil volumes come from the Daiqing oil region
(discovered in 1959), which is ‚currently well past its prime‛ (Zack’s Investment Research 2010).
PetroChina is using natural gas from Daiqing for enhanced oil-recovery projects, hoping to stabilize
Daiqing’s oil output. But many analysts expect little or no growth from Petro China’s domestic oil
fields. Bank of America and Merrill Lynch pointed out recently that in the past few years, nearly 90
percent of oil production growth came from overseas operation (Wong and Leung 2010). The CNPC’s
overseas upstream business arm, the CNPC Exploration and Development Co., is a 50-50 joint venture
between PetroChina and the CNPC, and is managed by PetroChina.40
Petro China’s refining business was created by combining previously separate refineries, many
small and inefficient and some previously owned by Sinopec. PetroChina has been upgrading those
with large capacities and shutting down the smaller, more inefficient facilities. In 2008 the company
completed the construction or renovation of 19 refining projects to improve product mix and quality,
particularly with respect to gasoline and diesel (Zhang 2004). These modernizations should allow
PetroChina to improve its refinery utilization rate.
PetroChina faces declining output relative to total assets. This may be because of the large
employment base that the company continues to maintain. Petro China’s output per employee is also
low relative to the other NOCs in our sample. This metric may reflect national mission priorities that
place a burden on the NOC’s efficiency, which in the long run may hinder its ability to create value.
40 Reuters (2010). Citing oil prices and income tax concerns, PetroChina halted plans to buy out ‚safe‛ overseas
assets from the CNPC. But its long-term plan is to ‚inject all safe overseas assets into PetroChina‛ with ‚sensitive
assets such as those in the Sudan‛ remaining with the CNPC.
http://www.economictimes.indiatimes.com/news/international-business/PetroChina-halts-CNPC-assets-purchase-
plan/articleshow/5953718.cms.

71
Financial performance
Financial Performance Indicators PetroChina 5-Yr Avg.,
All NOCs 2004 2005 2006 2007 2008 5-Yr Avg
EBRTN / revenues (%) 43.37 39.35 37.25 32.85 26.49 35.9 45.3
EBRTN / total assets (%) 26.99 27.99 29.49 25.70 23.75 26.8 34.9
Net cash flow / CAPEX (%) 92.61 139.48 124.08 105.87 73.65 107.2 131.4
Source: Authors, CEE.
Note: EBRTN = earnings before interest, taxes, and noncommercial expenditures; CAPEX = capital
expenditure.
Petro China’s profitability has been under pressure from increasing costs in its mostly mature
upstream sector, and losses due to artificially low domestic refined products and natural gas prices.
Unit-lifting costs have been rising at Petro China’s mature fields, increasing 20 percent in 2008 at
Daiqing alone. Refined products prices were held below international market levels over the period
2005–08. As a result, PetroChina incurred losses averaging about 5 percent of revenues in its refining
operations. A similar situation existed in the natural gas market, since China has favored
manufacturing and fertilizer gas users by keeping gas prices well below market rates over the same
period. As the largest gas supplier in China, this policy has hurt Petro China’s profits. Some natural
gas price relief was provided by the NDRC in mid-2009, but increases are expected to be gradual so as
not to damage the industrial sector during the economic downturn (EIA 2009).
Although capital expenditures comfortably covered depreciation over the period, net cash flow
(after taxes and dividends) as a percentage of capital expenditure reveals a much tighter fiscal
situation. The latter ratio averaged 107 percent in 2005–08, dropping to 74 percent in 2008. This
situation is directly linked to the profitability issues discussed above, and to the 364 percent increase in
the company’s noncommercial social and economic expenditures from 2006 to 2008.
National mission performance
National Mission Performance Indicators
PetroChina 5-Yr Avg.,
All NOCs 2004 2005 2006 2007 2008 5-Yr
Avg.
Share of local labor (%) 99.00 99.00 99.00 99.00 99.00 99.0 81.5
NOC employment growth-country
employment growth (%) 2.73 2.75 0.83 3.93 1.67 2.4 1.9
Share of NOC employment in country
labor force (%) 0.06 0.06 0.06 0.06 0.06 0.1 0.3
Share of local content (%) 97.99 82.11 69.94 62.79 47.21 72.0 64.4
Non-commercial expenditure / total
expenditure (%) 0.04 0.06 0.06 0.0 1.7
Non-core commercial activities net income
/ total net income (%) 0.0 1.6
Price subsidies / revenues (%) 4.99 3.58 4.22 2.47 7.75 4.6 10.0
NOC domestic petroleum products
production / country oil consumption (%) 22.33 22.78 22.90 23.19 23.14 22.9 71.9
Source: Authors, CEE.
The share of domestic labor is an estimate based on the mainly domestic nature of the NOC’s
operations for most years in our analysis. The NOC’s 2008 Social Sustainability Report appears to

72
corroborate our assumption (Petrochina 2008). Since the company’s businesses are capital intensive
rather than labor intensive, PetroChina employs a relatively small percentage of China’s labor force. In
addition, a large number of noncore business employees remained at the CNPC at the time of Petro
China’s first initial public offering.
Petro China’s noncommercial social and economic expenditures increased significantly from 2006
to 2008, particularly in the areas of poverty alleviation and education donation. It also consistently
contributed to disaster relief. In addition, fuel price subsidies grew considerably between 2005 and
2008. At the peak of the oil price cycle, the cost of subsidies to PetroChina was well above the average
of all NOCs in our sample. However, in December 2008 the government launched a fuel tax and
reform of the country’s product pricing mechanism in an effort to align retail oil product prices more
closely with international crude oil prices, attract downstream investment, ensure higher profit
margins for refiners, and reduce energy consumption (EIA, 2010).
PetroChina does not have noncore commercial activities as these activities were deliberately left
with the CNPC. But the company contributes to strengthening domestic backward linkages by
purchasing goods and services from the CNPC and other CNPC group affiliates in the areas of oil field
construction and technical services, production services, supply of material services, social services,
and financial services.
In line with its business model, PetroChina provides a relatively small part of China’s
consumption of oil products; the majority of China’s refining assets are owned by Sinopec.
Value Drivers
Geology
According to the BP statistical review 2009, at the end of 2008 China held about 1.1 percent of the
world’s oil reserves or 14.8 billion barrels, and about 1.3 percent of the world proved natural gas
reverse or 86.7 trillion cubic feet. China’s largest and oldest onshore oil fields—Daqing, Shengli and
other ageing fields—have been producing since the 1960s, and are in significant decline.
Nearly 15 percent of China’s oil production is from offshore reserves, and most of its net oil
production growth will likely also come from offshore fields. Offshore E&P activities have focused on
the Bohai Bay region, Pearl River Delta, South China Sea, and, to some extent, the East China Sea. The
Bohai Bay Basin, located in northeastern China, is the oldest oil-producing offshore zone and holds a
large portion of proven offshore reserves in China. In May 2007, PetroChina announced a reserve
assessment of its newest oil field in Bohai Bay, claiming that it could be the largest oil find in three
decades. The Nanpu field holds proven oil reserves of 3.7 billion barrels. PetroChina initiated phase
one development of the Nanpu field in June 2007, and hopes to bring 200,000 bbl/d of crude oil
production onstream by 2012 (EIA, 2010).
State context
The Chinese state had, and continues to have, a significant influence on the formation,
organization, and strategy of PetroChina. The partial privatization of the company responded to the
government’s imperative to secure greater access to global oil and gas resources (Zhang 2004). To this
end, PetroChina was structured in a manner that would allow it access to investment capital and
would enable it to compete successfully with international oil and gas companies.
China’s growing dependence on oil imports and the government’s concern about the security of
supplies play an important role in explaining the NOC’s aggressive strategies, domestically and
internationally, as well as the support afforded by the government. Government loans to and strategic

73
infrastructure investments in various countries, including Russia, Venezuela, Kazakhstan, Brazil,
Ecuador, Nigeria, and other countries, may have helped to create comparative advantages for
PetroChina and other Chinese NOCs in their attempts to penetrate new markets (EIA 2009).
Except for political stability and voice and accountability, China’s Governance Indicators have
been steadily improving over the period 2004-2008.
Petroleum sector organization and governance
By relieving PetroChina of regulatory, administrative and non-core commercial activities, the Chinese
government enabled the company to focus on commercial operations, as well as resolved a potential
conflict of interest.
In view of its mature and declining oil asset base, PetroChina itself has indicated a need for
advanced technologies and cooperative ventures with foreign oil companies.41 But as indicated by
China’s scores in the Fraser Institute Global Petroleum surveys (2007 and 2008), China’s fiscal, tax, and
regulatory regimes, while generally positive, have not been as attractive as that of some other
countries. Indeed, private companies still play a minor role in China’s upstream oil and gas sector,
accounting for about 11 percent of China’s domestic oil and gas production from 2005 to 2008.
As discussed earlier, the lack of a coherent regulatory and fiscal framework for natural gas has
hindered the development of this resource for all market participants and PetroChina in particular.
Company strategy and behavior
PetroChina accounts for roughly 80 percent of China’s total oil and gas output. The company’s current
strategy is to expand its downstream presence both domestically and abroad (EIA, 2010). The
company has a long history of operatorship, particularly in the upstream, which has served it well in
maintaining oil output despite declines due to maturity. Petro China’s capital expenditures have a
decided upstream focus, averaging 74 percent during 2005–08, which have enabled it to increase
production and maintain the level of its proved reserves.
The company has been investing heavily in technologies to increase recovery rates at its mature oil
fields. To improve production levels and reserves additions, the PetroChina has signed production
sharing contracts with foreign firms to co-develop fields in the northeastern region and has focused on
developing largely untapped reserves in the western interior provinces (Xinjiang, Sichuan, Gansu,
Inner Mongolia).42
While there are significant onshore gas reserves, China’s natural gas market is relatively
undeveloped. Being the largest natural gas reserve holder in China, the development of a local gas
market represent a potential source of upstream and midstream growth for PetroChina.
Training appears to be an important element of Petro China’s strategy. The company reports that
it has spent RMB 550 million, or about 20 percent of 2006–08 revenues, on employee training
development.43
According to the United Nations University, Chinese oil and gas companies, including
PetroChina, have made significant science and technology research and development expenditures to
‚catch up technologically with the world’s leading firms‛ (Carvalho and Goldstein 2008). In 2006
41 ‚2009 Annual Results Presentation,‛ http://www.petrochina.com.cn. PetroChina has concluded at least three
transactions with majors who ‚can offer/share technical expertise . . . in difficult areas‛: Chevron-Luojiazhai gas
field; Total-Sulige gas field in Inner Mongolia, and Shell-Changbei gas field. See Lahn (2007). 42 EIA "Annual Results Presentation,‛ available at www.petrochina.com.cn. 43 2008 Corporate Social Sustainability Report, http://www.petrochina.com.cn.
74
PetroChina was ranked eighth in the world in research and development performance, but patents
production is still only a fraction of that of its Western competitors (Carvalho and Goldstein 2008).44
Corporate governance
The board of directors of PetroChina has considerable autonomy with respect to budget and financial
management decisions. But the NOC must obtain NDRC approval for a broad range of specific
investment projects, including oil and gas development projects over a certain size, liquefied natural
gas projects, cross-province oil or gas transportation projects, new refineries or first expansions of
existing refineries, and certain petrochemical projects. Delays and uncertainty with respect to the
NDRC’s approvals increase the risk profile of the projects and may affect value creation.
In 2008 about one-third of Petro China’s board members were independent, up from 23 percent in
2004. But more than half of its directors were affiliated with the CNPC or an affiliate of the CNPC in
2008. The board appoints the company’s senior management but the Ministry of Personnel is also
involved in this process. In addition, there is another layer of supervision above the board called the
‚supervisory board,‛ which monitors financial matters and ‚oversees the actions of the BOD and the
company’s senior management personnel.‛ Some 44 percent of the supervisors are affiliated with the
CNPC and 22 percent are independent. The remaining supervisors are elected shareholder and
employee representatives.
Financial and reserve auditing transparency improved after the partial privatizations. Financial
statements were audited by an independent international auditor and reserves by an independent
international firm with reports filed in Hong Kong, Shanghai, and New York.
Conclusions
PetroChina is a commercially focused, profit-oriented company that has had strong operational and
financial performance while making significant contributions to the national development agenda. The
company was relieved of noncore commercial activities, and its declining purchases from the CNPC
and its group affiliates as a percentage of total purchases demonstrate its ability to obtain attractive
terms elsewhere. It continues to be a significant contributor to local supply industries. On the other
hand, Petro China’s increasing national mission contributions may pose a challenge to the NOC’s
ability to improve its current operational and financial performance levels. This is especially so as
maturing domestic upstream assets and an aggressive international expansion program impose higher
costs. In addition, Petro China’s profitability is likely to face challenges as it begins to import natural
gas from Central Asia at prices higher than controlled domestic natural gas prices.
Like the other Chinese NOCs, Petro China’s efficiency and ability to create value may be hindered
by the complexity of the sector policy and regulatory apparatus, which could act as a barrier to foreign
investment. The NOC’s complex governance structure, with its various supervision layers and
restricted investment decision authority, may hinder the NOC’s ability to effectively compete, since
most of its competitors do not face these limitations.
44 Moreover, Chinese oil firms still face great obstacles in purchasing/capturing the technologies embodied in the
products of specialist suppliers.

75
References
Carvalho, Flavia, and Andrea Goldstein. 2008. ‚The ‘Making of’ National Giants: Technology and
Governments Shaping the International Expansion of Oil Companies from Brazil and China.‛
UNU_MERIT Working Papers, ISSN 1871-9872. Maastricht, The Netherlands
http://www.merit.unu.edu/publications/wppdf/2008/wp2008-021.pdf.
Chen, Nicholas V. 2008. ‚China’s Energy Market: Overview and Opportunities.‛ Pamir Law Group,
Energy Practice Group, Cape Town, South Africa, September 19.
EIA (U.S. Energy Information Administration). 2009. China Country Analysis Brief, July.
http://www.eia.doe.gov/cabs/China/pdf.pdf.
Fraser Institute. 2007 and 2008. Global Petroleum Survey (June each year).
http://www.fraserinstitute.org/researchandpublications/publications/search.aspx?Page=1&title=&auth
or=0&keyword=&date=0&topic=0&formatid=93&sort=date.
Greene, J., J. Tong, and M. Chen. 2009. ‚China’s Proposed Energy Law Would Create Comprehensive
Energy, Regulatory Scheme.‛ DLA Piper UK LLP Newsletter, February. http://www.dlapiper.com.
Lahn, Glada. 2007. ‚Trends in Asian National Oil Company Investment Abroad: An Update.‛ Chatham
House (November).
Wong, T., and V. Leung. 2010. ‚PetroChina: More Gas, More Profit?‛ Bank of America and Merrill
Lynch, March 12.
Zack’s Investment Research. 2010. ‚PetroChina Company Limited-ADR.‛ April 13.
Zhang, Jin. 2004. Catch-Up and Competitiveness in China: The Case of Large Firms in the Oil Industry.
London and New York: Routledge Curzon Studies on the Chinese Economy.
Zhang, Xiangdong. 2009. ‚China to Establish New National Energy Commission.‛ December 15.
http://www.eeo.com.cn/ens/Politics/2009/12/15/158171.shtml.

76
8. Petroliam Nasional Berhad
(Malaysia)
Once an energy-rich country, Malaysia is now increasingly relying on imports to meet its energy
demands. Prior to 1970 Malaysia imported all its petroleum from other countries. It was then that a
policy decision was made to create the regulatory and institutional conditions needed for the
development of domestic petroleum resources. Petronas was established with ownership of and
exclusive rights to the development of the country’s petroleum resources.
Today Petronas is considered as an example of a successful national oil company (NOC), both
domestically and internationally. Malaysia’s liquefied natural gas (LNG) value chain, developed and
operated by Petronas, is one of the largest and most successful in the world. The company has built a
large international portfolio of assets, critical to its success given the limited domestic exploration and
production (E&P) opportunities.
The company’s widely admired technical and managerial competence appear to have benefited
from participation of international companies in Malaysia’s hydrocarbon sector and scrutiny from
international debt and equity markets. Malaysia and Petronas face an energy security problem similar
to that faced in 1970, but more difficult to solve given the decline in domestic oil and gas resources.
This will require an even closer cooperation between the NOC and its owner, supported by a coherent
set of policies addressing energy supply, demand, and pricing.
Company and country sector evolution
Business activities
Petronas is now the world’s second-largest multinational company based in a developing country
(Goldstein 2009). It is engaged in a broad range of oil- and natural-gas-related activities including: (i)
oil and gas E&P, both domestic and international; (ii) oil refining, transportation, storage, and
distribution in Malaysia and South Africa; (iii) production of LNG and natural gas processing and
transmission in Malaysia and overseas; (iv) petrochemical production in Malaysia; and (v) maritime
shipping and logistics. 45 As of the end of March 2009 (fiscal year 2008):
Domestic oil and gas production was 426 million barrels of oil equivalent (boe), accounting for 70
percent of Malaysia’s production. Petronas operates 33 percent of the company’s reported
domestic production.
International oil and gas production was 230 million boe, accounting for about 35 percent of the
company’s total production. Petronas participates in 66 international upstream ventures in 22
45 Information in this section comes from the Petronas Group Financial Results Announcement and presentation
for the year ended March 31, 2009, and the Petronas Annual Report 2009 (Petronas 2009).

77
countries. In 42 percent of those ventures Petronas is the sole operator; it is the joint operator in an
additional 21 percent.
Petronas operates 65 percent of Malaysia’s refining capacity and controls 18 percent and 27
percent, respectively, of refining capacity and retail fuel markets in South Africa. The South
African operations contribute about 20 percent of Petronas’s total revenue.
Petronas is a large exporter of LNG, second only to Algeria and Indonesia, and accounts for 19
percent of the market share in Japan, 22 percent in South Korea, and 30 percent in Taiwan.
Petrochemical production averaged about 9.3 million tonnes in recent years, with plant reliability
rates of about 95 percent.
Petronas currently is the world’s largest owner and operator of LNG carriers.46
Petronas: Equity ownership and organization
Petronas is wholly owned by the Malaysian government through the Ministry of Finance. Four of
its majority-owned subsidiaries have some private ownership, including foreign equity participation,
and are listed on the Malaysia Bursa (stock exchange). The traded subsidiaries include the Petronas’
E&P company, its natural gas transmission company, its refining company, and its petrochemical
company (Von Der Mehden and Troner 2007). Petronas’s organizational structure is illustrated in
figure 8.1.
Figure 8.1– Petroleum sector organization
Notes:
*The seven Energy Commission members are appointed by the Minister of Energy.
** The Prime Minister appoints the Chairman of the Board of Directors of Petronas, who is also the
CEO.
Source: Authors, based on information available on Petronas website (www.petronas.com.my).
46 But the company’s leading role is likely to be supplanted by the Qatar LNG businesses (QatarGas and RasGas).
Malaysia Parliament
Cabinet led by Prime
Minister
Prime Minister Policy
Ministry of Energy, Green
Technology, Water (Policy
excluding Upstream)
Ministry of Finance (Owns
10% of Petronas.’ shares)
Economic Planning Unit
(Policy)
Implementation
Coordination Unit
(Execution)
Petronas**
(Upstream Regulation,
Commercial Operations)
Energy Commission*
(Regulation excluding
Upstream)

78
Petronas and Malaysia’s hydrocarbon sector: History
Malaysia is the twenty-sixth largest producer of crude oil, and the fourteenth producer of natural gas
in the world. The country is one of the leading LNG developers and exporters. As shown in figure 8.2,
while oil production has declined with field maturities, natural gas production has increased with new
discoveries.
Figure 8.2 – Malaysia oil and gas production and consumption
Source: Authors and CEE, based on data from U.S. Energy Information Administration (EIA), International
Statistics.
Significant oil resources were discovered in Malaysia’s Sabah, Sarawak, and Terengganu regions
in the 1960s, which were developed by foreign oil companies (primarily Shell and Esso, but also Elf
Aquitaine and Conoco) under a traditional concession system (Goldstein 2009). By the early 1970s,
Malaysian oil production was approximately 95,000 barrels per day.
The Malaysian government did not believe that the foreign oil companies were keeping it
properly informed of their operations in its territory, and decided to exert state control over the
hydrocarbons sector in 1974. This decision was concurrent with growing economic nationalism in
Malaysia and a desire to see more Malaysian control of important sectors of the economy (Von Der
Mehden and Troner 2007).
Petronas was formed as a corporation in 1974 pursuant to the Petroleum Development Act of 1974
(PDA) with exclusive rights and powers over Malaysia’s hydrocarbon resources. Although Petronas is
subject to considerable governmental control through the prime minister’s office, its function as stated
in the PDA is explicitly ‚commercial or industrial‛ (Moorthy 1981). The company’s budget process is
separate from that of the government, and the NOC has never sought funds from the national treasury
(Von Der Mehden and Troner 2007). The government acts as a shareholder through the Ministry of
Finance and receives dividends but does not involve itself in Petronas’s routine commercial
operations. As a result, Petronas has had a commercial and profit orientation from the beginning
(Manning 2000).
Petronas was given the responsibility for negotiating and administering oil and gas E&P
arrangements with private companies. Influenced by the experience of Indonesia and Pertamina, one
of its earliest actions was to restructure the existing concession arrangements into production-sharing
-
100
200
300
400
500
600
700
800
900
1,000 Malaysia Oil Production, Consumption
Oil Production ('000 b/d)
Oil Consumption ('000 b/d)
-
500
1,000
1,500
2,000
2,500
3,000 Malaysia Natural Gas Production, Consumption
Natural Gas Production (BCF)
Natural Gas Consumption (BCF)

79
contracts (PSCs).47 Foreign oil companies were opposed to the restructuring but eventually accepted
the PSCs. The first PSC was signed with Shell in 1976, and Malaysia became an oil exporter in the same
year. In 1978 Petronas formed its Carigali subsidiary, which acquired Conoco’s interests in the east
coast of peninsular Malaysia and entered into direct oil and gas E&P operations (Von Der Mehden and
Troner 2007).
First exports of LNG from Malaysia to Japan began in 1982. Petronas entered the domestic retail
gasoline business in 1981 and the domestic refining business in 1983. It completed the first stage of the
peninsular gas pipeline network and entered the petrochemical business in 1985.
Although Malaysia’s oil and gas reserves saw growth through the 1980s, by the early 1990s the
resource base had matured and was more geologically complex. It was increasingly difficult to offset
the natural decline of the reserves base. As a result, in 1990 Petronas decided to enter the international
upstream business in a major way despite considerable internal controversy. Its first projects were
undertaken in Vietnam and Myanmar in 1991. In fiscal year (FY) 2007, Petronas’s revenues from
international operations (40 percent) surpassed revenues from exports (39 percent) for the first time; in
FY 2008, international revenues were 42 percent and export revenues were 37 percent of the total.48
Africa accounted for 37 percent of international reserves, and 60 percent of international production in
FY 2008.
Despite the periodic reorganization of ministries and regulatory entities, the structure of
Malaysia’s hydrocarbon sector has been stable since 1974. There is no independent upstream
policy/regulatory entity. Petronas’s chief executive officer and board of directors report directly to the
Malaysian prime minister.
Petronas is expected to be a profitable commercial enterprise. Its four publicly listed subsidiaries
have some degree of market scrutiny. The prime minister is not involved in the company’s routine
commercial operations. But the prime minister ‚is the final arbiter in company policy and has
frequently been the source of decisions and strategy‛ (Von Der Mehden and Troner 2007). Examples of
prime ministerial influence include: (i) Petronas’s international expansion in 1990–91, which was
supported and encouraged by then–prime minister Mahathir, who wanted a more active role for
Malaysia on the international stage; and (ii) Petronas’s funding of the Twin Towers building in Kuala
Lumpur and the construction of the new national government administrative center in Putrajaya.
Finally, the use of regulated prices for gas and electricity clearly affects Petronas’s financial
performance owing to substantial natural gas subsidies, which made up about 8 percent of Petronas’s
revenues annually during the period 2005–08.
With respect to the midstream and downstream hydrocarbon sectors, the prime minister’s office
and the Economic Planning Unit are involved in policy decisions together with the Ministry of Energy,
Green Technology and Water. The ministry and its associated Energy Commission are responsible for
midstream and downstream hydrocarbon sector regulation.
Petronas negotiates, awards, and administers upstream PSCs with private companies. As such, it
generally has a meaningful participation in each PSC and at times has awarded itself 100 percent of a
PSC .49 Malaysia’s fiscal regime appears adequate to attract profitable investment by Petronas and
private companies as evidenced by: (i) continuing significant capital expenditures; (ii) a fair amount of
success in arresting and, at times, reversing the decline in Malaysia’s resource base; and (iii) the
47 In the same time period, Petronas entered into the LNG shipping business. 48 Petronas Group Financial Results Announcement and presentation for the year ended March 31, 2009 and the
Petronas Annual Report 2009, http://www.petronas.com.my. For a good discussion of Petronas international
projects and transactions, see Goldstein, A. (2009). 49 Petronas 2009 Annual Report, http://www.petronas.com.my.

80
significant amount of hydrocarbon production coming from private companies (about 35 percent of
Malaysia’s total production).50
Value Creation Index
Operational performance
Operational performance
indicators
Petronas 5-Yr Avg.,
All NOCs 2004 2005 2006 2007 2008 5-Yr Avg.
E&P production growth (%) -0.20 5.79 -0.09 7.10 3.67 3.3 10.4
Reserves replacement rate (%) 260.00 70.00 170.00 180.00 90.00 154.0 95.8
Refinery utilization rate (%) 90.00 87.00 91.00 92.00 86.00 89.2 90.3
Output/total assets (BOE/000$) 12.51 11.07 9.55 8.38 7.81 9.9 16.2
Output/total employees (000
BOE)
21.82 20.52 20.14 20.75 19.50 20.5 20.6
Source: Authors, CEE.
Note: boe = barrel of oil equivalent.
Petronas’s production growth is below the average of NOCs in our study. Petronas’s Malaysian oil-
and gas-producing assets are relatively mature and are becoming more geologically complex. Hence,
the NOC’s domestic production shows a slight decline during 2005–08, going from 1.21 million boe
per day in 2005 to 1.16 million boe per day in 2008 (Petronas annual report 2009). On the other hand, in
2008 production from international upstream operations reached 615 million boe per day, almost twice
the 2005 level, with 60 percent of international production coming from African sources. Similar to oil
and gas production, international operations contributed to support the reserve replacement growth
during 2005–08 (Petronas annual report 2009).
Continuous operational performance improvement initiatives resulted in an increase in Petronas’s
Malaysian refineries’ utilization rates to 97 percent while plant reliability remained at 98 percent
(Petronas annual report 2009). An unplanned shutdown of its South African refinery reduced the
company’s overall utilization rate to 86 percent.
Finally, on two measures of productivity, Petronas demonstrated mixed results. The ratio of
output to total assets declined during the study time frame and is below the average of the NOC
sample group. This may reflect both lags in developing new discoveries and depletion of the
company’s major assets. The ratio of output to total employees is roughly at the NOC study peer
group average. This may reflect challenges associated with Petronas’s international investment
strategies.
Financial performance
Financial performance
indicators
Petronas 5-Yr Avg.,
All NOCs 2004 2005 2006 2007 2008 5-Yr
Avg.
EBRTN/revenues (%) 49.78 49.22 48.70 47.53 38.26 46.8 45.3
EBRTN/assets (%) 33.60 34.39 32.82 35.93 29.79 33.4 34.9
Net cash flow/CAPEX (%) 196.55 205.88 185.19 127.93 80.45 159.4 131.4
Source: Authors, CEE.
Note: EBRTN = earnings before interest, taxes, and noncommercial expenditures; CAPEX = capital
expenditure.
50 Company annual reports, www.petronas.com.my .

81
Analysts cite Petronas’s ‚low cost integrated operations‛ as a key contributor to its good financial
performance (Wong and Guerena 2009). But the company’s profitability as measured by the indicators
above has been under some pressure in recent years, largely due to factors beyond the NOC’s control.
Income taxes increased 210 percent between 2004 and 2008 compared to a 154 percent increase in
income before taxes over the same period: the tax rate as a percentage of income before tax increased
from 25 percent to 34 percent. There appears to be no difference between how Petronas is taxed and
how international oil companies are treated.51 The natural gas price subsidy provided by Petronas
increased 264 percent between 2004 and 2008. (If natural gas price subsidies are added back to the
earnings before interest, taxes, and noncommercial expenditures [EBRTN], the EBRTN/revenue
averages 54 percent over the period versus 47 percent without subsidies added back.) Dividends paid
to the government increased 330 percent between 2004 and 2008 as ‚the government continued to
make higher use of the company’s financial resources for policy objectives, given the government’s
fiscal stimulus measures and the recent contraction in economic growth.‛
Capital expenditures increased 253 percent from 2004 to 2008. Analysts expect capital
expenditures to remain at high levels in the near future as Petronas attempts to arrest declining
domestic production and further develop high-potential overseas assets. Petronas’s ability to fund
these capital expenditures from operating cash flow, less dividends, has decreased markedly over the
period. Financial leverage is expected to increase, but Petronas has a very strong balance sheet (total
debt/total capital was 23 percent at end of March 2009) and significant unrestricted cash reserves (also
23 percent of total capital at end of March 2009).
National mission performance
National Mission performance
indicators
Petronas 5-Yr Avg.,
All NOCs 2004 2005 2006 2007 2008 5-Yr
Avg.
Share of local labor (%) 82.00 80.00 81.0 81.5
NOC employment growth-country
employment growth (%) 4.00 4.0 1.9
Share of NOC employment in
country labor force (%) 0.26 0.27 0.3 0.3
Share of local content (%) 64.4
Non-commercial expenditure/total
expenditure (%) 1.7
Non-core commercial net
income/total net income (%) 1.6
Price subsidies/revenues (%) 5.40 8.38 8.48 8.83 7.39 7.7 10.0
NOC domestic petroleum products
production/country oil consumption
(%)
111.89 106.81 98.97 93.91 92.86 101.0 71.9
Source: Authors, CEE.
Representation of Malaysian employees as a percentage of the total employees in Petronas’s workforce
has remained high despite the continuing increase in non-Malaysian employees in its international
51 Malaysia’s fiscal regime for petroleum is designed so that the tax rate increases as prices increase
(http://www.petrocash.com/documents/free/67284106.ppt#650,5,TrendsinoilTaxation2003-2008; Pedro van Meurs
2009).

82
operations. Internationally, Petronas makes a strong effort to use local labor.52 The share of Petronas’s
Malaysian employees as a percentage of Malaysia’s labor force is small, given the capital-intensive
nature of its businesses (but consistent).
Petronas does not report the percentage of its total purchases of goods and services that come
from local Malaysian suppliers. But Malaysia’s PSCs require companies to purchase goods and
services locally to the maximum extent possible, and Petronas has historically played a key role as a
vehicle to develop local content.
As noted previously, natural gas price subsidies provided by Petronas were significant over the
2004–08 time period. The NOC’s ability to meet Malaysia’s oil consumption needs from its domestic
equity production declined as its resource base has matured, but if non-Petronas Malaysian oil
production is included, there is more than sufficient domestic production to meet oil consumption
requirements. The company does face mandates for refined products supply, which it satisfies through
both domestic refining and product imports (if needed).
Value Drivers
Geology
The characteristics of Petronas’s domestic resource base have a significant impact on its value creation
capability. Malaysia is a relatively small producer. According to BP statistical review 2010, at the end
of 2008 its oil reserves were about 5.5 billion barrels of crude oil, and 84 trillion cubic feet of natural
gas. The majority of its fields have been producing for over 30 years, and production levels are
declining fast. Remaining fields are of lower quality, relatively small in size, and far from existing
infrastructure, which imply higher development costs and potentially lack of commerciality for some
of them (Economic Planning Unit 2010).
Perhaps this geological context has been an important contributor to Petronas’ decision to expand
internationally. But international expansion brings special costs and risks linked to the learning curve
of doing business in a foreign environment.
State context
At the federal level, Malaysia has a sophisticated long-term planning process that integrates economic
and social development and hydrocarbon sector development goals (Mahbob 2008). Malaysia’s civil
service is relatively efficient and professional (Von Der Mehden and Troner 2007). The country’s
World Bank World Governance Indicators (WGI) score on government effectiveness improved from
0.99 in 2004 to 1.13 in 2008.
But Malaysia’s government has become increasingly dependent on the fiscal contribution from
Petronas: hydrocarbon revenue as a percentage of total government revenue increased from 20 percent
in 2004 to 44 percent in 2008. Although part of the fiscal revenue is generated by private oil companies
that operate in Malaysia, Petronas makes a significant fiscal contribution to the state. Malaysia also
does not have a macroeconomic stabilization mechanism such as a petroleum fund to mitigate the
effect of volatile oil and gas prices on the economy. Federal debt has remained quite modest, which
provides fiscal flexibility. But the government appears to prefer to rely on Petronas to provide
resources for the Malaysian economy at difficult times, a trend that could have a negative effect on the
NOC’s operational and financial value creation.
Energy consumption per capita is low but is expected to expand at a rapid pace as the country
develops further. In 2008 Malaysia’s energy demand was divided as follows: petroleum products
52 Petronas 2009 Annual Report, www.petronas.com.my.

83
represented 54 percent, natural gas 24 percent, electricity 18 percent, and coal and coke 4 percent.
Petroleum product demand (mainly by the transport sector) was matched by supply, while gas
demand (mainly from the industrial sector) was matched by import. In Malaysia gas prices and
electricity prices are regulated. This policy, although meant to benefit vulnerable groups, develop
strategic industries, and attract investors, has generated distortions and inflated the demand for
natural gas, including from low-value-added sectors (Economic Planning Unit 2010). To entice more
gas suppliers to Malaysia the government has started transitioning gas prices toward market prices.
Other policy tools are being considered to mitigate the impact of increased gas prices on target groups.
This policy will also benefit Petronas by reducing and possibly eliminating the burden of subsidies as
well as favoring the development of small gas discoveries for use in the domestic market.
Government effectiveness scores highly among Malaysia’s Governance Indicators. But voice and
accountability and political stability have been deteriorating over the study period.
Petroleum sector organization and governance
Public policy literature advises against giving responsibility for upstream regulation and
administration to a commercial entity, as this tends to distract from commercial focus and efficiency
and can lead to conflicts of interest in the regulatory arena. Similarly, the extent of executive branch
control over the hydrocarbon sector and the management of Petronas would be regarded as
potentially detrimental to the company’s operational and financial value creation capability.
Nevertheless, despite a possibly suboptimal sector organizational structure, Petronas appears to
have created substantial operational, financial, and national mission value. Perhaps one reason resides
in the benefit of exposing the NOC to competition and market scrutiny. Despite the creation of
Petronas, Malaysia has continued to invite private companies to participate in the hydrocarbon sector
and has benefited from access to risk capital and management and technology practices. In the
process, the government has sought to establish a fiscal regime attractive to both its NOC and to
private investors. Malaysia’s fiscal, regulatory, and tax regimes scored 2.4 on the Fraser Institute 2007
and 2008 Global Petroleum Surveys, signifying that they are not a deterrent to investment. Private
company competition in the sector has perhaps kept pressure on Petronas to continually strive for
performance improvement, even if the NOC has the advantage of being the ultimate awarder of a PSC.
Similarly, Petronas’s participation in international debt markets—as well as the international equity
market scrutiny provided by the minority public owners of four of its major subsidiaries’ equity—has
provided impetus for the company to meet international commercial standards.
NOC strategy and behavior
Petronas is a major operator in all of its businesses, operating 33 percent of its domestic upstream oil
and gas production and 100 percent of its domestic refining capacity. The company is known as a low-
cost, efficient operator (Wong and Guerena 2009). Petronas’s capital expenditures have an upstream
focus, averaging about 60 percent during 2005–08, which enables it to increase production and
maintain proven reserve levels. Similarly, Petronas’s upstream expansion internationally has
contributed to production and reserves growth. Its long history of partnerships and joint ventures
with private companies domestically and internationally has exposed it to international best practices.
Petronas’s upstream oil equity production is sufficient to supply its domestic refineries.
Although it does not report employee training and development expenditures, Petronas has made
substantial efforts in this regard since its inception. In the early 1970s there was an enormous lack of
Malaysian personnel in oil- and gas-related fields (Von Der Mehden and Troner 2007). In the field of
education, Petronas has been one of the major sponsoring entities in Malaysia.53 It has established
53 Petronas website, http://www.petronas.com.my.

84
several technical and management-oriented universities in Malaysia and for its own employees.
Petronas established one of its two training units in 1981—Institut Teknologi Petroleum Petronas
(INSTEP)—and it has been the major source of technically competent skilled manpower for the
company and for private companies operating in the country. In 1989 Petronas established PERMATA,
which provides mainly management-training programs and courses for its employees.
NOC corporate governance
Although the company is 100 percent owned by the government through the Ministry of Finance, four
of its major subsidiaries have some private ownership and are subject to international capital markets
scrutiny. The Petronas’s CEO and board of directors report directly to the Malaysian prime minister.
Every board member is an appointee of the prime minister, who has the right to appoint or remove
every member of Petronas’s management (Goldstein 2009).
Financial statements and oil and gas reserves are not audited by independent third parties. But
Petronas does publicly report its financial and oil and gas reserve results in a manner that has gained
acceptance from the international debt and equity markets.
Conclusions
Petronas has a dual role as an upstream regulator and commercial company. The government, through
the prime minister, exercises a significant level of control over the NOCs’s board and management.
Nevertheless, Petronas appears to have been able to balance its national mission and its commercial
objectives, contributing significant value to both.
Although the NOC has exclusive powers over the country’s petroleum resources, it does not seem
to have used these to capture immediate gains to the detriment of long-term value creation. Rather it
seems that the NOC and its government have pursued a strategy of partnering and risk sharing with
private companies. Indeed the NOC appears to have benefited from the commercial performance
pressures exerted by competition and scrutiny from international debt and equity markets.
The NOC is facing declining domestic production owing to the country’s maturing asset base,
which creates challenges to growth and cost control. This has been a key motivator of the NOC’s
decision to enter the international arena in the 1990s. Today its international operations contribute
substantially to upstream growth. But the NOC is likely to face increasing costs and risk, which will
require rebalancing its policy priorities.
85
References
Economic Planning Unit (EPU). 2010. ‚The Malaysia Energy Sector: In Pursuit of a Better Future.‛
Economic Planning Unit, Prime Minister’s Office, March 22.
Goldstein, A. 2009. ‚New Multinationals from Emerging Asia: The Case of National Oil Companies.‛
Asian Development Review 26 (2): 26–56.
Mahbob, Dr. Sulamain, Director General, Malaysian Economic Planning Unit. 2008. ‚Long Term
Planning in Malaysia.‛ Presentation at the Conference on Qatar National Vision 2030.
Manning, R. 2000. ‚The Asian Energy Factor: Myths and Dilemmas of Energy, Security and the Pacific
Future.‛ New York: Palgrave.
Moorthy, V. K. 1981. ‚The Malaysian National Oil Corporation—Is It a Government Instrumentality?‛
International and Comparative Law Quarterly 30 (July): 638–59.
Petronas. 2009. Group Financial Results and Annual Report for the year ended March 31, 2009.
http://www.petronas.com.my.
Von Der Mehden, F. R., and A. Troner. 2007. ‚Petronas: A National Oil Company with an International
Vision.‛ The James A. Baker III Institute for Public Policy, Rice University, Houston, Texas.
Wong, A., and M. Guerena. 2009. Petroliam Nasional Bhd. Ratings Affirmed; Proposed Notes Assigned A-
Rating. Standard & Poor’s. http://www.standardandpoors.com/ratingsdirect.
86
9. The Petroleum Oil and Gas
Corporation of South Africa (South
Africa)
The Petroleum Oil and Gas Corporation of South Africa (Petro SA) is South Africa’s national oil
company (NOC). National mission goals, particularly those related to energy security, employment
opportunities, and local economic development, are among the main imperatives for the company. But
operational performance of the company has been deteriorating, particularly since 2006.
The relatively low geological prospectivity of South Africa, together with the nation’s long period
of isolation during the 1980s, certainly affected the value-creating ability of Petro SA and its
predecessors.
The NOC relies on partnerships and joint operations with private oil companies as part of its risk-
reduction strategy. But a delay in implementation of sector reforms designed in 2002 has created
uncertainty over the direction of such reforms, affecting the pace of investment in the sector.
Company and country sector evolution
Business activities
Petro SA defines its core business activities as:
The exploration and production (E&P) of oil and natural gas
The production of synthetic fuels from offshore gas at the world’s largest commercial gas-to-
liquids (GTL) plant
The marketing and trading of oil and petrochemicals
The storage of crude oil on behalf of the Strategic Fuel Fund
Petro SA accounts for about 5 percent of the liquid fuels market in South Africa, and 66 percent
and 100 percent of domestic oil and gas production, respectively.
Although South Africa has the second largest refining capacity in Africa (485,000 barrels per day
[bpd], surpassed only by Egypt with a capacity of 726,250 bpd), Petro SA does not currently own or
participate in refining activities, but is planning to build a 400,000 bpd refinery in Coega, Port
Elizabeth. In 2009 full feasibility studies for the refinery were completed, and it is expected to become
operational by 2015.54
54 Production is planned for a product mix of up to 70 percent distillates (diesel and aviation fuel) and 30 percent
high-octane gasoline. These fuels will meet the highest Clean Fuels (Euro V) specifications. Biofuels and
petrochemicals opportunities are also included in the design parameters. Capital costs for the 400,000 bpd base
case are estimated at $11 billion.

87
The company is also considering building a liquefied natural gas (LNG) regasification terminal, in
line with South Africa’s energy policy imperatives of energy security and cleaner burning fuels.
Indeed new natural gas supply would be necessary to support its GTL production, since existing
natural gas fields are being gradually depleted. Pursuant to South Africa’s Energy Master Plan, the
company is charged with providing at least 30 percent of domestic oil demand. To this end, the NOC
is stepping up its exploration efforts.
Petro SA has also been expanding its upstream operations abroad. The NOC has exploration
licenses in Gabon, Equatorial Guinea, Sudan, Egypt, Namibia, and Mozambique, and a 40 percent
nonoperating interest in a producing field in Nigeria. Petro SA does not report having noncore
commercial activities.
Equity ownership and organization
Petro SA is the sole upstream NOC for the country. The national fuel pipeline system is operated by
another state-owned enterprise (SOE), Petronet, and the state-owned transportation company Transnet
controls, among other activities, oil and gas pipeline transportation businesses in South Africa. Petro
SA is wholly owned by the CEF group, which in turn is owned by South Africa’s Department of
Minerals and Energy (DME).
The CEF group has seven active subsidiaries, including the Petroleum Agency, the upstream
petroleum sector regulator, but Petro SA is the largest contributor. The NOC accounted for about 85
percent of its total net income in 2008. The organization of its ownership is shown in Figure 9.1.
Figure 9.1 – CEF holdings and organizational structure
Source: Authors, based on information provided by CEF on its website (http://www.cef.org.za).
Petro SA and South Africa petroleum sector: History
Petro SA was formed in 2002 from the merger of three previous entities: Mossgas (Pty) Ltd., Soekor
(Pty) Ltd., and parts of the Strategic Fuel Fund Association.
Soeker, a government-owned oil and gas E&P company, was established in 1965 and found small
accumulations of oil onshore, but these were noncommercial. In 1967 a new Mining Rights Act was
passed, and offshore concessions were granted to a number of international companies including
Total, Gulf Oil, Esso, Shell, Arco, CFP, and Superior. Prior to 1995 Soeker had an equity participation
option of up to 20 percent in all E&P ventures. The first offshore well was drilled in 1969, and gas was
Ministry of Mineral and
Energy
CEF (Pty) Ltd
iGas Strategic Fuel
Fund
Association
Petroleum
Agency SA
PetroSA Oil Pollution
Control SA South Africa
National
Energy
Research
Institute
Energy Development Corporation
(a division of CEF)
National
Energy
Efficiency
Agency

88
discovered by Superior. Soeker commenced offshore drilling in 1970, and abandoned onshore
operations in 1978 without finding any commercial accumulation of petroleum.
As a result of political sanctions against South Africa, international oil and gas companies
gradually withdrew from the country. Soeker was the sole exploration and operating company in the
entire South African offshore area from the mid-1970s to the late 1980s.
In 1977 South Africa passed the Central Energy Fund Act. Pursuant to this act, the CEF group was
incorporated to engage in the acquisition, exploration, generation, marketing, and distribution of any
energy form, and to engage in related research and development (CEF Group 2008). Soeker and
Mossgas became wholly owned subsidiaries of the CEF group which, in turn, was and is a wholly
state-owned entity controlled by the DME.
Exploration activities were greatest from 1981 to 1991, during which period some 181 exploration
wells were drilled. In the early 1980s Soeker found significant natural gas fields offshore. The gas
fields provided the basis for the establishment of the GTL project in Mossel Bay, which was
commissioned in 1987. The GTL plant operated by Mossgas, the first of its kind in the world,
converted natural gas and condensate into liquid fuels, in addition to producing petrochemicals. The
GTL plant’s current production capacity is about 35,000 barrels of final product per day. Oil was
discovered by Soeker in 1989 and brought into production in 1997.
The demand for oil and gas in South African grew rapidly in a context of scarce domestic
petroleum resources (Figure 9.2).
Figure 9.2 – South Africa crude oil and natural gas production and consumption
Source: Authors and CEE, based on data from U.S. Energy Information Administration (EIA), International
Statistics.
Prior to 1980 several state agencies, including the Department of Planning, the Department of
Industries, and the Department of Commerce and Consumer Affairs, were sharing regulatory
functions in the energy sector. In 1980 the Department of Mineral and Industry Affairs (DMEA)
(presently the DME) was formed. It was and remains the main governmental body in charge of
energy-related issues. The DME is responsible for proposing energy legislation and policy, and
oversees various energy regulators such as the National Electricity Regulator.
Another agency involved in the governance of the energy sectors is the Department of Public
Enterprises (DPE). In the energy sector, the DPE owns the state-owned electricity utility Eskom and
the transportation company Transnet.
-
100
200
300
400
500
600
700 South Africa Oil Production, Consumption
Oil Production ('000 b/d)
Oil Consumption ('000 b/d)
-
50
100
150
200
250 South Africa Natural Gas Production, Consumption
Natural Gas Production (BCF)
Natural Gas Consumption (BCF)

89
With respect to regulation of the upstream petroleum sector, until 1999 Soeker’s Petroleum
Licensing Unit was responsible for the promotion, data management, regulation, and other functions
related to the licensing of oil and gas E&P rights.
The first petroleum sector exploration licensing round was held in the post-sanctions era in 1994,
but failed to attract investors’ interest. As a result, in 1995 the government began a major energy sector
restructuring. In 1999 Soeker was relieved of its upstream regulatory functions and a new regulatory
agency, the Petroleum Agency South Africa (PASA), was established. Currently, 11 companies hold
petroleum E&P rights in South Africa.
South Africa has numerous government agencies and companies involved in the natural gas
industry, including iGas, Petro SA, Sasol, Petroleum Agency of South Africa, and Petronet. These
agencies and companies work to promote and develop natural gas E&P in South Africa.
The Mineral and Petroleum Resources Development Act of 2002 became effective in 2004, but was
not applied until 2008. The act introduced reforms aimed at providing equitable access to, and
sustainable development of, South Africa’s mineral and petroleum resources (Accountancy SA 2009).
But the act was criticized by some practitioners for creating uncertainty and instability in the sector
(Leon 2007). Pursuant to the act, pre-1994 ‚old order‛ E&P leases were required to migrate to
negotiated ‚new order‛ E&P rights by June 2007. The ‚new order‛ rights would require some offering
of equity interests in accordance with the Black Economic Empowerment (BEE) policy, which also
included employment and procurement requirements. In addition holders of petroleum E&P licenses
issued in 1994 and after were required to make contributions to the Upstream Training Trust (UTT)
and to the fight against the HIV/AIDS pandemic.55 The ‚new order‛ rights were also subject to revised
royalty rates as prescribed in the 2002 Mineral and Petroleum Resources Royalty Act. Given the
foregoing, the period from 2004 to 2008 was characterized by significant regulatory uncertainty for all
industry participants. According to some industry observers, this situation led operators to delay their
drilling obligations (Hayman 2006).
Vertical integration in the oil and gas sector in South Africa is prohibited.56 In the downstream
petroleum sector there are several international companies in addition to Sasol (a former SOE
privatized in 1979) and Petro SA. The refining sector was deregulated in 1991, and the difference
between administered and market prices for petroleum products is entirely borne by the government.
In the coal-to-liquids (CTL) and GTL sectors the government continues to heavily subsidize Sasol,
Petro SA, and Mossgas. In the midstream petroleum sector, the Gas Act of 2001 was enacted to
promote the orderly development of the natural gas pipeline industry and establish a regulatory
framework for the sector. Since 2005 the National Energy Regulator of South Africa (NERSA) has
regulated policy over the entire South African energy industry and is responsible for implementing
South Africa’s energy plan. The NERSA also regulates the midstream sector.
55 The UTT was established to ‚contribute to the education of previously disadvantaged South Africans in the
fields of mathematics, science and technology in general, and to promote their entrance into the petroleum
industry specifically.‛ Details on the intent of the trust are provided in the 2006 UTT Annual Report,
http://www.cef.org.za. 56 For For example, the Petroleum Products Amendment Act of 2006 ‚prohibits licensed wholesalers from holding
retail licenses, except for training purposes‛ ( Sasol Form 20F 2009).
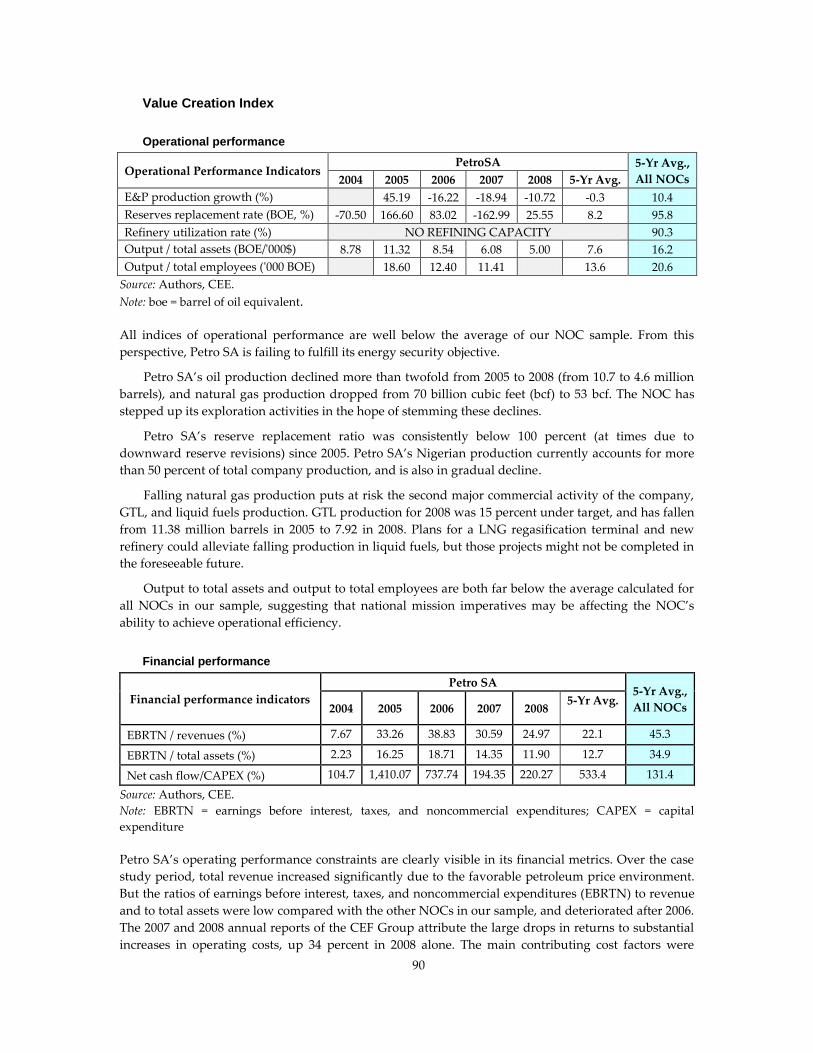
90
Value Creation Index
Operational performance
Operational Performance Indicators PetroSA 5-Yr Avg.,
All NOCs 2004 2005 2006 2007 2008 5-Yr Avg.
E&P production growth (%) 45.19 -16.22 -18.94 -10.72 -0.3 10.4
Reserves replacement rate (BOE, %) -70.50 166.60 83.02 -162.99 25.55 8.2 95.8
Refinery utilization rate (%) NO REFINING CAPACITY 90.3
Output / total assets (BOE/'000$) 8.78 11.32 8.54 6.08 5.00 7.6 16.2
Output / total employees ('000 BOE) 18.60 12.40 11.41 13.6 20.6
Source: Authors, CEE.
Note: boe = barrel of oil equivalent.
All indices of operational performance are well below the average of our NOC sample. From this
perspective, Petro SA is failing to fulfill its energy security objective.
Petro SA’s oil production declined more than twofold from 2005 to 2008 (from 10.7 to 4.6 million
barrels), and natural gas production dropped from 70 billion cubic feet (bcf) to 53 bcf. The NOC has
stepped up its exploration activities in the hope of stemming these declines.
Petro SA’s reserve replacement ratio was consistently below 100 percent (at times due to
downward reserve revisions) since 2005. Petro SA’s Nigerian production currently accounts for more
than 50 percent of total company production, and is also in gradual decline.
Falling natural gas production puts at risk the second major commercial activity of the company,
GTL, and liquid fuels production. GTL production for 2008 was 15 percent under target, and has fallen
from 11.38 million barrels in 2005 to 7.92 in 2008. Plans for a LNG regasification terminal and new
refinery could alleviate falling production in liquid fuels, but those projects might not be completed in
the foreseeable future.
Output to total assets and output to total employees are both far below the average calculated for
all NOCs in our sample, suggesting that national mission imperatives may be affecting the NOC’s
ability to achieve operational efficiency.
Financial performance
Financial performance indicators
Petro SA 5-Yr Avg.,
All NOCs 2004 2005 2006 2007 2008 5-Yr Avg.
EBRTN / revenues (%) 7.67 33.26 38.83 30.59 24.97 22.1 45.3
EBRTN / total assets (%) 2.23 16.25 18.71 14.35 11.90 12.7 34.9
Net cash flow/CAPEX (%) 104.7 1,410.07 737.74 194.35 220.27 533.4 131.4
Source: Authors, CEE.
Note: EBRTN = earnings before interest, taxes, and noncommercial expenditures; CAPEX = capital
expenditure
Petro SA’s operating performance constraints are clearly visible in its financial metrics. Over the case
study period, total revenue increased significantly due to the favorable petroleum price environment.
But the ratios of earnings before interest, taxes, and noncommercial expenditures (EBRTN) to revenue
and to total assets were low compared with the other NOCs in our sample, and deteriorated after 2006.
The 2007 and 2008 annual reports of the CEF Group attribute the large drops in returns to substantial
increases in operating costs, up 34 percent in 2008 alone. The main contributing cost factors were
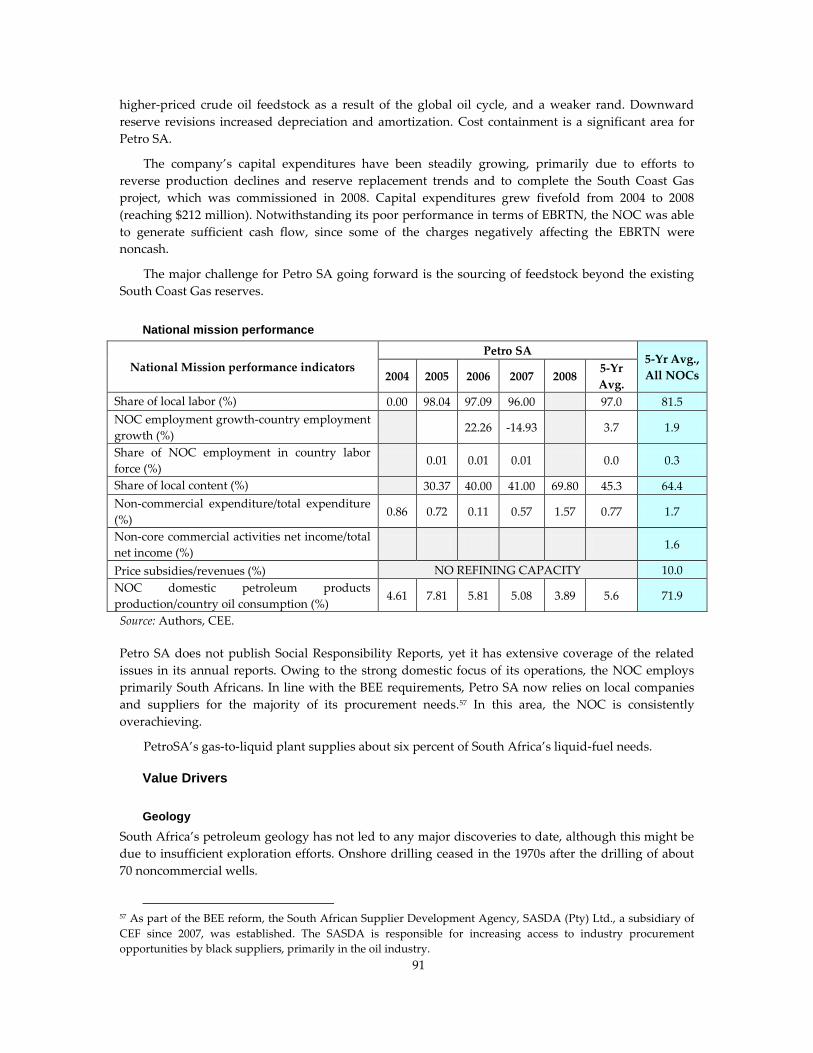
91
higher-priced crude oil feedstock as a result of the global oil cycle, and a weaker rand. Downward
reserve revisions increased depreciation and amortization. Cost containment is a significant area for
Petro SA.
The company’s capital expenditures have been steadily growing, primarily due to efforts to
reverse production declines and reserve replacement trends and to complete the South Coast Gas
project, which was commissioned in 2008. Capital expenditures grew fivefold from 2004 to 2008
(reaching $212 million). Notwithstanding its poor performance in terms of EBRTN, the NOC was able
to generate sufficient cash flow, since some of the charges negatively affecting the EBRTN were
noncash.
The major challenge for Petro SA going forward is the sourcing of feedstock beyond the existing
South Coast Gas reserves.
National mission performance
National Mission performance indicators
Petro SA 5-Yr Avg.,
All NOCs 2004 2005 2006 2007 2008 5-Yr
Avg.
Share of local labor (%) 0.00 98.04 97.09 96.00 97.0 81.5
NOC employment growth-country employment
growth (%) 22.26 -14.93 3.7 1.9
Share of NOC employment in country labor
force (%) 0.01 0.01 0.01 0.0 0.3
Share of local content (%) 30.37 40.00 41.00 69.80 45.3 64.4
Non-commercial expenditure/total expenditure
(%) 0.86 0.72 0.11 0.57 1.57 0.77 1.7
Non-core commercial activities net income/total
net income (%) 1.6
Price subsidies/revenues (%) NO REFINING CAPACITY 10.0
NOC domestic petroleum products
production/country oil consumption (%) 4.61 7.81 5.81 5.08 3.89 5.6 71.9
Source: Authors, CEE.
Petro SA does not publish Social Responsibility Reports, yet it has extensive coverage of the related
issues in its annual reports. Owing to the strong domestic focus of its operations, the NOC employs
primarily South Africans. In line with the BEE requirements, Petro SA now relies on local companies
and suppliers for the majority of its procurement needs.57 In this area, the NOC is consistently
overachieving.
PetroSA’s gas-to-liquid plant supplies about six percent of South Africa’s liquid-fuel needs.
Value Drivers
Geology
South Africa’s petroleum geology has not led to any major discoveries to date, although this might be
due to insufficient exploration efforts. Onshore drilling ceased in the 1970s after the drilling of about
70 noncommercial wells.
57 As part of the BEE reform, the South African Supplier Development Agency, SASDA (Pty) Ltd., a subsidiary of
CEF since 2007, was established. The SASDA is responsible for increasing access to industry procurement
opportunities by black suppliers, primarily in the oil industry.

92
Up to 1996 South Africa did not have indigenous crude oil production. According to the Oil and
Gas Journal, South Africa had proven oil reserves of 15 million barrels as of January 2008. All of the
proven reserves were located offshore southern South Africa in the Bredasdorp Basin and off the west
coast of the country near the border with Namibia. In 2007 South Africa produced 199,000 bpd of oil,
of which about 16,000 bpd was crude and 160,000 bpd was synthetic liquids processed from coal and
natural gas.
South Africa produces small amounts of natural gas, which it uses in synthetic fuel production.
According to Cedigaz, South Africa had 318 bcf of proven natural gas reserves as of January 2008. The
country also has an estimated 3 tcf of coalbed methane, but production has yet to start.
During the embargo period South Africa had to rely on domestic energy sources, particularly coal,
which accounted for more than 70 percent of primary energy demand. In the 1950s through the 1980s
South Africa became a pioneer in commercial scale CTL production. Up to the end of its period of
sanctions, CTL represented close to a third of total liquids consumption in the country.
According to some industry analysts, ‚the big hope for South African exploration and
development is the deep water‛ where ‚any success will give a rocket thrust to the South African oil
industry‛ (Hayman 2006). But exploration drilling has been very limited since 2001.
State context
During the period of international economic and political sanctions imposed on the country,
international companies largely withdrew, taking their capital and technology with them. Exploration
and development activity suffered, and the country’s net importer status continued. Since 1994 the
government has focused on reorganizing the petroleum sector. But there have been significant costs
and delays associated with the major organizational, legislative, fiscal, and regulatory reforms planned
by the government since 1998.
The petroleum sector has played a minimal role in South Africa’s economy: the total contribution
of Petro SA to the state, comprised of taxes and dividends, appears to be less than 6 percent of total
budget revenues in 2008. South Africa is a net petroleum importer, and does not have a stabilization
mechanism based on petroleum revenues.
In 2001 the industry and government signed a charter that assured government regulators that at
least 25 percent of their marketing and other businesses would go to black shareholders by 2014.
Procurement and affirmative employment goals were set, making sure that the BEE initiative ensured
a meaningful change in the existing industry profile and ways of doing business. The South Africa
Petroleum Industry Association (SAPIA) is in the process of completing a scorecard assessing progress
toward the initiative’s goals.58 Although divestment by foreign companies in the short term reduces
foreign investment flows, in the long term the government expects the initiative to generate
sustainable growth and to encourage the redistribution of wealth and opportunities to previously
disadvantaged communities.
Although over the study period a slight deterioration was recorded in all of South Africa’s
Governance Indicators, the country’s scores remain considerably above the regional average.
Petroleum sector organization and governance
The 20 percent equity participation option in all upstream ventures granted to its predecessor
company, Soeker, allowed it to build an asset base in the presanctions period. Private companies have
58 Information on the oil industry charter and related initiative can be found on the SAPIA’s website,
http://www.sapia.co.za/pubs/charter.htm.
93
stayed involved in the petroleum sector in the postsanctions period, exposing Petro SA to international
best practices. From 2004 to 2008, about 81 percent of South Africa’s oil and gas production came from
private companies.
The goals and objectives of Petro SA and its parent company, CEF, are publicly disclosed and
measured in some detail. In 2006 the IHS Ratings and Rankings index, which ranks the E&P
attractiveness of countries according to criteria that include geological prospectivity, fiscal terms, and
political risk, showed that fiscal terms in South Africa were ‚the third best in the world‛ at that time
(Hayman 2006).
But the government’s restructuring of the petroleum sector took 10 years (1998–2008). The
resulting uncertainties, coupled with the limited geological attractiveness, and more recently the
economic crises, have hindered growth in E&P activities by Petro SA and others.
Policy, regulatory, and commercial functions are performed by distinct entities: policy by the
DME, regulation by the PASA and NERSA, and commercial operations by CEF/Petro SA. But the
commercial and regulatory entities report to the CEF, which in turn is controlled by the DME. This
situation may give rise to potential conflicts of interest.
NOC strategy and behavior
Fostering economic development is part of Petro SA’s national mission objectives. Indeed the NOC has
built an impressive track record of exceeding its BEE goals. Key drivers for the NOC have been the
promotion of foreign direct investment and the improvement of South Africa’s balance of payments.
The criteria for investing include the creation of jobs and the alleviation of poverty. This includes
opportunities for local participation.
The NOC’s asset ownership strategy tends to be geared toward sustainable national growth. For
example, the Coega refinery, to be located in the Eastern Cape, aims to support one of the poorest
provinces in South Africa. The refinery is expected to create up to 27,500 temporary jobs during the
construction phase, and another 18,500 direct and indirect jobs when operational. These considerations
affected the choice of location.
Increase in NOC involvement in refining investment is likely to trigger more upstream investment
to guarantee security of supply. To improve production levels and its reserves replacement rate, the
NOC has stepped up its upstream investment, both domestically and abroad. The company relies on
partnerships with private oil companies, which lowers its investment risk and exposes it to
international best practices.
The NOC aims to become an active player across the entire petroleum sector value chain, from
upstream to downstream, so as to mitigate project risks and maximize sustainable BEE opportunities
(All Africa, 2009).
NOC corporate governance
The board of directors comprises 12 members, of which 5 are not government officials or NOC
executives. Board members are appointed by the minister of minerals and energy and include
representatives of the Central Energy Fund (chief executive officer and chairperson), the Ministerial
Black Empowerment Evaluation Committee, and the chief financial officer of the Financial Services
Board. The company secretary is also an executive board member.
The board has ample authority and power within the limits imposed by strategic and operational
policies and targets set by the DME. Remuneration to the nonexecutive members of the board is jointly
determined by the minister of minerals and energy and the minister of finance. Remuneration to the
94
executive directors is determined by the board itself. The company is also required by law to pay a
certain level of dividends to its shareholders (including the state) on an annual basis.
The company is audited on a regular basis by the auditor general for South Africa.59
Conclusions
National mission goals, particularly those related to energy security, employment opportunities, and
local economic development, are among the main imperatives for Petro SA. But operational
performance of the company has been deteriorating, particularly since 2006.
The NOC has also scaled up its exploration expenditure in an effort to support future production
and growth. The NOC’s strategy and investment choices are clearly affected by its national mission
imperatives, and attempt to balance the need to secure supplies with domestic economic development
and wealth redistribution objectives.
The relatively low geological prospectivity of South Africa, together with its long period of
isolation during the 1980s, certainly affected Petro SA. Nonetheless, a few discoveries were made, and
the NOC developed the largest GTL plant in the world. In its relatively short life, the NOC has strived
to stem production declines by investing in enhanced recovery techniques.
The NOC relies on partnerships and joint operations with private oil companies as part of its risk-
reduction strategy. But uncertainty regarding reform implementation has been affecting the pace of
investment in the sector.
59 http://www.pmg.org.za/minutes/20050823-central-energy-fund-petrosa-oil-pollution-control-south-africa-igas-
petroleum-agenc.

95
References
‚Malaysian Success is a Model for PetroSA.‛ All Africa, April 16, 2009.
http://allafrica.com/stories/200904160370.html.
Accountancy SA. 2009. Getting to the Bottom of South Africa’s New Mining Royalties.
http://www.accountancysa.org.za.
CEF Group. 2008. CEF Group 2008 Annual Report. http://www.cef.org.za.
—————. 2010. 2006 UTT Annual Report. http://www.cef.org.za.
Hayman, Andrew. 2006. ‚South Africa is Ready to Arrive on World Stage.‛ IHS Energy, The American
Oil and Gas Reporter (August 2006).
IEA (International Energy Agency). 1996. Energy Policies of South Africa. 1996 Survey. Organisation for
Economic Co-operation and Development / International Energy Agency.
Leon, Peter. 2007. ‚Investing with Certainty: Stability under South Africa’s New Oil and Gas
Regulatory Regime.‛ Address by Peter Leon, Partner, Webber Wentzel Bowens, Johannesburg, to
UNCTAD’s Africa Oil, Gas, Trade and Finance Conference, May 23, 2007; and Peter Leon, ‚Oil and
Gas Exploration in South Africa: In Search of Stability.‛ http://www.mpmagazine.com.
PASA (Petroleum Agency of South Africa). 2010.
http://www.petroleumagencysa.com/uploads/ministerial%20directive.pdf.
Petro SA. 2005–08. Annual reports and presentations on company’s Website.
http://www.petrosa.co.za.
Sasol. 2009. Sasol Form 20F 2009. http://www.sec.gov.

96
10. PTT Public Company Limited
(Thailand)
PTT, Thailand’s national oil company (NOC), has grown from an allocator of oil and refined products
to a fully integrated oil and gas company that is one of the 50 largest in the Association of Southeast
Asian Nations (ASEAN) region. Profitability has suffered some in recent years due to economic
recession, but is expected to rebound with economic growth.
Thailand’s relative openness to private company competition in the hydrocarbon sector has
exposed PTT to world-class technologies and managerial practices. Together with the partial
privatization of the company in 2001, which exposed it to capital markets scrutiny and discipline, this
competition has provided pressure for improved performance by PTT.
The NOC is a key instrument for achieving the government’s national energy security objectives,
which translate into the NOC’s strategy of value creation through integration along the energy value
chain.
Far-reaching sector reforms in the upstream sector that were introduced by the Energy Industry
Act in 2007 put PTT in a more competitive environment. Changes to the natural gas regulatory
framework have so far not affected PTT’s dominant position in the gas midstream and downstream
sectors. The company continues to have a profitable monopoly in gas transmission, distribution, and
marketing. But these reforms seem to indicate the government’s intention to gradually introduce
competition in all links of the energy value chain.
Company and country sector evolution
Business activities
PTT is one of the largest corporations in the country, and the only Thai company listed among the
Fortune Global 500 companies. 60 At the end of 2009 it had a market capitalization of $70 billion,
accounting for 40 percent of the market value of the entire Thai stock exchange (SET). PTT is vertically
integrated with domestic and international operations in exploration and production (E&P) (through
its 66-percent-owned subsidiary, PTT Exploration and Production Co. [PTTEP]), transportation,
refining and petrochemicals, and wholesale and retail petroleum products distribution (Wood 2010).
In particular:
PTT, through PTTEP, is Thailand’s largest oil and gas producer, with operations in Thailand,
Malaysia, Indonesia, Cambodia, Myanmar, Vietnam, Oman, Iran, Egypt, Algeria, Bahrain,
Bangladesh, Australia, and New Zealand. In 2008 it accounted for 27 percent of all hydrocarbons
produced in the country.61 PTTEP’s production is about 70 percent natural gas and 30 percent oil.
PTT directly and through several subsidiaries controls about 74 percent of primary refining
distillation capacity in Thailand. Its equity portion of total Thai refining capacity is 36 percent.
60 Information in this section comes from PTT’s annual reports, 2004–08, and material available on the company
website, http://www.pttplc.com/en. 61 Company information and BP Statistical Review of World Energy, June 2009.

97
PTT is the monopoly purchaser and wholesaler of natural gas in Thailand.
PTT has a monopoly in the domestic natural gas distribution sector.
PTT is the largest retail marketing company in Thailand with about 1,157 service stations, or 34
percent of the domestic market.
PTT has interests in five petrochemical companies producing a wide range of products.
The company is organized into four divisions: (i) oil, (ii) gas, (iii) petrochemicals and refining, and
(iv) international trading, and operates along the energy value chain though a network of wholly
owned, majority-owned, and minority-owned companies.
As of first quarter 2010, PTTEP accounted for 57 percent of PTT’s earnings before interest, taxes
and depreciation (EBITDA), and PTT’s gas businesses (transmission, distribution and marketing)
accounted for 29 percent of EBITDA.
Equity ownership and organization
Formerly known as the Petroleum Authority of Thailand, PTT was established in 1978 and partially
privatized at the end of 2001. The Thai government, through 51.7 percent ownership by the Ministry of
Finance, exercises its ownership rights. In addition, the government-supported equity fund, Vayupak,
owns 15.4 percent, taking total government ownership to 67.1 percent. The remaining shares trade on
the SET. PTT has 45 affiliated companies, 7 of which are also traded on the SET.
Figure 10.1 shows the company’s organization structure.
Figure 10.1 – PTT Organizational Structure
Source: Authors based on information available on the company website (www.pttplc.com.en).
PTT and Thailand’s Hydrocarbon Sector: History
The PTT case study addresses the role of a national oil enterprise within the context of an ‚energy
short‛ fast-growing economy. As shown in figure 10.2, demand for petroleum products and natural
gas has grown rapidly over the past two decades. PTT’s origins and strategies reflect energy security
imperatives within a state context of economic liberalization.
Board of Directors
Audit Committee
Corporate Governance
Committee
Nomination Committee
Remuneration
Committee
President and Chief Executive Officer
Corporate
Management
Corporate Strategy and
Organization Development
Chief Financial
Officer
Chief Operating Officer Upstream
and Gas Business Group
Chief Operating Officer Downstream
and Gas Business Group
Gas Oil Petrochemical
and Refining
International
Trading

98
Figure 10.2 – Thailand crude oil and natural gas production, consumption
Source: Authors and CEE, based on data from U.S. Energy Information Administration (EIA), International
Statistics.
Since the 1990s, oil has accounted for about 50 percent of the country’s total primary energy
consumption (Sandu S., Sharma D. and Chaivongvilan 2008). More than half of the country’s natural
gas consumption is by electric generators (Koomsup and Sirasoontom 2007). Thailand has significant
natural gas reserves. Nevertheless, the country depends on imported oil to meet domestic demand. In
2005 about 95 percent of the country’s oil requirements were imported, that is, about 10 percent of its
gross domestic product (Sandu S., Sharma D. and Chaivongvilan 2008). To reduce its dependence,
Thailand has made substantial efforts to increase domestic production.
The history of the oil and gas sector in Thailand started in 1921, when oil was discovered in the
Fang basin. A small refinery was built near the Fang basin wells in 1956. The government established
the Oil Fuel Organization (OFO) to allocate refined petroleum products. A second refinery was
completed by Japanese construction companies at Bangchak, near Bangkok, in 1964.
The upstream sector was controlled by foreign companies, operating under a concession regime
established in 1971 with royalty and taxes ranging between 50–60 percent of project revenues
(Chandler and Thong-Ek 2009). Natural gas discoveries by the foreign concessionaries Unocal and
Texas Pacific in the Gulf of Thailand marked a new era in the energy sector’s development. The
government set up the Natural Gas Organization of Thailand (NGOT) as an allocation counterpart to
OFO. Yet, E&P efforts developed slowly due to the lack of a natural gas market in Thailand.
In 1978 the government established PTT with the primary function of providing adequate supplies
of petroleum to the country during the oil crises of 1978–81. Another important function for PTT was
the development of a natural gas transmission system. Its first offshore pipeline began delivering gas
from the Erawan field operated by Unocal in 1981. In 1982 PTT opened a second pipeline connecting
the Erawan field directly to an electric-generation plant in Bangkok (International Directory of
Company Histories 2004). By 1981 PTT controlled two-thirds of Thailand’s refining capacity. In
addition to its commercial operations, PTT took over the allocation functions of OFO and NGOT,
including OFO’s retail service station network.
In 1985 PTT entered into a joint venture with Shell to develop the Sirikit oil field concession and
began its first production operations (Oil and Gas Journal 1985). For that project PTT established an
upstream subsidiary—PTTEP. By the mid-1990s PTT had attained a domestic oil market share of 27
percent.
Between 1983 and 1987, PTT constructed six liquid petroleum gas (LPG) terminals nationwide,
linked to a LPG transportation system, and entered the petrochemicals business. By 1988 PTT had
-
100
200
300
400
500
600
700
800
900
1,000 Thailand Oil Production, Consumption
Oil Production ('000 b/d)
Oil Consumption ('000 b/d)
-
200
400
600
800
1,000
1,200
1,400 Thailand Natural Gas Production, Consumption
Natural Gas Production (BCF)
Natural Gas Consumption (BCF)

99
taken delivery of 1 trillion cubic feet (tcf) of natural gas from Unocal from the Erawan, Baanpot, Satun,
and Platong fields.
PTT entered the international market in 1993, with the acquisition of a 30 percent equity interest in
Petroasia, which operates service stations in China. During the same period PTTEP launched
operations in Algeria and Oman, and PTT entered into an agreement with Petronas (Malaysia’s NOC)
for the Malaysia-Thailand joint development area and began its international trading business.
Oil and gas demand increased rapidly in Thailand during the 1980s due to the industrialization
and urbanization of the country. In order to accelerate the development of its energy sector, the Thai
government undertook some institutional reforms. In 1992 PTT was restructured on the basis of
recommendations by McKinsey & Co. to improve the company’s commercial performance
(Chaivongvilin and others 2008). As a result, the National Energy Policy Council (NECP) and National
Energy Policy Office (NEPO) were formed as the sector’s primary policy makers.
The impact of the East Asian financial crisis in 1997 and 1998 highlighted Thailand’s energy sector
institutional issues (Sandu S., Sharma D. and Chaivongvilan 2008). Economic assistance loans
provided by the International Monetary Fund (IMF) carried conditions for the country to accelerate
energy reform and private ownership in the sector. In the fall of 2001 the Thai government sold 30
percent of its equity in PTT to the public: proceeds of $726 million were used to reimburse the
country’s debt with the IMF. Additional energy reforms were implemented to centralize policy-
making functions, and in 2002 the Ministry of Energy (MOE) was created. Supervision of the NEPO,
which was renamed the Energy Planning and Policy Office, was transferred from the Prime Minister’s
office to the MOE (Chandler and Thong-Ek 2009).
In 1997 the government initiated a series of reforms aimed to restructure the natural gas and
electricity sectors pursuant to the 1997 Master Plan for State Enterprise Sector Reform with the
objective of separating the roles of policy maker, regulator, and operator as well as providing new
regulatory frameworks for these sectors (Koomsup and Sirasoontom 2007). Major changes included
third-party access to the transmission and distribution network, separation of transmission and
trading, competition in trading, and introduction of an independent sector regulator. Figure 10.3
summarizes these reform measures.
Figure 10.3 - Existing and proposed natural gas sector organization in Thailand
Regulation: The Regulator’s tasks include: licensing; approving tariffs, developing load forecasts, ensuring energy security and reliability, setting
power purchase rules and regulation, monitoring of energy business operations, setting operational standards, promoting research and
development and capacity building in the energy sector, and promoting the use of renewable energy and energy efficiency.
Source: Authors based on information contained in National Energy Policy Office of Thailand (1998) and
Chaivongvilin and others (2008).
POCs
75%
PTT
100%
PTTEP
25%
PTT
100%
PTT
100%
Exploration &
Production
Pipelines &
Supply/Trading
Gas
Separation
Distribution
Regulator
E&P
companies
Transmission
and
Distribution
Pipelines
Traders
C
U
S
T
O
M
E
R
S
Sales Notes:

100
Despite strong protests by labor unions, these measures were finally adopted in December 2007
with the approval of the Energy Industry Act by the Thai legislature. The act established an
independent regulatory body for the natural gas sector (Energy Regulatory Commission, ERC) with a
clear division of functions between the MOE and ERC.
But the regulatory duties did not include direct tariff determination and were limited to
approval/disapproval of tariffs submitted by licensees. Although nondiscriminatory access to
pipelines was mandated, separation of marketing/trading businesses from transmission businesses
was not required. As a result, PTT still holds a monopoly/monopsony position.
To date the reform is in a transition phase, and measures under the Energy Industry Act have
been only partially implemented. As of 2009 the ERC had issued transportation, wholesale, and
distribution licenses for natural gas operations to PTT only (ERC 2010). In the meantime, the
privatization of PTT in 2001 was challenged in court. The court ruling made ‚some adjustments
relating the transfer of ownership of some pipelines back to the Ministry of Finance‛ (ERC 2010).
Nonetheless, it appears that these regulatory reforms gave some boost to exploration activity in the
hydrocarbon sector. The May 2008 licensing round was a success—resulting in 22 concessions for 27
blocks to be approved, of which 18 concessions for 21 blocks were signed (Chandler and Thong-Ek
2009).
Value Creation Index
Operational Performance
Operational performance indicators PPT
5-Yr Avg.,
All NOCs 2004 2005 2006 2007 2008 5-Yr
Avg.
E&P production growth (%) 25.54 13.98 10.30 6.17 21.97 15.6 10.4
Reserves replacement rate (BOE, %) 98.00 98.0 95.8
Refinery utilization rate (%) 91.00 90.20 91.00 92.00 86.00 90.0 90.3
Output / total assets (BOE/'000$) 3.94 3.46 3.11 2.47 3.16 3.2 16.2
Output / total employees ('000 BOE) 10.23 11.73 12.32 8.26 10.02 10.5 20.6
Source: Authors, CEE.
Note: boe = barrel of oil equivalent.
Production grew between 2004 and 2008, both domestically (about 75 percent of total production) and
overseas (Burma, Vietnam, and the Middle East), well above the average of the NOCs in our sample.
The reserve replacement rate in 2008 was 98 percent, probably helped by PTT’s 65 percent exploration
success ratio (company website http://www.pttplc.com/en). Some analysts forecast that the biggest
driver of PTT’s value growth will be through organic international expansion, particularly in Burma,
Australia, and the Middle East (Wood 2010).
Over the period of our analysis, refining utilization was about 90 percent. In fact, three of PTT’s
five refineries are complex, with potential for upgrades and expansions, and a fourth is undertaking a
project to improve its product slate.
PTT’s output-to-total-assets ratio is somewhat misleading, as output includes only crude oil,
natural gas, and products volumes, but a large portion of PTT’s assets are in gas transmission,
marketing and distribution, and international trading of oil and refined products. The NOC’s finding
and development costs have been rising over time in line with industry trends, but appear to be
slightly above the regional average. Finding and development costs went from $2.97/BOE in 2004 to

101
$15.67/BOE in 2008. The regional average for East Asia and the Pacific in 2008 was $12.45/BOE, while
the averages in the Middle East and Africa—that correspond to approximately 3 percent of the NOC’s
portfolio of projects—were respectively $5.12/BOE and $32.49/BOE. Lifting costs also increased, going
from $1.25/BOE in 2004 to $2.46/BOE in 2008, well below the regional averages (EIA 2008).
Financial performance
Financial performance indicators
PPT 5-Yr Avg.,
All NOCs 2004 2005 2006 2007 2008 5-Yr Avg.
EBRTN / revenues (%) 15.73 14.26 14.15 11.85 6.88 12.6 45.3
EBRTN / total assets (%) 20.82 20.28 23.06 20.05 15.56 20.0 34.9
Net cash flow / CAPEX (%) 45.27 79.33 89.05 106.88 98.29 83.6 131.4
Source: Authors, CEE.
Note: EBRTN = earnings before interest, taxes, and noncommercial expenditures; CAPEX = capital
expenditure
PTT’s earnings before interest, taxes, and noncommercial expenditures (EBRTN) increased from 2004
to 2007 primarily due to increased oil prices and production levels, and steady volume and earnings
growth in its gas businesses. PTT’s gas transmission business is very profitable as its tariffs have fixed
returns on equity of 11 to 16 percent (Wood 2010). In 2008 in particular, PTT’s EBRTN was hurt by a
loss in petrochemicals and refining. Its net cash-flow-to-capital-expenditure ratio was less than 100
percent over the period, resulting in a debt-to-equity ratio of 56 percent at the end of 2008. The latter
could be partially explained by the ambitious investment programs in all sectors PTT was involved in,
such as oil and gas E&P, natural gas transportation and marketing, and petrochemical industries. Joint
PTT and PTTET capital expenditures were planned at almost $10 billion for 2006–10. The company
plans to invest $15.9 billion overall in 2010–14.
National mission performance
National Mission performance
indicators
PPT 5-Yr Avg.,
All NOCs 2004 2005 2006 2007 2008 5-Yr
Avg.
Share of local labor (%) 97.84 96.48 95.56 96.7 81.5
NOC employment growth-country
employment growth (%) 14.73 -3.50 3.52 4.9 1.9
Share of NOC employment in
country labor force (%) 0.01 0.01 0.01 0.01 0.3
Share of local content (%) 64.4
Non-commercial expenditure/total
expenditure (%) 1.7
Non-core commercial activities net
income/total net income (%) 1.61 1.25 2.07 1.64 1.51 1.6 1.6
Price subsidies/revenue (%) 0.00 0.00 0.00 10.0
NOC domestic petroleum products
production/country oil consumption
(%)
34.76 35.68 84.62 89.22 87.70 66.6 71.9
Source: Authors, CEE.
The company does not provide price subsidies to any category of consumers, and has limited social
responsibilities, largely defined by the company (very much in the manner of international oil

102
companies). Although PTT’s share of local labor is higher than the average of the NOC sample, it
accounts for a very small portion of the total labor market.
Value Drivers
Geology
According to BP statistical review 2010, at the end of 2008 Thailand’s proven reserves of oil at 454
million barrels, while proven reserves natural gas were at 12 trillion cubic feet. But the country is still
largely under-explored.
Petroleum provinces in Thailand can be geographically separated into six regions: northern
Thailand, the Central Plain, northeastern Thailand, southern Thailand, the Gulf of Thailand, and the
Andaman Sea. Petroliferous basins are mostly tertiary in age and distributed across various areas, both
onshore and offshore. Proliferous petroleum basins are located both offshore and onshore, but the
majority of current production comes from the Gulf of Thailand – a mature area with some exploration
opportunities, particularly marginal fields.
Few major fields are expected to become operational in the coming years (Platong Gas II, with
capacity of about 416 million cubic feet per day, by Chevron; and Bongkot field, about 630 million
cubic feet per day, by PTT).
State context
Thailand is a unitary state that has traditionally employed a centralized form of government. The
country has been undergoing important political changes to develop governance structures that are
more suited to a highly competitive and rapidly changing global environment. The Thai government's
policies and the National Economic and Social Development Plan aim to support the free market, and
to encourage an increasing role for the private sector in economic and social development. Thailand is
a net importer of both oil and gas. Energy security is a key policy driver for petroleum exploration, as
well as energy efficiency and diversification.
Thailand’s Governance Indicators have been deteriorating over the period 2004-08, particularly
the control of corruption and political stability. Addressing corruption and improving accountability
would improve investors’ confidence and the efficiency of budget spending—and ultimately support
the country’s economic growth.
Petroleum sector organization and governance
Notwithstanding the monopoly of PTT in natural gas procurement, Thailand has promoted a rather
investment-friendly environment. There is a large presence of private oil companies in both the
upstream and downstream oil and gas sectors. The third and fourth largest refining assets in terms of
primary distillation capacity are controlled by private oil companies (namely Chevron and
ExxonMobil). Moreover, there is a market-based pricing system for petroleum products.
PTT has no regulatory functions. The Energy Policy and Planning Office (MOE) oversees the
performance of state-owned enterprises in the energy sector. The MOE has policy-setting
responsibilities. Far-reaching sector reforms in the upstream sector were introduced by the Energy
Industry Act in 2007 that put PTT in a more competitive environment. The act established an
independent regulator, the ERC, with some regulatory powers over the natural gas sector. Recent
changes to the natural gas regulatory framework have so far not affected PTT’s dominant position in
the gas midstream and downstream sectors, but these reforms seem to indicate a gradual opening
toward increased competition.
103
Company strategy and behavior
The company does not have a long history of operatorship in the upstream sector since it has mostly
relied on joint-venture partnerships, both domestically and internationally. PTT’s upstream portfolio
has a domestic and regional focus. About 75 percent of its production is domestic, and the majority of
its international production is regional.
Thailand has shown consistently accelerating growth in natural gas consumption, especially in the
power generation (33 percent of consumption) and industrial sectors. For example, most recent data
(first quarter of 2010) showed 18.3 percent and 29.9 percent growth respectively on a year-to-year
basis. Thus, it is not surprising that 46 percent of PTT capital expenditures over the next four years
have been earmarked for the natural gas business.62 Since the expected rate of production growth
would not suffice, PTT is currently developing an LNG regasification terminal with an initial capacity
of 5 million tonnes annually; this is expected to become operational in 2011–12.
Investments in the natural gas sector for PTTEP are expected to be on par with investments in
upstream joint ventures, which would keep oil production of the company from falling and ensure
sustainable growth (about 20 percent from 2009 to 2014). Investments in oil projects operated by
PTTEP stand at only 4 percent, which is much lower than for most NOCs in the sample group. PTT is
also planning to expand natural gas distribution networks, especially around nation’s capital.
It was recently reported that PTT is preparing to separate its natural gas transmission business
from gas procurement and gas distribution. Although PTT intends to retain 100 percent equity interest
in the new companies, this division will improve transparency and facilitate the benchmarking of
performance.
Another strategic point for PTT is developing regional fuel-exporting capabilities through
blending and gas pipeline projects.
Corporate governance
The initial public offerings made both by PTT and some of its subsidiaries increased financing options
for the company. The company appears to maintain some budget autonomy from the government,
which allows for streamlining and expedited planning and investments.63
PTT is governed by a 15-member board of directors (BOD) seven of whom are independent. The
BOD approves company strategies, objectives and financial targets and ensures the reliability of the
company’s accounting system, its financial reporting and auditing systems, and its internal controls.64
PTT’s corporate governance arrangements reflect domestic laws and regulations. Approximately
87 percent of the board members (13 out of 15) are government officials and/or company executives.
But in line with domestic regulations the company reports having nine independent directors on its
board. Board members are appointed by the shareholders from a list of candidates recommended by
the Nomination Committee.
In addition to the Nomination Committee, the board is assisted by three committees: Corporate
Governance, Audit, and Remuneration. The company’s corporate governance and ethics policy is
publicly available on its website.
62 PTT Analyst Meeting 2009, February 25, 2010, slides 30, 32. 63 Some experts consider PTT to have ‚limited financial or operational freedom.‛ See Business Monitor
International (2010: 66). 64 PTT Corporate Governance and Code of Ethics Handbook, Revised Version 2,
www.pttplc.som/Files/PTT_book/CG-book2010/PTT-CGHandBook-Eng.pdf.

104
Financial statements are audited by the government office of the auditor general of Thailand, with
reports filed in Bangkok. Hydrocarbon reserves for the PTT group are not being audited and reported,
but PTTEP reserves are internally assessed.
Conclusions
PTT has created significant value since its establishment in 1978. It has grown from an allocator of oil
and refined products to a fully integrated oil and gas company that is one of the 50 largest in the
ASEAN region. Profitability has suffered some in 2008 due to the recessionary economic environment,
but is expected to rebound with economic growth.
Thailand’s relative openness to private company competition has exposed the NOC to world-class
technologies and managerial practices. Together with the partial privatization of the company in 2001,
this competition has helped improved performance. Even withstanding economic crisis, the company
continues to have a profitable monopoly in gas transmission, distribution, and marketing. Recent
reforms introduced by the government in the natural gas sector suggest a transition toward full
competition.
105
References
Business Monitor International. 2010. Thailand Oil and Gas Report, Q3.
Chandler and Thong-Ek. 2009. ‚Thai E&P Sector,‛ http://www.ctlo.com/data/Thai%20E&P%20Sector-
01.pdf
EIA (U.S. Energy Information Administration). 2008. Performance Profile of Major Energy Producers.
http://www.eia.doe.gov/emeu/perfpro/aboutFRS.html.
———. 2010. International Energy Statistics.
http://tonto.eia.doe.gov/cfapps/ipdbproject/IEDIndex3.cfm?tid=5&pid=57&aid.
ERC (Energy Regulatory Commission). 2010. ‚Thailand Energy Regulatory Developments 2009.‛
Energy Regulatory Commission of Thailand (http://www2.erc.or.th/Doc/thailand.pdf).
International Directory of Company Histories. 2004. Vol. 56. St. James Press.
http://www.fundinguniverse.com/company-histories/PTT.
Koomsup, P., and Sirasoontom, P. 2007. ‚Energy Industry Act: Implications for the Energy Sector in
Thailand.‛ GMSARN International Conference on Sustainable Development, December 12–14
(http://dl.gmseenet.org:8080/handle/123456789/705).
National Energy Policy Office of Thailand. 1998. ‚Privatisation Master Plan. Energy Sector Report,‛
14–16. September 2.
Oil and Gas Journal. 1985. ‚Thai Shell in Accord for Sirikit Area Development.‛ Oil and Gas Journal,
May 13.
PTT. 2004–08. PTT’s annual reports 2004–08 and material available on the company Website.
http://www.pttplc.com/en.
———. 2010. PTT Corporate Governance and Code of Ethics Handbook, Revised Version 2.
http://www.pttplc.som/Files/PTT_book/CG-book2010/PTT-CGHandBook-Eng.pdf.
Sandu, S., Sharma, D. and Chaivongvilan, S. 2008. ‚Energy Challenges for Thailand: An Overview.‛
GMSARN International Journal 2: 53–60.
Wood, A. 2010. ‚Understanding and Investing in Thailand’s Energy Sector.‛ Bangkok Post, April 9.
106
11. Sonatrach S.A. (Algeria)
Hydrocarbons play a crucial role in Algeria’s economy, accounting for roughly 60 percent of total government
revenues, a third of gross domestic product (GDP), and over 95 percent of export earnings. Sonatrach is a
vertically integrated company, wholly owned by the government of Algeria. The national oil company (NOC)
has a complex history of operating in a challenging institutional environment. Algeria has faced a number of
internal security issues associated with its sociopolitical context, the civil war, and related conflicts over the
years. During the period 2004–08, relative peace enabled stronger economic growth, fueled by higher prices for
Algeria’s oil and gas commodities.
Institutional reforms and an improved investment climate had a positive effect on the hydrocarbon sector’s
performance, and Sonatrach’s in particular. But Algeria’s known reserves are mature, production has been
dropping, and exploration efforts have so far produced limited results. The NOC has been an efficient
producer of its existing reserves, but its reserves replacement ratio steadily declined between 2004 and 2008. To
counter this trend, the NOC launched an ambitious investment plan, including upstream, midstream, and
pipeline transportation, mainly financed with internally generated cash flow. Going forward this financial
strategy may require adjustment to reflect changed circumstances in commodity prices and the world
economy.
Company and country sector evolution
Business activities
Sonatrach is a diversified energy company with interests in a variety of non-core, non-energy related
businesses. The company’s core business started in the oil and gas sectors, and progressively diversified into
power generation and renewable energy.65 Over the past decade Sonatrach has also entered into the aviation66,
insurance,67 media,68 precious metal mining,69 and water desalination industries.70
Sonatrach has a share of about 80 percent of oil and 90 percent of natural gas production in Algeria
(Business Monitor International 2010: 44).
Sonatrach has a monopoly in the midstream and downstream sectors, including Algeria’s large liquefied
natural gas (LNG) businesses.
Sonatrach operates the largest oil field in Algeria, Hassi Messaoud, which is reported to have produced
about 26 percent of crude oil production. Hassi Berkine, a joint venture between Sonatrach and Anadarko,
reportedly produced about 20 percent of total crude production (EIA, 2010).
65Sharikat Kehraba Terga, Sonatrach’s subsidiary in the power sector, operates three gas-fired combined cycle generation
plants with combined capacity of 3,600 megawaatts, and NEAL Algeria, a joint venture between Sonatrach and Sonelgaz
(the state-owned power generation company) is engaged in development of renewable energy sources. 66 In 1998 Sonatrach and Air Algerie jointly established Tassili Airlines (51 percent and 49 percent respectively). Six years
later Sonatrach obtained full control over Tassili Airlines. 67 Sonatrach has 50 percent in the CASH insurance company (established in 2000, revenue of 2 billion dinars in 2004). In 2007
the company established a reinsurance subsidiary in Luxemburg. 68 BAOSEM is a joint venture of Sonatrach and Sonelgaz, created in 2000. 69 ENOR was established in 1992 and produced over 3300 ounces of gold in 2009. 70 Joint venture with Sonelgaz AEC was established in 2001 and has a capacity of 1,610,000 cubic meters/day of water
desalination.

107
Sonatrach operates over 2,000 miles of oil pipelines in the country. The most important pipelines carry
crude oil from the Hassi Messaoud field to export terminals. Sonatrach also operates oil condensate and
LPG pipeline networks that link Hassi R'Mel and other fields to Arzew (EIA, 2010).
Equity ownership and organization
Since its creation, the company has been fully owned by the state. It has more than 15 subsidiaries, specialized
in various segments of the company’s business. In the oil and gas sectors, Sonatrach operates along the entire
value chain through its subsidiaries. These include wholly owned subsidiaries such as NAFTEC (refining),
ENIP (petrochemicals), NAFTAL (domestic distribution of petroleum products), SNTM-HYPROC (shipping),
Algerian Petroleum Institute (oil and gas trading), and professional training and controlled subsidiaries such as
RENTP, ENAFOR (drilling), ENSP (well services), ENAGEO (geophysics), and ENGTP (engineering).
Sonatrach’s internal organization chart is shown in Figure 11.1.
Figure 11.1 – Sonatrach Organizational Structure
Source: Authors, based on information disclosed by the company on its website (www.sonatrach-dz.com).
Sonatrach and Algeria hydrocarbons sector: History
Sonatrach was established when Algeria gained national independence in 1963. The company, which was
created ‚on a modest scale to deal with a contentious pipeline project in December 1963, was intended to act as
an instrument of state ownership, government petroleum policy and, ultimately, central control of the
industry.‛ After the Evian Accord of 1965 the company was assigned broader roles beyond transportation and
marketing, but had to ‚co-operate with its French and other counterparts or at least co-exist with them‛
President and CEO
Ethics Committee
International Projects
Coordination Committee
Executives Committee
Projects Review
Committee
Public Relations Security
Upstream Pipelines Downstream Marketing and
Trading
Engineering and Development
Finance
Human Resources
Strategy and Planning
Affiliates and Shareholdings
Holding Services
Legal Affairs
Internal Audit
Procurement
Health, Safety and Environment
Management of JVs
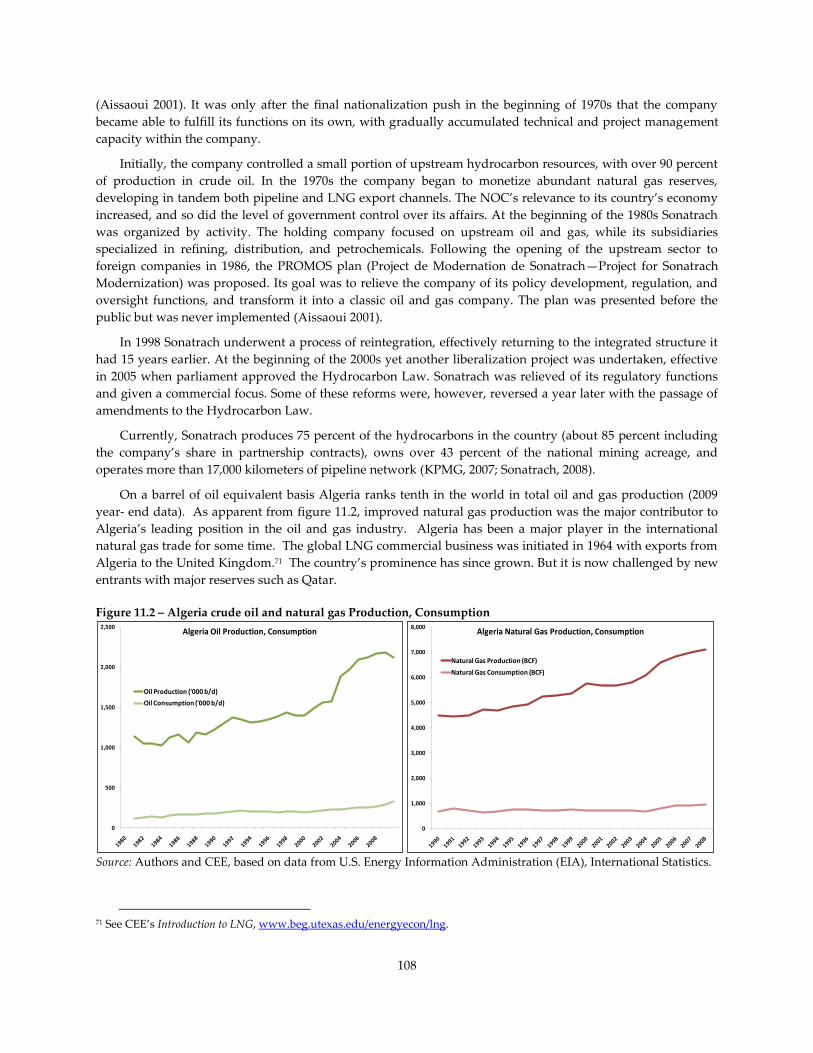
108
(Aissaoui 2001). It was only after the final nationalization push in the beginning of 1970s that the company
became able to fulfill its functions on its own, with gradually accumulated technical and project management
capacity within the company.
Initially, the company controlled a small portion of upstream hydrocarbon resources, with over 90 percent
of production in crude oil. In the 1970s the company began to monetize abundant natural gas reserves,
developing in tandem both pipeline and LNG export channels. The NOC’s relevance to its country’s economy
increased, and so did the level of government control over its affairs. At the beginning of the 1980s Sonatrach
was organized by activity. The holding company focused on upstream oil and gas, while its subsidiaries
specialized in refining, distribution, and petrochemicals. Following the opening of the upstream sector to
foreign companies in 1986, the PROMOS plan (Project de Modernation de Sonatrach—Project for Sonatrach
Modernization) was proposed. Its goal was to relieve the company of its policy development, regulation, and
oversight functions, and transform it into a classic oil and gas company. The plan was presented before the
public but was never implemented (Aissaoui 2001).
In 1998 Sonatrach underwent a process of reintegration, effectively returning to the integrated structure it
had 15 years earlier. At the beginning of the 2000s yet another liberalization project was undertaken, effective
in 2005 when parliament approved the Hydrocarbon Law. Sonatrach was relieved of its regulatory functions
and given a commercial focus. Some of these reforms were, however, reversed a year later with the passage of
amendments to the Hydrocarbon Law.
Currently, Sonatrach produces 75 percent of the hydrocarbons in the country (about 85 percent including
the company’s share in partnership contracts), owns over 43 percent of the national mining acreage, and
operates more than 17,000 kilometers of pipeline network (KPMG, 2007; Sonatrach, 2008).
On a barrel of oil equivalent basis Algeria ranks tenth in the world in total oil and gas production (2009
year- end data). As apparent from figure 11.2, improved natural gas production was the major contributor to
Algeria’s leading position in the oil and gas industry. Algeria has been a major player in the international
natural gas trade for some time. The global LNG commercial business was initiated in 1964 with exports from
Algeria to the United Kingdom.71 The country’s prominence has since grown. But it is now challenged by new
entrants with major reserves such as Qatar.
Figure 11.2 – Algeria crude oil and natural gas Production, Consumption
Source: Authors and CEE, based on data from U.S. Energy Information Administration (EIA), International Statistics.
71 See CEE’s Introduction to LNG, www.beg.utexas.edu/energyecon/lng.
0
500
1,000
1,500
2,000
2,500Algeria Oil Production, Consumption
Oil Production ('000 b/d)
Oil Consumption ('000 b/d)
0
1,000
2,000
3,000
4,000
5,000
6,000
7,000
8,000Algeria Natural Gas Production, Consumption
Natural Gas Production (BCF)
Natural Gas Consumption (BCF)
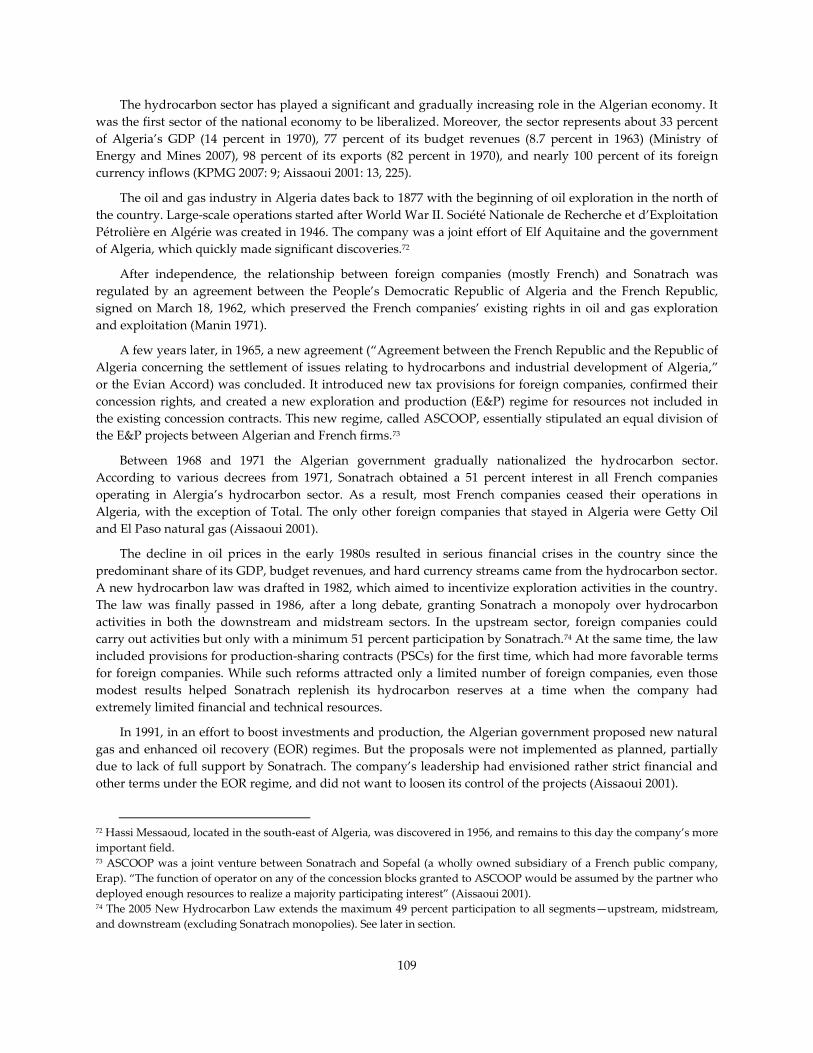
109
The hydrocarbon sector has played a significant and gradually increasing role in the Algerian economy. It
was the first sector of the national economy to be liberalized. Moreover, the sector represents about 33 percent
of Algeria’s GDP (14 percent in 1970), 77 percent of its budget revenues (8.7 percent in 1963) (Ministry of
Energy and Mines 2007), 98 percent of its exports (82 percent in 1970), and nearly 100 percent of its foreign
currency inflows (KPMG 2007: 9; Aissaoui 2001: 13, 225).
The oil and gas industry in Algeria dates back to 1877 with the beginning of oil exploration in the north of
the country. Large-scale operations started after World War II. Société Nationale de Recherche et d’Exploitation
Pétrolière en Algérie was created in 1946. The company was a joint effort of Elf Aquitaine and the government
of Algeria, which quickly made significant discoveries.72
After independence, the relationship between foreign companies (mostly French) and Sonatrach was
regulated by an agreement between the People’s Democratic Republic of Algeria and the French Republic,
signed on March 18, 1962, which preserved the French companies’ existing rights in oil and gas exploration
and exploitation (Manin 1971).
A few years later, in 1965, a new agreement (‚Agreement between the French Republic and the Republic of
Algeria concerning the settlement of issues relating to hydrocarbons and industrial development of Algeria,‛
or the Evian Accord) was concluded. It introduced new tax provisions for foreign companies, confirmed their
concession rights, and created a new exploration and production (E&P) regime for resources not included in
the existing concession contracts. This new regime, called ASCOOP, essentially stipulated an equal division of
the E&P projects between Algerian and French firms.73
Between 1968 and 1971 the Algerian government gradually nationalized the hydrocarbon sector.
According to various decrees from 1971, Sonatrach obtained a 51 percent interest in all French companies
operating in Alergia’s hydrocarbon sector. As a result, most French companies ceased their operations in
Algeria, with the exception of Total. The only other foreign companies that stayed in Algeria were Getty Oil
and El Paso natural gas (Aissaoui 2001).
The decline in oil prices in the early 1980s resulted in serious financial crises in the country since the
predominant share of its GDP, budget revenues, and hard currency streams came from the hydrocarbon sector.
A new hydrocarbon law was drafted in 1982, which aimed to incentivize exploration activities in the country.
The law was finally passed in 1986, after a long debate, granting Sonatrach a monopoly over hydrocarbon
activities in both the downstream and midstream sectors. In the upstream sector, foreign companies could
carry out activities but only with a minimum 51 percent participation by Sonatrach.74 At the same time, the law
included provisions for production-sharing contracts (PSCs) for the first time, which had more favorable terms
for foreign companies. While such reforms attracted only a limited number of foreign companies, even those
modest results helped Sonatrach replenish its hydrocarbon reserves at a time when the company had
extremely limited financial and technical resources.
In 1991, in an effort to boost investments and production, the Algerian government proposed new natural
gas and enhanced oil recovery (EOR) regimes. But the proposals were not implemented as planned, partially
due to lack of full support by Sonatrach. The company’s leadership had envisioned rather strict financial and
other terms under the EOR regime, and did not want to loosen its control of the projects (Aissaoui 2001).
72 Hassi Messaoud, located in the south-east of Algeria, was discovered in 1956, and remains to this day the company’s more
important field. 73 ASCOOP was a joint venture between Sonatrach and Sopefal (a wholly owned subsidiary of a French public company,
Erap). ‚The function of operator on any of the concession blocks granted to ASCOOP would be assumed by the partner who
deployed enough resources to realize a majority participating interest‛ (Aissaoui 2001). 74 The 2005 New Hydrocarbon Law extends the maximum 49 percent participation to all segments—upstream, midstream,
and downstream (excluding Sonatrach monopolies). See later in section.

110
The regulatory framework in Algeria was initially modeled after that of the French. The Directorate for
Energy and Fuel (DEC) was in charge of general energy policy issues. While the Bureau Algerien des Petroles
(BAP), which was created in 1962 and operated under the DEC was charged with the E&P of oil resources, the
BAP could participate in commercial activities either on its own or jointly with private and public companies. It
also took over government shares in then-existing oil and gas companies (SN Repal, for instance). Most of the
upstream and midstream companies in Algeria at that time represented joint ventures between the French
public Bureau des Recherches des Petroles (BRP), French and U.S. private companies, and the Algerian
government (in a very few cases). The BAP was dissolved several years later, with the Ministry of Industry and
Energy and Sonatrach taking over its regulatory functions.75
In 1981 the National Energy Council (NEC) was formed with a mission to define national energy policy
and to coordinate its implementation. The NEC was comprised mainly of various government ministers, but
the chief executives of Sonatrach and Sonelgaz (a power-generation state-owned company) also served on the
council between 1990 and 1995.76
In 1997 Sonatrach was formally placed under the Ministry of Energy and Petrochemical Industries (later
Ministry of Energy and Mines), which strengthened the government’s influence over the NOC’s growth and
development strategy as well as Sonatrach’s influence on sector policy and regulatory issues.
In 2001 the Ministry of Energy and Mines proposed the reorganization of Sonatrach into three different
entities: (i) an upstream administrative regulatory agency responsible for managing national hydrocarbon
resources including licensing rounds, concessions, and contracts; (ii) a midstream and downstream regulatory
agency responsible for the regulation and oversight of pipeline network access, tariffs and safety, and
environmental regulation, and (iii) a commercial entity competing against domestic and foreign private
companies. The proposed reform was captured in a draft Hydrocarbon Law, which after a long debate was
finally passed by Parliament in 2005. Two state agencies, the Agence Nationale pour la Valorisation des
Resources en Hydrocarbures (ALNAFT) and Autorité de Régulation des Hydrocarbures (ARH), were
established. Sonatrach was granted the option to participate by up to 30 percent in exploration and/or
production contracts with other state and private companies.
The reform was partially reversed in 2006 when amendments to the 2005 Hydrocarbons Law were passed.
In contrast with the original reform that aimed to increase competition in the upstream oil and gas sector,
Sonatrach was mandated to participate in all upstream, midstream, and downstream (refining) projects with a
minimum controlling interest of 51 percent. 77
Algeria’s first exploration licensing round, carried out in 2008 by the ALNAFT, generated limited
investment interest. The government offered 16 exploration blocks: 9 bids were submitted and only 4 licenses
were granted. The limited response of foreign companies was attributed to regulatory uncertainty and the
challenging commercial terms offered by the state agency. In 2009 the ALNAFT held a second licensing round,
under which several of the blocks from the first licensing round were reoffered. In January 2010 only 3 licenses
were awarded out of 10 blocks offered.
75 Sonatrach was created at the end of 1963 only, and initially did not have a mandate to represent the state in joint ventures.
It was only by the end of 1966 that Sonatrach took over state equity in those entities (Kouadri 1969). 76 According to Aissaoui (2001: 209) Sonatrach and Sonelgas were ‚de-facto policy makers.‛ 77 National Hydrocarbon Law articles 32, 48, 68 and 77.

111
Value Creation Index
Operational performance
Operational performance indicators Sonatrach 5-Yr Avg.,
All NOCs 2004 2005 2006 2007 2008 5-Yr Avg.
E&P production growth (%) 15.04 -3.63 -0.89 1.29 -0.51 2.3 10.4
Reserves replacement rate (BOE, %) 50.82 51.0 95.8
Refinery utilization rate (%) 81.36 81.48 84.47 87.17 93.27 85.6 90.3
Output / total assets (BOE/'000$) 47.47 39.48 32.42 25.76 21.22 33.3 16.2
Output / total employees ('000 BOE) 48.07 45.74 44.53 43.22 41.72 44.7 20.6
Source: Authors, CEE.
Note: boe = barrel of oil equivalent.
Overall, Sonatrach’s E&P output declined during the study period. Indeed, Sonatrach’s five-year average
production growth was significantly lower than that of the average in our sample. According to industry
reports, much of the company’s success in production activities in the past decade came from Sonatrach’s joint
operations with foreign companies. Over the period 2004–08, gas production increased by 7 percent while
crude oil production fell by 2 percent, leading to an overall decrease in oil equivalent production of 4 percent.
Although the number of oil and gas exploration wells has increased dramatically, the company’s reported
reserves replacement rate, which includes probable reserves, has been steadily declining.78 Indeed there has
been a very limited increase in seismic acquisition and exploration drilling activities between 2004 and 2008,
and the company has been seeking alternative natural gas supplies to meet its contractual obligations. In the
past few years, Sonatrach has focused on improving its domestic performance in the crude oil sector at the
expense of international activities. Results are yet to be seen, since most of the projects are in the exploration
stage. Enhanced oil recovery (EOR) has the potential to increase domestic crude oil production but, according
to industry reports, interest in EOR projects by private companies has so far been limited.
In terms of overall company performance on an operating basis, Sonatrach’s output to total assets has
dropped sharply since 2005, although its five-year average was higher than that of our study sample. The
company’s output to total employees is, however, high relative to the sample average, but also declining.
Similar to the Petróleos de Venezuela, S.A., this ratio may be affected by the share of production Sonatrach
books from its mandatory equity interests in concessions and contracts.
78 According to Sonatrach’s annual reports, in 2008 the NOC added 75 million tonnes of oil equivalent of proved and
probable reserves, which translates into approximately 30 percent reserve replacement ratio, down from 61 percent in 2004.
It should be noted that these data refer to proved and probable reserves. As such they have been excluded from the data
sample, which is based on proved reserves only.

112
Financial performance
Financial performance indicators Sonatrach 5-Yr Avg.,
All NOCs 2004 2005 2006 2007 2008 5-Yr Avg.
EBRTN / revenues (%) 66.48 72.07 66.88 69.68 70.07 69.0 45.3
EBRTN / total assets (%) 60.96 80.68 74.45 65.01 71.36 62.9 34.9
Net cash flow / CAPEX (%) 194.82 240.43 210.62 194.67 147.04 197.5 131.4
Source: Authors, CEE.
Note: EBRTN = earnings before interest, taxes, and noncommercial expenditures; CAPEX = capital expenditure.
The ratio of earnings before interest, taxes, and noncommercial expenditures (EBRTN) on social and economic
development programs to revenues has been fairly consistent, owing primarily to the favorable global oil and
gas price environment and Algeria’s resource endowments.
The NOC’s net cash flow to capital expenditure remained strong, notwithstanding the decline in
commodity prices in 2008, suggesting that the NOC has sufficient financial flexibility to implement its
expansion plans.
National Mission performance
National Mission performance indicators
Sonatrach 5-Yr
Avg.,
All NOCs 2004 2005 2006 2007 2008
5-Yr
Avg.
Share of local labor (%) 99.99 100.00 100.00 100.00 100.00 100.0 81.5
NOC employment growth-country
employment growth (%) -9.99 -4.59 -4.92 3.15 2.30 -0.5 1.9
Share of NOC employment in country labor
force (%) 0.34 0.32 0.31 0.32 0.32 0.30 0.3
Share of local content (%) 64.4
Non-commercial expenditure/total expenditure
(%) 1.7
Non-core commercial activities net income/total
net income (%) 1.64 1.89 2.02 2.36 2.36 2.1 1.6
Price subsidies/revenues (%) 15.08 16.57 18.17 18.56 20.84 17.8 10.0
NOC domestic petroleum products
production/country oil consumption (%) 152.28 145.81 142.76 132.18 131.19 140.8 71.9
Source: Authors, CEE.
Sonatrach largely employs Algerian nationals. The percentage of Sonatrach’s employees in the country labor
force has dropped significantly since the 1980s. Sonatrach’s personnel fell from approximately 100,000
employees two decades earlier to approximately 40,000 in 2007–08, but in that same period the NOC’s
employment growth was higher than that of its country. This long-term adjustment is probably a consequence
of earlier reorganization.
The NOC does not report the share of goods and services purchased from local suppliers as a percentage
of its total purchases, nor does it report grants, donations, and contributions to Algerian social and economic
development.
Sonatrach is clearly a major contributor to Algerian socioeconomic programs but the extent of its
obligations is unknown. While the NOC does not report noncommercial socioeconomic expenditures, the
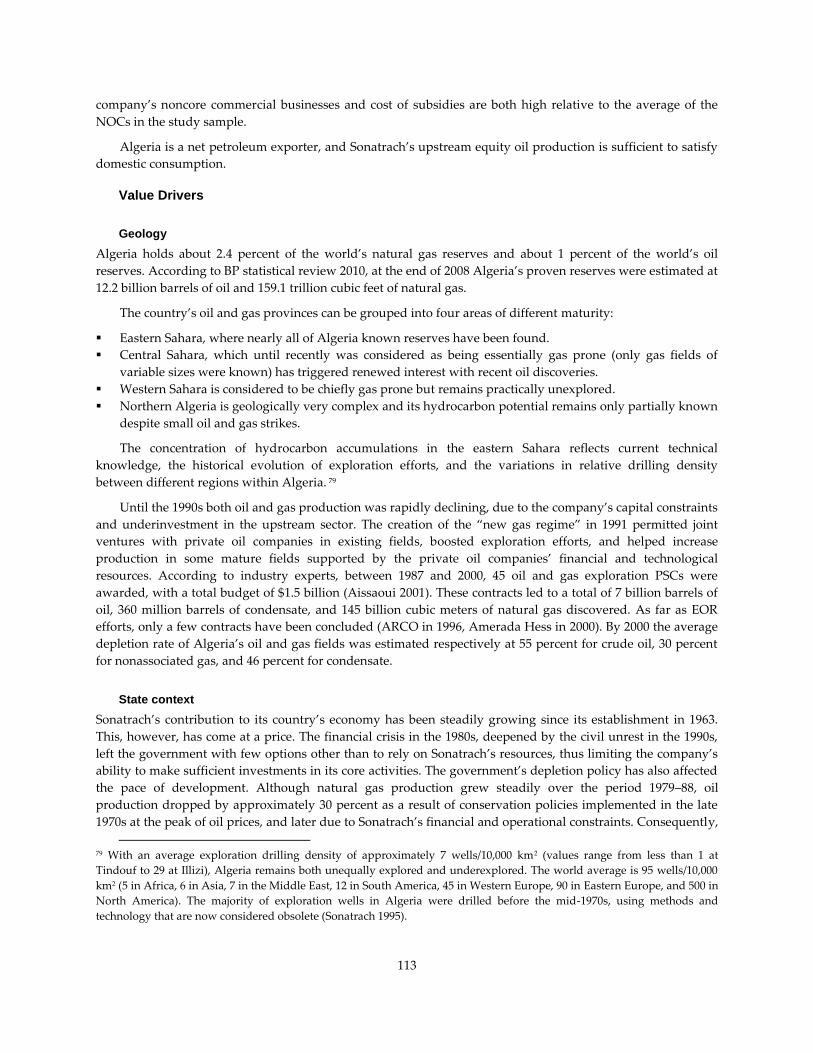
113
company’s noncore commercial businesses and cost of subsidies are both high relative to the average of the
NOCs in the study sample.
Algeria is a net petroleum exporter, and Sonatrach’s upstream equity oil production is sufficient to satisfy
domestic consumption.
Value Drivers
Geology
Algeria holds about 2.4 percent of the world’s natural gas reserves and about 1 percent of the world’s oil
reserves. According to BP statistical review 2010, at the end of 2008 Algeria’s proven reserves were estimated at
12.2 billion barrels of oil and 159.1 trillion cubic feet of natural gas.
The country’s oil and gas provinces can be grouped into four areas of different maturity:
Eastern Sahara, where nearly all of Algeria known reserves have been found.
Central Sahara, which until recently was considered as being essentially gas prone (only gas fields of
variable sizes were known) has triggered renewed interest with recent oil discoveries.
Western Sahara is considered to be chiefly gas prone but remains practically unexplored.
Northern Algeria is geologically very complex and its hydrocarbon potential remains only partially known
despite small oil and gas strikes.
The concentration of hydrocarbon accumulations in the eastern Sahara reflects current technical
knowledge, the historical evolution of exploration efforts, and the variations in relative drilling density
between different regions within Algeria. 79
Until the 1990s both oil and gas production was rapidly declining, due to the company’s capital constraints
and underinvestment in the upstream sector. The creation of the ‚new gas regime‛ in 1991 permitted joint
ventures with private oil companies in existing fields, boosted exploration efforts, and helped increase
production in some mature fields supported by the private oil companies’ financial and technological
resources. According to industry experts, between 1987 and 2000, 45 oil and gas exploration PSCs were
awarded, with a total budget of $1.5 billion (Aissaoui 2001). These contracts led to a total of 7 billion barrels of
oil, 360 million barrels of condensate, and 145 billion cubic meters of natural gas discovered. As far as EOR
efforts, only a few contracts have been concluded (ARCO in 1996, Amerada Hess in 2000). By 2000 the average
depletion rate of Algeria’s oil and gas fields was estimated respectively at 55 percent for crude oil, 30 percent
for nonassociated gas, and 46 percent for condensate.
State context
Sonatrach’s contribution to its country’s economy has been steadily growing since its establishment in 1963.
This, however, has come at a price. The financial crisis in the 1980s, deepened by the civil unrest in the 1990s,
left the government with few options other than to rely on Sonatrach’s resources, thus limiting the company’s
ability to make sufficient investments in its core activities. The government’s depletion policy has also affected
the pace of development. Although natural gas production grew steadily over the period 1979–88, oil
production dropped by approximately 30 percent as a result of conservation policies implemented in the late
1970s at the peak of oil prices, and later due to Sonatrach’s financial and operational constraints. Consequently,
79 With an average exploration drilling density of approximately 7 wells/10,000 km2 (values range from less than 1 at
Tindouf to 29 at Illizi), Algeria remains both unequally explored and underexplored. The world average is 95 wells/10,000
km2 (5 in Africa, 6 in Asia, 7 in the Middle East, 12 in South America, 45 in Western Europe, 90 in Eastern Europe, and 500 in
North America). The majority of exploration wells in Algeria were drilled before the mid-1970s, using methods and
technology that are now considered obsolete (Sonatrach 1995).

114
‚at one point, in the context of the Gulf crisis of 1990–91, it [Sonatrach] was even unable to produce its higher
quota of 827 kd/d‛ (Aissaoui 2001).
Since 1994 Algeria has managed to restore its economy by restructuring its external debt, liberalizing its
exchange rate, devaluing its currency, and limiting public expenditures growth. As the government’s financial
needs decreased, Sonatrach was able to retain sufficient cash flow for reinvestment in operations, and
hydrocarbon exports increased. During the study period, 2004–08, the company enjoyed a period of prosperity,
largely as a function of higher commodity prices. The state budget was in a rather healthy condition, and
Algeria was in a period of relative calm. During this period Sonatrach managed to increase natural gas
production and exports, while keeping oil production levels stable. At the same time, the company started to
diversify its commercial operations and to expand its reach outside Algeria.
State context, in sum, has been an important driver for both Sonatrach’s and Algeria’s hydrocarbon sector
performance. Algeria fares poorly on all World Bank World Governance Indicators; on some measures (such as
voice and accountability, regulatory quality, political stability) rankings have worsened steadily. Uncertain
commodity price and global economic conditions, a resumption of civil unrest, and many other risks cloud the
future. The recent departure of former energy minister Chakib Khalil casts some doubt on Sonatrach’s future
expansion plans and projects (Saleh 2010).
Petroleum sector organization and governance
The relationship among the Ministry of Energy and Mines, the hydrocarbon sector regulators (most recently,
ALNAFT and ARH), and Sonatrach has been difficult at times. The government’s ambitious plan to restructure
the petroleum sector in 2005 was not entirely realized, to some extent owing to a lack of support and
cooperation from Sonatrach.
The partial reform succeeded in increasing foreign participation in the sector, although not at the levels
originally envisioned by the 2005 Hydrocarbon Law. Direct foreign investment went up from $671 million in
1999 to $2.4 billion in 2002. While non-NOC exploration efforts have been steadily growing, oil production has
stagnated; Sonatrach still has firm control over the midstream and downstream sectors (most notably, LNG
and refining), while some openings for new investors have occurred in the petrochemical sector.
Amendments to the 2005 Hydrocarbon Law included a hydrocarbon windfall profit tax of up to 50 percent
when oil prices topped $30 per barrel, which may have made investments in the country less attractive for
foreign players.80 Coupled with the mandatory minimum 51 percent participation of Sonatrach (carried
through exploration), this policy measure might have contributed to production declines and low reserve
replacement rates, affecting Sonatrach’s performance.
NOC strategy and behavior
Political conditions in Algeria, and reliance on Sonatrach's revenue streams, are such that Sonatrach's
investment decisions rest on a complex set of political, economic, and project specific considerations.
Although its known resource base is mostly mature, and its technical and financial capabilities are not
sufficient to support an intensive expansion, the company has adopted a rather conservative strategy by
maintaining strong control over oil and gas exploration, gas transportation, LNG and oil refining.
80 The windfall tax was imposed on annual revenue minus oil revenue taxes, royalties/depreciation, and operating expenses.
The tax regime was identical for the international oil companies and Sonatrach. The windfall tax did affect value creation
directly. Algeria’s rankings in the Fraser Institute (2007 and 2008) Surveys placed the country in the middle of the
distribution (from one to five, with five being best) on favorability of tax regime with a scant 6 percent decline between the
surveys.
115
Sonatrach has been expanding its operations abroad since 2000. SIPEX, an upstream subsidiary, operates
in Yemen. Sonatrach also has exploration projects in Mali, Niger, Libya, Egypt, Morocco, Mauritania and Peru.
In the midstream and downstream oil and gas sectors, Sonatrach has several ventures: (i) 50 percent interest in
the Trans-Mediterranean Pipeline Company, which transports natural gas to Spain and Italy, (ii) 100 percent
interest in SIPCO, which has a share in the Camisea natural gas project in Peru; (iii) 11 percent interest in
TGPC, also part of the Camisea project; and (iv) 36 percent interest in MEDGAS, a pipeline company that
transports Algeria’s gas to Spain. In addition, Sonatrach participates in the proposed TransSahara pipeline that
will carry natural gas from Nigeria into Sonatrach’s systems and export markets. Sonatrach also has extensive
investment interests abroad. SPIC has assets in the United States, Spain, and the Netherlands, PROPANCHEM
is a petrochemical JV with BASF, located in Spain (Sonatrach has 49 percent). Sonatrach also has a 10 percent
share in a LNG regasification terminal in Reganosa, Italy. GTP, an engineering and construction subsidiary of
Sonatrach operates in Mauritania, Yemen, Mali, and Morocco. Sonatrach also controls several hydrocarbon
trading and marketing companies abroad, as well as financial services companies.
Its international operations in Africa have increased the company’s exposure to technology and know-
how, but have so far provided very limited contribution to reserves growth. Joint ventures with foreign
companies have helped to leverage Sonatrach’s resources in the upstream sector. But while capital
expenditures increased by 60 percent from 2004 to 2008, Sonatrach’s share in seismic activities dropped from 90
percent in 2001 to 30 percent in 2007 and its share in exploration activities from 66 percent to 46 percent.
The midstream sector has been stagnating domestically, with some progress on export routes (MEDGAZ,
GALSI). Little progress has been made in the capital-intensive downstream sector.81 Two additional
liquefaction facilities are in the making, which would strengthen Sonatrach’s export capabilities. However, the
increased competition from non-traditional sources of natural gas in Europe, the relatively low near-term
international natural gas price conditions, coupled with Sonatrach’s reserves constraints could reduce the
contribution of these expansion projects to the company’s operational and financial value creation capabilities.
NOC Corporate Governance
The company’s General Assembly, which is presided over by the minister of energy and comprises the
minister of finance, the commissioner general for planning, the governor of the Central Bank of Algeria, and a
representative of the presidency, is the highest governance body. Thus the General Assembly functions as a
mini cabinet, and performs the state role of ownership (Assaoui 2001). Among its tasks is the approval of the
company’s budget.
The minister of energy sets the agenda, and convenes and chairs the General Assembly. The minister also
appoints the company’s president and general manager—who is also the chairman of the board of directors—
and gives prior approval to the appointment of the Executive Committee by the CEO (Assaoui 2001).
The board includes 13 members, most of which are representatives of various ministries, including the
Ministry of Finance, Bank of Algeria, and Ministry of Hydrocarbons. Other boards members include
representatives of Sonatrach and its employees. The 12 executive directors of the NOC form the Executive
Committee.
In terms of external governance, the National Energy Council (NEC) sets broad strategic policy guidelines
for the energy sector, which the minister of energy implements and develops through regulations. The NEC is
also a recipient of the reports prepared by the board of directors.
81 Plans for new projects were scrapped on a regular basis, and lack of foreign participation due to Sonatrach’s reluctance
did not help. The only refinery built in 30 years was Adrar, with 600,000 tonnes of annual capacity (2006).
116
Political conditions in Algeria, and reliance on Sonatrach’s revenue streams, are such that Sonatrach’s
investment decisions rest on a complex set of political, economic, and project-specific considerations.
The company’s financial reports are audited internally; accounts are kept according to domestic
accounting principles and the U.S. Generally Accepted Accounting Principles (GAAP).
Reserves reporting, although periodically audited by an independent international company, are not
reported according to the Securities and Exchange Commission (SEC), International Financial Reporting
Standards (IFRS), or Society of Petroleum Engineers (SPE) standards.
Conclusions
In many respects, Sonatrach resembles PEMEX (Mexico) and PDVSA (Venezuela) in its challenges. A strong
resource endowment enabled the country and the company to leap to the top of the global oil and gas arena,
but internal state challenges and a maturing, depleting resource endowment have placed strains on their ability
to create value. To a large extent, the NOC has benefited enormously from geology, the size and scope of the
country’s resource endowments, and its ability to become a dominant producer and exporter.
Recent regulatory reforms appear to have generated more interest from international investors, which
would in turn have had a positive impact on Sonatrach’s performance. The NOC is an effective producer of its
existing fields, but oil production is declining and the company’s overall ability to replace reserves through
exploration is stretched. Additional regulatory and fiscal regime changes such as improved financial and
strategic independence for Sonatrach, more attractive investment conditions, and some flexibility with respect
to the ‚Algerization‛ of human resources, are likely to be contentious.
Sonatrach’s organization and governance as well as that of the petroleum sector are equally complex. It
appears that the company has both impacted and been impacted by government actions. Sonatrach’s mission
has been stated as follows: ‚to meet Algeria’s present and future needs; to maximize the long-term value of
Algeria’s hydrocarbon resources; and to contribute to national development, primarily by providing the
required hard currency revenues.‛82 While the company has clearly met these objectives throughout its history,
its ability to meet them going forward (given the maturity of Algeria’s resource endowments) would require a
facilitating framework that will sustain and increase investor interest, as well as a stable socioeconomic context.
82 Ministry of Energy and Minerals’ website.
117
References
Aissaoui, A. 2001. The Political Economy of Oil and Gas. Oxford University Press.
Business Monitor International. 2010. Algeria Oil and Gas Report Q3. www.businessmonitor.com.
Fraser Institute. 2007 and 2008. Global Petroleum Survey. http://www.fraserinstitute.org/research-
news/overview.aspx.
Kouadri, M. El-Aziz. 1969. ‚Place et Rôle du Secteur Pétrolier dans le Développement de L'économie
Algérienne.‛ Tiers-Monde 10 (39): 636.
KPMG Algeria SPA. 2007. Algeria Hydrocarbon Guide.
http://www.algeria.kpmg.com/fr/Documents/Guide%20Hydrocarbures%202007en.pdf.
Manin, P. 1971. ‚Le différend franco-algérien relatif aux hydrocarbures.‛ Annuaire français de droit international
17 (17).
MEM (Ministry of Energy and Mining). 2007. Evolution du Secteur de l’Energie at des Mines, 1962–2007. Ministry
of Energy and Mining of Algeria.
Saleh, H. 2010. ‚Algeria Reshuffle Hits Oil Portfolio.‛ Financial Times, May 13.
Sonatrach. 1995. Algeria’s Hydrocarbon Potential. http://www.mem-algeria.org/fr/hydrocarbures/w4_0.pdf.
118
12. StatoilHydro ASA. (Norway)
Statoil has been both the result and the driver of institutional change in Norway’s petroleum sector. Since its
inception in the early 1970s, Statoil’s role and objectives have evolved considerably, to a large extent reflecting
changes in its geological, economic, institutional, and managerial circumstances.
As for many other national oil companies (NOCs), Statoil benefited (and to a certain extent continues to
benefit) from the backing of the state and the privileges afforded to it. With state support, Statoil was able to
focus on its core business, to develop knowledge and expertise, and to realize strategic investments in
technologies.
Company and sector evolution
Business activities
Statoil was created in 1972 as the NOC of Norway. In October 2007 it merged with partially state-owned Norsk
Hydro (‚Statoil-Hydro,‛ herein referred to as ‚Statoil‛). International oil majors have a sizable presence in
Norway but they must act in partnership with Statoil. Statoil owns and operates the 179,000 barrels per day
(bpd) Mongstad refinery, one of two domestic Norwegian refineries. (ExxonMobil owns and operates the
115,000 bpd Slagen refinery.) Statoil also owns a 10 percent stake in the Shell-operated 400,000 bpd Pernis
refinery in the Netherlands and 100 percent of the 118,000 bpd Kalundborg refinery in Denmark. Norway is an
important supplier of gasoline and diesel fuel to the European Union (EU), largely because its refined products
comply with EU environmental rules. Statoil dominates retail sales of petroleum in Norway with a strong
distribution network that includes Poland and Russia. Statoil and Finland’s Neste group jointly own Borealis,
which is a petrochemicals company headquartered in Copenhagen.
Oil and gas pipelines primarily serve export markets in the United Kingdom and the continent, but Statoil
no longer has exclusive ownership and operation of these pipeline networks. The company operates a liquefied
natural gas (LNG) export terminal and liquefaction facility at Melkoya, near Hammerfest, which came online in
late 2007 to process gas from the Snohvit gas field, the first development in the Barents Sea. The terminal has
200 billion cubic feet (bcf) a year capacity and shipments in 2008 totaled about 77 bcf (Cedigaz), with Spain
being the largest customer.
With the increasing maturity of the Norwegian Continental Shelf (NCS) and with a limited domestic
market, Statoil has been eager to compete internationally. Currently it has operations in over 20 countries,
including Brazil, Canada, and the United States. In 1990 it entered into an international alliance with BP, which
enabled it to participate in key international explorations and developments, such as the Angolan deep
offshore blocks and the Azeri-Chirag-Guneshli development in Azerbaijan.
Equity ownership
Statoil is 67 percent owned by the Norwegian government, and it controls 80 percent of Norway’s oil and gas
production. State ownership has changed over the years: Statoil became 100 percent government owned in
1972. But in December 2000, parliament approved its partial privatization with the sale of 19.2 percent of Statoil
shares (valued at approximately $16 billion) on the Oslo and New York Stock Exchanges. In July 2004 and in
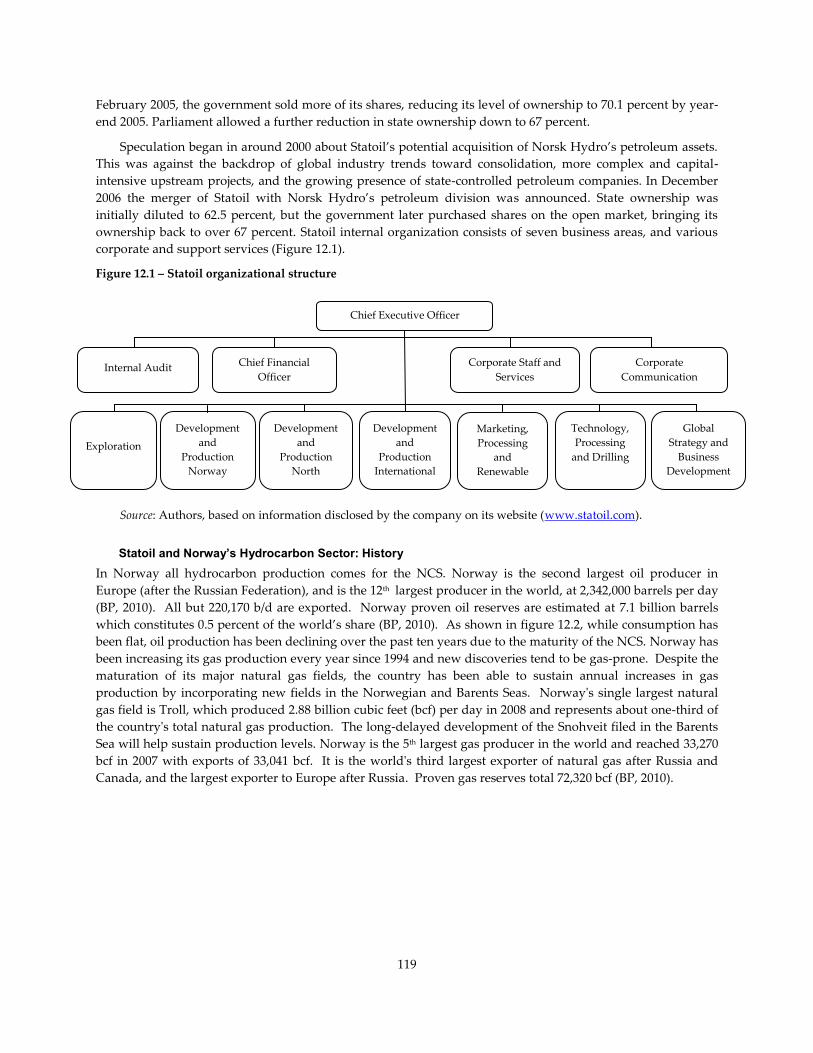
119
February 2005, the government sold more of its shares, reducing its level of ownership to 70.1 percent by year-
end 2005. Parliament allowed a further reduction in state ownership down to 67 percent.
Speculation began in around 2000 about Statoil’s potential acquisition of Norsk Hydro’s petroleum assets.
This was against the backdrop of global industry trends toward consolidation, more complex and capital-
intensive upstream projects, and the growing presence of state-controlled petroleum companies. In December
2006 the merger of Statoil with Norsk Hydro’s petroleum division was announced. State ownership was
initially diluted to 62.5 percent, but the government later purchased shares on the open market, bringing its
ownership back to over 67 percent. Statoil internal organization consists of seven business areas, and various
corporate and support services (Figure 12.1).
Figure 12.1 – Statoil organizational structure
Source: Authors, based on information disclosed by the company on its website (www.statoil.com).
Statoil and Norway’s Hydrocarbon Sector: History
In Norway all hydrocarbon production comes for the NCS. Norway is the second largest oil producer in
Europe (after the Russian Federation), and is the 12th largest producer in the world, at 2,342,000 barrels per day
(BP, 2010). All but 220,170 b/d are exported. Norway proven oil reserves are estimated at 7.1 billion barrels
which constitutes 0.5 percent of the world’s share (BP, 2010). As shown in figure 12.2, while consumption has
been flat, oil production has been declining over the past ten years due to the maturity of the NCS. Norway has
been increasing its gas production every year since 1994 and new discoveries tend to be gas-prone. Despite the
maturation of its major natural gas fields, the country has been able to sustain annual increases in gas
production by incorporating new fields in the Norwegian and Barents Seas. Norway's single largest natural
gas field is Troll, which produced 2.88 billion cubic feet (bcf) per day in 2008 and represents about one-third of
the country's total natural gas production. The long-delayed development of the Snohveit filed in the Barents
Sea will help sustain production levels. Norway is the 5th largest gas producer in the world and reached 33,270
bcf in 2007 with exports of 33,041 bcf. It is the world's third largest exporter of natural gas after Russia and
Canada, and the largest exporter to Europe after Russia. Proven gas reserves total 72,320 bcf (BP, 2010).
Chief Executive Officer
Internal Audit Chief Financial
Officer
Corporate Staff and
Services
Corporate
Communication
Development
and
Production
Norway
Development
and
Production
North
America
Development
and
Production
International
Marketing,
Processing
and
Renewable
Energy
Technology,
Processing
and Drilling
Exploration
Global
Strategy and
Business
Development

120
Figure 12.2 – Norway crude oil and natural gas production and consumption
Source: Authors and CEE, based on data from U.S. Energy Information Administration (EIA), International Statistics.
Natural gas and oil development have been hampered in the northern Barents Sea area due to the lack of a
defined maritime boundary between Norway and Russia. But in June 2009 Gazprom and Statoil signed a three-
year memorandum of understanding to work together to explore and develop their Arctic sea regions and the
Shtokman field—some 345 miles offshore—which holds estimated gas reserves of around 113 trillion cubic
feet.
With a limited domestic market, the development of gas and oil pipeline infrastructure was essential to
Norway in order for companies to monetize their investments and reach export markets. Now, an extensive
network of subsea oil pipelines link offshore platforms with onshore terminals.
The Ekofisk discovery in 1969 marked the real beginnings of the Norwegian petroleum sector. Soon after,
the state asserted its authority to ensure control over sector development. In 1971 the Storting (Norwegian
parliament) passed the so-called ‚ten commandments‛ of petroleum policy, which interalia called for: (i)
national direction and control of all operations on the NCS; (ii) active state coordination of Norwegian
interests; (iii) the development of domestic expertise in the sector; (iv) exploration and production (E&P) to
occur with due regard to existing livelihoods and the environment; and (v) the creation of the Norwegian State
Oil Company ‚Den norske stats oljeselkap a.s.,‛ later named ‚Statoil.‛
The first licenses were assigned to Statoil in May 1973. Recognizing the benefits of private investment in
the sector, the NOC was not granted a monopoly. The state held shares in another Norwegian oil company
Norsk Hydro, and the fully private Saga Petroleum and international oil companies were allowed to invest in
the sector. Nonetheless during its first decade of operations, Statoil benefited greatly from two key privileges:
(i) minimum participation of 50 percent, carried through the exploration phase, in all petroleum licenses,
implying a veto power on all development decisions; and (ii) once a discovery was declared commercial, the
option to increase the participation by up to 30 percent (to a total of 80 percent) based on a sliding scale linked
to production levels. In return for these privileges, Statoil was bound by the commercial duties of the
Companies Act and required to carry out the political and social aims of the government.
By the mid-1980s, there were worries about the influence of Statoil on the domestic economy and
(potentially) domestic politics. In 1984 the Storting (Report No.73, 1983–84) decreased its power, revoking most
of the privileges cited above. In particular, Statoil’s license interests were split into two parts, the bigger part of
which was transferred to the SDFI. Although Statoil still managed these assets, their revenues now went
directly to the public treasury and the special privileges were withdrawn from Statoil and henceforth applied
-
500
1,000
1,500
2,000
2,500
3,000
3,500
4,000 Norway Oil Production, Consumption
Oil Production ('000 b/d)
Oil Consumption ('000 b/d)
-
1,000
2,000
3,000
4,000
5,000
6,000 Norway Natural Gas Production, Consumption
Natural Gas Production (BCF)
Natural Gas Consumption (BCF)
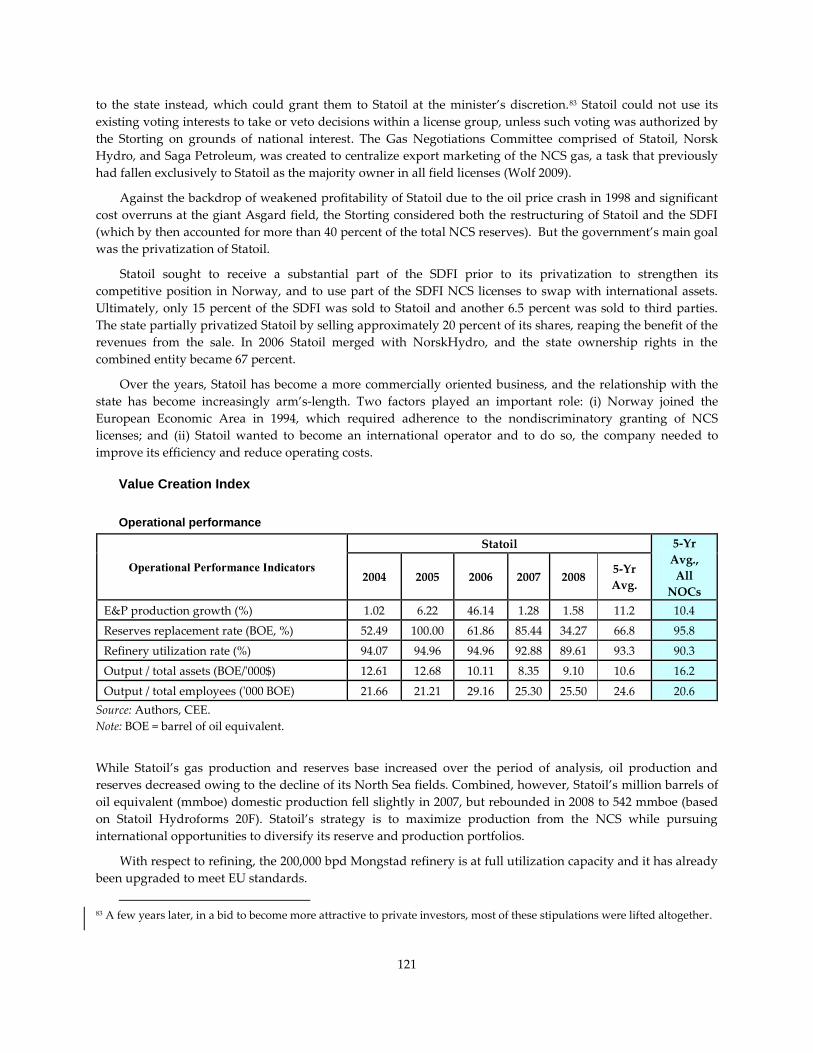
121
to the state instead, which could grant them to Statoil at the minister’s discretion.83 Statoil could not use its
existing voting interests to take or veto decisions within a license group, unless such voting was authorized by
the Storting on grounds of national interest. The Gas Negotiations Committee comprised of Statoil, Norsk
Hydro, and Saga Petroleum, was created to centralize export marketing of the NCS gas, a task that previously
had fallen exclusively to Statoil as the majority owner in all field licenses (Wolf 2009).
Against the backdrop of weakened profitability of Statoil due to the oil price crash in 1998 and significant
cost overruns at the giant Asgard field, the Storting considered both the restructuring of Statoil and the SDFI
(which by then accounted for more than 40 percent of the total NCS reserves). But the government’s main goal
was the privatization of Statoil.
Statoil sought to receive a substantial part of the SDFI prior to its privatization to strengthen its
competitive position in Norway, and to use part of the SDFI NCS licenses to swap with international assets.
Ultimately, only 15 percent of the SDFI was sold to Statoil and another 6.5 percent was sold to third parties.
The state partially privatized Statoil by selling approximately 20 percent of its shares, reaping the benefit of the
revenues from the sale. In 2006 Statoil merged with NorskHydro, and the state ownership rights in the
combined entity became 67 percent.
Over the years, Statoil has become a more commercially oriented business, and the relationship with the
state has become increasingly arm’s-length. Two factors played an important role: (i) Norway joined the
European Economic Area in 1994, which required adherence to the nondiscriminatory granting of NCS
licenses; and (ii) Statoil wanted to become an international operator and to do so, the company needed to
improve its efficiency and reduce operating costs.
Value Creation Index
Operational performance
Operational Performance Indicators
Statoil 5-Yr
Avg.,
All
NOCs 2004 2005 2006 2007 2008
5-Yr
Avg.
E&P production growth (%) 1.02 6.22 46.14 1.28 1.58 11.2 10.4
Reserves replacement rate (BOE, %) 52.49 100.00 61.86 85.44 34.27 66.8 95.8
Refinery utilization rate (%) 94.07 94.96 94.96 92.88 89.61 93.3 90.3
Output / total assets (BOE/'000$) 12.61 12.68 10.11 8.35 9.10 10.6 16.2
Output / total employees ('000 BOE) 21.66 21.21 29.16 25.30 25.50 24.6 20.6
Source: Authors, CEE.
Note: BOE = barrel of oil equivalent.
While Statoil’s gas production and reserves base increased over the period of analysis, oil production and
reserves decreased owing to the decline of its North Sea fields. Combined, however, Statoil’s million barrels of
oil equivalent (mmboe) domestic production fell slightly in 2007, but rebounded in 2008 to 542 mmboe (based
on Statoil Hydroforms 20F). Statoil’s strategy is to maximize production from the NCS while pursuing
international opportunities to diversify its reserve and production portfolios.
With respect to refining, the 200,000 bpd Mongstad refinery is at full utilization capacity and it has already
been upgraded to meet EU standards.
83 A few years later, in a bid to become more attractive to private investors, most of these stipulations were lifted altogether.
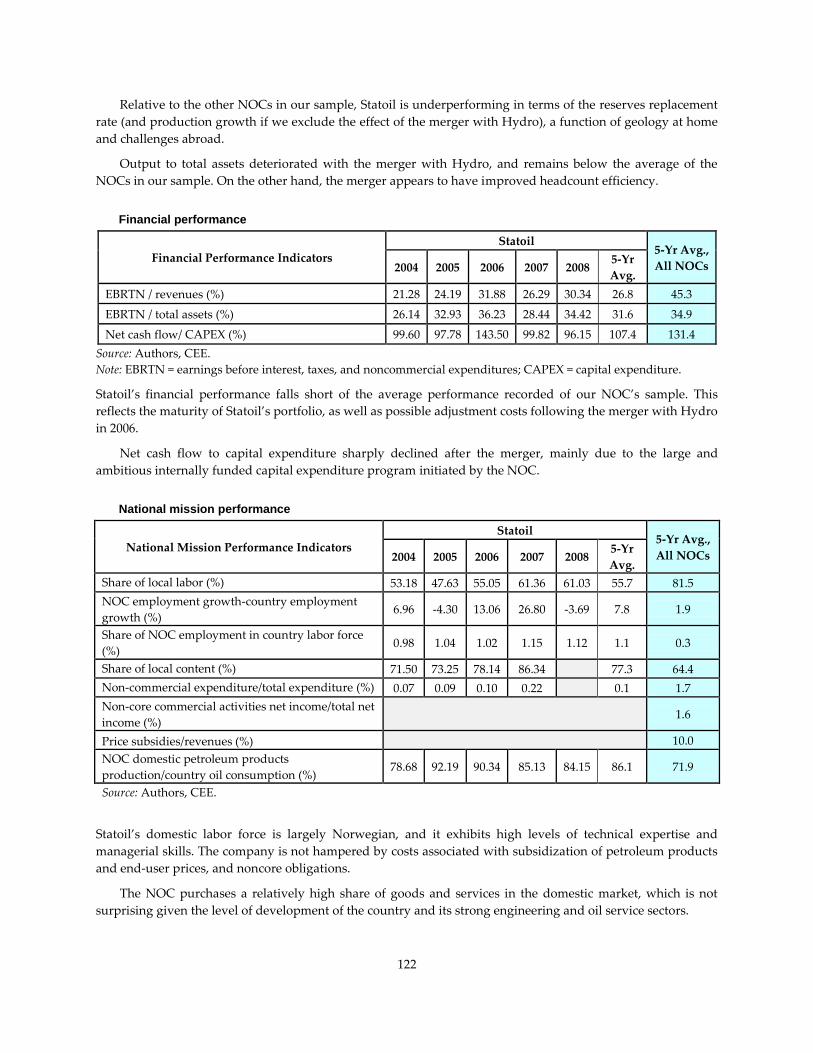
122
Relative to the other NOCs in our sample, Statoil is underperforming in terms of the reserves replacement
rate (and production growth if we exclude the effect of the merger with Hydro), a function of geology at home
and challenges abroad.
Output to total assets deteriorated with the merger with Hydro, and remains below the average of the
NOCs in our sample. On the other hand, the merger appears to have improved headcount efficiency.
Financial performance
Financial Performance Indicators
Statoil 5-Yr Avg.,
All NOCs 2004 2005 2006 2007 2008 5-Yr
Avg.
EBRTN / revenues (%) 21.28 24.19 31.88 26.29 30.34 26.8 45.3
EBRTN / total assets (%) 26.14 32.93 36.23 28.44 34.42 31.6 34.9
Net cash flow/ CAPEX (%) 99.60 97.78 143.50 99.82 96.15 107.4 131.4
Source: Authors, CEE.
Note: EBRTN = earnings before interest, taxes, and noncommercial expenditures; CAPEX = capital expenditure.
Statoil’s financial performance falls short of the average performance recorded of our NOC’s sample. This
reflects the maturity of Statoil’s portfolio, as well as possible adjustment costs following the merger with Hydro
in 2006.
Net cash flow to capital expenditure sharply declined after the merger, mainly due to the large and
ambitious internally funded capital expenditure program initiated by the NOC.
National mission performance
National Mission Performance Indicators
Statoil 5-Yr Avg.,
All NOCs 2004 2005 2006 2007 2008 5-Yr
Avg.
Share of local labor (%) 53.18 47.63 55.05 61.36 61.03 55.7 81.5
NOC employment growth-country employment
growth (%) 6.96 -4.30 13.06 26.80 -3.69 7.8 1.9
Share of NOC employment in country labor force
(%) 0.98 1.04 1.02 1.15 1.12 1.1 0.3
Share of local content (%) 71.50 73.25 78.14 86.34
77.3 64.4
Non-commercial expenditure/total expenditure (%) 0.07 0.09 0.10 0.22
0.1 1.7
Non-core commercial activities net income/total net
income (%) 1.6
Price subsidies/revenues (%)
10.0
NOC domestic petroleum products
production/country oil consumption (%) 78.68 92.19 90.34 85.13 84.15 86.1 71.9
Source: Authors, CEE.
Statoil’s domestic labor force is largely Norwegian, and it exhibits high levels of technical expertise and
managerial skills. The company is not hampered by costs associated with subsidization of petroleum products
and end-user prices, and noncore obligations.
The NOC purchases a relatively high share of goods and services in the domestic market, which is not
surprising given the level of development of the country and its strong engineering and oil service sectors.

123
Value Drivers
Geology
According to BP statistical review 2010, as of year-end 2008 Norway’s proven oil reserves stood at 7.5 billion
barrels, and its natural gas reserves were 78.2 trillion cubic feet. All production is located offshore, mainly in
the Norwegian share of the North Sea. 84
The parts of the NCS that the Storting has opened for petroleum activities are the greater part of the North
Sea, the Norwegian Sea, and the southern Barents Sea. The NPD’s estimate of undiscovered resources in the
areas on the continental shelf totals 3.4 billion standard cubic meters of recoverable oil equivalents. The
resources are divided more or less equally between the three regions: 35 percent in the North Sea, 35 percent in
the Norwegian Sea, and 30 percent in the Barents Sea. There are still large parts of the NCS that the Storting has
not opened up for petroleum activities, including all of the northern Barents Sea, Troms II, Nordland VII, parts
of Nordland VI, and the coastal regions off Nordland and Skagerrak.
Petroleum activities on the NCS started in the North Sea and have gradually moved northward as new
areas gradually open. Consequently, large portions of the North Sea are now considered to be mature from an
exploration perspective. There has also been considerable exploration of Haltenbanken in the Norwegian Sea,
and many parts of this region are also considered mature. The most recent area to be considered mature is the
area surrounding Snøhvit in the Barents Sea. There have been petroleum activities in parts of the mature area
of the continental shelf for nearly 40 years. This means that the geology in these areas is well documented, and
the infrastructure is for the most part highly developed. But the discovery rate is high, and major new
discoveries are less likely. Furthermore, the lifetime of the existing infrastructure is limited and it is thus
important to prove and recover the resources in these areas before the infrastructure is shut down.
The areas currently considered to be frontiers on the NCS include major portions of the Barents Sea and
the Norwegian Sea. In the Norwegian Sea, this applies particularly to deepwater regions and the northernmost
areas. The coastal areas in the southern part of the NCS are also relatively immature.
State context
Norway is not a member of Organization of the Petroleum Exporting Countries (OPEC) or the EU; however it
is a member of the International Energy Agency (2007–09), the World Trade Organization, and the Kyoto
Protocol. It benefits from political stability, a solid currency (kroner), and a good, albeit slow-growing
economy. It is ranked fifth in the world in terms of GDP per capita ($58,600) (CIA 2009). Because of the
relatively small size of the Norwegian economy, hydrocarbons dominate the budget and macroindicators,
accounting for 35 percent of state revenues and 25 percent of GDP.85 But Norway has adopted policies to avoid
macroeconomic distortions resulting from an oil-based economy, and is often cited as example of success in
dealing with the resource curse.
As discussed earlier in this case study, recent years have seen a rapid decline in oil production on the NCS.
Given the relevance of the petroleum sector to the country’s economy, the Norwegian government promptly
adopted policies to incentivize the rapid and efficient identification of new resources. New licensing and fiscal
terms have been introduced to ensure that the NCS is attractive for established and new players that can
contribute to efficient exploration. The new terms greatly improve the commercial viability of petroleum
operations in Norway to the mutual benefit of the state, NOC, and private oil companies.
84 See Norwegian Petroleum Directorate, http://www.npd.no/Global/Engelsk/3%20-
%20Publications/Facts/Facts2009/Chapters/Kap4.pdf.
85 Critics contend this is due to the more onerous fiscal terms in Norway.
124
Norway’s Governance Indicators during the period 2004-2008 were above the regional average. But control
of corruption and government effectivenss rankings have seen a slight deterioration. However, it is widely
recognized that the culture of transparency and accountability that permeates Norwegian society is the key
ingredient of the recipe for the sound and sustainable management of petroleum resources. Perhaps its strong
national identity also, more than economic considerations, explains much of the emphasis placed on the direct
involvement of the state in petroleum E&P, even beyond the initial phase of sector development when control
over industry activities, active local-content policies, and the acquisition of knowledge and skills were key
policy goals driving direct state participation.
Petroleum sector organization and governance
The ‚Norwegian model‛ of petroleum management features the separation of responsibilities among:
The Ministry of Petroleum and Energy (MPE).
The Norwegian Petroleum Directorate (NPD), the regulator, whose mission is to create the greatest
possible values for society from the oil and gas activities by means of prudent resource management based
on safety and emergency preparedness and safeguarding of the external environment.
Petoro AS, a wholly state-owned company established in 2001, which is responsible for the commercial
aspects related to the state’s direct involvement in petroleum activities on the NCS, and associated
business. Petoro acts on behalf of the state and at the expense and risk of the state.
Gassco, a wholly state-owned company established in 2001, which is responsible for transporting
Norwegian gas to continental Europe and the United Kingdom. Gassco also manages Gassled, the gas-
export network of international pipelines and terminals.86
Statoil, an integrated oil company in which the state is the majority shareholder.
The State Participation Unit, with the MPE’s Department for Economic and Administrative Affairs,
oversees the state’s ownership interests in petroleum activities, that is, StatoilHydro, the State Direct Financial
Interest (SDFI), Petoro, and the state’s insurance fund.
The SDFI was established in 1985 to allow the Norwegian state to participate in the Norwegian petroleum
sector directly as an investor. The SDFI has a direct financial interest in 137 production licenses and in 14 joint
ventures for pipelines and onshore facilities. The state pays a share of all investments and operating costs in
projects on the NCS corresponding to its direct financial interest in the SDFI portfolio. On the same terms as the
other owners, the government then receives a matching share of revenues from the sale of production and
other income sources. The Storting (parliament) votes the SDFI’s budget and framework on an annual basis.
Income, expenses, and investments in the SDFI are part of the central government budget. The net cash flow
resulting from the SDFI portfolio constitutes a predictable, long-term, and secure revenue to the Norwegian
state. The SDFI portfolio is managed by Petoro, while Statoil markets the state share of petroleum administered
by the SDFI on behalf of the state.
These institutional arrangements have allowed the NOC to focus on oil and gas E&P activities.
Furthermore, the privileges granted to the NOC from its establishment allowed the company to develop
knowledge and technical skills, and a portfolio of assets without bearing the exploration risk. Statoil’s
privileges were largely revoked by the Storting in 1984. However, by then the NOC had a dominant position in
the NCS, and a sufficiently large asset base to face competition.
The state largely refrained from imposing a heavy financial burden on its NOC. According to our estimates
Statoil’s average fiscal burden (royalties, production and income taxes and dividends) over the period 2004 to
86 The Gas Negotiations Committee, known as the GFU, designed to centralize export marketing of the NCS gas, was
abolished in January 2002. As a result all companies are now free to market their own gas. Statoil continues to provide the
majority of Norway’s gas exports.

125
2008 was 23 percent of total revenue compared to Ecopetrol (40 percent) and Kazmuaigaz (37 percent).
Statoil’s burden is low compared to NOCs such as Pemex and PDVSA that are called upon directly or
indirectly to fund the state budget deficit.
Company strategy and behavior
For at least a decade after its establishment, Statoil could count on the extensive privileges granted to it by the
state, which allowed it to build its expertise and asset base without taking the exploration and development
risk. Indeed the government’s aim was to create a strong NOC. A monopoly would have clearly been a more
costly and inefficient way of achieving such objective. Hence, private companies and the partially state-owned
Hydro were allowed to participate in the sector alongside Statoil.
The NOC strategy evolved over time adapting to changing geological, economic, and political conditions.
As both the NOC and the state walked along the sector learning curve on different tracks—the NOC as
technical and commercial operator and the state as policy maker and manager of the resource—their
relationship evolved and was not always easy. By the early 1980s Statoil had grown materially, was highly
profitable, and continued to enjoy full state backing. But increasingly there were worries about the unduly
large influence of Statoil on the domestic economy and (potentially) domestic politics. Most of its privileges
were revoked by the Storting, and the NOC was forced to reinvent its strategy.
A few years later Statoil’s profitability fell: the oil price crush and cost overruns at its Asgard field had
taken a toll on the NOC. The Storting acted again, and further institutional rationalization occurred. Statoil’s
political standing was not particularly strong, and the NOC was not successful in obtaining all of the SDFI’s
participating interests it had hoped for. But a new strategy started to emerge—the NOC looked at venturing
outside the comfort of its domestic market.
Statoil played an important role in contributing to the development of Norwegian industry and
technological capability. ‚With a strong engineering orientation and few consequences for failure as a fully
state-backed company, Statoil developed a culture valuing innovation over development of a lean,
commercially oriented organization. [. . .] [T]he focus on innovation contributed to significant technological
breakthroughs and helped spur the development of a high-value-added domestic industry in oil services‛
(Thurber and Istad 2010).
The central role of Statoil’s technology investments is visible in the growing complexity and engineering
sophistication of the projects undertaken by the NOC: from the Heidrun (1995) and Troll (1986) platforms, to
the subsea development of the giant deepwater Ormen Lange gas field, the Snovit development in the Barent
Sea, and the exploration in the Arctic Sea. The technology focus played and still plays an important role in
Statoil’s strategy domestically and internationally. The decision to look for international opportunities was
driven, among other things, by the growing maturity of the NCS. But to gain access to international acreage,
Statoil does not seem to be relying on its status as NOC. On the contrary, the NOC is targeting areas in which
its technology and ability to operate in deepwater and harsh environments provide a competitive edge.
The NOC is also pursuing the development of the oil sand value chain, as well as establishing the
foundation for future business opportunities by investing in ground-breaking technology within new energy
and environmental technology.87
Corporate governance
By international standards, Statoil has a strong corporate governance structure. The roles and responsibilities
of the shareholders, the board of directors, and Statoil’s management are clearly defined.
87 Statoil Annual Report 2009.
126
The State Participation Unit of the MPE exercises the ownership rights of the state.
A nomination committee, whose members are elected by the shareholders for a term of two years, is
independent of both the board and the company’s management. The duties of the nomination committee are to
present: (i) a recommendation to the annual general meeting regarding the election of shareholder-elected
members to the corporate assembly; (ii) a recommendation to the corporate assembly regarding the election of
shareholder-elected members to the board; and (iii) a proposal for the remuneration of members of the board
and the corporate assembly.
The board of directors is composed of 11 members, of which 8 are independent. There are no company
representatives on the board, other than three representatives of the employees. The board has overriding
responsibility for managing the group and supervising the group’s day-to-day management and its operations.
The board is supported by two committees: audit and compensation.
The NOC’s external auditor is independent in relation to the company’s management and is elected by the
annual general meeting. The board’s audit committee assesses and makes a recommendation concerning the
choice of external auditor, and it is responsible for ensuring that the external auditor meets the requirements
set by the authorities in Norway and in other countries in which Statoil is listed on the stock exchange.
The NOC as an internal corporate audit department, which is responsible for all internal auditing within
the Statoil group and also auditing of partnerships, contracts, counterparts, and other entities dependent on
contractual audit rights. The senior vice president of the corporate audit department responds to the board and
Statoil’s CEO and acts as the company’s corporate compliance officer.
Conclusions
The Norwegian government’s policy has successfully adapted to changes in the market outlook, trends in the
regulation of the petroleum sector, and the relative importance and shifting of relationships between the NOC
and private oil companies. These factors, coupled with good governance transparency, an already developed
industrial sector, and closeness to consuming markets in Europe, are crucial conditions for value creation.
Statoil is an example of a successful NOC. As for many other NOCs, it has benefited (and to a certain
extent continues to benefit) from the backing of the state and the privileges afforded to it. With the state’s
support, the NOC has been able to focus on its core business, to develop knowledge and expertise, and to
realize strategic investments in technologies.
The government decisions to open the petroleum sector to private investors, and eventually to revoke the
NOC’s state privileges, were far-sighted policy measures. By partnering with experienced international
operators the NOC was able to: (i) accelerate its learning curve, (ii) develop a portfolio of assets without having
to take the exploration risk, and (iii) benchmark its performance with private companies. When its privileges
were revoked, the NOC had to find its place in the market, but by then it had the size, strength, and knowledge
to do so.
127
References
BP 2010. British Petroleum Statistical Review 2010.
http://www.bp.com/productlanding.do?categoryId=6929&contentId=7044622.
CIA (U.S. Central Intelligence Agency). The World Factbook—Norway (Updated May 2010), Washington, DC.
http://www.cia.gov.
Fraser Institute. 2007 and 2008. Global Petroleum Surveys.
http://www.fraserinstitute.org/commerce.web/product_files.
Moody’s. 2009. Statoil ASA. Moody’s Global Credit Research.
http://www.statoil.com/no/InvestorCentre/BondsAndCreditRating/rating/Downloads/moody9oktober2009.pdf
Norwegian Ministry of Petroleum and Energy and the Norwegian Petroleum Directorate (NPD). 2005–09.
Facts. http://www.npd.no/en/Publications/Facts/.
Statoil. Various years. Annual reports and accounts Statoil ASA. http://www.statoil.com.
Statoil. Various years. Hydro Form 20Fs. http://www.statoil.com.
Thurber, M., and B. T. Istad. 2010. ‚Norway's Evolving Champion: Statoil and the Politics of State Enterprise.‛
Working Paper, Stanford University.
Wolf, C. 2009. ‚The Performance and Value Creation of National Oil Companies: An Analytical Framework.‛
Background paper for the study on NOCs and Value Creation, World Bank, Washington, DC.

The World Bank1818 H Street, N.W.Washington, D.C. 20433USA
www.worldbank.org/ogmc (or /oil or /gas or /mining)


