
ISSN 1393 – 6670
National Ecosystem and Ecosystem
Service Mapping Pilot for a Suite
of Prioritised Services
Irish Wildlife Manuals No. 95

National ecosystem and ecosystem service mapping pilot

National ecosystem and ecosystem service mapping pilot
National Ecosystem and Ecosystem Service Mapping Pilot for a
Suite of Prioritised Services
Neil Parker, Elsa-Kristin Naumann, Katie Medcalf, Roy Haines-
Young, Marion Potschin, Conor Kretsch, Jacqueline Parker and
Benjamin Burkhard
Citation:
Parker, N., Naumann, E-K., Medcalf, K., Haines-Young, R., Potschin, M., Kretsch, C., Parker, J. &
Burkhard, B. (2016) National ecosystem and ecosystem service mapping pilot for a suite of prioritised
services. Irish Wildlife Manuals, No. 95. National Parks and Wildlife Service, Department of Arts,
Heritage, Regional, Rural and Gaeltacht Affairs, Ireland.
Keywords: Ecosystem services; Mapping; Habitats
Cover photos: © Gemma Weir
The NPWS Project Officer for this report was: Gemma Weir; [email protected]
Irish Wildlife Manuals Series Editor: R. Jeffrey & F. Marnell
© National Parks and Wildlife Service 2016
ISSN 1393 - 6670

National ecosystem and ecosystem service mapping pilot
i
Contents
CONTENTS.................................................................................................................................................... I
EXECUTIVE SUMMARY ........................................................................................................................... V
ACKNOWLEDGEMENTS ........................................................................................................................ IX
1. INTRODUCTION ................................................................................................................................. 1
1.1 EU POLICY CONTEXT........................................................................................................................ 1
1.2 PROJECT AIMS .................................................................................................................................. 3
1.2.1 Overview of Project outputs. ...................................................................................................... 3
2. APPROACH........................................................................................................................................... 6
2.1 TALKING ABOUT ECOSYSTEM SERVICES: TERMINOLOGY ................................................................... 6
2.1.1 Conceptual Framework – the Role of the Cascade Model ............................................................. 6
2.1.2 Classifying and Measuring Ecosystem Services: CICES ............................................................11
2.1.4 A note on trade-offs and costs associated with ecosystem services ..............................................18
2.2 ECOSYSTEM SERVICE MAPPING TOOLS: SENCE ..............................................................................19
2.3 STAKEHOLDER CONSULTATION .......................................................................................................21
2.3.1 Consultation with the Project Steering Group ...........................................................................21
2.3.2 Stakeholder Workshop 1 ............................................................................................................21
2.3.2 Stakeholder Workshop 2 ............................................................................................................23
3. APPLYING ECOSYSTEM SERVICE CONCEPTS IN IRELAND ..................................................25
3.1 OVERVIEW .......................................................................................................................................25
3.2 OUTCOMES OF THE WORK UNDERTAKEN WITH STAKEHOLDERS .....................................................26
3.2.1 Prioritising of Ecosystem Services – Steering Group Meeting and Workshop 1 ..........................26
3.2.2 Generating support and gathering feedback - Workshop 2..........................................................27
3.3 ANALYSING POLICY NEEDS .............................................................................................................28
3.4 DEVELOPING CICES IN THE IRISH CONTEXT ...................................................................................30
3.4.1 Background ..............................................................................................................................30
3.4.2 Linking Ecosystem Services to Key Policy Concerns ..................................................................32
4. THE THEORY OF MAPPING ECOSYSTEM SERVICES .................................................................34
4.1 OVERVIEW .......................................................................................................................................34
4.2 DEVELOPING ECOSYSTEM SERVICE INDICATORS ..............................................................................35

National ecosystem and ecosystem service mapping pilot
ii
4.3 AN ECOSYSTEM SERVICES INFORMATION DATABASE ...................................................................... 37
5. MAPPING ECOSYSTEM SERVICES IN IRELAND USING SENCE ........................................... 39
5.1 OVERVIEW ....................................................................................................................................... 39
5.2 DATA COLLATION AND SUITABILITY AUDIT.................................................................................... 40
5.3 HABITAT ASSET REGISTER ............................................................................................................... 42
5.3.1 Preparation of the Habitat Asset Register (for terrestrial habitats) ............................................. 46
5.4 PRIMARY INTERMEDIATE LAYERS .................................................................................................... 49
5.4.1 Land Parcel Information System (LPIS) Data ........................................................................... 50
5.4.2 Forest Inventory and Planning Systems (FIPS) data ................................................................. 56
5.4.3 EU Habitats Directive – Habitat (Article 17) Data – Mosaic habitats ....................................... 58
5.4.4 Turlough data .......................................................................................................................... 60
5.4.5 Species Coincidence Layer ........................................................................................................ 62
5.4.6 Habitat Networks ..................................................................................................................... 65
5.4.7 Designated Sites Layer ............................................................................................................. 72
5.4.8 Bathymetry .............................................................................................................................. 75
5.4.9 Slope ........................................................................................................................................ 77
5.5 RULE-BASE DEVELOPMENT ............................................................................................................. 79
5.5.1 Steering Group Consultation on Rule-Bases ............................................................................. 81
5.6 CREATION OF ECOSYSTEM SERVICE MAPS ......................................................................................... 82
6. MAPPING OUTPUTS ......................................................................................................................... 83
6.1 LAND TEMPORARILY STORING WATER............................................................................................ 86
6.1.1 Summary ................................................................................................................................. 86
6.1.2 How the input data relates to these results ................................................................................ 88
6.1.3 How the map relates to other maps produced ............................................................................. 89
6.1.4 Data and knowledge gaps associated with this map ................................................................... 89
6.2 WATER QUALITY (OF FRESHWATER)................................................................................................ 90
6.2.1 Summary ................................................................................................................................. 90
6.2.2 How the input data relates to these results ................................................................................ 92
6.2.3 How the map relates to other maps produced ............................................................................. 93
6.2.4 Data and knowledge gaps associated with this map ................................................................... 93
6.3 SOIL CARBON .................................................................................................................................. 94
6.3.1 Summary ................................................................................................................................. 94
6.3.2 How the input data relates to these results ................................................................................ 96
6.3.3 How the map relates to other maps produced ............................................................................. 97
6.3.4 Data and knowledge gaps associated with this map ................................................................... 97

National ecosystem and ecosystem service mapping pilot
iii
6.4 VEGETATION CARBON .....................................................................................................................99
6.4.1 Summary .................................................................................................................................99
6.4.2 How the input data relates to these results .............................................................................. 101
6.4.3 How the map relates to other maps produced ........................................................................... 102
6.4.4 Data and knowledge gaps associated with this map ................................................................. 102
6.5 TERRESTRIAL FOOD ....................................................................................................................... 103
6.5.1 Summary ............................................................................................................................... 103
6.5.2 How the input data relates to these results .............................................................................. 105
6.5.3 How the map relates to other maps produced ........................................................................... 105
6.5.4 Data and knowledge gaps associated with this map ................................................................. 106
6.6 TERRESTRIAL BIODIVERSITY ........................................................................................................... 107
6.6.1 Summary ............................................................................................................................... 107
6.6.2 How the input data relates to these results .............................................................................. 109
6.6.3 How the map relates to other maps produced ........................................................................... 110
6.6.4 Data and knowledge gaps associated with this map ................................................................. 110
6.7 MARINE AREAS THAT PROVIDE FOOD ........................................................................................... 111
6.7.1 Summary ............................................................................................................................... 111
6.7.2 How the input data relates to these results .............................................................................. 113
6.7.3 How the map relates to other maps produced ........................................................................... 114
6.7.4 Data and knowledge gaps associated with this map ................................................................. 114
6.8 MARINE CARBON .......................................................................................................................... 115
6.8.1 Summary ............................................................................................................................... 115
6.8.2 How the input data relates to these results .............................................................................. 117
6.8.3 How the map relates to other maps produced ........................................................................... 118
6.8.4 Data and knowledge gaps associated with this map ................................................................. 118
6.9 MARINE BIODIVERSITY .................................................................................................................. 119
6.9.1 Summary ............................................................................................................................... 119
6.9.2 How the input data relates to these results .............................................................................. 122
6.9.3 How the map relates to other maps produced ........................................................................... 123
6.9.4 Data and knowledge gaps associated with this map ................................................................. 123
7. LIMITATIONS AND NEXT STEPS ................................................................................................ 124
7.1 MAPPING LIMITATIONS .................................................................................................................. 124
7.1.1 Projects addressing current mapping limitations ..................................................................... 127
7.2 CULTURAL ECOSYSTEM SERVICES .................................................................................................. 129
7.3 FURTHER ES FRAMEWORK METHODOLOGY DEVELOPMENT .......................................................... 129

National ecosystem and ecosystem service mapping pilot
iv
7.3.1 CICES .................................................................................................................................... 129
7.3.2 Developing Policy or Sector Relevant Reporting Categories .................................................... 130
7.3.3 Ecosystem Service Indicators .................................................................................................. 130
7.3.4 Opportunities mapping .......................................................................................................... 132
8. REFERENCES AND BIBLIOGRAPHY ........................................................................................... 133
APPENDICES ............................................................................................................................................ 150
National ecosystem and ecosystem service mapping pilot
v
Executive Summary
Although the importance of ecosystem services has been widely acknowledged as a way of
communicating the contribution that biodiversity makes to human well-being, there are considerable
practical challenges in applying the idea for policy and management purposes.
This project has drawn on existing tools, approaches and data to demonstrate the kind of mapping
that assists in the assessment of the state and trends of ecosystem services in Ireland. It was
commissioned by the National Parks and Wildlife Service (NPWS), and is a step towards establishing
a framework for a National Ecosystem Assessment for Ireland within the context of the EU’s
Biodiversity Strategy to 2020. Like all EU Member States, Ireland is requested under Action 5 of the
strategy and the subsequent MAES (Mapping and Assessment of Ecosystems and their Services)
Process to implement the action by mapping and assessing the state of ecosystems and the services
they supply in their national territory. Information generated under the MAES Process will be used to
value ecosystems and their services in the entire EU and promote the recognition of their economic
worth into national and EU-level accounting and reporting systems.
This report describes how the project team worked with local stakeholders to identify which
ecosystem services should be prioritised as part of the pilot, to identify what needs to be mapped and
what can be mapped, taking into consideration existing national spatial data sources and developing
indicators for national ecosystem service mapping. It sought to identify indicators that are
appropriate for quantifying ecosystem service supply and demand, and document how they relate to
different habitats and their associated characteristics. A series of maps have been produced and
recommendations are made for taking forward the approaches demonstrated.
The ecosystem service “cascade” provides the conceptual framework for this project, and the basis for
classifying ecosystem services using the Common International Classification of Ecosystem Services
(CICES). CICES has been used widely for supporting mapping and assessment projects; its
standardised nomenclature enables regional comparisons to be made and it has been adopted as a
framework for MAES.
The mapping tool chosen for this project was SENCE (Spatial Evidence for Natural Capital
Evaluation), selected primarily for its ability to be manipulated to accept a wide range of data sources
at different scales and its ability to deliver outputs for a variety of ecosystem services. It is a GIS
system, which allows for stakeholder weighting to be applied and, therefore, local knowledge to be
included.
In developing an ecosystem services framework for Ireland, it was essential to incorporate the
contributions of a range of stakeholders, including organisations likely to be involved in

National ecosystem and ecosystem service mapping pilot
vi
implementing projects to restore ecosystems in Ireland, people with existing knowledge of
environmental and societal issues and policy in Ireland, and technical experts and other stakeholders
with knowledge of relevant data and projects. There were three main opportunities for stakeholder
input; two stakeholder workshops and a review of modelling data and rules during mapping.
A workshop resulted in the identification of prioritised ecosystem services for Ireland which became
the focus of the mapping work, namely the regulation of water quality and climate regulation through
carbon storage. Biodiversity was identified as a factor of fundamental importance in underpinning
ecosystem functioning and it was incorporated into the mapping to take account of its contribution in
supporting the provision of ecosystem services.
Using the outputs of the stakeholder consultation workshops as a starting point, the project team
examined the relevance of ecosystem services to stakeholder concerns within Ireland, and to policy
areas that are the focus of current concern. This enabled the team to identify which of the many
ecosystem services should be prioritised for consideration by the project, and which, given currently
available data, could be analysed and mapped. An assessment was made of national and regional
policy priorities and related work programmes. This helped identify principal areas of economic
activity, including sectors and markets utilising living natural resources, which could be linked to the
benefits from, or status and trends in, ecosystem services. In many areas, this review revealed a
number of important cross-cutting issues. To bring together the many different policy driver and
ecosystem themes, a table was created to define areas of interest which can be taken forward into the
development of CICES sub-classes for Ireland.
Selected ecosystem services were then modelled using the SENCE tool to create maps of:
Land temporarily storing water
Areas of land promoting good water quality
Vegetation carbon
Soil carbon
Terrestrial food
Terrestrial biodiversity: Habitats, management, ecological networks, and species
Marine areas that provide food
Marine carbon
Marine biodiversity: Habitats and management
Over 300 spatial datasets were made available to the project, with many being identified and
commented upon as part of the first stakeholder workshop. In the majority of cases, no single dataset
was readily available, appropriate to use, simple to map and fully representative of an individual

National ecosystem and ecosystem service mapping pilot
vii
ecosystem service. Mapping and assessment work relied on the use of ‘indicators’ or ‘surrogate’
measures that can be used to quantify provision in a more indirect way. Information has been
brought together using a geoinformatics approach that considers the available data both spatially and
quantitatively by use of a scientific ‘rule-base’ system based on scientific literature and local
knowledge. This enabled bespoke maps to be developed which illustrate the spatial variation in
service provision. Limitations and gaps in the datasets have been identified and discussed in this
report.
A key feature of data collation was to create a seamless and comprehensive habitat dataset, known as
a Habitat Asset Register, as an indicator of the underpinning living systems that support ecosystem
services. It is suitable for re-use by the NPWS and with very few licence restrictions. In addition, an
Ecosystem Services Information Database (designed to incorporate datasets throughout Ireland, i.e. an
All-Ireland Matrix of datasets) was produced to facilitate further ecosystem service mapping. It helps
users identify their data needs for mapping a particular service and can identify which service can be
mapped given the data available. It also facilitates effective communication of the findings for Ireland
by linking the name of the CICES service to corresponding names under the other ecosystem service
classifications.
By looking at indicators in the context of the SENCE tool, the work has demonstrated how these
indicators can be cross-referenced to the different elements of the ‘ecosystem service cascade’ so that
users can see how service outputs can be quantified using different direct and proxy measures. This
approach is particularly important because it enables the role of ‘biodiversity’ in service outputs to be
more clearly demonstrated and potentially monitored.
In order to ensure that the description and naming of ecosystem services relates to Ireland, this project
has developed and extended the CICES framework. The results principally list what has been
identified as the specific ecosystem service benefits that are relevant in the Irish context, given our
understanding of stakeholder concerns and policy needs. These ecosystem service benefits are listed
as sub-classes within the CICES structure. The list represents those services at sub-class level that
were prioritised through our work with stakeholders and through our analysis of policy needs. In
naming these sub-classes an attempt has been made to use terminology that is appropriate to current
concerns in Ireland. In addition the mapping that has been suggested would assist in the assessment
of the state and trends of these services and which key habitats or features might be used as the basis
for quantitative indicators.
The steps that can be taken in the future to further advance the incorporation of ecosystem services
into policy and decision making in Ireland have been identified and recommendations have been
made on further development of methods.

National ecosystem and ecosystem service mapping pilot
viii
Main Recommendations:
While the overall structure of CICES seems appropriate, it is recommended that the ecosystem
services classification for Ireland be developed further with regards to sub-classes, a process started
for prioritised services during this pilot. It is useful in an operational context to break down the class
level (the most detailed within the current CICES structure) to more specific sub-classes nested into
the overall structure. These sub-classes are at the level of ecosystem goods and services that can
actually be measured ‘on the ground’ and which have particular policy or management relevance.
This would provide users with the kind of flexibility they would need to develop geographically
specific applications, and the experience in Ireland is valuable in showing how this can be done. For
higher level policy work more aggregated indicators would be useful (at the CICES Group and
Division levels); this might be especially useful in the context of the MAES Process and any associated
reporting commitments. A further aspect of this work would be to look at user-needs more generally
and explore how, in an Irish context, policy or sector relevant reporting categories can be constructed
using CICES classes, groups and divisions.
This work was used to identify potential ecosystem service classes, which are a subset of the CICES
classification, and metrics that could be used to assess the status and trends of selected ecosystem
service benefits. Further dialogue with stakeholders would allow the appropriateness of these
indicators to be reviewed, and others added where gaps are felt to exist.
In addition, it would now be valuable to identify the next set of indicators that can be quantified and
mapped given current data resources, and where data gaps exist, to develop monitoring and
measurement strategies that can be put in place to overcome these. For example, in order to develop
cultural ecosystem services, it would be useful for any future study to review the range of material
available and develop understanding of the important factors that drive the need to map and assess
these at different scales, as well as developing strategies for overcoming data and knowledge gaps.
To verify the usefulness of the indicators and potential ecosystem services classes at a local level, it
would be good to carry out a local pilot in a data-rich region and seek conversation with local
stakeholders.
The existing maps could be developed further in the future, as they can be seen as the first step
towards an economic evaluation. Furthermore, opportunity mapping, showing where ecosystem
services could be enhanced, could be carried out.
The species data collated for this project could be used to carry out more detailed analysis into
functional groupings; relationships between species groups and ecosystem service provision could be
investigated.

National ecosystem and ecosystem service mapping pilot
ix
Acknowledgements
The project was co-ordinated for NPWS by Gemma Weir, who provided technical and scientific
advice and co-ordinated scientific/technical input of staff at NPWS.
The project steering group comprised Dr Deirdre Lynn (NPWS), Paul Duffy (NPWS), Dr Tasman
Crowe (UCD), Stuart Green (Teagasc), Kevin Lydon and Tadhg O’Mahony (EPA).
NPWS staff and contractors contributed data and advice to the project. Other organisations which
kindly provided data and input include:
Bat Conservation Ireland (BCI), Birdwatch Ireland, Bord Na Móna, Botanical Society of Britain &
Ireland (BSBI), Central Statistics Office (CSO), Coastal and Marine Research Centre (CMRC),
Department of Agriculture, Food and the Marine, Department of Communications, Energy & Natural
Resources - Petroleum Affairs Division, Department of Environment, Community and Local
Government, Environmental Protection Agency (EPA), European Environment Agency (EEA),
European Marine Observation Data Network (EMODnet), Forest Service, Geological Survey of Ireland
(GSI), Intermap UK, International Council for the Exploration of the Sea (ICES), International
Maritime Organisation, Local Authorities of Ireland, Marine Institute, Moths Ireland, National
Biodiversity Data Centre (NBDC), National Botanic Gardens, North East Atlantic Fisheries
Commission (NEAFC), Office of Public Works (OPW), Ordnance Survey of Ireland (OSi), OSPAR
Commission, Sustainable Energy Authority of Ireland (SEAI), Teagasc, University College Dublin
(UCD), Trinity College Dublin (TCD).

National ecosystem and ecosystem service mapping pilot
1
1. Introduction
1.1 EU Policy Context
Like all EU Member States, Ireland is requested by the EU Biodiversity Strategy to 2020 Target 2
Action 5 to map and assess in its national territory the state of ecosystems and the services they supply
(European Commission, 20111). This information will be used to value ecosystems and their services in
the entire EU and to promote the recognition of their economic worth into national and EU-level
accounting and reporting systems by 2020. Suitable methods, information and data are necessary to
fulfil the requirements of Action 5 and to understand the supply and use of ecosystem services and
how they are dependent on biodiversity. The overall aim of the Biodiversity Strategy’s Target 22 is to
maintain and restore ecosystems. The strategy recognises that society depends on various ecosystem
services (e.g. food, energy, raw materials, air, water) which are provided by healthy ecosystems.
Mapping and assessment of ecosystems and their services delivers information, methods and data
needed for a more sustainable management of our environment and for ecosystem restoration where
it is needed.
To support the EU Member States with the tasks related to the implementation of Action 5, the EU-
wide working group MAES3 (Mapping and Assessment of Ecosystems and their Services) has been
established. The group meets twice a year to discuss latest developments in the Member States and the
European Commission and to jointly develop guidance on mapping and assessment of ecosystems
and their services. At present there are three supporting documents that have been prepared by the
MAES working group which include:
1st report providing the analytical framework;
2nd report on indicators for ecosystem assessments;
3rd report focusing on the conditions of ecosystems
These reports can be downloaded from the MAES website. Additional support is provided to the EU
Member States by the EU Horizon 2020 project ESMERALDA 4 (Enhancing ecosystem services
mapping for policy and decision making). The application of findings from related studies and
1 http://ec.europa.eu/environment/nature/biodiversity/strategy/index_en.htm
2 http://ec.europa.eu/environment/nature/biodiversity/strategy/target2/index_en.htm
3 http://biodiversity.europa.eu/maes
4 Enhancing ecosystem services mapping for policy and decision making: http://esmeralda-project.eu/ 4 Enhancing ecosystem services mapping for policy and decision making: http://esmeralda-project.eu/

National ecosystem and ecosystem service mapping pilot
2
projects begins to set the tone for implementing Action 5. However, for national and local level
implementation of Action 5, more detailed studies and understanding are needed.
In order to support policy and decision making, Action 5 promotes the creation of national and EU-
wide knowledge bases that can be used as primary data sources for developing green infrastructure,
for the designation of ecosystems suitable for restoration (15% restoration of degraded ecosystems is
included in Target 2) and to promote strategies for ensuring “no net loss of biodiversity and
ecosystem services”.
Through documents and efforts such as the Millennium Ecosystem Assessment (MA)5, MAES and
Ireland’s National Biodiversity Plan6, the need to plan and manage for ecosystem services are gaining
more attention by policy makers, planners and decision makers. Ecosystem services are generally split
into three categories7:
provisioning ecosystem services (goods directly gained from nature, such as food or timber);
regulation and maintenance ecosystem services (e.g. the regulation of our climate, clean air
and water); and,
cultural ecosystem services (e.g. locations that support benefits such as recreation or sense of
place).
All of these categories of ecosystem services rely on healthy levels of biodiversity and ecosystem
conditions, the underlying determinants of all ecosystem services. The ecosystem service “cascade”
(Potschin and Haines-Young, 2011, 2016) provides the conceptual framework for this project, and the
basis for classifying ecosystem services using the Common International Classification of Ecosystem
Services (CICES). CICES has been used widely for mapping and assessment purposes (Crossman et
al., 2013). Its standardised nomenclature enables regional comparisons to be made (e.g. Busch et al.,
2012), and has been adopted as a framework for MAES.
Due to the underpinning importance of biodiversity for ecosystem service provision, the resilience of
ecosystem services is an additional consideration under the ecosystem approach. Resilience measures
how healthy the ecosystems are and how likely they are to remain healthy when faced with
environmental changes. Considering the resilience of a system is particularly important, as detectable
changes in service provision can lag behind the changes in the environment that are ultimately
causing them. The functioning biodiversity of Ireland’s marine and terrestrial system are intrinsically
5 http://www.millenniumassessment.org/
6 http://www.npws.ie/legislation/national-biodiversity-plan
7 Following CICES: http://cices.eu/

National ecosystem and ecosystem service mapping pilot
3
linked to the resilience of ecosystems and this project will provide a starting point to map and describe
these functions.
1.2 Project Aims
This project aims to pilot national mapping and assessing of ecosystem services for Ireland, in order to
identify the kind of mapping that assists in the assessment of the state and trends for a suite of
prioritised ecosystem services in Ireland. It seeks to identify which indicators are appropriate for
quantifying ecosystem service supply, and for documenting how they relate to different habitats and
their associated characteristics. The study provides an evaluation of methods and data sources
currently available for mapping and assessing ecosystem services in Ireland and also identifies data
and knowledge gaps, which can guide future research. The aims of the project are therefore:
Working with stakeholders to identify the most important ecosystem services in Ireland, and
understanding which habitats or ecosystems support the delivery of these services;
Developing indicators for selected ecosystem services, using existing and available data;
Collating and preparing data, modelling and mapping the selected ecosystem services across
Ireland;
Presenting outputs and recommendations at stakeholder workshops, as well as preparation of this
final report outlining methods and identifying key gaps in knowledge and data.
This project seeks to exploit existing data and local expert knowledge, as gained through stakeholder
input into the project. Moreover, this project is an initial step towards establishing a National
Ecosystem Assessment (NEA) for Ireland, to which the identified methods, data and stakeholders
would eventually contribute.
1.2.1 Overview of Project outputs.
The project report should be read in conjunction with the suite of project outputs. Indicator
documents describing the indicators developed for mapping the selected ecosystem services are
included in the appendices to the main report.
Rules-base provided in MS excel format contains the qualitative weightings assigned per class
per indicator.
Mapping outputs are presented as images in the report. These are also available for viewing
and download in GIS format via the NPWS website. INSPIRE compliant metadata for the
mapped outputs are included in the project NPWS Data Resource catalog in Adobe PDF
format.

National ecosystem and ecosystem service mapping pilot
4
A standalone MS Access Ecosystem Services Spatial Framework Database provides
information on available Irish national datasets to facilitate further ecosystem service
mapping with reference to the CICES classification.
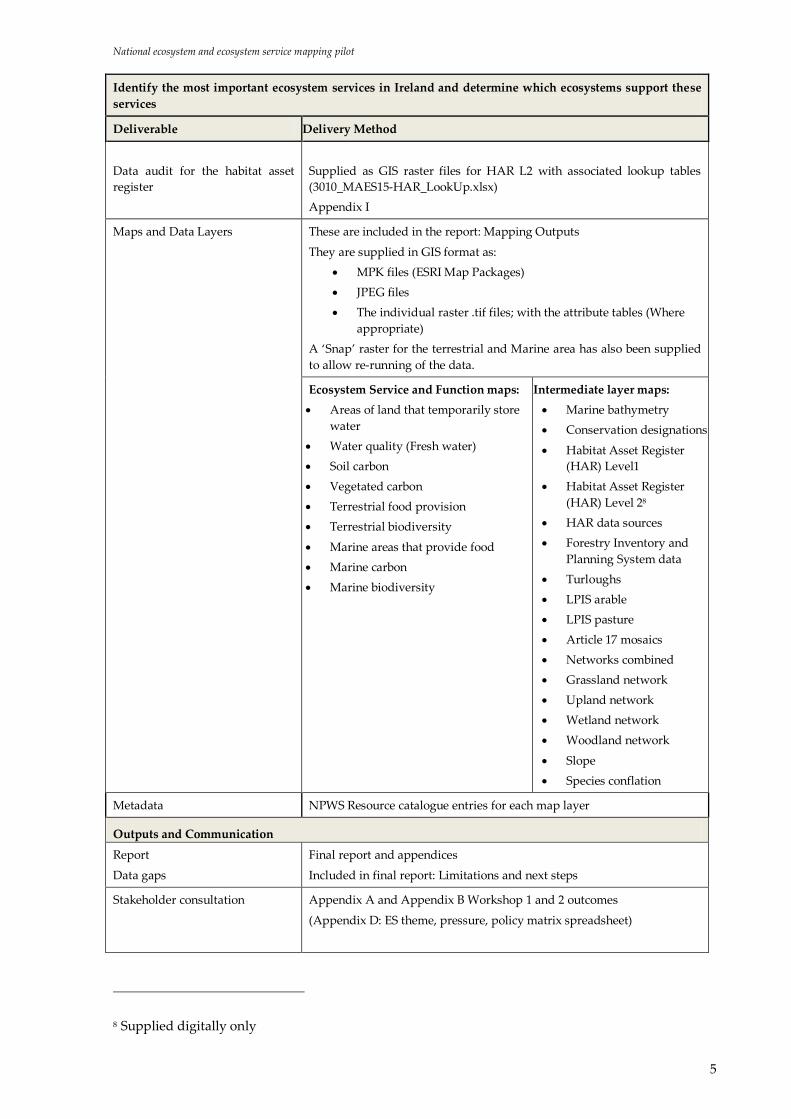
A full list of the project deliverables are shown in Table 1.
Table 1: Project deliverables
Identify the most important ecosystem services in Ireland and determine which ecosystems support these
services
Deliverable Delivery Method
High level national matrix of ES
for Ireland
Included in the report – Appendix F
Full excel spreadsheet supplied
Project overview diagram Included in report - (Figure 1)
Develop indicators for selected ecosystem services
List of information required to
map and assess the prioritised ES.
Included in the report: - Data Collation and Suitability Analysis
Data gaps
Reference list
Included in the report: Mapping outputs and Limitations and Next Steps
Included in the report : References and bibliography
Database Microsoft Access data base included as a stand-alone deliverable
The data base includes reference tables:
CICES for Ireland_fordb.xlsx Lists CICES sub-classes developed during
this project, including information on how
they fit into the over-arching CICES
framework and which maps they are
included in.
Data_Information.xlsm Lists datasets used during this project,
including data owners, licencing conditions,
and links to the data or contact information
for the data owner.
Data_to_Map_Services.xlsm Lists datasets used during this project and
identifies if they are not needed, essential, or
beneficial to mapping the ecosystem
services that were prioritised for this project.
Scale.xlsm Lists datasets used during this project and
identifies if they are suitable for mapping at
local/catchment/regional/national/EU scale.
Crosswalk.xlsm Identifies how CICES classes fit into two
other ecosystem service frameworks, MA
and TEEB
Theme_order.xlsx Identifies the order that themes appear in
the reports produced by Option 2
Collate and prepare data, model and map selected ecosystem services nationally
Rule-bases
Stand-alone Excel spreadsheet
Habitat asset register Included in the report – Habitat Asset Register
National ecosystem and ecosystem service mapping pilot
5
Identify the most important ecosystem services in Ireland and determine which ecosystems support these
services
Deliverable Delivery Method
Data audit for the habitat asset
register
Supplied as GIS raster files for HAR L2 with associated lookup tables
(3010_MAES15-HAR_LookUp.xlsx)
Appendix I
Maps and Data Layers
These are included in the report: Mapping Outputs
They are supplied in GIS format as:
MPK files (ESRI Map Packages)
JPEG files
The individual raster .tif files; with the attribute tables (Where
appropriate)
A ‘Snap’ raster for the terrestrial and Marine area has also been supplied
to allow re-running of the data.
Ecosystem Service and Function maps:
Areas of land that temporarily store
water
Water quality (Fresh water)
Soil carbon
Vegetated carbon
Terrestrial food provision
Terrestrial biodiversity
Marine areas that provide food
Marine carbon
Marine biodiversity
Intermediate layer maps:
Marine bathymetry
Conservation designations
Habitat Asset Register
(HAR) Level1
Habitat Asset Register
(HAR) Level 28
HAR data sources
Forestry Inventory and
Planning System data
Turloughs
LPIS arable
LPIS pasture
Article 17 mosaics
Networks combined
Grassland network
Upland network
Wetland network
Woodland network
Slope
Species conflation
Metadata NPWS Resource catalogue entries for each map layer
Outputs and Communication
Report
Data gaps
Final report and appendices
Included in final report: Limitations and next steps
Stakeholder consultation
Appendix A and Appendix B Workshop 1 and 2 outcomes
(Appendix D: ES theme, pressure, policy matrix spreadsheet)
8 Supplied digitally only
National ecosystem and ecosystem service mapping pilot
6
2. Approach
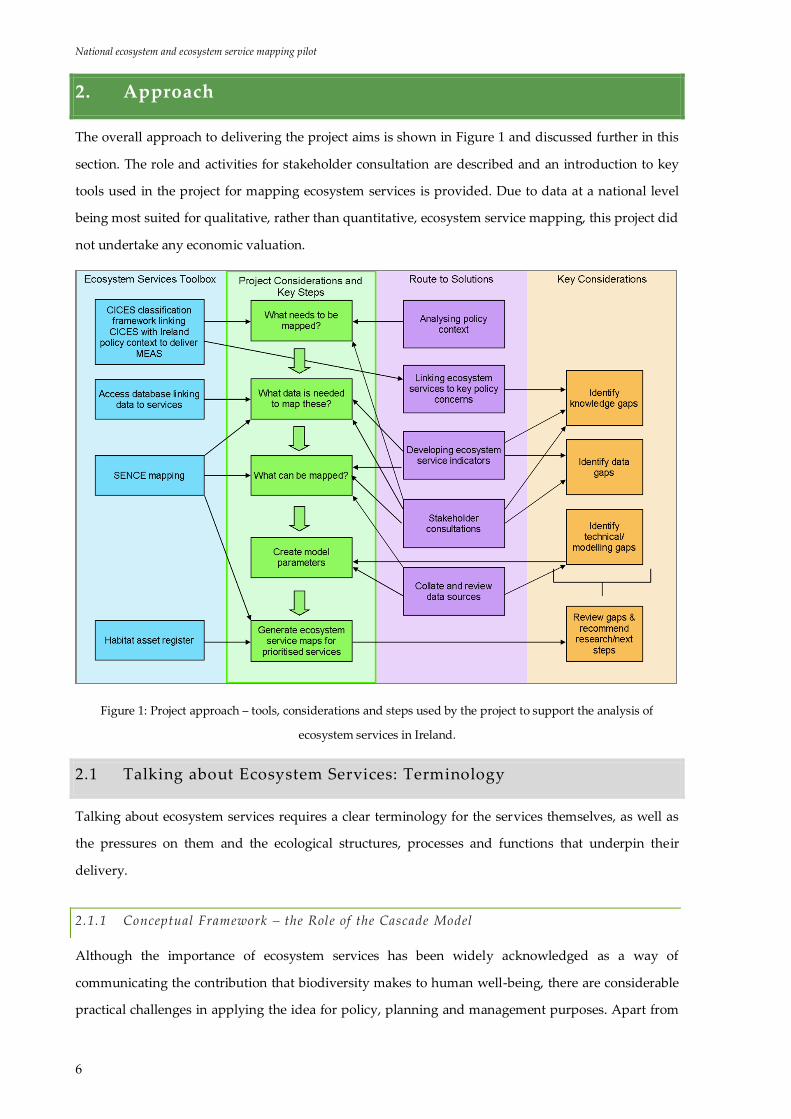
The overall approach to delivering the project aims is shown in Figure 1 and discussed further in this
section. The role and activities for stakeholder consultation are described and an introduction to key
tools used in the project for mapping ecosystem services is provided. Due to data at a national level
being most suited for qualitative, rather than quantitative, ecosystem service mapping, this project did
not undertake any economic valuation.
Figure 1: Project approach – tools, considerations and steps used by the project to support the analysis of
ecosystem services in Ireland.
2.1 Talking about Ecosystem Services: Terminology
Talking about ecosystem services requires a clear terminology for the services themselves, as well as
the pressures on them and the ecological structures, processes and functions that underpin their
delivery.
2.1.1 Conceptual Framework – the Role of the Cascade Model
Although the importance of ecosystem services has been widely acknowledged as a way of
communicating the contribution that biodiversity makes to human well-being, there are considerable
practical challenges in applying the idea for policy, planning and management purposes. Apart from

National ecosystem and ecosystem service mapping pilot
7
the availability of relevant data, the complexity of ecosystems themselves often makes the
characterisation and assessment of ecosystem services a difficult undertaking. Moreover, since the
factors that determine the demand and supply of services vary spatially, the mapping and valuation
of those services is often intricate because it depends on understanding the way in which nature and
society are linked causally. The MAES Process was therefore set-up to help the policy community
overcome challenges detailed in the EU Biodiversity Strategy to 2020.
Figure 2 illustrates the ecosystem services ‘cascade model’ (Potschin and Haines-Young 2011, 2016)
which sets out the way ecosystem services connect ecological structures and processes to the benefits
and values realised by society, and hence the way human well-being depends on the underpinning
characteristics of living systems or biodiversity.
Figure 2: The cascade model (Potschin and Haines-Young, 2011, 2016).
A particular issue that the cascade model has sought to clarify is the way ecosystem services, benefits
and values depend on the characteristics and behaviours of ecosystems. In the Millennium Ecosystem
Assessment (MA, 2005), the ecological underpinning was captured in the notion of ‘supporting
services’ which included elements like nutrient cycling and primary productivity. Other
commentators (e.g. Saarikoski et al., 2015) have recognised that the links between these supporting
services and the ecosystem outputs that ultimately benefit people may involve a number of steps and
have therefore suggested that ‘intermediate services’ can also be identified (Boyd and Banzhaf, 2007).
The cascade model that is used in the MAES Process seeks to clarify these types of relationships for
National ecosystem and ecosystem service mapping pilot
8
practical purposes, by distinguishing only the ‘final’ outputs of ecosystems that benefit people as
‘services’. The notion of an ‘ecological function’ is then used to identify those particular characteristics
associated with a species or habitat on which that final service depends. These different conceptual
elements are important in helping to quantify and map services and the benefits associated with them.
Figure 2 illustrates the way the cascade model can be used to describe how a habitat like woodland
can contribute to human well-being by providing the service of ‘flood protection’. In this case, the key
ecological function is the capacity of the woodland to slow the passage of water through the
woodland stand. Different types and ages of woodland will vary in the degree to which they can do
this. Therefore, it is useful to distinguish this attribute from the other characteristics of woodlands and
the ecological processes associated with them, because it helps us pick out what things might be
measured in order to find out how the service is being delivered at a particular time and place. These
functional characteristics may also be important for identifying what kinds of management
intervention might be important.
The example used in the cascade model shown in Figure 2 also distinguishes the service of flood
protection from the benefit that it generates and hence the value associated with it. It is here that the
MAES framework differs from that of the MA, in that the latter regards services as benefits, whereas
for MAES they are simply contributions to them. The reason why it is useful to distinguish services
from benefits is that the implication of slowing the passage of water, and hence flood protection, will
vary according to context. Clearly if it protects people and contributes to their security then this
benefit would have quite a different value, than if it prevented the beneficial recharge of wetlands
downstream. Services, in other words, can give rise to different types of benefit and the values
associated with them can be different in different situations.
In the cascade and MAES framework, goods and benefits are things that can be valued, and if an
overall understating of the importance of a service to a society is to be gained these are the factors that
can be used to generate a kind of ‘balance sheet’. And, as the cascade diagram (Figure 2) suggests, it is
society’s view of the changes in benefits and values that shape strategies to conserve or sustain the
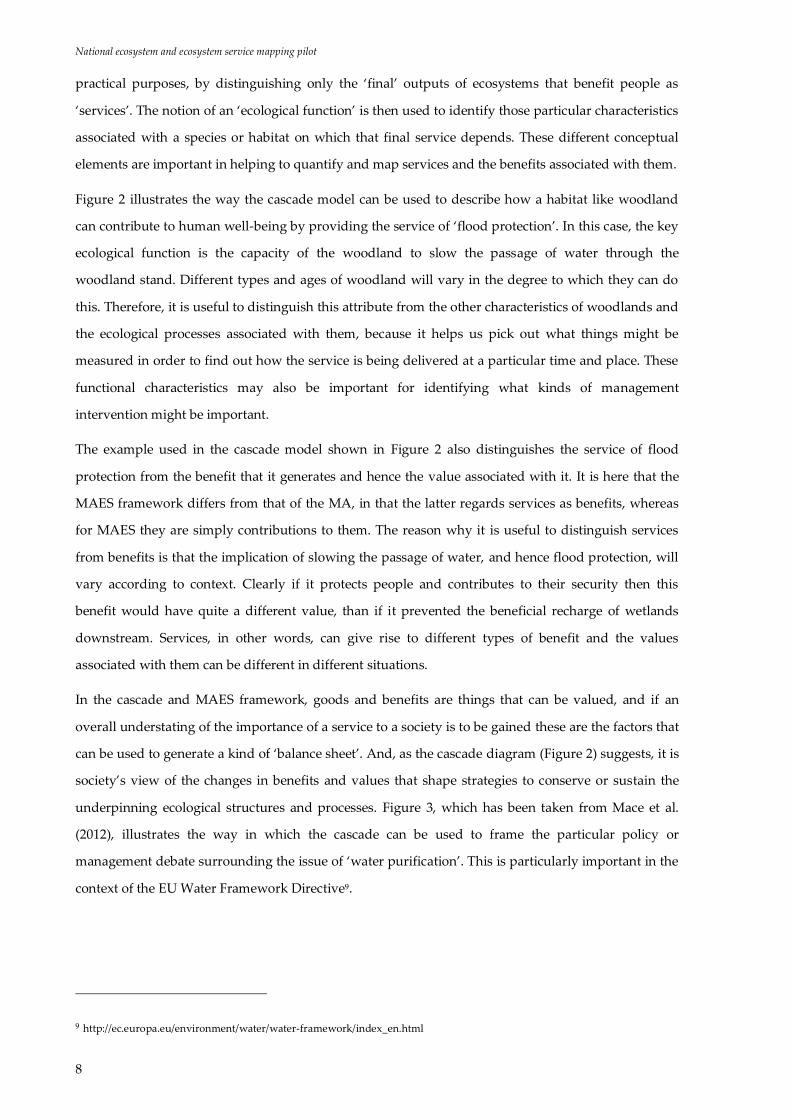
underpinning ecological structures and processes. Figure 3, which has been taken from Mace et al.
(2012), illustrates the way in which the cascade can be used to frame the particular policy or
management debate surrounding the issue of ‘water purification’. This is particularly important in the
context of the EU Water Framework Directive9.
9 http://ec.europa.eu/environment/water/water-framework/index_en.html

National ecosystem and ecosystem service mapping pilot
9
Figure 3: Application of the ecosystem services cascade framework to water purification (after Maes et al., 2012).
Although the cascade model has been found to be helpful in understanding the way nature and
society are linked, it obviously greatly simplifies the way real socio-ecological systems work. For
example, most habitats can generate a range of different services, and in this sense be viewed as
‘multi-functional’. Moreover, within the suite or ‘bundle’ of ecosystem services associated with a
particular ecosystem or habitat, some services can be positively associated with each other (in the
sense that the factors that might cause one to increase will also enhance the other, thereby creating
ecosystem services ‘synergies’), while others might show more divergent types of association. This last
situation is often described as involving ecosystem services ‘trade-offs’, in that the manager has to
make choices about what types of intervention are needed according to the importance or preference
that society has for the particular services on offer. Figure 4 illustrates how the cascade can begin to be
used to describe some of the ‘multi-functional’, and hence ‘multi-benefit’, relationships that can arise
in any particular situation.

National ecosystem and ecosystem service mapping pilot
10
Figure 4: Ecosystem services and multiple benefits.
The cascade model can also be used to clarify the place of ‘biodiversity’ in the context of the ecosystem
service debate. As Mace et al. (2012) point out, the concept can be multi-layered in the sense that
biodiversity can have a role at various points throughout the cascade, namely, as a factor
underpinning ecosystem processes; as a final ecosystem service; and finally as a good that can be
valued through different valuation approaches. Thus, the variety or diversity of a grassland sward
might be important in terms of the production of biomass, and thus underpin services that depend on
forage production. In contrast, a harvestable entity such as an apple can be viewed as a final
ecosystem service in that it can give rise to a number of goods and benefits such as food products or
cultural heritage. Finally wild species, such as eagles or whales, can be treated as ecosystem goods
that have value in their own right. In summary, therefore, the cascade model can help us clarify and
communicate the different ways in which the conservation and management of biodiversity can be
important for society.

National ecosystem and ecosystem service mapping pilot
11
2.1.2 Classifying and Measuring Ecosystem Services: CICES
One way in which the cascade model can be used to help measure and map ecosystem services is by
providing a framework for naming and classifying them. A number of different typologies for
ecosystem services have been used, including that of the MA (2005), that of The Economics of Ecosystems
and Biodiversity (TEEB 2010)10, and in the UK that of its own National Ecosystem Assessment (NEA-UK
2014)11. Because these typologies differ in a number of ways, and have often been quite selective in the
services they identified, the Common International Classification of Ecosystem Services (CICES)12 has been
proposed as a way of more comprehensively listing services and defining them in a more consistent
and transparent way.
CICES was initially put forward as part of the work on the System of Environmental and Economic
Accounting (SEEA) that was led by the United Nations Statistical Division (Haines-Young and
Potschin, 2013). Although initially proposed as a way of supporting the development of ecosystem
accounts, subsequent work as has shown that it is also useful in the context of mapping and valuing
ecosystem services. In Europe this wider role has been championed by the European Environment
Agency (EEA), and most recently CICES has been proposed as the classification framework to be used
in MAES13.
The version of CICES that is now widely used was published in 2013, and is known as ‘version 4.3’
(Table 2). At the highest or most general level are the three familiar categories used in the MA:
‘provisioning’, ‘regulating and maintenance’, and ‘cultural’. Below these major ‘Sections’ in the
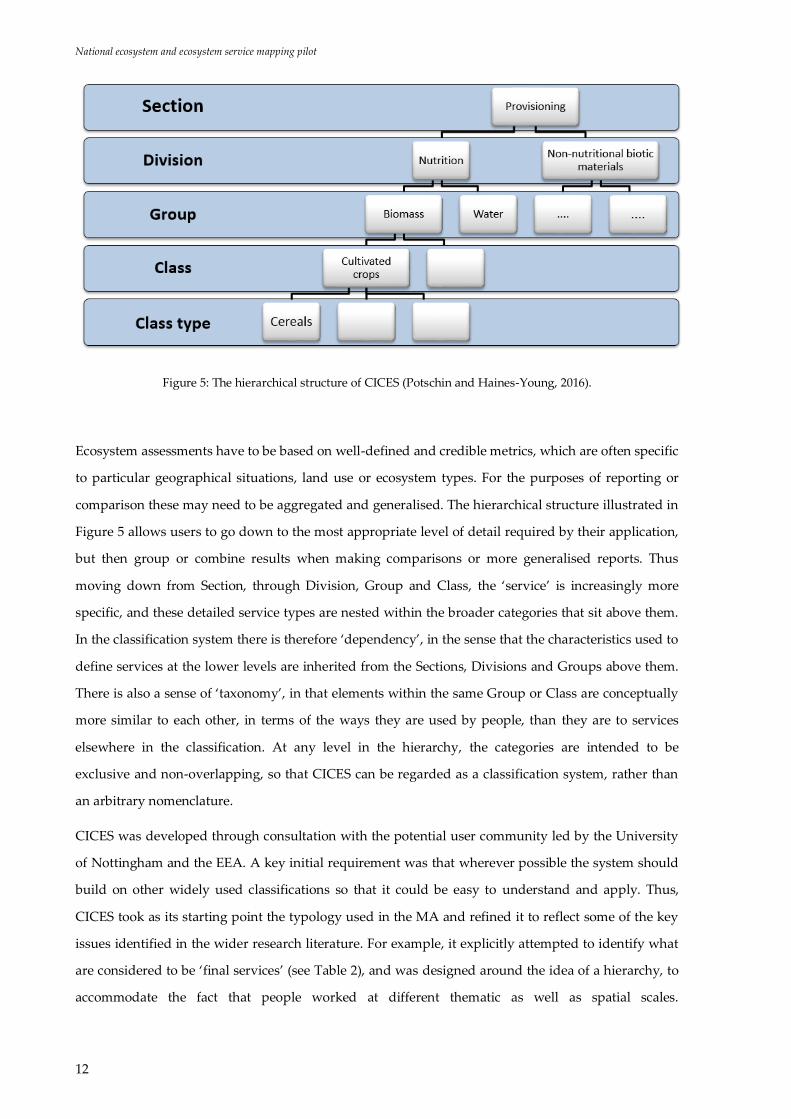
classification are a series of ‘Divisions’, ‘Groups’ and ‘Classes’. Figure 5 shows the way in which the
hierarchical structure works for Provisioning Services.
10 http://www.teebweb.org/
11 http://uknea.unep-wcmc.org/
12 ww.cices.eu
13 see 2nd MAES report: http://catalogue.biodiversity.europa.eu/uploads/document/file/1230/2ndMAESWorkingPaper.pdf
National ecosystem and ecosystem service mapping pilot
12
Figure 5: The hierarchical structure of CICES (Potschin and Haines-Young, 2016).
Ecosystem assessments have to be based on well-defined and credible metrics, which are often specific
to particular geographical situations, land use or ecosystem types. For the purposes of reporting or
comparison these may need to be aggregated and generalised. The hierarchical structure illustrated in
Figure 5 allows users to go down to the most appropriate level of detail required by their application,
but then group or combine results when making comparisons or more generalised reports. Thus
moving down from Section, through Division, Group and Class, the ‘service’ is increasingly more
specific, and these detailed service types are nested within the broader categories that sit above them.
In the classification system there is therefore ‘dependency’, in the sense that the characteristics used to
define services at the lower levels are inherited from the Sections, Divisions and Groups above them.
There is also a sense of ‘taxonomy’, in that elements within the same Group or Class are conceptually
more similar to each other, in terms of the ways they are used by people, than they are to services
elsewhere in the classification. At any level in the hierarchy, the categories are intended to be
exclusive and non-overlapping, so that CICES can be regarded as a classification system, rather than
an arbitrary nomenclature.
CICES was developed through consultation with the potential user community led by the University
of Nottingham and the EEA. A key initial requirement was that wherever possible the system should
build on other widely used classifications so that it could be easy to understand and apply. Thus,
CICES took as its starting point the typology used in the MA and refined it to reflect some of the key
issues identified in the wider research literature. For example, it explicitly attempted to identify what
are considered to be ‘final services’ (see Table 2), and was designed around the idea of a hierarchy, to
accommodate the fact that people worked at different thematic as well as spatial scales.

National ecosystem and ecosystem service mapping pilot
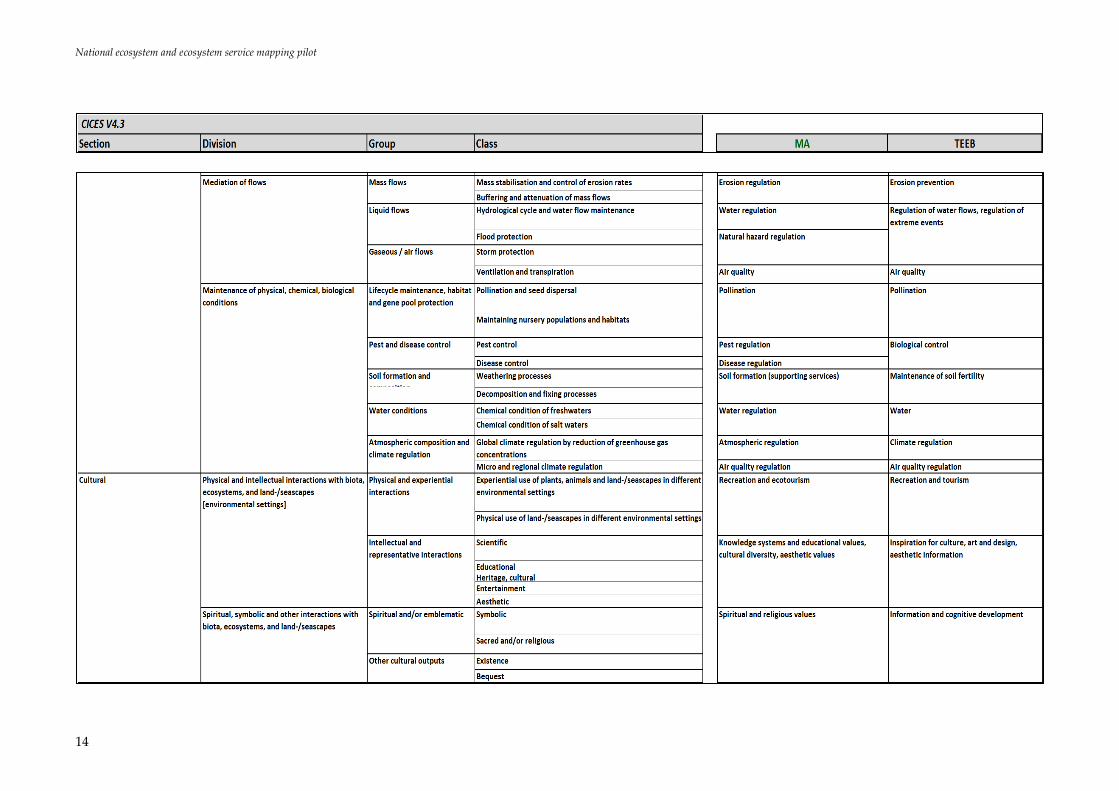
13
Table 2: CICES V4.3 and the equivalence with the MA and TEEB typologies (Haines-Young and Potschin, 2013; Potschin and Haines-Young, 2016).
National ecosystem and ecosystem service mapping pilot
14

National ecosystem and ecosystem service mapping pilot
15
Although CICES seeks to be comprehensive, in drawing up the design it was recognised that ability to
customise it so that it can be applied in different situations was important. This customisation can be
achieved in two ways. Firstly, by nesting specific sub-class types that are specific to the application
below the class level. Thus in Ireland, the Irish sub-class named ‘Red, green, yellow, brown algae’
would lie within the more general class named ‘Fibres and other materials from plants, algae and
animals for direct use or processing’. The way in which this approach was used in Ireland is explained
in more detail in Section 3.4.2 Linking Ecosystem Services to Key Policy Concerns of this report.
The second way that customisation of CICES can be achieved is by grouping the classes into locally
meaningful reporting categories that may also have a name that has resonance for the people working
on that application. Thus, the surface and ground water provisioning services might simply be
grouped as ‘water supply’; the important point here is that the specific metrics used to assess ‘water
supply’ are retained so that the transparency of the evidence-base can be assured.
Table 2 sets out the basic structure of CICES and also shows the equivalences with the typologies of
the MA and TEEB. In many cases, there is a fairly simple read-across at the group level, but there are
categories included in CICES, such as bioenergy, that are not explicitly covered by the others. Table 2
also emphasises the point that while the CICES categories can be used directly in a given study, it can
also serve as a way of translating between the different systems in use; indeed, a simple prototype
translation tool has been developed as part of the on-going EU-funded OpenNESS project14.
The ‘translation’ role of CICES is important analytically because it can help people make consistent
comparisons between different studies, even though they may have used different nomenclatures.
This is especially important when comparing the status and trends of a service in different areas, or
where comparison of value needs to be made between different places. CICES is also valuable
analytically because it provides a framework within which people can link the indicators they have
used to characterise particular services, as well as the datasets that have been used to measure them.
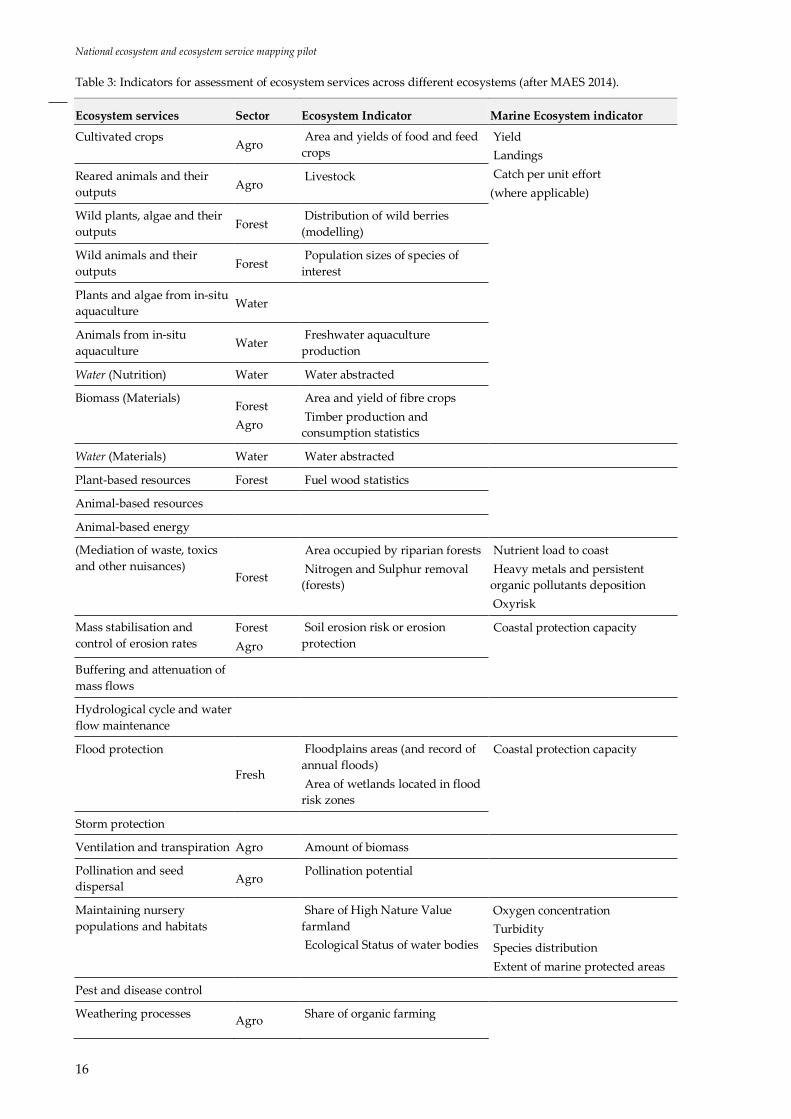
For example, the MAES process has already begun to suggest indicators that can be used to
characterise services in different thematic sectors, such as agriculture and forestry (Table 3).
14 http://openness.hugin.com/example/cices
National ecosystem and ecosystem service mapping pilot
16
Table 3: Indicators for assessment of ecosystem services across different ecosystems (after MAES 2014).
Ecosystem services Sector Ecosystem Indicator Marine Ecosystem indicator
Cultivated crops Agro
Area and yields of food and feed
crops
Yield
Landings
Catch per unit effort
(where applicable)
Reared animals and their
outputs Agro
Livestock
Wild plants, algae and their
outputs Forest
Distribution of wild berries
(modelling)
Wild animals and their
outputs Forest
Population sizes of species of
interest
Plants and algae from in-situ
aquaculture Water
Animals from in-situ
aquaculture Water
Freshwater aquaculture
production
Water (Nutrition) Water Water abstracted
Biomass (Materials) Forest
Agro
Area and yield of fibre crops
Timber production and
consumption statistics
Water (Materials) Water Water abstracted
Plant-based resources Forest Fuel wood statistics
Animal-based resources
Animal-based energy
(Mediation of waste, toxics
and other nuisances) Forest
Area occupied by riparian forests
Nitrogen and Sulphur removal
(forests)
Nutrient load to coast
Heavy metals and persistent
organic pollutants deposition
Oxyrisk
Mass stabilisation and
control of erosion rates
Forest
Agro
Soil erosion risk or erosion
protection
Coastal protection capacity
Buffering and attenuation of
mass flows
Hydrological cycle and water
flow maintenance
Flood protection
Fresh
Floodplains areas (and record of
annual floods)
Area of wetlands located in flood
risk zones
Coastal protection capacity
Storm protection
Ventilation and transpiration Agro Amount of biomass
Pollination and seed
dispersal Agro
Pollination potential
Maintaining nursery
populations and habitats
Share of High Nature Value
farmland
Ecological Status of water bodies
Oxygen concentration
Turbidity
Species distribution
Extent of marine protected areas
Pest and disease control
Weathering processes Agro
Share of organic farming

National ecosystem and ecosystem service mapping pilot
17
Ecosystem services Sector Ecosystem Indicator Marine Ecosystem indicator
Soil organic matter content
pH of topsoil
Cation exchange capacity
Decomposition and fixing
processes Agro
Area of nitrogen fixing crops
Chemical condition of
freshwaters Water
Chemical status
Chemical condition of salt
waters Marine
Nutrient load to coast
HM and POP loading
Oxyrisk
Global climate regulation by
reduction of greenhouse gas
concentrations Forest
Carbon storage and sequestration
by forests
Carbon stock
Carbon sequestration
pH;
Blue carbon
Primary production
Micro and regional climate
regulation Forest
Forest area
Physical and experiential
interactions
Forest
Agro Water
Marine
Visitor statistics
Intellectual and
representative interactions
Spiritual and/or emblematic
Other cultural outputs Extent of protected areas
* For further details and explanations of terminology used in the MAES indicators please refer to the second MAES report
(MAES et al. 2014)
A final way in which CICES and the cascade model can support the analysis of ecosystem services lies
in the fact that although the aim is to measure ecosystem services directly, in some situations it may
not be possible or appropriate to do so. For example, while a direct measurement of the reduction in
the incidence of pests or disease clearly represents suitable measures of the level of pest or disease
control provided by ecosystems, such measurements of changes in yield with and without the natural
control agents might be difficult or costly to make. Instead, proxy or surrogate measures for other
elements of the cascade can be used. Thus, in the case of these two examples, data on the distribution
of semi-natural habitats and their proximity to the crops potentially receiving the service are often
used. Thus, the cascade shows how an understanding of the ecological structures and processes (e.g.
semi-natural habitats supporting populations of pest and disease control agents) and ecological
functions (e.g. spatial patterning of habitats, or the structure of an ecological network in relation to the
dispersal characteristics of the control agents) can be used as alternative ways of characterising the
capacity of ecosystems to supply a given service.
In other situations, it may not be appropriate to characterise the service directly, because the focus of
attention may be on the benefits or values that are associated with it. For example, it may be easier to

National ecosystem and ecosystem service mapping pilot
18
count the number of trips and the costs people incur in making them as a way of characterising the
recreational benefits that ecosystems provide rather than measuring the particular characteristics of
different environmental settings (i.e. habitats/species) that affect people’s experience in relation to this
cultural ecosystem service.
In summary, therefore, the cascade model and the MAES framework provide a way of characterising
the entire production chain linking the biophysical elements of nature to the benefits and values that
they support, rather than just narrowly focussing on the services which are the interface between the
two (cf. Pagella and Sinclair, 2014). As a result, a richer understanding of real-world problems can be
built up, and using systems such as CICES a robust evidence base can be established. This is
particularly important in the context of mapping ecosystem services, where an understanding of the
key factors that influence patterns in the underlying ecological structures, processes and functions is
required. This is a fundamental element of the SENCE approach proposed for this study (see Sections
2.2 Ecosystem Service Mapping Tools: SENCE and 5. Mapping Ecosystem Services in Ireland using
SENCE.)
2.1.4 A note on trade-offs and costs associated with ecosystem services
Whilst the focus of this project is on the contributions of biodiversity and ecosystems to human well-
being in Ireland, it is important to recognise that some interactions with the natural environment can
have negative consequences for certain people or for society at large. These issues often arise as trade-
offs, where the benefits of accessing or sustaining ecosystem services must be weighed against
potential undesirable consequences. Such trade-offs can sometimes occur at a broad societal level. In
some cases, trade-offs might be of concern to particular individuals, groups or communities. For
example, many ecosystems and natural landscape features provide unique settings for recreation and
sports tourism which create local employment and support regional economies, but at the same time
the intensive use of lands for a few tourism activities may result in local nuisances such as noise or
littering, or exclude other recreational users (the restorative benefits of experiencing nature may be
hard to come by on a crowded tourist beach). From another perspective, whilst the strict conservation
of bog ecosystems can have widespread benefits for Irish society, in terms of conserving vital genetic
resources, preserving important cultural landscapes, reducing flood risks and protecting water
supplies, it may limit the use of peatlands for local activities such as turf-cutting and forestry.
In some situations, natural ecosystem processes or specific elements of biodiversity may pose risks to
well-being. A classic example of this from tropical regions is malaria, a disease caused by a wild
parasite and spread by mosquitoes which naturally breed in wetland and forest habitats. In Ireland, a
familiar example is hay fever, which some people suffer when they are exposed to pollen released into
the atmosphere by some crops and wild plants. In cases where a negative impact on well-being can be

National ecosystem and ecosystem service mapping pilot
19
related to specific ecosystem processes or functions, the term ‘ecosystem disservice’ is often used.
However, this term is somewhat controversial as some so-called ecosystem disservices result more
directly from the actions or choices of human communities, rather than from any ecosystem process.
For example, trees in an urban landscape might provide a nuisance if their roots damage concrete or if
they block the views from some residential properties, and this has been referred to as an ecosystem
disservice (e.g. Lyytimäki 2014); however, such problems are arguably the result of a decision to plant
certain trees in certain places or to manage the urban landscape in a particular fashion, and not really
an impact of biodiversity or the direct result of ecosystem functioning. Confusingly, the term has also
been used to refer to an impact upon the environment (i.e. a disservice to ecosystems) from a human
activity, such as the impact which agricultural activities can have on wildlife or water quality
(Swinton et al. 2007).
Regardless of the form that they take, the issue of trade-offs poses challenges for the sustainable use
and conservation of biodiversity and ecosystem services, and may be linked to complex issues of
ethics, fairness and social justice. Whilst this publication does not deal with such issues specifically,
they have been considered in the review of policy priorities and assessment of economic and social
needs associated with Ireland’s ecosystems.
2.2 Ecosystem Service Mapping Tools: SENCE
There are a variety of tools available to map and assess ecosystem services (see reviews by Crossman
et al., 2013; Martínez-Harms & Balvanera, 2012; Egoh et al., 2012). They have been developed as part
of research projects by academic, government and non-governmental organisations or commercial
businesses and, therefore, vary in their setup and application. Some are built as standalone pieces of
software and others are toolkits designed to be used within existing commercially available and/or
open source GIS (Geographic Information Systems). These mapping and assessment tools seek to
depict ecosystem services by demonstrating the distribution of natural and anthropogenic processes.
By capturing information about ecosystem services in this way, it is possible to use evidence of the
provision of ecosystem services to benefit decision making processes, such as policy development.
Typically, a greater level of detail (both spatially and in terms of what the data inputs show) is needed
to generate the information content required to support regional, or even local, decision making. At a
national scale, a more generic set of information can be used to indicate ecosystem supply, and not all
datasets cover such a wide spatial scale. Thus a local project might utilise a detailed map of soil types
(e.g. 1:25,000 scale) that is available for a particular area (but maybe not for the rest of the country),
whereas a national project is more likely to make use of a spatially consistent national soil map at a

National ecosystem and ecosystem service mapping pilot
20
more generalised scale (e.g. 1:250,000). A GIS can accept data at many spatial scales and ecosystem
services mapping requires the use of multiple data sources, so it is a necessity to understand the
suitability of the data attributes at different spatial scales.
For this project, it was decided to carry out a short review of a range of suitably advanced mapping
and assessment tools to assist in deciding which tool to use, to learn from previous work and to
support the project and its requirements to:
produce ecosystems services maps for the whole of Ireland including territorial waters;
retain the ability for data to be revisited to produce ecosystems services maps at more detailed
spatial scales;
consider different biophysical characteristics of ecosystem services (at CICES Cascade levels 1
and 2);
produce spatially explicit maps;
utilise available datasets specific to Ireland in a range of data formats;
combine datasets of differing spatial scales and levels of information content to represent
ecosystem indicators;
facilitate stakeholder input (by providing clear information);
be flexible in considering different types of ecosystem services whilst retaining a consistent
approach to deliver the spatially modelled maps;
identify where data gaps exist and how data can be manipulated, but not misunderstood;
produce ecosystem service maps.
The findings of the review of mapping tools are presented in Appendix A.
The process chosen for this project was SENCE (Spatial Evidence for Natural Capital Evaluation),
which was selected primarily for to its ability to be manipulated to accept a wide range of data sources
at different scales, and its ability to deliver outputs for a variety of ecosystem services. SENCE is a
process of mapping ecosystem services developed by Environment Systems following successful
projects to support research for natural resource management in Wales and for the Joint Nature
Conservation Committee (JNCC) in their advisory role to the UK government15. It is a participatory
GIS system, which allows for stakeholder weighting to be applied and therefore, local knowledge to
be included. Further details of the use of the SENCE toolkit and how it was applied using the datasets
available to the project is provided in Section 5. Mapping Ecosystem Services in Ireland using SENCE.
15 http://ecosystemsknowledge.net/sites/default/files/wp-content/uploads/2013/05/A-Practical-application-of-SCCAN-in-
Bridgend1.pdf
National ecosystem and ecosystem service mapping pilot
21
The concepts and approach that underpin SENCE are described in detail in two documents: ‘Spatial
framework for assessing evidence needs for operational ecosystem approaches’ 16 and ‘Further
development of a spatial framework for mapping ecosystem services’17. SENCE has been applied both
in the UK and overseas with the toolkit supporting the mapping and providing data output on
ecosystem services to meet the needs of a range of stakeholders in widely differing environments 18.
2.3 Stakeholder Consultation
In developing an ecosystem services framework for Ireland, it was essential to incorporate the
contributions of a range of stakeholders. Stakeholders involved in the project include:
organisations likely to be involved in implementing the ecosystem services model in Ireland;
stakeholders and interested parties with existing knowledge of environmental and societal
issues and policy in Ireland;
technical experts and other stakeholders with knowledge of data and projects that can
support or inform the project.
During the project, there were three main opportunities for stakeholder input, which included two
stakeholder workshops and a review of modelling data and rules during the SENCE process.
2.3.1 Consultation with the Project Steering Group
The initial Steering Group meeting, held in August 2015, considered prioritisation of different
ecosystem service themes. Specific policy areas (such as agriculture, forestry, fisheries, water quality,
flooding, etc.) were put forward for discussion. Stakeholders were then asked to provide details on
why the policy area is important, how the policy area is currently applied and understood, and to
identify likely high level interactions with other policy areas (e.g. increase in forestry or agricultural
land take). The group then identified and ranked the different ecosystem themes/policy areas to
determine their level of priority and create the drivers for mapping specific ecosystem services. The
Steering Group included representatives from Teagasc, Environmental Protection Agency, University
College Dublin and the National Parks and Wildlife Service.
2.3.2 Stakeholder Workshop 1
16 http://jncc.defra.gov.uk/page-6241
17 http://jncc.defra.gov.uk/page-6690
18 http://www.darwininitiative.org.uk/documents/DPLUS022/23488/DPLUS022%20AR1%20-%20Edited.pdf

National ecosystem and ecosystem service mapping pilot
22
The first stakeholder workshop was held in September 2015 and had the following objectives:
Create awareness and support for the project aims by the stakeholders;
Discuss data availability and suitability with stakeholders;
Provide a summary of the workshop outcomes suitable both for workshop attendees and
stakeholders who could not attend; and
Encourage further stakeholder input.
20 stakeholders attended the workshop in person, an additional five stakeholders provided feedback,
comments and/or data via email. 12 organisations were represented: Bord Na Mona, Department of
Communications, Energy & Natural Resources (Geological Survey of Ireland), National University of
Ireland Maynooth, Office of Public Works, Trinity College Dublin, Department of Environment,
Community and Local Government, and representatives from organisations in the Steering Group -
University College Dublin, Environmental Protection Agency, National Parks & Wildlife Service and
Teagasc.
Following the Steering Group meeting indictors to map specific ecosystem services were proposed. A
review of available data was carried out to prepare a series of mapped outputs to support Workshop
1.
Workshop 1 comprised three sessions.
1. To make the best ecosystem service framework for Ireland, it was necessary to identify the key
issues and services provided. In the first session, the candidate list of prioritised services
(including pressures/ indicators) produced through consultation with the project steering
group was put forward for discussion at the workshop. This candidate list contained
ecosystem services that were considered suitable for mapping during initial assessments and
that were considered important by the steering group.
2. In the second session, stakeholders identified further data sets with potential for use in the
mapping as well as providing improved understanding of the datasets that had already been
identified. To encourage engagement with the use of ecosystem mapping tools there was
discussion at the stakeholder workshop regarding the use of different geospatial modelling
techniques. This included additive modelling and data conflations.
3. The last session of the workshop sought to gather knowledge from local experts regarding
considerations specific to Irish ecosystems, as this has an influence on how scoring is applied
when mapping using the SENCE approach. For example, ecosystems in countries such as
Ireland are influenced by land use patterns, with small field sizes and hedgerows leading to
high spatial variation. This could lead to different approaches to scoring and evaluation
between Ireland and continental countries.

National ecosystem and ecosystem service mapping pilot
23
A copy of the Workshop 1 outcomes is provided in Appendix B.
2.3.2 Stakeholder Workshop 2
The workshop was held on 25th November 2015. Over 40 participants attended, including participants
from additional organisations including OPW, Department of Arts, Heritage and the Gaeltacht
(DAHG) Built Heritage, Marine Institute, Department of Agriculture, Food and the Marine, DECLG –
Spatial Planning, Dublin City Council, Birdwatch Ireland, Irish Water, Irish Forum on Natural Capital
and Woodlands of Ireland.
As new stakeholders were present it was important to continue with generating support for the
project as well as demonstrating progress by:
Re-visiting the concepts, terminology and tools available for mapping ecosystem services;
Providing detailed explanations of how data is used to map ecosystem service indicators;
To introduce and provide the opportunity for stakeholders to review the draft priority ecosystem
service maps based on those indicators;
Complete a workshop session on how the GIS models and maps could support a range of work
and decision making throughout Ireland.
Workshop 2 comprised three sessions:
1. In the first session the project and its aims were introduced. This explained further the concept
behind categorising ecosystem services from Workshop 1, and how identifying biophysical
characteristics of those services can be used. Examples of how ecosystem service mapping has
been implemented elsewhere provided stakeholders with the opportunity to understand the
approach taken and to generate discussion.
2. Following the Steering Group Meeting and Workshop 1, additional data such as Land Parcel
Information Systems (LPIS) was made available which provides high resolution information
on the distribution of pastoral and arable farming throughout Ireland. In addition more
datasets were made available for key indicators such as habitat type and structure following
Workshop 1 which enabled draft maps of the prioritised ecosystem services to be prepared for
discussion. These maps were presented in a workshop session, with stakeholders invited to
provide written comments on applicability of the maps, wording of what the services mapped
actually show and to help identify where maps could be improved by introduction of new
data or adaptations to the rules used in GIS modelling.
3. In a similar fashion to Workshop 1, the last session sought to gather knowledge from the
stakeholders. The principal aim was to evaluate how ecosystem service mapping and
National ecosystem and ecosystem service mapping pilot
24
assessment can usefully contribute to environmental decision making in Ireland. To support
the discussion, each stakeholder was requested to complete a questionnaire which included:
Identification of opportunities for mapping ecosystems services in their current
work;
Ranking of the most useful components of ecosystem service mapping;
Type of mapping outputs that would be useful;
Which policy areas can ecosystem services be used by;
Barriers to implementation of ecosystem services to support decision making.
The principal outcomes of the workshop provided further opportunities to include additional data
and to adjust the Rule-bases for modelling of ecosystem services. A copy of the Workshop 2 feedback
report is provided in Appendix C.

National ecosystem and ecosystem service mapping pilot
25
3. Applying Ecosystem Service Concepts in Ireland
3.1 Overview
Figure 6: Project approach – tools, considerations and steps detailed in this section.
Although the EU Biodiversity Strategy’s objectives for 2020 are a key focus of the MAES Initiative, the
relevance of ecosystem services is much broader. Indeed, it may well be the case that these
biodiversity objectives cannot be fulfilled unless the kind of cross-sectoral thinking envisaged in the
Ecosystem Approach is applied. Therefore, this section examines in more detail the relevance of
ecosystem services to stakeholder concerns within Ireland, and to policy areas that are the focus of
current concern. The aim is to identify which of the many ecosystem services should be prioritised by
the project, and which, given currently available data, can be analysed and mapped.

National ecosystem and ecosystem service mapping pilot
26
3.2 Outcomes of the Work Undertaken with Stakeholders
3.2.1 Prioritising of Ecosystem Services – Steering Group Meeting and Workshop 1
To make the best ecosystem service framework for Ireland, it is important to identify the key
environmental issues and ecosystem service themes in Ireland. A candidate list of prioritised services
(including pressures/ indicators) was produced through consultation with the project steering group
and put forward for discussion at the workshop. This list was based both on the suitability of the
service for mapping and the importance that the steering group attributed to the service and
comprised:
Provisioning services: Timber, Food
Regulating services: Water quality, Coastal flooding and erosion regulation, Soil erosion
regulation
Cultural services: Sense of place, Recreation
In addition, the mapping of biodiversity represented by functional ecological networks, species
diversity and habitats were also considered important factors to model and map as they have the
potential to provide useful spatial information on the biophysical characteristics supporting those
aforementioned services.
Discussion at the workshop identified ecosystem type priorities which confirmed the candidate list. A
particular link was made to the number of services and functions relating to water quality in the
freshwater and marine environment. In addition, the importance of peat in the rural economy was
identified. Suggested key factors and indicators, as well as the ecosystem services they are linked to,
are shown in Table 4.
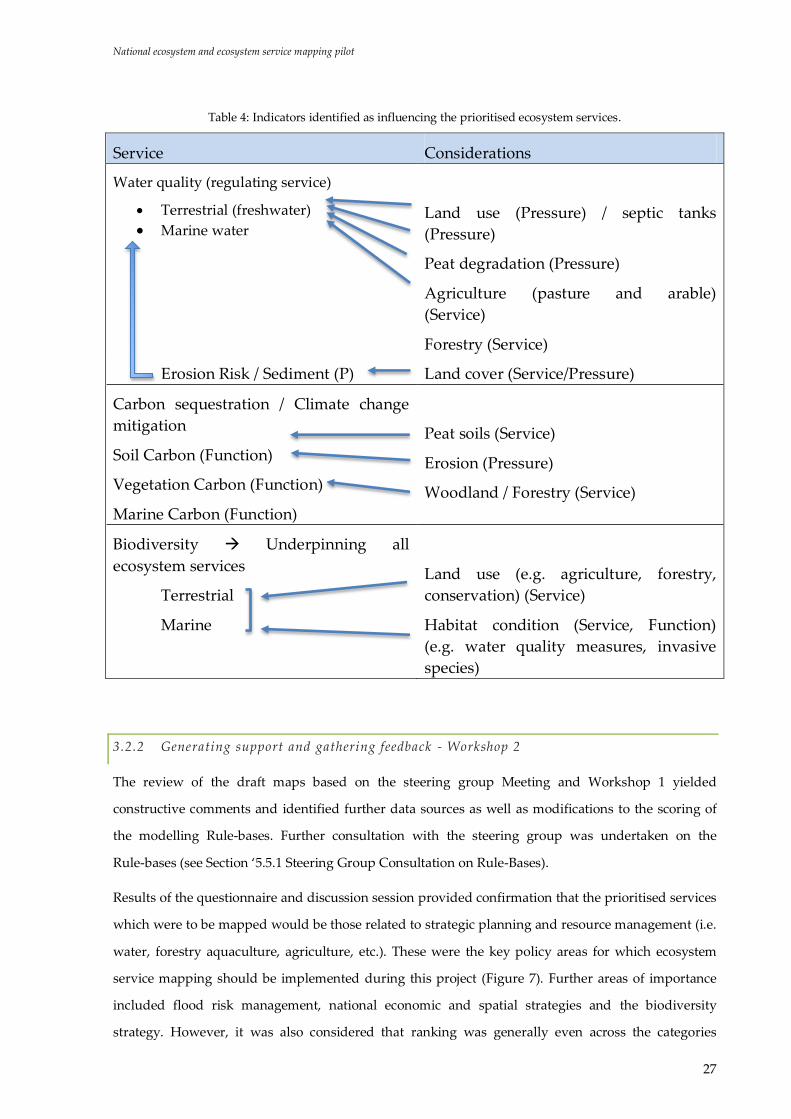
National ecosystem and ecosystem service mapping pilot
27
Table 4: Indicators identified as influencing the prioritised ecosystem services.
Service Considerations
Water quality (regulating service)
Terrestrial (freshwater)
Marine water
Land use (Pressure) / septic tanks
(Pressure)
Peat degradation (Pressure)
Agriculture (pasture and arable)
(Service)
Forestry (Service)
Erosion Risk / Sediment (P) Land cover (Service/Pressure)
Carbon sequestration / Climate change
mitigation
Soil Carbon (Function)
Vegetation Carbon (Function)
Marine Carbon (Function)
Peat soils (Service)
Erosion (Pressure)
Woodland / Forestry (Service)
Biodiversity Underpinning all
ecosystem services
Terrestrial
Marine
Land use (e.g. agriculture, forestry,
conservation) (Service)
Habitat condition (Service, Function)
(e.g. water quality measures, invasive
species)
3.2.2 Generating support and gathering feedback - Workshop 2
The review of the draft maps based on the steering group Meeting and Workshop 1 yielded
constructive comments and identified further data sources as well as modifications to the scoring of
the modelling Rule-bases. Further consultation with the steering group was undertaken on the
Rule-bases (see Section ‘5.5.1 Steering Group Consultation on Rule-Bases).
Results of the questionnaire and discussion session provided confirmation that the prioritised services
which were to be mapped would be those related to strategic planning and resource management (i.e.
water, forestry aquaculture, agriculture, etc.). These were the key policy areas for which ecosystem
service mapping should be implemented during this project (Figure 7). Further areas of importance
included flood risk management, national economic and spatial strategies and the biodiversity
strategy. However, it was also considered that ranking was generally even across the categories
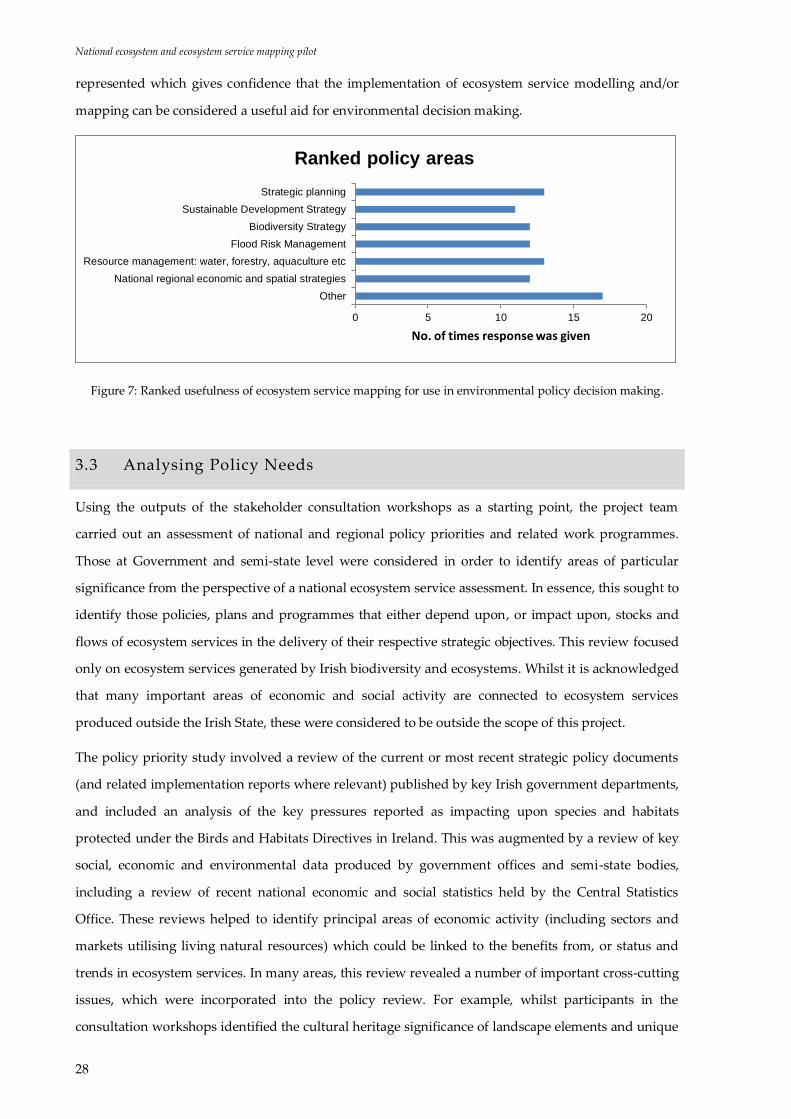
National ecosystem and ecosystem service mapping pilot
28
represented which gives confidence that the implementation of ecosystem service modelling and/or
mapping can be considered a useful aid for environmental decision making.
Figure 7: Ranked usefulness of ecosystem service mapping for use in environmental policy decision making.
3.3 Analysing Policy Needs
Using the outputs of the stakeholder consultation workshops as a starting point, the project team
carried out an assessment of national and regional policy priorities and related work programmes.
Those at Government and semi-state level were considered in order to identify areas of particular
significance from the perspective of a national ecosystem service assessment. In essence, this sought to
identify those policies, plans and programmes that either depend upon, or impact upon, stocks and
flows of ecosystem services in the delivery of their respective strategic objectives. This review focused
only on ecosystem services generated by Irish biodiversity and ecosystems. Whilst it is acknowledged
that many important areas of economic and social activity are connected to ecosystem services
produced outside the Irish State, these were considered to be outside the scope of this project.
The policy priority study involved a review of the current or most recent strategic policy documents
(and related implementation reports where relevant) published by key Irish government departments,
and included an analysis of the key pressures reported as impacting upon species and habitats
protected under the Birds and Habitats Directives in Ireland. This was augmented by a review of key
social, economic and environmental data produced by government offices and semi-state bodies,
including a review of recent national economic and social statistics held by the Central Statistics
Office. These reviews helped to identify principal areas of economic activity (including sectors and
markets utilising living natural resources) which could be linked to the benefits from, or status and
trends in ecosystem services. In many areas, this review revealed a number of important cross-cutting
issues, which were incorporated into the policy review. For example, whilst participants in the
consultation workshops identified the cultural heritage significance of landscape elements and unique
0 5 10 15 20
Other
National regional economic and spatial strategies
Resource management: water, forestry, aquaculture etc
Flood Risk Management
Biodiversity Strategy
Sustainable Development Strategy
Strategic planning
No. of times response was given
Ranked policy areas

National ecosystem and ecosystem service mapping pilot
29
uses of land as priority issues, the policy review determined that this related to priority initiatives in
the tourism sector, which seek to better capture the value of these elements to tourism throughout
Ireland and particularly to rural economies. Similarly, the review of policies related to recreation,
which was also highlighted by the stakeholder workshop, identified connections to national public
health priorities associated with physical activity and social engagement.
The policy review considered several key regulatory instruments at the EU level, including amongst
others, the Water Framework Directive, Marine Strategy Framework Directive, and the Floods
Directive, and these were noted, where relevant, as key drivers of Irish policy pertaining to ecosystem
services. However, a detailed review of the full range of connected EU policy instruments, and of the
full suite of implementing legislation in Ireland, was beyond the scope of this project. Certain
regulatory instruments and EU policies were considered to have an over-arching importance across all
social and economic policy areas (including the Birds and Habitats Directives and the EU Biodiversity
Strategy to 2020), whilst others were considered to be most important as tools for implementing
protections for biodiversity and ecosystems rather than as primary drivers of policies affecting
ecosystem services (for example, the Environmental Liabilities Directive19, the Environmental Impact
Assessment Directive20, and Strategic Environmental Assessment Directive21).
This assessment also took account of relevant ‘headline’ issues of public concern, as far as was
possible, based on a review of national, local and specialist media reports on policy priorities and
related issues in the previous decade (i.e. since 2006). Particular attention was also paid to recent
reports on the state of the Irish environment produced by inter alia the Environmental Protection
Agency, the Heritage Council, the National Biodiversity Data Centre, and the NPWS, as well as a
review of relevant scientific literature (both peer-reviewed journal articles and commissioned reports
for government and semi-state bodies, stakeholder groups and non-governmental organisations). The
project was further guided by outputs from the UK National Ecosystem Assessment and the TEEB
project, and an assessment of the social and economic costs and benefits of biodiversity in Ireland,
carried out for the NPWS in 2008 (Bullock et al., 2008).
To compile the many different policy driver and ecosystem themes and pressures, a table was created
to provide clarity and define areas of interest which could be taken forward into the development of
CICES sub-classes for Ireland. A graphic overview of the matrix is provided in Table 5 and the full
details of the interactions are provided in Appendix D and as an element in the MS Access Database.
19 http://eur-lex.europa.eu/legal-content/EN/TXT/?uri=CELEX:02004L0035-20130718
20 http://eur-lex.europa.eu/legal-content/EN/TXT/?uri=CELEX:32014L0052
21 http://eur-lex.europa.eu/legal-content/EN/TXT/?uri=CELEX:32001L0042

National ecosystem and ecosystem service mapping pilot
30
Table 5: Ecosystem Theme, Pressure and Policy Matrix; ‘x’ indicates that there is a policy / document addressing
the issue in regards to the policy and non-policy drivers
3.4 Developing CICES in the Irish Context
3.4.1 Background
While the cascade and CICES described in Section ‘2.1.1 Conceptual Framework – the Role of the
Cascade Model’ and ‘2.1.2 Classifying and Measuring Ecosystem Services: CICES’ can be valuable
analytically, it is also apparent that CICES can be useful in the context of reporting the outcomes of
assessment and mapping exercises. It was in this context that the notion of ‘CICES-Ireland’ was
suggested in the proposals for this work.
While the hierarchical structure of CICES enables ecosystem services to be defined in a very detailed
way, these may not be appropriate for reporting the outcomes in a given policy or management
context. Thus it is possible to use the basic elements of CICES as building blocks, and to aggregate or
group them in ways that are appropriate to a given problem or issue. There is also the possibility of
naming these groups in ways that can be understood or have resonance with the different stakeholder
groups involved in particular situations. Providing the links back to the underlying CICES classes are
retained, a transparent and flexible structure can be created that would allow wider comparisons to be
made and results transferred to other situations.

National ecosystem and ecosystem service mapping pilot
31
An example of the way CICES can potentially support the reporting task is provided by work in
Belgium, where a consultative process was used to develop a set of categories using CICES for
assessment work (Turkelboom et al., 2013). The outcome, which has been referred to as ‘CICES-Be’,
largely aggregates classes into broader categories and uses terminology to describe them in a way that
has meaning to the people that will be using the assessment. The Symposium in Ireland on the
Mapping and Assessment of Ecosystem Services, held at the Waterford Institute of Technology in
February 2015 jointly organised by the National Biodiversity Data Centre, the Environmental
Protection Agency and the Department of Arts, Heritage and the Gaeltacht, initiated a similar kind of
process, although the outcome did not result in as complete a set of proposals as in Belgium.
The Waterford meeting reviewed CICES and suggested potential adaptations for Irish land use,
environment and data, and potential indicators. Although a report from the Symposium is not yet
available, a draft summary was made available to the project team (Murray and Malone, 2015). It
included some suggestions for possible merging and regrouping of the CICES classes to produce more
suitable categories for work at the national scale. The results are shown in Appendix E. Several
features of the outcome of the Symposium are of particular interest here.
In relation to CICES, participants at the Waterford Symposium felt that the classification required
greater explanation and interpretation with respect to Ireland, and that to make progress there was a
need to develop a set of case studies illustrating its application in MAES in the Irish context. The
outcomes of the current project will clearly begin to provide some of this material, and in particular
provide guidance on how it can be applied in a way that is relevant to current policy and management
concerns. Therefore, section 3.4.2 Linking Ecosystem Services to Key Policy Concerns describes how a
set of specific subclasses can be identified that link the major ecosystem services to different policy
areas.
During the Waterford Symposium the participants considered issues in relation to agricultural, forest,
freshwater and marine ecosystems, and made recommendations for which services were considered
to be a priority within each sector. They also suggested how CICES might be modified to handle them.
There were clear differences between ecosystem types in terms of what were considered to be the
most important services generated in each type. In general terms, provisioning services outputs from
wild plants and animals were flagged as being of particular interest in forest, freshwater and marine
ecosystems; cultivated crops and reared animals were highlighted as important provisioning services
in agricultural ecosystems. Water supply for drinking and other uses from surface and ground waters
were also identified as being an important focus for work. Finally within provisioning services, plant-
based sources of biomass energy were prioritised.

National ecosystem and ecosystem service mapping pilot
32
There was a considerable spread of interest within the regulating services, but there was clear
agreement on the importance of global climate regulation, with the recommendation that it might be
grouped with micro-climate regulation. The hydrological cycle and water flow maintenance were also
seen as especially significant across all the ecosystem types. Amongst the cultural services, scientific
uses were highlighted as a priority across all ecosystem types considered, along with the experiential
use of plants, animals, landscapes and seascapes, by virtue of the recreational activities that they
support.
The current project has worked with stakeholders, and it is clear that the findings largely confirm the
prioritisation made at the Waterford meeting. In terms of taking the recommendations on modifying
CICES that were made, it is recommended that these are most usefully addressed by not changing
CICES directly, but instead using the hierarchical structure to identify policy or management relevant
reporting categories by aggregating classes and sub-classes as appropriate. It is suggested that this
work builds on the effort to identify ‘Irish relevant’ services at the sub-class level, which is addressed
in the next section.
3.4.2 Linking Ecosystem Services to Key Policy Concerns
In order to ensure that the description and naming of ecosystem services speaks specifically to Irish
concerns, this project has developed and extended the CICES framework. The results are shown in
Appendix F, which principally lists which specific ecosystem outputs have been identified that are
relevant in the Irish context, given the understanding of stakeholder concerns and policy needs. These
ecosystem service outputs are listed as sub-classes within the CICES structure.
In reviewing the information in the policy review it is important to note that while the sub-classes
identified are cross-referenced to corresponding classes and groups, not all CICES classes are
represented in this table. Rather, this list represents those services at sub-class level that were
prioritised through our work with stakeholders and through our analysis of policy needs. In naming
these sub-classes an attempt has been made to use terminology that is appropriate to current concerns
in Ireland, and to make this as transparent as possible, against each of the particular sub-classes the
rationale for choosing them has been set out. In addition it has also been suggested which kinds of
mapping would assist in the assessment of the state and trends of these services and which key
habitats or features might be used as the basis for quantitative indicators.
In the context of the current Project, the CICES Sub-classes for Ireland forms the basis of the mapping
work that has been undertaken to show how spatial assessments of ecosystem services can be made
using currently available data. In more general terms, however, it is also important in taking forward
the discussions on the need for ‘CICES-Ireland’, that is a classification that has greater resonance with
national concerns. The ability to customise as many ‘locally relevant’ categories at the sub-class level
National ecosystem and ecosystem service mapping pilot
33
was always intended as one way in which CICES could provide a flexible approach to characterising
ecosystem service. Thus the CICES Sub-classes for Ireland (Appendix F) represent a first draft of what
CICES for Ireland might look like. As other data becomes available or as other concerns arise, further
Irish-specific sub-classes can be added as required. The important point to note is that the upper levels
of CICES do not need to be modified to make them relevant to Irish concerns. The descriptors at the
sub-class level can take the definitions at these upper levels and provide the kind of explanation that
was called for in the Waterford workshop. Moreover, the approach does not preclude the construction
of broader or more aggregated reporting categories, such as ‘water supply’ or ‘climate regulation’.
Indeed, clarity in the way in which the service at class and sub-class level are ‘merged’ into these
reporting classes ensures that the evidence-base represented through these reporting categories is as
transparent as possible. Preservation of the overall structure of CICES also means that the ability to
cross-reference cases and sub-classes to the MA and TEEB classification frameworks is maintained.

National ecosystem and ecosystem service mapping pilot
34
4. The Theory of Mapping Ecosystem Services
4.1 Overview
This section deals with the theoretical framework used for mapping in the project and the
development of spatially explicit information on biophysical properties to model ecosystem service
provision. Additionally, the section describes how this information is captured within a database, the
All-Ireland Matrix, for future users with an interest in ecosystem service mapping.
Figure 8: Project approach – tools, considerations and steps detailed in this section.
Application of ecosystem service tools, i.e. tools for visual depiction, assessment and/or valuation of
ecosystem services, is an emerging discipline. This mapping project for Ireland, therefore, needed to
consider all the information available and review its suitability for use. It is important that available
spatial datasets can be assessed for its quality and applied to produce a clear picture of the spatial
extent of ecosystem services.
In creating a crosswalk between the CICES ecosystem service sub-classes and the classes of the
existing CICES, TEEB and MA frameworks it is possible to see where and how Ireland specific
ecosystem services exist. The ability to register the datasets used or generated in this project alongside

National ecosystem and ecosystem service mapping pilot
35
other frameworks provides opportunities to contribute towards EU reporting under the Biodiversity
Strategy to 2020.
Whilst understanding how different frameworks correspond it is also important to know what data is
available. To this end, an Ecosystem Services Information Database was created. This is a Microsoft
Access database which can be operated by a non-GIS specialist to understand what spatial data is
available and/or required to assist in mapping the indicators of ecosystem services and for which
category under the different framework classifications they will apply.
4.2 Developing Ecosystem Service Indicators
Whilst the ability to clearly classify and describe ecosystem services is an essential part of any
assessment on the contribution they make to human well-being, this is only a first step in the process
of measuring them quantitatively and understanding patterns of supply and demand. It is not always
the case that a service can be measured directly. Often relevant data is not available, or it is difficult or
expensive to collect. Thus instead, mapping and assessment work has to rely on ‘indicators’ or
‘surrogate’ measures that can be used to quantify provision in a more indirect way.
Section 2.1.1 Conceptual Framework – the Role of the Cascade Model discussed the cascade model
and the fact that the capacity of ecosystems to deliver services depends on the underlying ecological
structures and processes associated with an ecosystem, and the particular ecological functions that
give rise to the service. Thus important insights into that capacity to supply a service can be gained by
mapping say, the stock (amount) and distribution of an ecosystem represented as a specific habitat or
group of habitats, and of the condition of those individual habitat parcels, in terms of their
productivity, size or isolation. Similarly, the demand-side of ecosystem services can be represented by
looking more directly at the goods and benefits that the services support. For example the capacity of
an ecological setting to supply cultural services can be assessed by the amount or value of recreational
activity that it supports, where recreation is understood as a benefit in terms of the cascade model.
In short, to assess and potentially to ‘map an ecosystem service’, data across some or all the elements
of the cascade may need to be looked at to build up a complete picture. The situation is illustrated in
Figure 9, where the cascade has been used to look at the kinds of relationships that exist between the
ecological functions, structures and processes that underpin climate regulation and water quality
regulation. The diagram also illustrates how the various drivers and pressures for change can be
factored into the analysis.

National ecosystem and ecosystem service mapping pilot
36
Figure 9: Ecological structures, functions and ecosystem services in the Cascade Model.
The necessity to look at services across all the elements of the cascade has been recognised by a
number of recent studies, such as that of Mononen et al. (2016) who used it as a framework for
developing a set of national ecosystem service indicators for measuring socio-ecological sustainability
in the context of the Finnish National Ecosystem Assessment. These works argued that the CICES
classes represented, in a sense, a set of themes or issues that could only be characterised by looking at
the relationships the services had to the other elements of the cascade that determined ecosystem
service supply and demand. The indicators of these different elements are the kinds of proxy or
surrogate measures that can be used in this study to map the ecosystem services that are important to
Ireland.
Therefore, this notion of proxy or surrogate measures to identify the kinds of mapping and mapping
units that can be useful in characterising different services has been used. This provides the
foundation for the SENCE mapping approach used in this study, which relies on understanding the
key factors that influence patterns in the underlying ecological structures, processes and functions so
that the likely service output can be inferred or predicted.
The SENCE approach is described more fully in the Sections 2.2 Ecosystem Service Mapping Tools:
SENCE and 5. Mapping Ecosystem Services in Ireland using SENCE of this Report. Its application is
contingent on the availability of data for services or their relevant proxies, and so in order to identify

National ecosystem and ecosystem service mapping pilot
37
which of the priority ecosystem services could actually be taken forward for more detailed
quantitative assessment, a review of available information has been undertaken (see Section 5.2 Data
Collation and Suitability Audit).
4.3 An Ecosystem Services Information Database
The Ecosystem Services Information Database (designed to incorporate datasets throughout Ireland,
i.e. an All-Ireland Matrix of datasets) helps to facilitate further ecosystem service mapping to be
carried out for Ireland through two principal functions:
The users can choose an ecosystem service of interest, input the scale at which they would like to
map this service, and obtain a report detailing which data would be required.
The user can input the type of data available and obtain a report detailing which service could be
mapped from that data, and at which scale.
One important part of ecosystem service mapping is the effective communication of findings.
Therefore, the database has a third functionality:
The user can input a service and the classification system that the name of the service was derived
from (CICES). The tool will then output the corresponding name under the other ecosystem
service classification system and a report with relevant scientific background regarding the service
in question.
As an additional functionality, the tool can be used to obtain information regarding the
methodology of the ecosystem service maps produced during this pilot project (see section ‘6.
Mapping outputs’).
The Access tool is underlain by information specifying which type of data is needed for the mapping
of which ecosystem service, and for which scale individual datasets are suitable. Additionally, a table
specifies which TEEB and MA categories ecosystem services from the CICES framework fall into.
Examples of the type of report output by the tool are provided in Appendix G.
Table 6 lists the source tables in which all relevant information for the access database is recorded.
The data base is supported by a set of documents which outline the scientific conceptual background
of each of the services and functions mapped. These documents are intended to provide sufficient
information for non-specialists from other disciplines to understand the way the service has been
mapped and scored, based on scientific literature. They are not developed as an Ireland-specific set of
references, although this could be built into the system in the future.

National ecosystem and ecosystem service mapping pilot
38
Table 6: Source tables for the access database forming the All Ireland Matrix
Table Information recorded
CICES for
Ireland_fordb.xlsx
Lists CICES sub-classes developed during this project, including
information on how they fit into the over-arching CICES framework
and which maps they are included in.
Data_Information.xlsm Lists datasets used during this project, including data owners, licencing
conditions, and links to the data or contact information for the data
owner.
Data_to_Map_Services.xlsm Lists datasets used during this project and identifies if they are not
needed, are essential, or are beneficial to mapping the ecosystem
services that were prioritised for this project.
Scale.xlsm Lists datasets used during this project and identifies if they are suitable
for mapping at local/catchment/regional/national/EU scale.
Crosswalk.xlsm Identifies how CICES classes fit into two other ecosystem service
frameworks, MA and TEEB
Theme_order.xlsx Identifies the order that themes appear in in the reports produced by
Option 2

National ecosystem and ecosystem service mapping pilot
39
5. Mapping Ecosystem Services in Ireland using SENCE
5.1 Overview
This section deals with the practical approach to ecosystem service mapping taken in this project,
including data collection/audit, the creation of any intermediate layers, and rule-base development.
Figure 10: Project approach – tools, considerations and steps detailed in this section.
Spatial Evidence for Natural Capital Evaluation (SENCE) is based on the concept of identifying the
key factors which affect the contribution to a service of any area of land. These key factors include
habitat, soil/geology, landform, and management/cultural factors. The SENCE tool builds on
developments from the JNCC ecosystem service Spatial Evidence Mapping work (Medcalf et al., 2012
and 2013).
In the majority of cases, there is no single dataset that is readily available, appropriate to use, simple to
map, and fully representative of an individual ecosystem service. Instead, the ecosystem service
provision is modelled using different proxies. Information is brought together using a geoinformatics
approach that considers the data both spatially and quantitatively by use of a scientific ‘rule-base’
National ecosystem and ecosystem service mapping pilot
40
system. The rule-base is based on scientific literature and local knowledge, allowing bespoke maps to
be developed that consider local subtleties in service provision.
Terrestrial ecosystem service mapping was carried out at a national level, covering the whole of the
Republic of Ireland, with a total of 69,880km2. Marine mapping approximately followed the outline of
the continental shelf and Ireland’s Exclusive Economic Zone, whichever reached farther, creating a
total coverage of 712,268km2.
5.2 Data Collation and Suitability Audit
The data available for use with the SENCE mapping method are spatial datasets, including both point
and polygon vector data and raster data, collected at a variety of different scales, and with a variety of
accuracies and resolutions.
Once data has been collated the suitability and appropriateness of the data for use in the project was
assessed by considering:
Quality (in terms of coverage, topology and map projections);
Suitability (whether appropriate information is included within the dataset);
Availability and licensing, and the quality of the metadata supplied;
Coverage (only national coverage data considered, as local data could skew the results on the
national scale).
Metadata quality is an important component of data, as it explains to the end user how the data was
captured, the limitations of the data and the confidence within the information provided. Those
datasets which were not provided with sufficient accompanying information were not considered for
the analysis.
In addition to these criteria, spatial scale is an important overarching factor to consider. Data must be
fit for purpose; ‘coarse’ data is most suitable for use at a national strategic level to inform national
policy and planning issues. At a local level, coarse data could potentially over-simplify the context
and does not often include the suitably detailed information required to support local decision
making. To overcome this, highly detailed local data on environmental and social assets are needed
and can be considered in combination to reflect the situation.
NPWS sourced over 300 datasets which were provided to Environment Systems Ltd. for use in the
project. Many of these were identified and commented upon as part of the 1st stakeholder workshop
(see sections 2.3.2 Stakeholder Workshop 1 and 3.2 Outcomes of the Work Undertaken with
Stakeholders). A list is provided in Appendices H and I. This data was from a variety of different
sources, was at varying spatial and temporal resolutions, and was in a number of coordinate reference

National ecosystem and ecosystem service mapping pilot
41
systems. The majority of data was collated up to autumn 2015, additional species distributions were
collated up to February 2016, so it is possible that there are datasets or projects which became
available only after this period that were not included. Full details of the data temporal extent and
creation date for outputs are detailed per resource in the associated metadata.
Once data collection had been completed, an audit of applicable data took place, collating information
regarding who owns the data, any licence restrictions, whether metadata was provided, and what the
scale and coverage of the data are. The information available was quite variable and examples from
the data log are provided in Table 7 to illustrate this.
Table 7: Examples of data collation and audit.
Theme Data set
Dataset
Owner /
Provider
Data
reliability*
Spatial
resolution Licensing
Geology
National Draft
Generalised Bedrock
Map (Groundwater
Rockunits)
DCENR – GSI Medium Medium
Free for
commercial,
research and public
use. Acknowledge
the material.
Soils Teagasc Soils Teagasc Medium
Scale (vector)
1:100,000 –
1:150,000
Must acknowledge
source and does
not include
Commercial use
Habitats
Saltmarsh
Monitoring Project
2006 - 2008
NPWS
High (mostly
derived from
field survey)
High (GPS
data
collected on
site,
supported
by OSi data)
Must acknowledge
source
National Survey of
Native Woodlands
2003 - 2008
NPWS
High (mostly
based on
field survey,
with original
survey site
selection
using FIPS)
20m*20m is
minimum
mapping
area
Must acknowledge
source
Corine Landcover
2012 EPA Low Low
Must acknowledge
source and does
not include
Commercial use
Land form NextMap 5m DTM NPWS High 5m
Must acknowledge
Intermap
Technologies Inc.
Designated
Sites
Terrestrial Special
Areas of
Conservation (SAC's)
NPWS
Not assessed
– no meta
data
Not assessed
– no meta
data
Must acknowledge
source
Natural Heritage
Areas (NHA's) NPWS
Not assessed
– no meta
data
Not assessed
– no meta
data
Must acknowledge
source
*Reliability assessment was taken from existing metadata, where available, or from an analysis of the attributes within the data
set in combination with its spatial scale and currency.
National ecosystem and ecosystem service mapping pilot
42
5.3 Habitat Asset Register
Habitat data can be harnessed to map many ecosystem services. The spatial variation of the geology
and soil profiles of Ireland gives rise to a complexity of habitat types. For example, thin, acidic soils
support dry heath communities in a complex mosaic with other vegetation and where drainage is
impeded on gently sloping valley sides and depressions, wet heath and bog communities occur.
Identifying these biophysical characteristics or ‘living systems’ provides an indication of ecosystem
service provision.
Ireland currently has no standardised national terrestrial habitat mapping. This means that although
there is a widespread range of habitat data available, these are collected by different organisations for
differing purposes. Numerous habitat datasets were made available, however, each of these datasets
had varying characteristics in terms of coverage (whole or partial), age, scale, nomenclature, quality
and resolution (polygons, point data, fuzzy data). Therefore, a significant proportion of the project
resources were required to address this deficit, in order to create a seamless and comprehensive
terrestrial habitat dataset, known as a Habitat Asset Register as an indicator of the underpinning
living systems that support ecosystem services. The Habitat Asset Register was to be suitable for re-
use by the NPWS, and with very few licence restrictions.
Data to be included in the Habitat Asset Register was chosen after an audit of over 150 habitat
datasets. In order to identify the most suitable datasets thematic suitability, metadata quality, spatial
extent, and resolution were examined and an extensive process of stakeholder consultation took place.
During this process, the most suitable data for national scale mapping and a range of data gaps and
limitations were identified.
Spatially explicit data representing the actual habitat boundaries in polygon format were given
precedence, as the usage of point data introduces error into the map, with the exception of Turloughs,
which were incorporated into the register at the 50m cell level.
In addition, the evaluation covered relevance at a national scale. Data for discrete habitats (covering
only very small, disjunct areas) was not included; for example, despite being spatially explicit, the
Article 17 data23 (NPWS, 2013) on Juniper scrub (5130) was not incorporated into the Habitat Asset
Register, as the presence of individual Juniper bushes cannot be used as proxy for overall ecosystem
functions in an area. The overall ecosystem function will depend on the type of habitat the Juniper
bushes are found within, such as acid grassland or limestone pavement. However, the habitats that
were not suitable for inclusion in a national habitat map can still be of relevance for national scale
23 ‘Article 17‘ refers to Habitats Directive Annex I Habitats, for which their national distributions have been mapped nationally
and reported under the Habitats Directive Article 17 report on National Conservation Status

National ecosystem and ecosystem service mapping pilot
43
provision of some ecosystem services. In this case, they were added into the mapping process as a
layer of their own, alongside the Habitat Asset Register, as they modify the service provision as
determined by the main habitat rather than define how strong service provision is at the site.
A full list of the data provided and evaluated, including information on the data selected for use, is
provided in Appendix I.
A different approach was taken for marine habitat mapping, where the coverage of habitat layers was
very different to the terrestrial situation. Here the two datasets with the largest spatial extent were
used. They were not conflated in the same way but as part of the analysis process.
Note - Whilst the Habitat Asset Register (HAR) is based on the best data currently available, it does
contain some inherent limitations due to the manner in which LPIS categorises permanent pasture.
This may lead to an underestimation of semi-natural grassland and heaths. For details, please refer to
the section on data gaps and the section on the preparation of LPIS data for usage in the HAR.

National ecosystem and ecosystem service mapping pilot
44
Figure 11: Habitat Asset Register for Ireland - Level 1

National ecosystem and ecosystem service mapping pilot
45
Figure 12: Habitat Asset Register for Ireland - Data sources

National ecosystem and ecosystem service mapping pilot
46
5.3.1 Preparation of the Habitat Asset Register (for terrestrial habitats)
The final version of the Habitat Asset Register was created from a conflation of over 45 datasets
(Figure 13). The best data available for each habitat type was used, which, in some cases, required the
creation of primary intermediate layers (see Section ‘5.4 Primary Intermediate Layers’). Each of the
datasets was subject to the data suitability review (as described in section ‘5.2 Data Collation and
Suitability Audit’).
The intermediate layers (generated from LPIS, FIPS, Article 17 and Turlough datasets) and the
remaining datasets were conflated using a stacking approach. Corine 2012 dataset was used as the
‘base layer’, being in effect the first layer; it is important that the first layer provides continuous cover
across whole area of interest, in this case the Republic of Ireland (Figure 12).
The next dataset used supersedes the base layer. The second data layer used was the ‘Connolly’
derived peatland map. It only covers part of the area of interest, and only in these areas is the Corine
data overwritten by the Connolly peat map layer in the conflation process. As processing is carried
out with rasters, the output of the data conflation is a seamless and continuous raster surface, in this
case representing habitats. This process is then repeated for dataset three and so on, until all the data
is included in the seamless dataset, with the data from the data layers being added later always
superseding those that are already conflated.
A full table of area coverage by input data sources in the final, conflated layer is provided in
Appendix J. In the first iteration, before more data was added, 60% of the habitat map was still
covered by Corine data, meaning that in these areas during the stacking process the base layer had not
been an overwritten one. In the final iteration, where, amongst others, LPIS data had been added into
the stack, only 11.8% of the area remained covered by Corine data. The remaining 88.2% of area have
been superseded by at least one other dataset, with the different classes derived from LPIS now
covering 61.8% of Ireland.
A data map is provided to show which data source underlies the Habitat Asset Register in each area.
The conflation process and the creation of a data map enables an understanding of the certainty and
suitability of the data forming the source for the Habitat Asset Register.
The output of the conflation is a raster dataset consisting of approximately 200 habitat classes (known
as ‘Habitat Asset Classes’), e.g. all the various habitat attributes used in all layers included in the
habitat conflation. Due to the number of classes, this initial conflation output is unsuitable to be
displayed; additionally, habitats in this layer can appear twice, if, for example, one input layer refers
to “Coniferous woodland” and another input layer to “Woodland (coniferous)”. Therefore, Habitat
Asset Classes are split into two levels of detail (Level I and Level II) (Table 8) to support both a

National ecosystem and ecosystem service mapping pilot
47
strategic overview of habitats across Ireland (Level 1) and a detailed understanding of the habitats
present with regards to their potential for ecosystem service provision (Level 2). Level 2 is not suitable
to be coloured up at a national scale, as there are too many habitat classes. Depending on what
purpose the layer is used for, the user could colour up the different types of raised bog, or other
habitats of interest. Table 8 illustrates how strategic scale habitats from Level 1 are split into more
detailed habitat classes used for ecosystem scoring in this project (Level 2).
Table 8: Example Habitat Asset Classes (attribute table fields) in the Habitat Asset Register; classes resulted from
grouping of all original classes appearing in the input data sources
Habitat Asset Class Level I Level II Data Source
Coniferous forest Coniferous
woodland
Coniferous
woodland Corine
Discontinuous urban fabric Built
environment
Built
environment -
Discontinuous
Corine
Low-level Atlantic Blanket Bog Blanket bog Blanket bog -
Low-level
Connolly Derived
Peatland Map
GS2 Semi-natural dry
grassland
Semi-natural dry
grassland
NPWS semi-natural
grassland survey
RBMA13 (Raised Bog Monitoring and
Assessment Survey 2013)-Cutaway
Bog
Raised Bog Raised Bog -
Cutaway
RBMA13 - High bog
cutaway
Coniferous Coniferous
woodland
Coniferous
woodland FIPS
Marginal Raised Bog Raised Bog -
Marginal
RBMA13 -
habitats2007-13
Active Flush Raised Bog Raised Bog -
Active Flush
RBMA13 -
habitats2007-13
NationalSecondaryRoad Built
environment
Built
environment OSi Discovery Series
7130 Blanket bog Blanket bog -
Active Article17 - 7130
To ensure future users of the Habitat Asset Register can understand the dataset, a full resource
catalogue of metadata was also prepared in addition to a readme crib sheet (MS Excel lookup)
referenceable to the number codes in the raster dataset. This ensures that the original datasets for this
derived product can be identified to give the user confidence if applying future updates, or if it is used
in later projects.
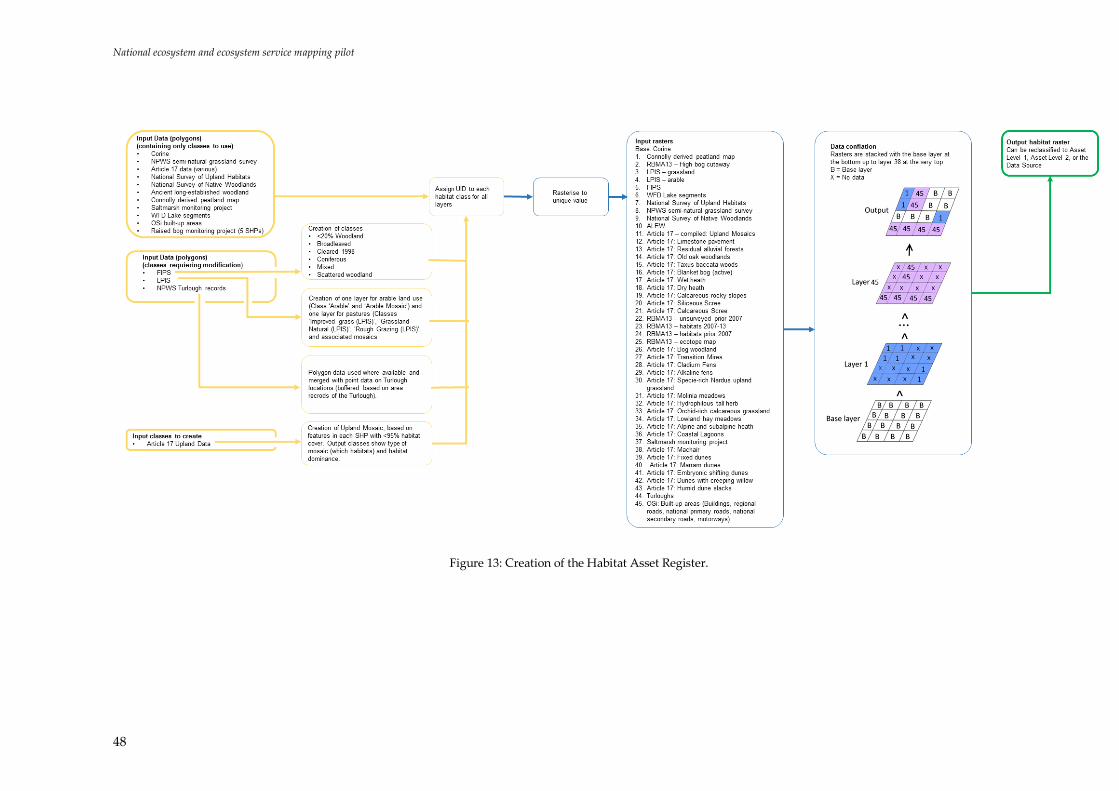
National ecosystem and ecosystem service mapping pilot
48
Figure 13: Creation of the Habitat Asset Register.

National ecosystem and ecosystem service mapping pilot
49
5.4 Primary Intermediate Layers
Intermediate layers were created for some of the datasets, as they required manipulation in order to be
used in the data conflation to create the Habitat Asset Register (see Section ‘5.3 Habitat Asset
Register’) or as supporting layers for final ecosystem service mapping (see Section‘5.6 Creation of
ecosystem service maps’). In these datasets, data was recorded in a format unsuitable for unmodified
inclusion in the mapping process (e.g. classes too detailed; percentage cover of each species recorded,
instead of overall habitat type; data split into several files; etc.). Datasets that required modification
are listed in Table 9, with the resulting maps displayed in Appendix L. For the remaining datasets,
one, or a combination of two attribute columns of the original dataset could be used.
Table 9: Datasets that were modified to create intermediate layers.
Original
data
Primary
Intermediate
layer
Why modification was
required
Secondary
Intermediate
Layer
What the
layer was
used for
How the layer was
created
Land Parcel
Information
System
(LPIS) data
Arable land
use &
Pastoral land
use
Original classes
exceeded detail
required; Identification
of land use required
consideration of 5-year
arable rotation
Habitat Asset
Register
All
terrestrial
ecosystem
services
mapped
See section ‘5.4.1
Land Parcel
Information System
(LPIS) Data’
Forest
Inventory
and
Planning
Systems
(FIPS) data
Forest cover
based on
LPIS
Percentage of individual
species recorded,
instead of habitat type;
merge of 2012 data into
2007 data due to some
corruption in 2012 layer
See section ‘5.4.2
Forest Inventory and
Planning Systems
(FIPS) data’
Article 17
data
Article 17
mosaics
Presence of mosaics
indicated through
overlap of different
Article 17 map layers
See section ‘5.4.3 EU
Conservation of
Habitats and Species
Directive – Habitat
(Article 17) Data –
Mosaic habitats’
Turlough
data (points
and
polygons)
National
coverage of
turloughs
Data in polygon and
point format
See section ‘5.4.4
Turlough data’
Species
records
Species
coincidence
layer
Over 1000 individual
species records at
varying resolutions
- Terrestrial
Biodiversity
See section ‘5.4.5
Species Coincidence
Layer’
Habitat
Asset
Register
Ecological
Networks
Not previously existing - Terrestrial
Biodiversity
See section ‘5.4.6
Habitat Networks’
Designated
sites layers
Designated
sites layer
Previously one SHP per
designation type
- Terrestrial
ecosystem
service
maps
See section ‘5.4.7
Designated Sites
Layer’
Bathymetry
data /
Bathymetry
in 2 depth
Partial coverage of the
marine AOI
Marine
biodiversity
See section
‘Bathymetry’
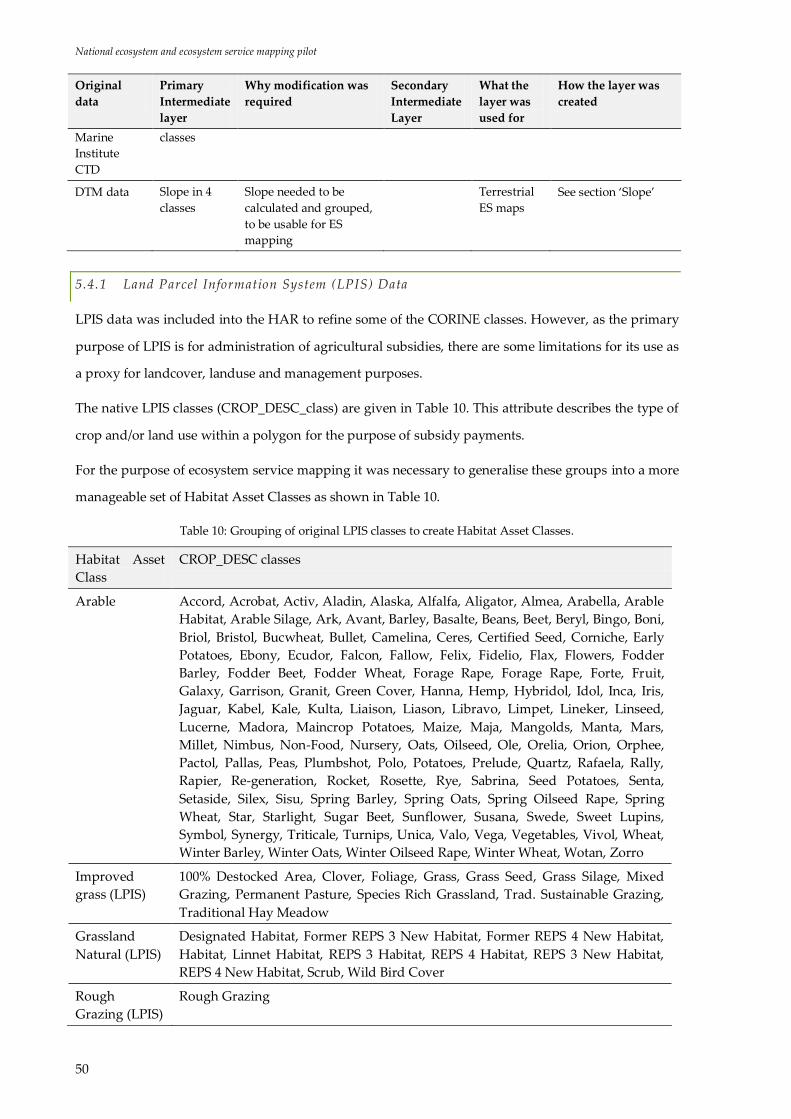
National ecosystem and ecosystem service mapping pilot
50
Original
data
Primary
Intermediate
layer
Why modification was
required
Secondary
Intermediate
Layer
What the
layer was
used for
How the layer was
created
Marine
Institute
CTD
classes
DTM data Slope in 4
classes
Slope needed to be
calculated and grouped,
to be usable for ES
mapping
Terrestrial
ES maps
See section ‘Slope’
5.4.1 Land Parcel Information System (LPIS) Data
LPIS data was included into the HAR to refine some of the CORINE classes. However, as the primary
purpose of LPIS is for administration of agricultural subsidies, there are some limitations for its use as
a proxy for landcover, landuse and management purposes.
The native LPIS classes (CROP_DESC_class) are given in Table 10. This attribute describes the type of
crop and/or land use within a polygon for the purpose of subsidy payments.
For the purpose of ecosystem service mapping it was necessary to generalise these groups into a more
manageable set of Habitat Asset Classes as shown in Table 10.
Table 10: Grouping of original LPIS classes to create Habitat Asset Classes.
Habitat Asset
Class
CROP_DESC classes
Arable Accord, Acrobat, Activ, Aladin, Alaska, Alfalfa, Aligator, Almea, Arabella, Arable
Habitat, Arable Silage, Ark, Avant, Barley, Basalte, Beans, Beet, Beryl, Bingo, Boni,
Briol, Bristol, Bucwheat, Bullet, Camelina, Ceres, Certified Seed, Corniche, Early
Potatoes, Ebony, Ecudor, Falcon, Fallow, Felix, Fidelio, Flax, Flowers, Fodder
Barley, Fodder Beet, Fodder Wheat, Forage Rape, Forage Rape, Forte, Fruit,
Galaxy, Garrison, Granit, Green Cover, Hanna, Hemp, Hybridol, Idol, Inca, Iris,
Jaguar, Kabel, Kale, Kulta, Liaison, Liason, Libravo, Limpet, Lineker, Linseed,
Lucerne, Madora, Maincrop Potatoes, Maize, Maja, Mangolds, Manta, Mars,
Millet, Nimbus, Non-Food, Nursery, Oats, Oilseed, Ole, Orelia, Orion, Orphee,
Pactol, Pallas, Peas, Plumbshot, Polo, Potatoes, Prelude, Quartz, Rafaela, Rally,
Rapier, Re-generation, Rocket, Rosette, Rye, Sabrina, Seed Potatoes, Senta,
Setaside, Silex, Sisu, Spring Barley, Spring Oats, Spring Oilseed Rape, Spring
Wheat, Star, Starlight, Sugar Beet, Sunflower, Susana, Swede, Sweet Lupins,
Symbol, Synergy, Triticale, Turnips, Unica, Valo, Vega, Vegetables, Vivol, Wheat,
Winter Barley, Winter Oats, Winter Oilseed Rape, Winter Wheat, Wotan, Zorro
Improved
grass (LPIS)
100% Destocked Area, Clover, Foliage, Grass, Grass Seed, Grass Silage, Mixed
Grazing, Permanent Pasture, Species Rich Grassland, Trad. Sustainable Grazing,
Traditional Hay Meadow
Grassland
Natural (LPIS)
Designated Habitat, Former REPS 3 New Habitat, Former REPS 4 New Habitat,
Habitat, Linnet Habitat, REPS 3 Habitat, REPS 4 Habitat, REPS 3 New Habitat,
REPS 4 New Habitat, Scrub, Wild Bird Cover
Rough
Grazing (LPIS)
Rough Grazing
National ecosystem and ecosystem service mapping pilot
51
Single value fields:
In order to create these Habitat Asset Classes, all single values were classed as Arable and Non-Arable
(for arable land use) and as Improved grass (LPIS), Grassland Natural (LPIS), Rough Grazing (LPIS),
and Non-grass (for pasture land use) (yellow section of Figure 14).
Multi value classes:
Polygons may contain multiple values per polygon, where the parcel has had multiple uses in the
given year, (e.g. Spring Barley, Maincrop Potatoes, Permanent Pasture). Where polygons contained
more than one value, a set of rules was used to determine which class they should be assigned to as
illustrated in the blue boxes for multi value fields in Figure 14:
For arable land use:
If the field lists different types of arable crops and no non-arable classes (e.g. Spring
Barley, Maincrop Potatoes, Vegetables) the whole field is classed as arable, as the
polygon as a whole is under Arable Rotation.
If the field lists one or more types of arable crops, but does also include non-arable
classes (e.g. Spring Barley, Maincrop Potatoes, Permanent Pasture) the whole field is
classed as Arable Mosaic, as only part of the polygon is under arable rotation.
If the field lists only non-arable classes, the field is classed as Non-arable.
For pasture land use:
If the field lists only different types of grassland that fall within the same grassland
class, the whole field is classed as this class.
If the field lists different types of grassland that fall within the same grassland class
and some non-grassland classes, the field is classed as mosaic of the grassland class
present
If the field lists only non-grassland classes, the field is classed as Non-grass.
If the field lists different types of grassland that fall within different grassland classes,
Improved grass (LPIS) takes precedence over Grassland Natural (LPIS) and Rough
Grazing (LPIS), because the improvement of part of the management unit will impact
upon adjacent areas. Similarly Rough Grazing (LPIS) takes precedence over Grassland
Natural (LPIS), as grazing in direct vicinity will impact on the natural grassland.
The same set of precedence rules applies to mosaics of grassland classes.
As the data does not record percentage cover of the individual classes, these classes are conservative
estimates. In case of a mix of an arable class and a grassland class, the area will appear as arable, even
though in reality 90% of the area could be grassland. However, in the final HAR only ~1.5% or
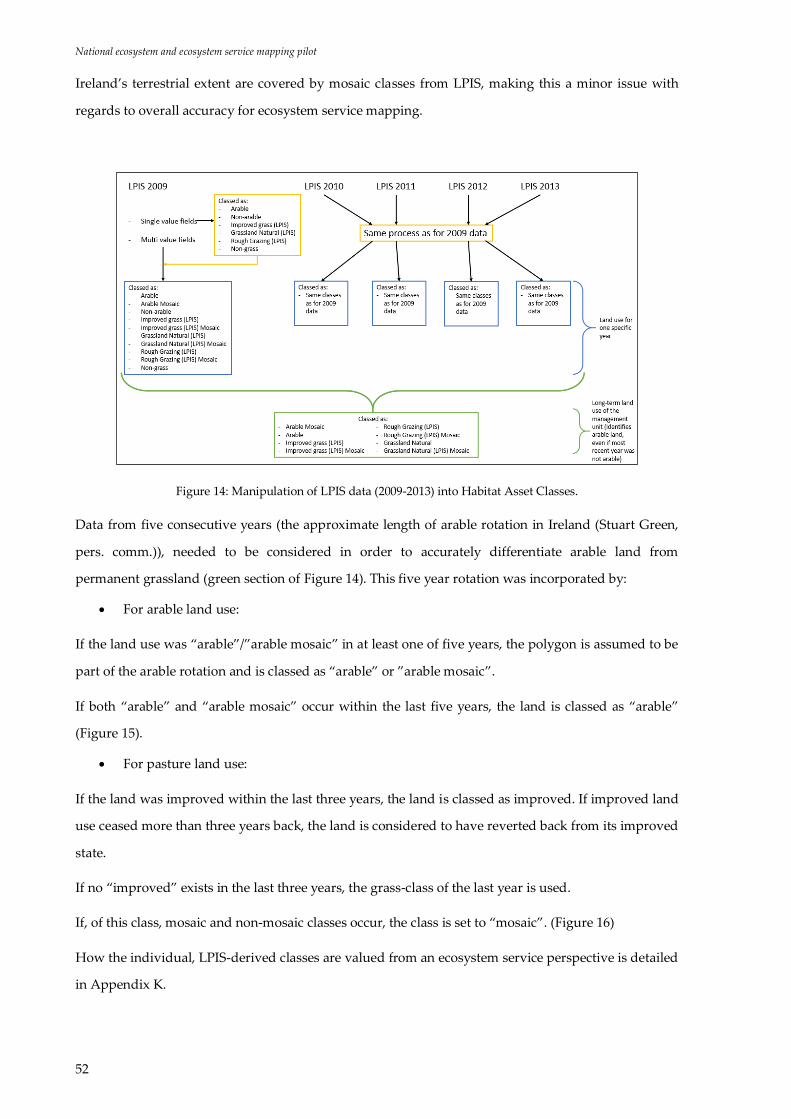
National ecosystem and ecosystem service mapping pilot
52
Ireland’s terrestrial extent are covered by mosaic classes from LPIS, making this a minor issue with
regards to overall accuracy for ecosystem service mapping.
Figure 14: Manipulation of LPIS data (2009-2013) into Habitat Asset Classes.
Data from five consecutive years (the approximate length of arable rotation in Ireland (Stuart Green,
pers. comm.)), needed to be considered in order to accurately differentiate arable land from
permanent grassland (green section of Figure 14). This five year rotation was incorporated by:
For arable land use:
If the land use was “arable”/”arable mosaic” in at least one of five years, the polygon is assumed to be
part of the arable rotation and is classed as “arable” or ”arable mosaic”.
If both “arable” and “arable mosaic” occur within the last five years, the land is classed as “arable”
(Figure 15).
For pasture land use:
If the land was improved within the last three years, the land is classed as improved. If improved land
use ceased more than three years back, the land is considered to have reverted back from its improved
state.
If no “improved” exists in the last three years, the grass-class of the last year is used.
If, of this class, mosaic and non-mosaic classes occur, the class is set to “mosaic”. (Figure 16)
How the individual, LPIS-derived classes are valued from an ecosystem service perspective is detailed
in Appendix K.

National ecosystem and ecosystem service mapping pilot
53
There are known issues with the use of LPIS as a proxy for habitat and land management. For
example the LPIS class Permanent Pasture includes areas that are used to grow grasses or other
herbaceous forage. These may be self-seeded or cultivated (DAFM, 2011 & 2015). However the
discrimination between areas that are sown from those that self-seed is important for the purposes
carbon sequestration, and also the discrimination of areas that are mown from those that are not.
Furthermore, this class can include a range of different habitat types and management intensities;
from improved grass dominated areas (such as productive rye grass swards) to less productive areas
which may be dominated by non-grass species such as heathers. Therefore permanent pasture class
could range from Fossitt GA1: Improved Grassland habitat to Semi natural grassland classes, Heath
classes and potentially Bog classes (GS, HH, PB), each of which may perform quite differently in
terms of different ecosystem services.
If, in the future, more suitable data on particularly pastoral land use was collected, this could further
improve the Habitat Asset Register. With currently available data, however, incorporating LPIS data
is the best available option. Figure 14 shows the workflow used to create one intermediate layer for
agricultural and one for pastoral land use from LPIS data.
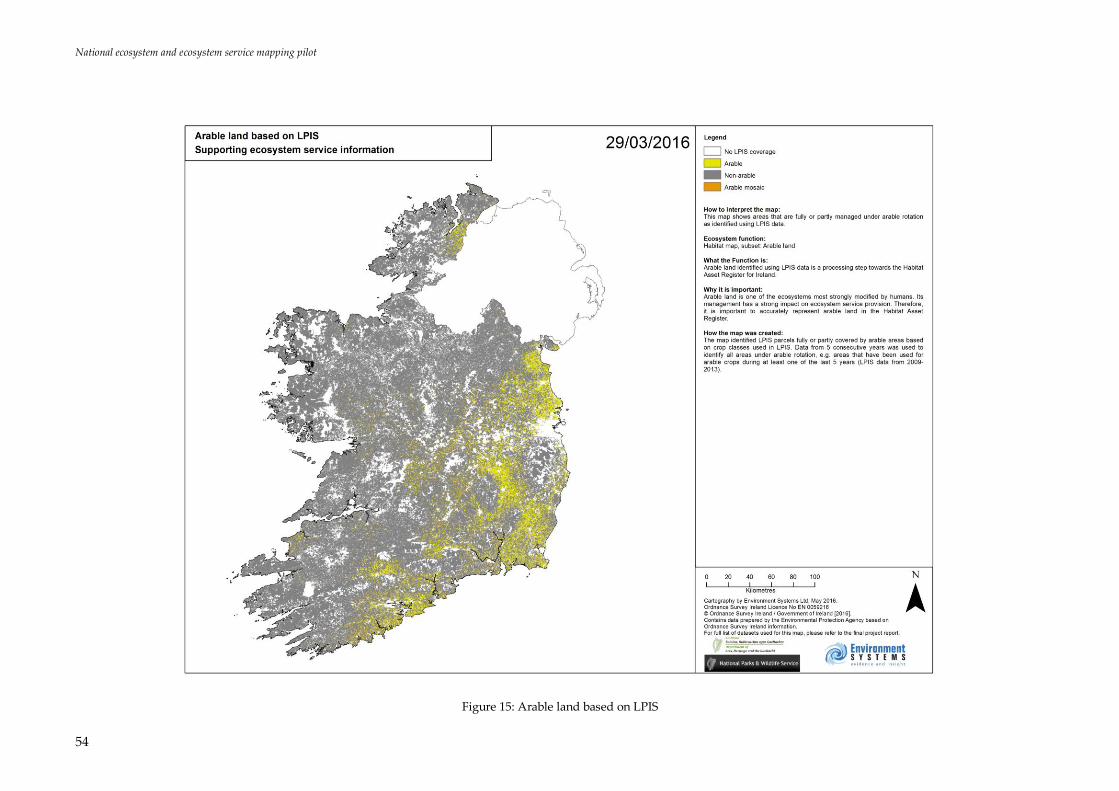
National ecosystem and ecosystem service mapping pilot
54
Figure 15: Arable land based on LPIS

National ecosystem and ecosystem service mapping pilot
55
Figure 16: Pasture land based on LPIS
National ecosystem and ecosystem service mapping pilot
56
5.4.2 Forest Inventory and Planning Systems (FIPS) data
Due to some corrupted data, the FIPS dataset from 2012 could not be used in its entirety. Therefore,
post-2007 entries from this dataset were merged into the 2007 dataset. Resulting slivers of polygon
overlap were removed (Figure 17)
The information recorded within the composite FIPS dataset (percentage cover of 30+ species) was
then grouped into classes relevant for a strategic scale map:
Broadleaved: Over 75% cover of broadleaved species
Coniferous: Over 75% cover of coniferous species
Mixed: Over 75% listed as ‘mixed’ in the original data or over 75% cover of coniferous and
broadleaved species combined
Scattered woodland: Over 20% woodland and less than 75% of any other classes, such as ‘BIO
– Biodiversity’
<20% woodland: Less than 20% woodland and less than 75% of any other classes, such as ‘BIO
– Biodiversity’
Cleared 1998: Field classes as ‘Cleared 1998’ in the original dataset
The 75% cut-off value is based on Fossitt Habitat Descriptions (Fossitt, 2000) of woodland habitats.

National ecosystem and ecosystem service mapping pilot
57
Figure 17: FIPS (Forestry Inventory and Planning System)
National ecosystem and ecosystem service mapping pilot
58
5.4.3 EU Habitats Directive – Habitat (Article 17) Data – Mosaic habitats
Article 17 data was provided as one shapefile per habitat. Areas with habitat mosaics are not recorded
as mosaic classes, but indicated through the overlap of shapefiles for two or more habitats. As mosaics
were considered important on a national scale, a layer spatially specifying the presence of mosaic
habitats was created based on the following Article 17 shapefiles:
4010: Wet heath
4030: Dry heaths
4060: Alpine and subalpine heath
7130: Blanket bog (active)
7140: Transition mires
7210: Cladium fen
7230: Alkaline fens
8110: Siliceous scree
8120: Eutric scree
8210: Calcareous rocky slopes
8220: Siliceous rocky slopes
Selection of datasets for inclusion in the Article 17 mosaic was based on the percentage cover of the
habitat. Where a habitat was confirmed through the dataset as being more than 95% cover, it was
excluded and included higher up in the conflation as a single habitat. The higher up in the order of the
conflation the more the dataset will supersede what has been included before it. This thereby ensures
that the most dominant Article 17 habitat with its specific ecosystem service provision is represented
(Figure 18).

National ecosystem and ecosystem service mapping pilot
59
Figure 18: Article 17 mosaics

National ecosystem and ecosystem service mapping pilot
60
5.4.4 Turlough data
Turloughs are an important Irish ecosystem (HD Annex I habitat) which has a major impact on several
ecosystem services. Therefore, it was decided to include them in the Habitat Asset Register despite no
comprehensive, spatially explicit dataset being available. The data used is a merge of two datasets.
One contains 22 turloughs mapped spatially explicitly for the NPWS by Trinity College Dublin.
Additionally, a point shapefile with information on 446 additional turloughs has been incorporated
after buffering the points based on the area attributed to each turlough; this approach ensures that
turloughs are included in the Habitat Asset Register to the best extent facilitated by the data available
at this time. However, there is a risk of Turloughs being misplaced based on a point location and of
area being under-represented (Figure 19).
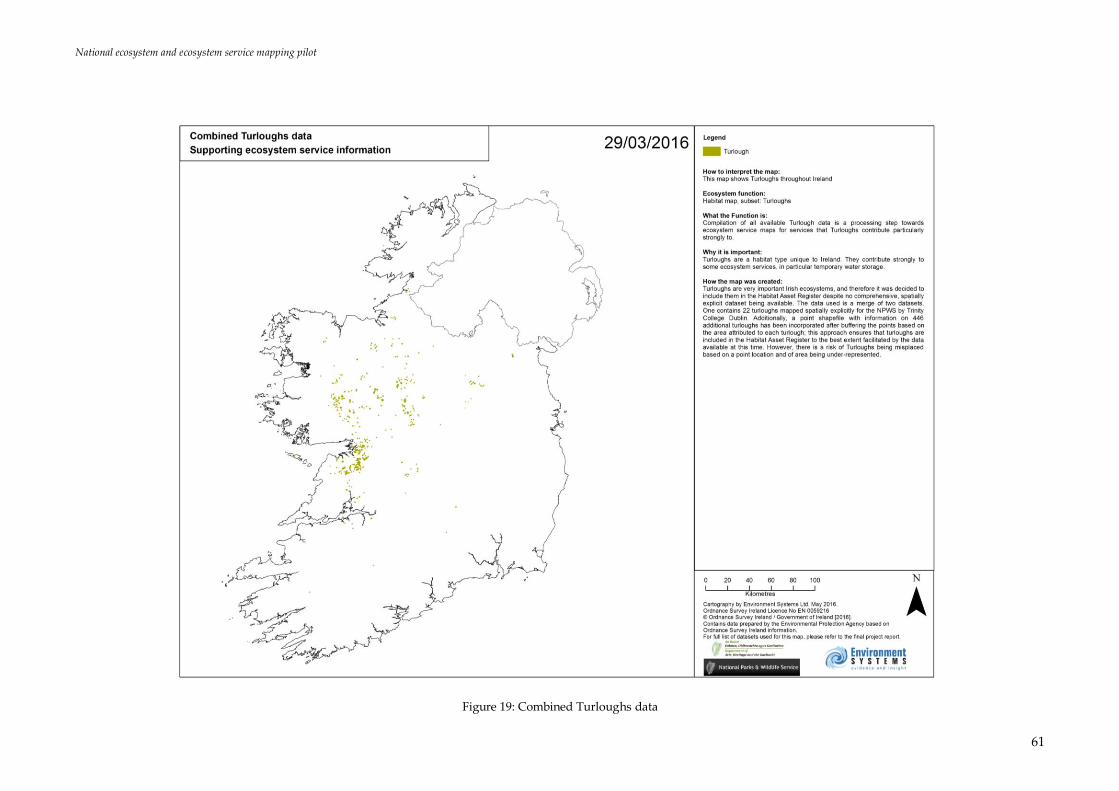
National ecosystem and ecosystem service mapping pilot
61
Figure 19: Combined Turloughs data

National ecosystem and ecosystem service mapping pilot
62
5.4.5 Species Coincidence Layer
Species records are direct observations of a species in an area and can aid in identifying species
hotspots within the landscape. Therefore, a layer was created to illustrate the coincidence of legally
protected species and a further layer of other species which are regarded as being of policy relevance
because they fall into one of the three IUCN threatened categories or are classed as amber or red on
the list of Birds of Conservation Concern for Ireland list. The coincidence layer combines national
distributions of over 1000 different species derived from over 1.5 million records. Each species was
associated with a national terrestrial grid of 50m*50m squares.
The coincidence is limited to terrestrial environment due to the lower availability of marine records
and the extreme mobility of many of the recorded marine species which means it is extremely difficult
to assign them to a specific geographic location.
The records were compiled from a number of data sources:
EU Article 17 data (Annex II, IV & V species distributions) (NPWS)
NBDC (National Biodiversity Data Centre) protected and threatened species data
Bat Data (Bat Conservation Ireland & NPWS)
Selected Bird Species (Birdwatch Ireland)
Bryophyte Data (NPWS)
Flora Protection Order Vascular Plants and Lichens (NPWS)
Freshwater mussel data (NPWS)
Mollusc data (NPWS)
Butterfly data (Regan et al., 2010; Asher et al., 2001; Fox et al., 2006)
Moth Data (Moths Ireland)
Odonata (Dragonflies) (Nelson et al., 2011)
Water Beetles (Aquatic Coleoptera) (Foster et al., 2009)
Molluscs (Byrne et al., 2009)
Bees (Fitzpatrick et al., 2006)
Mayflies (Ephemeroptera) (Kelly-Quinn and Regan, 2012)
The output layer does not take account of how many times an individual species has been recorded in
each unit, it only records its presence. This ensures that sufficient weight is given to rare, but
important species. Many grid squares contained multiple records for the same species; in these cases
the records were simplified to provide only a single record per cell.
In total, records for over 1000 species were incorporated to create a single layer. This involved
bringing together data that had originally been recorded at varying resolutions, from point data to

National ecosystem and ecosystem service mapping pilot
63
10km*10km polygons. In a first processing step, a single dataset was created for each species. In cases
where a species had been recorded both in a high (≤50m) and in a low resolution dataset (>50m) for
the same area, preference was given to high resolution data, with only the highest resolution record
being taken forward.
These datasets were then scored to reflect the resolution of the source data for the record. High
resolution records (species recorded at ≤50m) were scored at 300, whilst low resolution records
(species recorded at >50m resolution) were scored at 150. This means that the most accurate records
have a stronger impact on the score of the pixel, whilst lower resolution records acknowledge the
presence of a species in the general vicinity but do not have as strong an impact on the overall score.
After scoring, all of the individual species datasets were combined through addition, creating the final
layer of ‘species coincidence’ (Figure 20).
Two examples of scoring are given in Table 11.
Table 11: Scoring examples for creation of the species coincidence layer where: ‘records’ lists all species records
present within one 50m*50m area that forms one pixel in the final raster dataset. Record resolution relates to the
number of digits contained in the grid reference for the species record.
Grid cell 1 Grid cell 2
Records Score Records Score
Species 1 (at 50m)1 300 Species 1 (at 50m) 300
Species 2 (at >50m) 150 Species 6 (at 50m) 300
Species 3 (at 50m) 300 Species 7 (at 50m) 300
Species 4 (at 50m) 300 Species 8 (at 50m) 300
Species 5 (at >50m) 150
Total 1200 Total 1200
1 Species 1 also has a record at >50m resolution but the methodology excluded this record from the
coincidence layer to ensure consistency in the weighting process for each species
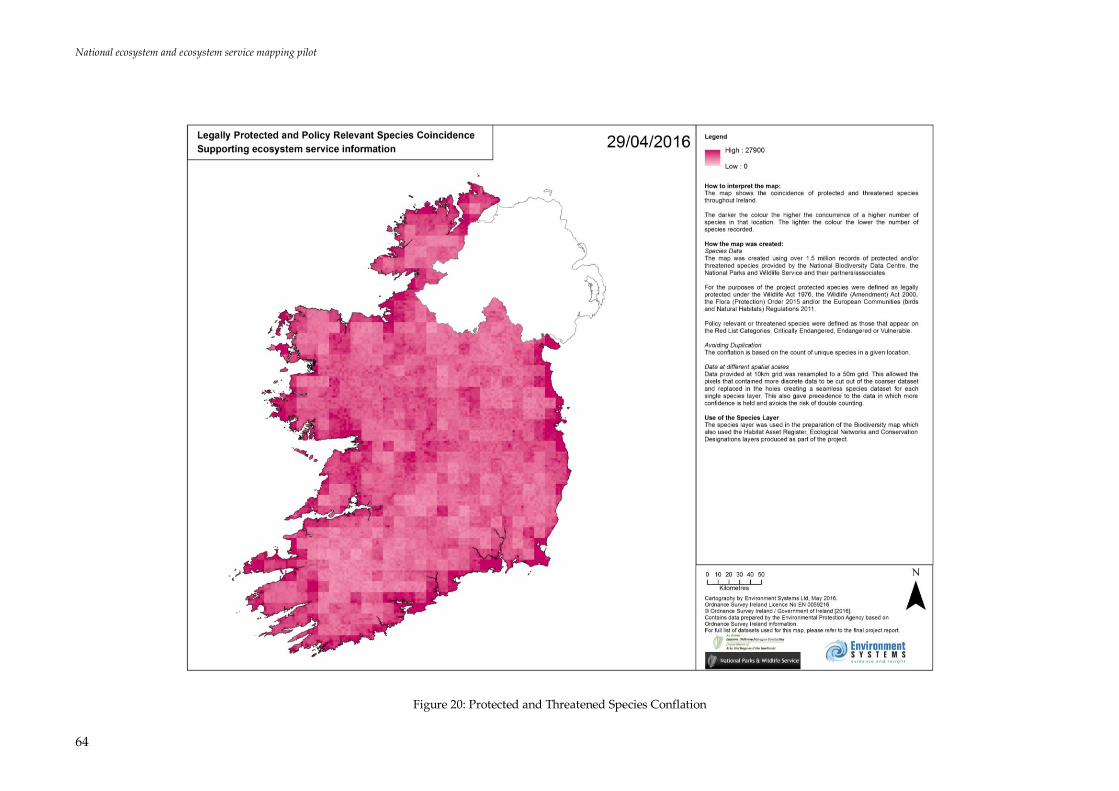
National ecosystem and ecosystem service mapping pilot
64
Figure 20: Protected and Threatened Species Conflation
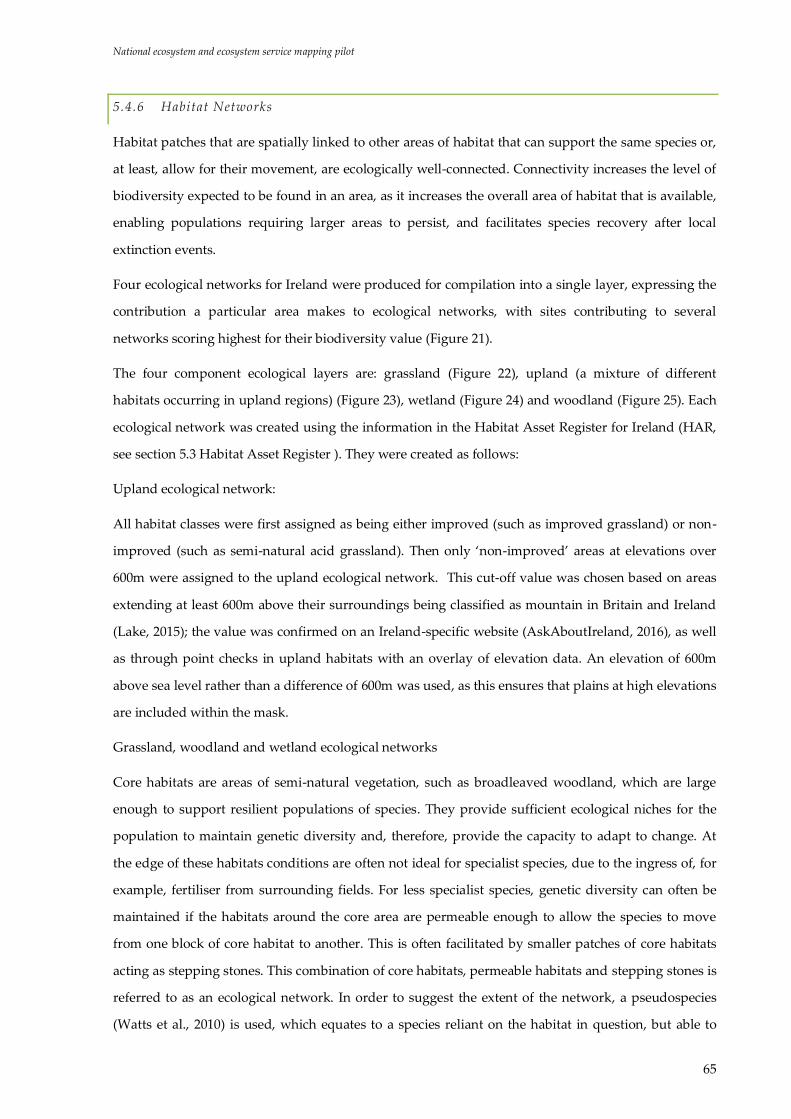
National ecosystem and ecosystem service mapping pilot
65
5.4.6 Habitat Networks
Habitat patches that are spatially linked to other areas of habitat that can support the same species or,
at least, allow for their movement, are ecologically well-connected. Connectivity increases the level of
biodiversity expected to be found in an area, as it increases the overall area of habitat that is available,
enabling populations requiring larger areas to persist, and facilitates species recovery after local
extinction events.
Four ecological networks for Ireland were produced for compilation into a single layer, expressing the
contribution a particular area makes to ecological networks, with sites contributing to several
networks scoring highest for their biodiversity value (Figure 21).
The four component ecological layers are: grassland (Figure 22), upland (a mixture of different
habitats occurring in upland regions) (Figure 23), wetland (Figure 24) and woodland (Figure 25). Each
ecological network was created using the information in the Habitat Asset Register for Ireland (HAR,
see section 5.3 Habitat Asset Register ). They were created as follows:
Upland ecological network:
All habitat classes were first assigned as being either improved (such as improved grassland) or non-
improved (such as semi-natural acid grassland). Then only ‘non-improved’ areas at elevations over
600m were assigned to the upland ecological network. This cut-off value was chosen based on areas
extending at least 600m above their surroundings being classified as mountain in Britain and Ireland
(Lake, 2015); the value was confirmed on an Ireland-specific website (AskAboutIreland, 2016), as well
as through point checks in upland habitats with an overlay of elevation data. An elevation of 600m
above sea level rather than a difference of 600m was used, as this ensures that plains at high elevations
are included within the mask.
Grassland, woodland and wetland ecological networks
Core habitats are areas of semi-natural vegetation, such as broadleaved woodland, which are large
enough to support resilient populations of species. They provide sufficient ecological niches for the
population to maintain genetic diversity and, therefore, provide the capacity to adapt to change. At
the edge of these habitats conditions are often not ideal for specialist species, due to the ingress of, for
example, fertiliser from surrounding fields. For less specialist species, genetic diversity can often be
maintained if the habitats around the core area are permeable enough to allow the species to move
from one block of core habitat to another. This is often facilitated by smaller patches of core habitats
acting as stepping stones. This combination of core habitats, permeable habitats and stepping stones is
referred to as an ecological network. In order to suggest the extent of the network, a pseudospecies
(Watts et al., 2010) is used, which equates to a species reliant on the habitat in question, but able to

National ecosystem and ecosystem service mapping pilot
66
move through sufficiently permeable habitats from one patch of core habitat to another. This allows
the functional network to be described, which will be relevant to most of the species of interest. In
addition, the network can also be regarded as the best place to re-instate habitats. This is because seed
banks, relevant pollinator species and soil microbial communities are all near enough to move into the
newly established habitat and create a functioning community in a relatively timely manner.
To create the three ecological networks, all habitats in the HAR were first assigned as ‘core’ or ‘non-
core’ for the network in question. It should be noted that a particular patch of core habitat might be
assigned to more than one type of ecological network. For example, wet grassland can be core habitat
both for the grassland network and for the wetland network; so the core networks may overlap in
some areas.
Utilising GIS layers, a cost-distance model was used to calculate how difficult it is for species
associated with each core network to move between habitats surrounding the core habitat, with
difficulty depending on the distance to the next patch of core habitat and on the type of habitat it
moves through. The type of habitat is incorporated on the basis of permeability scores given to all
non-core habitats. These scores express how usable the type of habitat is for pseudo-species associated
with the network of interest, with some types of habitats forming barriers against species movement
(such as roads and water).
Within the output from the cost-distance model, a cut-off value was determined, beyond which
movement becomes so difficult for the species group that the area is considered to not form part of the
network. The cut-off values are aimed to create habitat belts around the core patches that approximate
to the maximum dispersal distance of species associated with the habitat (Table 12).
The resulting networks were reviewed visually by local experts and, following consultation,
permeability scores were reviewed, networks re-calculated, and final cut-off values determined.
Table 12: Approximate maximum dispersal distances (m) of species associated with different habitat types; table
adapted from Bowe et al. (2015).
Network type Maximum Dispersal
Distance (m)
Broadleaved woodland 750
Grasslands (non-acid, non-
improved)
500
Heathland and Acid Grassland 600
Fen, Marsh and Swamp 400

National ecosystem and ecosystem service mapping pilot
67
Figure 21: Contribution of land to potential ecological networks
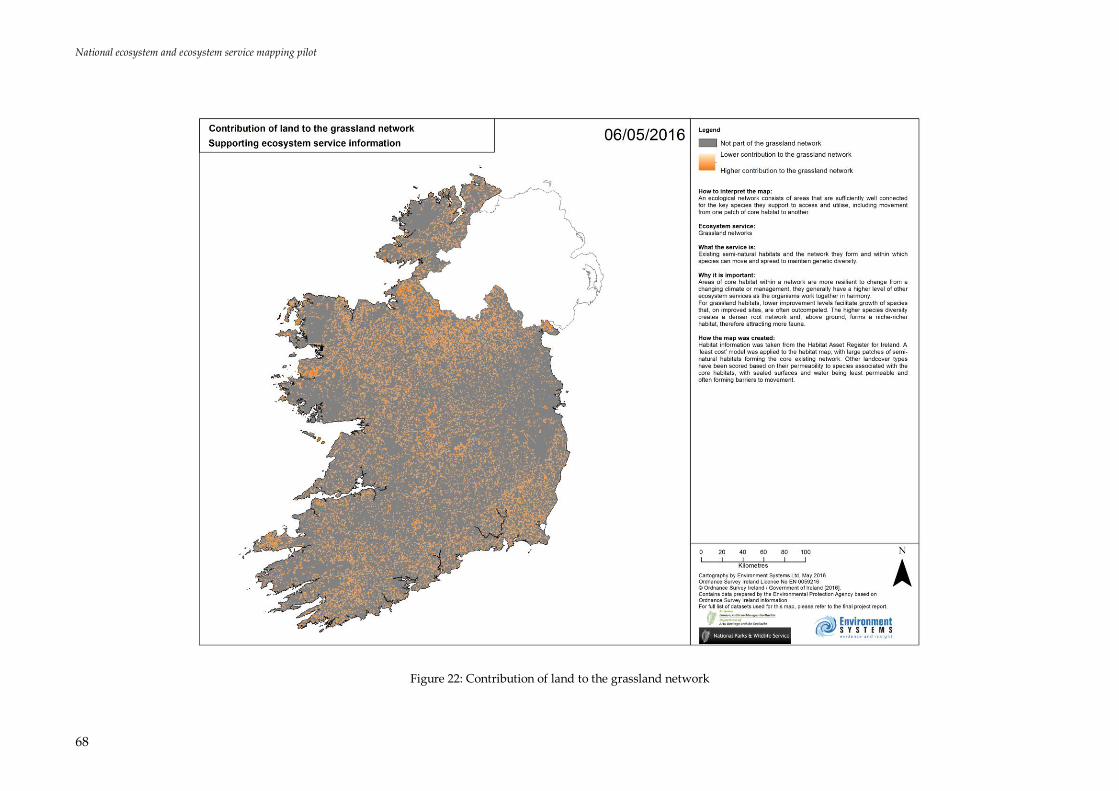
National ecosystem and ecosystem service mapping pilot
68
Figure 22: Contribution of land to the grassland network

National ecosystem and ecosystem service mapping pilot
69
Figure 23: Contribution of land to the upland network

National ecosystem and ecosystem service mapping pilot
70
Figure 24: Contribution of the land to the wetland network

National ecosystem and ecosystem service mapping pilot
71
Figure 25: Contribution of the land to the woodland network

National ecosystem and ecosystem service mapping pilot
72
5.4.7 Designated Sites Layer
Designated sites are in place to help ensure appropriate management to protect biodiversity and they
indicate locations where some of the best functioning ecosystems throughout Ireland can be found.
However, the actual level of protection varies between designations.
In order to reflect the value arising from management under designated status, a combined weighted
designated sites layer was created. Higher scores were assigned for areas afforded more protection
and specifically targeting biodiversity conservation. The scoring system used is summarised and
described in Table 13 and reflects the tiered structure of international, national and local wildlife
designations that reflect the expected value of the land for biodiversity.
Table 13: Scores given to different designation types for creation of the designations layer.
Designation Score
Special Protection Areas (SPA) 4
Special Areas of Conservation (SAC) 4
Natural Heritage Areas (NHA) 4
Wildfowl Sanctuary 2
Proposed Natural Heritage Areas
(pNHA)
2
Refuge for Fauna 2
National Park +1 Modifier
Nature Reserve +1 Modifier
A file combining Special Protection Areas (SPAs), Special Areas of Conservation (SACs), Natural
Heritage Areas (NHAs), Wildfowl Sanctuaries, Proposed Natural Heritage Areas (pNHAs) and
Refuges for Fauna was created. The lowest scored layer was used as base layer. The base layer was
then overwritten by higher ranking layers, so that the higher ranking designations superseded lower
ranking ones. Additionally, a modifier layer was created, with the value 1 in areas covered by
National Parks and/or Nature Reserves. These two layers were added using raster maths to create and
output with all areas being scored between 0 (no designations) and 5 (SPA/SAC/NHA that is managed
for conservation in a National Park/Nature Reserve).
If an area is part of both the SPA and SAC network, the score is still 4, as being part of both networks
is not considered to increase the overall level of protection afforded.
Refuges for Fauna were provided as a point file. In order to rasterise the point file, as a rough
approximation the points were buffered by the radius required to create polygons equal in size to the

National ecosystem and ecosystem service mapping pilot
73
area of the Refuge. Size of area was generated either form the attribute table or from information on
the protected site.
This intermediate layer (Figure 26) is provided to inform the reader as to the level of protection
offered by each area of the Irish environment. It is intended to be used to aid interpretation of the
other layers.
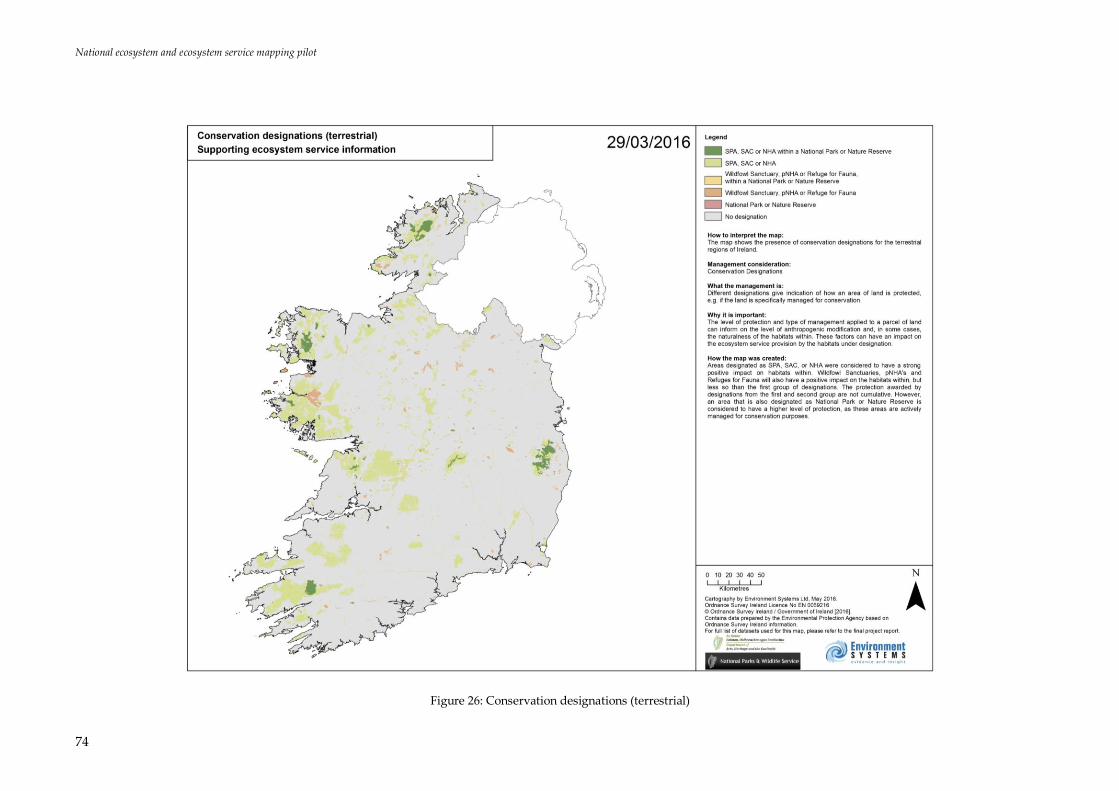
National ecosystem and ecosystem service mapping pilot
74
Figure 26: Conservation designations (terrestrial)

National ecosystem and ecosystem service mapping pilot
75
5.4.8 Bathymetry
Bathymetry for the marine area of interest was derived primarily from the INFOMAR survey
(INtegrated Mapping FOr the Sustainable Development of Ireland's MArine Resource (INFOMAR).
Where data gaps existed CTD (Conductivity, Temperature, Depth) point data collected by the Marine
Institute to form a depth profile was interpolated to form a depth profile. The interpolated data covers
6.2% of the total marine AOI; these areas can be seen as the NoData areas in the INFOMAR data layer.
The resulting, seamless layer was then re-classified to form two depth classes: “Shallow (<10m)” and
“Deep (>10m)” (Figure 27).
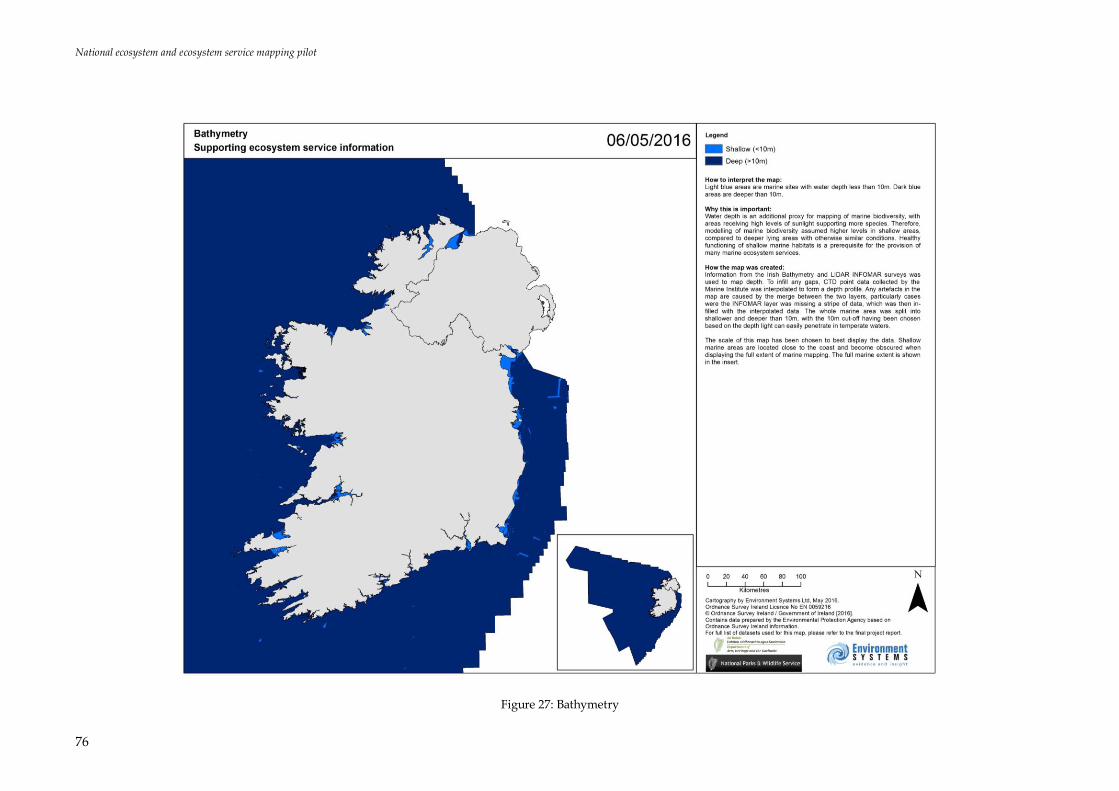
National ecosystem and ecosystem service mapping pilot
76
Figure 27: Bathymetry
National ecosystem and ecosystem service mapping pilot
77
5.4.9 Slope
For the terrestrial area of Ireland a seamless DTM layer was created from 5,000m2 IfSAR tiles at a
resolution of 5m (Intermap Technologies Inc.). The slope was calculated in ENVI. Slope is one of the
main key underlying factors used in the SENCE approach to ecosystem service mapping, as it relates
to the functioning of a wide variety of ecosystem services. For example it affects how the land can be
used agriculturally, as well as being strongly correlated to the movement of water through the
landscape. For detailed information on which maps used landform as a proxy, refer to the indicator
documents provided alongside the report / in Appendix L.
The resulting, seamless slope layer was re-classified to form groups based on cut-off values used for
agricultural land classification (MAFF, 1988) (Figure 28).

National ecosystem and ecosystem service mapping pilot
78
Figure 28: Slope

National ecosystem and ecosystem service mapping pilot
79
5.5 Rule-Base Development
The project utilised a rule-base approach to map and combine individual elements of ecosystem services, i.e.
different data layers. This provides a stepped approach to building a representation of the whole or part of a
complex ecosystem interaction.
The rule-base assessment is based on indicators which interact in different ways for the services under
consideration. These indicators, for each parcel of land, are predominantly based on:
The type of land cover (e.g. woodland or heathland)
The soil and geology underlying the site
The position of the land parcel in the landscape (e.g. on a steep slope or valley bottom next to a river
or distance from an urban area)
The management regime or designation applying to the site (e.g. intensive, extensive, little active
management or designation, such as SAC or NHA).
These are considered as major indicators of ecosystem services. For some ecosystem service maps supporting
data is also used which provides an additional indicator of ecosystem services provision. They provide
information about, but are not direct measurements of, the service of interest. For example, due to its
inherent biophysical properties, woodland slows down water flow through the landscape and provides a
natural flood control measure. Thus, despite not containing direct measures of retention time, a woodland
would be scored as being of higher importance to natural flood control than, for example, amenity
grassland. Based on habitat data, the mapped output from the GIS model for ‘Land temporarily storing water’
would, therefore, consider service provision in wooded areas to be higher than in other areas. In this way, all
attributes contained in the datasets chosen for mapping of a service are treated as indicators of service
provision and are jointly considered by the GIS model to produce a final map based on all available
indicators (see section ‘5.6 Creation of ecosystem service maps’).
The rule-base is designed to be transparent and transferable. It uses scientific knowledge to score each
ecosystem indicator using expert interpretation of the datasets used. The weightings are retained in a tabular
format and the same approach can be applied to model and map other ecosystem services or for application
at a different scale. The approach is iterative in nature which can be applied using standardised parameters
or can be adapted using local knowledge.
For each ecosystem service, a rule-base was developed to determine:
the specific attribute information of each dataset considered important for mapping that service;
the relative value to be assigned to the different classes of each element to enable mapping;
if applicable, weightings required when different datasets are to be combined.
National ecosystem and ecosystem service mapping pilot
80
Appendix L outlines the technical, scientific understanding underpinning each of the indicators mapped.
Table 14 illustrates how the rule-base describes the scoring of the datasets pertaining to potential soil carbon
storage, demonstrating how these data attributes can be used to build up a representation of the ecosystem
service being analysed. Expert knowledge on soil carbon richness was used to construct the rule-base.
In order to account for the fact that mapping is based on indicators, rather than direct measurements,
certainty tables are created to illustrate our understanding of the indicator in relation to the service of
interest. To do so, three primary questions are addressed:
How much do is known about the contribution of the indicator towards the ecosystem service
provision?
How much does the indicator influence the ecosystem service?
How good is the data available to map the indicator?
In response to these questions, all indicators were scored for certainty into three levels; high, medium and
low. This was completed for each respective dataset with the following descriptions:
High - meaning a lot is known about the indicator and knowledge is well-documented, for example, in
many books and textbooks; the data has good coverage at a suitable scale for the project, and/or the
indicator has a high amount of influence on the service being mapped.
Moderate - meaning something is known about the indicator, there is some scientific literature (e.g.
within journals), but there might not be a general consensus; the data may have really high resolution
data of discrete features but is only available for part of the area to be mapped, and/or the indicator,
although specific, does not actually, as far as is understood at present, contribute a huge amount to the
goods and benefits received from the service.
Low - meaning the indicator is not well-understood as it has not been researched in detail and there is
not a great deal of scientific literature available to help us understand the contribution of the indicator to
the ecosystem service, and/or the spatial data available is old, has very little coverage or is at a scale
which requires manipulation and could lose detail (i.e. it is not a good fit, but is all that is available at the
time).

National ecosystem and ecosystem service mapping pilot
81
Table 14: Rule-base scoring example (Soil carbon)
Data name Attribute
heading 1
Attribute 1 Soil
Carbon
Score
Legend (generic)*
BasemapIE_IG
_Q1_08
(OSI Prime 2)
HAR: L1 - L2
Built environment -
Built environment
Minor
negative
Connolly
Derived
Peatland Map
HAR: L1 - L2
Blanket bog - Low-
level
Very
high
Slope Classes
Slope
>18°
Major
negative
Saltmarsh
Monitoring
Project
HAR: L1 - L2
Semi-natural
grassland - Coastal
grassland mosaic
Moderate
Article17 -
21A0
HAR: L1 - L2
Machair - Machair
High-
very high
*Generic legend on left most column illustrating the full range of potential classes for outputs (ie not specific to Soil
carbon attribute scorings).
5.5.1 Steering Group Consultation on Rule-Bases
Following the second stakeholder workshop in November 2015, the second iteration of rule-bases for each
ecosystem service to be mapped was prepared and sent out to members of the Steering Group for comment.
The consultation package included a set of maps of the ecosystems service provision together with
information on:
The CICES class represented by the map;
The position of the service being mapped within the ES Cascade;
Information on what the ecosystem service being mapped is;
The indicators generated from GIS attribute data to map the service;
Information on how the map was created;
How the map was scored or weighted based on the influence of each indicator for that service;
A proxies and limitations spreadsheet for each ecosystem service.

National ecosystem and ecosystem service mapping pilot
82
On review of the consultation package, comments were prepared by the steering group members. The
comments were collated to identify specific messages and to adapt the scoring and use of data based on the
more local and expert knowledge of ecosystems from the steering group members. Using the collated
comments, the GIS models for each service were adapted to create a revision of each map.
5.6 Creation of ecosystem service maps
After scoring the key factors and supporting indicators, including any intermediate layers (see section ‘5.4
Primary Intermediate Layers’), they are then combined in an overlay analysis (Figure 29). For example:
woodland may have a positive influence on the regulation of water quality, as can organic soil (in good
condition) – they have been scored highly. However, steeply sloping land promotes overland flow and is not
good for natural control of water quality – this attribute was given a low score. In combination, the area
would have a medium to high rank for its contribution to water quality control, based on the exact steepness
of the slope and the type of woodland. Negative scores assigned to attributes that reduce provision of a
service, e.g. intensively managed arable land reducing water quality, will appropriately reduce the overall
value during the overlay analysis.
Figure 29: Schematic representation of the overlay analysis used in the SENCE approach to ecosystem service mapping;
this process describes how the information from different key factor layers is combined to obtain information on
ecosystem service delivery within each parcel of land.

National ecosystem and ecosystem service mapping pilot
83
6. Mapping outputs
Figure 30: Project approach – tools, considerations and steps detailed in this section.
The maps are modelled approximations of our best estimates of the situation at the current time with the
data available. The maps have been created from available data at strategic scales (as opposed to local scale
mapped with detailed input data). Therefore, any proposed action on individual sites will need to be
assessed at a site level, using available or creating more detailed information appropriate for supporting
decisions at that scale. If individual site surveys are undertaken, the results should be fed back into a
regional or localised model to help enhance the spatial understanding of ecosystem services in that area.
Ecosystem services are primarily based on natural, biophysical characteristics, which generally do not align
with administrative and management units, which may determine the distribution of beneficiaries.
Approaches to mapping ecosystem services and the data from which to create maps are constantly evolving.
Where further research and data becomes available, the mapping models can be revisited and updated
utilising new knowledge and data.

National ecosystem and ecosystem service mapping pilot
84
As per prioritisation during stakeholder consultation, selected ecosystem services were modelled using the
SENCE tool to create maps of:
Land temporarily storing water (Ecosystem service: Regulation of flows (Regulating))
Areas of land promoting good water quality (Ecosystem service: Regulation of water quality)
Terrestrial food (Ecosystem service: Nutrition from crops, livestock and wild foods)
Terrestrial biodiversity: Habitats, management, ecological networks, and species (Function:
Naturalness, support of systems and species, and resilience)
Marine areas that provide food (Ecosystem service: Marine food (Provision))
Marine biodiversity: Habitats and management (Function: Naturalness, support of systems and
species, and resilience)
Carbon storage maps
Carbon storage as an ecosystem service is of high interest due to its impact on climate change. Carbon
sequestration describes the process of gaseous carbon being removed from the atmosphere, by, for example,
being incorporated into the biomass of fresh vegetation growth. The carbon retained within the currently
existing vegetation biomass is the carbon stored in this vegetation. With vegetation die-off, carbon stored in
plants is incorporated into the soil profile; the carbon is thus stored in the soil, as well as in the vegetation.
Similarly, carbon is stored in marine sediments, which, if at sufficient depth, can form areas of long-term
carbon storage, i.e., the carbon stored in this manner is unlikely to be released for a long time. Generally,
carbon sequestration refers to the process of carbon being removed from the atmosphere and being
incorporated into another medium. Carbon storage refers to the carbon currently present within said
medium. Maps produced during this project model the latter of the two.
- Soil carbon (Ecosystem service: Regulation of greenhouse gases (carbon))
- Vegetation carbon (Ecosystem service: Regulation of greenhouse gases (carbon))
- Marine carbon (Ecosystem service: Regulation of greenhouse gases (carbon))
Each of these maps is created based on relative comparison, rather than showing ecosystem service
provision in an absolute sense. The scoring system (see Section ‘Rule-Base Development’) says, for example,
that one habitat contributes much more to the provision of the service than another habitat does. In that
sense, the final outputs are meant to be interpreted as showing relative ecosystem service provision. The
areas shown as being of the highest value on the maps have been modelled as contributing the most to the
provision of this service within Ireland and are, therefore, Irish hotspots of ecosystem service provision for

National ecosystem and ecosystem service mapping pilot
85
the service in question. This means that without further quantification, no direct comparison between
different maps for carbon storage can be made; each map will be highlighting where in Ireland provision of
the three types of carbon storage is highest / lowest, but how much carbon ‘highest’ means in tonnes is, at
this stage, unquantified.
Due to the strong impact urban areas have on ecosystem service provision, two small areas of compromised
data in the OSi buildings layer showed distinctly on the ecosystem service maps produced. To avoid these
areas showing as sites of disbenefit to the service, the areas of compromised data are shown in black on all
maps affected.
Note – Whilst the Habitat Asset Register (HAR) is based on the best data currently available, it does
contain some inherent limitations due to the manner in which LPIS categorises permanent pasture.
This may lead to an underestimation of semi-natural grassland and heaths. For details, please refer to
the section on data gaps and the section on the preparation of LPIS data for usage in the HAR.
While the scorings assigned in the Rules-base are qualitative, as these are related to spatial distributions it is
possible to quantify the areas assigned each of the qualitative classes. Therefore, in addition to the maps,
charts are supplied that help the reader to see the overall contribution of various areas to each service within
Ireland. In order to create these charts, the continuous data on ecosystem service provision shown on the
map is grouped into classes, such as ‘neutral’ (= modelling showed the service to not be provided, but there
is also no disbenefit), ‘ES provision’ (= modelling showed an average amount of provision), or ‘ES provision
hotspot’ (= exceptionally high ecosystem service provision was modelled, within the range of values
obtained for this service).
The area coverage (as % of terrestrial or marine area) for each class is calculated. In combination with the
maps, the charts help to see both how the provision of one service is in Ireland overall, but also how
provision is distributed. For example, for one service, 80% of the area might be falling into the class ‘ES
provision’, 10% into ‘Disbenefit’, and 10% into ‘Some ES provision’. This would show that this service is
provided consistently throughout Ireland, with some sites that are negative for this service. For another
service, 20% might be falling into the class ‘Strong disbenefit’, 20% into ‘Neutral’, 40% into ‘ES provision’,
and 20% into ‘ES provision hotspot’. This would indicate a much patchier distribution of the service, with
some areas being very valuable (and possibly of importance for the provision of this service on a national
level), whilst other areas have a strong detrimental effect on the provision of the service in question.

National ecosystem and ecosystem service mapping pilot
86
For information regarding attributes of input layers having been scored as disbenefits for a service, please
refer to the excel Rule-bases provided as part of the supplementary material for this project as described in
the introductory chapter, Table 1.
6.1 Land Temporarily Storing Water
6.1.1 Summary
The map (Figure 31) indicates the spatial variation in the capacity of land to regulate the flow of water,
through interception of rainfall through the vegetation canopy (CICES Ireland sub-Classes Mitigation of
Peak Flows) and through the absorption of rainfall into the soil (CICES Ireland sub-Class Water Storage).
The capacity of land to regulate the flow of water will become increasingly important with greater climate
variability and associated risk of flooding and drought (as indicated in the policy & pressure matrix,
Appendix F).
The main factors determining this capacity are topography, geology, soil, vegetation and land use. Steeper
topography results in faster movement of water overland, whilst on gently sloping and flat land, the speed
of water flow slows. Porous rocks allow water to be absorbed, helping retain water below-ground rather
than the rainfall remaining on the surface and contributing to run–off. Similarly, deep soils with a moderate
to high organic matter content also absorb water, reducing the amount that can form overland flows. The
more complex the structure of the vegetation, the higher the interception of rainfall and the more the energy
in the water is dissipated and slowed before it reaches the ground. Land without vegetation cover, for
example arable areas before or after cropping, or sealed surfaces, provide a very rapid pathway for water to
move.
In terms of the spatial distribution of this service, approximately 90% of the country has been classified as
either providing, providing strongly, or forming hotspots of service provision (Figure 32). Areas of lower
provision for water regulation (classified as Disbenefit (1.25 %) or Some Disbenefit (1.69 %)).are mostly
associated with areas of bare ground and sealed surfaces

National ecosystem and ecosystem service mapping pilot
87
Figure 31: Map: Land Temporarily Storing Water

National ecosystem and ecosystem service mapping pilot
88
Figure 32: Contribution of Ireland’s terrestrial areas to temporary water storage (%); note that, as the map is coloured
across a colour gradient, whilst values have been grouped for the graph, colours do not exactly correspond between the
two.
6.1.2 How the input data relates to these results
The project ‘Rules-base’ (MS Excel file) details the model inputs and qualitative weightings for the service.
Further explanation for the rationale behind the scientific reasoning for the scoring system can be found in
the indicator documents (Appendix L).
Above ground vegetation coverage and structure influence the transit of precipitation, and scores reflect the
complexity of the structure of the vegetation. Soil moisture retention is influenced by multiple biological,
physical and chemical properties of the soil; its organic matter content, depth, aspect, and slope as well as its
management history. The score in the ‘Rules-base’ reflects these features. Underlying geology influences
both soil characteristics, structure and topography and will determine the capacity of the rock itself to hold
water, these features are reflected in the scores given. For topography, the lowest scores are given on highly
sloping and poorly vegetated areas and the highest scores in areas with gentle slopes and full vegetation
cover. The highest scores for habitats are awarded to native woodland with understorey, a shrub layer and
tall canopy trees, as these provide the highest level of interception. Aquifers also have a strong role in water
retention and are scored highly as a result.

National ecosystem and ecosystem service mapping pilot
89
The map illustrates the spatial variation in the combination of these factors, with potential service provision
being lowest in non-vegetated sealed areas (urban areas) and for land with very steep slopes with little
vegetation cover in the uplands. The raised bog areas and the wooded valleys show as the areas of highest
provision. Floodplains are also areas of high provision, especially where there are complex vegetation
structures (e.g. woodland or a high density of hedges) because they can hold water in storm events.
Although these areas may themselves flood at times, they slow the flow of water, avoiding or delaying the
speed at which water reaches downstream areas. This can be an important service for towns and cities near
the outflow of rivers where the impact of flooding can be severe.
6.1.3 How the map relates to other maps produced
The degree that water is intercepted or continues as overland flow will have an influence on the removal or
contribution of pollutants in solution or suspension in water. Therefore, there is a relationship between the
potential ‘Regulation of Flows’ service with that of ‘Regulation of Water Quality’. This due to the fact that
areas with a high rate of overland flow (generally sealed areas or steep areas) have a greater chance of
encountering pollutants on the surface when the water is in a high state of energy. These pollutants can then
become suspended in the water and can be transported into the river systems. On shallower slopes with
vegetation cover, rainfall is more easily absorbed into the soil which aids the purification of the water
through interactions with soil chemistry and biological action of the roots.
Areas of steeply sloping land or where there are areas of sealed surfaces show that there is correspondence
between low Mediation of Water Flow and low ‘Regulation of Greenhouse Gases: Soil Carbon Storage’.
Steep slopes do not store water well and provide little opportunity for soils to form carbon stores.
6.1.4 Data and knowledge gaps associated with this map
The data used includes habitat cover, soils, geology and topography as these provide a good indication of
factors that determine how water is naturally stored by different ecosystems. The ‘Rules-base’ could be
improved by considering the following data gaps:
The ‘Rules-base’ does not incorporate the effects of precipitation. Rainfall data could be incorporated
to identify which catchments have a both a high precipitation and low flow regulation potential
relative to residential areas to model flood risk.
The map does not model where the potential flow of water will occur. Inclusion of data such as
catchment boundaries and drainage networks (e.g. non-river channels that water flows through after
heavy rainfall events) could be incorporated to determine exactly where water will travel through
the landscape.
National ecosystem and ecosystem service mapping pilot
90
The depth of soils including knowledge of soil profiles could add a greater level of detail to the
mapping of this service.
See also section on mapping limitations inputs.
6.2 Water Quality (of Freshwater)
6.2.1 Summary
The map (Figure 33) indicates the spatial variation in the potential for areas of land to influence water
quality (CICES sub-class Ireland ‘Terrestrial & freshwater habitats which provide nutrient retention and pH
buffering’).
Water quality regulation (including sedimentation) varies relative to the combined spatial variation in
substrates, slope, vegetation type and land use. Some soil types filter water as it percolates through (e.g.
alkaline clay-loams), whilst others (e.g. peat) add to the suspended particulate matter and mineral burden of
the water. In addition, slope is a key influencing factor, as steep slopes shed water more rapidly than
shallow slopes. Faster flowing water has higher energy and is able to carry more particulate matter (picked
up from the land surface) within it.
Some plant species (e.g. reeds) assist with water purification, taking-up ions selectively and reducing
chemical pollution. In addition, plant roots trap and prevent particulate matter reaching water courses.
Intensive arable cropping can increase the pollution burden; areas of bare soil are more susceptible to
erosion and also have the potential for high inputs of inorganic fertilizers, pesticides and herbicides. In
addition, areas which are grazed by livestock, and in particular areas where livestock have free access to the
water courses add to contamination through poaching of the land and input of faecal coliforms.
This map considered particulate matter and general buffering capacity. The lowest provision is associated
with arable land, urban areas and unvegetated peat, which erodes easily (with organic material being carried
in the water giving it a brownish colour without extensive treatment). Sites with calcareous, porous rock and
extensive aquifers generally have good filtration as the chemistry of the rocks helps purify the water as it is
stored underground.
The breakdown of service provision by area shows that almost half of the country (49.87%) has been
classified as having ES Provision for this service, and a further 16% Strong ES Provision, while only 0.42%
were classified as being hotspots for provision (Figure 34). Areas classified as either Disbenefit or Some
Disbenefit amount to c9%, with these areas potentially contributing to the pollution burden of freshwater to
some degree.

National ecosystem and ecosystem service mapping pilot
91 Figure 33; Map: Water Quality (of Freshwater)

National ecosystem and ecosystem service mapping pilot
92
Figure 34: Contribution of Ireland’s terrestrial areas to water quality regulation (%) regarding sedimentation; note that,
as the map is coloured across a colour gradient, whilst values have been grouped for the graph, colours do not exactly
correspond between the two.
6.2.2 How the input data relates to these results
The project ‘Rules-base’ (MS Excel file) details the model inputs and qualitative weightings for the service.
Further rationale behind the scientific reasoning for the scoring system can be found in the indicator
documents (Appendix L).
National spatial data representing the key factors influencing water quality have been combined to develop
a qualitative potential distribution of the service. The key factors in the ‘Rules-base’ broadly include
vegetation (modelled through the Habitat Asset Register). Vegetation with deep root systems or vegetation
where the dominant species has a strong role in nutrient cleaning (e.g. reeds) are scored as high potential
provision. The substrate (incorporated through a combination of soils, sub soils, geology and aquifer data)
are scored; with alkaline, porous soils on extensive aquifers having the highest scores as the soil and rock
chemistry in these areas will facilitate the removal of particulate matter and other pollutants from the
system. Shallower slopes are scored with a high level of provision as water moving slowly has less energy
and is therefore less likely to carry sediment and pollutants. For the influence of grazing land, the Habitat
Asset Register and designations network data were used; with the lowest scores being on improved
grassland likely to be carrying high numbers of livestock. More precise data on land management would
greatly assist the accuracy of this proxy score (see data gaps below).

National ecosystem and ecosystem service mapping pilot
93
The areas of highest provision for this service are most strongly concentrated in a band along the west of the
country (Figure 33). The areas of disbenefit are located in major cities and in the more intensive / arable
farming areas in the east of the country. Areas where peat is likely to be unvegetated and therefore eroding
can also been seen on the map in the centre of Ireland. In areas scored similarly for all other supporting input
data, outlines of some of extensive aquifers can be distinguished on the map given their additional impact in
storing water allowing pollutants to be deposited in rocks.
6.2.3 How the map relates to other maps produced
There is a relationship between the ‘Regulation of Water Quality’ and the service ‘Regulation of Flows’. This
is due to the interaction between slope and vegetation/soil type on steep or non-porous areas with little
vegetation. Here water generally moves faster giving a low value for flow regulation and with the potential
energy to pick up more particulate matter giving a low value for Regulation of Water Quality.
There is also some correlation of areas of high provision on this map with the ‘Regulation of Greenhouse
Gases (Vegetation Carbon). This is due to the fact that the habitats storing the most carbon are generally
those with the deepest rooting systems which trap more water and remove more pollutants.
6.2.4 Data and knowledge gaps associated with this map
This map aims to model the national spatial variation in the potential for regulating and maintaining water
quality. The data used includes habitat cover, soils, geology and topography and proxies for management
information. It does not model the complexities of the different pathways and vectors for individual
pollutants such as nitrogen or phosphorus. More detailed modelling work at catchment level is being
undertaken by EPA for the Water Framework Directive examining these specific pathways. The model could
be improved by considering the following data gaps:
Incorporation of stocking density data, linked to LPIS parcels would considerably enhance the
output by providing an indication of risk of pollution from livestock rearing. However, this was not
feasible with the data available and the time constraints of the project. Mapping stocking density,
where stock has access to the river system would further refine the model.
Point sources of pollution have not been considered and would help complete the picture to identify
disbenefit hotspots.
See also section on mapping limitations.

National ecosystem and ecosystem service mapping pilot
94
6.3 Soil Carbon
6.3.1 Summary
The map (Figure 35) illustrates the spatial variation in potential soil carbon storage service (CICES sub-class
for Ireland ‘Areas Important for Emissions Reduction’). Carbon storage is of importance due to its potential
to mitigate climate change impacts (see Appendix F). Carbon sequestration describes the process of gaseous
carbon being removed from the atmosphere and stored in the soil. Carbon storage refers to the carbon
currently present within the soil. This map models the potential for carbon storage in the soil.
The amount of carbon stored in a system is primarily influenced by the physical and chemical properties of
soil, which determine its capacity to store carbon. Habitats, through the vegetation present, also play a role
in soil carbon storage in that vegetation provides the main source of carbon input into the soil system. Slope
and management have a small effect, this is because soil on very steep slopes retains less carbon and because
land which is cropped each year (where the above ground vegetation is removed from the system),
especially where managed with inorganic fertilisers, will lose carbon from year to year.
Roughly 25% of the terrestrial area of Ireland is classed as being of highest potential provision and are
associated with peatlands or semi-natural woodland (Figure 36, classes Strong ES Provision, ES Provision
Hotspot). 62% of the country potentially provides a moderate level of carbon storage (class ES Provision)
due to the soils being rich in organic compounds and stabilised year round through permanent vegetation
cover, i.e. areas of permanent grassland. These factors facilitate a stable soil profile with a generally medium
to high organic component, as roots and dead litter material from the vegetation provide a constant input of
carbon to the system which is broken down by the soil fauna and stored as soil organic carbon. Areas of
lower provision (classes Neutral, Some Disbenefit and Disbenefit) are associated with urban areas, bare
ground, bare rock, clear-felled forests or ploughed sites.

National ecosystem and ecosystem service mapping pilot
95
Figure 35: Map: Soil Carbon

National ecosystem and ecosystem service mapping pilot
96
Figure 36: Contribution of Ireland’s terrestrial areas to soil carbon sequestration (%); note that, as the map is coloured
across a colour gradient, whilst values have been grouped for the graph, colours do not exactly correspond between the
two.
6.3.2 How the input data relates to these results
The project ‘Rules-base’ (MS Excel file) details the model inputs and qualitative weightings for the service.
Further rationale behind the scientific reasoning for the scoring system can be found in the indicator
documents (Appendix L).
The soil data has a very strong influence on the model for soil carbon storage, with organic soils having the
highest provision. Where these soils are coincident with semi-natural habitats with a high potential for
additional vegetation carbon entering the system, hotspots of ecosystem service supply occur. These areas
have been scored as high provision in the ‘Rules-base’. Conversely, paved or sealed surfaces have no
potential to accumulate carbon by sequestration from the atmosphere or through decomposition of organic
matter and are scored as neutral as they do not have an impact on the service. Areas of cropping where
carbon is frequently removed from the system are shown as a disbenefit, as are areas of potential eroding
peat where organic material is being removed from the system. Where bare ground exists, soil erosion is a
potential risk, which can, in some cases, cause the release of carbon back into the atmosphere. Steep slopes
have a strong influence and can be identified on the map, as in these areas there is an increased erosion risk
leading to loss of carbon from the eroded soils.
National ecosystem and ecosystem service mapping pilot
97
The map (Figure 35) shows a variation on a north west- south east axis. The north and west of Ireland
generally has a much stronger role in carbon sequestration in the soil than the south east where arable
farming and less organic rich soils are present which store less carbon.
6.3.3 How the map relates to other maps produced
Regulation of greenhouse gases (Vegetation Carbon): The amount of carbon stored in vegetation has some
correspondence with that stored in soil, as vegetation is the primary mechanism by which carbon enters the
soil system. However, there are certain differences; the soil carbon map shows the highest scoring in areas
where anaerobic conditions together with semi-natural bog and mire habitats are growing peat. By contrast,
in the vegetation carbon map the largest concentration of vegetative carbon occurs on an aerobic medium
such as deep brown soils which support broadleaved woodlands.
Regulation of greenhouse gasses (Marine Carbon): Despite the fact that the marine and terrestrial maps both
record potential carbon sequestration, they are difficult to compare as the carbon cycle in each environment
is very different, with separate drivers and pathways based on the difference of the main medium of
delivery (air and water). The mechanism for carbon sequestration is distinctly different in air and water as
each medium has very different chemical and physical properties. The land supports a higher carbon
accumulation than the ocean as much primary productivity in the terrestrial environment is undigested and
therefore enters the decomposer cycle and is stored. In the marine environment the major proportion of
primary productivity is consumed, digested, and assimilated into higher trophic levels and comparatively
little enters the decomposition phase of the cycle to be stored (Chapin et.al., 2011).
‘Nutrition for crops, livestock and wild foods’: Areas with higher amounts of soil carbon storage capacity
are often associated with sites with little soil disturbance. These areas are mostly extensively managed for
grazing, and are therefore areas of lower agricultural production. These areas are of higher importance for
regulating carbon through soils.
Biodiversity: Regulation of carbon through soils shows a degree of correspondence with areas of higher
biodiversity. This is likely to be a consequence of the accumulation of higher amounts of organic matter in
undisturbed systems which are also those most likely to be more natural, with many different niches
developing over time which support a high degree of structure, species diversity and resilience.
6.3.4 Data and knowledge gaps associated with this map
As outlined above, this map aims to model the national spatial variation in the potential for carbon storage
in the soil. The data used includes soil; geology and habitat cover together with topographic information.
National ecosystem and ecosystem service mapping pilot
98
The maps currently indicate storage of carbon in the soil system rather than the sequestration potential. The
model could be improved by considering the following data gaps:
Information on the depth of the soil layer (in particular for organic soils) which influences how
much carbon is stored is not incorporated into the current model due to lack of data; this would
greatly enhance the model.
Information on peatland condition. Disturbance of peatlands is particularly important for terrestrial
soil carbon, as peat forms probably the most abundant source of the carbon in the terrestrial
environment, however when disturbed it turns from a carbon sink into a carbon source. This lack of
data on peatland condition may be addressed through EPA STRIVE funded SCAMPI project.
Land use, and in particular permanence of grasslands, are important factors. However, there are
limitations with the use of LPIS as a proxy in this regard (see section on mapping limitations and
data gaps).
Soil and habitat condition also determine the capacity of soil to store carbon but this was not
available nationally.
Erosion is a major factor determining how stable the soil profile is. Slope and habitat in conjunction
form an additional indicator (soil erosion) which could be modelled to increase the overall accuracy.
See also section on mapping limitations and data gaps.
National ecosystem and ecosystem service mapping pilot
99
6.4 Vegetation Carbon
6.4.1 Summary
The map (Figure 37) illustrates the spatial variation in potential carbon storage in vegetation across Ireland.
This comprises part of the CICES sub-class for Ireland ‘Areas important for emissions reduction’. Carbon
storage in vegetation is of importance due to its potential to mitigate climate change impacts (see Appendix
F). Carbon sequestration describes the process of gaseous carbon being removed from the atmosphere.
Carbon storage refers to the carbon currently present and stored within the vegetation. Maps produced
during this project model carbon storage in vegetation.
Naturally, habitats, and the dominant species present in each, have the strongest link to this service.
However soil, topography and management also have an impact on the vegetation, and influence the model
to some degree. The highest regulation of carbon in vegetation is associated with permanent, high-biomass
habitats, particularly broadleaved woodland. A large proportion of Ireland’s terrestrial area is covered by
permanent vegetation cover, including land used for grazing. This permanent grazing land provides a
relatively high potential for vegetation carbon storage, particularly through storage in the extensive network
of plant roots which develops under such conditions.
Figure 38 shows c. 88% of Ireland’s terrestrial area is classified as ES Provision (82%) or Some ES Provision
(6.32%) of carbon stored in vegetation, however only c.2% is classified as the strongest provision (Strong ES
Provision) and is mostly associated with ancient woodland on deep brown soils with multiple layers of
vegetation and large mature trees several centuries old. Approximately 10% of areas are classified as Neutral
provision, Some Disbenefit or Disbenefit. These are associated with sealed surfaces and land under arable
rotation. In these areas, fertiliser input facilitates fast removal of carbon from the atmosphere through
photosynthesis, but the vegetative biomass created is removed frequently, therefore carbon vegetation
storage is relatively low or negative.

National ecosystem and ecosystem service mapping pilot
100
Figure 37: Map, Vegetation Carbon

National ecosystem and ecosystem service mapping pilot
101
Figure 38: Contribution of Ireland’s terrestrial areas to vegetation carbon sequestration (%); note that, as the map is
coloured across a colour gradient, whilst values have been grouped for the graph, colours do not exactly correspond
between the two.
6.4.2 How the input data relates to these results
The project ‘Rules-base’ (MS Excel file) details the model inputs and qualitative weightings for the service.
Further rationale behind the scientific reasoning for the scoring system can be found in the indicator
documents (Appendix L).
The primary data source for this output is the Habitat Asset Register, with highest provision in semi-natural
woodland habitats, which are given the highest score. Areas of land designated under conservation policy
are likely to contain higher vegetation biomass and less impacted soil than the same habitat without
protection, as they are likely to be subjected to less anthropogenic disturbance. They therefore indicate areas
likely to store higher amounts of carbon within vegetation than unprotected areas of the same type.
Arable land shows clearly as low provision areas on the map, as this is one of the only land cover types
where vegetation, and the associated carbon, are removed frequently. These therefore have the lowest score
in the model. The distribution of more natural habitat in the north-west contrasts on the map with the more
arable areas in the south-east of the area.

National ecosystem and ecosystem service mapping pilot
102
6.4.3 How the map relates to other maps produced
The relationship between the 3 modelled outputs relating to carbon sequestration; ‘Regulation of greenhouse
gases (Soil Carbon)’, ‘Regulation of greenhouse gases (Vegetation Carbon)’ and ‘Regulation of greenhouse
gases (Marine Carbon)’ maps is explained in the section on soil carbon relationships. The key difference
between soil and vegetation carbon is due to the fact that the highest storage of carbon in vegetation is found
in woodland, whereas for soil carbon the highest storage is found in peat.
Food Provision & Regulation of Water Quality: Areas contributing strongly to food provision show as
disbenefits to vegetation carbon, as the harvesting of crops also removes the carbon. In addition to the
removal of crops, the use of fertilisers and herbicides to increase yields also affects water quality in areas of
arable production. There is therefore a negative relationship between these maps and vegetation carbon.
Biodiversity: Regulation of vegetation carbon shows a degree of correspondence with areas of higher
biodiversity. This similarity can be expected given the accumulation of higher amounts of organic matter in
undisturbed systems which are also those most likely to be more diverse with many different niches
developing over time that support a high degree of structure, species diversity and resilience.
6.4.4 Data and knowledge gaps associated with this map
This map aims to model the national spatial variation in the potential for carbon storage in vegetation. The
data used includes the Habitat Asset Register, soils, geology and topographic information. The maps
currently indicate storage of carbon in the vegetation system rather than the sequestration potential. The
model could be improved by considering the following data gaps:
Habitat cover as an indicator for vegetation carbon storage could be enhanced with nationwide data
on the condition of semi-natural habitats. Direct measurements of biomass cover and density, for
example, for ancient woodlands with understorey and ground flora will contain more vegetation
carbon than semi-mature plantation woodland with no understorey.
Data on the extent of hedgerows throughout the agricultural matrix of Ireland could further enhance
modelling of vegetation carbon, as the woody vegetation of the hedgerows is one of the main
contributors to vegetation carbon storage within an agricultural landscape.
See also section on mapping limitations.

National ecosystem and ecosystem service mapping pilot
103
6.5 Terrestrial Food
6.5.1 Summary
The map (Figure 39) shows the contribution the land of Ireland makes to food production considering crops,
livestock and wild foods. This map models a combination of CICES sub-classes for Ireland under the
Provisioning class ‘Nutrition from crops, livestock and wild foods’. These are: grain crops, pollinated crops,
market vegetables, dairy and beef cattle, sheep, wild plants, fruits and fungi, wildfowl, terrestrial game birds
and deer.
Nutrition is a key service, but is part of a bundle of services, all of which need to be considered in decision
making when considering competing land use interests.
The map is largely modelled from the information on habitats using the Habitat Asset Register using the
association between habitats and the agriculture and wild animals they are likely to support. Topography
and management information are also pertinent and are included in the model as they affect the type and
intensity of the agricultural enterprises.
As Ireland’s predominant land use is agriculture, 71% of the terrestrial area can be categorised as potentially
providing “Ecosystem Service provision” or “Strong Ecosystem Service provision” (Figure 40). Areas of
strong food provision (approximately 9%) correspond primarily to land being cultivated for cropping, with
land with improved grasslands used for dairying or more intensive livestock rearing having a moderately
high value. Other areas, in particular semi natural areas, have a higher potential for provision of wild foods
(wild plants, fruits and fungi, wildfowl, game birds, deer) but at a lower output than farmed areas.
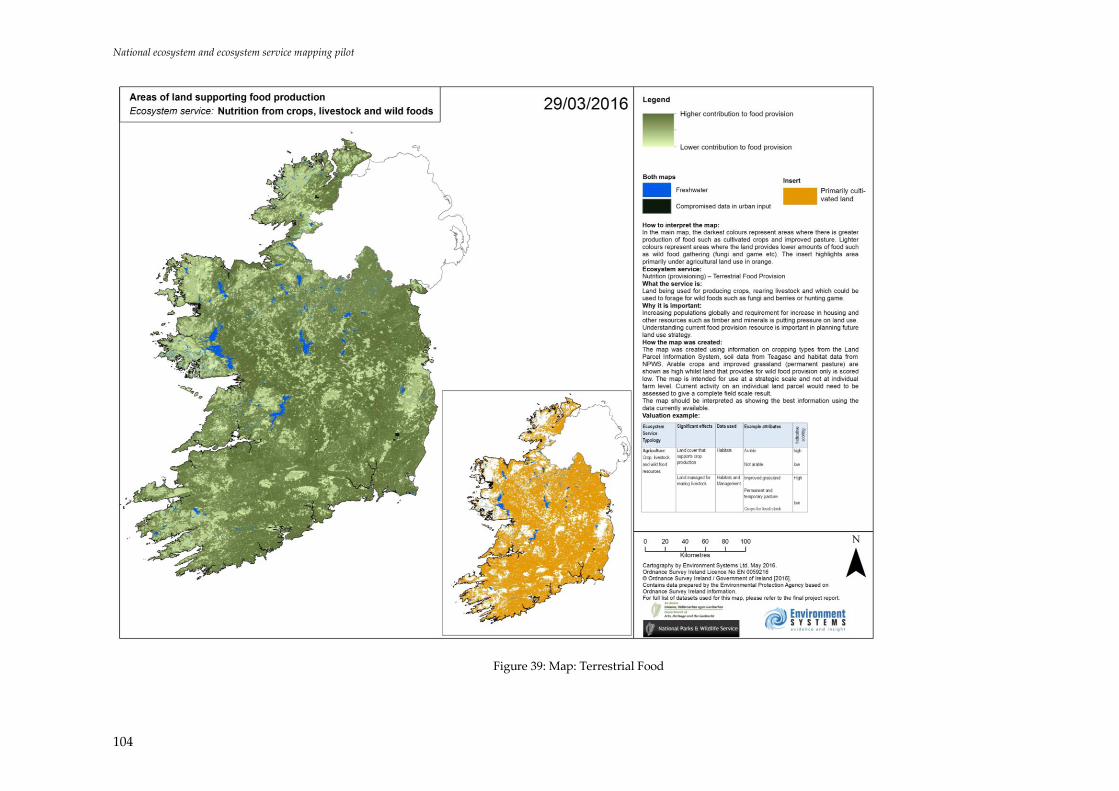
National ecosystem and ecosystem service mapping pilot
104
Figure 39: Map: Terrestrial Food

National ecosystem and ecosystem service mapping pilot
105
Figure 40: Contribution of Ireland’s terrestrial areas to food provision (%); note that, as the map is coloured across a
colour gradient, whilst values have been grouped for the graph, colours do not exactly correspond between the two.
6.5.2 How the input data relates to these results
The project ‘Rules-base’ (MS Excel file) details the model inputs and qualitative weightings for the service.
Further rationale behind the scientific reasoning for the scoring system can be found in the indicator
documents (Appendix L).
The data is strongly influenced by the Habitat Asset Register and, specifically, the LPIS data contained
therein. Areas that have been identified as arable land using LPIS show as the highest provisioning areas
with the highest scores. Semi-natural habitats and conservation designation sites show as having a lower
contribution to the supply of this ecosystem service as these areas are likely to either have lower intensity
grazing regimes or may be limited to wild food provision only.
6.5.3 How the map relates to other maps produced
There is a broad inverse relationship between food provision and ‘Regulation of Water Quality’. This is
because high intensity agriculture has a greater risk of causing negative impacts on water quality through

National ecosystem and ecosystem service mapping pilot
106
the input of pesticides, inorganic fertilisers and herbicides. The areas in the high scoring for food provision
show a similar pattern to areas of lower potential service provision for water quality regulation.
There is a broadly inverse relationship between the spatial distribution of areas of higher food provisioning
and those areas of higher ‘Biodiversity’ potential, modified to a degree by the potential for wild food yield
from semi natural areas. Intensively managed areas tend to contain monocultures and are therefore
intrinsically less biodiverse supporting far fewer species, genetic diversity and being less resilient than
natural complex systems.
6.5.4 Data and knowledge gaps associated with this map
This map aims to model the national spatial variation in the potential for food provision based on the likely
agricultural and wild food provision associated with different habitats and land use types. The model could
be improved by considering the following data gaps:
The model relies heavily on LPIS to distinguish arable areas from other farmed grasslands. However
there can be considerable variation in the management and yield amongst these categories, more
exact data on farming systems would greatly enhance the model.
The outputs would also be improved through inclusion of stocking density and type at farm or
parcel level, and also by inclusion of data on crop type, crop and yield (and which may vary within
a single year for the same area).
Spatial information on hunting bags and seaweed harvesting would improve the modelling of the
wild food elements if available.
Note that this map has been prepared at a strategic level and is not suitable at localised detailed
scales showing individual holdings or fields.
See also section on mapping limitations.

National ecosystem and ecosystem service mapping pilot
107
6.6 Terrestrial Biodiversity
6.6.1 Summary
Figure 41: Map, Terrestrial biodiversity, shows the contribution the land of Ireland makes to terrestrial
biodiversity considering habitats, networks, management and species information. It is a map of CICES
Function rather than an ecosystem service. This function has been modelled as it provides valuable
information for decision making, as biodiversity underpins the functioning of the environment. Natural and
semi-natural communities provide resilient ecosystems, regulating the functions of the environment (such as
carbon and water cycling) and contain both genetic and often, but not always, species diversity; both above
and below ground. The map also provides an opportunity to identify sites where this function could be
enhanced by specific management or restoration action, by, for example joining two areas of high
biodiversity to from a larger, more resilient patch.
The map has been modelled considering information of the Habitat Asset Register for habitat information. It
is underpinned by models of functional ecological networks, as these are considered important factors to
model and map. This is due to the fact that they have the potential to provide useful spatial information on
the biophysical characteristics within these networks, and also the fact that the resilience of habitats within
the networks is enhanced as genetic diversity through species movement is facilitated within them (see
‘Habitat Network Section’ under ‘Primary Intermediate Layers’). Biological networks for Ireland were
calculated for broadleaved woodlands, non-acid and non-improved grasslands, heathlands and acid-
grasslands and fen, marsh & swamp. Areas where management is undertaken to preserve the biodiversity
were considered. The coincidence of species of conservation interest (see section ‘Species Coincidence Layer’
under ‘Primary Intermediate Layers’) has been incorporated as a proxy indicator of well-functioning
systems.
Areas that are assigned the highest value for biodiversity functions are those areas where there is a
coincidence of relevant factors, such as the presence of semi-natural habitats falling within ecological
networks (where genetic movement is supported) and are associated with high species diversity or include
species of importance (i.e. protected or priority species). Based on the combination of factors, the area has
been categorised into a set of 4 classes ranging from some provision to ‘ES’ provision hotspot. Just under 1%
of the landmass has been classified into the highest class (ES Provision hotspot) while 95% of the remaining
area has been categorised as Strong (24%) or ES Provision (71%). Built areas, including which sealed or
artificial surfaces, make the lowest potential contribution to biodiversity.

National ecosystem and ecosystem service mapping pilot
108
Figure 41: Map, Terrestrial biodiversity

National ecosystem and ecosystem service mapping pilot
109
Figure 42: Contribution of Ireland’s terrestrial areas to biodiversity (%); note that, as the map is coloured across a colour
gradient, whilst values have been grouped for the graph, colours do not exactly correspond between the two.
6.6.2 How the input data relates to these results
The project ‘Rules-base’ (MS Excel file) details the model inputs and qualitative weightings for the service.
Further rationale behind the scientific reasoning for the scoring system can be found in the indicator
documents (Appendix L).
Management and land cover have a strong influence on the resulting map, with areas of semi-natural habitat
showing as being of high biodiversity value, and arable land and intensively managed grassland showing as
lower biodiversity value. The results are also influenced by records of species of conservation interest and
areas of land that contribute to one or more ecological networks; this causes a range of contribution to
biodiversity value being modelled for land within the same habitat type. The effect of soil type had a small
impact as the potential below ground diversity of soils can be significant. The greatest biodiversity provision
is found in semi-natural habitats that contribute to several networks, co-occurring in areas managed for
biodiversity enhancement, and which are associated with selected species
The map shows the strongest scores in the most semi-natural habitats towards the west of the country and in
the raised bogs in the central areas. The urban areas show as lower scored areas (Figure 41: Map, Terrestrial
biodiversity).
3.62
71.24
24.46
0.68
Some provision
ES provision
Strong ES provision
ES provision hotspot

National ecosystem and ecosystem service mapping pilot
110
6.6.3 How the map relates to other maps produced
This map is related to the other services as it shows a key function of the environment of Ireland. However,
the function has strongest affinity with the following services:
‘Nutrition from crops, livestock and wild foods’: Areas of high biodiversity interest correspond to areas of
lower food provision. However, within the agricultural matrix, biodiversity value can vary greatly based on
the intensity of the farming system in place.
‘Regulation of greenhouse gases (Soil Carbon)’: Areas of high soil carbon for the most part fall within sites of
high biodiversity value. Exceptions are semi-natural habitats that are not associated with organic and/or
thick layers of soil.
‘Regulation of greenhouse gases (Vegetation Carbon)’,: Areas which store much carbon in vegetation
coincide with high biodiversity areas, as they tend to be formed on well-established natural systems with
long lived plants, such as ancient woodland.
6.6.4 Data and knowledge gaps associated with this map
This map aims to model the national spatial variation in biodiversity. With the data available, this map is
focused on looking at the diversity of the entire landscape, considering habitats in the context of their
function in networks. It also built on the concept of using biodiversity conservation/ management as a proxy
for ecosystem health/ condition, looking at position in relation to networks and presence of indicator species
as a proxy for resilience. The model could be improved by considering the following data gaps:
Habitat condition is significant in the functioning and resilience of the natural communities as it
influences how well the ecosystem services are performed. Although a considerable amount of data
on condition of habitats from NPWS surveys was available to the project, such biodiversity
monitoring data is only available for a small sample nationally, and generally only for those habitats
protected under the EU Habitats Directive. Consequently, such data could only be included in a
very few cases as it did not have comprehensive coverage. Given the importance of condition in
assessment of services this is a key data gap.
Data for species of conservation interest (i.e. legally protected and/or policy relevant species only)
has been included by mapping the coincidence of different species but not their abundance. This
distribution will suffer from the usual limitations in terms of recorder bias (there is a tendency to
record species where they are already known to be present, where there is high likelihood of
presence, or where there is a need (such as pre-construction surveys) to survey. Areas outside of
these zones are therefore, likely to be under recorded, and this caused an apparent bias around the
coast and urban centres for the species coincidence layer. Furthermore the distribution only

National ecosystem and ecosystem service mapping pilot
111
incorporates species of conservation interest, therefore species of importance for ecosystem
functioning and resilience may be missing.
See also section on mapping limitations.
6.7 Marine Areas that Provide Food
6.7.1 Summary
The map (Figure 43) shows marine areas potentially contributing to food provision through the provision of
algae, fish, and shellfish. This map models a combination of multiple CICES classes for Ireland under the
provisioning classes ‘Wild animals and their outputs’ and ‘Animals from in-situ aquaculture’ including
Coastal aquaculture - finfish (Salmonids), Coastal mariculture – oysters and Red / Green / Yellow / Brown
algae (splash zone to lower shore), each of which are of policy relevance in Ireland (see Appendices D and
F).
Ireland’s marine area consists of an area approximately ten times that of its land area. The map provides an
overview of the main spatial locations important for food species within this area. Most of the activity
recorded is concentrated in the shallower waters around the coast. Shallower water tends to support more
species, as benthic communities are present as well as those which form in the part of the water column with
sufficient light to provide energy. The map uses the best data that there is available, but much less is known
about the marine environment and it should be regarded as indicating potential contribution. The map could
be used in combination with other marine maps to consider multi-functionality of selected areas.
Known ecosystem service provision, e.g. with fisheries effort as indicator, is low in the majority of the
marine area (73%) see Figure 44, particularly further offshore. The small patches of the strongest known food
provision, e.g. the highest fishing effort, are located along the coastline, with particular hotspots in near
shore areas, especially along the south-east coast. Approximately 16% of the waters of Ireland are shown as
strong provision or as Ecosystem Service provisioning hotspots.

National ecosystem and ecosystem service mapping pilot
112
Figure 43: Map, Marine areas that provide food

National ecosystem and ecosystem service mapping pilot
113
Figure 44: Contribution of Ireland’s marine areas to food provision (%); note that, as the map is coloured across a colour
gradient, whilst values have been grouped for the graph, colours do not exactly correspond between the two.
6.7.2 How the input data relates to these results
The project ‘Rules-base’ (MS Excel file) details the model inputs and qualitative weightings for the service.
Further rationale behind the scientific reasoning for the scoring system can be found in the indicator
documents (Appendix L).
The creation of this map relied heavily on fisheries data, both gear data and quantitative data on fisheries
effort. Areas where numerous types of fishing activity occur at high levels of intensity are taken as the best
available indicator of hotspots of ecosystem service provision. This does not, however, mean that the area
may not be at a risk of overexploitation.
Additional factors are the various fisheries restriction zones, such as the biologically sensitive area to the
south of Ireland. These zones have been given a positive score, as they promote healthy fish stocks. As these
management areas are defined by straight lines, they show very clearly on the mapped output.
73%
2%
9%
12%
4%
Neutral
Some provision
ES provision
Strong ES provision
ES provision hotspot

National ecosystem and ecosystem service mapping pilot
114
6.7.3 How the map relates to other maps produced
Fisheries practices can, in some cases, reduce marine biodiversity through active removal of species and
through habitat disturbance. Therefore, areas with many overlapping types of fisheries effort are also visible
on the stock map for Marine Biodiversity, where they show as areas of slight disbenefit.
There is a tentative relationship between marine food and Marine Carbon. Techniques such as dredging for
shellfish and bottom trawling were considered as negative factors for the ability of the seabed sediment and
substrate to store carbon. For example, when the dredging machinery scrapes the seabed it disturbs the
sediment and distributes particles throughout the water column, meaning the carbon storage potential of the
seabed is drastically reduced. As deep water sites are of higher value for marine carbon, whilst fisheries
effort is centred along the coast, the interaction between these services is minor.
6.7.4 Data and knowledge gaps associated with this map
This map aims to model the national spatial variation in the potential for food provision in the marine
environment. The map relies heavily on data available on fisheries but it is uncertain how representative this
is of actual effort, intensity or yield. It is possible that recording bias causes the high food provision
modelled for coastal areas, whilst neutral values further offshore could be caused by less data being
recorded and available. The model could be improved by considering the following data gaps:
To improve understanding of the fisheries resource, i.e. the supply of algae, fish, and shellfish, it
would be beneficial to understand the relationship between different habitats utilised over their
whole lifecycle to maintain healthy stocks. Furthermore the relationship between habitat types and
individual target fish species is not well enough understood
Data on species-specific fishing areas was not available, or does not currently exist to enable
spatially explicit mapping to incorporate this concept at this time.
The relationship between habitat types, resilience and individual target fish species is not well
enough understood.
National ecosystem and ecosystem service mapping pilot
115
6.8 Marine Carbon
6.8.1 Summary
The map (Figure 45) shows marine areas potentially contributing to carbon storage. This map models the
CICES sub-class for Ireland ‘Areas important for emissions reduction’. Carbon storage in the marine
environment is of importance due to its potential to mitigate climate change impacts (see Appendix F).
Carbon sequestration describes the process of gaseous carbon being removed from the atmosphere. Carbon
storage refers to the carbon currently present and stored within the marine environment. Maps produced
during this project model carbon storage rather than sequestration. Carbon stored in the marine
environment by primary productivity is utilised by other organisms higher up the food chain in a much
more extensive way than in terrestrial environments and less enters the decomposition phase of the cycle
and is stored. However, although carbon storage may be relatively lower in the marine environment by unit
area, as Ireland’s marine area is much more extensive than the terrestrial area, marine carbon contributes a
significant fraction of Ireland’s overall carbon storage. This map is created using the best available data. It
can therefore be regarded as a proxy for marine carbon and a first step towards mapping its distribution.
Atmospheric carbon is sequestrated by, and stored in, the marine environment through two main processes.
The first is photosynthesis where CO2 is used by phytoplankton and oxygen is released. The resulting
microbes that grow from the process pass into the food chain. The other main method is via dissolution and
chemical reaction of carbon dioxide and water forming bicarbonate which is mainly stored in marine
sediments.
The type, depth and disturbance of the substrate were considered, together with activities likely to provide
more disruption of the benthic environment, as the main indicators for this ecosystem service. The role of
substrate in marine carbon storage is related to the particle size distribution of the sediment. Coarse sandy
sediments have large particles which allow water to flow freely through the upper part of the sediment,
flushing the region with oxygen. Finer, tightly-packed sediments such as mud and clay allow less water
penetration and so are less oxygenated. Higher levels of oxygenation promote greater microbial activity,
leading to faster carbon cycling and lower levels of carbon retention within the sediment. The greater the
depth, the more likely the carbon is to be stored, as it will be less prone to disturbance and further oxidation.
Of the marine area in Ireland 42% provides a moderate level of this service (Class ES Provision), but less
than 1% of the area was classified as Strong ES Provision (Figure 46).

National ecosystem and ecosystem service mapping pilot
116
Figure 45: Map, Marine carbon

National ecosystem and ecosystem service mapping pilot
117
Figure 46: Contribution of Ireland’s marine areas to marine carbon storage (%); note that, as the map is coloured across a
colour gradient, whilst values have been grouped for the graph, colours do not exactly correspond between the two.
6.8.2 How the input data relates to these results
The project ‘Rules-base’ (MS Excel file) details the model inputs and qualitative weightings for the service.
Further rationale behind the scientific reasoning for the scoring system can be found in the indicator
documents (Appendix L).
Indicators of marine carbon storage rely on substrate and depth information; depth is important, as carbon
stored in deep sediment is more likely to be stored long-term as it is subjected to less frequent natural
disturbance. Data was taken from both the EU Sea map and the map of collated seabed substrate.
Highest scores for marine carbon storage are located to the north west and to the south of Ireland’s territorial
waters. Deeper areas, such as the deep-water channel to the North West of Ireland, show as high value areas.
Sites with coarse sediment and high disturbance (i.e. high current or wave energy environments) show as
areas with lesser value, as it is more difficult for carbon to be sequestered into the seabed. Fisheries data on
dredging influences the map, lowering the scores at sites were fisheries activity disturbs the sediment (e.g.
dredging and trawling). This has only a minor effect on the overall map, as, within the whole of Ireland’s
marine area, dredging activity has only been recorded for few sites.
0.16
0.06
6.44
52.14
41.19
0.01
Disbenefit
Some disbenefit
Neutral
Some provision
ES provision
Strong ES provision

National ecosystem and ecosystem service mapping pilot
118
6.8.3 How the map relates to other maps produced
As both maps rely heavily on substrate/depth (recorded in one dataset), similar patterns appear on the map
for marine carbon and Marine Biodiversity. However, similarity between the maps is limited to patterns, as
the high value areas do not correspond.
Compared to the maps for Regulation of Greenhouse Gases (Soil Carbon), the overall area indicating
particularly high regulation of carbon in the marine environment is lower. However, there is a large area
which has moderate importance for marine carbon. This is due to the potential for long-term storage in low
energy environments in the deeper areas off shore. These areas are extensive in the marine environment.
6.8.4 Data and knowledge gaps associated with this map
This map aims to model the national spatial variation of areas with the potential for carbon storage in the
marine environment. The data used includes depth and substrate as partial indicators for marine carbon
storage. The model could be improved by addressing the following data gaps:
Biomass within the sediment will differ based on how well oxygenated the area is, which could form
an additional indicator.
Similarly, removal of carbon from the sediment back into the water column will be higher in high
energy/high disturbance environments and a combination of fetch and/or average wave height
maps, as well as measures of benthic currents could form additional indicators.
The map does not incorporate processes occurring within the water column, where factors such as
depth of light penetration, presence of fronts, currents or eddies, as well as the depth of thermocline
and halocline can affect the overall productivity of the marine carbon pump.
It does not consider the efficiency of chemical exchange of carbon at the air-water interface.
See also section on mapping limitations.

National ecosystem and ecosystem service mapping pilot
119
6.9 Marine Biodiversity
6.9.1 Summary
Figure 47 shows the areas with biophysical properties that support marine biodiversity based on habitats,
sediment and management information. It is a map of CICES ‘Function’ rather than an ecosystem service
(see Figure 4). The map function has been modelled and mapped as it provides valuable information for
decision making, as biodiversity underpins the functioning of the environment. Marine communities help
regulate functions of the environment such as carbon and nutrient cycling. The map also provides an
opportunity to highlight areas where biodiversity is important. However, species data has not been
incorporated in the model due to the difficulty of mapping such mobile species with incomplete data. In
addition marine biodiversity can be split into pelagic (relating to the open sea) and benthic (relating to, or
occurring at, the bottom of a body of water) organisms. Amongst the latter, estimates suggest that only a
very small percentage is known as of yet, which adds uncertainty to using substrates as indicators for
biodiversity. This map should therefore be regarded as a first step, based on currently available mapping
rather than a definitive map, and is developed to indicate areas of potential multiple functions.
The main indicator is the substrate type found in an area; the highest values being where biogenic (formed
by living organisms, e.g. corals or mussels) habitats have been recorded. High energy environments with a
lot of tide, current and wave action have quite a low value, as movement of currents in these areas can cause
crushing of benthic organisms, with exposure also being an influencing factor. Other indicators include
anthropogenic structures, as these offer additional habitat complexity, and which therefore potentially
increase biodiversity in the immediate vicinity by creating additional ecological niches. Fisheries, depending
on the type of fishing gear used and intensity, can have a negative effect on marine biodiversity. The
strongest negative impact would be expected from bottom trawling in areas that are naturally low in
disturbance, such as stable sediments or biogenic reefs, whilst the impact on mobile sediment (i.e. high
energy environments) in areas of higher exposure would be quite low.
Shallow areas, where sunlight penetrates, will generally contain greater biodiversity than deeper areas,
where there is less readily usable energy. Deeper areas, on the other hand, contain some of the most
specialised and rarest species. However, due to the vast expanse of deep and dark ocean bed, biodiversity
hotspots do not develop in the same way as in shallow, sun-lit areas.
Protected areas are considered to have a positive effect on biodiversity, even though the lack of physical
boundaries in the marine environment makes this effect difficult to quantify.

National ecosystem and ecosystem service mapping pilot
120
Overall values for marine biodiversity vary most around the coast, with high value occurring to the south of
Ireland, within an area designated as biologically sensitive. This area, together with coastal SACs and
shallow water bays, are the main contributors to the approximately 26% of areas falling into the classes “ES
provision”, “Strong ES provision”, or “ES provision hotspot” (Figure 48). Disbenefit areas occur in small
patches around the coastline primarily due to known areas of dumping at sea.

National ecosystem and ecosystem service mapping pilot
121
Figure 47 Map, Marine biodiversity: Habitats and management
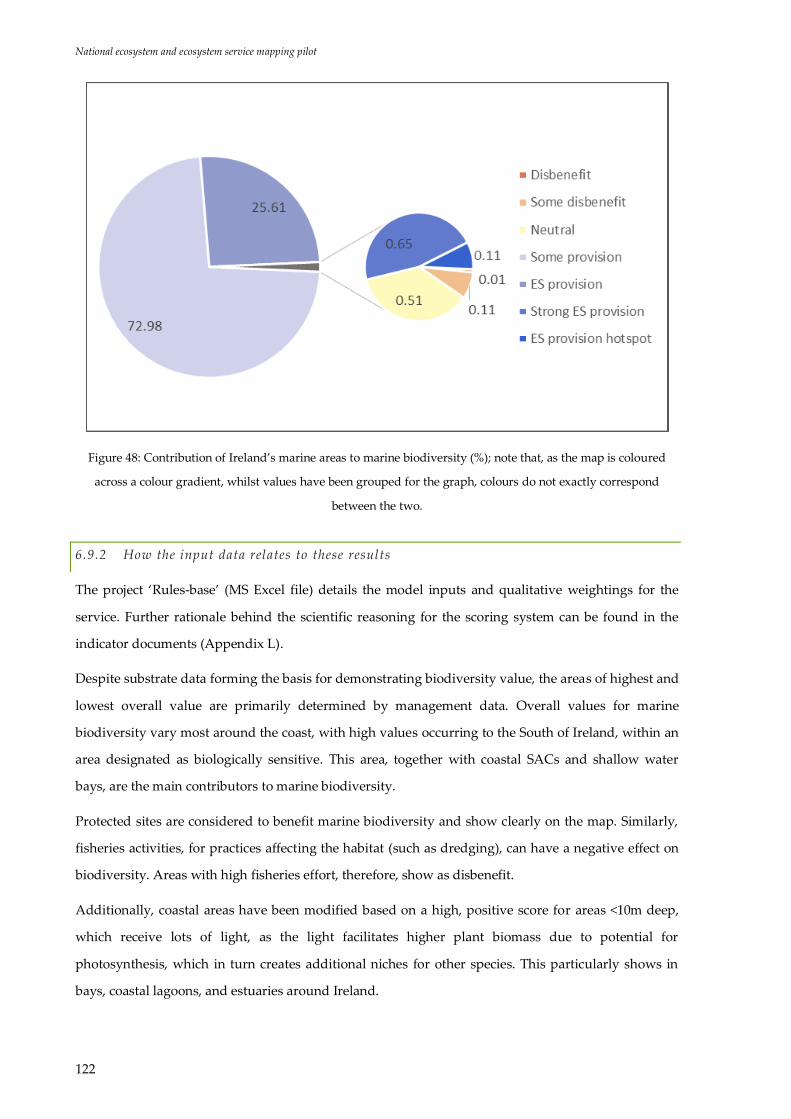
National ecosystem and ecosystem service mapping pilot
122
Figure 48: Contribution of Ireland’s marine areas to marine biodiversity (%); note that, as the map is coloured
across a colour gradient, whilst values have been grouped for the graph, colours do not exactly correspond
between the two.
6.9.2 How the input data relates to these results
The project ‘Rules-base’ (MS Excel file) details the model inputs and qualitative weightings for the
service. Further rationale behind the scientific reasoning for the scoring system can be found in the
indicator documents (Appendix L).
Despite substrate data forming the basis for demonstrating biodiversity value, the areas of highest and
lowest overall value are primarily determined by management data. Overall values for marine
biodiversity vary most around the coast, with high values occurring to the South of Ireland, within an
area designated as biologically sensitive. This area, together with coastal SACs and shallow water
bays, are the main contributors to marine biodiversity.
Protected sites are considered to benefit marine biodiversity and show clearly on the map. Similarly,
fisheries activities, for practices affecting the habitat (such as dredging), can have a negative effect on
biodiversity. Areas with high fisheries effort, therefore, show as disbenefit.
Additionally, coastal areas have been modified based on a high, positive score for areas <10m deep,
which receive lots of light, as the light facilitates higher plant biomass due to potential for
photosynthesis, which in turn creates additional niches for other species. This particularly shows in
bays, coastal lagoons, and estuaries around Ireland.
National ecosystem and ecosystem service mapping pilot
123
6.9.3 How the map relates to other maps produced
As both maps include substrate data and no further datasets with full coverage of the area of interest,
similar patterns appear on the map for Marine Biodiversity and ‘Regulation of Greenhouse Gases
(Marine Carbon)’. However, as deep areas are of particularly high value for carbon sequestration, the
maps are similar only with regards to patterns, whilst high and low provision areas are in different
locations.
High value areas for Marine Food Provision based on fisheries effort and marine biodiversity overlap in
several locations, as sites with high biological productivity also attract greater fish stocks resulting in
greater fishing effort.
6.9.4 Data and knowledge gaps associated with this map
This map aims to model the national spatial variation in marine biodiversity in Irish waters. With the
data available this map focused on looking at the diversity of the entire seascape. It also built on the
concepts of biodiversity conservation/management as a proxy for ecosystem health/condition. Much
less is known about functions in the marine environment and therefore this map is preliminary. The
model could be improved by considering the following data gaps:
The map for marine biodiversity does not include species data. This is because many marine
species are highly mobile, so that point observations included in the map could easily
misrepresent the overall results. Additionally, recording is often biased to large marine
species, in particular marine mammals. Therefore, incorporating species data is likely to
attribute higher biodiversity value to those areas known for marine mammals, instead of
mapping marine biodiversity as a whole.
NPWS marine community mapping was not incorporated into this map, as this data does not
cover the whole extent of the marine mapping and incorporating it into the habitat data with
less details would create an inconsistent data set.
Further research and data on the role and distribution of benthic communities is needed.
See also section on mapping limitations.
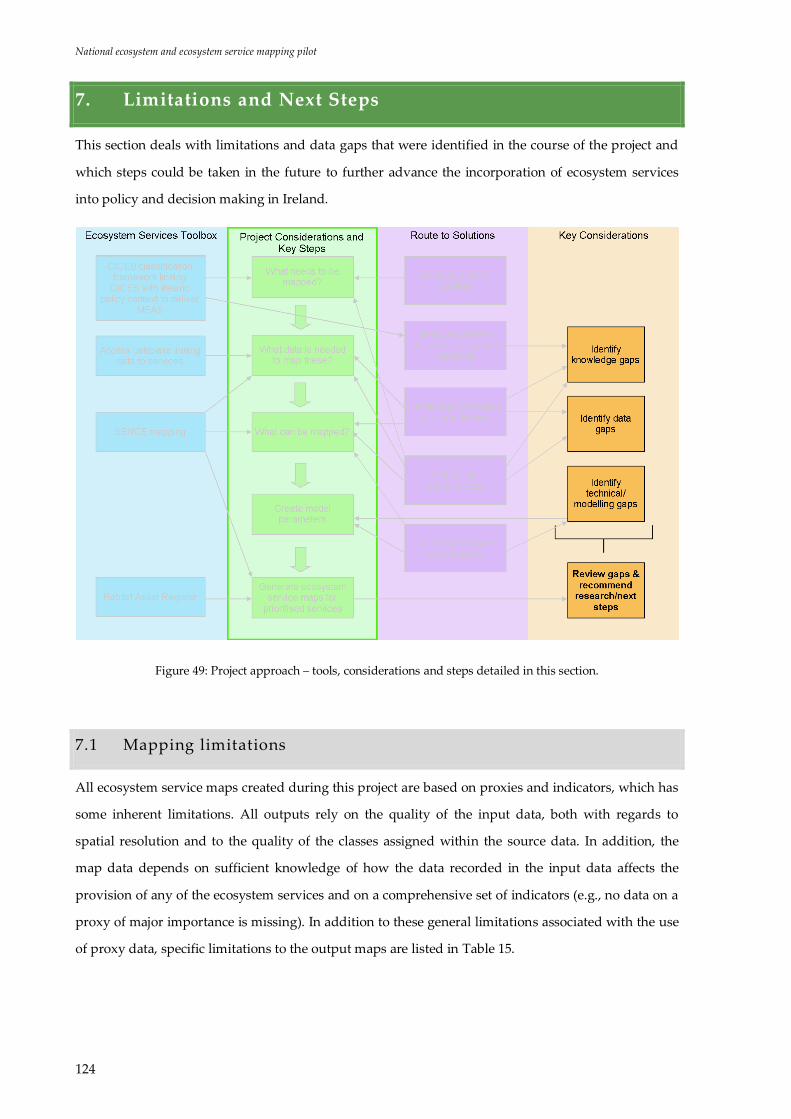
National ecosystem and ecosystem service mapping pilot
124
7. Limitations and Next Steps
This section deals with limitations and data gaps that were identified in the course of the project and
which steps could be taken in the future to further advance the incorporation of ecosystem services
into policy and decision making in Ireland.
Figure 49: Project approach – tools, considerations and steps detailed in this section.
7.1 Mapping limitations
All ecosystem service maps created during this project are based on proxies and indicators, which has
some inherent limitations. All outputs rely on the quality of the input data, both with regards to
spatial resolution and to the quality of the classes assigned within the source data. In addition, the
map data depends on sufficient knowledge of how the data recorded in the input data affects the
provision of any of the ecosystem services and on a comprehensive set of indicators (e.g., no data on a
proxy of major importance is missing). In addition to these general limitations associated with the use
of proxy data, specific limitations to the output maps are listed in Table 15.
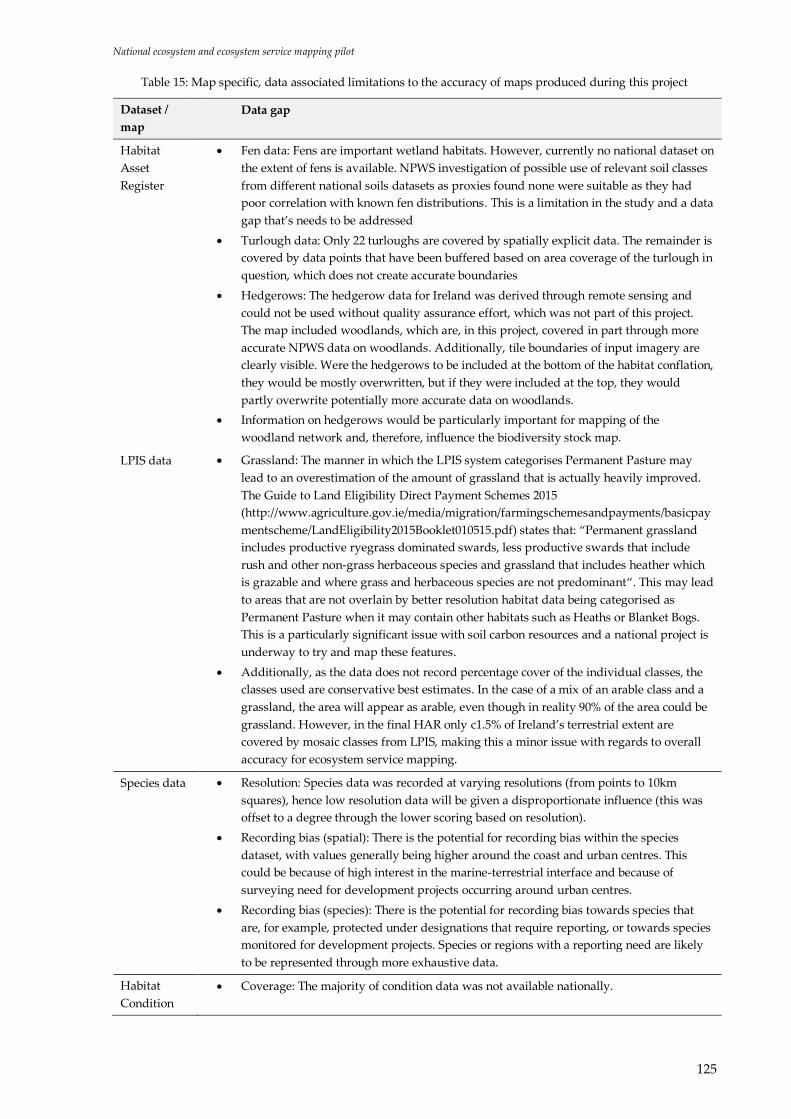
National ecosystem and ecosystem service mapping pilot
125
Table 15: Map specific, data associated limitations to the accuracy of maps produced during this project
Dataset /
map
Data gap
Habitat
Asset
Register
Fen data: Fens are important wetland habitats. However, currently no national dataset on
the extent of fens is available. NPWS investigation of possible use of relevant soil classes
from different national soils datasets as proxies found none were suitable as they had
poor correlation with known fen distributions. This is a limitation in the study and a data
gap that’s needs to be addressed
Turlough data: Only 22 turloughs are covered by spatially explicit data. The remainder is
covered by data points that have been buffered based on area coverage of the turlough in
question, which does not create accurate boundaries
Hedgerows: The hedgerow data for Ireland was derived through remote sensing and
could not be used without quality assurance effort, which was not part of this project.
The map included woodlands, which are, in this project, covered in part through more
accurate NPWS data on woodlands. Additionally, tile boundaries of input imagery are
clearly visible. Were the hedgerows to be included at the bottom of the habitat conflation,
they would be mostly overwritten, but if they were included at the top, they would
partly overwrite potentially more accurate data on woodlands.
Information on hedgerows would be particularly important for mapping of the
woodland network and, therefore, influence the biodiversity stock map.
LPIS data Grassland: The manner in which the LPIS system categorises Permanent Pasture may
lead to an overestimation of the amount of grassland that is actually heavily improved.
The Guide to Land Eligibility Direct Payment Schemes 2015
(http://www.agriculture.gov.ie/media/migration/farmingschemesandpayments/basicpay
mentscheme/LandEligibility2015Booklet010515.pdf) states that: “Permanent grassland
includes productive ryegrass dominated swards, less productive swards that include
rush and other non-grass herbaceous species and grassland that includes heather which
is grazable and where grass and herbaceous species are not predominant“. This may lead
to areas that are not overlain by better resolution habitat data being categorised as
Permanent Pasture when it may contain other habitats such as Heaths or Blanket Bogs.
This is a particularly significant issue with soil carbon resources and a national project is
underway to try and map these features.
Additionally, as the data does not record percentage cover of the individual classes, the
classes used are conservative best estimates. In the case of a mix of an arable class and a
grassland, the area will appear as arable, even though in reality 90% of the area could be
grassland. However, in the final HAR only c1.5% of Ireland’s terrestrial extent are
covered by mosaic classes from LPIS, making this a minor issue with regards to overall
accuracy for ecosystem service mapping.
Species data Resolution: Species data was recorded at varying resolutions (from points to 10km
squares), hence low resolution data will be given a disproportionate influence (this was
offset to a degree through the lower scoring based on resolution).
Recording bias (spatial): There is the potential for recording bias within the species
dataset, with values generally being higher around the coast and urban centres. This
could be because of high interest in the marine-terrestrial interface and because of
surveying need for development projects occurring around urban centres.
Recording bias (species): There is the potential for recording bias towards species that
are, for example, protected under designations that require reporting, or towards species
monitored for development projects. Species or regions with a reporting need are likely
to be represented through more exhaustive data.
Habitat
Condition
Coverage: The majority of condition data was not available nationally.

National ecosystem and ecosystem service mapping pilot
126
Dataset /
map
Data gap
Land use –
Stocking
density
Stocking density data was not available for ES mapping, but is very important for ES
delivery, particularly for regulation of water quality
Crop types
and yield
Knowing crop type and yield would help quantify the food resource more accurately.
Whilst crop types are recorded in LPIS, this data was not used, due to yield not being
recorded and many mixed value fields, which could not be scored accurately.
Soil depth Data regarding the depth of the soil layer can improve mapping accuracy for soil carbon
and water related ES, in particular for peat soils.
Peat
disturbance/
condition
Peatlands: Condition data has to some extent been included (to distinguish between cut-
over and active raised bog). However, a project (EPA STRIVE funded SCAMPI – Status
and Condition Assessment and Mapping of the Peatlands of Ireland) is currently in
progress, which will facilitate more accurate modelling of ecosystem service provision
from peatlands.
Location and
flow
direction of
drains
(including
tile drains)
This is necessary to assess the flow rate for reducing flooding risk and for calculating
pathways of pollutants, such as seepage from septic tanks, to show water quality.
Point source
pollution
features
Adding point source pollution risk features to the water quality map would enhance its
accuracy. This was not undertaken at the all-Ireland scale as the data becomes very
detailed. It could however be considered for local scale mapping.
Erosion risk Calculating erosion risk across Ireland would also significantly enhance the models for
water quality.
Marine food
provision
Fisheries data (wild harvest): Only limited information (e.g. metadata) available
regarding what was measured and how
Aquaculture: No data was available on marine food provision through aquaculture
Further indicators (habitat): It is difficult to find indicators to use that go beyond direct
measures of fisheries effort or fishing gear. It would be interesting to map the
contribution of each area to this service based on how individual habitats contribute to
healthy fish stocks for important target species. However, establishing this link between
habitats and fish stocks would require an extensive desk review of literature regarding
the ecology of the species of interest.
Bathymetry The bathymetry raster layers had some gaps in coastal areas. These were filled in
through interpolation from the CTD depth measures (point file), which can create some
inaccuracies.
Marine
ecosystem
services
The marine environment is very much three dimensional, with processes occurring in the
water column being just as relevant as pelagic or benthic ones. Therefore, incorporating
processes occurring in the water column could further improve modelling accuracy.

National ecosystem and ecosystem service mapping pilot
127
7.1.1 Projects addressing current mapping limitations
A range of Irish research and mapping projects are either currently underway or planned for the near
future. The results of these projects will address some of the data and mapping limitations noted
during this project and allow for updates on the outputs. These projects and how they could be
incorporated into mapping are listed in Table 16.
Table 16: Future and underway projects addressing data and mapping limitations noted during this project
Project Project purpose Limitations addressed
Hedgerow mapping by Bluesky
(Pilot project)
Detailed hedgerow mapping in
Cork
Lack of accurate hedgerow data
addressed for one county
Flooding / Water quality by
OPW
(www.cfram.ie/pfra/interactive-
mapping/ and EPA
(Catchments.ie))
Flood Studies Update
Programme
Newer maps on flooding and
water quality were created this
year (2016)
The development of new or
recalibrated flood estimation
Maps in this project precede the
release of these newer datasets;
relevant maps could be updated
or interpreted using this
information
Detailed data on flooding.
CforRep by University College
of Dublin
Obtaining information for better
carbon reporting in Ireland
Lack of accurate data on soil
carbon particularly in relation to
that found under Permanent
Pasture
SEAI Bioenergy Mapping Land suitability mapping for
bio-energy crops: Short rotation
willow, Miscanthus and oilseed
rape
Potential in Ireland for growth
of energy crops
Valuing the significant
ecosystem services provided by
Irish coastal, marine and
estuarine habitats (NUIG)
To obtain more information on
coastal and marine ecosystem
services
Lack of spatial data in marine
and coastal environments.
SAT4Grass Mapping grassland
intensification (using field
spectroscopy measurements
and satellite to measure
grassland yield and paddock
management)
More accurate proxy for
fertilizer input
Drainmap Mapping drained farmland More accurate proxy of
temporary water storage and
contribution to water quality in
farmland
SCAMPI (EPA STRIVE funded) UCC/Teagasc Mapping
condition of Irish peatlands
Peatland condition important
for a number of ecosystem
services, particularly relating
the hydrological cycle and
climate change mitigation

National ecosystem and ecosystem service mapping pilot
128
Project Project purpose Limitations addressed
TaLAMH, Teagasc Delineation of upland habitats
using semi automated methods
Additional data to improve
upland mapping and arable and
pasture mapping in lowlands in
addition to LPIS
NPWS ongoing habitat and
species surveying
Mapping of habitats and species More detailed and up-to-date
information
LIFE Active Raised Bogs
Restoration Project
Improve the conservation status
in Ireland of active raised bogs
Monitoring restoration works
on designated raised bog sites
under National Raised Bog
Special Area of Conservation
Management Plan 2016-2021
including 12 raised bogs which
are part of Irish Raised Bog
LIFE Project
EPA-funded project: A
framework for the restoration of
degraded peatlands
EPA / Trinity College UCD and TCD are carrying out
this 3-year research project
(2015-2018))
KerryLIFE project Restore populations of
freshwater pearl mussels in
Caragh and Kerry
Additional information on
distribution of a species of
conservation concern (at a local
level)
Tellus Project (Geological
Survey of Ireland)
Provide additional geoscience
information
Additional information
regarding geology and
associated features

National ecosystem and ecosystem service mapping pilot
129
7.2 Cultural Ecosystem Services
The on-going discussions concerning the revision of CICES have been prompted in part by the
difficulty of defining and measuring cultural ecosystem services. Many of the difficulties arise because
it is often hard to distinguish the particular ecological characteristics of species and places that give
rise to cultural services and the associated benefits that people enjoy. The way cultural services are
conceptualised is undergoing scrutiny in the international literature (Chan and Satterfield, 2016).
Thinking about how different measures of cultural services can be generated across all elements of the
ecosystem service cascade can help to overcome some of these difficulties, but there is also often a
more fundamental problem arising from the simple lack of data (Tratalos et al., 2016). Data on cultural
services is often difficult and costly to generate, because it involves survey information in most cases.
The Monitoring of Engagement with the Natural Environment 24 (MENE), undertaken in the UK illustrates
the value of longitudinal survey data in the context of ecosystem services and the scale of resource
commitment required in order to develop a clear picture at national scales. In the future, it may well
be that relevant data can be generated in a more rapid and cost effective way. For example, recent
work has shown how, by analysing photos placed on social media by the public, the qualities and
characteristics of different environmental settings that are used for various kinds of activities
(Tenerelli et al., 2016) can potentially be understood. In order to take work on cultural ecosystem
services further in Ireland, it would be useful for any future study to review the range of material that
relates to cultural ecosystem services that are available, and to document how this can be used to
characterise cultural services at different spatial scales. The work could also look at strategies for
overcoming data gaps.
7.3 Further ES Framework Methodology Development
7.3.1 CICES
At the time of the preparation of this report, the current version of CICES (V4.3) is being reviewed in
order to determine whether any revisions are necessary. This process is drawing heavily on the
experience of users, and so in this context the results from Ireland will be especially valuable in taking
this discussion forward. Potential ‘modifications’ to CICES have previously been explored in Ireland
(see our earlier discussion in section‘3.4 Developing CICES in the Irish Context’).
24 https://www.gov.uk/government/statistics/monitor-of-engagement-with-the-natural-environment-2015-to-2016

National ecosystem and ecosystem service mapping pilot
130
On the basis of the outcomes of these discussions, and the experience gained in this project, our
recommendation is that while the overall structure of CICES seems appropriate, it is useful in an
operational context to break down the class level (the most detailed within the current CICES
structure) to more specific sub-classes. These sub-classes are at the level of ecosystem goods and
services that can actually be measured ‘on the ground’ and which have particular policy or
management relevance in Ireland. When CICES was designed it was anticipated that this kind of
customisation at the sub-class level would provide users with the kinds of flexibility they would need
to develop geographically specific applications, and the experience in Ireland is valuable in showing
how this can be done.
7.3.2 Developing Policy or Sector Relevant Reporting Categories
In quantifying ecosystem services, it is clearly important to be as specific as possible, so that indicators
are easy to interpret and meaningful. This report has shown how this can be done by expanding the
range of metrics used to quantify ecosystem service classes by creating policy relevant ‘sub-classes’
that are then nested into the overall structure. Clearly for higher level policy work more aggregated
indicators would be useful; this might be especially useful in the context of the MAES Process and any
associated reporting commitments. Thus an area that might be looked at in any future work would be
how to develop suitable, more aggregated indicators, at the CICES Group and Division levels. An
approach used elsewhere involved identifying a ‘basket of indicators’ that can be used to characterise
these more general reporting categories with some kind of weighting system used to generate an
overall score.
A further aspect of this work would be to look at user-needs more generally, and explore how, in an
Irish context, policy or sector relevant reporting categories can be constructed using CICES classes,
groups and divisions.
7.3.3 Ecosystem Service Indicators
The work described in this report on indicators (Section ‘4.2 Developing Ecosystem Service
Indicators’) demonstrates how CICES at the class and sub-class levels can provide a framework for
indicator development. By looking at these indicators in the context of the SENCE tool, the work has
demonstrated how these indicators can be cross-referenced to the different elements of the ‘ecosystem
service cascade’ so that users can see how service outputs can be quantified using different direct and
proxy measures. This approach is particularly important because it enables the role of ‘biodiversity’ in
service output to be more clearly demonstrated and potentially monitored.
In order to take this work further a number of elements could be further developed:
National ecosystem and ecosystem service mapping pilot
131
At present the material in Appendix F is based on a review of key policy areas that are relevant in
the Irish context. This work was used to identify potential service sub-classes and metrics that
could be used to assess the status and trends of these ecosystem service outputs. In order to
continue the dialogue with stakeholders that has been started by this project, the appropriateness
of these indicators could be reviewed, and others added where gaps are felt to exist.
Only a subset of the potential policy relevant indicators at sub-class level identified have been
used in this study for quantification and mapping. The selection was made on the basis of data
availability and where policy priorities were thought to lie. In order to continue the dialogue with
stakeholders which has begun through this project, it would now be valuable to identify the next
set of indicators that can be quantified and mapped, given current data resources, and where data
gaps exist, what kinds of monitoring and measurement strategy might be put in place to
overcome these deficiencies.
During this project, no quantitative assessment was carried out. However, the work done on this
project can be regarded as the precursor to economic evaluation. However, taking this step was
beyond the scope of this project. The creation of the Habitat Asset Register and the qualitative
ecosystem service maps provide a set of data layers and initial outputs that could be reused to
develop ecosystem service modelling and economic valuation further and leave room to
incorporate additional data.
As the focus was on the development of national indicators, it was not possible to utilise data
sources which were only available for specific locations. The application of the framework to a
local pilot would provide the opportunity to verify the appropriateness of the indicators approach
while enhancing them using available local data. This would also provide greater opportunity to
examine links between specific structures, processes and functions with individual and multiple
services and benefits. Furthermore, a local pilot would give greater opportunity for outputs to be
customised to the needs of local decision making. The transparency of the valuations provided by
the spatial framework approach can provide a valuable mechanism for consultation with local
stakeholders and incorporation of their values.
The Rules-base provides a transparent way for weighting datasets. As new data becomes available
from new research projects, these can be used to update the indicators and the map outputs. The
data base should also be maintained so that newer data sources are incorporated.
The species coincidence layer was comprised of legally protected and policy relevant species. It
was beyond the scope of the current pilot to analyse the data in terms of functional groupings and
their role with respect to specific ecosystem services, but this could be done using the data
gathered to create the species coincidence layer as a starting point.

National ecosystem and ecosystem service mapping pilot
132
7.3.4 Opportunities mapping
Stock maps are only one type of ecosystem service maps that can be produced through the SENCE
methodology. They provide information on the current distribution of ecosystem service provision.
There are additional map types that can be produced, one of which are opportunities maps. These
show areas where the provision of a specific ecosystem service could feasibly be enhanced. This
considers which areas are unsuitable for modification, or only allow for certain types of management,
such as the implementation of agri-environment options on agricultural land.
As a next step the outputs created as part of the national pilot to date can be combined to develop
such opportunities maps to enable the evaluation of multiple benefits and trade- off analysis at the
national scale.
Once opportunities and stock maps exist, they can be combined to show areas with trade-offs,
interactions, and synergies between services and opportunities. Areas with multiple opportunities can
be highlighted, to indicate areas where management action has the potential to enhance the provision
of more than one ecosystem service.
National ecosystem and ecosystem service mapping pilot
133
8. References and Bibliography
Aalen, F. H., Whelan, K., & Stout, M. (2010) Atlas of the Irish rural landscape. Cork University Press, Cork. 432pp.
Acreman, M., Blackwell, M., Durance, I., Everard, M., Morris, J., Spray Diack, C., Duigan, C., Dunbar, M., Gilvear,
D., Gurnell, A., Jenkins, A., Large, A., Maberly, S., Moss, B., Newman, J., Robertson, A., Ross, M., Rowan,
J., Shpherd, M., Skinner, A., Thompson, J., Vaughan, I & Ward, R. (2011) UK National Ecosystem
Assessment - Chapter 9: Freshwaters - Openwaters, Wetlands and Floodplains. (E. Maltby, & S. Ormerod, Eds.)
UK National Ecosystem Assessment.
Alonso, I., Weston, K., Gregg, R., & Morecroft, M. (2012) Carbon storage by habitat: Review of the evidence of the
impacts of management decisions and condition of carbon stores and sources. (N. England, Ed.) Natural
England.
Altieri, M., & Nicholls, C. (2003) Soil fertility management and insect pests: harmonizing soil and plant health in
agroecosystems. Soil and Tillage Research, 72(2), 203-211.
Anderson, R., (2013) Biodiversity Change in the Irish Uplands – the Effects of Grazing Management. Unpublished
PhD Thesis National University of Ireland, Cork, 220pp
Angers, D., & Caron, J. (1998) Plant-Induced Changes in Soil Structure: Processes and Feedbacks. Biogeochemistry,
55-72.
Annett, J.A. (2015) Deer Management in Ireland – A Framework for Action. Department of Agriculture, Food and the
Marine, Dublin. 38pp
Armentano, T., & Menges, E. (1986) Patterns of change in the carbon balance of organic soil-wetlands of the
temperate zone. The Journal of Ecology, 755-774.
Armstrong, W., Cousins, D., Armstrong, J., Turner, D., & Beckett, P. (2000) Oxygen distribution in wetland plant
roots and permeability barriers to gas-exchange with the rhizosphere: a microelectrode and modelling
study with Phragmites australis. Annals of Botany, 86(3), 687-703.
Arya, L. M., & Paris, J. F. (1981) A physicoempirical model to predict the soil moisture characteristic from
particle-size distribution and bulk density data. Soil Science Society of America Journal, 45(6), 1023-1030.
Asher, J., Warren, M., Fox, R., Harding, P., Jeffcoate, G. & Jeffcoates, S. (2001) The millennium atlas of butterflies
in Britain and Ireland. Oxford University Press, Oxford.
AskAboutIreland (2016). Ardailte agus Sléibhte. Uplands and Mountains. http://www.askaboutireland.ie/learning-
zone/secondary-students/irish/labhairt-agus-scriobh/abhar-ar-dtimpeallacht/ardailte-agus-sleibhte/
Bache, B., Rosenqvist, I., Goldsmith, P., Fowler, D., Ogden, J., & Brown, K. (1984) Soil-water interactions [and
discussion]. Philosophical Transactions of the Royal Society of London. B, Biological Sciences, 305(1124), 393-
407.
Bain, C., Bonn, A., Stoneman, R., Chapman, S., Coupar, A., Evans, M., Gearey, B., Howat, M., Joosten, H.,
Keenleyside, C., Labadz, JU., Lindsay, R., Littlewood, N., Lunt, P., Miller, C., Moxey, A., Orr, H., Reed,
M., Smith, P., Swales, V., Thompson, D., Thompson, P., Van de Noort, R., Wilson, J. & Worrall, F. (2011)
IUCN UK Commission of Inquiry on Peatlands.
Baines, C. (2008) Flooding, Water and the Landscape. In I. Rotherham (Ed.). Wildtrack Publishing.
Baird, A., Holden, J., & Chapman, P. (2009) A Literature Review of Evidence on Emissions of Methane in
Peatlands. Defra Project SP0574.
Baker, A., & Brooks, R. (1989) Terrestrial higher plants which hyperaccumulate metallic elements. A review of
their distribution, ecology and phytochemistry. Biorecovery., 1(2), 81-126.
Ball, B., Campbell, D., & Hunter, E. (2000) Soil compactibility in relation to physical and organic properties at 156
sites in UK. Soil and Tillage Research, 57(1), 83-91.

National ecosystem and ecosystem service mapping pilot
134
Balvanera, P., Pfisterer, A., Buchmann, N., He, J., Nakashizuka, T., Raffaelli, D., & Schmid, B. (2006) Quantifying
the evidence for biodiversity effects on ecosystem functioning and services. Ecology letters, 9(10), 1146-
1156.
Bellamy, P., Loveland, P., Bradley, R., Lark, R., & Kirk, G. (2005) Carbon losses from all soils across England and
Wales 1978--2003. Nature, 437(7056), 245-248.
Benton, T. G., Vickery, J. A., & Wilson, J. D. (2003) Farmland biodiversity: is habitat heterogeneity the key? Trends
in Ecology & Evolution, 18(4), 182-188.
Beven, K., & Wood, E. (1983) Catchment geomorphology and the dynamics of runoff contributing areas. Journal of
Hydrology, 65(1), 139-158.
Bhogal, A., Nicholson, F., Rollett, A., & Chambers, B. (2009) Best Practice for Managing Soil Organic Matter in
Agriculture - Manual of Methods for 'Lowland' Agriculture. Defra project SP09016.
Billett, M., Charman, D., Clark, J., Evans, C., Evans, M., Ostle, N., Worrall, A., Burden, A., Dinsmore, K., Jones, T.,
McNamara, N., Parry, L., Rowson, J. & Rose, R. (2010). Carbon balance of UK peatlands: current state of
knowledge and future research challenges. Climate Research, 45, 13-29.
BIM (2008) The Seafood Development Operational Programme 2007-2013. BIM, Dublin. 108pp
BIM (2012) A Market Analysis towards the Further Development of Seaweed Aquaculture in Ireland.
PBA/SW/07/001(01). BIM, Dublin. 49pp
BIM (2016) BIM Annual Aquaculture Survey 2016. BIM, Dublin. 16pp.
Blake, R., Westbury, D., Woodcock, B., Sutton, P., & Potts, S. (2011) Enhancing habitat to help the
plight of the bumblebee. Pest Management Science, 67(4), 377-379.
Bolund, & Hunhammar, S. (1999) Ecosystem services in urban areas. Ecological economics, 29(2), 293-301.
Bord Bia (2011) National Amenity Census 2011. Bord Bia, Dublin 62pp.
Bord Bia (2015) Amenity Sector Full Year 2014 – Management Report. Bord Bia, Dublin 48pp.
Boulton, A., Fenwick, G., Hancock, P., & Harvey, M. (2008) Biodiversity, functional roles and ecosystem services
of groundwater invertebrates. Invertebrate Systematics, 22(2), 103-116.
Bowe, M., Higginson, E., Chant, J. & Osbourn, M. (2015) Somerset’s Ecological Network – Mapping the components of
the ecological netowrk in sommerset. 2015 report, Somerset Wildlife Trust.
Boyd, J. & S. Banzhaf (2007) What are ecosystem services? The need for standardized environmental accounting units.
Ecological Economics 63, 616–626.
Brady, N. C., and R. R. Weil. (2002) In The Nature and Properties of Soils (13th Edition). Upper Saddle River, NJ:
Prentice-Hall, Inc.
Brady, N., C., and Weil, R. R. (2008) The Nature and Properties of Soils. Prentice Hall/Pearson Education.
Britton A. J., (2005) Impacts of grazing on montane heath vegetation in Wales and implications for the restoration
of montane areas. Biological Conservation 125(4), 515:524.
Broadmeadow, M., & Matthews, R. (2003) Forests, carbon and climate change - The UK contribution. Tech. rep.,
Forestry Commission.
Brussaard, L. (1997) Biodiversity and ecosystem functioning in soil. Ambio, 563-570.
Brussaard, L., De Ruiter, P. C., & Brown, G. G. (2007) Soil biodiversity for agricultural sustainability. Agriculture,
ecosystems & environment, 121(3), 233-244.
Bullock, C. H., & Collier, M. (2011) When the public good conflicts with an apparent preference for unsustainable
behaviour. Ecological Economics, 70(5), 971-977.

National ecosystem and ecosystem service mapping pilot
135
Bullock, C., Kretsch, C. and Candon, E. (2008) The Economic and Social Aspects of Biodiversity – Benefits and
Costs of Biodiversity in Ireland. Government of Ireland; Environment, Heritage and Local Government, ISBN
978-1-4064-2105-7.
Bullock, J. M., Aronson, J., Newton, A. C., Pywell, R. F., & Rey-Benayas, J. M. (2011) Restoration of ecosystem services
and biodiversity: conflicts and opportunities. Trends in Ecology & Evolution, 26(10), 541-549.
Bullock, J., Jefferson, R., Blackstock, T., Pakeman, R., Emmett, B., Pywell, R., Grime, P. & Silvertown, J. (2011). UK
National Ecosystem Assessment - Chapter 6: Semi-natural Grasslands. (J. Bullock, Ed.) UK National
Ecosystem Assessment.
Busch, M., La Notte, A., Laporte, V., and Erhard, M. (2012). Potentials of quantitative and qualitative approaches
to assessing ecosystem services. Ecological Indicators 21, pp. 89-103
Byrne, A., Moorkens, E.A., Anderson, R., Killeen, I.J. & Regan, E.C. (2009) Ireland Red List No. 2 – Non‐Marine
Molluscs.National Parks and Wildlife Service, Department of the Environment, Heritage and Local
Government, Dublin, Ireland.
Calder, I., Harrison, J., Nisbet, T., & Smithers, R. (2008) Woodland actions for biodiversity and their role in water
management. Flooding, Water and the Landscape, 7:1, 153.
Carpenter, A. (ed) (2014) Art and Architecture of Ireland. Yale University Press, New Haven and London 2528pp
Carroll, D. (1959) Ion exchange in clays and other minerals. Geological Society of America Bulletin, 70(6), 749-779.
Carruthers, C., Burns, A., Elliott, G. (2015) Gastronomic tourism: development, sustainability and applications – a case
study of County Cork, Republic of Ireland. In: Hindley, C. (ed) The Routledge Handbook of Sustainable
Food and Gastronomy. Routledge, London and New York. pp360 – 369;
Carter, M. (2004) Researching structural complexity in agricultural soils. Soil and tillage research 79:1, 1-6.
Carvell, C., Meek, W., Pywell, R., Goulson, D., & Nowakowski, M. (2007) Comparing the efficacy of agri-
environment schemes to enhance bumble bee abundance and diversity on arable field margins. Journal of
Applied Ecology 44:1, 29-40.
Central Statistics Office (CSO): www.cso.ie
Chan, K.M. A. and Terre Satterfield, T. (2016) Managing cultural ecosystem services for sustainability. In Routledge
Handbook of Ecosystem Services (Potschin, M. et al., eds), Routledge, London and New York, 343-356.
Chapin III, F., Matson P. and Vitousek P. (2011) Principles of Terrestrial Ecosystem Ecology Springer science and
Business Media 529pp
Chapin III, F., Zavaleta, E., Eviner, V., Naylor, R., Vitousek, P., Reynolds, H., Hooper, D., Lavorel, S., Sala, O.,
Hobbie, S., Mack, M. & Díaz, S. (2000) Consequences of changing biodiversity. Nature 405:6783, 234-242.
Colding, J., J., Lunberg., C. Folke. (2006) Incorporating Green-area User Groups in Urban Ecosystem
Management. AMBIO 35:5, 237-244.
Colhoun K. and Cummins S. (2013) Birds of Conservation Concern in Ireland 2014-2019. Irish Birds9
Connolly, J., & Holden, N. M. (2009) Mapping peat soils in Ireland: updating the derived Irish peat map. Irish
Geography 42:3, 343-352.
Connolly, J., & Holden, N. M. (2013) Classification of peatland disturbance. Land Degradation & Development, 24(6),
548-555.
Connolly, J., Holden, N. M., & Ward, S. M. (2007) Mapping peatlands in Ireland using a rule-based methodology
and digital data. Soil Science Society of America Journal 71:2, 492-499.
National ecosystem and ecosystem service mapping pilot
136
Connolly, J., Holden, N. M., Connolly, J., Seaquist, J. W., & Ward, S. M. (2011) Detecting recent disturbance on
Montane blanket bogs in the Wicklow Mountains, Ireland using the MODIS enhanced vegetation index.
International journal of remote sensing 32:9, 2377-2393.
Cooper, F., Stone, R.E., McEvoy, P., Wilkins, T. & Reid, N. (2012) The conservation status of juniper formations in
Ireland. Irish Wildlife Manuals, No. 63 National Parks and Wildlife Service, Department of Environment,
Heritage and Local Government, Dublin, Ireland.
Cottle, R. (2004) Linking Geology and Biodiversity. (E. Nature, Ed.) English Nature.
Crawley, M. J. (1997) Plant Ecology, 2nd Edition. Oxford. Blackwell Science Ltd.
Crockford, R., & Richardson, D. (2000) Partitioning of rainfall into throughfall, stemflow and interception: effect
of forest type, ground cover and climate. Hydrological processes, 14(16-17), 2903-2920.
Crossman, N. D., Burkhard, B., Nedkov, S., et al. (14 authors) (2013) A blueprint for mapping and modelling
ecosystem services. Ecosystem Services 4, 4-14.
Curtis, S. E. (1983) Environmental management in animal agriculture. Iowa. Iowa State University Press.
DAFM (2009) National Field Vegetable Census 2009. DAFM, Dublin 66pp.
DAFM (2015) Ireland’s Forests – Annual Statistics, 2015. DAFM, Dublin 66pp.
DAFM (Department of Agriculture, Food and the Marine) (2011) Helpsheet / Terms and Conditions for the 2011 EU
Single Payment Scheme (SPS) and for the 2011 Disadvantaged Areas Scheme, and other 2011 Area-based
Schemes. DAFM, Dublin Retrieved from:
https://www.agriculture.gov.ie/media/migration/farmingschemesandpayments/singlepaymentsscheme/
2011/2011SPSTermsConditions180411.pdf
DAFM (Department of Agriculture, Food and the Marine) (2013) Soft Fruit and Protected Vegetable Census 2013.
DAFM, Dublin 63pp.
DAFM (Department of Agriculture, Food and the Marine) (2015) A Guide to Land Eligibility Direct Payment
Schemes. DAFM, Dublin Retrieved from:
https://www.agriculture.gov.ie/media/migration/farmingschemesandpayments/basicpaymentscheme/La
ndEligibility2015Booklet010515.pdf
Davari, M., Ram, M., Tewari, J., Kaushish, S., & others. (2010) Impact of agricultural practice on ecosystem services.
International journal of Agronomy and Plant Production 1:1, 11-23.
De Deyn, G., Shiel, R., Ostle, N., McNamara, N., Oakley, S., Young, I. & Bardgett, R. (2011) Additional carbon
sequestration benefits of grassland diversity restoration. Journal of Applied Ecology 48:3, 600-608.
DEFRA (2009) Protecting our water, soil and air: A code of good agricultural practice for farmers, growers and land
managers. Norwich. TSO
Department of Agriculture, food and the Marine (DAFM) (2015) National Strategic Plan for Sustainable Aquaculture
Development – Draft for Public Consultation. DAFM, Dublin. 109pp
Department of Environment, Heritage and Local Government (2008) Skellig Michael World Heritage Site
Management Plan 2008–2018. Department of Environment, Heritage and Local Government, Dublin
138pp
Department of Environment, Heritage and Local Government (2009) The Monastic City of Clonmacnoise and its
Cultural Landscape, Candidate World Heritage Site: World Heritage Site Draft Management Plan 2009 - 2014.
Department of Environment, Heritage and Local Government, Dublin 219pp.
Dirzo, R., & Raven, P. (2003) Global state of biodiversity and loss. Annual Review of Environment and Resources 28:1,
137-167.
Dominati, E., Patterson, M., & Mackay, A. (2010) A framework for classifying and quantifying the natural capital
and ecosystem services of soils. Ecological Economics, 69:9, 1858-1868.

National ecosystem and ecosystem service mapping pilot
137
Doris et al. (2015) Drinking Water Report 2014. EPA, Wexford. 54pp.
DragonflyIreland database (unpublished database maintained by Brian Nelson, NPWS in conjunction with NBDC
and CEDaR)
Dunfield, P., Dumont, R., Moore, T., & others. (1993) Methane production and consumption in temperate and
subarctic peat soils: response to temperature and pH. Soil Biology and Biochemistr, 25:3, 321-326.
Ecorys (2012) Economic Value of Ireland's Historic Environment. Final report to the Heritage Council, Kilkenny
94pp.
Egoh, B., Drakou, E.G., Dunbar, M.B., Maes, J. & L. Willemen (2012) Indicators for mapping ecosystem services: a
review. Report EUR25456EN. Publications Office of the European Union, Luxembourg.
Emmett, B., Reynolds, B., Chamberlain, P., Rowe, E., Spurgeon, D., Brittain, S. & Woods, C. (2010). Soils Report
from 2007 (Vol. 9/07). Countryside Survey.
Eswaran, H., Van Den Berg, E., & Reich, P. (1993) Organic carbon in soils of the world. Soil science society of
America journal 57:1, 192-194.
European Commission (2011) Biodiversity Strategy, Retrieved from:
http://ec.europa.eu/environment/nature/biodiversity/strategy/index_en.htm
Evans, M., Warburton, J., & Yang, J. (2006) Eroding blanket peat catchments: global and local implications of
upland organic sediment budgets. Geomorphology 79:1, 45-57.
Executive, S. (2007) ECOSSE - Estimating Carbon In Organic Soils Sequestration And Emissions. (S. E. Environment, &
R. A. Department, Eds.) Scottish Executive.
Fabian, Y., Sandau, N., Bruggisser, O., Aebi, A., Kehrli, P., Rohr, R. & Bersier, L. (2013) The importance of
landscape and spatial structure for hymenopteran-based food webs in an agro-ecosystem. Journal of
Animal Ecology 82:6, 1203-1214.
Fáilte Ireland (2007) Tourism Product Development Strategy 2007-2013. Fáilte Ireland, Dublin. 97pp.
Fáilte Ireland (2009) Determination of Waters of National Tourism Significance and Associated Water Quality Status.
Fáilte Ireland, Dublin. 52pp.
Fáilte Ireland (2016) Activity product usage among overseas tourists in 2014. Fáilte Ireland, Dublin 9pp.
Fáilte Ireland (2016) Cultural product usage among overseas tourists in 2014. Fáilte Ireland, Dublin 9pp.
FAO (2006) Fishery Country Profile: Ireland. FAO, Rome.
Farmer, D., Sivapalan, M., & Jothityangkoon, C. (2003) Climate, soil, and vegetation controls upon the variability
of water balance in temperate and semiarid landscapes: Downward approach to water balance analysis.
Water Resources Research 39:2.
Ferguson, A. (1989) Genetic differences among brown trout, Salmo trutta, stocks and their importance for the
conservation and management of the species. Freshwater biology 21:1, 35-46.
Ferguson, A. J. B. T., Taggart, J. B., Prodöhl, P. A., McMeel, O., Thompson, C., Stone, C., & Hynes, R. A. (1995) The
application of molecular markers to the study and conservation of fish populations, with special
reference to Salmo. Journal of Fish Biology 47, 103-126.
Fernandez, F. Crowley, W. & Wilson S. (2009a) Clara Bog (Clara, Co. Laois) High Bog Ecological Survey, National
Parks & Wildlife Service, Department of Environment, Heritage and Local Government, Dublin.
Fernandez, F. Crowley, W. & Wilson S. (2009b) Killamuck Bog (Abbeyleix, Co. Laois) High Bog Ecological Survey, Bord
Na Móna, Dublin.Fernandez, F. Crowley, W. & Wilson S. (2012) Raised Bog Monitoring Survey, National
Parks & Wildlife Service, Department of Environment, Heritage and Local Government, Dublin.

National ecosystem and ecosystem service mapping pilot
138
Fernandez, F., Connolly K., Crowley W., Denyer J., Duff K. & Smith G. (2014) Raised Bog Monitoring and
Assessment Survey 2013. Irish Wildlife Manuals, No. 81. National Parks and Wildlife Service, Department
of Arts, Heritage and Gaeltacht, Dublin, Ireland.
Fernandez, F., Fanning, M., McCorry, M. & Crowley, W. (2005) Raised Bog Monitoring Project 2004-5, Unpublished
report, National Parks & Wildlife Service, Department of Environment, Heritage and Local Government,
Dublin.
Fernandez, F., MacGowan, F., Crowley, W., Farrell, M., Croal, Y., Fanning, M. & McKee M. (2006) Assessment of
the Impacts of turf cutting on designated Raised Bogs 2003-06, Unpublished report, National Parks and
Wildlife Service, Department of Environment, Heritage and Local Government, Dublin.
Fetter, C. W. (1994) Applied hydrogeology (4th Ed). Upper Saddle River: Prentice Hall.
Firbank, L. & Bradbury, R. (2012). Delivering multiple ecosystem services from Enclosed Farmland in the UK
Agriculture, Ecosystems and Environment. UK. UKNEA.
Fisheries Ireland (2016) http://www.fisheriesireland.ie/fish-species/arctic-char.html
Fitter, A. H. (1991) Characteristics and functions of root systems. Plant roots: the hidden half 2, 1-29
Fitzpatrick, U., Murray, T.E., Byrne, A., Paxton, R.J. & Brown, M.J.F. (2006) Regional Red List of Irish Bees.
National Parks & Wildlife Service (Ireland) & Environment & Heritage Service (Northern Ireland).
Foley, J., DeFries, R., Asner, G., Barford, C., Bonan, G., Carpenter, S. (2005) Global consequences of land use.
Science, 309:5734, 570-574.
Fontaine, S., Barot, S., Barré, P., Bdioui, N., Mary, B., & Rumpel, C. (2007) Stability of organic carbon in deep soil
layers controlled by fresh carbon supply. Nature 450:7167, 277-280.
Food, & of the United Nations, A. O. (2001) Plantations and Greenhouse Gas Mitigation: A short Review. Forest
Plantations Thematic Papers, Working Paper FP/12.
Fornara, D., & Tilman, D. (2008) Plant functional composition influences rates of soil carbon and nitrogen
accumulation. Journal of Ecology 96:2, 314-322.
Fossitt, J.A., (2000) A guide to habitats in Ireland. Heritage Council/Chomhairle Oidhreachta
Foster, G. N., Nelson, B. H. & O Connor, Á. (2009) Ireland Red List No. 1 – Water beetles. National Parks &
Wildlife Service, Department of Environment, Heritage & Local Government, Dublin, Ireland.
Foster, J.W. (ed) (1999) Nature in Ireland: A Scientific and Cultural History. McGill-Queen's University Press 658pp
Foster, S., & Chilton, P. (2003) Groundwater: the processes and global significance of aquifer degradation.
Philosophical Transactions of the Royal Society of London. Series B: Biological Sciences 358:1440, 1957-1972.
Fox, R., Asher, J., Brereton, T., Roy, D. & Warren, M. (2006) The state of butterflies in Britain and Ireland. Pisces
Publications, Newbury.
Fox, R., Asher, J., Brereton, T., Roy, D. & Warren, M. (2006) The state of butterflies in Britain and Ireland. Pisces
Publications, Newbury. Ireland Marsh Fritillary Database (unpublished database maintained by Brian
Nelson, NPWS in conjunction with NBDC)
Frank, A., & Karn, J. (2005) Shrub Effects on Carbon Dioxide and Water Vapor Fluxes over Grasslands. Rangeland
ecology & management 58:1, 20-26.
Frenzel, P., & Karofeld, E. (2000) CH4 emission from a hollow-ridge complex in a raised bog: the role of CH4
production and oxidation. Biogeochemistry 51:1, 91-112.
Fu, M., Kelly, J. A., & Clinch, J. P. (2014) Residential solid fuel use: Modelling the impacts and policy implications
of natural resource access, temperature, income, gas infrastructure and government regulation. Applied
Geography 52, 1-13.
Fullen, M. (1998) Effects of grass ley set-aside on runoff, erosion and organic matter levels in sandy soils in east
Shropshire, UK. Soil and Tillage Research 46:1, 41-49.
Gaston, K. (2000) Global patterns in biodiversity. Nature 405:6783, 220-227.
National ecosystem and ecosystem service mapping pilot
139
Gearey, B. R., Fletcher, W., & Fyfe, R. (2014) Managing, Valuing, and Protecting Heritage Resources in the
Twenty-First Century: Peatland Archaeology, the Ecosystem Services Framework, and the Kyoto
Protocol. Conservation and Management of Archaeological Sites 16:3, 236-244.
Gillmor, D. A. (1987) Concentration of enterprises and spatial change in the agriculture of the Republic of Ireland.
Transactions of the Institute of British Geographers 12:2, 204-216.
Gleick, P. H. (1993) Water in Crisis. Oxford, Oxford University Press.
Green, R., Rudeforth, C., Hartnup, R., Lea, J., Thompson, T., & Wright, P. (1984) Soils and their use. (R. Green, Ed.)
Soil survey of England and Wales.
Gupta, S., & Larson, W. (1979) Estimating soil water retention characteristics from particle size distribution,
organic matter percent, and bulk density. Water resources research 15:6, 1633-1635.
Gyssels, G., Poesen, J., Bochet, E., & Li, Y. (2005). Impact of plant roots on the resistance of soils to erosion by
water: a review. Progress in Physical Geography 29:2, 189-217.
Hagon, S., Ottitsch, A., Convery, I., Herbert, A., Leafe, R., Robson, D., & Weatherall, A. (2013) Managing Land for
Carbon - A guide for farmers, land managers and advisers.
Haines-Young, R. and M. Potschin (2013) Common International Classification of Ecosystem Services (CICES), Version
4.3. Report to the European Environment Agency (download: www.cices.eu)
Hallberg, G. (1987) Agricultural chemicals in ground water: extent and implications. American Journal of
Alternative Agriculture 2:1, 3-15.
Halpern, B., Walbridge, S., Selkoe, K., Kappel, C., Micheli, F., D'Agrosa, C., others (2008) A global map of human
impact on marine ecosystems. Science 319:5865, 948-952.
Halpin, S., Kretsch, C., & Keeley, B. (2004) Archaeological, Ecological & Structural Survey of Cargin Church, County
Galway. Moore Group, Galway 70pp.
Hanna, A. Y., Harlan, P. W., & Lewis, D. T. (1982) Soil available water as influenced by landscape position and
aspect. Agronomy Journal 74:6, 999-1004.
Harrod, C., Griffiths, D., McCarthy, T. K., & Rosell, R. (2001) The Irish pollan, Coregonus autumnalis: options for its
conservation. Journal of Fish Biology 59, 339-355
Hartanto, H., Prabhu, R., Widayat, A., & Asdak, C. (2003) Factors affecting runoff and soil erosion: plot-level soil
loss monitoring for assessing sustainability of forest management. Forest Ecology and Management 180:1,
361-374.
Haygarth, P., & Ritz, K. (2009) The future of soils and land use in the UK: soil systems for the provision of land-
based ecosystem services. Land Use Policy 26, 187-197.
Heathwaite, A., Quinn, P., & Hewett, C. (2005) Modelling and managing critical source areas of diffuse pollution
from agricultural land using flow connectivity simulation. Journal of Hydrology 304:1, 446-461.
Helal, H., & Sauerbeck, D. (1986). Effect of plant roots on carbon metabolism of soil microbial biomass. Zeitschrift
für Pflanzenernährung und Bodenkunde 149:2, 181-188.
Heritage Council (2010) Case Studies on High Nature Value Farming in Ireland - North Connemara and the Aran Islands.
Heritage Council, Kilkenny 16pp.
Heritage Council (2010) Ireland’s thatched roofs. Heritage Council, Kilkenny;
Hladyz, S., Åbjörnsson, K., Chauvet, E., Dobson, M., Elosegi, A., Ferreira, V., … Vought, L. B.-M. (2011). Chapter 4
– Stream Ecosystem Functioning in an Agricultural Landscape: The Importance of Terrestrial–Aquatic
Linkages. In Advances in Ecological Research (Vol. 44, pp. 211–276). http://doi.org/10.1016/B978-0- 12-
374794- 5.00004-3

National ecosystem and ecosystem service mapping pilot
140
Holden, J. (2005) Peatland hydrology and carbon release: why small-scale process matters. Philosophical
Transactions of the Royal Society A: Mathematical, Physical and Engineering Sciences 363:1837, 2891-2913.
Holden, J., Chapman, P., & Labadz, J. (2004) Artificial drainage of peatlands: hydrological and hydrochemical
process and wetland restoration. Progress in Physical Geography 28:1, 95-123.
Holden, J., Kirkby, M., Lane, S., Milledge, D., Brookes, C., Holden, V., & McDonald, A. (2008) Overland flow
velocity and roughness properties in peatlands. Water Resources Research 446.
Holden, N. M., & Connolly, J. (2011) Estimating the carbon stock of a blanket peat region using a peat depth
inference model. Catena 86:2, 75-85.
Holman, I. (2009) An estimate of peat reserves and loss in the East Anglian Fens. Department of Natural Resources,
Cranfield University / RSPB.
Hooper, D., Chapin Iii, F., Ewel, J., Hector, A., Inchausti, P., Lavorel, S., others. (2005) Effects of biodiversity on
ecosystem functioning: a consensus of current knowledge. Ecological monographs 75:1, 3-35.
Inland Fisheries Ireland (2015) National Strategy for Angling Development (NSAD) 2015-2020. IFI, Dublin. 34pp
Ireland Marsh Fritillary Database (unpublished database maintained by Brian Nelson, NPWS in conjunction with
NBDC)
Irish Forestry and Forest Products Association (2012) An overview of the Irish forestry and forest products sector 2012.
IBEC, Dublin 88pp.
Jenny, H. (1994). Factors of soil formation: a system of quantitative pedology. Courier Dover Publications. Retrieved
from http://lfs-farmpracticum.sites.olt.ubc.ca/files/2013/04/Factors-of-Soil-Formation-Jenny-1941.pdf
Joint Committee on Environment, Culture, and the Gaeltacht (2015) 31st Dáil Éireann / 24th Seanad Éireann; Report
on the Committee on Developing the Seaweed Industry in Ireland. Houses of the Oireachtas, Dublin. 35pp
Jones, L., Angus, S., Cooper, A., Doody, P., Everard, M., Garbutt, A. & others (2011). UK National Ecosystem
Assessment - Chapter 11: Coastal Margins. (L. Jones, Ed.) UK National Ecosystem Assessment.
Judith A. Annett Countryside Consulting (2013) Lakelands and Inland Waterways StrategicPlan; 2013-2016 Mid-term
review. Waterways Ireland, Dublin.
Karvonen, A., Aalto‐Araneda, M., Virtala, A. M., Kortet, R., Koski, P., & Hyvärinen, P. (2016) Enriched rearing
environment and wild genetic background can enhance survival and disease resistance of salmonid
fishes during parasite epidemics. Journal of Applied Ecology 53:1, 213-221.
Kayranli, B., Scholz, M., Mustafa, A., & Hedmark, A. (2010) Carbon storage and fluxes within freshwater
wetlands: a critical review. Wetlands 30:1, 111-124.
Kelly‐Quinn, M. & Regan, E.C. (2012) Ireland Red List No. 7: Mayflies (Ephemeroptera). National Parks and
Wildlife Service, Department of Arts, Heritage and the Gaeltacht, Dublin, Ireland.
Kimberley, S. & Waldren (in prep.) Turlough Ecological and Conservation Assessment, Chapter 11: Site Reports.
Unpublished Report to the National Parks & Wildlife Service. Department of Arts, Heritage and the
Gaeltacht.
Kimberley, S. & Waldren, S. (in prep.) Turlough Ecological and Conservation Assessment, Chapter 1: Introduction.
Unpublished Report to the National Parks & Wildlife Service. Department of Arts, Heritage and the
Gaeltacht.
Kimberley, S. (in prep.) Turlough Ecological and Conservation Assessment, Chapter 2: Site Selection. Unpublished
Report to the National Parks & Wildlife Service. Department of Arts, Heritage and the Gaeltacht.
Kimberley, S. (in prep.) Turlough Ecological and Conservation Assessment, Chapter 6: Turlough Soils and Landuse.
Unpublished Report to the National Parks & Wildlife Service. Department of Arts, Heritage and the
Gaeltacht.

National ecosystem and ecosystem service mapping pilot
141
Knops, J., Tilman, D., Haddad, N., Naeem, S., Mitchell, C., Haarstad, J. & others. (1999) Effects of plant species
richness on invasion dynamics, disease outbreaks, insect abundances and diversity. Ecology Letters 2:5,
286-293.
Knowlton, E.C. (1929) Nature in Older Irish. Proceedings of the Modern Language Association, 44:1; 92-122
Kopittke, G., Tietema, A., van Loon, E., & Kalbitz, K. (2013) The age of managed heathland communities:
implications for carbon storage? Plant and soil 369:1-2, 219-230.
Kutsch, W. L., Bahn M., and Heinemayer, A., Eds. (2012) Soil Carbon Dynamics. Cambridge, Cambridge
University Press.
Lake, S. (2015). Britain’s habitats: a guide to the wildlife habitats of Britain and Ireland. Princeton, New Jersey.
Princeton University Press.
Lane, S., Brookes, C., Louise Heathwaite, A., & Reaney, S. (2006) Surveillant science: challenges for the
management of rural environments emerging from the new generation diffuse pollution models. Journal
of Agricultural Economics 57:2, 239-257.
Latocha, A. (2015) Past Human Activities Recorded in the Landscape: A Case Study from the Glenveagh National
Park, Ireland. Landscape Research 40:3, 338-358.
Laurance, W., & Yensen, E. (1991) Predicting the impacts of edge effects in fragmented habitats. Biological
Conservation 55:1, 77-92.
Lavelle, P., Decaens, T., Aubert, M., Barot, S., Blouin, M., Bureau, F. & Rossi, J. (2006) Soil invertebrates and
ecosystem services. European Journal of Soil Biology 42, 3-15.
Levine, J., & HilleRisLambers, J. (2009) The importance of niches for the maintenance of species diversity. Nature
461:7261, 254-257.
Lichtfouse, E. (Ed.). (2011) Alternative farming systems, biotechnology, drought stress and ecological
fertilisation (Vol. 6). Springer Science & Business Media
Lindsay, R. (2010) Peatbogs and carbon: a critical synthesis to inform policy development in oceanic peat bog
conservation and restoration in the context of climate change. RSPB Scotland.
Littlewood, N., Anderson, P., Artz, R., Bragg, O., Lunt, P., & Marrs, R. (2010) Peatland biodiversity. IUCN UK
Peatland Programme, Edinburgh.
Lucas, R. E., and Davis, J. (1961) Relationships between pH values of organic soils and availabilities of 12 plant
nutrients. Soil Science 92:3, 177-182.
Lydon, K., and Smith, G. (2014) CORINE landcover 2012, Ireland: Final Report. Environmental Protection Agency,
Wexford. 55pp
Lyytimäki, J. (2014) Bad nature: Newspaper representations of ecosystem disservices. Urban Forestry & Urban
Greening 13:3, 418-424.
MA, 2005 Millenium Ecosystem Assessment (2005) - Current state and trends. Washington, DC.
MAFF (1988) Agricultural Land Classification of England and Wales – Revised guidelines and criteria for grading
the quality of agricultural land. Ministry of Agriculture, Fisheries and Food.
MacDonald, J., Fowler, D., Hargreaves, K., Skiba, U., Leith, I., & Murray, M. (1998) Methane emission rates from a
northern wetland; response to temperature, water table and transport. Atmospheric Environment 32:19,
3219-3227.
Mace, G. M., Norris, K., & Fitter, A. H. (2012) Biodiversity and ecosystem services: a multilayered relationship. Trends
in ecology & evolution 27:1, 19-26.
MAES et al. (2014) Mapping and Assessment of Ecosystems and their Services Indicators for ecosystem assessments under
Action 5 of the EU Biodiversity Strategy to 2020. 2nd Report. European Union

National ecosystem and ecosystem service mapping pilot
142
Maitland, P.S., Winfield, I.J., McCarthy, I. & Igoe, F. (2007) The status of Arctic charr Salvelinus alpinus in Britain
and Ireland. Ecology of Freshwater Fish 16:1, 6–19.
Malmon, D., Dunne, T., & Reneau, S. (2002) Predicting the fate of sediment and pollutants in river floodplains.
Environmental science & technology 36:9, 2026-2032.
Marine Institute (2014) Atlas of Commercial Fisheries Around Ireland; Second Edition. Marine Institute, Galway.
62pp.
Marine Institute (2015) Stock Book: Annual Review of Fish Stocks in 2015 with Management Advice for 2016. Marine
Institute, Galway. 481pp.
Martin, J.R., Gabbett, M., Perrin, P.M. & Delaney, A. (2007) Semi-natural Grassland Survey of Counties Roscommon
and Offaly. Unpublished report to National Parks and Wildlife Service, Dublin. Unpublished report to
National Parks & Wildlife Service, Department of Environment, Heritage and Local Government,
Dublin.
Martin, J.R., Perrin, P.M., Delaney, A.M., O’Neill, F.H. & McNutt, K.E. (2008) Irish Semi-natural Grasslands Survey -
Annual Report No. 1: Counties Cork and Waterford. Unpublished report to National Parks & Wildlife
Service, Department of Environment, Heritage and Local Government, Dublin.
Martínez-Harms & Balvanera, 2012 Martínez-Harms, M.J. & P. Balvanera (2012) Methods for mapping ecosystem
service supply: a review. International Journal of Biodiversity Science, Ecosystem Services &
Management 8, 17–25.
McCorry, M. (2007). Saltmarsh Monitoring Project 2006 – Summary Report. An unpublished report for the National
Parks & Wildlife Service, Department of Environment, Heritage and Local Government, Dublin.
McCorry, M. and Ryle T. (2009). Saltmarsh Monitoring Project 2007-2008 – Summary Report. An unpublished report
for the National Parks & Wildlife Service, Department of Environment, Heritage and Local Government,
Dublin.
McCracken, D., Stoate, C., Goulding, K., Harmer, R., Hess, T., Jenkins, A., Williams, P., and others (2011). UK
National Ecosystem Assessment - Chapter 7: Enclosed Farmland. (L. Firbank, & R. Bradbury, Eds.) UK
National Ecosystem Assessment.
Medcalf, K.; Small, N.; Finch, C., and Parker, J. (2012) Spatial framework for assessing evidence needs for operation
ecosystem approaches. JNCC, Peterborough. ISSN 0963 8901
Medina-Roldàn, E., Paz-Ferreiro, J., & Bardgett, R. (2012) Grazing exclusion affects soil and plant communities,
but has no impact on soil carbon storage in an upland grassland. Agriculture, Ecosystems & Environment
149, 118-123.
Melillo, J., Aber, J., Linkins, A., Ricca, A., Fry, B., & Nadelhoffer, K. (1989) Carbon and nitrogen dynamics along
the decay continuum: plant litter to soil organic matter. In Ecology of Arable Land—Perspectives and
Challenges (pp. 53-62). Springer.
MERC Consultants (2008) Status of Irish Aquaculture, 2007. BIM, Dublin. 144pp
Middelkoop, H., & Van Der Perk, M. (1998) Modelling spatial patterns of overbank sedimentation on embanked
floodplains. Geografiska Annaler: Series A, Physical Geography 80(2), 95-109.
Miller, P.I. & Christodoulou, S. (2014) Frequent locations of ocean fronts as an indicator of pelagic diversity:
application to marine protected areas and renewables. Marine Policy 45, 318-329.
Milne, R., & Brown, T. (1997) Carbon in the Vegetation and Soils of Great Britain . Journal of Environmental
Management 49:4, 413-433.
Mitsch, W., & Gosselink, J. (2000) The value of wetlands: importance of scale and landscape setting. Ecological
economics 35:1, 25-33.
Mittelbach, G., Schemske, D., Cornell, H., Allen, A., Brown, J., Bush, M. & others. (2007) Evolution and the
latitudinal diversity gradient: speciation, extinction and biogeography. Ecology letters 10:4, 315-331.

National ecosystem and ecosystem service mapping pilot
143
Mommer, L., Van Ruijven, J., De Caluwe, H., Smit-Tiekstra, A., Wagemaker, C., Joop Ouborg, N., De Kroon, H. &
others (2010). Unveiling below-ground species abundance in a biodiversity experiment: a test of vertical
niche differentiation among grassland species. Journal of Ecology 98:5, 1117-1127.
Mononen, L., Auvinen, A.P., Ahokumpu, A.L., Rönkä, M., Aarras, N., Tolvanen, H., Kamppinen, M., Viirret, E.,
Kumpula, T. and Vihervaara, P., (2016) National ecosystem service indicators: Measures of social–
ecological sustainability. Ecological Indicators 61, 27-37.
Mottiar, Z., Quinn, B., Ryan, T. & Stacey, J. (2013) Building Collaboration Between the Arts & Culture and Tourism
Sectors in the West of Ireland. Fáilte Ireland, Dublin 71pp.
Murphy, S. & Fernandez, F. (2009) The development of methodologies to assess the conservation status of limestone
pavement and associated habitats in Ireland. Irish Wildlife Manuals, No. 43. National Parks and Wildlife
Service, Department of the Environment, Heritage and Local Government, Dublin, Ireland.
Murray, P. M., Moane, S., Collins, C., Beletskaya, T., Thomas, O. P., Duarte, A. W., McHugh, E. & others (2013)
Sustainable production of biologically active molecules of marine based origin. New Biotechnology 30:6,
839-850.
Murray, T.E., Malone, B. (2015) Mapping and Assessment of Ecosystem Services in Ireland: Post-Symposium
Report. National Biodiversity Data Centre.
Naeem, S., Bunker, D, E., Hector, A., Loreau, M., Perrings, C. (2010) Biodiversity, Ecosystem Functioning, and Human
Wellbeing. Oxford. Oxford University Press.
Nash, T. (1996) Lichen biology. (T. Nash, Ed.) Cambridge University Press.
National Biodiversity Data Centre (2016), http://maps.biodiversityireland.ie/#/DataSet/73/Geographical
Naughton, O., Johnston, P & Gill, L. (in prep.) Turlough Ecological and Conservation Assessment, Chapter 3:
Hydrology. Unpublished Report to the National Parks & Wildlife Service. Department of Arts, Heritage
and the Gaeltacht.
NEA-UK (2014), http://uknea.unep-wcmc.org/Resources/tabid/82/Default.aspx
Nelson, B., Ronayne, C. & Thompson, R. 2011. Ireland Red List No.6: Damselflies & Dragonflies (Odonata).
National Parks and Wildlife Service, Department of the Environment, Heritage and Local Government,
Dublin, Ireland.
Nelson, E., Mendoza, G., Regetz, J., Polasky, S., Tallis, H., Cameron, D. & others. (2009) Modeling multiple
ecosystem services, biodiversity conservation, commodity production, and tradeoffs at landscape scales.
Frontiers in Ecology and the Environment 7:1, 4-11.
Nielsen, U., Ayres, E., Wall, D., & Bardgett, R. (2011) Soil biodiversity and carbon cycling: a review and synthesis
of studies examining diversity--function relationships. European Journal of Soil Science 62:1, 105-116.
Nisbet, T., Silgram, M., Shah, N., Morrow, K., & Broadmeadow, S. (2011). Woodland for Water: Woodland
measures for meeting Water Framework Directive objectives. Forest Research Monograph 4, 156.
Norris, K., Bailey, M., Baker, S., Bradbury, R., Chamberlain, D., Duck, C., Watt, A. & others (2011) UK National
Ecosystem Assessment. In K. Norris (Ed.). UNEP-WCMC.
North / South Interparliamentary Association (2014) Sports Tourism: Background briefing prepared by the Research and
Information Service (RaISe) of the Northern Ireland Assembly and of the Library & Research Service of the Houses
of the Oireachtas. Houses of the Oireachtais, Dublin 35pp.
NPWS (2008) The status of EU protected Habitats and species in Ireland. Conservation Status in Ireland of Habitats and
Species listed in the European Council Directive on the conservation of Habitats, Flora and Fauna 92/43/EEC.
National Parks and Wildlife Service, Department of the Environment, Heritage and Local Government
National ecosystem and ecosystem service mapping pilot
144
NPWS (2013) The Status of Protected EU Habitats and Species in Ireland. Overview Volume 1. Unpublished
Report, National Parks & Wildlife Services. Department of Arts, Heritage and the Gaeltacht, Dublin,
Ireland. Editor: Deidre Lynn.
O’Neill, F.H. & Martin, J.R. (2015) Summary of findings from the Survey of Potential Turloughs 2015. Unpublished
Report for National Parks & Wildlife Service. Volume I: Main Report.
O’Neill, F.H., Martin, J.R., Devaney, F.M. & Perrin, P.M. (2013) The Irish semi-natural grasslands survey 2007-2012.
Irish Wildlife Manuals, No. 78. National Parks and Wildlife Service, Department of Arts, Heritage and
the Gaeltacht, Ireland.
O’Neill, F.H., Martin, J.R., Devaney, F.M., McNutt, K.E., Perrin, P.M. & Delaney, A. (2010) Irish Semi-natural
Grasslands Survey Annual Report No. 3: Counties Donegal, Dublin, Kildare & Sligo. Report submitted to
National Parks & Wildlife Service, Dublin.
O’Neill, F.H., Martin, J.R., Perrin, P.M., Delaney, A. McNutt, K.E. & Devaney, F.M. (2009) Irish Semi-natural
Grasslands Survey - Annual Report No. 2: Counties Cavan, Leitrim, Longford and Monagahan. Unpublished
report to National Parks & Wildlife Service, Department of Environment, Heritage and Local
Government, Dublin.
O’Rourke, E., Kramm, N., & Chisholm, N. (2012) The influence of farming styles on the management of the
Iveragh uplands, southwest Ireland. Land Use Policy 29:4, 805-816.
O'Neill, F.H. & Barron, S.J. (2013) Results of a two-year monitoring survey of Annex I Old sessile oak woods (91A0) and
Alluvial forests (91E0) in Ireland. Irish Wildlife Manuals, No. 71. National Parks & Wildlife Service,
Dublin.
Opdam, P., & Wascher, D. (2004) Climate change meets habitat fragmentation: linking landscape and
biogeographical scale levels in research and conservation. Biological conservation 117:3, 285-297.
Osborne, J., Martin, A., Carreck, N., Swain, J., Knight, M., Goulson, D., Sanderson, R. & others (2008). Bumblebee
flight distances in relation to the forage landscape. Journal of Animal Ecology 77:2, 406-415.
Ostle, N., Levy, P., Evans, C., & Smith, P. (2009) UK land use and soil carbon sequestration. Land Use Policy 26,
274-283.
Pagella, T. F., and Sinclair, F. L. (2014) Development and use of a typology of mapping tools to assess their fitness
for supporting management of ecosystem service provision. Landscape ecology 29:3, 383-399.
Pagliai, M., Vignozzi, N., & Pellegrini, S. (2004) Soil structure and the effect of management practices. Soil and
Tillage Research 79:2, 131-143.
Parikh, S., & James, B. (2012) Soil: the foundation of agriculture. Nature Education Knowledge 3:10, 2.
Pauleit, S., & Duhme, F. (2000) Assessing the environmental performance of land cover types for urban planning.
Landscape and urban planning, 52:1, 1-20.
Paustian, K., Andrén, O., Janzen, H., Lal, R., Smith, P., Tian, G., Woomer, P. and others (1997) Agricultural soils as
a sink to mitigate CO2 emissions. Soil use and management 13:4, 230-244.
Perrin, P., Martin, J., Barron, S., O'Neill, F., McNutt, K. & Delaney, A. (2008) National survey of native woodlands
2003-2008. Unpublished report submitted to National Parks & Wildlife Service, Dublin.
Perrin, P.M. & Daly, O.H. (2010) A provisional inventory of ancient and long‐established woodland in Ireland. Irish
Wildlife Manuals, No. 46. National Parks and Wildlife Service, Department of the Environment,
Heritage and Local Government, Dublin, Ireland.
Perrin, P.M., Barron, S.J., Roche, J.R. & O’Hanrahan, B. (2013a.) Guidelines for a national survey and conservation
assessment of upland vegetation and habitats in Ireland. Version 2.0. Irish Wildlife Manuals, No. 48. National
Parks and Wildlife Service, Department of Arts, Heritage and the Gaeltacht, Dublin, Ireland.
Perrin, P.M., O’Hanrahan, B., Roche, J.R., Barron, S.J. (2009) Scoping study and pilot survey for a national survey and
conservation assessment of upland habitats and vegetation in Ireland, Report submitted to National Parks and
Wildlife Service, Department of Environment, Heritage and Local Government, Dublin, Ireland.
National ecosystem and ecosystem service mapping pilot
145
Perrin, P.M., Roche, J.R. & Barron, S.J. (2011) National Survey of Upland Habitats (Phase 1, 2010 - 2012) Site Report No
1: Mweelrea, Sheeffry, Erriff Complex cSAC (001932) Co. Mayo. National Parks and Wildlife Service,
Department of the Environment, Heritage and Local Government, Dublin, Ireland.
Perrin, P.M., Roche, J.R., Barron, S.J. & Daly, O.H. (2012) National Survey of Upland Habitats (Phase 2, 2011-2012),
Site Report No. 7: Mount Brandon cSAC (000375), Co. Kerry. National Parks and Wildlife Service,
Department of Arts, Heritage and the Gaeltacht, Dublin, Ireland.
Perrin, P.M., Roche, J.R., Barron, S.J., Daly, O.H., Hodd, R.L., Muldoon, C.S. & Leyden, K.J. (2013b). National
Survey of Upland Habitats (Phase 3, 2012-2013), Draft Site Report No. 10: Ox Mountains Bogs cSAC (002006),
Cos. Mayo and Sligo. National Parks and Wildlife Service, Department of Arts, Heritage and the
Gaeltacht, Dublin, Ireland.
Perrin, P.M., Roche, J.R., Barron, S.J., Daly, O.H., Hodd, R.L., Muldoon, C.S. & Leyden, K.J. (2013c). National
Survey of Upland Habitats (Phase 3, 2012-2013), Draft Site Report No. 11: Ben Bulben, Gleniff and Glenade
Complex cSAC (000623), Co. Sligo. National Parks and Wildlife Service, Department of Arts, Heritage and
the Gaeltacht, Dublin, Ireland.
Perrin, P.M., Roche, J.R., Barron, S.J., Daly, O.H., Hodd, R.L., Muldoon, C.S. & Leyden, K.J. (2013d). National
Survey of Upland Habitats (Phase 3, 2012-2013), Draft Site Report No. 12: Arroo Mountain cSAC (001403), Co.
Leitrim. National Parks and Wildlife Service, Department of Arts, Heritage and the Gaeltacht, Dublin,
Ireland.
Perrin, P.M., Roche, J.R., Barron, S.J., Daly, O.H., Hodd, R.L., Muldoon, C.S. & Leyden, K.J. (2013e). National
Survey of Upland Habitats (Phase 3, 2012-2013), Draft Site Report No. 13: Cuilcagh – Anierin Uplands cSAC
(000584), Cos. Cavan and Leitrim. National Parks and Wildlife Service, Department of Arts, Heritage and
the Gaeltacht, Dublin, Ireland.
Perrin, P.M., Roche, J.R., Barron, S.J., Daly, O.H., Hodd, R.L., Muldoon, C.S. & Leyden, K.J. (2013f). National
Survey of Upland Habitats (Phase 3, 2012-2013), Draft Site Report No. 14: Slieve League cSAC (000189), Co.
Donegal. National Parks and Wildlife Service, Department of Arts, Heritage and the Gaeltacht, Dublin,
Ireland.
Perry, T., & Nawaz, R. (2008) An investigation into the extent and impacts of hard surfacing of domestic gardens
in an area of Leeds, United Kingdom. Landscape and urban planning 86:1, 1-13.
Potschin, M. and R. Haines-Young (2011) Ecosystem Services: Exploring a geographical perspective. Progress in
Physical Geography 35:5, 575-594
Potschin, M., & Haines-Young, R. (2016) Defining and measuring ecosystem services. Potschin, M., Haines-Young, R.,
Fish, R. and Turner, RK (eds) Routledge Handbook of Ecosystem Services. Routledge, London and New
York, 125.
Purvis, A., & Hector, A. (2000) Getting the measure of biodiversity. Nature 405:6783, 212-219.
Quine, C., Cahalan, C., Hester, A., Humphrey, J., Kirby, K., Moffat, A., & Valatin, G. (2011) UK National Ecosystem
Assessment - Chapter 8: Woodlands. (C. Quine, Ed.) UK National Ecosystem Assessment.
Rankin, M., Semple, W., Murphy, B., & Koen, T. (2007) Is there a close association between ‘soils’ and
‘vegetation’? A case study from central western New South Wales. Cunninghamia 10:2.
Raskin, I., Kumar, P., Dushenkov, S., & Salt, D. (1994) Bioconcentration of heavy metals by plants. Current opinion
in Biotechnology 5:3, 285-290.
Rasse, D., Rumpel, C., & Dignac, M. (2005) Is soil carbon mostly root carbon? Mechanisms for a specific
stabilisation. Plant and soil 269:1-2, 341-356.
Ratcliffe, D.A. (Ed). (1977) A Nature Conservation Review. 2 vols. Cambridge. Cambridge University Press.
Reaney, S., Lane, S., Heathwaite, A., & Dugdale, L. (2011) Risk-based modelling of diffuse land use impacts from
rural landscapes upon salmonid fry abundance. Ecological Modelling 222:4, 1016-1029.
Regan, E.C., Nelson, B., Aldwell, B., Bertrand, C., Bond, K., Harding, J., Nash, D., Nixon, D., Wilson, C.J.
(2010) Ireland Red List No. 4 – Butterflies. National Parks and Wildlife Service, Department of
Environment, Heritage and Local Government, Ireland
National ecosystem and ecosystem service mapping pilot
146
Ritzema, H.P. (1994) Drainage Principles and Applications. Netherlands, ILRI.
Robinson, D., Hockley, N., Cooper, D., Emmett, B., Keith, A., Lebron, I. & others (2013) Natural capital and
ecosystem services, developing an appropriate soils framework as a basis for valuation. Soil Biology and
Biochemistry 57, 1023-1033.
Robinson, M., & Armstrong, A. C. (1988) The extent of agricultural field drainage in England and Wales, 1971-80.
Transactions of the Institute of British Geographers 19-28.
Roche, J.R., Perrin, P.M. & Barron, S.J. (2009) National Survey of Upland Habitats (Pilot Survey Phase, 2009-2010), Site
Report No. 2: Corraun Plateau cSAC (000485), Co. Mayo. National Parks and Wildlife Service, Department
of Arts, Heritage and the Gaeltacht, Dublin, Ireland.
Roche, J.R., Perrin, P.M. & Barron, S.J. (2010a) National Survey of Upland Habitats (Pilot Survey Phase, 2009-2010),
Site Report No. 3: Comeragh Mountains cSAC (001952) Co. Waterford. National Parks and Wildlife Service,
Department of the Arts, Heritage and the Gaeltacht, Dublin, Ireland.
Roche, J.R., Perrin, P.M. & Barron, S.J. (2010b) National Survey of Upland Habitats (Pilot Survey Phase, 2009-2010),
Site Report No. 4: Carlingford Mountain cSAC (000453) Co. Louth. National Parks and Wildlife Service,
Department of the Arts, Heritage and the Gaeltacht, Dublin, Ireland.
Roche, J.R., Perrin, P.M. & Barron, S.J. (2011a) National Survey of Upland Habitats (Phase 1, 2010 - 2012), Site Report
No. 6: Croaghaun / Slievemore cSAC (001955) Co. Mayo. National Parks and Wildlife Service, Department of
the Arts, Heritage and the Gaeltacht, Dublin, Ireland.
Roche, J.R., Perrin, P.M. & Barron, S.J. (2011b) National Survey of Upland Habitats (Phase 1, 2010 - 2012), Site Report
No. 5: Nephin Mountin Co. Mayo. National Parks and Wildlife Service, Department of the Arts, Heritage
and the Gaeltacht, Dublin, Ireland.
Roche, J.R., Perrin, P.M., Barron, S.J. & Daly, O.H. (2012a) National Survey of Upland Habitats (Phase 2, 2011-2012),
Site Report No. 9: Galtee Mountains cSAC (000646), Cos. Tipperary and Limerick. National Parks and Wildlife
Service, Department of Arts, Heritage and the Gaeltacht, Dublin, Ireland.
Roche, J.R., Perrin, P.M., Barron, S.J. & Daly, O.H. (2012b) National Survey of Upland Habitats (Phase 2, 2011-2012),
Site Report No. 8: Killarney NationalPark, Co. Kerry. National Parks and Wildlife Service, Department of
Arts, Heritage and the Gaeltacht, Dublin, Ireland.
Roem, W., & Berendse, F. (2000) Soil acidity and nutrient supply ratio as possible factors determining changes in
plant species diversity in grassland and heathland communities. Biological Conservation 92:2, 151-161.
Rosell R., et al. (2004) Conservation of the Irish Populations of the Pollan Coregonus autumnalis. Biology and
Environment: Proceedings of the Royal Irish Academy 104B:3, 67-72.
Rotherham, I. (2008) Flooding, Water and the Landscape. In I. Rotherham (Ed.). Wildtrack Publishing.
Roxburgh, S., Shea, K., & Wilson, J. (2004) The intermediate disturbance hypothesis: patch dynamics and
mechanisms of species coexistence. Ecology 85:2, 359-371.
Russi D., ten Brink P., Farmer A., Badura T., Coates D., Förster J., Kumar R. and Davidson N. (2012) The Economics
of Ecosystems and Biodiversity for Water and Wetlands. Final Consultation Draft.
Ryle T., Connolly, K., Murray, A. and Swann, M. (2009) Coastal Monitoring Project. A report to the National Parks
& Wildlife Service, Department of Environment, Heritage and Local Government, Dublin.
Saarikoski, H., Jax, K., Harrison, P. A., Primmer, E., Barton, D. N., Mononen, L. & Furman, E. (2015) Exploring
operational ecosystem service definitions: The case of boreal forests. Ecosystem Services.
Scallan, D (2013) A Socio-economic Assessment of the Value of Hunting in Ireland. Report for the Federation of Field
Sports of Ireland and the National Association of Regional Game Councils.
Scallan, D., (2007) A Socioeconomic Assessment of Hunting in the Republic of Ireland - Interim Summary Report for the
European Commission and the Federation of Associations for Hunting and Conservation of the EU (FACE).
National University of Ireland, Galway.

National ecosystem and ecosystem service mapping pilot
147
Sea Fisheries Protection Authority figures (2013 & 2014), http://www.sfpa.ie
Sharkey, N., Murphy, M., Kimberley, S., O’Rourke, A. & Waldren, S. (in prep.) Turlough Ecological and
Conservation Assessment, Chapter 7: Turlough Vegetation – Decsription, Mapping and Ecology. Unpublished
Report to the National Parks & Wildlife Service. Department of Arts, Heritage and the Gaeltacht.
Shutes, R. (2001) Artificial wetlands and water quality improvement. Environment international 26:5, 441-447.
Silvertown, J. (2004) Plant coexistence and the niche . Trends in Ecology & Evolution 19:11, 605-611.
Singh, J., & Gupta, S. (1977) Plant decomposition and soil respiration in terrestrial ecosystems. The Botanical
Review 43:4, 449-528.
Six, J., Conant, R., Paul, E., & Paustian, K. (2002) Stabilization mechanisms of soil organic matter: implications for
C-saturation of soils. Plant and soil 241:2, 155-176.
Small, R. (1989) Geomorphology and Hydrology. (B. Price, & J. Taylor, Eds.) Longman Modular Geography Series.
Spencer, H. B. (1978) Stability and control of two-wheel drive tractors and machinery on sloping ground. Journal
of Agricultural Engineering Research 23:2, 169-188.
Stachowicz, J., Whitlatch, R., & Osman, R. (1999). Species diversity and invasion resistance in a marine ecosystem.
Science, 286(5444), 1577-1579.
Stone, R., & Hilborn, D. (2000) Universal Soil Loss Equation, USLE. (J. Ritter, Ed.) Ministry of Agriculture, Food and
Rural Affairs.
Styles, D., Jones, M.B. (2007) Energy Crops in Ireland: An Assessment of their Potential Contribution to Sustainable
Agriculture, Electricity and Heat Production. EPA, Wexford.
Styles, D., Thorne, F., Jones, M.B. (2008) Energy crops in Ireland: An economic comparison of willow and
Miscanthus production with conventional farming systems, Biomass and Bioenergy 32:5, 407 – 421.
Swinton, S., Lupi, F., Robertson, G., & Hamilton, S. (2007) Ecosystem services and agriculture: cultivating
agricultural ecosystems for diverse benefits. Ecological economics 64:2, 245-252.
Taylor, V., Chappells, H., Medd, W., & Trentmann, F. (2009) Drought is normal: the socio-technical evolution of
drought and water demand in England and Wales, 1893--2006. Journal of Historical Geography 35:3, 568-
591.
TEEB (2010), http://www.teebweb.org/
Teklehaimanot, Z., Jarvis, P., & Ledger, D. (1991) Rainfall interception and boundary layer conductance in
relation to tree spacing. Journal of Hydrology 123:3, 261-278.
Tenerelli, P., Demšar, U., & Luque, S. (2016) Crowdsourcing indicators for cultural ecosystem services: A
geographically weighted approach for mountain landscapes. Ecological Indicators 64, 237-248.
Tews, J., Brose, U., Grimm, V., Tielbörger, K., Wichmann, M., Schwager, M., & Jeltsch, F. (2004) Animal species
diversity driven by habitat heterogeneity/diversity: the importance of keystone structures. Journal of
Biogeography 31:1, 79-92.
Thomas, S., & Martin, A. (2012). Carbon content of tree tissues: a synthesis. Forests 3:2, 332-352.
Torn, M., Trumbore, S., Chadwick, O., Vitousek, P., & Hendricks, D. (1997) Mineral control of soil organic carbon
storage and turnover. Nature 389:6647, 170-173.
Tourism Development International (2013) Socio-Economic Study of Recreational Angling in Ireland. IFI, Dublin.
161pp.
Tratalos, J. A., Haines-Young, R., Potschin, M., Fish, R., & Church, A. (2016) Cultural ecosystem services in the
UK: lessons on designing indicators to inform management and policy. Ecological Indicators 61, 63-73.
Travis, J. (2003). Climate change and habitat destruction: a deadly anthropogenic cocktail. Proceedings of the Royal
Society of London. Series B: Biological Sciences 270:1514, 467-473.

National ecosystem and ecosystem service mapping pilot
148
Tuohy, A., Bazilian, M., Doherty, R., O Gallachoir, B., O’ Malley, M.J. (2009) Burning Peat in Ireland: An
Electricity Market Dispatch Perspective, Energy Policy 37:8, 3035 – 3042
Turkelboom, F., Raquez, P., Dufrêne, M., et al. (19 authors) (2013) CICES going local: Ecosystem services classification
adapted for a highly populated country. In Jacobs, S., Dendoonker, N., and Keune, H. (eds) Ecosystem
Services. Chicago, pp. 223-247
Van Breemen, N. (1995). How Sphagnum bogs down other plants. Trends in Ecology & Evolution 10:7, 270-275.
Van den Pol Van Dasselaar, A., & Lantinga, E. (1995) Modelling the carbon cycle of grassland in the Netherlands
under various management strategies and environmental conditions. NJAS wageningen journal of life
sciences 43:2, 183-194.
Van der Wal, R., Bonn, A., Monteith, D., Reed, M., Blackstock, K., Hanley, N. & others (2011) UK National
Ecosystem Assessment - Chapter 5: Mountains, Moorlands and Heaths. (R. Van der Wal, Ed.) UK National
Ecosystem Assessment.
Van Rensburg, T.M., Murphy, E., Rocks, P. (2009) Commonage land and farmer uptake of the rural environment
protection scheme in Ireland. Land Use Policy 26:2, 345–355.
Van Wyk, L. (2014) Green (ing) infrastructure. Alive2green.
Vincent Pierce, Lawrence Pierce Ltd, Rathnew, Co. Wicklow; Geoff Coller (pers. comms.) Irish Sheep Shearing
Association
Viramontes, D., & Descroix, L. (2003) Changes in the surface water hydrologic characteristics of an endoreic basin
of northern Mexico from 1970 to 1998. Hydrological processes 17:7, 1291-1306.
Virginia, R., Jenkins, M., & Jarrell, W. (1986) Depth of root symbiont occurrence in soil. Biology and Fertility of Soils
2:3, 127-130.
Waldren, S., Allott, N., Coxon, C., Gill, L., Irvine, K., Johnston, P. & Kimberley, S. (in prep.) Turlough Ecological and
Conservation Assessment, Chapter 10: Conservation Assessment. Unpublished Report to the National Parks &
Wildlife Service. Department of Arts, Heritage and the Gaeltacht.
Waldren, S., Allott, N., Coxon, C., Gill, L., Irvine, K., Johnston, P. & Kimberley, S. (in prep.) Turlough Ecological and
Conservation Assessment, Chapter 12: Monitoring Manual. Unpublished Report to the National Parks &
Wildlife Service. Department of Arts, Heritage and the Gaeltacht.
Waldren, S., Allott, N., Coxon, C., Gill, L., Irvine, K., Johnston, P. & Kimberley, S. (in prep.) Turlough Ecological and
Conservation Assessment, Chapter 13: Summary and Recommendation. Unpublished Report to the National
Parks & Wildlife Service. Department of Arts, Heritage and the Gaeltacht.
Waldren, S., Allott, N., Coxon, C., Gill, L., Irvine, K., Johnston, P. & Kimberley, S. (in prep.) Turlough Ecological and
Conservation Assessment, Chapter 9: Integration of workpackages – Turlough Ecological Functioning.
Unpublished Report to the National Parks & Wildlife Service. Department of Arts, Heritage and the
Gaeltacht.
Wall, D., & Moore, J. (1999) Interactions Underground: Soil biodiversity, mutualism, and ecosystem processes.
BioScience 49:2, 109-117.
Ward, R., & Robinson, M. (1989) Principles of Hydrology. McGraw-Hill Book Company Europe.
Wardle, D. (1992) A comparative assessment of factors which influence microbial biomass carbon and nitrogen
levels in soil. Biological reviews 67:3, 321-358.
Warren, M., Hill, J., Thomas, J., Asher, J., Fox, R., Huntley, B. & others (2001) Rapid responses of British butterflies
to opposing forces of climate and habitat change. Nature 414:6859, 65-69.
Water Beetle database (unpublished database maintained by Prof Garth Foster (Balfour-Browne Club) in
conjunction with in conjunction with NBDC and CEDaR)
Watson, C., Bengtsson, H., Ebbesvik, M., Löes, A.-K., Myrbeck, A., Salomon, E., Stockdale, E. & others (2002) A
review of farm-scale nutrient budgets for organic farms as a tool for management of soil fertility. Soil Use
and Management 18:1, 264-273.
National ecosystem and ecosystem service mapping pilot
149
Watts, K., Eycott, A.E., Handley, P., Ray, D., Humphrey, J.W. & Quine, C.P. (2010) Targeting and evaluating
biodiversity conservation action within fragmented landscapes: an approach based on generic focal
species and least-cost networks. Landscape ecology 25:9, 1305-1318.
Weatherhead, E., & Howden, N. (2009). The relationship between land use and surface water resources in the UK.
Land Use Policy 26, 243-250.
Weis, J., & Weis, P. (2004). Metal uptake, transport and release by wetland plants: implications for
phytoremediation and restoration. Environment international 30:5, 685-700.
Werner, A., Clarke, D., Kraan, S. (2004) Strategic Review of the Feasibility of Seaweed Aquaculture in Ireland. Marine
Institute, Galway. 123pp.
White Lennon, B., and Doyle, E. (2013) Wild Food - Nature's Harvest: How to Gather, Cook and Preserve. O’Brien
Press, Dublin. 256pp
Whiting, G., & Chanton, J. (2001) Greenhouse carbon balance of wetlands: methane emission versus carbon
sequestration. Tellus B 53:5, 521-528.
Wilhelmi, O., & Wilhite, D. (2002) Assessing vulnerability to agricultural drought: a Nebraska case study. Natural
Hazards 25:1, 37-58.
Wilkinson, D. (1999) The disturbing history of intermediate disturbance. Oikos, 145-147.
Wilson, S. & Fernández, F. (2013) National Survey of Limestone Pavement and Associated Habitats in Ireland, Irish
Wildlife Manuals, No. 73, National Parks and Wildlife Service, Department of Arts, Heritage and the
Gaeltacht, Dublin, Ireland.
Winter, T., Harvey, J., Franke, O., & Alley, W. (1998) Ground Water and Surface Water - A single resource (Vol.
Circular 1139). (T. J. Casadevall, Ed.) U.S. Geological Survey.
Withers, P., & Lord, E. (2002) Agricultural nutrient inputs to rivers and groundwaters in the UK: policy,
environmental management and research needs. Science of the Total Environment 282, 9-24.
Worrall F, Armstrong A & Adamson JK (2007) The effect of burning and sheepgrazing on water table depth and
soil water quality in a blanket bog. Journal of Hydrology 339, 1-14
Zhang, L., Dawes, W., & Walker, G. (2001) Response of mean annual evapotranspiration to vegetation changes at
catchment scale. Water resources research 37:3, 701-708.

National ecosystem and ecosystem service mapping pilot
150
Appendices
All appendices are provided in a separate document.
Appendix A: Findings of the Review of Mapping and Assessment Tools
Appendix B: Workshop 1 Outcomes
Appendix C: Workshop 2 Feedback Report
Appendix D: Ecosystem Theme, Pressure and Policy Matrix
Appendix E: Waterford Symposium Ecosystem Service Grouping
Appendix F: CICES Sub-classes for Ireland
Appendix G: Example Outputs “All Ireland Matrix”
Appendix H: Data Audit for Mapping Ecosystem Indicators
Appendix I: Data Audit for the Habitat Asset Register
Appendix J: Percentage Covered by Data Sources in the Habitat Asset Register
Appendix K: Description of LPIS-derived Habitat Classes in Terms of Ecosystem Service Provision
Appendix L, Indicator documents providing the technical background to each service mapped.


