
Naive Play and the Process of Choice in GuessingGames∗
Marina Agranov† Andrew Caplin‡ Chloe Tergiman§
July 2013
Abstract
We introduce a new experimental design to provide insight into strategic choice
in one shot games. We incentivize and observe provisional choices in the 2/3 guess-
ing game in the period after the structure of the game has been communicated.
We define as naive those who play dominated strategies well after we have commu-
nicated the structure of the game. We identify a high proportion of such players
(more than 40% of subjects). We find strong support for the standard assumption
that naive types’ choices average 50. This holds not only at the end of the game, but
throughout the period of contemplation. Unlike their naive counterparts, strategic
players show evidence of increasing sophistication as the period of contemplation
increases.
JEL Codes: C72, C92, D83.
Keywords: Guessing Game, Naive play, Level-k theory, Laboratory experiment.
∗We thank Jim Andreoni, Colin Camerer, Vince Crawford, Mark Dean, John Duffy, Martin Dufwen-berg, Guillaume Frechette, Sen Geng, P.J. Healy, Daniel Martin, Rosemarie Nagel, Stefan Penczynski,Andy Schotter, Roberto Weber, the seminar participants at the Experimental Economics seminar atNYU, at the UCLA Theory Workshop, the Sauder School of Business at UBC and at the Rady andEconomics departments at UCSD.†California Institute of Technology.‡New York University.§University of British Columbia (corresponding author, [email protected]).
1
1 Introduction
The predictions of equilibrium theory frequently fail when players interact in unfamiliar
economic environments. For that reason, non-equilibrium theories focused on strategic
sophistication are of growing interest. The game that more than any other sparked this
interest is the 2/3 guessing game, in which players select an integer between 0 and 100,
with the reward going to the individual closest to 2/3 of the group average (Nagel (1995),
Stahl and Wilson (1995), Stahl (1996), Duffy and Nagel (1997), Ho, Camerer, and Weigelt
(1998), Camerer, Ho and Chong (2004)). While elimination arguments reveal the only
equilibrium choices to be 0 and 1, in practice there is significant clustering around 33 and
22.
The simplest non-equilibrium theory aimed at explaining behavior in the 2/3 guessing
game is the “Level-K” theory (Nagel (1995), Stahl and Wilson (1995), Stahl (1996)). This
theory is based on the assumption that naive “level zero” (L0) players make choices that
are uniformly distributed over the range [0,100], hence averaging 50 (see Nagel (1995),
Stahl and Wilson (1995) and Camerer, Ho and Chong (2004)). Sophisticated type L2
players who pick numbers close to 22 are interpreted as best responding to type L1 players,
who pick 33 in response to the assumed average of 50 associated with naive play.1
One possible explanation for the fact that more select numbers close to 33 and 22 than
close to 50 is that naive types are less prevalent than L1 and L2 types. If this interpre-
tation is valid, most players must engage in strategic reasoning at least to some extent.
Yet the idea that there are so few naive types is called into question by recent evidence
showing that a substantial proportion of experimental subjects are all-but oblivious to
strategic considerations.2
1More recent theories relax some of the stringent assumptions of the original Nagel (1995) model.For example, the Cognitive Hierarchy model of Camerer, Ho and Chong (2004) allows each individual tohave beliefs over the distribution of the less sophisticated types as opposed to imposing that distributionto be degenerate as in Nagel (1995). Recent work by Alaoui and Penta (2012) endogenizes the level ofreasoning based on the tradeoff between thinking costs and the benefits of the extra steps of reasoning.Agranov et al. (2012) and Slonim (2005) show evidence that subjects’ choices can depend on who theyare playing against.
2Costa-Gomes and Weizsacker (2008) run 14 two-person normal form games in which subjects areboth asked to choose an action and state a belief on their partner’s action. They find that subjects’
2

Given their foundational role in the theory and recent controversies concerning their
prevalence, it is important not only to accurately identify naive players but also to un-
derstand their pattern of choices. It is hard to do this using standard choice data, since
identification rests on group average play, not individual play.3 This has provoked inter-
est in using non-standard data on choice procedures to gain additional insight into naive
play.4
In this paper we use a novel strategic experiment to identify naive players. Rather
than study only final choices, we incentivize and observe players’ provisional choices in
the three minute period after the structure of the guessing game is conveyed to them.
The resulting “strategic choice process” (SCP) data capture how internal reflection on
the structure of the game causes the perceived optimal decision to change.
In contrast with other non-standard data such as messages to team members, the
non-standard SCP data that we gather are particularly easy to map to the theory. We
identify as naive those players who make dominated choices (at or above 67) after having
had some time to consider the decision. Strategic choice process data is clearly essential
to our identification strategy, since types are defined precisely from the pattern of their
provisional choices, and not just their final choice or their choice at a particular point in
time.
There are four main findings related to the 2/3 game. First, we confirm that there is a
high proportion of naive players (approximately 40%).5 Second, the SCP protocol allows
elicited beliefs and actions are inconsistent up to 40% of the time. In an auction context, Ivanov, Levinand Niederle (2010) show that many subjects are unable to best-respond to their own past play. For anup-to-date survey of the literature see Crawford, Costa-Gomes and Iriberri (2011).
3The theory asserts only that such players average 50, not that they all choose 50.4For example, Costa-Gomes, Crawford and Broseta (2001) and Costa-Gomes and Crawford (2006)
examined data on information search behavior recorded using MouseLab. A second line of researchinvolves estimating subjects’ levels of reasoning by analyzing verbal data associated with their choices(e.g. Sbriglia (2004), Bosch-Domenech, Montalvo, Nagel and Satorra (2002), Arad (2009) and Burchardiand Penczynski (2010)). A separate line of work uses physiological and neurological measurements togain insight into play in the guessing game. Dickinson and McElroy (2009) find that subjects applyhigher levels of reasoning when well-rested rather than sleep-deprived; Coricelli and Nagel (2009) usefMRI techniques to explore levels of reasoning; Chen, Huang and Wang (2010) used eye-tracking data tocomplement choice data in a modified 2/3 guessing game played spatially on a two-dimensional plane.
5Agranov et al. (2012) suggest a different method to estimate the proportion of naive players in thepopulation. In that study, subjects are told that they are each playing against seven computers that arechoosing numbers uniformly. Only about half of the subjects are capable of making one step of strategic
3

us to uniquely track the behavior of these players and we show that these naive types
make final choices that average close to 50, just as the theory suggests. It is important
to note that our identification of naive types does not in any way restrict how they play
at the end of the game, or what their average play may be. Thus, we provide what is
perhaps the clearest support for the basic assumption of naive play that has been used
in Level K and Cognitive Hierarchy theories. Strikingly, naive players average close to 50
through much of the 3 minute observation period. Hence they fit the standard conception
of naive players for most of the period of play. Third, those that we identify as strategic
players appear to be well described by hierarchical models of strategic reasoning. Their
choices follow a downward drift with the passage of time, as if further contemplation
increased the extent of their strategic understanding.6 Finally, we show that those who
are identified as strategic using the SCP protocol are also more likely to be strategic in an
unrelated Bayesian updating game (Monty Hall), while final choice alone does not allow
for this cross-game correlation.7
We believe that the applications of the SCP protocol are of broader interest and can
reasoning and choose about 33 in this experiment, which suggests that the remaining half of the subjectsare naive players. One major drawback of this method is that it can only be used when subjects playagainst computers. In contrast, the SCP protocol allows us to identify naive subjects in the game itself,without modification (subjects are trying to guess 2/3 of the choices of other human players). Second,because we can track the path of play, we can better evaluate whether a subject choosing 33, say, hassettled to a stable final choice or displays continued indecision throughout the period of contemplation.This allows for a more accurate identification of naive types.
6While it may not be surprising that average choices decrease over time, the SCP allows us to trackwhich subjects are choosing lower numbers and which are doing it as a result of a deliberate choice. Thisis of great importance if one wants to be able to identify the reason why this decrease is happening.Weber (2003) used the 2/3 guessing game to illustrate that learning can happen even without feedback.In his design, subjects played the guessing game ten times in a row. What he found was that whencomparing the first and last round, a sizable fraction of the population had lowered their choices. Whilethis experiment did not focus on individual play and does not provide information on whether individualdecisions over rounds were systematic or of a more random nature, it is nonetheless useful in showingthat individual choices may vary even in the absence of external information. We are aware of only onepaper in which the time constraint in a 2/3 guessing game was manipulated. Kocher and Sutter (2006)examined the effects of time pressure and incentive schemes on choices in repeated plays of the guessinggame. Surprisingly, they did not find much difference in first round play for different time constraints.This may be due to the fact that their subjects knew that they would repeat the game several times,and so would be able to change their decisions in later plays of the game. In our design, subjects playone and only one time, and may therefore more rapidly internalize the structure of the game.
7This game is modeled on the “Monty Hall” game of Nalebuff (1987), Friedman (1998) and Avishalomand Bazerman (2003). Our results are consistent with the results of Burchardi and Penczynski (2010),and Georganas, Healy and Weber (2010). They find that types based on final choice alone are nottransferable across games.
4
be used beyond the 2/3 game. Our design can be used to explore strategic sophistication
in a directly analogous manner whenever there are dominated strategies. Even when
there are no such strategies,8 the data in our experiment displays intriguing patterns
suggesting other identification strategies.9
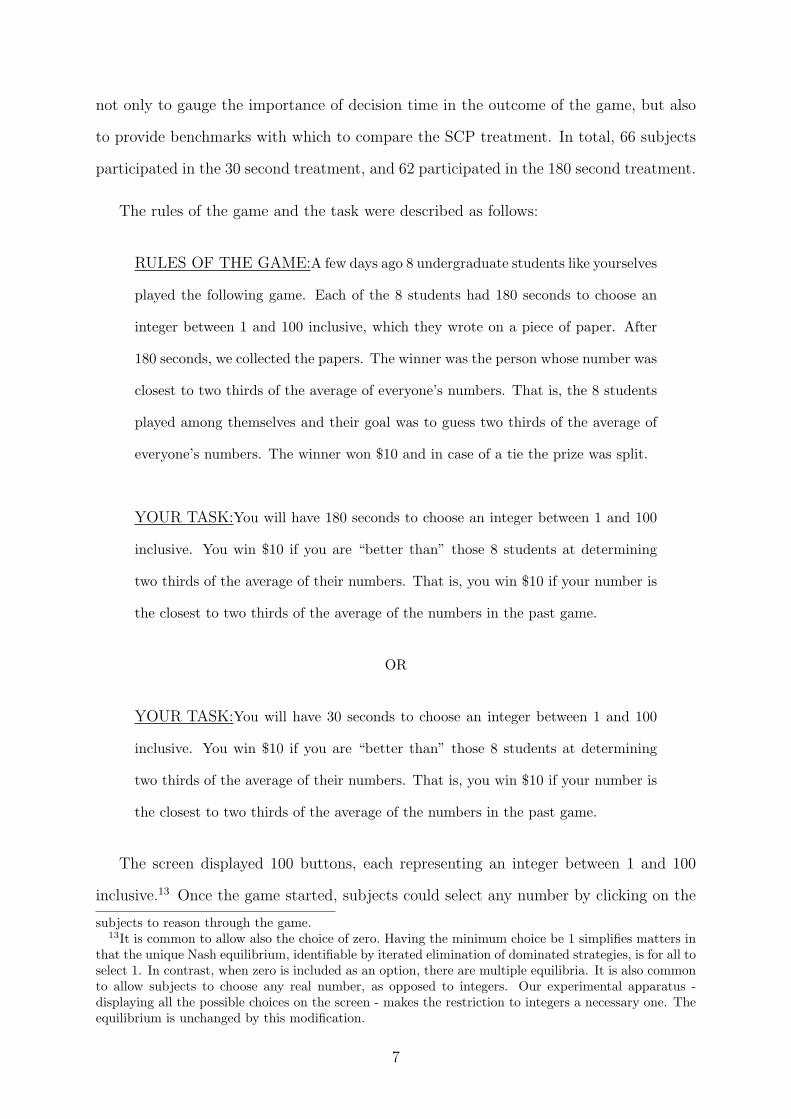
Finally, the SCP method offers one possible way around a key challenge facing those
interested in how contemplation time interacts with game play. Indeed, the SCP experi-
ment can be seen as eliciting from one individual an entire sequence of time-constrained
choices in their very first play of an unfamiliar game. The standard procedure (between
subject design) for examining the impact of contemplation time requires the use of sep-
arate pools of subjects for each time constraint. Hence very large subject pools are
required to adequately control for individual differences. In addition to allowing one to
economize on the number of plays, using the SCP treatment to explore the impact of
time constraints removes the need to control for individual differences: the players are
one and the same regardless of the time constraint.10 To confirm that the SCP protocol
doesn’t interfere with choice, we run standard guessing game experiments with 30 and
180 second time constraints. We find the resulting behavior to be very similar to that
in the SCP experiment at the corresponding time. To a first approximation, this finding
supports the idea that play in the SCP is analogous to play in multiple guessing games
with different time constraints. For that reason, the SCP methodology may be worth
deploying in other situations in which contemplation time interacts with strategic choice.
The remainder of the paper is organized as follows. The experimental design can be
found in Section 2. Results concerning the prevalence and patterns of naive and strategic
play are in Section 3. Results suggesting the broader applicability of the SCP experiment
are in Section 4. Concluding remarks are in Section 5.
8Grimm and Mengel (2010) have recently shown that giving decision-makers additional time to decidein the ultimatum game greatly lowers the rate of rejection of small offers. One possible reason for this isthat the emotional effects of a disappointing offer are felt less sharply once they are internalized. This isa case in which the passage of time may change the decision maker’s utility function.
9See Section 4.10As noted above, naive players average close to 50 throughout the full three minute observation period.
This suggests a possible connection between play in the SCP after a given period of contemplation andplay in a corresponding standard game.
5

2 The Experimental Design
All of the experiments were run at the laboratory of the Center for Experimental So-
cial Science (CESS) at New York University. Subjects were drawn from the general
undergraduate population in the university by email solicitations. The guessing game
experiments themselves lasted about 10 minutes. Subjects in the SCP treatment par-
ticipated in additional tasks, as detailed below. Average payoffs were between $10 and
$15.11
In all treatments, subjects were first seated at their computer terminals, and then
given the experimental instructions, face down. Once all subjects received their instruc-
tions, they were instructed that they could turn the sheets over and the instructions were
read out loud. Subjects did not communicate with one another during the experiments.
There was only a single play of the 2/3 guessing game in each experiment. The precise
experimental instructions differed across treatments as indicated below.
Given our interest in how learning takes place in a novel one shot game, we dropped
subjects who reported being familiar with the game, whether in a lab, in a classroom or
in any other context. This familiarity was assessed in a questionnaire at the end of each
session. Some 25% of subjects had either played the game or heard of it. The remaining
sample consists of 188 subjects.
2.1 Standard Guessing Games
Before running the SCP experiment, we conducted standard guessing games of 30 seconds
and 180 seconds durations. In these games only the final choice of each subject mattered
for payment. The longer time of 180 seconds was chosen since prior work suggests that
it is enough time for most subjects to reason through the game, while the shorter time
was chosen to cut short such reasoning.12 These Standard Experiments were included
11The show-up fee was $ 7 and most subjects did not win both the Monty Hall game and the 2/3rdsgame.
12The fact that the final numbers subjects chose are similar on average with those coming fromexperiments where there was no time-limit suggests that the 3 minute cutoff was indeed enough time for
6
not only to gauge the importance of decision time in the outcome of the game, but also
to provide benchmarks with which to compare the SCP treatment. In total, 66 subjects
participated in the 30 second treatment, and 62 participated in the 180 second treatment.
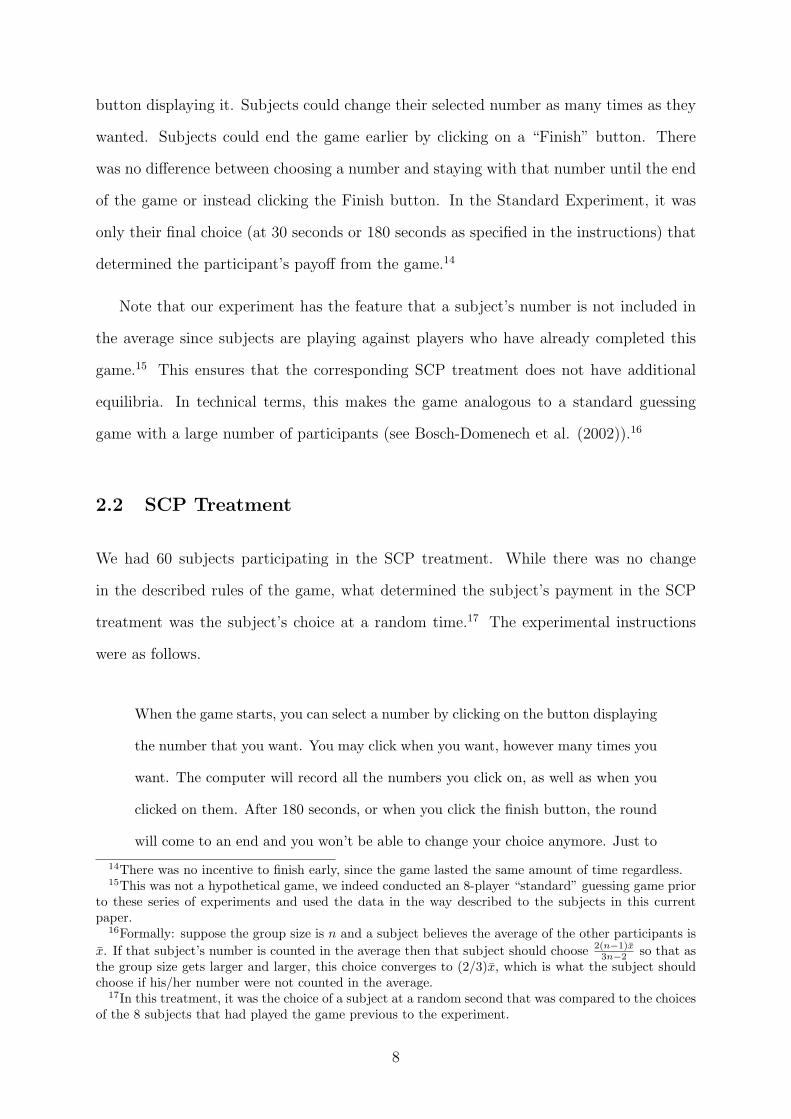
The rules of the game and the task were described as follows:
RULES OF THE GAME:A few days ago 8 undergraduate students like yourselves
played the following game. Each of the 8 students had 180 seconds to choose an
integer between 1 and 100 inclusive, which they wrote on a piece of paper. After
180 seconds, we collected the papers. The winner was the person whose number was
closest to two thirds of the average of everyone’s numbers. That is, the 8 students
played among themselves and their goal was to guess two thirds of the average of
everyone’s numbers. The winner won $10 and in case of a tie the prize was split.
YOUR TASK:You will have 180 seconds to choose an integer between 1 and 100
inclusive. You win $10 if you are “better than” those 8 students at determining
two thirds of the average of their numbers. That is, you win $10 if your number is
the closest to two thirds of the average of the numbers in the past game.
OR
YOUR TASK:You will have 30 seconds to choose an integer between 1 and 100
inclusive. You win $10 if you are “better than” those 8 students at determining
two thirds of the average of their numbers. That is, you win $10 if your number is
the closest to two thirds of the average of the numbers in the past game.
The screen displayed 100 buttons, each representing an integer between 1 and 100
inclusive.13 Once the game started, subjects could select any number by clicking on the
subjects to reason through the game.13It is common to allow also the choice of zero. Having the minimum choice be 1 simplifies matters in
that the unique Nash equilibrium, identifiable by iterated elimination of dominated strategies, is for all toselect 1. In contrast, when zero is included as an option, there are multiple equilibria. It is also commonto allow subjects to choose any real number, as opposed to integers. Our experimental apparatus -displaying all the possible choices on the screen - makes the restriction to integers a necessary one. Theequilibrium is unchanged by this modification.
7
button displaying it. Subjects could change their selected number as many times as they
wanted. Subjects could end the game earlier by clicking on a “Finish” button. There
was no difference between choosing a number and staying with that number until the end
of the game or instead clicking the Finish button. In the Standard Experiment, it was
only their final choice (at 30 seconds or 180 seconds as specified in the instructions) that
determined the participant’s payoff from the game.14
Note that our experiment has the feature that a subject’s number is not included in
the average since subjects are playing against players who have already completed this
game.15 This ensures that the corresponding SCP treatment does not have additional
equilibria. In technical terms, this makes the game analogous to a standard guessing
game with a large number of participants (see Bosch-Domenech et al. (2002)).16
2.2 SCP Treatment
We had 60 subjects participating in the SCP treatment. While there was no change
in the described rules of the game, what determined the subject’s payment in the SCP
treatment was the subject’s choice at a random time.17 The experimental instructions
were as follows.
When the game starts, you can select a number by clicking on the button displaying
the number that you want. You may click when you want, however many times you
want. The computer will record all the numbers you click on, as well as when you
clicked on them. After 180 seconds, or when you click the finish button, the round
will come to an end and you won’t be able to change your choice anymore. Just to
14There was no incentive to finish early, since the game lasted the same amount of time regardless.15This was not a hypothetical game, we indeed conducted an 8-player “standard” guessing game prior
to these series of experiments and used the data in the way described to the subjects in this currentpaper.
16Formally: suppose the group size is n and a subject believes the average of the other participants isx̄. If that subject’s number is counted in the average then that subject should choose 2(n−1)x̄
3n−2 so that asthe group size gets larger and larger, this choice converges to (2/3)x̄, which is what the subject shouldchoose if his/her number were not counted in the average.
17In this treatment, it was the choice of a subject at a random second that was compared to the choicesof the 8 subjects that had played the game previous to the experiment.
8
make clear, if you choose a number and then stay with that number until the end,
or instead decide to click on the “Finish” button, it will make no difference.
Only one of the numbers you selected will matter for payment. To determine which
one, the computer will randomly choose a second between 0 and 180, with each
second equally likely to be chosen. The number you selected at that time will be
the one that matters. We will call this number “Your Number.”
We took measures to ensure that subjects participating in SCP treatments properly
understood the incentive structure. Hence when they arrived in the lab we described the
experimental methodology to them before introducing them to the guessing game. They
were told that:
1. The game that they were about to play would last 180 seconds.
2. The computer would record their choice throughout the game.
3. After the 180 seconds were over, the computer would randomly select one of the
180 seconds.
4. Their choice at that random second would be the one that mattered for their pay-
ment.
Illustrative examples were provided to illuminate the nature of the final payoff.18 The
examples illustrated that failure to pick an option would result in a certain payoff of zero.
Hence subjects in the SCP treatment were incentivized to make a quick and intuitive first
estimate of two-thirds of the average final number picked by the group that had played
previously. Whenever further reflection causes this best estimate to change, they were
incentivized immediately to make the corresponding change in their guess.19
18Appendix A contains the instructions for these SCP sessions.19The desire to enrich standard choice data while retaining strong links to standard theory led Caplin
and Dean (2011) to introduce “choice process” data in the search theoretic context. These data identifythe evolution of perceived optimal choices during the period of search. Caplin, Dean, and Martin (2011)develop an experimental interface to capture these data, and use it to get new insights into the natureof the search process and the rules for stopping search.
9

After completing the 2/3rds guessing game, all subjects in the SCP treatment played
the Monty Hall Game. The Monty Hall Game is a classic problem in which intuition
can diverge from Bayesian reasoning. We showed participants three closed doors on the
screen, and let them know that there was $5 behind one and only one randomly chosen
door, with nothing behind the other two. They were then asked to choose one of the
doors. At that point, the experimenter announced that he or she knew the location of
the $5, and opened one of two unselected doors to show that it contained nothing. The
subject was then given the option either to stay with their initial choice or instead to
switch to the other closed door.
3 Naive and Strategic Players
In this section we present three basic findings based on using play of dominated strategies
to identify naive players. Our first finding relates to the proportion of such players in the
population. The second relates to their pattern of behavior throughout the game. The
third relates to the remaining subset of the population, the strategic players.
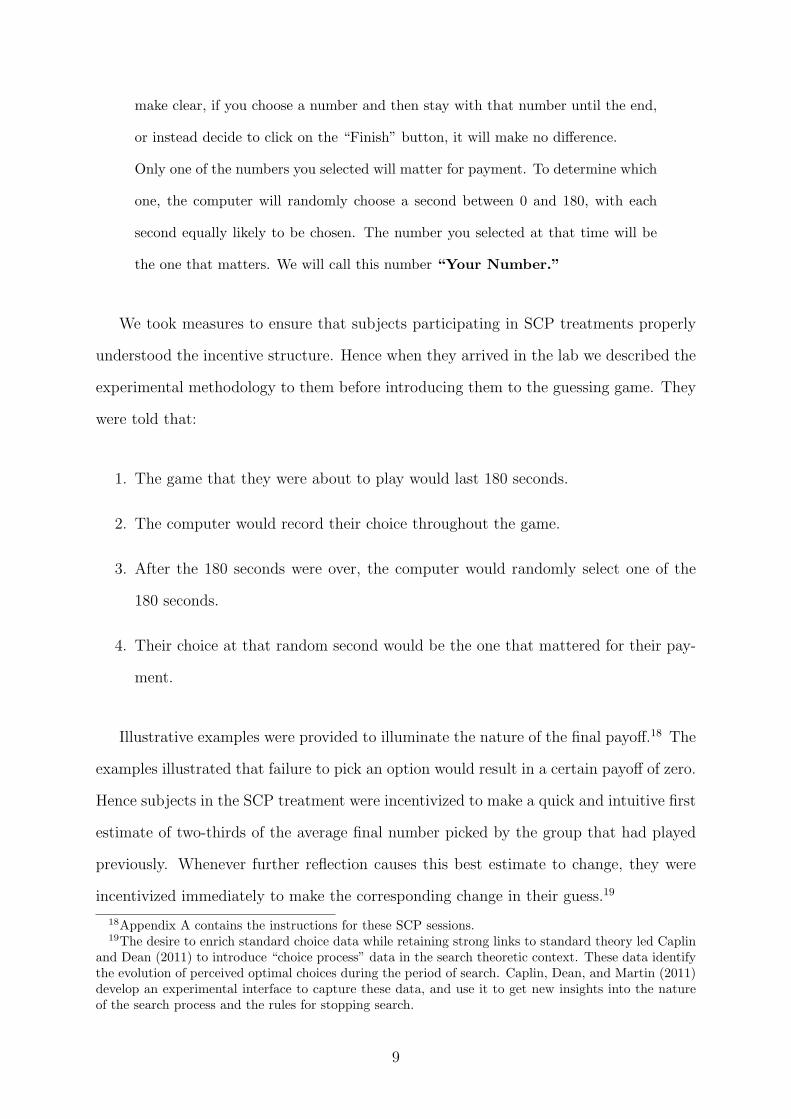
Finding 1: More than 40% of the population is naive.
Choosing a number at or above 67 is a dominated action, since 2/3 of the highest
possible number is 67 (66.7 rounded-up). We use this strong theory-driven cutoff to
define naive players. Figure 1 presents the histogram of the last time each subject chose
numbers at or above 67. For instance, someone who never chose numbers at or above 67
is counted in the 0 bin on this graph, while a person whose final choice is at or above 67
appears in the 180 bin.
As can be seen in Figure 1, more than 45% of subjects never chose a number at
or above 67. However, it is plausible that some subjects make first choices that are
instinctive, before even internalizing the structure of the game. For that reason, we
define naive players as those who chose 67 at some point 30 seconds or more into the
10
0.1
.2.3
.4.5
Fraction
0 20 40 60 80 100 120 140 160 180Time
Figure 1: Last time each subject chose numbers at or above 67 in the SCP experiments.
experiment.20,21
According to our definition, 43.3% of subjects are naive players. This may underes-
timate the true number of naive players in the population since such players may never
choose numbers at or above 67. Yet the proportion is consistent with other work that
studies different games, such as Costa-Gomes and Weizsacker (2008), Ivanov, Levin and
Niederle (2010) and Agranov et al. (2012).
Two natural questions arise. The first one may ask is whether our selection criterion
adequately captures naive players. The large majority of subjects that are in our naive
category appear to be making random choices throughout the game and switch choice on
average over 52 times over the 180 seconds (see Table 2).22 However, some naive subjects
may simply choose a single number a random and remain with that number throughout
the game, never choosing above 67. In our current definition, this player who is actually
naive would nevertheless not be counted as naive. In our data, however, there are only
five subjects who only choose a single number throughout the game and never switch.
20Figure 1 shows that all of the subjects who chose numbers above 67 after 30 seconds also chose above67 more than one minute into the experiment.
21All the results in this paper follow through if we instead choose 90 seconds as the cutoff for definingnaive players.
22Actually, we show in Result 6 that using a measure capturing the amount of change in choices -which we do by looking at the standard deviation of choices can also be used to capture naive players.Using frequency of switches yields similar results.
11
Including these five subjects among those we call naive does not change our results.23
The second question one may ask at this point is whether we really need SCP data to
identify naive players. Could we instead have used the last choices of subjects, which is
what is typically done in the literature? The answer is unequivocal: if one were to look
only at the last choice made by subjects, all that is possible with standard choice data,
only 5% (3 subjects) of subjects made choices at or above 67. Hence, without the SCP
data, one is likely to dramatically underestimate the proportion of naive individuals in
the population.
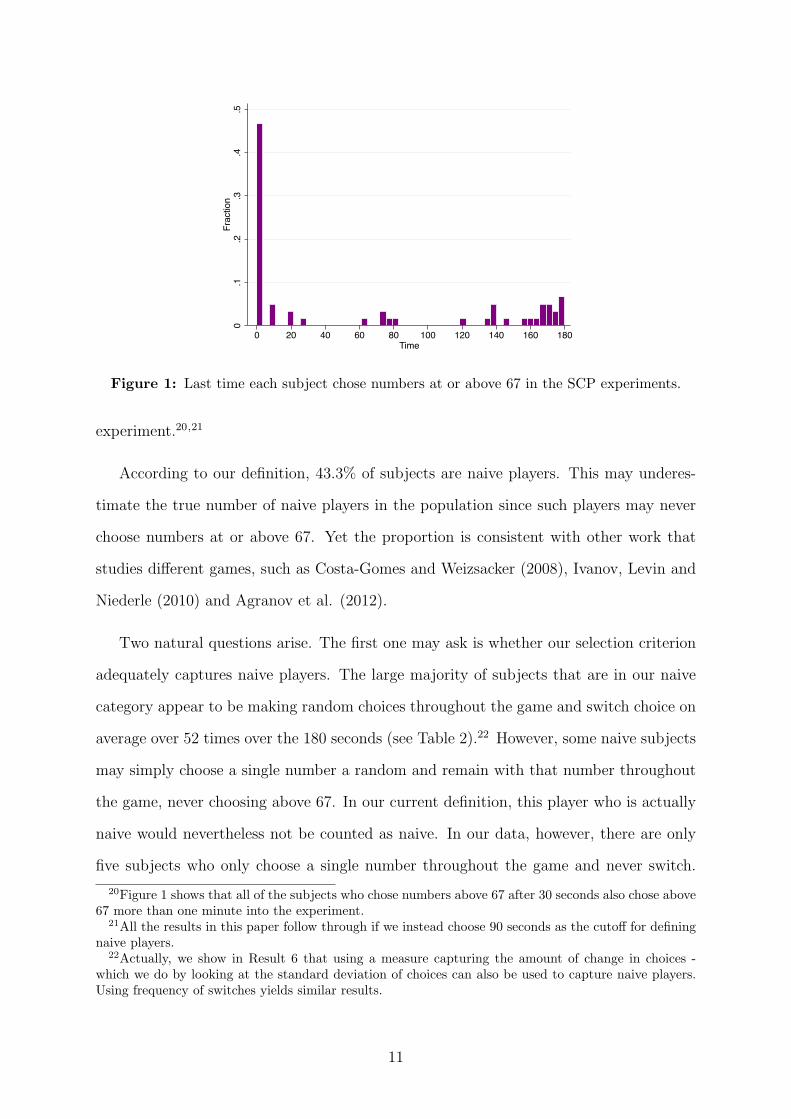
Finding 2: Naive players average close to 50 (a) at the end of the game and
(b) throughout the game.
Figure 2 shows the distribution of final choices of the naive players. Consistent with
the standard assumption on naive play, 50 is within the 95% confidence interval for the
mean final choice.24 We now consider the behavior of these players throughout the game.
0.05
.1.15
Fraction
0 20 40 60 80 100Choice
Figure 2: Distribution of choices of naive players at the end of the game.
Summary statistics on naive play are presented in Table 1. Over the course of the
23While the magnitudes of the estimates will vary, all our results follow through. All these are availablefrom the authors upon request.
24The point estimate for the mean is just above 45, and the median is 45.5.
12

Naive PlayersMeanChoice
TimeAt or Above 67
Seconds 1 to 6053.4(14)
30.9%
Seconds 61 to 12051.06(10.7)
25.9%
Seconds 121 to 18052.4
(13.8)27.6%
Table 1: Choices of naive players (standard deviations in parentheses).
entire experiment, the average choice of naive players is 52.3.25 Further, as Table 1
indicates, the average choice of naive players remains fairly stable over the course of
the experiment. In addition, the group of naive players spends close to a third of the
time on choices at or above 67 throughout the whole experiment. Finally, these players
change their minds very frequently over the course of the game, roughly every three
seconds. These three observations provide further support that the group we identify as
naive players are indeed non-strategic (they choose numbers above at or 67 throughout
the entire experiment, not only towards the beginning, or the middle, or the end). Our
experiment is, to our knowledge, the first to evaluate the assumption concerning naive
play, and our data show support for the standard assumption that such subjects average
50.
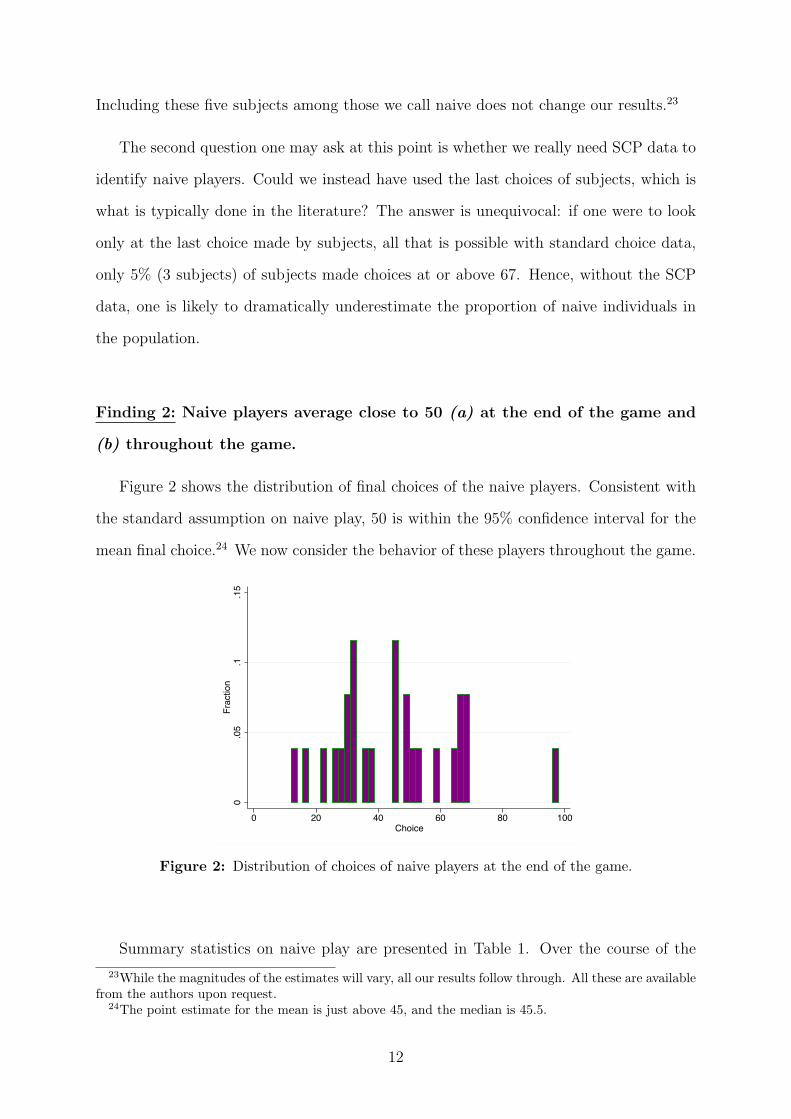
The first three panels of Figure 3 depict the histograms of all the choices made by
naive players in the first 60, second 60 and third 60 seconds of the experiment, treating
each choice for a given subject as an independent observation. Further to this, in the last
panel of Figure 3, we present the average choice of naive players during the course of the
experiment along with the 95% confidence interval for the mean choice.
It is quite striking that 50 is within the 95% confidence interval for average play of
the naive types over 90% of the time. These players average close to 50 throughout the
experiment. Hence they fit the intuitive conception of naive players through most of the
period of play.
25Including the five subjects who choose a single number and never change in the group of naive playerschanges this average choice to about 49.
13
0.05
.1.15
Fraction
0 20 40 60 80 100Choice
(a) Naive players: seconds 1 to 60
0.05
.1.15
Fraction
0 20 40 60 80 100Choice
(b) Naive players: seconds 61 to 120
0.05
.1.15
Fraction
0 20 40 60 80 100Choice
(c) Naive players: seconds 121 to 180
010
2030
4050
6070
80
0 20 40 60 80 100 120 140 160 180Time
Mean Choice 95% CI Lower Bound95% CI Upper Bound
(d) Average choices of naive players, by time
Figure 3: Choices of naive players
What makes this finding of such note is that our criterion to determine the naive sub-
jects is the play of a dominated strategy. This does not in itself have strong implications
for the path of choice. Certainly, it does not imply that choices for the naive types should
remain constant at close to 50 over the course of the experiment. We interpret the result
as providing robust support for the hypothesis that naive players choices average 50 not
only at the end of the game but throughout the game.
Finding 3: Strategic players’ choices decrease over time.
In this section we focus on those subjects who never or almost never choose dominated
actions. We refer to these subjects as the strategic subjects.
Figure 4 displays the average choice as a function of consideration time in the SCP
treatment for both the strategic and naive individuals. Figure 4 also displays the fitted
14

regression lines using fractional-polynomial formulations. While Lk and Cognitive Hier-
archy theories do not explicitly incorporate time, those with higher cognitive levels are
treated as reasoning further through the game. One might expect their choices to have
a decreasing trend over time, though this need not be the case if subjects adjust their
beliefs concerning the play of others.30
4050
60Choice
0 20 40 60 80 100 120 140 160 180Time
Naive Strategic
Figure 4: Choice over time: average data with fractional polynomial regressions superimposed.
Naive Players Strategic Players
Average Choice52.3
(20.9)34.1(17)
Average Time of First Choice6.5
(3.6)7.8
(5.4)
Average Total Number of Switches52.4
(57.5)9.1
(18.4)
Average Time of Last Choice161.8(30.3)
102.1(68.6)
Table 2: Some statistics on strategic and naive players.
Table 2 presents some statistics on the strategic and naive types. What is clear from
Table 2 is that these types differ in aspects that are some way removed from the defining
criterion of playing a dominated strategy. While time of first choice does not differ
between these groups,26 naive subjects “change their minds” and switch numbers much
more often than the strategic types.27 Further, the L0 types keep changing their minds
26A Ranksum as well as a Kolmogorov-Smirnov tests reject the null that both populations have identicalmedians or distributions, with p-values largely above 10%.
27Both a Ranksum and Kolmogorov-Smirnov test have pvalues strictly less than 1%.
15
almost to the end of the experiment, which is not the case for the strategic types.28 In
other words, our strategic types, while not defined that way, seem to converge faster to
a final decision, making their decisions possibly more deliberate than those of the naive
types.
The simplest form of introspective reasoning by which a subject may advance in type
is based on best-responding to own past decision, which results in selecting precisely 2/3
of the previous choice (a rapid learner might pick some power of 2/3 by skipping levels
of reasoning). One subject (subject 31) fit this pattern precisely, moving from 50 to 33
to 22, and retaining this choice for the remainder of the 180 seconds. In general, the
fraction of switches that are very close to being in two thirds steps (plus or minus 5%)
is higher for the strategic players than for the naive players. For example, more than
25% of strategic players make at least twenty percent of their switches in such steps. In
contrast, only 8% of the naive group make this high a proportion of such steps. Even
though the percentage of such adjustments is far from being the dominant feature of our
data, it is far from negligible.
Finding 4: Strategic types defined through the SCP protocol are more likely
to be strategic in the Monty Hall game.
The existing experimental literature on the guessing game suggests that there is little
correlation in level classifications across games when classifications are based only on final
choices.29
One possible reason for the failure of types defined by level of reasoning to generalize
is that they do not adequately summarize strategies, particularly when learning is taking
place. If indeed a large fraction of the population is naive and making essentially random
28Both a Ranksum and Kolmogorov-Smirnov test have pvalues strictly less than 1%.29There is some evidence that at the population level the distribution of types across games may be
stable (see for example Camerer, Ho and Chong (2004)). At the individual level, Georganas, Healyand Weber (2010) find that though there is a correlation of levels within guessing games, choices inthe guessing games fail to correlate with behavior outside the guessing game family. Burchardi andPenczynski (2010) reach similar conclusions.
16

020
40
60
80
100
Choice
0 50 100 150200Time
Figure 5: Is final choice enough? Paths of choice for four individuals with the same finalchoice.
choices, final choice alone cannot be enough to identify those players. To drive home this
point, Figure 5 presents four individuals whose final choice is the same (33), and who
would be classified as L1 thinkers if only their final choice was observed. However, the
manner in which they arrived at this final choice is dramatically different, and may contain
information of value in understanding their behavior in various other environments.30
We present simple results illustrating the potential value of understanding the path of
play rather than just the final choice. Specifically, we consider the performance of naive
and sophisticated players as identified in the guessing game in an entirely different game:
the Monty Hall game. In this game, appropriate updating implies that the respondent
should switch doors, yet it is intuitively plausible that it is equally good to remain with
the initial choice.31 Table 3 below presents the results of four Probit regressions from the
Monty Hall game. The dependent variable yi equals 1 if participant i switched from the
initially chosen door and 0 otherwise. Regression 1 and 2 use final choice and Nagel’s
types as independent variables, respectively. Regression 2 uses dummy variables for the
L1 and L2 types as defined by Nagel (1995) using final choice alone, leaving the naive type
as the control group. In Regression 3, the independent variables are a dummy equal to 1
if a subject is classified as strategic using SCP methodology as well as an interaction term
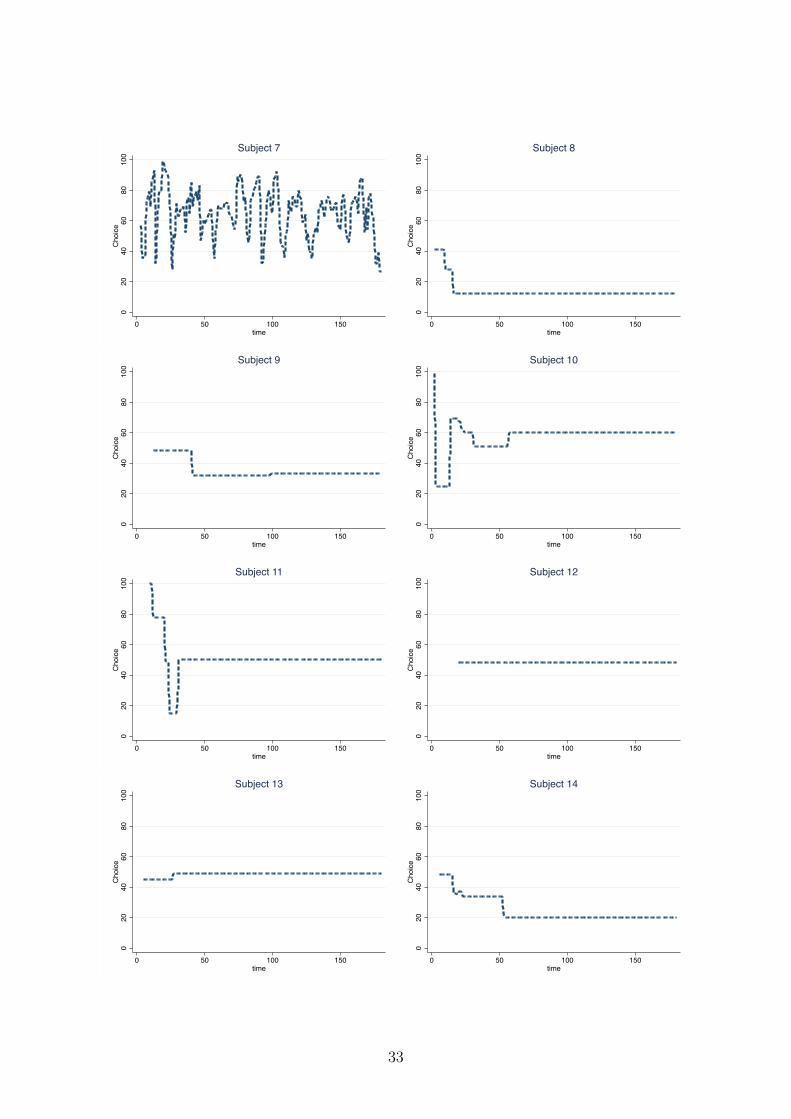
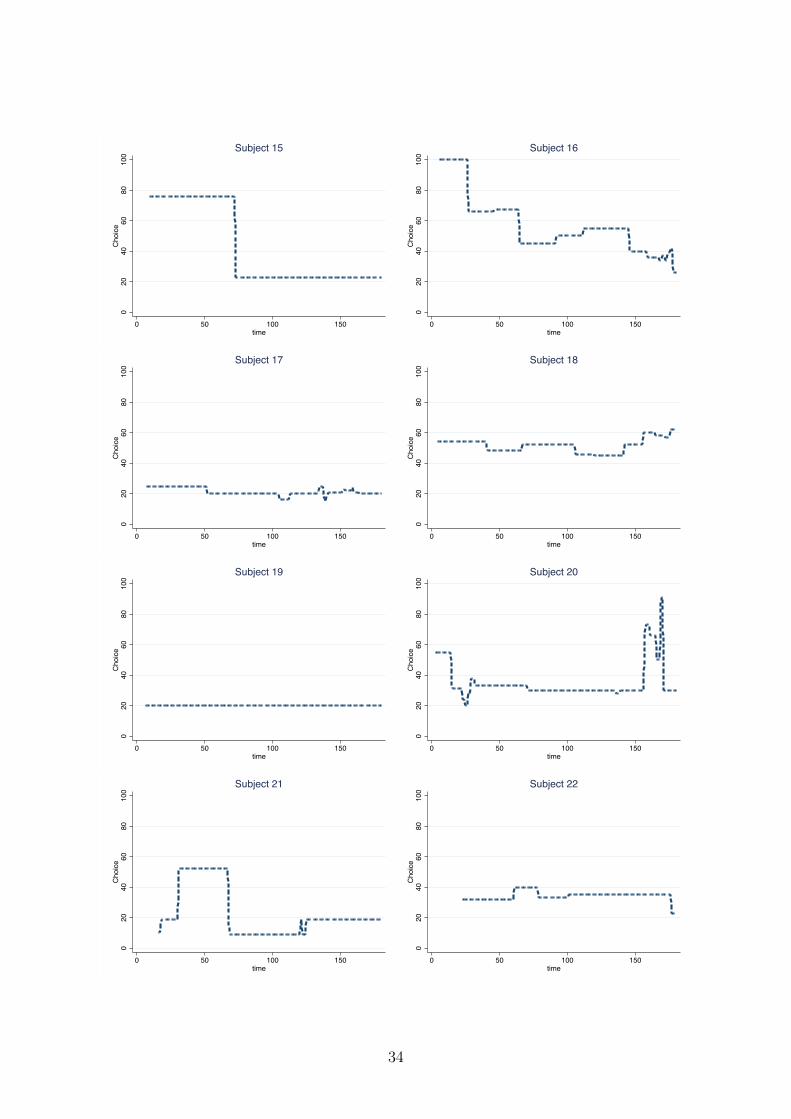
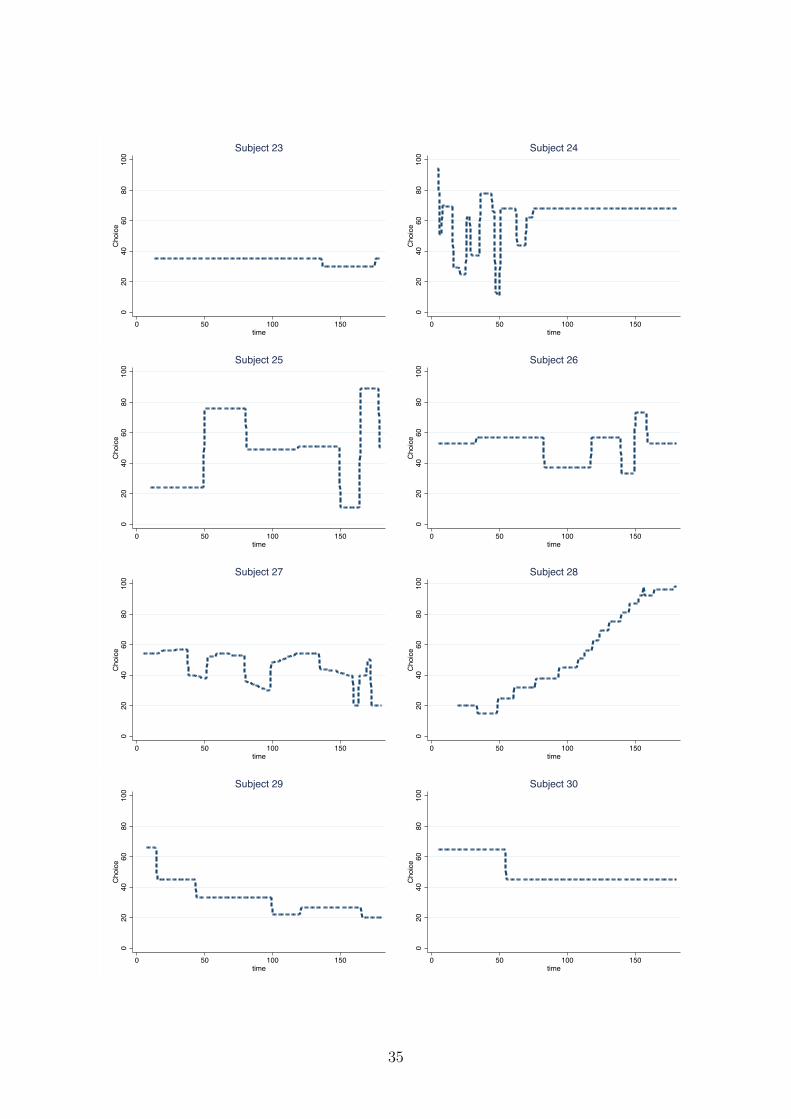
30These and all other complete paths of choice are in Appendix C.31The instructions are in Appendix B.
17
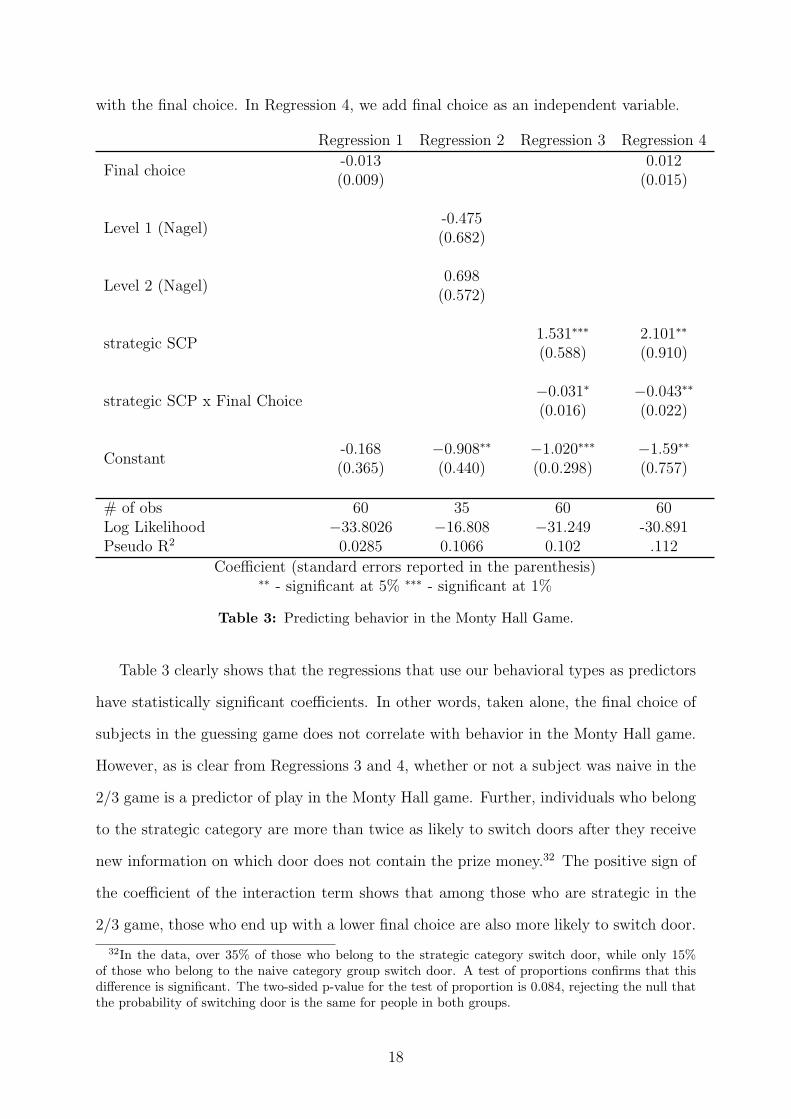
with the final choice. In Regression 4, we add final choice as an independent variable.
Regression 1 Regression 2 Regression 3 Regression 4
Final choice-0.013(0.009)
0.012(0.015)
Level 1 (Nagel)-0.475(0.682)
Level 2 (Nagel)0.698
(0.572)
strategic SCP1.531∗∗∗
(0.588)2.101∗∗
(0.910)
strategic SCP x Final Choice−0.031∗
(0.016)−0.043∗∗
(0.022)
Constant-0.168(0.365)
−0.908∗∗
(0.440)−1.020∗∗∗
(0.0.298)−1.59∗∗
(0.757)
# of obs 60 35 60 60Log Likelihood −33.8026 −16.808 −31.249 -30.891Pseudo R2 0.0285 0.1066 0.102 .112
Coefficient (standard errors reported in the parenthesis)∗∗ - significant at 5% ∗∗∗ - significant at 1%
Table 3: Predicting behavior in the Monty Hall Game.
Table 3 clearly shows that the regressions that use our behavioral types as predictors
have statistically significant coefficients. In other words, taken alone, the final choice of
subjects in the guessing game does not correlate with behavior in the Monty Hall game.
However, as is clear from Regressions 3 and 4, whether or not a subject was naive in the
2/3 game is a predictor of play in the Monty Hall game. Further, individuals who belong
to the strategic category are more than twice as likely to switch doors after they receive
new information on which door does not contain the prize money.32 The positive sign of
the coefficient of the interaction term shows that among those who are strategic in the
2/3 game, those who end up with a lower final choice are also more likely to switch door.
32In the data, over 35% of those who belong to the strategic category switch door, while only 15%of those who belong to the naive category group switch door. A test of proportions confirms that thisdifference is significant. The two-sided p-value for the test of proportion is 0.084, rejecting the null thatthe probability of switching door is the same for people in both groups.
18
In intuitive terms, this suggests that the types that we identify as strategic in the
guessing game are better than others at incorporating new information, whether this
information results from internal reflection or a change in the information set on which
to base a decision.
4 SCP and Other Games
In this section we present findings suggesting the value of the SCP data in other set-
tings. We first compare behavior in the SCP treatment with that in standard guessing
games with distinct time constraints and show that the SCP protocol does not interfere
with choice. Finally, we present results suggesting that the SCP protocol may be able
to identify naive players in a broad class of games for which there is no dominated strategy.
Finding 5: The SCP protocol is equivalent to a series of time constrained
games.
By definition, a subject can play an unfamiliar game one and only one time. This
poses a challenge for those seeking to understand how the contemplation period interacts
with the final decision. For one so interested, the standard procedure (between subject
design) requires the use of separate pools of subjects for each time constraint. Therefore,
the standard procedure does not easily and cost-effectively allow the identification of
individual learning differences.33
The SCP experiment is designed to elicit from one individual an entire sequence of
time-constrained choices in their very first play of an unfamiliar game. The extent to
which this design provides information on how time constraints impact play depends on
whether or not the choices it gives rise to are different than those in the corresponding
sequence of time-constrained games.34 A first hint in this direction is provided by the
33At the very least, it requires a large sample to adequately control for individual differences.34Surprisingly, a large fraction of subjects in these standard treatments make provisional choices that
parallel those made by subjects in the SCP treatments.
19
# of Obs Mean Choice Median Choice
30 seconds - Standard 6642.83
(20.13)42
30 seconds - SCP 6041.68
(19.95)42
180 seconds - Standard 6236.35
(20.24)33
180 seconds - SCP 6036.73
(18.34)33
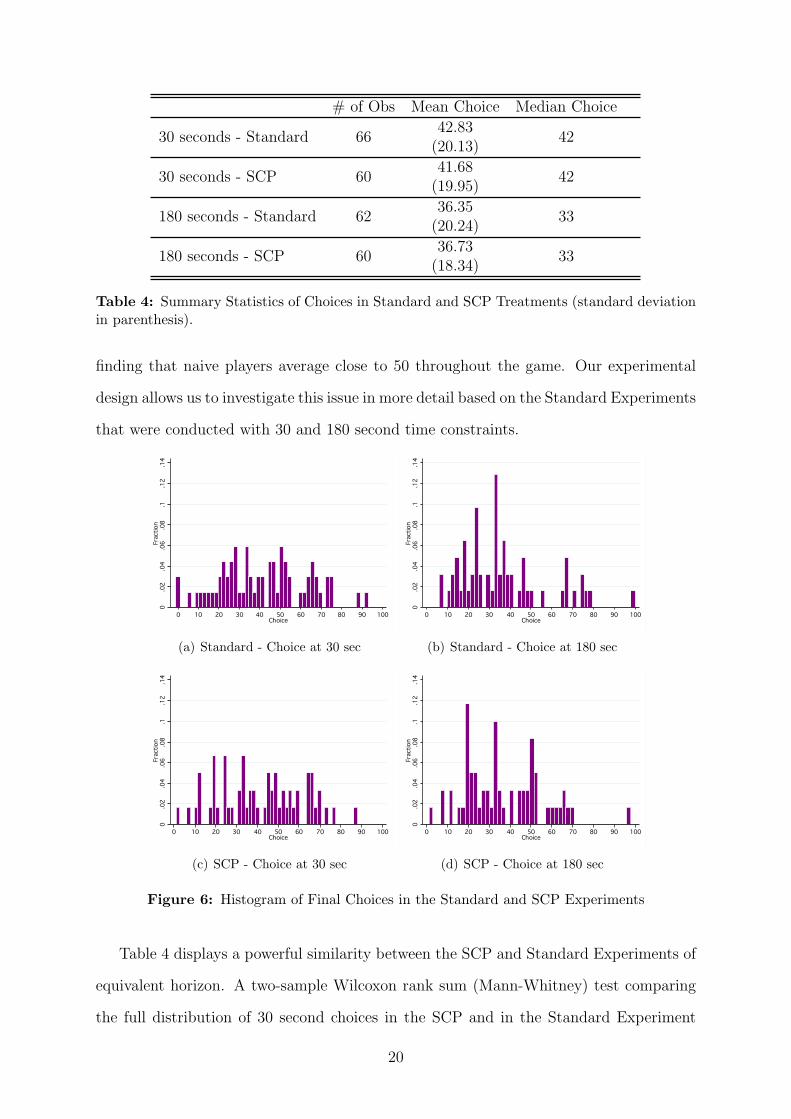
Table 4: Summary Statistics of Choices in Standard and SCP Treatments (standard deviationin parenthesis).
finding that naive players average close to 50 throughout the game. Our experimental
design allows us to investigate this issue in more detail based on the Standard Experiments
that were conducted with 30 and 180 second time constraints.
0.02
.04
.06
.08
.1.12
.14
Fraction
0 10 20 30 40 50 60 70 80 90 100Choice
(a) Standard - Choice at 30 sec
0.02
.04
.06
.08
.1.12
.14
Fraction
0 10 20 30 40 50 60 70 80 90 100Choice
(b) Standard - Choice at 180 sec
0.02
.04
.06
.08
.1.12
.14
Fraction
0 10 20 30 40 50 60 70 80 90 100Choice
(c) SCP - Choice at 30 sec
0.02
.04
.06
.08
.1.12
.14
Fraction
0 10 20 30 40 50 60 70 80 90 100Choice
(d) SCP - Choice at 180 sec
Figure 6: Histogram of Final Choices in the Standard and SCP Experiments
Table 4 displays a powerful similarity between the SCP and Standard Experiments of
equivalent horizon. A two-sample Wilcoxon rank sum (Mann-Whitney) test comparing
the full distribution of 30 second choices in the SCP and in the Standard Experiment
20
shows that we cannot reject the hypothesis that the two samples are from the same distri-
bution (p > 0.10).35 The same holds true when comparing the 180 second choices in the
SCP and Standard Experiments. Figure 6 presents the histograms of choices in Standard
30 second and 180 second treatments and SCP experiments at 30 and 180 seconds.
# obs. Mean Choice τ Bootstrap 90% C.I.
Standard Experiment30 Seconds
66 42.83 0.5 [0,0.25]
SCP Experiment30 Seconds
60 41.68 0.6 [0,0.31]
Standard Experiment180 Seconds
62 36.35 1.1 [0.41,1.33]
SCP Experiment180 Seconds
60 36.73 1.06 [0.45,1.72]
Ho, Camerer, Weigelt (1998)p = 0.7
69 38.9 1 [0.5,1.6]
Nagel (1995)p = 2/3
66 37.2 1.1 [0.7,1.5]
Agranov et al. (2012)p = 0.64
91 35.1 1.13 [0.48,1.36]
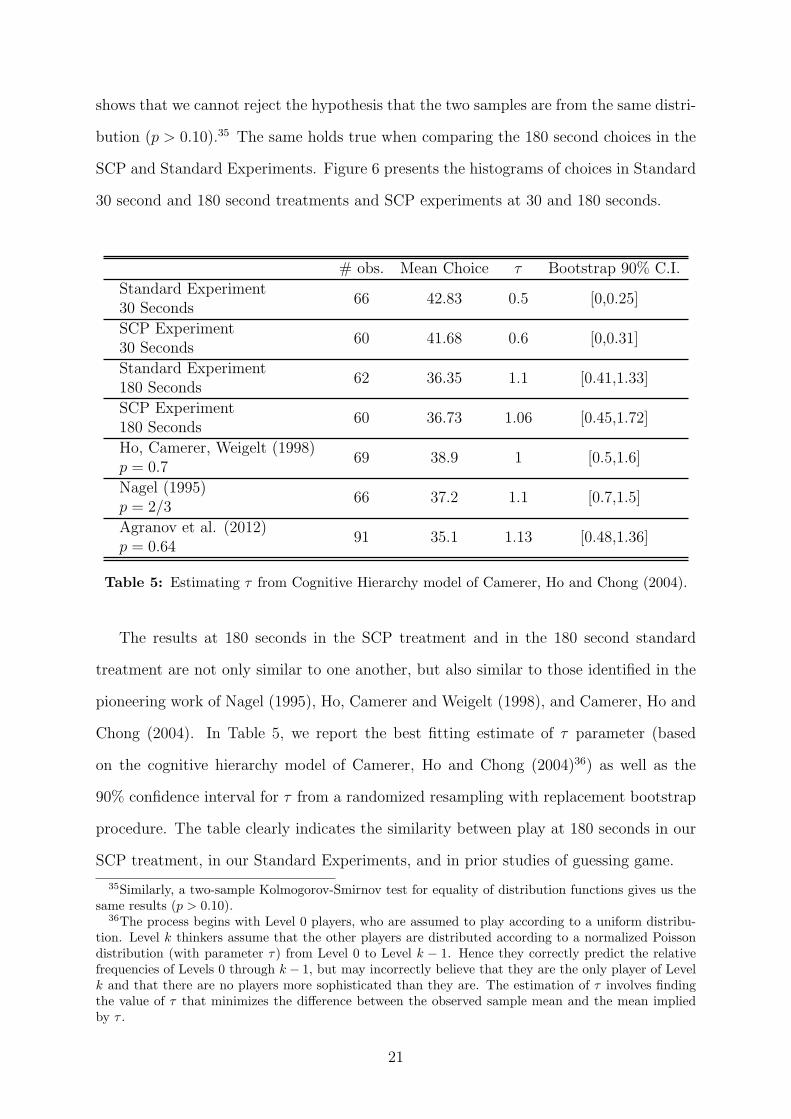
Table 5: Estimating τ from Cognitive Hierarchy model of Camerer, Ho and Chong (2004).
The results at 180 seconds in the SCP treatment and in the 180 second standard
treatment are not only similar to one another, but also similar to those identified in the
pioneering work of Nagel (1995), Ho, Camerer and Weigelt (1998), and Camerer, Ho and
Chong (2004). In Table 5, we report the best fitting estimate of τ parameter (based
on the cognitive hierarchy model of Camerer, Ho and Chong (2004)36) as well as the
90% confidence interval for τ from a randomized resampling with replacement bootstrap
procedure. The table clearly indicates the similarity between play at 180 seconds in our
SCP treatment, in our Standard Experiments, and in prior studies of guessing game.
35Similarly, a two-sample Kolmogorov-Smirnov test for equality of distribution functions gives us thesame results (p > 0.10).
36The process begins with Level 0 players, who are assumed to play according to a uniform distribu-tion. Level k thinkers assume that the other players are distributed according to a normalized Poissondistribution (with parameter τ) from Level 0 to Level k − 1. Hence they correctly predict the relativefrequencies of Levels 0 through k − 1, but may incorrectly believe that they are the only player of Levelk and that there are no players more sophisticated than they are. The estimation of τ involves findingthe value of τ that minimizes the difference between the observed sample mean and the mean impliedby τ .
21
We conclude that indeed there are strong similarities between SCP data and data
on the corresponding sequence of time-constrained games. To a first approximation, the
SCP treatment appears to be equivalent to multiple guessing games with different time
constraints. In addition to allowing one to economize on the number of plays, using the
SCP treatment to explore the impact of time constraints removes the need to control for
individual differences: the players are one and the same regardless of the time constraint.
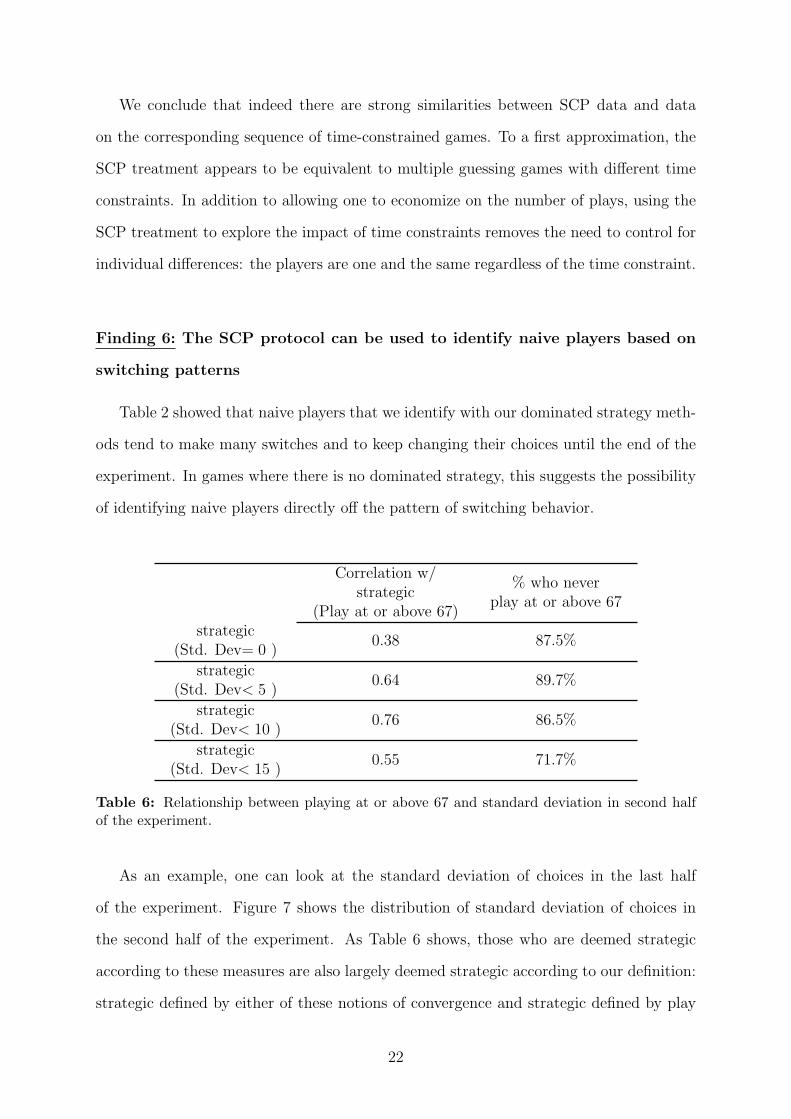
Finding 6: The SCP protocol can be used to identify naive players based on
switching patterns
Table 2 showed that naive players that we identify with our dominated strategy meth-
ods tend to make many switches and to keep changing their choices until the end of the
experiment. In games where there is no dominated strategy, this suggests the possibility
of identifying naive players directly off the pattern of switching behavior.
Correlation w/strategic
(Play at or above 67)
% who neverplay at or above 67
strategic(Std. Dev= 0 )
0.38 87.5%
strategic(Std. Dev< 5 )
0.64 89.7%
strategic(Std. Dev< 10 )
0.76 86.5%
strategic(Std. Dev< 15 )
0.55 71.7%
Table 6: Relationship between playing at or above 67 and standard deviation in second halfof the experiment.
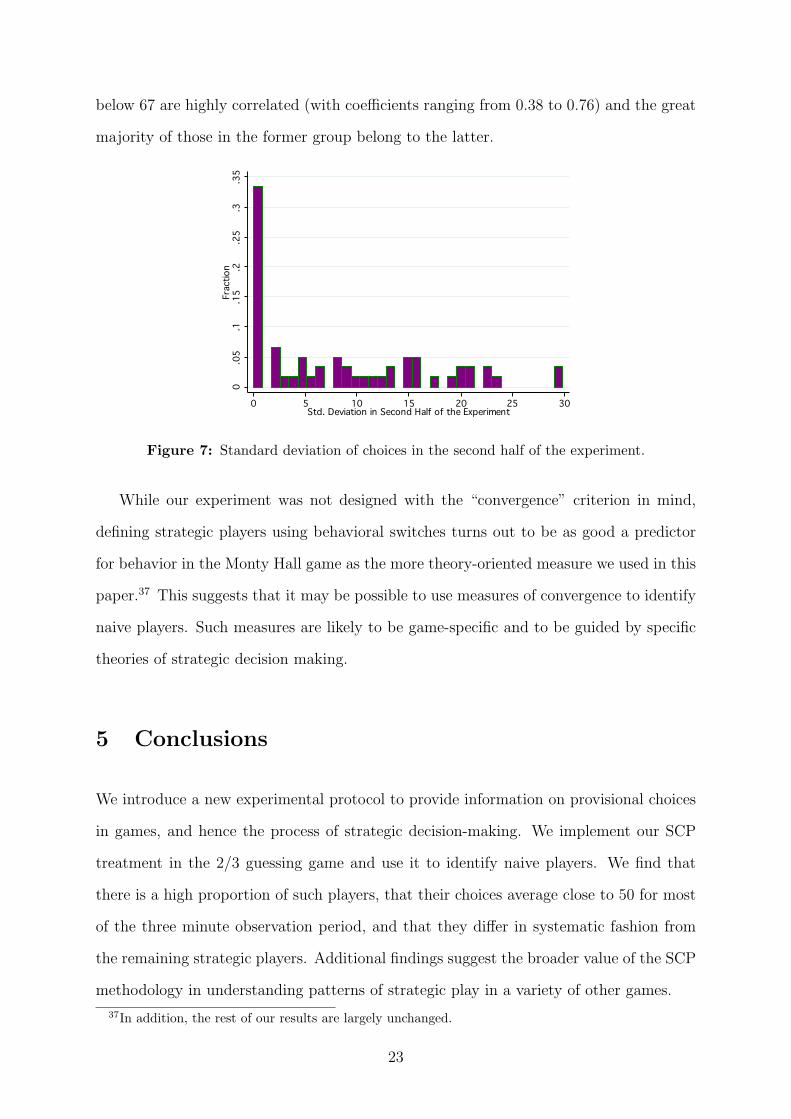
As an example, one can look at the standard deviation of choices in the last half
of the experiment. Figure 7 shows the distribution of standard deviation of choices in
the second half of the experiment. As Table 6 shows, those who are deemed strategic
according to these measures are also largely deemed strategic according to our definition:
strategic defined by either of these notions of convergence and strategic defined by play
22
below 67 are highly correlated (with coefficients ranging from 0.38 to 0.76) and the great
majority of those in the former group belong to the latter.
0.0
5.1
.15
.2.2
5.3
.35
Fra
ction
0 5 10 15 20 25 30Std. Deviation in Second Half of the Experiment
Figure 7: Standard deviation of choices in the second half of the experiment.
While our experiment was not designed with the “convergence” criterion in mind,
defining strategic players using behavioral switches turns out to be as good a predictor
for behavior in the Monty Hall game as the more theory-oriented measure we used in this
paper.37 This suggests that it may be possible to use measures of convergence to identify
naive players. Such measures are likely to be game-specific and to be guided by specific
theories of strategic decision making.
5 Conclusions
We introduce a new experimental protocol to provide information on provisional choices
in games, and hence the process of strategic decision-making. We implement our SCP
treatment in the 2/3 guessing game and use it to identify naive players. We find that
there is a high proportion of such players, that their choices average close to 50 for most
of the three minute observation period, and that they differ in systematic fashion from
the remaining strategic players. Additional findings suggest the broader value of the SCP
methodology in understanding patterns of strategic play in a variety of other games.
37In addition, the rest of our results are largely unchanged.
23
References
[1] Agranov, Marina, Potamites, Elizabeth, Schotter, Andrew and Chloe Tergiman.
2012. “Beliefs and Endogenous Cognitive Levels: an Experimental Study”, Games
and Economic Behavior, vol.75 pp. 449-463
[2] Alaoui, Larbi and Antonio Penta. 2012. “Level-k Reasoning and Incentives.” Working
Paper.
[3] Arad, Ayala. 2012. “The Tennis Coach Problem: A Game-Theoretic and Experimen-
tal Study.” The B.E. Journal of Theoretical Economics (Contributions), 12 (1)..
[4] Avishalom, Tor, and Max Bazerman. 2003. “Focusing Failures in Competitive En-
vironments: Explaining Decision Errors in the Monty Hall Game, the Acquiring a
Company Problem, and Multi-Party Ultimatums.” Journal of Behavioral Decision
Making, 16: 353-374.
[5] Bosch-Domenech, Antoni, Montalvo, Jose, Nagel, Rosemarie, and Albert Satorra.
2002. “One, Two, (Three), Infinity, . . . : Newspaper and Lab Beauty-Contest Ex-
periments.” The American Economic Review, 92 (5): 1687-1701.
[6] Burchardi, Konrad, and Stefan Penczynski. 2010. “Out of Your Mind:
Eliciting Individual Reasoning in One Shot Games.” Working Paper.
http://personal.lse.ac.uk/burchark/research/levelk 100413.pdf
[7] Camerer, Colin, Ho, Teck-Hua, and Juin-Kuan Chong. 2004. “A Cognitive Hierarchy
Model of Games.” The Quarterly Journal of Economics, 119(3): 861-898.
[8] Caplin, Andrew, and Mark Dean. 2011. “Search, Choice, and Revealed Preference.”
Theoretical Economics, 6:19-48.
[9] Caplin, Andrew, Dean, Mark, and Daniel Martin. 2011. “Search and Satisficing.”
American Economic Review, 101 (7): 2899-2922.
24
[10] Chen, Chun-Ting, Huang, Chen-Ying, and Joseph Wang. 2010. “A Window of Cog-
nition: Eyetracking the Reasoning Process in Spatial Beauty Contest Games.” Work-
ing Paper.
[11] Coricelli, Giorgio, and Rosemarie Nagel. 2009. “Neural correlates of depth of strate-
gic reasoning in medial prefrontal cortex.” Proceedings of the National Academy of
Sciences (PNAS): Economic Sciences, 106(23): 9163-9168.
[12] Costa-Gomes, Miguel A., Crawford, Vincent, and Bruno Broseta. 2001. “Cogni-
tion and Behavior in Normal-Form Games: An Experimental Study.” Econometrica,
69(5): 1193-1235.
[13] Costa-Gomes, Miguel, and Vincent Crawford. 2006. “Cognition and Behavior in
Two-Person Guessing Games: An Experimental Study.” The American Economic
Review, 96(5): 1737-1768.
[14] Costa-Gomes, Miguel. & Georg Weizsacker, 2008. “Stated Beliefs and Play in
Normal-Form Games,” Review of Economic Studies, vol. 75(3), pages 729-762.
[15] Crawford, Vincent. 2008. “Look-ups as the Windows of the Strategic Soul: Studying
Cognition via Information Search in Game Experiments.” In The Foundations of
Positive and Normative Economics, ed. Andrew Caplin and Andrew Schotter. New
York: Oxford University Press.
[16] Dawes, Robin. 1990. “The potential non-falsity of the false consensus effect.” In
Insights in decision making: A tribute to Hillel T. Einhorn, ed. Hillel and Robin
Hogarth. Chicago: University of Chicago Press.
[17] Dickinson, David, and Todd McElroy. 2009. “Naturally-occurring sleep choice and
time of day effects on p-beauty contest outcomes.” Working Papers 09-03, Depart-
ment of Economics, Appalachian State University.
[18] Duffy, John and Rosemarie Nagel. 1997. “On the robustness of behavior in d exper-
imental beauty-contest games.” Economic Journal, 107: 1684-1700.
25
[19] Dufwenberg, Martin, Sundaram, Ramya and David J. Butler. 2010. “Epiphany in
the Game of 21.” Journal of Economic Behavior & Organization, 75: 132-143.
[20] Friedman, Daniel. 1998. “Monty Hall’s Three Doors: Construction and Deconstruc-
tion of a Choice Anomaly.” The American Economic Review, 88(4): 933-946.
[21] Grosskopf, Brit and Rosemarie Nagel. 2008. “The Two-Person Beauty Contest,”
Games and Economic Behavior, 62 (2008) 9399.
[22] Georganas, Sotiris, Healy, Paul J. and Roberto Weber. 2010. “On the persistence of
strategic sophistication.” Working Paper.
[23] Goeree, Jacob, and Charles Holt. 2004. “A Model of Noisy Introspection.” Games
and Economic Behavior, 46(2): 365-382.
[24] Grimm, Veronika, and Friederike Mengel. 2010. “Let me sleep on it: Delay reduces
rejection rates in Ultimatum Games”. Working Paper.
[25] Ho, Teck-Hua, Camerer, Colin, and Keith Weigelt. 1998. “Iterated Dominance and
Iterated Best-response in p-Beauty Contests.” The American Economic Review, 88:
947-969.
[26] Ivanov, Asen, Levin, Dan & Muriel Niederle, 2010. “Can Relaxation of Beliefs Ra-
tionalize the Winner’s Curse?: An Experimental Study,” Econometrica, vol. 78(4),
pages 1435-1452.
[27] Kahneman, Daniel, and Amos Tversky. 1972. “Subjective probability: A judgment
of representativeness.” Cognitive Psychology 3: 430-454.
[28] Kocher, Martin, and Matthias Sutter. 2006. “Time is money - Time pressure, in-
centives, and the quality of decision-making.” Journal of Economic Behavior and
Organization, 61(3): 375-392.
[29] Nagel, Rosemarie. 1995. “Unraveling in Guessing Games: An Experimental Study.”
The American Economic Review, 85(5): 1313-1326.
26
[30] Nalebuff, Barry. 1987. “Puzzles: Choose a Curtain, Duel-ity, Two Point Conversions,
and More.” The Journal of Economic Perspectives, 1(2): 157-163.
[31] Rubinstein, Ariel. 2007. “Instinctive and Cognitive Reasoning: A Study of Response
Times.” Economic Journal, 117: 1243-1259.
[32] Sbriglia, Patrizia. 2004. “Revealing the depth of reasoning in p-beauty contest
games.” Working Paper.
[33] Slonim, Robert L. 2005. “Competing Against Experienced and Inexperienced Play-
ers.” Experimental Economics, 8:55-75.
[34] Stahl, Dale. 1996. “Boundedly Rational Rule Learning in a Guessing Game.” Games
and Economic Behavior, 16: 303-330.
[35] Stahl, Dale, and Paul Wilson. 1995. “On Players Models of Other Players: Theory
and Experimental Evidence.” Games and Economic Behavior, 10(1): 218-254.
[36] Weber, Roberto. 2003. “Learning with no feedback in a competitive guessing game.”
Games and Economic Behavior, 44(1): 134-144.
27

A Instructions for the Choice Process Experiment
We will start with a brief instruction period. If you have any questions during this period,
raise your hand. Experiment consists of two parts. You will be given instructions for
the next part of the experiment once you finished this part. Anything you earn in the
experiment will be added to your show-up fee of $7.
PART I
We will start by describing what kinds of decisions you will be making in this
game. We will then describe the rules of the game and the payments in this
game.
Your task in this game is to choose a number from those presented on the screen.
The game lasts 180 seconds. At the top right corner of the screen you can see how many
seconds are left. At the bottom right corner of the screen there is a “Finished” button.
The rest of the screen is filled with buttons representing integer numbers between 1 and
100. They are arranged in decreasing order.
When the game starts, you can select the number by clicking on the button displaying
the number that you want. You may click when you want, however many times you want.
The computer will record all the numbers you click on, as well as when you
clicked on them.
After 180 seconds, or when you click the finish button, the round will come to an end
and you won’t be able to change your choice anymore. Just to make clear, if you choose
a number and then stay with that number until the end, or instead decide to click on the
“Finish” button, it will make no difference.
Only one of the numbers you selected will matter for payment. To determine which one,
the computer will randomly choose a second between 0 and 180, each second is equally
likely to be chosen. The number you selected at that time will be the one that matters.
We will call this number “Your Number.” Below are two examples.
28
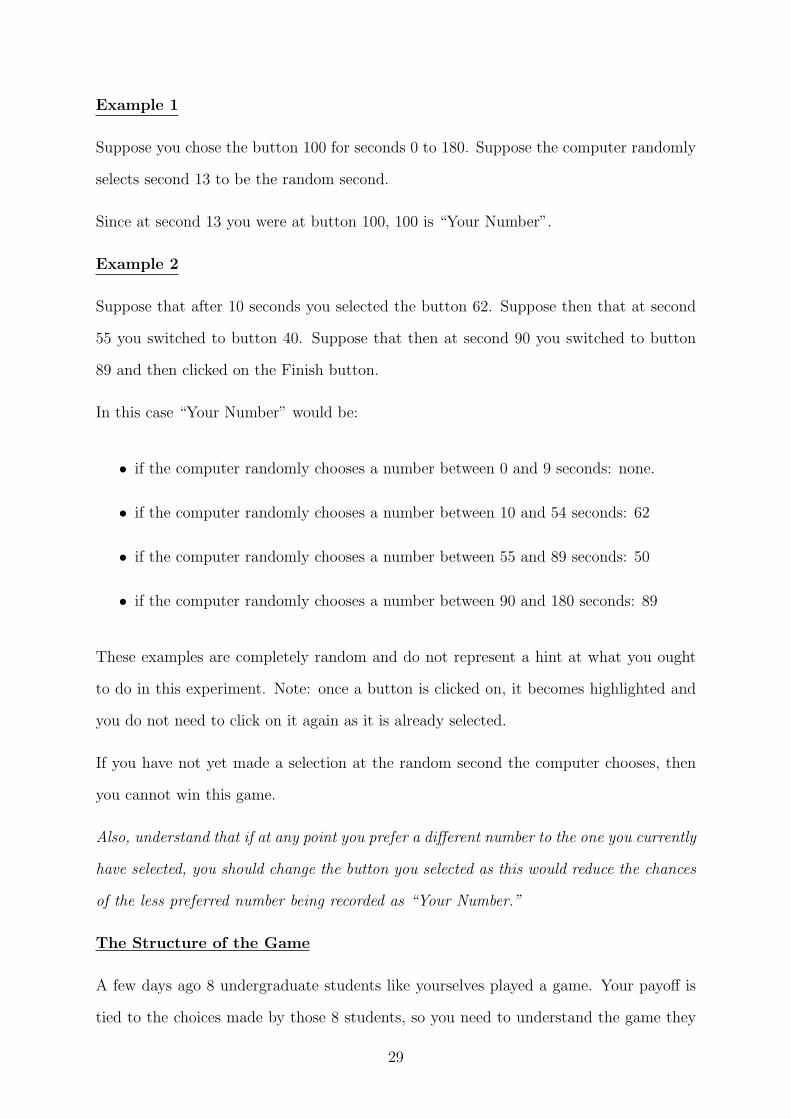
Example 1
Suppose you chose the button 100 for seconds 0 to 180. Suppose the computer randomly
selects second 13 to be the random second.
Since at second 13 you were at button 100, 100 is “Your Number”.
Example 2
Suppose that after 10 seconds you selected the button 62. Suppose then that at second
55 you switched to button 40. Suppose that then at second 90 you switched to button
89 and then clicked on the Finish button.
In this case “Your Number” would be:
• if the computer randomly chooses a number between 0 and 9 seconds: none.
• if the computer randomly chooses a number between 10 and 54 seconds: 62
• if the computer randomly chooses a number between 55 and 89 seconds: 50
• if the computer randomly chooses a number between 90 and 180 seconds: 89
These examples are completely random and do not represent a hint at what you ought
to do in this experiment. Note: once a button is clicked on, it becomes highlighted and
you do not need to click on it again as it is already selected.
If you have not yet made a selection at the random second the computer chooses, then
you cannot win this game.
Also, understand that if at any point you prefer a different number to the one you currently
have selected, you should change the button you selected as this would reduce the chances
of the less preferred number being recorded as “Your Number.”
The Structure of the Game
A few days ago 8 undergraduate students like yourselves played a game. Your payoff is
tied to the choices made by those 8 students, so you need to understand the game they
29

played. We will now distribute the rules of the game these 8 students played and the
rules of the game you will be playing.
Your payoff will not depend on the choices made by the people in this room. It depends
only on your choice and the choices these 8 students made a few days ago.
[Distribute the second set of instructions face down now. Wait for all to
receive a copy. Read it out loud.]
The PAST game the 8 people played:
Each of the 8 students had 180 seconds to choose an integer between 1 and 100 inclusive,
which they wrote on a piece of paper. After 180 seconds, we collected the papers. The
winner was the person whose number was closest to two thirds of the average of everyone’s
numbers. That is, the 8 students played among themselves and their goal was to guess
two thirds of the average of everyone’s numbers.
The winner won $10 and in case of a tie the prize was split.
The game YOU will be playing now:
You will have 180 seconds to choose an integer between 1 and 100 inclusive. You win
$10 if you are ”better than” those 8 students at determining two thirds of the average of
their numbers. That is, you win $10 if Your Number is the closest to two thirds of
the average of the numbers in the past game.
At any point, it is in your best interest to select the button corresponding to
what you think is two thirds of the average of the numbers in the past game.
[Game starts right away.]
B Instructions for the Monty Hall Game
Screen 1
Behind one of these doors is $5. Behind the other two is $0. So, there is only one winning
30

door.
Please choose one of the doors.
Screen 2
You have selected Door < their choice >.
We know which door contains $5.
Before we opend the door you selected, we are going to open one of the doors that con-
tains $0.
[ We open one door that contains $0.]
Screen 3
Do you want to keep Door < their choice > or switch to Door < other door >?
31
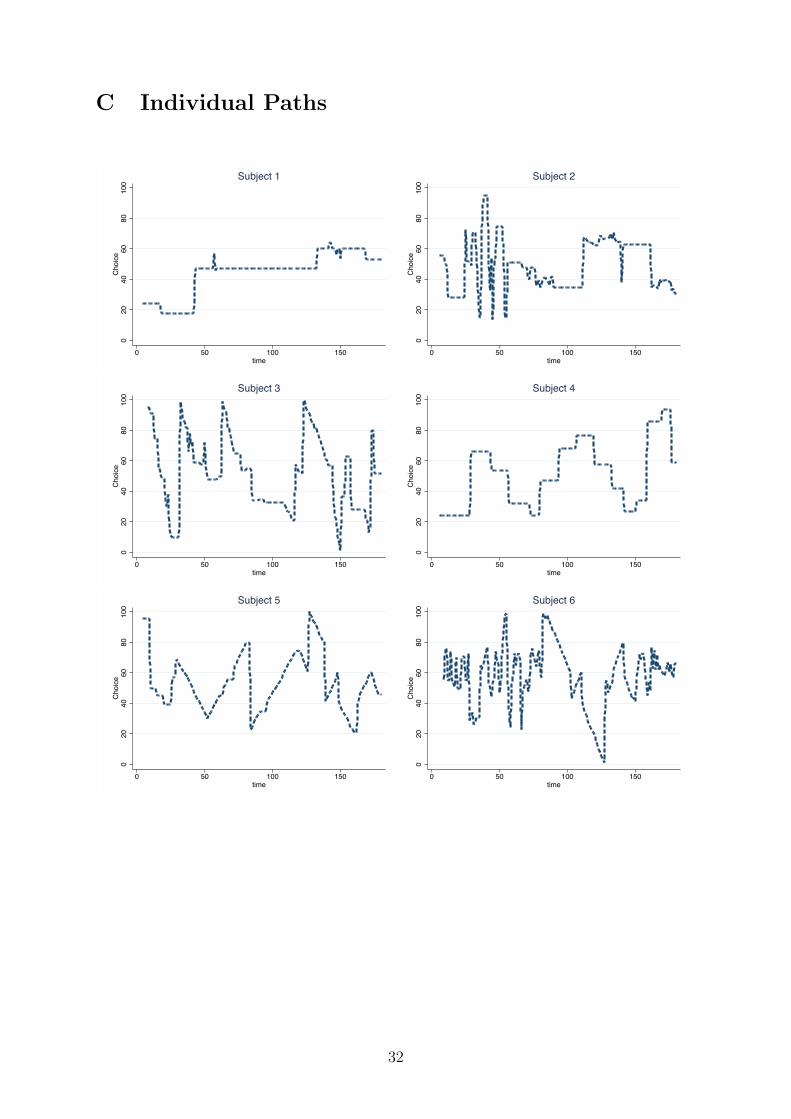
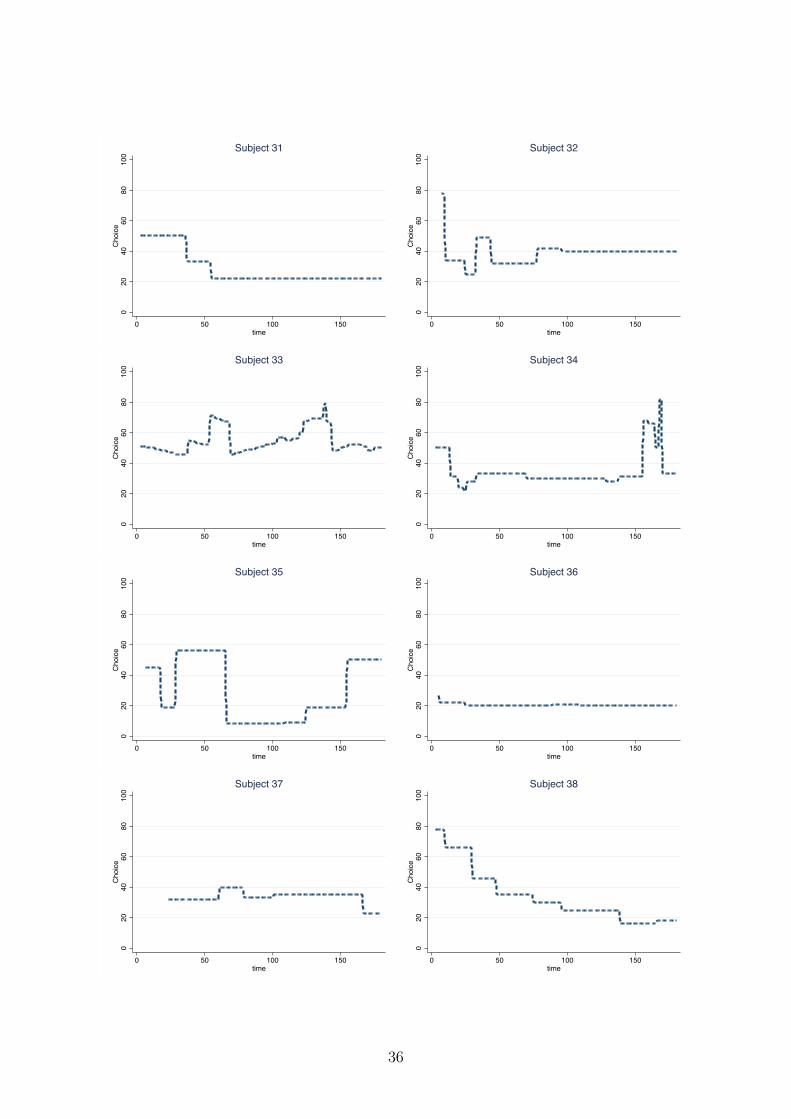
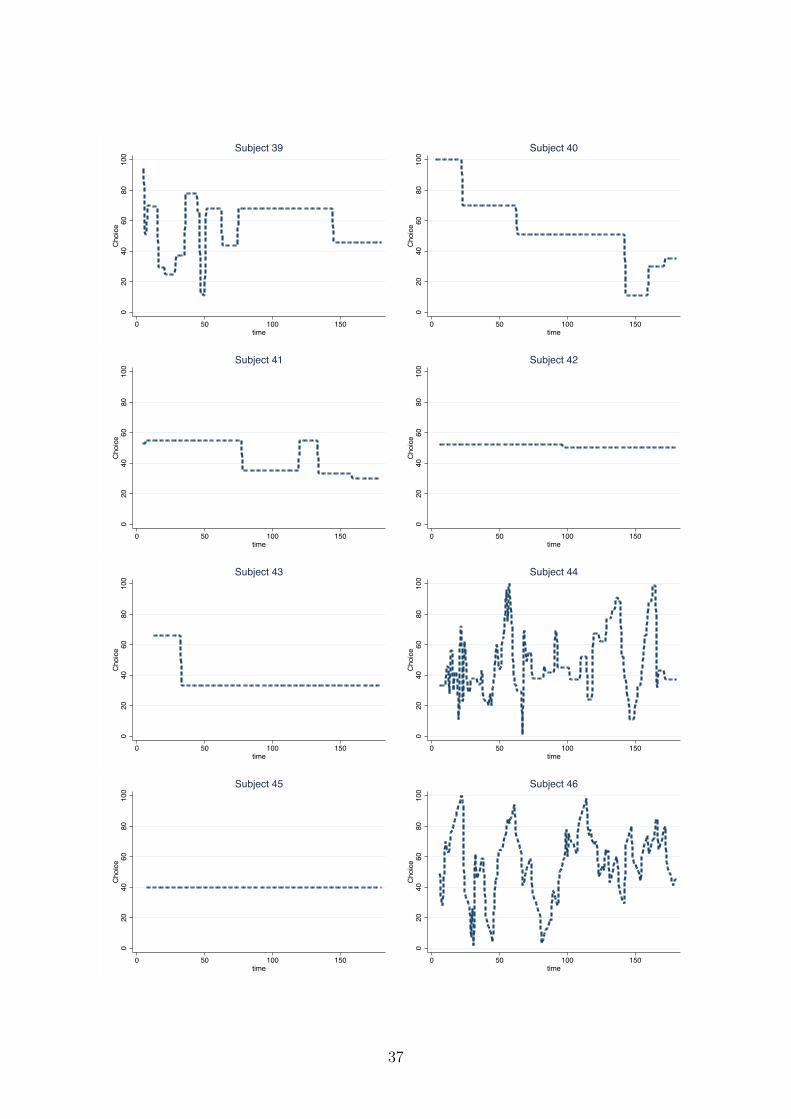
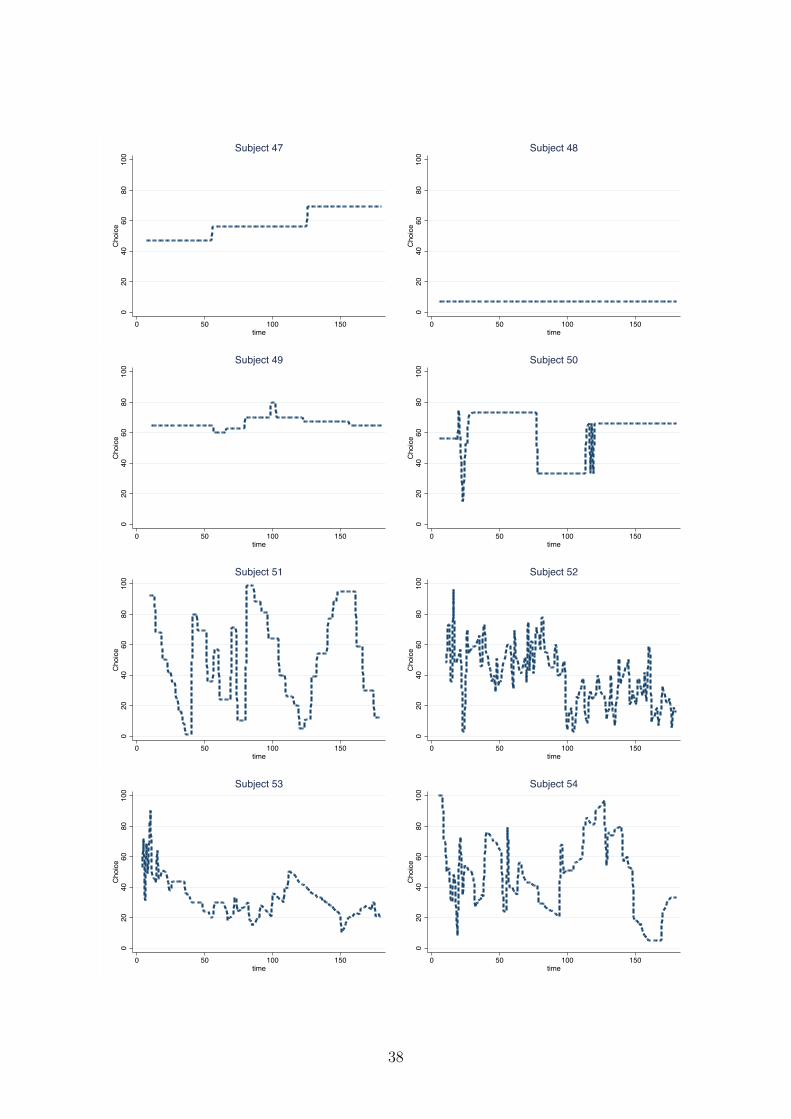
C Individual Paths0
2040
6080
100
Cho
ice
0 50 100 150200time
Subject 1
020
4060
8010
0C
hoic
e
0 50 100 150200time
Subject 2
020
4060
8010
0C
hoic
e
0 50 100 150200time
Subject 3
020
4060
8010
0C
hoic
e
0 50 100 150200time
Subject 4
020
4060
8010
0C
hoic
e
0 50 100 150200time
Subject 5
020
4060
8010
0C
hoic
e
0 50 100 150200time
Subject 6
32
020
4060
8010
0C
hoic
e
0 50 100 150200time
Subject 7
020
4060
8010
0C
hoic
e
0 50 100 150200time
Subject 8
020
4060
8010
0C
hoic
e
0 50 100 150200time
Subject 9
020
4060
8010
0C
hoic
e
0 50 100 150200time
Subject 10
020
4060
8010
0C
hoic
e
0 50 100 150200time
Subject 11
020
4060
8010
0C
hoic
e
0 50 100 150200time
Subject 12
020
4060
8010
0C
hoic
e
0 50 100 150200time
Subject 13
020
4060
8010
0C
hoic
e
0 50 100 150200time
Subject 14
33
020
4060
8010
0C
hoic
e
0 50 100 150200time
Subject 15
020
4060
8010
0C
hoic
e
0 50 100 150200time
Subject 16
020
4060
8010
0C
hoic
e
0 50 100 150200time
Subject 17
020
4060
8010
0C
hoic
e
0 50 100 150200time
Subject 18
020
4060
8010
0C
hoic
e
0 50 100 150200time
Subject 19
020
4060
8010
0C
hoic
e
0 50 100 150200time
Subject 20
020
4060
8010
0C
hoic
e
0 50 100 150200time
Subject 21
020
4060
8010
0C
hoic
e
0 50 100 150200time
Subject 22
34
020
4060
8010
0C
hoic
e
0 50 100 150200time
Subject 23
020
4060
8010
0C
hoic
e
0 50 100 150200time
Subject 24
020
4060
8010
0C
hoic
e
0 50 100 150200time
Subject 25
020
4060
8010
0C
hoic
e
0 50 100 150200time
Subject 26
020
4060
8010
0C
hoic
e
0 50 100 150200time
Subject 27
020
4060
8010
0C
hoic
e
0 50 100 150200time
Subject 28
020
4060
8010
0C
hoic
e
0 50 100 150200time
Subject 29
020
4060
8010
0C
hoic
e
0 50 100 150200time
Subject 30
35
020
4060
8010
0C
hoic
e
0 50 100 150200time
Subject 31
020
4060
8010
0C
hoic
e
0 50 100 150200time
Subject 32
020
4060
8010
0C
hoic
e
0 50 100 150200time
Subject 33
020
4060
8010
0C
hoic
e
0 50 100 150200time
Subject 34
020
4060
8010
0C
hoic
e
0 50 100 150200time
Subject 35
020
4060
8010
0C
hoic
e
0 50 100 150200time
Subject 36
020
4060
8010
0C
hoic
e
0 50 100 150200time
Subject 37
020
4060
8010
0C
hoic
e
0 50 100 150200time
Subject 38
36
020
4060
8010
0C
hoic
e
0 50 100 150200time
Subject 39
020
4060
8010
0C
hoic
e
0 50 100 150200time
Subject 40
020
4060
8010
0C
hoic
e
0 50 100 150200time
Subject 41
020
4060
8010
0C
hoic
e
0 50 100 150200time
Subject 42
020
4060
8010
0C
hoic
e
0 50 100 150200time
Subject 43
020
4060
8010
0C
hoic
e
0 50 100 150200time
Subject 44
020
4060
8010
0C
hoic
e
0 50 100 150200time
Subject 45
020
4060
8010
0C
hoic
e
0 50 100 150200time
Subject 46
37
020
4060
8010
0C
hoic
e
0 50 100 150200time
Subject 47
020
4060
8010
0C
hoic
e
0 50 100 150200time
Subject 48
020
4060
8010
0C
hoic
e
0 50 100 150200time
Subject 49
020
4060
8010
0C
hoic
e
0 50 100 150200time
Subject 50
020
4060
8010
0C
hoic
e
0 50 100 150200time
Subject 51
020
4060
8010
0C
hoic
e
0 50 100 150200time
Subject 52
020
4060
8010
0C
hoic
e
0 50 100 150200time
Subject 53
020
4060
8010
0C
hoic
e
0 50 100 150200time
Subject 54
38
020
4060
8010
0C
hoic
e
0 50 100 150200time
Subject 55
020
4060
8010
0C
hoic
e0 50 100 150200
time
Subject 56
020
4060
8010
0C
hoic
e
0 50 100 150200time
Subject 57
020
4060
8010
0C
hoic
e
0 50 100 150200time
Subject 58
020
4060
8010
0C
hoic
e
0 50 100 150200time
Subject 59
020
4060
8010
0C
hoic
e
0 50 100 150200time
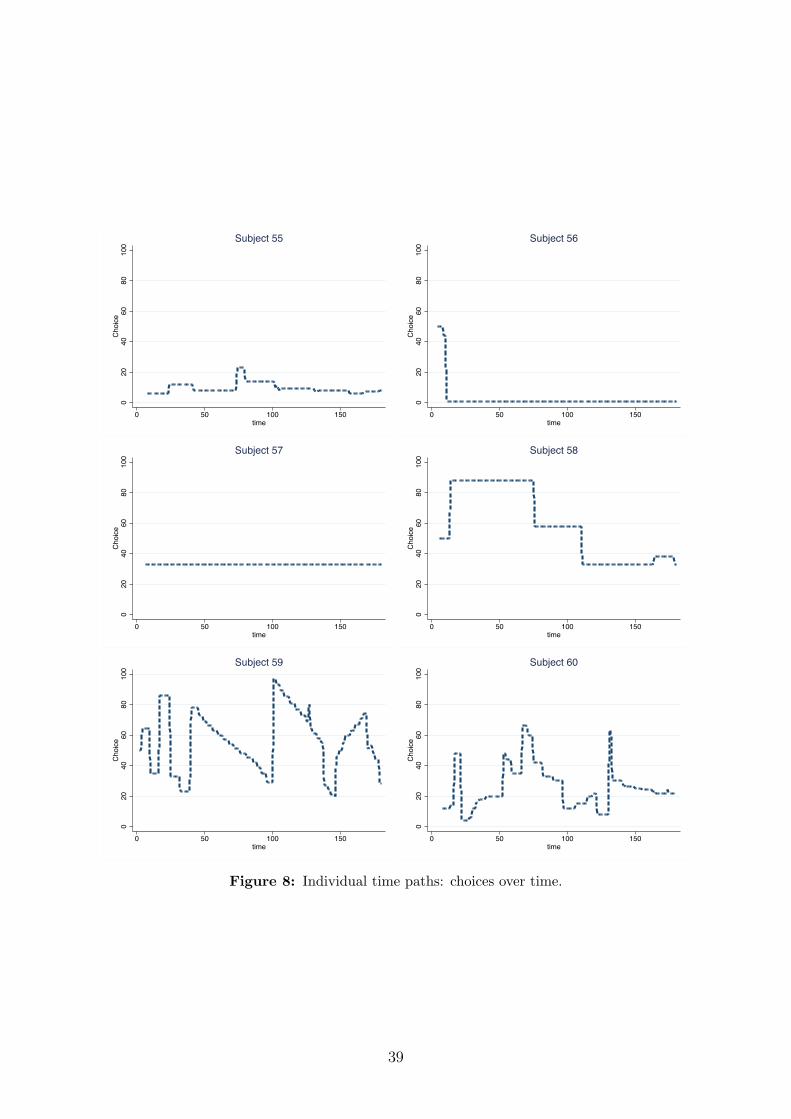
Subject 60
Figure 8: Individual time paths: choices over time.
39


