
Journ
alof
Cell
Scie
nce
N-cadherin-mediated cell–cell adhesion promotes cellmigration in a three-dimensional matrix
Wenting Shih and Soichiro Yamada*Department of Biomedical Engineering, University of California, Davis, CA 95616, USA
*Author for correspondence ([email protected])
Accepted 15 March 2012Journal of Cell Science 125, 3661–3670� 2012. Published by The Company of Biologists Ltddoi: 10.1242/jcs.103861
SummaryCancer cells that originate from epithelial tissues typically lose epithelial specific cell–cell junctions, but these transformed cells are notdevoid of cell–cell adhesion proteins. Using hepatocyte-growth-factor-treated MDCK cells that underwent a complete epithelial-to-
mesenchymal transition, we analyzed cell–cell adhesion between these highly invasive transformed epithelial cells in a three-dimensional (3D) collagen matrix. In a 3D matrix, these transformed cells formed elongated multicellular chains, and migrated fasterand more persistently than single cells in isolation. In addition, the cell clusters were enriched with stress-fiber-like actin bundles that
provided contractile forces. N-cadherin-knockdown cells failed to form cell–cell junctions or migrate, and the expression of the N-cadherin cytoplasmic or extracellular domain partially rescued the knockdown phenotype. By contrast, the expression of N-cadherin–a-catenin chimera rescued the knockdown phenotype, but individual cells within the cell clusters were less mobile. Together, our
findings suggest that a dynamic N-cadherin and actin linkage is required for efficient 3D collective migration.
Key words: Cell migration, Cell–cell adhesion, N-cadherin, 3D matrix, EMT
IntroductionCell migration is a critical first step in the assembly anddevelopment of tissues and metastasis of cancer cells. Many
motile cells migrate with a prototypical mesenchymal phenotypeby grabbing onto the complex substrate surrounding primarytumor sites, thus cell-to-extracellular matrix adhesion is a key
determinant of migration phenotype. Recent studies have focusedon the properties of extracellular matrix, including theorganization, stiffness, and dimensionality (Geiger and Yamada,2011). Three-dimensional (3D) matrices provide unique external
cues typically absent in two-dimensional (2D), stiff surfaces. Notsurprisingly, cell migration in a 3D matrix is distinct from thetypical, lamellipodia-driven cell migration on 2D substrates.
Unlike the prominent focal adhesions formed on a stiff substrate,adhesive complexes in a soft 3D matrix have different molecularcompositions and size (Cukierman et al., 2001; Kubow and
Horwitz, 2011), and in some cases are absent (Fraley et al., 2010).These studies suggest that the matrix dimension can significantlyalter cell-extracellular matrix adhesion, but little is known about
cell–cell adhesion between migrating cells in a 3D matrix.
Cell–cell adhesion is required for coordinated multicellularmovement. Cadherins, calcium-dependent adhesion receptors,play a central role during embryo compaction (Vestweber and
Kemler, 1985), cell intercalation (Cavey et al., 2008; Rauzi et al.,2010), apical constriction (Martin et al., 2009; Sawyer et al.,2009), cell sorting (Steinberg and Takeichi, 1994), and purse-
string wound healing (Danjo and Gipson, 1998; Jacinto et al.,2001). With cadherin associating proteins and the underlyingactin cytoskeleton, cadherin-mediated cell–cell adhesion
promotes a unique cytoskeletal structure to provide adhesivestrength (Gomez et al., 2011; Leckband et al., 2011; Weis andNelson, 2006).
Cellular movement is initiated by the activation of specifictranscription factors, and the altered gene expression profile
results in a phenotypic transition from an epithelial tomesenchymal morphology. This epithelial-to-mesenchymal
transition (EMT) drives gastrulation and neural crestdelamination in embryogenesis, but is thought to also initiate
the cancer cell invasion and the progression of metastatic cancer(Thiery, 2002; Thiery et al., 2009). Similar to collective cell
migration observed in embryogenesis, cancer cell invasion has
been shown to occur as a multicellular process in vitro (Ilina et al.,2011; Wolf et al., 2007) and in vivo (Friedl and Gilmour, 2009;
Friedl and Wolf, 2003). EMT alters the gene expression profile ofcell–cell adhesion receptors: the down-regulation of epithelial
(E)-cadherin and the up-regulation of neural (N)-cadherin.The down-regulation of E-cadherin is a hallmark of cancer
development, and E-cadherin is thought to act as a tumorsuppressor (Cavallaro and Christofori, 2004). Furthermore, the E-
to-N cadherin switch is often observed in aggressive cancers(Wheelock et al., 2008). Therefore, a mechanistic understanding
of N-cadherin in transformed epithelial cell migration hassignificant implications, not only in normal developmental
processes, but also in cancer progression.
Using hepatocyte growth factor (HGF) as an EMT inducer of
MDCK cells, we analyzed cell invasion of transformed epithelialcells. Although HGF acts in an upstream of snail, a transcription
factor that regulates E-cadherin expression (Grotegut et al.,2006), whether HGF can induce complete EMT or 3D cell
invasion has not been analyzed. Here, we demonstrate that HGF-
treated MDCK cells undergo the E-to-N cadherin switch anddevelop a highly invasive phenotype in a 3D matrix. These
transformed cells migrate collectively and N-cadherin is requiredfor both pro-migratory signaling and cell–cell adhesion between
Research Article 3661
Journ
alof
Cell
Scie
nce
invasive cells. Furthermore, the dynamic N-cadherin-actin
linkage is an essential requirement for intercellular movement
within a cluster during collective cell invasion in a 3D matrix.
These results reveal the roles of newly up-regulated N-cadherin
in collective cell invasion of transformed epithelial cells, and
may provide the mechanistic understanding of N-cadherin during
cancer progression.
ResultsHepatocyte growth factor induces EMT and invasiveness
in MDCK epithelial cells
To study the migration of epithelial cells that have undergone an
EMT, MDCK epithelial cells were cultured in HGF containing
media. Unlike partial EMT observed under short term HGF
exposure (Leroy and Mostov, 2007), under prolonged HGF
exposure, the protein level of cadherins switched from E-to-N
cadherin (Fig. 1A), which localized prominently at the cell–cell
contacts of pre and post EMT cells (Fig. 1B) respectively. HGF-
treated cells showed increased expression of fibronectin, another
mesenchymal marker (Fig. 1A), and reduced levels of
desmoplakin, a component of desmosomes (supplementary
material Fig. S1). These cells lost their typical epithelial
cobblestone morphology and adopted a mesenchymal, spindle
shape (Fig. 1B). On a coverslip, these transformed cells migrated
without maintaining cell–cell contacts, and migrated faster than
untransformed epithelial cells (supplementary material Fig. S2).
In a 3D collagen matrix, HGF-treated cells exhibited an
elongated morphology, with thin membrane extensions, and were
also highly migratory in all three dimensions. Invasive cells
exerted significant traction forces that deformed the surrounding
collagen matrix toward cell body (supplementary material Movie
1), which in turn suggests the presence of a linkage between the
collagen and migrating cells, likely mediated by integrins. The
addition of Y27632 (Rho kinase inhibitor) relaxed the anterior
and posterior collagen network of migrating cells, and halted cell
migration (supplementary material Fig. S3, Movie 2), suggesting
that myosin II generated traction forces are required for 3D cell
migration. Despite the significant collagen deformation
(supplementary material Fig. S3), thus indicating high traction
forces, cells were able to maintain cell–cell contacts with
neighboring cells, and migrate collectively as an elongated
cluster through the 3D matrix (Fig. 1C, supplementary material
Movie 1). Therefore, in a 3D matrix, either cell–cell junctions are
more resilient and/or traction forces are weaker than on a 2D
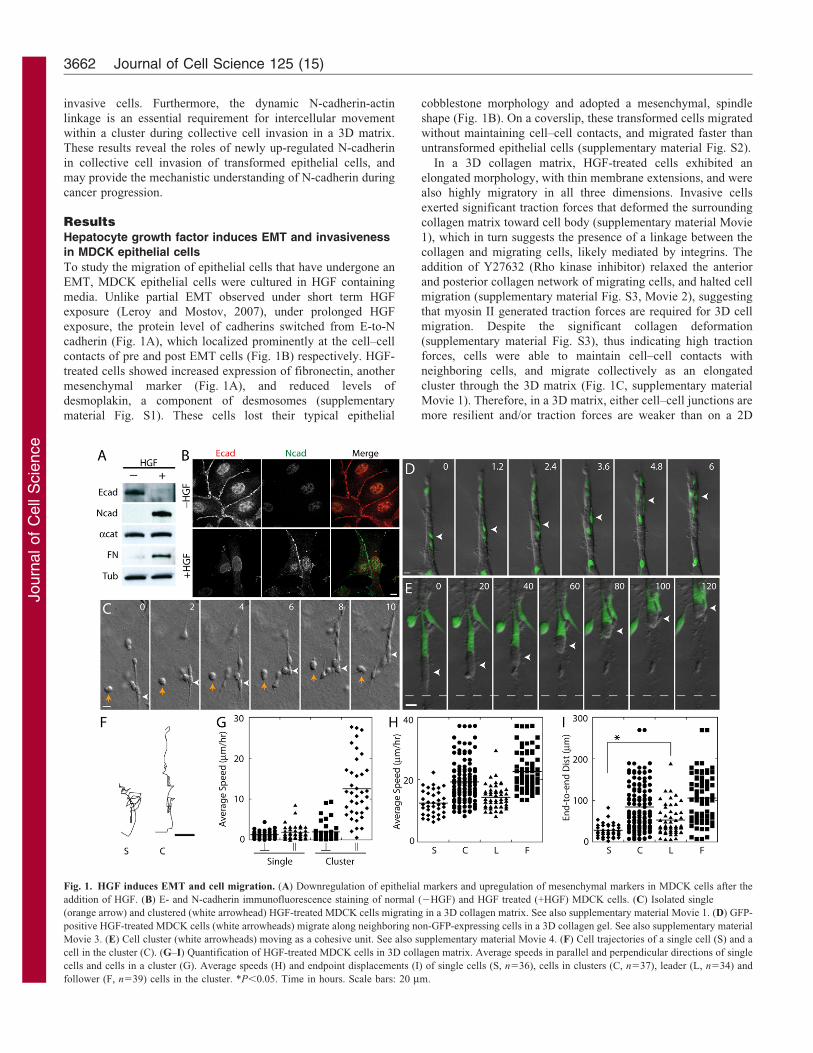
Fig. 1. HGF induces EMT and cell migration. (A) Downregulation of epithelial markers and upregulation of mesenchymal markers in MDCK cells after the
addition of HGF. (B) E- and N-cadherin immunofluorescence staining of normal (2HGF) and HGF treated (+HGF) MDCK cells. (C) Isolated single
(orange arrow) and clustered (white arrowhead) HGF-treated MDCK cells migrating in a 3D collagen matrix. See also supplementary material Movie 1. (D) GFP-
positive HGF-treated MDCK cells (white arrowheads) migrate along neighboring non-GFP-expressing cells in a 3D collagen gel. See also supplementary material
Movie 3. (E) Cell cluster (white arrowheads) moving as a cohesive unit. See also supplementary material Movie 4. (F) Cell trajectories of a single cell (S) and a
cell in the cluster (C). (G–I) Quantification of HGF-treated MDCK cells in 3D collagen matrix. Average speeds in parallel and perpendicular directions of single
cells and cells in a cluster (G). Average speeds (H) and endpoint displacements (I) of single cells (S, n536), cells in clusters (C, n537), leader (L, n534) and
follower (F, n539) cells in the cluster. *P,0.05. Time in hours. Scale bars: 20 mm.
Journal of Cell Science 125 (15)3662

Journ
alof
Cell
Scie
nce
surface, thus preventing the mechanical disruption of cell–cellcontacts often observed for migrating cells on a coverslip (de
Rooij et al., 2005). In a 3D matrix, the formation of cell–celladhesion has important consequences on cell migrationphenotype.
In a 3D matrix, HGF-treated cells migrated collectively using acombination of two techniques. Individual cells within a clustermigrated along cell–cell contacts, sliding past neighboring cells
(Fig. 1D, supplementary material Movie 3). Alternatively, cellclusters translocated cohesively as a single unit, while individualcells maintained contacts with the same neighboring cells
(Fig. 1E, supplementary material Movie 4). The advantage ofcollective cell migration is the directional persistence. Singlecells in the matrix migrated randomly at a similar speed in boththe parallel and perpendicular directions (relative to the initial
axis of cell polarization, Fig. 1G). In contrast, individual cells ina cluster migrated faster along adjacent cells parallel to theelongated direction of the cluster, than in the perpendicular
direction (Fig. 1G). Since the leader cells exhibited a similarspeed as single isolated cells in a 3D matrix, the faster movementof cells in a cluster is due to the increased speed of the follower
cells (Fig. 1H). Significantly, the leader cells of a cell clustermigrated in a more persistent direction than single isolated cellsas indicated by end-to-end displacement (Fig. 1F,I), suggestingthat cell-to-cell interactions between the leader cells and follower
cells promote a linear migration path in a 3D matrix.
Cell–cell adhesion promotes persistent cell migration bysuppressing random protrusions
One possible explanation for why cells prefer to migrate along
and with adjacent cells is that the path provides the leastresistance compared to the extracellular matrix. For example,some leader cells establish a migration path by digesting
extracellular matrix and creating a tunnel for other cells tofollow (Gaggioli et al., 2007; Wolf et al., 2007). To test whether amigration track or cell–cell interactions are required for persistentcell migration, the cell clusters were treated with EDTA to
chelate the calcium and disrupt cell–cell adhesion. After EDTAtreatment, cell–cell contacts became disrupted, and the cellcluster dissociated (Fig. 2A, supplementary material Movie 5).
The newly isolated single cells extended numerous protrusions,and migrated in random directions as opposed to migrating inthe same direction (Fig. 2A, arrowheads), suggesting that the
presence of such a track (if any) does not influence the migrationdirection. In addition, since there were increased thin membraneprotrusions as cell–cell contacts dissociated (Fig. 2A), cell–cell
adhesion inhibits the formation of random membrane extensions,thereby minimizing cell scattering. Altogether, these data suggestthat cell–cell adhesion promotes directionally persistentcollective cell migration in a 3D environment by suppressing
random membrane extensions.
The actin organization at N-cadherin junctions in 3D matrix
The newly up-regulated N-cadherin prominently localized tocell–cell contacts of highly migratory cells in a 3D matrix
(Fig. 2B). The N-cadherin junctions colocalized with the actincytoskeleton, which aligned parallel to cell–cell contacts(Fig. 2C, arrowheads). Interestingly, some actin bundles
organized perpendicular to N-cadherin junctions (Fig. 2C,arrows), and in the direction of the contractile force generatedby migrating cells (supplementary material Fig. S3). These actin
bundles, reminiscent of actin stress fibers in cells that adhere to
stiff 2D substrates, were only present in cells with an elongated,
migratory morphology, and were absent from circular cells. The
presence of N-cadherin at the ends of the actin bundles suggests
that N-cadherin may be responsible for organizing actin fibers in
a 3D matrix. However, N-cadherin proteins were not the only
cadherin expressed in these cells. HGF-treated cells also
expressed T-cadherin, K-cadherin and cadherin 11 (Fig. 2D).
None of the other cadherin levels were HGF treatment dependent,
except N-cadherin, suggesting that the newly acquired cell–cell
interaction and the unique actin organization between invasive
cells are primarily mediated by N-cadherin.
N-cadherin-deficient cells do not adhere or migrate
To test the roles of N-cadherin in HGF-treated post-EMT cells,
we stably silenced N-cadherin in HGF-treated cells, which had
99% (KD1) and 90% (KD2) reduction of endogenous N-cadherin
(Fig. 3A; supplementary material Fig. S4A), while other cadherin
levels remained unchanged (supplementary material Fig. S4B). In
suspension, wild-type HGF-treated cells aggregated, but N-
cadherin depleted cells (KD1) did not (Fig. 3B). In contrast,
partial knockdown (KD2) cells which expressed a low level of
residual endogenous N-cadherin (,10%), formed aggregates
similar in size to wild-type HGF-treated cells (Fig. 3B),
indicating that a small fraction of endogenous N-cadherin is
sufficient for cell aggregation. Furthermore, in the presence of
cytochalasin D, which disrupts the actin cytoskeleton, wild-type
HGF-treated cells also did not aggregate (Fig. 3B). Therefore, in
Fig. 2. Cell–cell adhesion between HGF-treated MDCK cells in a 3D
collagen matrix. (A) Cell–cell interaction is calcium dependent. EDTA was
added at time 0 hour. See also supplementary material Movie 5. Orange and
white arrowheads track the movement of two individual cells.
(B) Immunofluorescence staining of N-cadherin. (C) Dual immunofluorescence
staining of N-cadherin (red) and actin (green) in HGF-treated cells in a 3D
matrix. Arrowheads indicate the N-cadherin junctions, and the arrows indicate
the bundles of actin fibers. (D) Western blots of normal and HGF-treated MDCK
cells for T-cadherin, cadherin 11 and K-cadherin. Scale bars: 10 mm.
N-cadherin-mediated cell migration 3663
Journ
alof
Cell
Scie
nce
addition to N-cadherin, an intact actin network is required for the
formation of cell–cell adhesion and cell aggregates in a matrix-
free suspension.
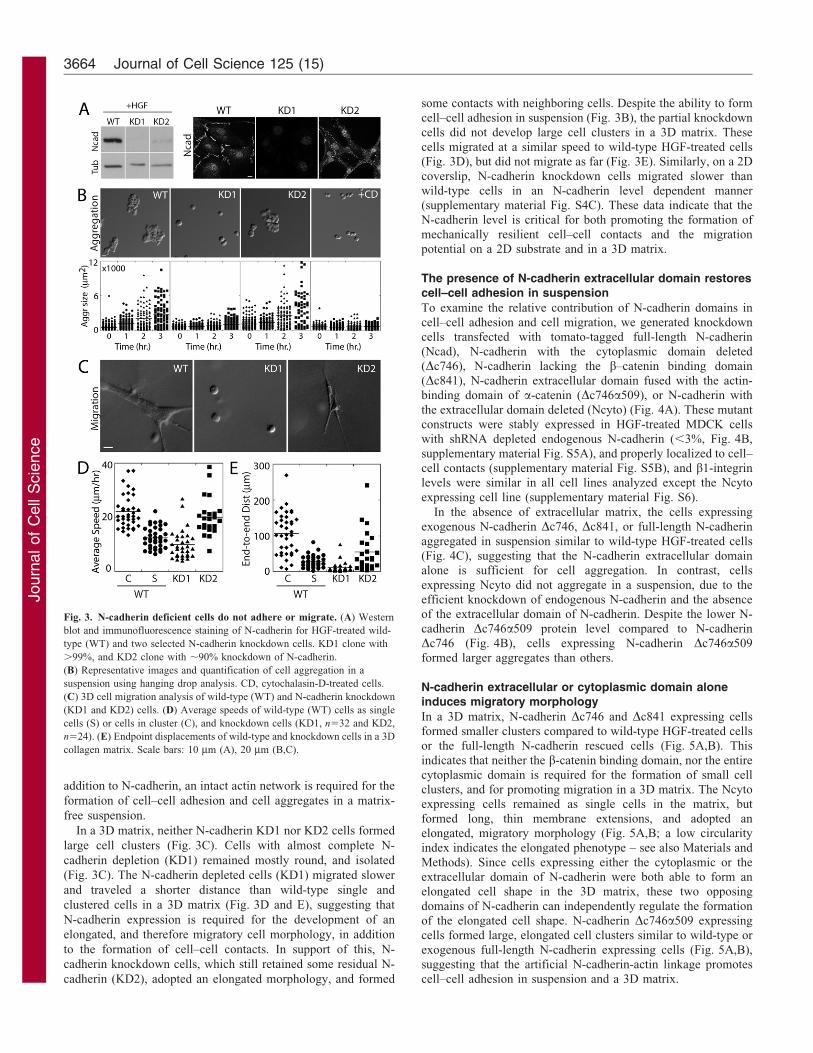
In a 3D matrix, neither N-cadherin KD1 nor KD2 cells formed
large cell clusters (Fig. 3C). Cells with almost complete N-
cadherin depletion (KD1) remained mostly round, and isolated
(Fig. 3C). The N-cadherin depleted cells (KD1) migrated slower
and traveled a shorter distance than wild-type single and
clustered cells in a 3D matrix (Fig. 3D and E), suggesting that
N-cadherin expression is required for the development of an
elongated, and therefore migratory cell morphology, in addition
to the formation of cell–cell contacts. In support of this, N-
cadherin knockdown cells, which still retained some residual N-
cadherin (KD2), adopted an elongated morphology, and formed
some contacts with neighboring cells. Despite the ability to formcell–cell adhesion in suspension (Fig. 3B), the partial knockdown
cells did not develop large cell clusters in a 3D matrix. Thesecells migrated at a similar speed to wild-type HGF-treated cells(Fig. 3D), but did not migrate as far (Fig. 3E). Similarly, on a 2D
coverslip, N-cadherin knockdown cells migrated slower thanwild-type cells in an N-cadherin level dependent manner(supplementary material Fig. S4C). These data indicate that theN-cadherin level is critical for both promoting the formation of
mechanically resilient cell–cell contacts and the migrationpotential on a 2D substrate and in a 3D matrix.
The presence of N-cadherin extracellular domain restorescell–cell adhesion in suspension
To examine the relative contribution of N-cadherin domains incell–cell adhesion and cell migration, we generated knockdowncells transfected with tomato-tagged full-length N-cadherin
(Ncad), N-cadherin with the cytoplasmic domain deleted(Dc746), N-cadherin lacking the b–catenin binding domain(Dc841), N-cadherin extracellular domain fused with the actin-binding domain of a-catenin (Dc746a509), or N-cadherin with
the extracellular domain deleted (Ncyto) (Fig. 4A). These mutantconstructs were stably expressed in HGF-treated MDCK cellswith shRNA depleted endogenous N-cadherin (,3%, Fig. 4B,
supplementary material Fig. S5A), and properly localized to cell–cell contacts (supplementary material Fig. S5B), and b1-integrinlevels were similar in all cell lines analyzed except the Ncyto
expressing cell line (supplementary material Fig. S6).
In the absence of extracellular matrix, the cells expressingexogenous N-cadherin Dc746, Dc841, or full-length N-cadherin
aggregated in suspension similar to wild-type HGF-treated cells(Fig. 4C), suggesting that the N-cadherin extracellular domainalone is sufficient for cell aggregation. In contrast, cells
expressing Ncyto did not aggregate in a suspension, due to theefficient knockdown of endogenous N-cadherin and the absenceof the extracellular domain of N-cadherin. Despite the lower N-cadherin Dc746a509 protein level compared to N-cadherin
Dc746 (Fig. 4B), cells expressing N-cadherin Dc746a509formed larger aggregates than others.
N-cadherin extracellular or cytoplasmic domain aloneinduces migratory morphology
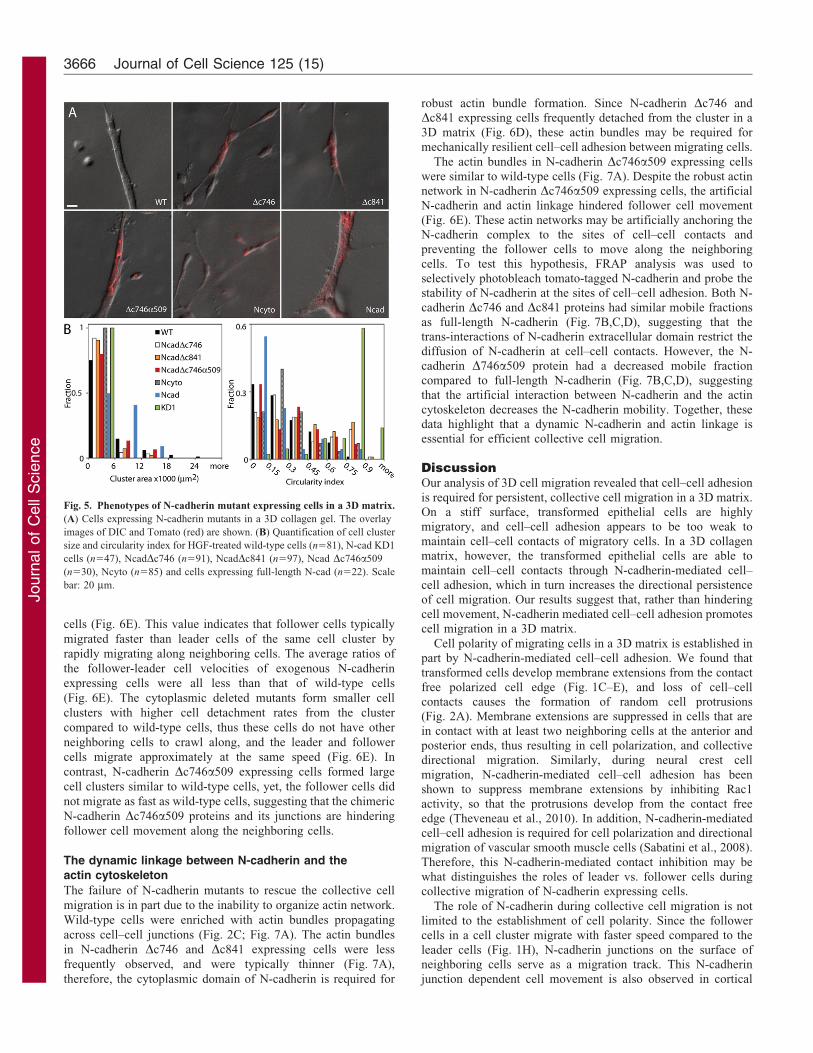
In a 3D matrix, N-cadherin Dc746 and Dc841 expressing cellsformed smaller clusters compared to wild-type HGF-treated cellsor the full-length N-cadherin rescued cells (Fig. 5A,B). This
indicates that neither the b-catenin binding domain, nor the entirecytoplasmic domain is required for the formation of small cellclusters, and for promoting migration in a 3D matrix. The Ncytoexpressing cells remained as single cells in the matrix, but
formed long, thin membrane extensions, and adopted anelongated, migratory morphology (Fig. 5A,B; a low circularityindex indicates the elongated phenotype – see also Materials and
Methods). Since cells expressing either the cytoplasmic or theextracellular domain of N-cadherin were both able to form anelongated cell shape in the 3D matrix, these two opposing
domains of N-cadherin can independently regulate the formationof the elongated cell shape. N-cadherin Dc746a509 expressingcells formed large, elongated cell clusters similar to wild-type or
exogenous full-length N-cadherin expressing cells (Fig. 5A,B),suggesting that the artificial N-cadherin-actin linkage promotescell–cell adhesion in suspension and a 3D matrix.
Fig. 3. N-cadherin deficient cells do not adhere or migrate. (A) Western
blot and immunofluorescence staining of N-cadherin for HGF-treated wild-
type (WT) and two selected N-cadherin knockdown cells. KD1 clone with
.99%, and KD2 clone with ,90% knockdown of N-cadherin.
(B) Representative images and quantification of cell aggregation in a
suspension using hanging drop analysis. CD, cytochalasin-D-treated cells.
(C) 3D cell migration analysis of wild-type (WT) and N-cadherin knockdown
(KD1 and KD2) cells. (D) Average speeds of wild-type (WT) cells as single
cells (S) or cells in cluster (C), and knockdown cells (KD1, n532 and KD2,
n524). (E) Endpoint displacements of wild-type and knockdown cells in a 3D
collagen matrix. Scale bars: 10 mm (A), 20 mm (B,C).
Journal of Cell Science 125 (15)3664

Journ
alof
Cell
Scie
nce
N-cadherin deletion mutants cannot fully rescue collective
cell migration in a 3D matrix
In a 3D matrix, the leader cells of cell clusters expressing N-
cadherin Dc746a509 and full-length N-cadherin migrated at a
similar speed (Fig. 6A) and traveled a similar distance to wild-
type cells (Fig. 6B). N-cadherin Dc746 or Dc841 expressing cells
migrated slightly faster (Fig. 6A), but traveled a similar end-to-
end displacement to the wild type, and N-cadherin Dc746a509 or
full-length N-cadherin expressing cells (Fig. 6B). In contrast,
single cells expressing Ncyto migrated at a similar speed to
others (Fig. 6A), but had a shorter end-to-end displacement than
the other clustered N-cadherin mutant rescued and wild-type cells
(Fig. 6B). This is consistent with the observation that cell–cell
adhesion between the leader cells and follower cells induces
directional persistency (Fig. 1I). This migration analysis suggests
that the expression of the N-cadherin cytoplasmic domain alone
is sufficient to induce single cell migration, but in the absence
of the adhesive extracellular domain of this construct, the
expression of the N-cadherin cytoplasmic domain alone is not
sufficient for collective, persistent cell migration.
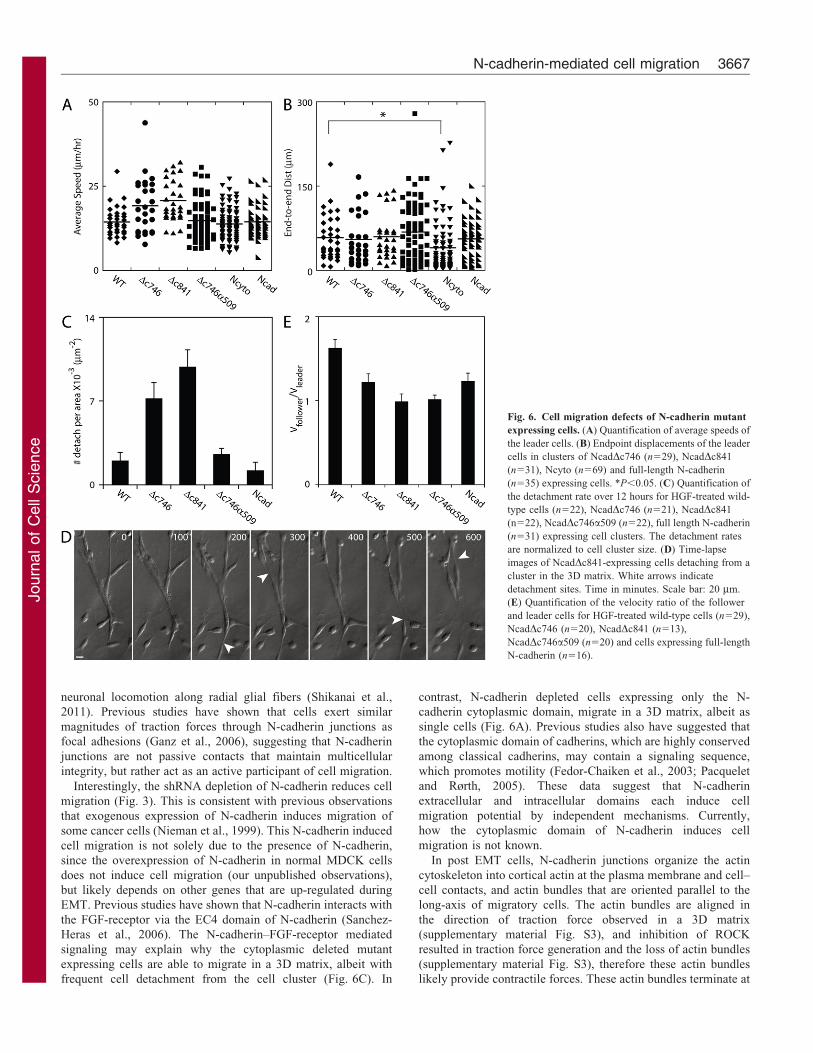
Although the N-cadherin mutants expressing cells migrated at
the similar speed as the wild-type cells, these mutants did not
completely rescue the migration phenotype of wild-type cells. In
the 3D matrix, these cells often moved away from the cell
clusters with trailing thin membrane connections that often
detached (Fig. 6D). Cell detachment rates of N-cadherin Dc746
and Dc841 expressing cells were higher than wild-type or full-
length N-cadherin expressing cells (Fig. 6C,D; supplementary
material Movie 6). Since b1 integrin levels remained constant in
N-cadherin Dc746 and Dc841 expressing cells compared to wild-
type HGF-treated cells (supplementary material Fig. S6), the
higher rates of cell detachment observed in cells expressing the
extracellular domain of N-cadherin (Fig. 6C) are unlikely due
to increased cell-matrix adhesion. Rather, the high cluster
detachment rates may be due to the lack of N-cadherin
cytoplasmic domain. In contrast, N-cadherin Dc746a509
expressing cells formed tight clusters with a similar cell
detachment rate from the cluster as wild-type or full-length N-
cadherin expressing cells (Fig. 6C). While N-cadherin Dc746 and
Dc841expression is sufficient to induce the formation of cell
aggregates (Fig. 4C) and small cell clusters in the matrix
(Fig. 5A,B), these cell–cell junctions are not strong enough to
prevent cell detachment from the highly migratory cluster.
N-cadherin fused to the actin-binding domain of a-catenin
hinders intercellular motility
The artificial linkage between N-cadherin and the actin
cytoskeleton in N-cadherin Dc746a509 expressing cells appears
to be sufficient for collective cell migration, but with one key
distinction. We compared the velocities of follower cells with
that of leader cells in the same cell clusters in a 3D matrix. The
follower-leader cell velocity ratio was about 1.5 for wild-type
Fig. 4. N-cadherin mutants in N-cadherin deficient cells. (A) Schematic of N-cadherin mutants. (B) Western blots of N-cadherin mutant rescue cells. (C) Cell
aggregation analysis of cells expressing N-cadherin mutants. Scale bar: 20 mm.
N-cadherin-mediated cell migration 3665
Journ
alof
Cell
Scie
nce
cells (Fig. 6E). This value indicates that follower cells typically
migrated faster than leader cells of the same cell cluster by
rapidly migrating along neighboring cells. The average ratios of
the follower-leader cell velocities of exogenous N-cadherin
expressing cells were all less than that of wild-type cells
(Fig. 6E). The cytoplasmic deleted mutants form smaller cell
clusters with higher cell detachment rates from the cluster
compared to wild-type cells, thus these cells do not have other
neighboring cells to crawl along, and the leader and follower
cells migrate approximately at the same speed (Fig. 6E). In
contrast, N-cadherin Dc746a509 expressing cells formed large
cell clusters similar to wild-type cells, yet, the follower cells did
not migrate as fast as wild-type cells, suggesting that the chimeric
N-cadherin Dc746a509 proteins and its junctions are hindering
follower cell movement along the neighboring cells.
The dynamic linkage between N-cadherin and the
actin cytoskeleton
The failure of N-cadherin mutants to rescue the collective cell
migration is in part due to the inability to organize actin network.
Wild-type cells were enriched with actin bundles propagating
across cell–cell junctions (Fig. 2C; Fig. 7A). The actin bundles
in N-cadherin Dc746 and Dc841 expressing cells were less
frequently observed, and were typically thinner (Fig. 7A),
therefore, the cytoplasmic domain of N-cadherin is required for
robust actin bundle formation. Since N-cadherin Dc746 andDc841 expressing cells frequently detached from the cluster in a
3D matrix (Fig. 6D), these actin bundles may be required formechanically resilient cell–cell adhesion between migrating cells.
The actin bundles in N-cadherin Dc746a509 expressing cells
were similar to wild-type cells (Fig. 7A). Despite the robust actinnetwork in N-cadherin Dc746a509 expressing cells, the artificialN-cadherin and actin linkage hindered follower cell movement
(Fig. 6E). These actin networks may be artificially anchoring theN-cadherin complex to the sites of cell–cell contacts andpreventing the follower cells to move along the neighboring
cells. To test this hypothesis, FRAP analysis was used toselectively photobleach tomato-tagged N-cadherin and probe thestability of N-cadherin at the sites of cell–cell adhesion. Both N-cadherin Dc746 and Dc841 proteins had similar mobile fractions
as full-length N-cadherin (Fig. 7B,C,D), suggesting that thetrans-interactions of N-cadherin extracellular domain restrict thediffusion of N-cadherin at cell–cell contacts. However, the N-
cadherin D746a509 protein had a decreased mobile fractioncompared to full-length N-cadherin (Fig. 7B,C,D), suggestingthat the artificial interaction between N-cadherin and the actin
cytoskeleton decreases the N-cadherin mobility. Together, thesedata highlight that a dynamic N-cadherin and actin linkage isessential for efficient collective cell migration.
DiscussionOur analysis of 3D cell migration revealed that cell–cell adhesion
is required for persistent, collective cell migration in a 3D matrix.On a stiff surface, transformed epithelial cells are highlymigratory, and cell–cell adhesion appears to be too weak to
maintain cell–cell contacts of migratory cells. In a 3D collagenmatrix, however, the transformed epithelial cells are able tomaintain cell–cell contacts through N-cadherin-mediated cell–
cell adhesion, which in turn increases the directional persistenceof cell migration. Our results suggest that, rather than hinderingcell movement, N-cadherin mediated cell–cell adhesion promotescell migration in a 3D matrix.
Cell polarity of migrating cells in a 3D matrix is established inpart by N-cadherin-mediated cell–cell adhesion. We found that
transformed cells develop membrane extensions from the contactfree polarized cell edge (Fig. 1C–E), and loss of cell–cellcontacts causes the formation of random cell protrusions(Fig. 2A). Membrane extensions are suppressed in cells that are
in contact with at least two neighboring cells at the anterior andposterior ends, thus resulting in cell polarization, and collectivedirectional migration. Similarly, during neural crest cell
migration, N-cadherin-mediated cell–cell adhesion has beenshown to suppress membrane extensions by inhibiting Rac1activity, so that the protrusions develop from the contact free
edge (Theveneau et al., 2010). In addition, N-cadherin-mediatedcell–cell adhesion is required for cell polarization and directionalmigration of vascular smooth muscle cells (Sabatini et al., 2008).
Therefore, this N-cadherin-mediated contact inhibition may bewhat distinguishes the roles of leader vs. follower cells duringcollective migration of N-cadherin expressing cells.
The role of N-cadherin during collective cell migration is notlimited to the establishment of cell polarity. Since the followercells in a cell cluster migrate with faster speed compared to the
leader cells (Fig. 1H), N-cadherin junctions on the surface ofneighboring cells serve as a migration track. This N-cadherinjunction dependent cell movement is also observed in cortical
Fig. 5. Phenotypes of N-cadherin mutant expressing cells in a 3D matrix.
(A) Cells expressing N-cadherin mutants in a 3D collagen gel. The overlay
images of DIC and Tomato (red) are shown. (B) Quantification of cell cluster
size and circularity index for HGF-treated wild-type cells (n581), N-cad KD1
cells (n547), NcadDc746 (n591), NcadDc841 (n597), Ncad Dc746a509
(n530), Ncyto (n585) and cells expressing full-length N-cad (n522). Scale
bar: 20 mm.
Journal of Cell Science 125 (15)3666
Journ
alof
Cell
Scie
nce
neuronal locomotion along radial glial fibers (Shikanai et al.,
2011). Previous studies have shown that cells exert similar
magnitudes of traction forces through N-cadherin junctions as
focal adhesions (Ganz et al., 2006), suggesting that N-cadherin
junctions are not passive contacts that maintain multicellular
integrity, but rather act as an active participant of cell migration.
Interestingly, the shRNA depletion of N-cadherin reduces cell
migration (Fig. 3). This is consistent with previous observations
that exogenous expression of N-cadherin induces migration of
some cancer cells (Nieman et al., 1999). This N-cadherin induced
cell migration is not solely due to the presence of N-cadherin,
since the overexpression of N-cadherin in normal MDCK cells
does not induce cell migration (our unpublished observations),
but likely depends on other genes that are up-regulated during
EMT. Previous studies have shown that N-cadherin interacts with
the FGF-receptor via the EC4 domain of N-cadherin (Sanchez-
Heras et al., 2006). The N-cadherin–FGF-receptor mediated
signaling may explain why the cytoplasmic deleted mutant
expressing cells are able to migrate in a 3D matrix, albeit with
frequent cell detachment from the cell cluster (Fig. 6C). In
contrast, N-cadherin depleted cells expressing only the N-
cadherin cytoplasmic domain, migrate in a 3D matrix, albeit as
single cells (Fig. 6A). Previous studies also have suggested that
the cytoplasmic domain of cadherins, which are highly conserved
among classical cadherins, may contain a signaling sequence,
which promotes motility (Fedor-Chaiken et al., 2003; Pacquelet
and Rørth, 2005). These data suggest that N-cadherin
extracellular and intracellular domains each induce cell
migration potential by independent mechanisms. Currently,
how the cytoplasmic domain of N-cadherin induces cell
migration is not known.
In post EMT cells, N-cadherin junctions organize the actin
cytoskeleton into cortical actin at the plasma membrane and cell–
cell contacts, and actin bundles that are oriented parallel to the
long-axis of migratory cells. The actin bundles are aligned in
the direction of traction force observed in a 3D matrix
(supplementary material Fig. S3), and inhibition of ROCK
resulted in traction force generation and the loss of actin bundles
(supplementary material Fig. S3), therefore these actin bundles
likely provide contractile forces. These actin bundles terminate at
Fig. 6. Cell migration defects of N-cadherin mutant
expressing cells. (A) Quantification of average speeds of
the leader cells. (B) Endpoint displacements of the leader
cells in clusters of NcadDc746 (n529), NcadDc841
(n531), Ncyto (n569) and full-length N-cadherin
(n535) expressing cells. *P,0.05. (C) Quantification of
the detachment rate over 12 hours for HGF-treated wild-
type cells (n522), NcadDc746 (n521), NcadDc841
(n522), NcadDc746a509 (n522), full length N-cadherin
(n531) expressing cell clusters. The detachment rates
are normalized to cell cluster size. (D) Time-lapse
images of NcadDc841-expressing cells detaching from a
cluster in the 3D matrix. White arrows indicate
detachment sites. Time in minutes. Scale bar: 20 mm.
(E) Quantification of the velocity ratio of the follower
and leader cells for HGF-treated wild-type cells (n529),
NcadDc746 (n520), NcadDc841 (n513),
NcadDc746a509 (n520) and cells expressing full-length
N-cadherin (n516).
N-cadherin-mediated cell migration 3667

Journ
alof
Cell
Scie
nce
N-cadherin cell–cell junctions, similar to contractile actin
bundles at cell–cell junctions in vitro (Vasioukhin et al., 2000;
Yamada and Nelson, 2007; Yonemura et al., 1995), wound
healing myofibroblasts in vivo (Hinz et al., 2001), or high fluid
shear regions of blood vessel (Wong et al., 1983). Other cancer
cells in a 3D matrix lacked the extensive actin bundles (Fraley
et al., 2010; Hegerfeldt et al., 2002), and this is likely due to the
absence or lower level of N-cadherin junctions as the levels of N-
cadherin is critical for the actin organization and collective cell
migration (Fig. 3, Fig. 7A).
The artificial actin recruitment at cell–cell contacts is
sufficient for the organization of actin bundles. However, the
N-cadherin Dc746a509 expressing cells are more prone to cell
aggregation (Fig. 4C) and the N-cadherin Dc746a509 proteins at
cell–cell junctions are less mobile than full-length N-cadherin
(Fig. 7B–D), suggesting that the interaction between N-cadherin
and the actin network is not a direct and stable linkage. Similar to
previous observations of E-cadherin (Drees et al., 2005; Yamada
et al., 2005), these data imply that N-cadherin junctions are
dynamic complexes that transiently interact with the underlying
actin network to promote cell migration within cell clusters. This
artificial linkage by the N-cadherin Dc746a509 reduces the speed
of follower cells in 3D cell clusters (Fig. 6E) and intercellular
movement in a monolayer (Nagafuchi et al., 1994). The artificial
recruitment of actin to N-cadherin Dc746a509 junctions,
therefore, is not dynamic enough to support cell movement
along neighboring cells within a cluster. Efficient collective
migration depends on a delicate balance between cell–cell
adhesion that is strong enough to prevent cell detachment from
the cluster, yet dynamic enough to support cell movement
between and along neighboring cells.
The up-regulation of N-cadherin in aggressive carcinomas
suggests that the level of N-cadherin is a critical parameter for
cancer cell invasion. Previous studies have shown that N-
cadherin mediates transendothelial migration of cancer cells, a
key step in metastasis (Drake et al., 2009; Qi et al., 2005). Our
results demonstrate that N-cadherin is important for promoting
migration even before cancer cells reach the vasculature. N-
cadherin targeted therapeutic strategies have been shown to
minimize N-cadherin positive tumor growth (Li et al., 2007) and
Fig. 7. The actin organization and N-cadherin dynamics
in migrating cells. (A) Dual immunofluorescence staining of
N-cadherin (red) and actin (green) in HGF-treated cells in a
3D matrix. Phalloidin staining of N-cadherin-depleted cells
expressing Tomato-tagged N-cadherin mutants in a 3D
matrix. (B) FRAP analysis of N-cadherin mutants.
Photobleaching of the Tomato-tagged N-cadherin proteins at
cell–cell contacts of HGF-treated cells in a 3D collagen
matrix. The left panel is a grayscale image of pre-FRAP cell–
cell contacts. The subsequent panels are time-lapse images of
boxed regions shown in the first panel. The fluorescence
intensity is pseudo-colored according to the scale bar shown
in the bottom right image. Time in seconds. (C) The
normalized fluorescence intensity profile of photobleached
spots. (D) The mean values (6 s.e.m.) of mobile fractions for
cells expressing full-length N-cad (n575), NcadD746
(n520), NcadD841 (n544) and NcadD746a509 (n518).
*P,0.05. Scale bars: 10 mm (A), 5 mm (B).
Journal of Cell Science 125 (15)3668

Journ
alof
Cell
Scie
nce
metastasis in a xenograft of prostate cancers (Tanaka et al.,2010). Our results provide the mechanistic details of how N-cadherin promotes cancer cell invasion and the explanations for
why N-cadherin targeted therapy might be effective. Althoughthe therapeutic agents targeting the extracellular domain of N-cadherin may not prevent single cancer cell invasion, breaking
down cell–cell adhesion between cancer cells will effectivelyminimize collective cell migration and may extend the timerequired for cancer cell dissemination.
Materials and MethodsCell lines and reagentsMDCK GII cells were cultured in DMEM (Invitrogen, Carlsbad, CA)supplemented with 10% FBS (Atlanta Biologicals, Lawrenceville, GA) and5 ng/ml of HGF (Sigma-Aldrich, St Louis, MO). The MDCK cells were treatedwith HGF for at least two weeks, and selected for complete EMT. Subsequentremoval of HGF from post-EMT cells caused N-to-E-cadherin switch, thus HGF-induced EMT was reversible. The higher concentration of HGF (20 ng/ml) wasadded to a collagen gel to increase the penetration of HGF into the gel. For westernblot or immunofluorescence applications, the antibodies used were E-cadherin (BDBiosciences, Franklin Lakes, NJ), N-cadherin (BD Biosciences, Franklin Lakes,NJ), a-catenin (Enzo Lifesciences, Farmingdale, NY), fibronectin (BDBiosciences, Franklin Lakes, NJ), tubulin (Sigma), T-cadherin (Anaspec, SanJose, CA), Cadherin 11 (R&D Systems, Minneapolis, MN), K-cadherin (a giftfrom James Nelson, Stanford University), desmoplakin I/II (a gift from JamesNelson), DsRed (Invitrogen, Carlsbad, CA) and b1-integrin (Millipore, Billerica,MA). Filamentous actin was labeled with phalloidin (Invitrogen). For western blot,the signals on the nitrocellulose membrane were detected by chemiluminescencewith an enhanced ECL reagent (Pierce Biotechnology). Pharmacological inhibitorsused were 100 mM Y-27632 (EMD Chemicals) and 10 mM Cytochalasin D (EMDChemicals).
N-cadherin knockdown and rescue constructsCanine N-cadherin shRNA targeting the sequences: #1: 59-AGTATTC-CCAAGACAAGCG-39; #2: 59-TGAACGGGCAAATAACAAC-39; #3: 59-AACGCCGAGGTAAAGAACG-39; and #4: 59-GATCGATATATGCAGCAAA-39, were inserted into the pSuper.neo+gfp vector (Oligoengine, Seattle, WA).Lipofectamine 2000 and G418 (both from Invitrogen, Carlsbad, CA) were used togenerate 35 stably transfected HGF-treated MDCK clones. Rescue N-cadherinmutants were derived from GFP-tagged N-cadherin (a gift from Kathleen Green,Northwestern University) and the GFP tag was replaced with a tandem dimerTomato fluorescent protein. We created the following constructs: mouse N-cadherin with only the extracellular domain AA1-746 (N-cadDc746), N-cadherinlacking the b-catenin binding domain AA1-841 (N-cadDc841), N-cadherin Dc746fused with a-catenin (AA 509-906), N-cadherin cytoplasmic domain AA747-906with a membrane targeting sequence from lyn protein (Ncyto), and the full-lengthN-cadherin. The rescue constructs were double transfected with a N-cadherinshRNA plasmid.
Live-cell confocal microscopy and FRAPAll samples were imaged on a Zeiss Axio Observer equipped with a Yokogawaspinning disk confocal system, a 106 and 406 objective, 488 and 561 nm solid-state lasers, and a CoolSNAP HQ camera. The microscope system was controlledand automated by Slidebook software (Intelligent Imaging Innovations, Denver,CO). Live cells were imaged on glass bottom dishes (MatTek, Ashland, MA) in atemperature-controlled chamber at 37 C.
FRAP analysis was performed on cells expressing tomato-tagged N-cadherinmutants. A small region (,1 mm2) at cell–cell contacts was selectivelyphotobleached, and the fluorescence intensity recovery was analyzed over time.Using Excel statistical analysis software (Microsoft, Redmond, WA), the recoverycurve was fitted to an exponential equation, I5If (12e2kt), where I is the intensity,If is the final intensity, t is time. The mobile fraction of the protein is the ratio ofthe final and initial intensity. A one-way analysis of variance (ANOVA) withDunnett’s post-hoc test was performed to compare the mobile fraction of each N-cadherin mutant protein with that of full-length N-cadherin. The difference wasassumed to be statistically significant when P,0.05.
Three-dimensional migration assaysFor three-dimensional migration assays, cells were embedded in a 1 mg/mlcollagen I matrix (BD Biosciences, Franklin Lakes, NJ) as previously described(Shih and Yamada, 2010). To chelate calcium, 0.5 mM EDTA was used to treatthe cells. Note that the concentration of EDTA used did not have any effects oncell spreading and attachment to a collagen-coated 2D surface (Shih and Yamada,unpublished data), therefore this disruption of cell–cell contacts and random cellinvasion are not the consequences of altered cell-ECM adhesion, but are unique
effects of EDTA on calcium dependent cell–cell adhesion. Fluorescent tracer
particles (1 mm diameter) were added to the matrix to visualize the matrix
deformation (Shih and Yamada, 2010).
To track individual cells within a cluster, HGF-treated cells were stably
transfected with GFP or GFP-tagged histone, and GFP-expressing cells were
mixed with non-expressing cells before seeding in the matrix. Cells were imaged
over 12 hours, and individual GFP-positive cells were tracked using Slidebook
software (Intelligent Imaging Innovations, Denver, CO). Leader cell velocitieswere obtained by tracking the leading edge of the cluster, and the follower-leader
velocity ratio was obtained by dividing the velocity of the follower cell by the
velocity of the leader cell for that particular cluster. End-to-end displacements
were calculated based on the initial and final cell position in 12 hour time-lapse
images. All cell trajectories were quantified in Slidebook software (Intelligent
Imaging Innovations, Denver, CO) and analyzed in Excel (Microsoft, Redmond,
WA). The number of detachments per cell cluster was counted, and normalized tothe cluster size and the imaging duration. A one-way analysis of variance
(ANOVA) with Dunnett’s post-hoc test was performed in (Fig. 1I), and the
difference was assumed to be statistically significant when P,0.05. Statistical
significance between wild-type and Ncyto in Fig. 6B was determined using z-test
with P,0.05.
Cell movement was analyzed in the directions parallel and perpendicular to the
primary axis of migration. For clusters, this reference direction was the long axis of
the cluster, while for single cells, the reference direction was the initial long axis of
the individual cell as determined by an ellipsoid fit. The cluster area of cells in the
matrix was determined by thresholding the image in ImageJ (http://rsb.info.nih.gov/ij), and quantifying the resulting cluster area of each object. The circularity
index for each thresholded object was calculated by taking the ratio of area and
perimeter (4p area/perimeter2), in which an object with perfect circle has an index
of 1.
Hanging drop analysis
For cell clustering analysis, cultured cells were dissociated with trypsin
(Invitrogen, Carlsbad, CA) supplemented with 1.8 mM calcium to preserve cell
surface receptors. Total volume of 25 ml containing approximately 250,000 cells
were hanged upside-down from the lid of the culture dish, and allowed to
aggregate for specified time. Some cell lines with strong cell–cell adhesion (e.g.
wild-type N-cadherin or N-cadherin Dc746a509 rescue cells) were difficult todissociate under these conditions and initially contained single cells and few cell
clusters (Fig. 4C). Every hour, the cell solution was triturated 5 times, then
imaged. The average aggregate size was determined by object thresholding using
ImageJ. Hanging drop results were analyzed using the Kruskal-Wallis test statistic
with Dunn’s post-hoc test. The difference was assumed to be statistically
significant when P,0.01.
AcknowledgementsWe thank James Nelson (Stanford University) for sharing the K-cadherin and desmoplakin antibodies, Kathleen Green (NorthwesternUniversity) for the N-cadherin-GFP plasmid, Tony Ronco for helpwith cell aggregation analysis.
FundingThis work was supported by a Beckman Young Investigator Award;a Hellman Family New Faculty Award; the National Institutes ofHealth EUREKA program [grant number GM094798]; and the fundfrom the University of California Cancer Research CoordinatingCommittee. Deposited in PMC for release after 12 months.
Supplementary material available online at
http://jcs.biologists.org/lookup/suppl/doi:10.1242/jcs.103861/-/DC1
ReferencesCavallaro, U. and Christofori, G. (2004). Cell adhesion and signalling by cadherins
and Ig-CAMs in cancer. Nat. Rev. Cancer 4, 118-132.
Cavey, M., Rauzi, M., Lenne, P. F. and Lecuit, T. (2008). A two-tiered mechanism for
stabilization and immobilization of E-cadherin. Nature 453, 751-756.
Cukierman, E., Pankov, R., Stevens, D. R. and Yamada, K. M. (2001). Taking cell-
matrix adhesions to the third dimension. Science 294, 1708-1712.
Danjo, Y. and Gipson, I. K. (1998). Actin ‘purse string’ filaments are anchored by E-
cadherin-mediated adherens junctions at the leading edge of the epithelial wound,
providing coordinated cell movement. J. Cell Sci. 111, 3323-3332.
de Rooij, J., Kerstens, A., Danuser, G., Schwartz, M. A. and Waterman-Storer,
C. M. (2005). Integrin-dependent actomyosin contraction regulates epithelial cell
scattering. J. Cell Biol. 171, 153-164.
N-cadherin-mediated cell migration 3669

Journ
alof
Cell
Scie
nce
Drake, J. M., Strohbehn, G., Bair, T. B., Moreland, J. G. and Henry, M. D. (2009).ZEB1 enhances transendothelial migration and represses the epithelial phenotype ofprostate cancer cells. Mol. Biol. Cell 20, 2207-2217.
Drees, F., Pokutta, S., Yamada, S., Nelson, W. J. and Weis, W. I. (2005). Alpha-catenin is a molecular switch that binds E-cadherin-beta-catenin and regulates actin-filament assembly. Cell 123, 903-915.
Fedor-Chaiken, M., Meigs, T. E., Kaplan, D. D. and Brackenbury, R. (2003). Tworegions of cadherin cytoplasmic domains are involved in suppressing motility of amammary carcinoma cell line. J. Biol. Chem. 278, 52371-52378.
Fraley, S. I., Feng, Y., Krishnamurthy, R., Kim, D. H., Celedon, A., Longmore,
G. D. and Wirtz, D. (2010). A distinctive role for focal adhesion proteins in three-dimensional cell motility. Nat. Cell Biol. 12, 598-604.
Friedl, P. and Gilmour, D. (2009). Collective cell migration in morphogenesis,regeneration and cancer. Nat. Rev. Mol. Cell Biol. 10, 445-457.
Friedl, P. and Wolf, K. (2003). Tumour-cell invasion and migration: diversity andescape mechanisms. Nat. Rev. Cancer 3, 362-374.
Gaggioli, C., Hooper, S., Hidalgo-Carcedo, C., Grosse, R., Marshall, J. F.,
Harrington, K. and Sahai, E. (2007). Fibroblast-led collective invasion ofcarcinoma cells with differing roles for RhoGTPases in leading and following cells.Nat. Cell Biol. 9, 1392-1400.
Ganz, A., Lambert, M., Saez, A., Silberzan, P., Buguin, A., Mege, R. M. and
Ladoux, B. (2006). Traction forces exerted through N-cadherin contacts. Biol. Cell
98, 721-730.Geiger, B. and Yamada, K. M. (2011). Molecular architecture and function of matrix
adhesions. Cold Spring Harb. Perspect. Biol. 3, a005033.Gomez, G. A., McLachlan, R. W. and Yap, A. S. (2011). Productive tension: force-
sensing and homeostasis of cell-cell junctions. Trends Cell Biol. 21, 499-505.Grotegut, S., von Schweinitz, D., Christofori, G. and Lehembre, F. (2006).
Hepatocyte growth factor induces cell scattering through MAPK/Egr-1-mediatedupregulation of Snail. EMBO J. 25, 3534-3545.
Hegerfeldt, Y., Tusch, M., Brocker, E. B. and Friedl, P. (2002). Collective cellmovement in primary melanoma explants: plasticity of cell-cell interaction, beta1-integrin function, and migration strategies. Cancer Res. 62, 2125-2130.
Hinz, B., Mastrangelo, D., Iselin, C. E., Chaponnier, C. and Gabbiani, G. (2001).Mechanical tension controls granulation tissue contractile activity and myofibroblastdifferentiation. Am. J. Pathol. 159, 1009-1020.
Ilina, O., Bakker, G. J., Vasaturo, A., Hofmann, R. M. and Friedl, P. (2011). Two-photon laser-generated microtracks in 3D collagen lattices: principles of MMP-dependent and -independent collective cancer cell invasion. Phys. Biol. 8, 015010.
Jacinto, A., Martinez-Arias, A. and Martin, P. (2001). Mechanisms of epithelialfusion and repair. Nat. Cell Biol. 3, E117-E123.
Kubow, K. E. and Horwitz, A. R. (2011). Reducing background fluorescence revealsadhesions in 3D matrices. Nat. Cell Biol. 13, 3-5.
Leckband, D. E., le Duc, Q., Wang, N. and de Rooij, J. (2011). Mechanotransductionat cadherin-mediated adhesions. Curr. Opin. Cell Biol. 23, 523-530.
Leroy, P. and Mostov, K. E. (2007). Slug is required for cell survival during partialepithelial-mesenchymal transition of HGF-induced tubulogenesis. Mol. Biol. Cell 18,1943-1952.
Li, H., Price, D. K. and Figg, W. D. (2007). ADH1, an N-cadherin inhibitor, evaluatedin preclinical models of angiogenesis and androgen-independent prostate cancer.Anticancer Drugs 18, 563-568.
Martin, A. C., Kaschube, M. and Wieschaus, E. F. (2009). Pulsed contractions of anactin-myosin network drive apical constriction. Nature 457, 495-499.
Nagafuchi, A., Ishihara, S. and Tsukita, S. (1994). The roles of catenins in thecadherin-mediated cell adhesion: functional analysis of E-cadherin-alpha cateninfusion molecules. J. Cell Biol. 127, 235-245.
Nieman, M. T., Prudoff, R. S., Johnson, K. R. and Wheelock, M. J. (1999). N-cadherin promotes motility in human breast cancer cells regardless of their E-cadherinexpression. J. Cell Biol. 147, 631-644.
Pacquelet, A. and Rørth, P. (2005). Regulatory mechanisms required for DE-cadherinfunction in cell migration and other types of adhesion. J. Cell Biol. 170, 803-812.
Qi, J., Chen, N., Wang, J. and Siu, C. H. (2005). Transendothelial migration ofmelanoma cells involves N-cadherin-mediated adhesion and activation of the beta-catenin signaling pathway. Mol. Biol. Cell 16, 4386-4397.
Rauzi, M., Lenne, P. F. and Lecuit, T. (2010). Planar polarized actomyosin contractileflows control epithelial junction remodelling. Nature 468, 1110-1114.
Sabatini, P. J., Zhang, M., Silverman-Gavrila, R., Bendeck, M. P. and Langille,B. L. (2008). Homotypic and endothelial cell adhesions via N-cadherin determinepolarity and regulate migration of vascular smooth muscle cells. Circ. Res. 103, 405-412.
Sanchez-Heras, E., Howell, F. V., Williams, G. and Doherty, P. (2006). The fibroblastgrowth factor receptor acid box is essential for interactions with N-cadherin and all ofthe major isoforms of neural cell adhesion molecule. J. Biol. Chem. 281, 35208-35216.
Sawyer, J. K., Harris, N. J., Slep, K. C., Gaul, U. and Peifer, M. (2009). TheDrosophila afadin homologue Canoe regulates linkage of the actin cytoskeleton toadherens junctions during apical constriction. J. Cell Biol. 186, 57-73.
Shih, W. and Yamada, S. (2010). Myosin IIA dependent retrograde flow drives 3D cellmigration. Biophys. J. 98, L29-L31.
Shikanai, M., Nakajima, K. and Kawauchi, T. (2011). N-cadherin regulates radialglial fiber-dependent migration of cortical locomoting neurons. Commun. Integr. Biol.
4, 326-330.
Steinberg, M. S. and Takeichi, M. (1994). Experimental specification of cell sorting,tissue spreading, and specific spatial patterning by quantitative differences in cadherinexpression. Proc. Natl. Acad. Sci. USA 91, 206-209.
Tanaka, H., Kono, E., Tran, C. P., Miyazaki, H., Yamashiro, J., Shimomura, T.,
Fazli, L., Wada, R., Huang, J., Vessella, R. L. et al. (2010). Monoclonal antibodytargeting of N-cadherin inhibits prostate cancer growth, metastasis and castrationresistance. Nat. Med. 16, 1414-1420.
Theveneau, E., Marchant, L., Kuriyama, S., Gull, M., Moepps, B., Parsons, M. andMayor, R. (2010). Collective chemotaxis requires contact-dependent cell polarity.Dev. Cell 19, 39-53.
Thiery, J. P. (2002). Epithelial-mesenchymal transitions in tumour progression. Nat.
Rev. Cancer 2, 442-454.
Thiery, J. P., Acloque, H., Huang, R. Y. and Nieto, M. A. (2009). Epithelial-mesenchymal transitions in development and disease. Cell 139, 871-890.
Vasioukhin, V., Bauer, C., Yin, M. and Fuchs, E. (2000). Directed actinpolymerization is the driving force for epithelial cell-cell adhesion. Cell 100, 209-219.
Vestweber, D. and Kemler, R. (1985). Identification of a putative cell adhesion domainof uvomorulin. EMBO J. 4, 3393-3398.
Weis, W. I. and Nelson, W. J. (2006). Re-solving the cadherin-catenin-actinconundrum. J. Biol. Chem. 281, 35593-35597.
Wheelock, M. J., Shintani, Y., Maeda, M., Fukumoto, Y. and Johnson, K. R. (2008).Cadherin switching. J. Cell Sci. 121, 727-735.
Wolf, K., Wu, Y. I., Liu, Y., Geiger, J., Tam, E., Overall, C., Stack, M. S. and Friedl,
P. (2007). Multi-step pericellular proteolysis controls the transition from individual tocollective cancer cell invasion. Nat. Cell Biol. 9, 893-904.
Wong, A. J., Pollard, T. D. and Herman, I. M. (1983). Actin filament stress fibers invascular endothelial cells in vivo. Science 219, 867-869.
Yamada, S. and Nelson, W. J. (2007). Localized zones of Rho and Rac activities driveinitiation and expansion of epithelial cell-cell adhesion. J. Cell Biol. 178, 517-527.
Yamada, S., Pokutta, S., Drees, F., Weis, W. I. and Nelson, W. J. (2005).Deconstructing the cadherin-catenin-actin complex. Cell 123, 889-901.
Yonemura, S., Itoh, M., Nagafuchi, A. and Tsukita, S. (1995). Cell-to-cell adherensjunction formation and actin filament organization: similarities and differencesbetween non-polarized fibroblasts and polarized epithelial cells. J. Cell Sci. 108, 127-142.
Journal of Cell Science 125 (15)3670


