
1
Music perception in dementia
Hannah L Goldena*, Camilla N Clarka*, Jennifer M Nicholasa,b, Miriam H Cohena,
Catherine F Slatterya, Ross W Patersona, Alexander J M Foulkesa, Jonathan M Schotta,
Catherine J Mummerya, Sebastian J Crutcha, Jason D Warrena
a Dementia Research Centre, UCL Institute of Neurology, University College London
b London School of Hygiene and Tropical Medicine, University of London
London, United Kingdom
* both authors contributed equally to this work
Correspondence: Prof. Jason Warren
Dementia Research Centre
UCL Institute of Neurology
University College London
London WC1N 3BG
Email: [email protected]
Tel: +44 [0]203 448 4773
Fax: +44 [0]203 448 3104
Running title: Music perception in dementia
Word count: Abstract 248, Main text 7090
2
Abstract
Despite much recent interest in music and dementia, music perception has not been widely
studied across dementia syndromes using an information processing approach. Here we
addressed this issue in a cohort of 30 patients representing major dementia syndromes of
typical Alzheimer’s disease (AD, n=16), logopenic aphasia (LPA, an Alzheimer variant
syndrome; n=5) and progressive nonfluent aphasia (PNFA; n=9) in relation to 19 healthy age-
matched individuals. We designed a novel neuropsychological battery to assess perception of
musical patterns in the dimensions of pitch and temporal information (requiring detection of
notes that deviated from the established pattern based on local or global sequence features)
and musical scene analysis (requiring detection of a familiar tune within polyphonic
harmony). Performance on these tests was referenced to generic auditory (timbral) deviance
detection and recognition of familiar tunes and adjusted for general auditory working
memory performance. Relative to healthy controls, patients with AD and LPA had group-
level deficits of global pitch (melody contour) processing while patients with PNFA as a
group had deficits of local (interval) as well as global pitch processing. There was substantial
individual variation within syndromic groups. No specific deficits of musical temporal
processing, timbre processing, musical scene analysis or tune recognition were identified.
The findings suggest that particular aspects of music perception such as pitch pattern analysis
may open a window on the processing of information streams in major dementia syndromes.
The potential selectivity of musical deficits for particular dementia syndromes and particular
dimensions of processing warrants further systematic investigation.
Key words: Alzheimer’s disease; dementia; progressive nonfluent aphasia; logopenic
aphasia; music; auditory scene analysis

3
1 Introduction
Despite much recent interest [1–3], the impact on music processing of Alzheimer’s disease
(AD) and other dementias has not been fully defined. Music is first and foremost a complex
acoustic phenomenon and the perception of music requires the parsing of a musical stimulus
of interest against the acoustic background (musical scene analysis: [4]), representation of the
musical source (instrumental or vocal timbre) and tracking of pitch (melody) and temporal
(rhythm, metre) information to create a coherent musical ‘object’ [5]. This formulation
suggests that music presents the brain with a complex problem of auditory information
processing, entailing the decoding of a number of perceptual and cognitive modules [6,7]. On
both computational and neuroanatomical grounds, these processes are likely to be vulnerable
to the effects of neurodegenerative diseases, most notably AD and primary progressive
aphasia syndromes that target peri-Sylvian cortex (progressive nonfluent aphasia (PNFA) and
logopenic aphasia (LPA): [8–11]). A substantial body of structural and functional
neuroimaging work in the healthy brain and in patients with focal brain lesions has delineated
distributed cortico-subcortical networks that analyze the dimensions of music [6,12,13]: these
networks closely overlap the networks targeted in canonical dementia syndromes [14,15].
However, to date most studies of music in dementia have focused on the interaction of music
and memory [16–18], preserved abilities in trained musicians developing dementia [16,19,20]
and potential benefits of music more widely in dementia [21–25].
Aside from its intrinsic interest, music is an attractive candidate paradigm for assessing the
processing of complex information streams or patterns in both the healthy and the diseased
brain. In the domain of musical pitch, patterns of pitch change can be analyzed at two levels:
pitch interval (the magnitude of change between consecutive notes) and pitch change
direction (the overall pattern of ‘ups’ and ‘downs’ comprising the contour of the melody:
[7,26]). By analogy with the visual domain, pitch interval and melody contour entail the

4
processing of ‘local’ and ‘global’ pitch pattern information, respectively; according to this
formulation, pitch intervals can be considered fine-grained musical features while combining
these intervals to create a melody contour can be considered an overall (global) ‘gestalt’ of
the musical piece. The distinction between these levels is evident in everyday music listening;
changing individual pitch intervals is often perceived as a jarring distortion to the musical
line, whereas simultaneously changing all pitch intervals but maintaining the relations
between them (as in transposition of a melody to another key) retains the same musical
gestalt (the tune is still recognisably the same). The concept of local versus global processing
levels is fundamental for understanding how percepts are organised and relevant to many
sensory domains. Music can be considered a non-visual test case for assessing the generality
of effects on sensory information streams and the relative impact on featural (local) versus
gestalt (global) perception of clinical disorders such as the dementias.
The local (pitch interval) and global (melody contour) levels of music perception can be
differentially affected by focal brain lesions distributed between the cerebral hemispheres
[26–30]. Functional neuroimaging studies in the healthy brain have demonstrated separable
mechanisms in posterior superior temporal lobe and parietal and prefrontal projection
pathways for the processing of pitch interval and melody contour [30,31]. Available evidence
suggests that the decoding of musical patterns may be affected by common dementias and
may help to stratify dementia syndromes and pathologies without relying on more specialised
(and potentially confounding) verbal mechanisms. Elementary pitch discrimination may be
retained in AD and impaired in PNFA, consistent with relatively greater involvement of early
auditory areas in neurodegenerative processes that target peri-Sylvian cortex [18,32–36].
However, the effects of these diseases on more complex pitch pattern processing have not
been resolved. Studies in the visual domain suggest that patients with AD may have
disproportionate difficulty in the analysis of global structure with relatively intact analysis of
5
local features: this profile is likely to reflect dysfunction of integrative mechanisms in parietal
cortex that are particularly targeted by AD pathology but may be more difficult to interpret in
the context of associated executive, verbal or spatial deficits [37-43]. In the musical domain,
it follows that AD should produce more severe impairment for processing global (melody
contour) than local (pitch interval) patterns; whereas in PNFA, a more pervasive impairment
of local and global pitch pattern processing would be anticipated. However, currently
available neuropsychological instruments for assessing pitch pattern processing often rely on
comparisons between paired musical sequences [44]. Such comparisons are vulnerable to
concurrent auditory working memory deficits that accompany AD and the progressive
aphasias [17,18,45–47]; moreover, the explicit serial comparison of sequential melodies is
seldom required in everyday music listening. Whereas specific musical working memory
systems are likely to be integrally linked to the perception of pitch and temporal patterns in
music, these are separable from verbal and other working memory systems that might be
generically involved in any auditory task [48-50].
Temporal patterns in music can similarly be represented at interval (rhythmic, local) and
longer duration stress or accent (metrical, global) levels of analysis [51]. Deficits in these
dimensions of musical temporal perception occur with focal lesions involving temporal and
parietal cortices [52–55] but frequently dissociate from pitch impairment [26,56] and further
dissociate from each other [52,54,57]. In the healthy brain perceptual analysis of rhythm and
metre engages cortico-subcortical circuitry jointly involved in preparing motor output [58–
61]. While evidence in AD is not conclusive [19,36,62,63], impairments of temporal pattern
processing have been described in PNFA associated with involvement of peri-Sylvian cortex
[64]: this may be attributable both to loss of dynamic precision mediated by the dominant
hemisphere and the high temporal resolution required for accurate processing of speech
signals [65,66].

6
Under most circumstances, the listener must simultaneously decode more than one stream of
musical information (whether produced by an ensemble of instruments or a single instrument
played polyphonically). Such an analysis is fundamental to the initial parsing of a musical
‘scene’, before more detailed analysis can occur [7]; it is likely to entail an interaction of
bottom-up mechanisms for coding perceptual structure with top-down mechanisms for
resolving perceptual ambiguities based on stored templates or schemas derived from past
experience of music [5,67]. Musical scene analysis has not been widely studied
neuropsychologically in clinical populations but is likely to engage posterior superior
temporal and parietal lobe regions and their dorsal projections [68–72]. AD has been shown
to produce a generic impairment of auditory scene analysis under diverse listening tasks and
conditions, including the streaming of sound sequences that bear some similarities to musical
melodies; this has been linked to dysfunction of posterior temporo-parietal areas overlapping
those involved in music perception [33,35,36,73–75]. On both neuroanatomical and
neuropsychological grounds, patients with AD might therefore be anticipated to have
difficulties with musical scene analysis; however, this has not been addressed directly in
previous work.
In this study we assessed the perceptual components of music processing systematically in a
cohort of patients representing major dementia syndromes. Based on the above synthesis of
the available literature in both the auditory and visual domains, we anticipated that global
versus local levels of musical pitch and temporal information processing and the effect of
presenting a melody against a musical background (i.e., processing of musical ‘scenes’)
would be the most informative components of music perception to target in the principal
neurodegenerative dementias. The framework we addressed in designing the experimental
music perception battery is outlined in Figure 1, adapting the modular model of music
cognition proposed by Peretz and Coltheart [7]. We studied patients with typical AD in
7
relation to patients with a syndromic diagnosis of primary PNFA and patients with the LPA
clinical variant presentation of Alzheimer pathology. Inclusion of these syndromic groups
allowed us to assess the effects of disease topography in dominant peri-Sylvian cortex in
relation to the predicted underlying molecular pathology (PNFA in relation to LPA). We
designed novel neuropsychological tests requiring continuous tracking of musical patterns
and detection of deviants from the established pattern in the domains of pitch (interval,
melody) and time (rhythm, metre). Our rationale was that detection of a deviant or ‘wrong’
note played during a performance more closely approximates natural music listening than
does sequential comparison of melodies or related neuropsychological procedures and also
reduces working memory and associated, extraneous executive demands. In addition, we
created a test to assess detection of melody patterns within a musical ‘scene’. These
dimensions of perceptual pattern processing were assessed in relation to detection of timbral
deviants (a measure of sustained auditory attention and executive processing of sound
sequences) and recognition of familiar tunes (a widely used index of musical semantic
processing). To allow musical perceptual effects to be interpreted without potentially
confounding effects from auditory working memory impairment, we controlled for this factor
in analysing the musical performance profiles of our patient groups: our concern here was to
adjust for generic, task-related auditory working memory capacity rather than any more
specifically musical working memory subsystem.
In line with previous evidence including studies of the healthy brain and focal brain damage,
we hypothesised that musical deficits would be produced by all three target dementia
syndromes, with distinctive profiles of impairment in each syndrome. More specifically, we
hypothesised that typical AD would be associated with relatively greater impairment of
global than local levels of musical pattern analysis and impaired musical scene analysis, with
a similar profile of deficits in LPA; while PNFA would be associated with deficient analysis

8
of both local and global pitch patterns but with more severely impaired analysis of temporal
patterns in music.
2 Methods
2.1 Participants
The key inclusion criterion for the study was a clinical diagnosis of one of the target dementia
syndromes based on current standard, consensus diagnostic criteria [76,77]. Sixteen patients
(six female) fulfilling diagnostic criteria for typical AD (henceforth simply ‘AD’) led by
episodic memory decline [76], five patients (two female) with a diagnosis of LPA and eight
patients (six female) fulfilling criteria for PNFA [77] were recruited. Nineteen healthy
individuals (ten female) matched to the patient cohort for age and musical background, with
no history of significant neurological or psychiatric disorders were recruited via our Centre’s
research participant database. To provide an index of musical background, patients’
caregivers and healthy control participants completed a questionnaire detailing current
musical exposure (estimated hours/week) and years of previous formal musical training.
Inability to comply with neuropsychological testing, a clinical history of significant hearing
loss or congenital amusia would constitute exclusion criteria for a study of this kind; in the
event no individuals were excluded on these grounds.
All participants had audiometric screening of peripheral hearing function and an elementary
pitch discrimination screening test (details in Supplementary Material on-line) designed to
establish that they could comply with experimental tests involving the processing of pitch
sequences. One potential participant with AD and one with PNFA were excluded as they
failed to reach the criterion (>80% correct) required to pass screening.
Demographic, clinical and general neuropsychological characteristics of the study cohort are
summarised in Table 1. Syndromic diagnoses in the patient groups were corroborated with a

9
comprehensive general neuropsychological assessment (Table 1). Brain MR images
(available for 28 patients) revealed a profile of atrophy consistent with the syndromic
diagnosis in each case; no brain images showed a significant cerebrovascular burden. Twelve
of 12 patients in the AD group and three of four patients in the LPA group for which CSF
was available had a protein marker profile suggesting underlying Alzheimer pathology (total
CSF tau: beta-amyloid1-42 ratio >1, based on local laboratory reference ranges) and the
remaining patient with LPA had a positive Florbetapir PET brain amyloid scan; in contrast,
five of six patients with PNFA had a CSF profile that did not suggest underlying AD while
the remaining patient had a negative brain amyloid scan. At the time of testing, 13 patients in
the AD group were receiving symptomatic treatment with donepezil and two with
memantine; in the LPA group, four patients were receiving donepezil and two memantine;
while in the PNFA group one patient was receiving donepezil.
The study was approved by the local institutional ethics committee and all participants gave
informed consent in accordance with the guidelines of the Declaration of Helsinki.
2.2 Experimental music perception battery
2.2.1 General structure
The overall structure of the music perception battery is schematised in Figure 2; examples of
the stimuli are provided in Supplementary Material on-line.
Procedures were adapted from previously described tests of musical deviance detection
[78,79]. Detection of deviant notes has been employed in previous music psychology
paradigms that sought to capture on-line analysis of musical information in pitch and
temporal domains under conditions that resemble natural musical listening; such paradigms
establish a continuous musical context, allow precise programming of incongruent events that
violate musical expectancies, capture moment-to-moment tracking of musical structure [78]

10
and allow estimation of processing latencies [79] while at the same time avoiding any explicit
requirement to make delayed, serial comparisons with episodes held in musical memory
(potentially, a particular advantage in patients with dementia). For the present pitch and
temporal processing tests, participants were required to listen to a sequence of musical notes
that conformed to a basic pattern with randomly presented notes that deviated from the
pattern according to the musical parameter of interest; for each subtest, the task on each trial
was to press a button as soon as a deviant note occurred. As a control for the attentional and
response requirements of these tests, we designed a task that required detection of timbral
deviants in note sequences. For the musical scene analysis (‘tune streaming’) test, highly
familiar or novel melodies were presented against a harmonic background with similar
perceptual characteristics; the task on each trial was to decide whether or not a familiar tune
was present. As a baseline test of tune recognition, familiar or novel melodies were presented
alone and the task on each trial was to decide whether or not the tune was familiar; this task
acted as a control for the tune recognition component of the musical scene analysis test. The
order of the experimental tests (fixed for all participants) and approximate times to administer
the tests were as follows: timbre deviant task (approximately two minutes); pitch deviant
tasks (approximately six minutes); temporal deviant tasks (approximately five minutes); tune
streaming (approximately five minutes); tune recognition (five to ten minutes).
Note sequences were synthesised in MATLAB® (pitch, temporal, timbral deviant detection
tests) or MuseScore (tune recognition tests). Stimulus parameters were in line with values
used in previous work [78,79]. Stimuli were presented from a notebook computer running
MATLAB® via headphones (Audio-Technica®) at a comfortable listening level (at least 70
dB) in a quiet room. Participants were first familiarised with each test using visual aids (see
examples in Figure S1 in Supplementary Material online) and practice examples to ensure
they understood the task instructions and were able to comply reliably. For all tests based on

11
deviance detection, participants were instructed to press the keyboard spacebar as quickly as
possible whenever they heard a ‘wrong note’; presses within a pre-specified window (see
Supplementary Material for details) after deviant onset were counted as correct detections.
Participant responses were recorded for offline analysis. During the tests no feedback was
given about performance and no time limits were imposed.
Further details of stimulus parameters in each condition are in Supplementary Material on-
line.
2.2.2 Assessment of pitch pattern processing
Stimulus note sequences comprised alternating tonic and dominant pitches (intervals of five
or four tones) in one of three keys, spanning two octaves (range F2 to C5) and arranged to
form a single simple template melody contour (five ascending – five descending – five
ascending – five descending…; see Figure 2). Individual notes lasted either 500 or 400 ms
with inter-note interval of 100 or 80 ms, yielding a base tempo for the sequence of either 100
or 125 beats/minute; total sequence duration for a given trial ranged from 33.1 to 41.4
seconds. Each trial contained five deviant notes, each of which diverged from the template
pitch pattern in one of three ways: local (interval step altered, global melody contour
preserved), global (melody contour direction altered) or global direction-only (melody
contour direction altered, using only notes previously heard in the pattern so that only the
order of notes was altered). The global direction-only condition was intended to access a
‘pure’ process of melody contour analysis that could not be performed (for example) by
detecting the occurrence of novel out-of-pattern notes. The magnitude of a deviant ranged
from two to eleven semitones; all deviant notes adhered to the diatonic scale of that trial.
Deviant notes occurred with random onsets over the course of the trial such that the complete
(unviolated) pattern occurred at least once before any deviants occurred and the interval
between deviants was at least 1.5 seconds. Four trials for each deviant type were presented as
12
blocks, yielding 20 deviants for each condition (local, global, direction-only). Responses
within 1.5 seconds from deviant onset were counted as correct detections.
If a participant correctly detected fewer than 50% of deviants for any of the condition blocks,
they completed half of all subsequent blocks and continued to an easier version of the pitch
test (see Error! Reference source not found.). In this ‘easy’ version of the test, the pitch
pattern comprised only two notes; local deviants changed the interval and global deviants the
melody contour. Two trials (10 deviants) were presented for each condition. Data on this test
were also collected for six healthy control individuals, to provide a performance reference.
2.2.3 Assessment of temporal pattern processing
Stimulus sequences for the temporal test comprised repeated rhythmic patterns, adapted after
the stimuli described by Geiser et al. [78] (see Figure 2); a given sequence (trial) established
a template rhythm with metre (time signature) fixed at either three or four beats per cycle (3/4
or 4/4 time), emphasising the first note of the cycle (bar) with increased sound intensity.
Individual notes had fixed pitch (either D4, Eflat4 or E4) with note duration 200 ms, and a
base tempo for the sequence of either 100 or 120 beats/minute; total sequence duration for a
given trial ranged from 22.5 to 38.4 seconds. Each trial contained four deviants, each of
which diverged from the temporal template pattern in one of two ways: local (rhythm altered
by varying inter-note interval by 100 to 600 ms) or global (metre altered by varying the
position of a louder note, perceived as an ‘early’ or ‘late’ beat). Deviant notes occurred with
random onsets over the course of the trial such that the complete (unviolated) pattern
occurred at least three times before any deviants occurred and the interval between deviants
was at least 2 seconds. Five trials for each deviant type were presented as blocks, yielding 20
deviants for each condition (rhythm, metre); the same set of temporal templates was used in
each condition. Responses within 2 seconds from deviant onset (allowing time to make
decisions on the inter-note interval) were counted as correct detections.
13
2.2.4 Assessment of acoustic deviance detection
In order to assess participants’ performance on acoustic deviance detection beyond the pitch
and temporal domains, we designed a test that required detection of timbre deviants presented
as elements of a note sequence based on an ascending or descending major scale. Deviants
were created by altering the envelope of frequency intensities composing the spectrogram of
the tone (its ‘spectral shape’) to produce one of two different timbre variants. Individual notes
had duration 600 ms, with base tempo 100 beats/minute and sequence duration 32.4 seconds
for each trial. Five timbre deviants were presented randomly during each trial; four trials
were presented, yielding 20 timbre deviants in total. Responses within 1.5 seconds from
deviant onset were counted as correct detections.
2.2.5 Tune recognition tests
In order to assess the parsing of melodies within complex musical scenes, we designed a test
requiring detection (streaming) of tunes against a harmonic background (see Figure 2).
Stimuli were created in three part harmony in a major key with a synthetic piano carrier. The
top line of the harmony carried the tune for all trials; 10 trials contained very familiar tunes
(based on pilot data in older British individuals; the tunes were Auld Lang Syne, Frere
Jacques, God Save the Queen, Jingle Bells, London Bridge is Falling Down, Mary had a
Little Lamb, Silent Night, Three Blind Mice, Twinkle Twinkle, Little Star, When the Saints Go
Marching In) while for the remaining 10 trials, the original tunes were pseudo-reversed (such
that the phrase ended on a long tonic or dominant note). Trial duration ranged between 7
seconds and 13 seconds. On each trial, the task was to respond ‘yes’ if a famous tune was
present and ‘no’ if not.
To provide a baseline measure of tune recognition, the same 20 famous and pseudo-reversed
tunes previously presented in the tune streaming test were presented in isolation, in

14
randomised order. On each trial, the task was to respond ‘yes’ if the tune was famous and
‘no’ if not.
2.3 Analysis of behavioural data
2.3.1 General characteristics
All behavioural data were analyzed using Stata12®. Most demographic and
neuropsychological data violated normality assumptions and groups were therefore compared
using a Kruskal-Wallis equality-of-populations rank test followed by pairwise comparisons
with Wilcoxon rank sum tests with Bonferroni adjusted p-values to account for the six
pairwise comparisons; gender distributions were compared using Fisher’s exact test. Tone
detection thresholds on audiometry screening were analyzed using multiple linear regression
model adjusted for age, using bias corrected, accelerated confidence intervals calculated from
2000 bootstrap replications. Pairwise comparisons used Bonferroni-adjusted confidence
intervals (99.17%) to account for the six pairwise comparisons between experimental groups.
2.3.2 Deviance detection tests
As participants were free to respond at any time, an individual participant’s proportion of
correct presses was first adjusted for ‘guesses’ (or indiscriminate responses), as estimated
using a Poisson distribution of that participant’s rate of incorrect presses outside the ‘correct’
time window. This can be represented by the following equation:
S = P – (1 – e-λ)
where S = score; P = proportion correct presses and λ = rate of incorrect presses x correct
time window. This transformation resulted in a ‘corrected detection score’ for each
participant for each condition; these corrected scores were entered into further analysis. As
pitch and temporal deviance detection data did not conform to normality assumptions, data
were analyzed using a multiple linear regression model comparing groups using bias
corrected, accelerated confidence intervals calculated from 2000 bootstrap replications.

15
Initially we tested for a differential effect of condition for each patient group compared to
control by examining the interaction terms between condition and group based on 95%
confidence intervals. If these suggested a significant interaction, we then assessed pairwise
comparisons between patient groups within condition using Bonferroni-adjusted confidence
intervals to account for the six comparisons between experimental groups. An effect was
considered significant if the confidence interval did not cross zero, after controlling for
general auditory working memory performance as indexed by reverse digit span (a standard
measure of verbal auditory working memory) in the regression model.
2.3.3 Processing of familiar tunes
Tune recognition performance was analyzed using multiple linear regression model
comparing groups using bias corrected, accelerated confidence intervals calculated from 2000
bootstrap replications and subsequent Bonferroni-corrected pairwise comparisons. A different
approach was required for analysis of the tune streaming task: if a participant was unable to
correctly identify a famous tune as famous when presented in isolation, this item was
excluded from analysis of their responses on the tune streaming test. This resulted in varying
numbers of famous and pseudo-reversed (non-famous) items for each participant on this test.
A logistic regression model incorporating all participants' binary responses, controlling for
reverse digit span performance, was used to model scores on the tune streaming task. To take
account of any bias introduced by this imbalance of trial numbers, a framework based on
signal detection theory was used to fit a logistic regression model for odds of labelling a tune
as famous [80]. The dependent variable was a binary category indicating for each test item
whether or not each participant in a group had responded ‘famous’. Accordingly, this model
assessed famous tune detection accuracy as odds ratios comparing labelling of famous and
non-famous tunes across all participants in each group. Here, an odds ratio of 1 corresponds
to chance level performance, i.e., the group had equal likelihood of labelling a famous or

16
non-famous tune as famous; an odds ratio >1 corresponds to increased accuracy
discriminating famous from non-famous tunes; and an odds ratio <1 corresponds to over-
rejection of famous tunes as non-famous or over-labelling of non-famous tunes as famous.
Overall effects of experimental group were therefore assessed through the interaction of
group and labelling tunes correctly. The Wald criterion was used to test for any interaction
effect or specific group differences, with Bonferroni adjusted P-values to account for the six
pairwise comparisons between experimental groups.
2.3.4 Correlates of musical perceptual performance
Where deficits on music processing tasks relative to healthy controls were identified,
Spearman’s correlation coefficient was used to assess associations of performance on the
relevant musical tasks with background musical training, general disease measures (Mini-
Mental State Examination score, symptom duration) and speech encoding measures (word
and sentence repetition) in the patient cohort. A threshold p<0.05 was accepted as the
criterion for statistical significance for all associations.
3 Results
3.1 General characteristics of participant groups
The analysis of demographic, clinical and background neuropsychological data is
summarised in Error! Reference source not found.. Due to time constraints, reduced
numbers of participants completed particular assessments (these are detailed in Tables 1 and
2). Patient and healthy control groups were well matched for age (χ2(3) = 6.32, P = 0.10),
gender (χ2(3) = 2.23, P = 0.56), education (χ2
(3) = 6.41, P = 0.09), musical training (χ2(3) =3.74,
P = 0.29) and current music listening (χ2(3) = 2.81, P = 0.42). Patient groups were well
matched for Mini-Mental State Examination score (χ2(2) = 1.58, P = 0.45) and symptom

17
duration (χ2(2) = 0.26, P = 0.88). Patient groups showed anticipated profiles of general
neuropsychological impairment.
On the screen of peripheral hearing function, relative to healthy controls, the AD and LPA
groups showed no significant performance difference but deficits compared to both the
healthy control and the AD group were shown by the PNFA group; there was no difference
between the LPA and PNFA groups (details summarised in Table S1 in Supplementary
Material on-line). A combined audiometry score using the sum of detection thresholds for all
frequencies was derived as an overall measure of peripheral hearing function to test for
associations with performance on the experimental tasks: no significant associations were
found and audiometry scores were therefore not included in further analyses. For the pitch
discrimination screening task (Table 1), total scores did not differ significantly between
experimental groups (χ2(3) = 2.66, p = 0.45).
3.2 Performance on experimental tests of music processing
Performance profiles for each group on all conditions and mean difference between groups
for pairwise comparisons for the experimental music battery are presented in Table 2 with
further details in Tables S2 and S3 on-line; individual data are shown in Figure 3.
Inspection of the individual performance data prior to adjustment for general auditory
working memory performance (Figure 3) suggests that patients in each syndromic group (and
most prominently, the progressive aphasia groups) performed substantially worse than the
healthy control group across the experimental tests of music processing. However, this was in
the context of wide individual variation within each group. An analysis of group performance
profiles without adjustment for general auditory working memory effects is summarised in
Table S4 in Supplementary Material on-line; the following is based on the main analysis
adjusted for this factor.

18
3.2.1 Pitch pattern processing
For the pitch pattern processing tasks, the PNFA group showed overall (across all three
conditions) poorer performance compared to the healthy control (beta = -0.47, 95% CI -0.81
to -0.16) and AD groups (-0.33, 95% CI -0.61 to -0.02); no other significant overall
performance differences between groups were found. Examining for effects of condition,
poorer performance was found across all groups in the global-direction-only compared to the
local condition (beta = -0.09, 95% CI -0.17 to -0.03). Compared to healthy controls, the AD
group performed significantly worse in the global and global-direction-only pitch conditions
but not the local condition; the LPA group performed significantly worse only in the global-
direction-only condition; and the PNFA group performed significantly worse in all pitch
conditions (Table 2). No significant performance differences between patient groups were
identified. No significant correlations of task performance with prior musical training,
general disease measures (Mini-Mental State Examination score, symptom duration) or
standard speech encoding measures (word and sentence repetition) were found within the
patient cohort.
Thirteen patients (five AD, two LPA, six PNFA) were also administered the ‘easy’ version of
the pitch pattern test having detected <50% of deviants in the more difficult test (we ran an
additional analysis of this subset of patients; data for all patients were included in the main
analysis of the more difficult test). Although raw detection scores (Table S2 in
Supplementary Material on-line) suggested impaired performance of the PNFA and LPA
groups in each pitch condition relative to the healthy control group, no significant differences
between groups were found after taking auditory working memory performance into account.
3.2.2 Temporal pattern processing
For the temporal pattern processing tasks, no significant effects of patient group on
performance were found after adjusting for auditory working memory capacity (vs controls:

19
AD beta = -0.02, 95% CI -0.12 to 0.09; LPA beta = -0.07, 95% CI -0.32 to 0.22; PNFA beta
= -0.18, 95% CI -0.40 to 0.03). Across all experimental groups, the global condition resulted
in poorer performance than the local condition (beta = -0.10, 95% CI -0.18 to -0.04).
However, there was no indication of a significant interaction between condition and group (vs
controls x condition: AD beta = -0.06, 95% CI -0.15 to 0.04; LPA beta = -0.10, 95% CI -0.29
to 0.08; PNFA beta = -0.05, 95% CI -0.14 to 0.08).
3.2.3 Timbral deviance detection
On the timbre processing (general acoustic deviance detection) task no significant effect of
group on performance was found after adjusting for auditory working memory capacity (vs
controls: AD beta = 0.05, 99% CI -0.04 to 0.26; LPA beta = -0.03, 99% CI -0.33 to 0.41;
PNFA beta = -0.05, 99% CI -0.23 to 0.07).
3.2.4 Tune recognition tasks
No significant interactions were found between group and correctly labelling a tune as
‘famous’ in the tune streaming (musical scene analysis) task (χ2(3) = 3.92, p = 0.27) ,
indicating no effect of patient group on performance on this task. No effect of patient group
was found for the baseline tune recognition task (vs controls: AD beta = 0.13, 99% CI -0.09
to 0.74; LPA beta = -0.95, 99% CI -4.04 to 2.60; PNFA beta = -0.34, 99% CI -2.83 to 0.74).
3.2.5 Correlations between dimensions of music processing
Significant pairwise correlations were found between all measures of pitch pattern and
temporal pattern processing (all p<0.05). Significant correlations were found for performance
on the tune streaming and global pitch pattern processing (direction-only) tasks; and for
performance on general acoustic (timbral) deviance detection and global pitch (direction-
only) and local temporal processing tasks (all p<0.05; see Table S3). Tune recognition
correlated with performance on timbral deviance detection; years of musical training

20
correlated with global temporal processing. Peripheral audiometry detection thresholds did
not correlate significantly with any of the experimental measures.
4 Discussion
Here we have shown that canonical dementia syndromes of typical AD, LPA and PNFA may
be associated with profiles of impaired music perception relative to healthy older individuals.
Deficits exhibited by the present syndromic groups affected the analysis of pitch pattern and
were not simply attributable to prior musical expertise, general cognitive, elementary
perceptual or task factors. After taking general auditory working memory performance into
account, detection of acoustic deviants (indexed by varying note timbre) was comparable to
healthy controls in all syndromic groups. Patients’ performance on pitch pattern analysis
tasks deteriorated with increasing perceptual difficulty (as indexed by the more versus less
difficult versions of the pitch pattern tests), consistent with a true deficit of pitch pattern
processing. Patients with typical AD had impaired processing of global pitch (melody
contour) information but (after accounting for general auditory working memory capacity)
intact processing of local pitch (interval) and temporal pattern, as well as intact tune
recognition whether in isolation or within a polyphonic ‘musical scene’. Patients with LPA (a
syndrome generally underpinned by AD pathology) showed a similar profile with
predominant impairment of global pitch processing, albeit the evidence of impairment was
most apparent in the more demanding processing of direction-only contour variation
(produced by deviance in the ordering of the same note sequence). In contrast, patients with
PNFA exhibited deficits affecting local (interval) as well as global (melody) information in
pitch patterns but (again, after controlling for general auditory working memory capacity)
performance that did not reach statistical significance when compared to control processing
of temporal pattern, tune recognition and musical scene analysis.

21
These findings are broadly consistent with a modular organisation of music cognition, as
previously proposed [7]. More specifically, the relatively greater impairment of global than
local pitch pattern analysis in typical AD and the similar profile in LPA corroborate our
experimental predictions. Impaired global processing of pitch information in music is in line
with other evidence for defective formation of coherent global stimulus representations in
AD: this deficit might reflect increased demand for coordinated integrative computations
between temporo-parietal association cortices vulnerable to Alzheimer pathology [81–85],
though any disadvantage with respect to the coding of local stimulus features is likely to be
relative rather than absolute [37–40,86]. While the processing of global stimulus
characteristics unfolding over longer time windows requires attentional resources [40,82,86],
it is unlikely that the profile of pitch deficits here was entirely underpinned by attentional
compromise: as our paradigm required a single response to consecutively presented stimuli, it
is unlikely to have taxed divided attention, while demands on sustained attention are likely to
have been similar in the timbral deviance detection task, on which the present AD group
performed normally. Moreover, pitch pattern deficits in our patient groups were documented
after taking auditory working memory capacity into account. On the other hand, the present
data suggest any claim that dementia syndromes differentially affect particular components of
music cognition must be qualified. Syndromic profiles were documented in the context of
wide individual variability (Figure 3). Moreover, across the patient cohort, correlated
performance was observed for processing local and global information and pitch and
temporal patterns. As the neural mechanisms mediating different components of music
perception are likely to be affected together by the spreading neurodegenerative process, the
finding of correlation (or absence of differential impairment) in this setting cannot be used to
draw inferences about the underlying cognitive architecture.
22
Our findings provide further evidence that LPA and PNFA have associated phenotypes of
nonverbal auditory impairment [32,64,87–89]. The musical phenotype was more severe in the
PNFA group here; the involvement of pitch pattern analysis in this syndrome is in line with
previous work [32] and suggests a putative mechanism linking generic mechanisms of
dynamic auditory encoding with speech production via the dorsal auditory cortical pathway,
extending over a range of timescales relevant to processing of individual and sequential
speech sounds [9,77,90–92], Marked involvement of musical perceptual mechanisms might
be anticipated from the severe and focal involvement of auditory association areas in the
progressive aphasias [9,11]. Although we did not demonstrate a correlation of musical
measures with standard measures of verbal encoding, pitch processing mechanisms are likely
to be more relevant to prosody (a crucial non-linguistic attribute of speech signals) than
phonemic sequencing, at least for non-tonal languages. Both perception and production of
prosody are abnormal in PNFA [89], raising the possibility of a common mechanism linking
musical pitch encoding with the programming of pitch variations in speech.
Allowing for the relatively small cohorts here, the present data offer relatively little support
for specific musical signatures of particular dementia pathologies: when syndromic groups
were directly compared, no measures indicated robust differences. Our findings suggest that
certain musical perceptual attributes such as melody (pitch contour) tax neural computational
resources across dementia syndromes; the data do not suggest any simple dichotomisation of
dementias according to whether they degrade or spare the perception of music. Though the
overall profile of pitch pattern deficits suggested some selectivity for particular syndromes
(predominantly affecting global pitch characteristics in AD and LPA and more widespread in
PNFA), any syndromic effects were relative rather than syndrome-specific. An important
theme emerging from this study is that auditory working memory deficits are likely to
amplify any purely musical deficits (compare Figure 3 prior to adjustment for this factor and

23
the unadjusted analysis summarised in Table S4 with the adjusted significance attributions in
Table 2): patients presenting with impairments of music processing may be comparably
impaired on processing of other extended auditory information streams. The extent to which
musical deficits reflect music-specific processes might then depend on the nature of the
interaction between auditory working memory and the relevant musical characteristic, as
suggested by previous work [48-50]. This factor may partly explain the lack of evidence here
for specific deficits of temporal pattern processing from music, which we anticipated
particularly in the PNFA group [64]. While in principle this could also reflect the small study
cohort or failure to sample relevant temporal windows (as temporal characteristics of music
are less constrained than pitch variations), temporal analysis of musical sequences may be
more intimately reliant on auditory working memory capacity than pitch analysis; moreover,
the linkage between temporal analysis and working memory mechanisms may have a
neuroanatomical substrate (including insular cortex) that is targeted in PNFA [93]. This is a
difficult issue to resolve, as particular subsystems of working memory are likely to be music-
specific [48-50]. On the other hand, it has been shown that musical listening tasks also
engage domain-general working memory circuits [94]. In this study, we set out to adjust for a
general index of (verbal) auditory working memory capacity that might affect performance
on auditory tracking tasks; however, the relative effects of music-specific and music-
independent buffer systems on the perception of musical structure will only be resolved by
assessing indices of musical pitch and temporal short-term memory directly alongside
standard working memory measures. Even if underpinned by separable neural substrates,
music-specific and music-independent working memory systems may be affected together in
neurodegenerative disease.
Perhaps more surprisingly, we found no evidence for a specific deficit of musical scene
analysis (as indexed by the processing of polyphonic melodies) in any patient group. This

24
contrasts with previous work characterising a generic impairment of auditory scene analysis
in AD [33,35,36,72–75] and may in part reflect the relatively wide variation in healthy
control performance on our tune streaming test (Figure 3). However, it is possible that the
analysis of musical scenes benefits to a greater degree than other kinds of auditory scenes
from the availability of stored templates, here familiar tunes. If (as the present data also
suggest) recognition of familiar tunes is relatively preserved in these dementia syndromes,
patients may be able to engage ‘top-down’ mechanisms for parsing the musical scene even
despite degraded mechanisms of early scene analysis [95,96].
The present findings have certain practical and clinical implications. Deficits of pitch pattern
analysis here were demonstrated using stimuli that required tracking of musical information
over time. Conventional neuropsychological (including music psychology) procedures that
assess discrete stimulus tokens presented in isolation may not fully capture information
processing deficits in dementia, particularly earlier in the disease course. Novel
neuropsychological instruments that require on-line tracking of information streams could be
relevant for assessing the encoding of verbal as well as musical sequences in these diseases.
Though conclusions must be qualified pending further detailed investigation, our findings
suggest that particular musical attributes (such as rhythm) might be used as a vehicle for
designing musical interventions in at least some patients with dementia. At present, formal
trials of music therapy in dementia often yield disappointing results despite anecdotal reports
of benefit [97]. Targeting of those musical components where the prospect of benefit is
greatest would provide a rational basis for music therapy in patients with dementia;
moreover, rhythm-based interventions might be more straightforward to deliver and
outcomes (for example, patient motor responses) may be easier to code than more complex
musical interventions [98].

25
Considered together, our findings suggest that music perception may be a useful paradigm for
assessing neural computational processes that support the analysis of information streams
over different time windows and levels of complexity and the impact of dementias on those
processes. Impaired encoding of pitch contour may have potential utility as a novel nonverbal
and nonvisual biomarker across dementia syndromes while the overall profile of pitch pattern
processing may have relative selectivity for particular pathologies such as AD. In addition,
potential linkages between musical pitch processing and the processing of speech prosody
warrant further investigation particularly in patients with progressive aphasia. This study has
several limitations that should direct further work. The numbers of patients recruited here to
particular syndromic groups were small and additionally, particular tests were not completed
by all patients (Table 2), further underlining the need to study larger patient cohorts to
corroborate these findings. Future study cohorts should ideally encompass a wider range of
neurodegenerative syndromes and diseases with longitudinal assessments to determine the
sensitivity and specificity of particular musical perceptual indices and patterns of evolution
over time, ultimately with histopathological and molecular correlation. Combining multi-
centre patient cohorts might improve power to detect effects and potentially, to stratify
neurodegenerative syndromes and pathologies. Even within the AD spectrum, factors such as
age and disease stage (severity) may importantly modify phenotype [39]; moreover the
present data underline the need to take into account individual variability, which may be
amplified by prior musical competence. Besides the analysis of local and global information
per se, dementia syndromes might degrade associated cognitive operations, such as
perceptual learning, executive shifting between processing levels or top-down attentional
modulation of perceptual mechanisms [39,43]: future musical paradigms should address these
possibilities. Structural and functional neuroanatomical studies comparing patient and healthy
older cohorts will be required to delineate the alterations in brain mechanisms of music

26
processing produced by these diseases and to more fully understand the musical phenotypes
demonstrated here. More broadly, our findings may provide a prima facie case for tackling
theoretical and practical issues of sensory information processing in the dementias that go
beyond the domains of language and vision.

27
Acknowledgements
We are grateful to all participants for their involvement. The Dementia Research Centre is
supported by Alzheimer's Research UK, the Brain Research Trust and the Wolfson
Foundation. This work was funded by the Wellcome Trust, the UK Medical Research
Council and the NIHR Queen Square Dementia Biomedical Research Unit. HLG was
supported by an Alzheimer Research UK PhD Fellowship. CNC is supported by The National
Brain Appeal – Frontotemporal Dementia Research Fund. SJC is supported by an Alzheimer
Research UK Senior Research Fellowship and an ESRC/NIHR (Grant no ES/K006711/1).
JDW was supported by a Wellcome Trust Senior Clinical Fellowship (Grant No
091673/Z/10/Z).

28
References
[1] Baird A, Samson S (2015) Music and dementia. Prog. Brain Res. 217, 207–235.
[2] Clark CN, Warren JD (2015) Music, memory and mechanisms in Alzhiemer’s disease.
Brain 138, 2114–25.
[3] Jacobsen J, Fritz T, Stelzer J, Turner R (2015) Why musical memory can be preserved
in advanced Alzheimer ’ s disease. Brain 138, 2438–2450.
[4] Bregman AS (1990) Auditory Scene Analysis: The Perceptual Organization of Sound,
MIT Press.
[5] Griffiths TD, Warren JD (2004) What is an auditory object? Nat. Rev. Neurosci. 5,
887–892.
[6] Clark CN, Golden HL, Warren JD (2015) Acquired amusia. In Handbook of clinical
neurology: The human auditory system Elsevier, pp. 607–631.
[7] Peretz I, Coltheart M (2003) Modularity of music processing. Nat. Neurosci. 6, 688–
691.
[8] Chételat G, Desgranges B, Landeau B, Mézenge F, Poline JB, de la Sayette V, Viader
F, Eustache F, Baron J-C (2008) Direct voxel-based comparison between grey matter
hypometabolism and atrophy in Alzheimer’s disease. Brain 131, 60–71.
[9] Grossman M (2012) The non-fluent/agrammatic variant of primary progressive
aphasia. Lancet Neurol. 11, 545–555.
[10] Herholz K (1995) FDG PET and differential diagnosis of dementia. Alzheimer Dis.
Assoc. Disord. 9, 6–16.
[11] Rohrer JD, Ridgway GR, Crutch SJ, Hailstone J, Goll JC, Clarkson MJ, Mead S, Beck
J, Mummery C, Ourselin S, Warrington EK, Rossor MN, Warren JD (2010)
Progressive logopenic/phonological aphasia: Erosion of the language network.
Neuroimage 49, 984–993.
[12] Clark CN, Downey LE, Warren JD (2015) Brain disorders and the biological role of
music. Soc. Cogn. Affect. Neurosci. 10, 444–52.
[13] Zatorre RJ, Salimpoor VN (2013) From perception to pleasure: Music and its neural
substrates. Proc. Natl. Acad. Sci. 110, 10430–10437.
[14] Warren JD, Fletcher PD, Golden HL (2012) The paradox of syndromic diversity in
Alzheimer disease. Nat. Rev. Neurol. 8, 451–64.
[15] Whitwell JL, Josephs K a. (2012) Neuroimaging in frontotemporal lobar
degeneration—predicting molecular pathology. Nat. Rev. Neurol. 8, 131–142.
[16] Cuddy LL, Duffin J (2005) Music, memory, and Alzheimer’s disease: is music
recognition spared in dementia, and how can it be assessed? Med. Hypotheses 64, 229–
35.
[17] Ménard M-C, Belleville S (2009) Musical and verbal memory in Alzheimer’s disease:

29
a study of long-term and short-term memory. Brain Cogn. 71, 38–45.
[18] White DA, Murphy CF (1998) Working Memory for Nonverbal Auditory Information
in Dementia of the Alzheimer Type. Arch. Clin. Neuropsychol. 13, 339–347.
[19] Beatty WW, Rogers CL, Rogers RL, English S, Testa JA, Orbelo DM, Wilson DA,
Ross ED (1999) Piano playing in Alzheimer’s disease: Longitudinal study of a single
case. Neurocase 5, 459–469.
[20] Omar R, Hailstone JC, Warren JE, Crutch SJ, Warren JD (2010) The cognitive
organization of music knowledge: a clinical analysis. Brain 133, 1200–13.
[21] El Haj M, Fasotti L, Allain P (2012) The involuntary nature of music-evoked
autobiographical memories in Alzheimer’s disease. Conscious. Cogn. 21, 238–46.
[22] Irish M, Cunningham CJ, Walsh JB, Coakley D, Lawlor BA, Robertson IH, Coen RF
(2006) Investigating the enhancing effect of music on autobiographical memory in
mild Alzheimer’s disease. Dement. Geriatr. Cogn. Disord. 22, 108–20.
[23] Moussard A, Bigand E, Belleville S, Peretz I (2014) Learning sung lyrics aids
retention in normal ageing and Alzheimer’s disease. Neuropsychol. Rehabil. 24, 894–
917.
[24] Simmons-Stern NR, Budson AE, Ally BA (2010) Music as a memory enhancer in
patients with Alzheimer’s disease. Neuropsychologia 48, 3164–7.
[25] Thompson RG, Moulin CJA, Hayre S, Jones RW (2006) Music enhances category
fluency in healthy older adults and Alzheimer’s disease patients. Exp. Aging Res. 31,
91–9.
[26] Peretz I (1990) Processing of local and global musical information by unilateral brain-
damaged patients. Brain 113, 1185–1205.
[27] Dowling WJ, Fujitani DS (1970) Contour, interval, and pitch reocgnition in memory
for melodies. J. Acoust. Soc. Am. 49, 524–531.
[28] Liégeois-Chauvel C, Peretz I, Babaï M, Laguitton V, Chauvel P (1998) Contribution of
different cortical areas in the temporal lobes to music processing. Brain 121, 1853–
1867.
[29] Peretz I, Morais J (1989) Music and modularity. Contemp. Music Rev. 4, 279–293.
[30] Stewart L, Overath T, Warren JD, Foxton JM, Griffiths TD (2008) fMRI evidence for
a cortical hierarchy of pitch pattern processing. PLoS One 3, e1470.
[31] Lee Y-S, Janata P, Frost C, Hanke M, Granger R (2011) Investigation of melodic
contour processing in the brain using multivariate pattern-based fMRI. Neuroimage 57,
293–300.
[32] Goll JC, Kim LG, Hailstone JC, Lehmann M, Buckley A, Crutch SJ, Warren JD
(2011) Auditory object cognition in dementia. Neuropsychologia 49, 2755–65.
[33] Goll JC, Kim LG, Ridgway GR, Hailstone JC, Lehmann M, Buckley AH, Crutch SJ,
Warren JD (2012) Impairments of auditory scene analysis in Alzheimer’s disease.

30
Brain 135, 190–200.
[34] Johnson JK, Chang C-C, Brambati SM, Migliaccio R, Gorno-Tempini ML, Miller BL,
Janata P (2011) Music recognition in frontotemporal lobar degeneration and Alzheimer
disease. Cogn. Behav. Neurol. 24, 74–84.
[35] Kurylo D, Corkin S, Allard T, Zatorre R, Growdon J (1993) Auditory function in
Alzheimer’s disease. Neurology 43, 1893–99.
[36] Strouse A, Hall JW, Burger MC (1995) Central Auditory Processing in Alzheimer ’s
Disease. Ear Hear. 16, 230–238.
[37] Delis DC, Massman PJ, Butters N, Salmon DP, Shear PK, Demadura T, Filoteo J V
(1992) Spatial cognition in Alzheimer’s disease: subtypes of global-local impairment.
J. Clin. Exp. Neuropsychol. 14, 463–77.
[38] Massman PJ, Delis DC, Filoteo JV, Butters N, et al (1993) Mechanisms of spatial
impairment in Alzheimer’s disease subgroups: Differential breakdown of directed
attention to global-local stimuli. Neuropsychology 7, 172–181.
[39] Matsumoto E, Ohigashi Y, Fujimori M, Mori E (2000) The processing of global and
local visual information in Alzheimer’s disease. Behav. Neurol. 12, 119–125.
[40] Slavin MJ, Mattingley JB, Bradshaw JL, Storey E (2002) Local–global processing in
Alzheimer’s disease: an examination of interference, inhibition and priming.
Neuropsychologia 40, 1173–1186.
[41] Thaiss L, De Bleser R (1992) Visual agnosia: a case of reduced attentional "spotlight"?
Cortex 28, 601-21.
[42] Stark ME, Grafman J, Fertig E. (1997) A restricted 'spotlight' of attention in visual
object recognition. Neuropsychologia 35, 1233-49.
[43] Belleville S, Bherer L, Lepage E, Chertkow H, Gauthier S (2008) Task switching
capacities in persons with Alzheimer's disease and mild cognitive impairment.
Neuropsychologia 46, 2225-33.
[44] Peretz I, Champod AS, Hyde K (2003) Varieties of Musical Disorders: The Montreal
Battery of Evaluation of Amusia. Ann. N. Y. Acad. Sci. 999, 58–75.
[45] Gorno-Tempini M-L, Dronkers NF, Rankin KP, Ogar JM, Phengrasamy L, Rosen HJ,
Johnsonm JK, Weiner MW, Miller BL (2004) Cognition and Anatomy in Three
Variants of Primary Progressive Aphasia. Ann. Neurol. 55, 335–346.
[46] Gorno-Tempini ML, Brambati SM, Ginex V, Ogar J, Dronkers NF, Marcone A, Perani
D, Garibotto V, Cappa SF, Miller BL (2008) The logopenic/phonological variant of
primary progressive aphasia. Neurology 71, 1227–1234.
[47] Stopford CL, Thompson JC, Neary D, Richardson AMT, Snowden JS (2012) Working
memory, attention, and executive function in Alzheimer’s disease and frontotemporal
dementia. Cortex 48, 429–46.
[48] Burunat I, Alluri V, Toiviainen P, Numminen J, Brattico E. (2014) Dynamics of brain
activity underlying working memory for music in a naturalistic condition. Cortex. 57,

31
254-69.
[49] Teki S, Griffiths TD. (2016) Brain Bases of Working Memory for Time Intervals in
Rhythmic Sequences. Front Neurosci. 10, 239. doi: 10.3389/fnins.2016.00239.
[50] Tillmann B, Lévêque Y, Fornoni L, Albouy P, Caclin A. (2016) Impaired short-term
memory for pitch in congenital amusia. Brain Res. 1640, 251-63.
[51] Schuppert M, Mu TF, Wieringa BM, Altenmu E (2000) Receptive amusia : evidence
for cross-hemispheric neural networks underlying music processing strategies. Brain
123, 546–559.
[52] Di Pietro M, Laganaro M, Leemann B, Schnider A (2004) Receptive amusia: temporal
auditory processing deficit in a professional musician following a left temporo-parietal
lesion. Neuropsychologia 42, 868–77.
[53] Robin DA, Tranel D, Damasio H (1990) Auditory perception of temporal and spectral
events in patients with focal left and right cerebral lesions. Brain Lang. 39, 539–555.
[54] Wilson SJ, Pressing JL, Wales RJ (2002) Modelling rhythmic function in a musician
post-stroke. Neuropsychologia 40, 1494–1505.
[55] Vignolo L (2003) Music agnosia and auditory agnosia. Ann. N. Y. Acad. Sci. 999, 50–
57.
[56] Peretz I, Kolinsky R (1993) Boundaries of separability between melody and rhythm in
music discrimination: a neuropsychological perspective. Q. J. Exp. Psychol. A. 46,
301–325.
[57] Fries W, Swihart AA (1990) Disturbance of Rhythm Sense Following Right
Hemisphere Damage. Neuropsychologia 28, 1317–1323.
[58] Chen JL, Penhune VB, Zatorre RJ (2008) Listening to musical rhythms recruits motor
regions of the brain. Cereb. cortex 18, 2844–54.
[59] Grahn JA, Rowe JB (2013) Finding and feeling the musical beat: striatal dissociations
between detection and prediction of regularity. Cereb. cortex 23, 913–21.
[60] Grahn JA (2009) The role of the basal ganglia in beat perception: Neuroimaging and
neuropsychological investigations. Ann. N. Y. Acad. Sci. 1169, 35–45.
[61] Konoike N, Kotozaki Y, Miyachi S, Miyauchi CM, Yomogida Y, Akimoto Y,
Kuraoka K, Sugiura M, Kawashima R, Nakamura K (2012) Rhythm information
represented in the fronto-parieto-cerebellar motor system. Neuroimage 63, 328–38.
[62] Cowles A, Beatty WW, Nixon SJ, Lutz LJ, Paulk J, Paulk K, Ross ED (2003) Musical
skill in dementia: a violinist presumed to have Alzheimer’s disease learns to play a
new song. Neurocase 9, 493–503.
[63] Hellström A, Almkvist O (1997) Tone duration discrimination in demented, memory-
impaired, and healthy elderly. Dement. Geriatr. Cogn. Disord. 8, 49–54.
[64] Grube M, Bruffaerts R, Schaeverbeke J, Neyens V, De Weer AS, Seghers A,
Bergmans B, Dries E, Griffiths TD, Vandenberghe R. (2016) Core auditory processing
32
deficits in primary progressive aphasia. Brain 139, 1817-29.
[65] Scott SK, McGettigan C (2013) The neural processing of masked speech. Hear. Res.
303, 58–66.
[66] Zatorre RJ, Belin P, Penhune VB (2002) Structure and function of auditory cortex:
music and speech. Trends Cogn. Sci. 6, 37–46.
[67] Griffiths TD, Warren JD (2002) The planum temporale as a computational hub. Trends
Neurosci. 25, 348–353.
[68] Bey C, Zatorre R (2003) Recognition of Interleaved Melodies: An fMRI study. Ann. N.
Y. Acad. Sci. 999, 152–4.
[69] Kamourieh S, Braga RM, Leech R, Newbould RD, Malhotra P, Wise RJS (2015)
Neural Systems Involved When Attending to a Speaker. Cereb. Cortex 25, 4284–4298.
[70] Mazzoni M, Moretti P, Pardossi L, Vista M, Muratorio a, Puglioli M (1993) A case of
music imperception. J. Neurol. Neurosurg. Psychiatry 56, 322–322.
[71] McDonald I (2006) Musical alexia with recovery: A personal account. Brain 129,
2554–2561.
[72] Gates G, Karzon R, Garcia P, Peterein J, Storandt M, Morris J, Miller JP (1995)
Auditory dysfunction in aging and senile dementia of the Alzheimer’s type. Arch.
Neurol. 52, 626–634.
[73] Gates GA, Anderson ML, McCurry SM, Feeney MP, Larson EB (2011) Central
Auditory Dysfunction as a Harbinger of Alzheimer Dementia. Arch. Otolaryngol. Neck
Surg. 137, 390–395.
[74] Golden HL, Agustus JL, Goll JC, Downey LE, Mummery CJ, Schott JM, Crutch SJ,
Warren JD (2015) Functional neuroanatomy of auditory scene analysis in Alzheimer’s
disease. NeuroImage Clin. 7, 699–708.
[75] Golden HL, Nicholas JM, Yong KXX, Downey LE, Schott JM, Mummery CJ, Crutch
SJ, Warren JD (2015) Auditory spatial processing in Alzheimer’s disease. Brain 138,
189–202.
[76] McKhann G, Drachman D, Folstein M, Katzman R, Price D, Stadlan EM (1984)
Clinical diagnosis of Alzheimer’s disease: Report of the NINCDS-ADRDA Work
Group* under the auspices of Department of Health and Human Services Task Force
on Alzheimer's Disease. Neurology 34, 939–939.
[77] Gorno-Tempini ML, Hillis AE, Weintraub S, Kertesz A, Mendez M, Cappa SF, Ogar
JM, Rohrer JD, Black S, Boeve BF, Manes F, Dronkers NF, Vandenberghe R,
Rascovsky K, Patterson K, Miller BL, Knopman DS, Hodges JR, Mesulam MM,
Grossman M (2011) Classification of primary progressive aphasia and its variants.
Neurology 76, 1006–14.
[78] Geiser E, Ziegler E, Jancke L, Meyer M (2009) Early electrophysiological correlates
of meter and rhythm processing in music perception. Cortex 45, 93–102.
[79] Janata P, Birk J, Tillmann B, Bharucha J (2003) Online detection of tonal pop-out in

33
modulating contexts. Music Percept. 20, 283–305.
[80] DeCarlo LT (1998) Signal detection theory and generalized linear models. Psychol.
Methods 3, 186–205.
[81] Fink GR, Halligan PW, Marshall JC, Frith CD, Frackowiak RS, Dolan RJ (1996)
Where in the brain does visual attention select the forest and the trees? Nature 382,
626–628.
[82] Fink GR, Halligan PW, Marshall JC, Frith CD, Frackowiak RS, Dolan RJ (1997)
Neural mechanisms involved in the processing of global and local aspects of
hierarchically organized visual stimuli. Brain 120, 1779–91.
[83] Lamb MR, Robertson LC, Knight RT (1990) Component mechanisms underlying the
processing of hierarchically organized patterns: inferences from patients with
unilateral cortical lesions. J. Exp. Psychol. Learn. Mem. Cogn. 16, 471–483.
[84] Robertson LC, Lamb MR (1991) Neuropsychological contributions to theories of
part/whole organization. Cogn. Psychol. 23, 299–330.
[85] Sanders LD, Poeppel D (2007) Local and global auditory processing: Behavioral and
ERP evidence. Neuropsychologia 45, 1172–1186.
[86] Filoteo J V, Friedrich FJ, Stricker JL (2001) Shifting attention to different levels
within global-local stimuli: A study of normal participants and a patient with temporal-
parietal lobe damage. Cogn. Neuropsychol. 18, 227–261.
[87] Goll JC, Crutch SJ, Loo JHY, Rohrer JD, Frost C, Bamiou D-E, Warren JD (2010)
Non-verbal sound processing in the primary progressive aphasias. Brain 133, 272–85.
[88] Hailstone JC, Ridgway GR, Bartlett JW, Goll JC, Crutch SJ, Warren JD (2012) Accent
processing in dementia. Neuropsychologia 50, 2233–44.
[89] Rohrer JD, Sauter D, Scott S, Rossor MN, Warren JD (2012) Receptive prosody in
nonfluent primary progressive aphasias. Cortex 48, 308–316.
[90] Libon DJ, Xie SX, Moore P, Farmer J, Antani S, McCawley G, Cross K, Grossman M
(2007) Patterns of neuropsychological impairment in frontotemporal dementia.
Neurology 68, 369–375.
[91] Maruta C, Makhmood S, Downey LE, Golden HL, Fletcher PD, Witoonpanich P,
Rohrer JD, Warren JD (2014) Delayed auditory feedback simulates features of
nonfluent primary progressive aphasia. J. Neurol. Sci. 347, 345–8.
[92] Warren JE, Wise RJS, Warren JD (2005) Sounds do-able: auditory-motor
transformations and the posterior temporal plane. Trends Neurosci. 28, 636–43.
[93] Jerde T a, Childs SK, Handy ST, Nagode JC, Pardo J V (2011) Dissociable systems of
working memory for rhythm and melody. Neuroimage 57, 1572–9.
[94] Janata P, Tillman B, Bharucha JJ. (2002) Listening to polyphonic music recruits
domain-general attention and working memory circuits. Cogn Affect Behav Neurosci 2,
121-140.

34
[95] Caza N, Belleville S (2008) Reduced short-term memory capacity in Alzheimer’s
disease: The role of phonological, lexical, and semantic processing. Memory 16, 341–
350.
[96] Eustache F, Lambert J, Cassier C, Dary M, Rossa Y, Rioux P, Viader F, Lechevalier B
(1995) Disorders of auditory identification in dementia of the Alzheimer type. Cortex
31, 119–27.
[97] Thornley J, Hirjee H, Vasudev A (2015) Music therapy in patients with dementia and
behavioral disturbance on an inpatient psychiatry unit: results from a pilot randomized
controlled study. Int. Psychogeriatrics 21, 1–3.
[98] McDermott JH, Wrobleski D, Oxenham AJ (2011) Recovering sound sources from
embedded repetition. Proc. Natl. Acad. Sci. U. S. A. 108, 1188–93.
[99] Dunn LM, Dunn PQ, Whetton C (1982) British Picture Vocabulary Scale, NFER-
Nelson, Windsor.
[100] Delis DC, Kaplan E, Kramer JH (2001) Delis-Kaplan executive function system, The
Psychological Corporation, San Antonio, TX.
[101] Jackson M, Warrington EK (1986) Arithmetic skills in patients with unilateral cerebral
lesions. Cortex 22, 611–20.
[102] McKenna P, Warrington E (1983) Graded naming test, NFER-Nelson, Windsor.
[103] Folstein M, Folstein S, McHugh P (1975) “Mini-mental state”: A practical method for
grading the cognitive state of patients for the clinician. J. Psychiatr. Res. 12, 189–198.
[104] Nelson HE (1982) National Adult Reading Test, NFER-Nelson, Windsor.
[105] Warrington EK (1984) Recogntion memory test, NFER-Nelson, Windsor.
[106] Warrington EK, James M (1991) The visual object and space perception battery,
Thames Valley Test Company, Bury St Edmunds.
[107] Wechsler D (1981) Wechsler Adult Intelligence Scale-Revised, Psychological
Corporation, New York.
[108] Wechsler D (1999) Wechsler abbreviated scale of intelligence: WASI, The
Psychological Corporation, Harcourt Brace, San Antonio, TX.
[109] Wechsler D (1987) Wechsler memory scale: Revised, The Psychological Corporation,
San Antonio, TX.
35
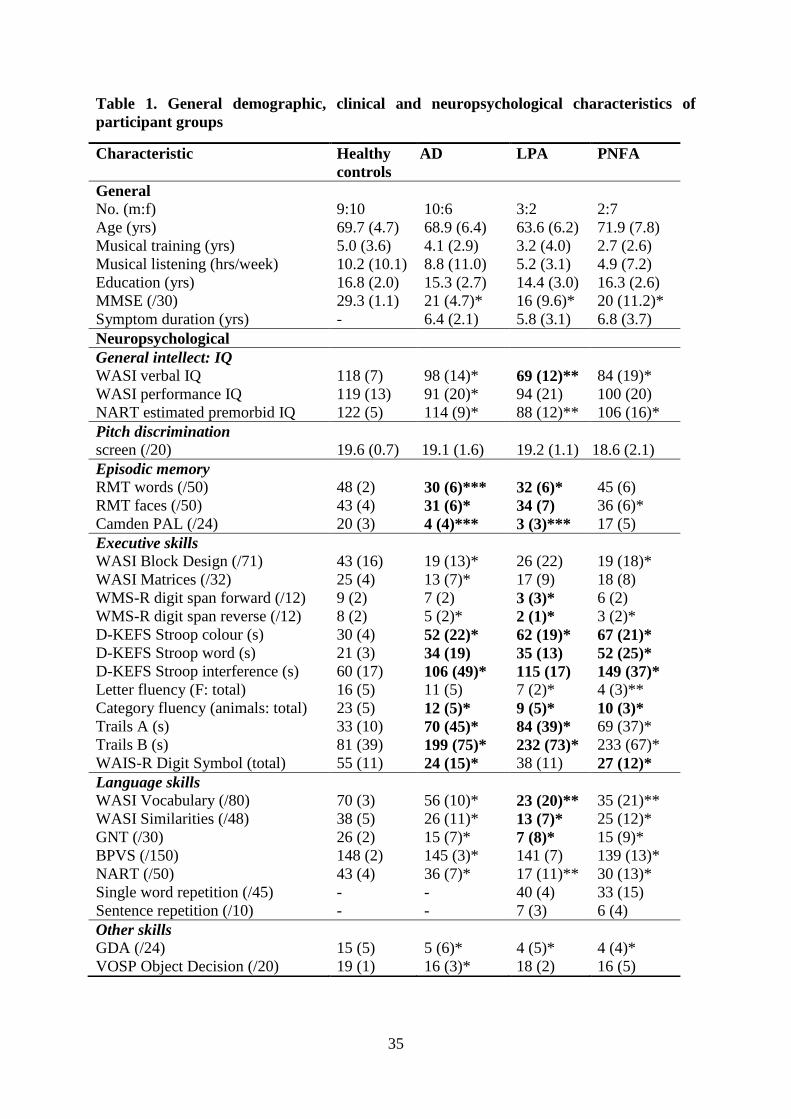
Table 1. General demographic, clinical and neuropsychological characteristics of
participant groups
Characteristic Healthy
controls
AD LPA PNFA
General
No. (m:f) 9:10 10:6 3:2 2:7
Age (yrs) 69.7 (4.7) 68.9 (6.4) 63.6 (6.2) 71.9 (7.8)
Musical training (yrs) 5.0 (3.6) 4.1 (2.9) 3.2 (4.0) 2.7 (2.6)
Musical listening (hrs/week) 10.2 (10.1) 8.8 (11.0) 5.2 (3.1) 4.9 (7.2)
Education (yrs) 16.8 (2.0) 15.3 (2.7) 14.4 (3.0) 16.3 (2.6)
MMSE (/30) 29.3 (1.1) 21 (4.7)* 16 (9.6)* 20 (11.2)*
Symptom duration (yrs) - 6.4 (2.1) 5.8 (3.1) 6.8 (3.7)
Neuropsychological
General intellect: IQ
WASI verbal IQ 118 (7) 98 (14)* 69 (12)** 84 (19)*
WASI performance IQ 119 (13) 91 (20)* 94 (21) 100 (20)
NART estimated premorbid IQ 122 (5) 114 (9)* 88 (12)** 106 (16)*
Pitch discrimination
screen (/20) 19.6 (0.7) 19.1 (1.6) 19.2 (1.1) 18.6 (2.1)
Episodic memory
RMT words (/50) 48 (2) 30 (6)*** 32 (6)* 45 (6)
RMT faces (/50) 43 (4) 31 (6)* 34 (7) 36 (6)*
Camden PAL (/24) 20 (3) 4 (4)*** 3 (3)*** 17 (5)
Executive skills
WASI Block Design (/71) 43 (16) 19 (13)* 26 (22) 19 (18)*
WASI Matrices (/32) 25 (4) 13 (7)* 17 (9) 18 (8)
WMS-R digit span forward (/12) 9 (2) 7 (2) 3 (3)* 6 (2)
WMS-R digit span reverse (/12) 8 (2) 5 (2)* 2 (1)* 3 (2)*
D-KEFS Stroop colour (s) 30 (4) 52 (22)* 62 (19)* 67 (21)*
D-KEFS Stroop word (s) 21 (3) 34 (19) 35 (13) 52 (25)*
D-KEFS Stroop interference (s) 60 (17) 106 (49)* 115 (17) 149 (37)*
Letter fluency (F: total) 16 (5) 11 (5) 7 (2)* 4 (3)**
Category fluency (animals: total) 23 (5) 12 (5)* 9 (5)* 10 (3)*
Trails A (s) 33 (10) 70 (45)* 84 (39)* 69 (37)*
Trails B (s) 81 (39) 199 (75)* 232 (73)* 233 (67)*
WAIS-R Digit Symbol (total) 55 (11) 24 (15)* 38 (11) 27 (12)*
Language skills
WASI Vocabulary (/80) 70 (3) 56 (10)* 23 (20)** 35 (21)**
WASI Similarities (/48) 38 (5) 26 (11)* 13 (7)* 25 (12)*
GNT (/30) 26 (2) 15 (7)* 7 (8)* 15 (9)*
BPVS (/150) 148 (2) 145 (3)* 141 (7) 139 (13)*
NART (/50) 43 (4) 36 (7)* 17 (11)** 30 (13)*
Single word repetition (/45) - - 40 (4) 33 (15)
Sentence repetition (/10) - - 7 (3) 6 (4)
Other skills
GDA (/24) 15 (5) 5 (6)* 4 (5)* 4 (4)*
VOSP Object Decision (/20) 19 (1) 16 (3)* 18 (2) 16 (5)

36
Mean (standard deviation) values are shown unless otherwise indicated; results in bold
indicate mean score <5th percentile for age norms (not available for BPVS, letter fluency,
word repetition, sentence repetition); *significantly different from healthy control group
**significantly different from healthy control and AD group ***significantly different from
healthy control and PNFA group. Reduced numbers of participants completing each of the
tests (by group) were as follows: D-KEFS Stroop, 15 AD, four LPA, five PNFA; fluency
(letter, category), five PNFA; GDA, eight PNFA; GNT, eight PNFA; NART, six PNFA;
RMT (words, faces), 18 controls, 15 AD; Trails, 14 AD, four LPA; VOSP Object Decision,
eight PNFA; WAIS-R Digit Symbol, 13 AD, seven PNFA; WASI (Block Design, Matrices,
Similarities, Vocabulary), four LPA; WMS-R digit span reverse, four LPA, eight PNFA. AD,
Alzheimer’s disease; BPVS, British Picture Vocabulary Scale [99]; D-KEFS, Delis Kaplan
Executive System [100]; GDA, Graded Difficulty Arithmetic [101]; GNT, Graded Naming
Test [102]; LPA, logopenic aphasia; MMSE, Mini-Mental State Examination score [103];
NART, National Adult Reading Test [104]; PAL, Paired Associate Learning; PNFA,
progressive nonfluent aphasia; RMT, Recognition Memory Test [105]; VOSP, Visual Object
and Spatial Perception Battery [106]; WAIS-R, Wechsler Adult Intelligence Scale Revised
[107]; WASI, Wechsler Abbreviated Scale of Intelligence [108]; WMS-R, Wechsler Memory
Scale Revised [109].

37
Table 2. Summary of performance of participant groups on music experimental tests
Musical
attribute
Measure Healthy
controls
AD LPA PNFA
Pitch interval
(pitch local)
Mean (SD) 0.93 (0.10) 0.74 (0.25) 0.59 (0.25) 0.37 (0.43)
Vs controls -0.14
(-0.43 to 0.09)
-0.22
(-0.67 to 0.10) -0.46
(-0.90 to -0.04)
Vs AD -0.08
(-0.49 to 0.16)
-0.33
(-0.72 to 0.09)
Vs LPA -0.24
(-0.68 to 0.22)
Melody contour:
global
Mean (SD) 0.92 (0.12) 0.60 (0.32) 0.37 (0.44) 0.40 (0.30)
Vs controls -0.26
(-0.61 to -0.01)
-0.42
(-0.96 to 0.11) -0.43
(-0.79 to -0.15)
Vs AD -0.16
(-0.65 to 0.37)
-0.17
(-0.48 to 0.16)
Vs LPA -0.01
(-0.54 to 0.47)
Melody contour:
global direction-
only
Mean (SD) 0.84 (0.18) 0.53 (0.29) 0.30 (0.34) 0.21 (0.24)
Vs controls -0.26
(-0.55 to -0.002)
-0.42
(-0.96 to -0.08)
-0.54
(-0.84 to -0.17)
Vs AD -0.16
(-0.66 to 0.16)
-0.28
(-0.59 to 0.05)
Vs LPA -0.12
(-0.46 to 0.33)
Rhythm
(temporal local)
Mean (SD) 0.92 (0.07) 0.75 (0.15) 0.51 (0.33) 0.46 (0.38)
Metre
(temporal global)
Mean (SD) 0.82 (0.16) 0.59 (0.17) 0.31 (0.22) 0.31 (0.30)
Timbre Mean (SD) 0.99 (0.01) 0.98 (0.04) 0.81 (0.25) 0.84 (0.36)
Tune detection
(tune streaming)
OR 86 10 6 8
Tune recognition
(in isolation)
Mean (SD)
( /20)
19.7 (0.5) 19.3 (0.8) 17.4 (2.3) 18.4 (3.3)
Within-group mean (standard deviation) scores on experimental music tests are presented;
corrected detection scores are presented for detection of local and global pitch deviants
(interval, melody), temporal deviants (rhythm, metre) and timbre deviants timbre control task:
see text). Bonferroni-corrected pairwise comparisons are shown: for all group comparisons,
mean difference (99% confidence interval) values are presented. Reduced numbers of
participants completing each of the tests (by group) were as follows: pitch deviance detection,
19 controls, 13 AD, five LPA, eight PNFA; temporal deviance detection, 19 controls, 13 AD,
five LPA, nine PNFA; timbre deviance detection, 19 controls, 14 AD, five LPA, eight PNFA,
tune streaming, 18 controls, 15 AD, four LPA, seven PNFA. Significant group differences

38
after adjustment for auditory working memory performance are indicated in bold. AD,
Alzheimer’s disease; LPA, logopenic aphasia; PNFA, progressive nonfluent aphasia; OR,
odds ratio; SD, standard deviation.

39
Figure Legends
Figure 1. Cognitive framework for the present experiments
The diagram is adapted from the modular module of music cognition proposed by Peretz and
Coltheart [7]. Oblongs indicate cognitive components and arrows indicate the primary
direction of information flow. Shaded oblongs indicate components addressed by the present
experiments and about which we had specific hypotheses concerning the profile of deficits in
particular dementia syndromes. Based on previous neuropsychological and neuroanatomical
evidence, we predicted Alzheimer’s disease (and its language variant, logopenic aphasia;
black oblongs) would impair acoustic analysis (here, parsing of a musical scene) and produce
more severe deficits of global (melody, metre) than local (interval, rhythm) information
processing in the pitch and temporal domains of music; while progressive nonfluent aphasia
(grey oblongs) would produce deficits of both local and global musical information
processing, more severe in the temporal domain (note that deficits of phonological processing
are a feature of both progressive aphasia syndromes but were not directly addressed in the
present experiments). The adapted model presented here retains the modular and hierarchical
framework proposed by Peretz and Coltheart but in contrast to the original model, makes no
strong inferences about the serial dependence of local on global pitch pattern encoding;
unlike the situation with focal brain lesions due to stroke (which motivated the original
model), neurodegenerative diseases typically damage but do not entirely remove particular
perceptual modules so that degraded information flow between modules can continue to
occur.
Figure 2. Schematic representation of the experimental music battery
Examples of stimuli used for all tests in the music experimental battery. Roman numerals I to
V code the presentation order of tests comprising the battery. For all deviance detection tasks,
deviant notes are shown in red; for the timbral deviant detection task, the red notes signify a
change in spectral envelope. For illustrative purposes, local and global deviants are shown
here within the same trial; however, the experimental stimuli as presented contained only a
single deviant type (condition) per trial. The tune recognition tests comprised a test of
musical scene analysis (decision on familiarity of tunes presented with polyphonic harmony;
target shown on top stave for each example) and a baseline test of tune recognition (decision
on familiarity of tunes presented in isolation, acting as a control for the tune streaming task);
40
examples represent Auld Lang Syne in natural and pseudo-reversed forms (see section 2.2 and
supplementary material for details).
Figure 3. Individual performance data for musical tasks
Individual corrected detection scores (not adjusted for auditory working memory
performance) are plotted for healthy control, Alzheimer’s disease (AD), logopenic aphasia
(LPA) and progressive nonfluent aphasia (PNFA) groups for tests of pitch, temporal and
timbral deviant detection, tune streaming and baseline tune recognition (see supplementary
material for details)

41
Figure 1

42
Figure 2

43
Figure 3

44
SUPPLEMENTARY MATERIAL
Music perception in dementia, by HL Golden et al
Peripheral hearing assessment
Peripheral hearing ability was assessed in each participant using pure tone audiometry,
administered via headphones from a notebook computer in a quiet room. The procedure was
adapted from a commercial screening audiometry software package (AUDIO- CDTM®,
http://www.digital-recordings.com/audiocd/audio.html). Five frequency levels (500, 1000,
2000, 3000, 4000 Hz) were assessed: at each frequency, participants were presented with a
continuous tone that slowly and linearly increased in intensity. Participants were instructed to
indicate as soon as they were sure they could detect the tone; this response time was
measured and stored for offline analysis. Hearing was assessed in the right ear. This test took
five to ten minutes to administer.
Pitch discrimination screening test
All participants completed a pitch discrimination test to assess their suitability for
undertaking tests involving pitch pattern processing. This screening test comprised 20 note
pairs; 10 pairs had identical notes and 10 had notes that differed in pitch by an interval of one
to six semitones (mean = 2.7 semitones). Notes were derived from a synthetic piano sound
(Musescore®) and intervals corresponded to pitch values in traditional Western music; each
note had duration 1s and an inter-note gap of 1s. Participants were instructed to indicate
whether note pairs were ‘same’ or ‘different’ after each pair was played. Examples were used
to familiarise participants with the task requirements prior to beginning the test. The test took
approximately two minutes to administer. Patients who scored <80% correct on this
screening task did not subsequently undertake the pitch pattern test in the experimental
battery proper.

45
Table S1. Peripheral hearing function in participant groups
Peripheral hearing measure Healthy
controls
AD LPA PNFA
Mean (SD) (sec) 12.1(9.9) 12.0 (14.0) 21.9(11.8) 23.5(15.9)
Vs healthy controls: beta (CI) -0.9
(-5.0 to 4.3)
10.6
(-0.9 to 27.8) 12.2
(3.1 to 22.0)
Vs AD: beta (CI) 11.5
(-0.2 to 28.1) 13.2
(4.3 to 23.2)
Vs LPA: beta (CI) -1.7
(-15.8 to 17.3)
Overall audiometry scores within groups (se text) and pairwise regression comparisons are
presented. Significant group differences are indicated in bold. AD, typical Alzheimer’s
disease; CI, 99% confidence interval; LPA, logopenic aphasia; PNFA, progressive nonfluent
aphasia. SD, standard deviation.

46
Table S2. Results on the ‘easy’ version of the pitch pattern processing task for
participant groups
Pitch measure Healthy
controls
AD LPA PNFA
Local 0.99 (0.01) 0.89 (0.11) 0.24 (0.44) 0.51 (0.44)
Global 0.99 (0.01) 0.91 (0.10) 0.18 (0.23) 0.65 (0.32)
Corrected detection scores (mean / standard deviation) before adjustment for auditory
working memory performance are presented (see text). AD, typical Alzheimer’s disease;
LPA, logopenic aphasia; PNFA, progressive nonfluent aphasia.
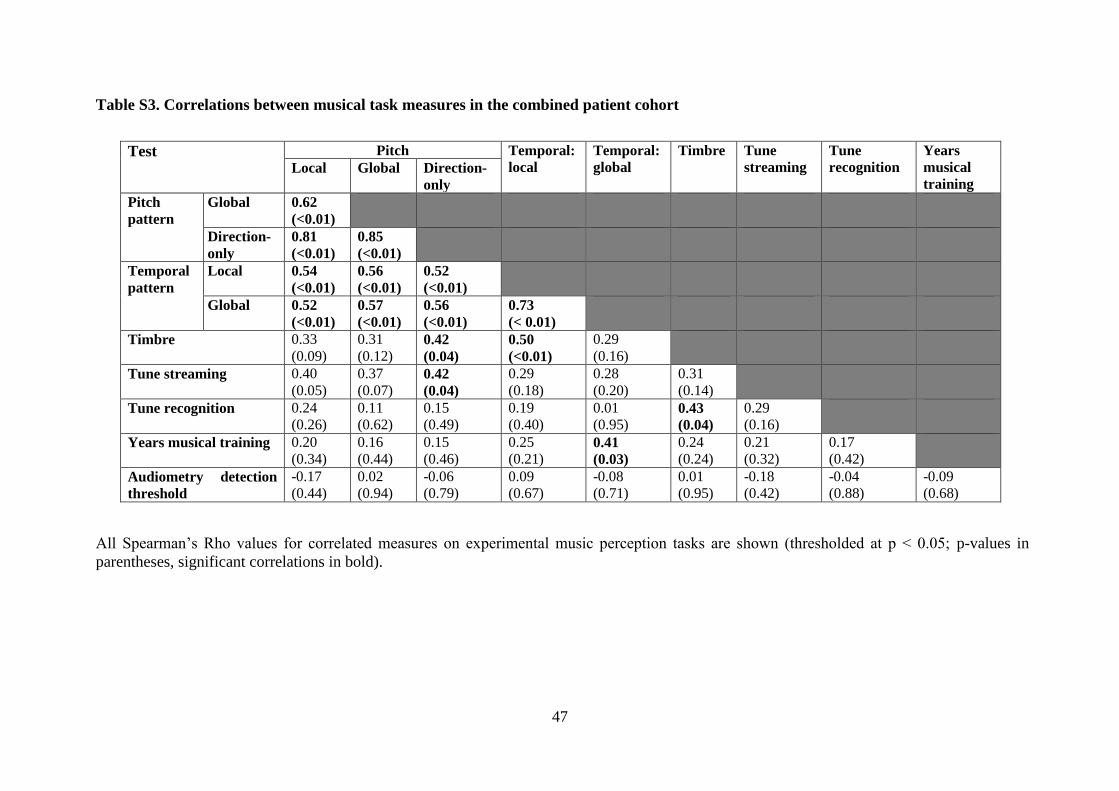
47
Table S3. Correlations between musical task measures in the combined patient cohort
Test Pitch Temporal:
local
Temporal:
global
Timbre Tune
streaming
Tune
recognition
Years
musical
training Local Global Direction-
only
Pitch
pattern
Global 0.62
(<0.01)
Direction-
only
0.81
(<0.01)
0.85
(<0.01)
Temporal
pattern
Local 0.54
(<0.01)
0.56
(<0.01)
0.52
(<0.01)
Global 0.52
(<0.01)
0.57
(<0.01)
0.56
(<0.01)
0.73
(< 0.01)
Timbre 0.33
(0.09)
0.31
(0.12) 0.42
(0.04)
0.50
(<0.01)
0.29
(0.16)
Tune streaming 0.40
(0.05)
0.37
(0.07) 0.42
(0.04)
0.29
(0.18)
0.28
(0.20)
0.31
(0.14)
Tune recognition 0.24
(0.26)
0.11
(0.62)
0.15
(0.49)
0.19
(0.40)
0.01
(0.95) 0.43
(0.04)
0.29
(0.16)
Years musical training 0.20
(0.34)
0.16
(0.44)
0.15
(0.46)
0.25
(0.21) 0.41
(0.03)
0.24
(0.24)
0.21
(0.32)
0.17
(0.42)
Audiometry detection
threshold
-0.17
(0.44)
0.02
(0.94)
-0.06
(0.79)
0.09
(0.67)
-0.08
(0.71)
0.01
(0.95)
-0.18
(0.42)
-0.04
(0.88)
-0.09
(0.68)
All Spearman’s Rho values for correlated measures on experimental music perception tasks are shown (thresholded at p < 0.05; p-values in
parentheses, significant correlations in bold).

48
Table S4. Summary of performance of participant groups on musical pitch and
temporal processing tests, before adjusting for general auditory working memory
Musical
attribute
Measure Healthy
controls
AD LPA PNFA
Pitch interval
(pitch local)
Mean (SD) 0.93 (0.10) 0.74 (0.25)* 0.59 (0.25)* 0.37 (0.43)*
Vs controls -0.19
(-0.40 to 0.05)
-0.34
(-0.69 to -0.18)
-0.56
(-0.92 to -0.20)
Vs AD -0.15
(-0.60 to 0.07)
-0.36
(-0.80 to 0.04)
Vs LPA -0.21
(-0.63 to 0.28)
Melody contour:
global
Mean (SD) 0.92 (0.12) 0.60 (0.32)* 0.37 (0.44)* 0.40 (0.30)*
Vs controls -0.31
(-0.59 to -0.10)
-0.54
(-0.96 to -0.07)
-0.52
(-0.85 to -0.30)
Vs AD -0.23
(-0.71 to 0.29)
-0.21
(-0.59 to 0.12)
Vs LPA 0.02
(-0.53 to 0.51)
Melody contour:
global direction-
only
Mean (SD) 0.84 (0.18) 0.53 (0.29)* 0.30 (0.34)* 0.21 (0.24)*
Vs controls -0.31
(-0.53 to -0.06)
-0.54
(-0.93 to -0.22)
-0.63
(-0.83 to -0.31)
Vs AD -0.23
(-0.68 to 0.11)
-0.31
(-0.60 to 0.001)
Vs LPA -0.09
(-0.44 to 0.35)
Rhythm
(temporal local)
Mean (SD) 0.92 (0.07) 0.75 (0.15)* 0.51 (0.33)* 0.46 (0.38)*
Vs controls -0.17
(-0.33 to -0.09)
-0.42
(-0.72 to -0.07)
-0.46
(-0.79 to -0.18)
Vs AD -0.25
(-0.57 to 0.12)
-0.29
(-0.66 to 0.01)
Vs LPA -0.04
(-0.39 to 0.53)
Metre
(temporal global)
Mean (SD) 0.82 (0.16) 0.59 (0.17)* 0.31 (0.22)* 0.31 (0.30)*
Vs controls -0.23
(-0.40 to -0.09)
-0.52
(-0.79 to -0.30)
-0.51
(-0.76 to -0.25)
Vs AD -0.28
(-0.56 to 0.05)
-0.28
(-0.53 to 0.01)
Vs LPA -0.01
(-0.39 to 0.32)
Within-group mean (standard deviation) scores on experimental music tests are presented;
corrected detection scores are presented for detection of local and global pitch deviants
(interval, melody) and temporal deviants (rhythm, metre). Bonferroni-corrected pairwise
comparisons are shown: for all group comparisons, mean difference (99% confidence
interval) values are presented. Significant group differences are indicated in bold.
*significantly different from controls; AD, Alzheimer’s disease; LPA, logopenic aphasia;
PNFA, progressive nonfluent aphasia; SD, standard deviation.

49
Figure S1. Visual guides given to participants for each experimental task
Prior to commencing the deviance detection tests, participants were first familiarised with
examples of the template pitch pattern (top) and the temporal pattern (below) without
deviants. ‘Change 1’ illustrates local changes in pitch (‘the pattern of ups and downs is the
same but the step is a different size’) and timing (‘the beat is the same but there may be two
shorter notes instead of a longer note or a longer note instead of two shorter notes’). ‘Change
2’ illustrates global changes in pitch (‘the note goes up instead of down or down instead of
up’) or timing (‘the place of the beat occurs late or early’).


