MPRAMunich Personal RePEc Archive
Performance and Size of Fraser & NeaveHoldings Bhd (F&N)
Ridhuan Othaman
Universiti Utara Malaysia
30 March 2017
Online at https://mpra.ub.uni-muenchen.de/78503/MPRA Paper No. 78503, posted 17 April 2017 09:42 UTC
1 | P a g e
Performance and Size of Fraser & Neave Holdings Bhd (F&N)
Muhamad Ridhuan Bin Othaman
Universiti Utara Malaysia
ABSTRACT
The main study is to analyze about the overall of the risk and the performance of the Fraser &
Neave Holdings Bhd (F&N). All the is get from annual report that get from the Bursa Malaysia.
The measurement of the company is used in variety of ratio such as liquidity risk, operational risk,
credit risk and financial risk. These ratio is useful to know well about the company.
Keywords: Risk and performance of the company, profitability and Liquidity.
1.0 INTRODUCTION
1.1 BACKGROUND OF THE COMPANY
Fraser and Neave Holdings Bhd (F&N) is a one of the organization in Malaysia recorded
on Bursa Malaysia's Main Board with mastery and unmistakable remaining in the sustenance and
drink business. Established by John Fraser and David Chalmers Neave in 1883, from whom our
immediately conspicuous initials "F&N" are inferred, F&N has advanced into a notorious family
2 | P a g e
unit mark and the F&N Group today is among the most established, most perceived and best
organizations in Singapore and Malaysia with center aptitude and authority in the Food and
Beverage, Property and Publishing and Printing parts.
F&N is among the district's and Malaysia's most seasoned organizations and its image
appreciates the uncommon qualification of being a market pioneer and commonly recognized
name in numerous classifications. F&N works in Malaysia, Brunei, Thailand and Indochina, and
is a backup of Fraser and Neave, Limited, an organization recorded on the Singapore Stock
Exchange. An all-around cherished brand in Malaysia, today, F&N has spread its wings to more
than 40 nations worldwide and set up itself as a provincial player.
Our products have satisfied the tastes and appetites of generations and we will continue to
deepen the connection with our consumers and offer excitement and enjoyment in tandem with
our brand promise of ‘Pure Enjoyment, Pure Goodness’.
1.2 PRODUCT
Milk
Soft drinks
Ice cream
2.0 LITERATURE REVIEW
According to Kolapo, Ayeni, & OKE (2012) defines the impact of credit risk on bank
execution measured by the Return on Assets of banks is cross-sectional invariant. That is, nature
and administrative example of individual firms don't decide the effect. This is uncovered by the
confined F – test under the settled impact examination. Loan and Advances ratio (LA) coefficient
applies most noteworthy constructive outcome on the productivity over the managing an account
firms.
3 | P a g e
Shariah Supervisory Board (SSB) is one of inside administration instruments which
includes the checking of Islamic banks' exercises in understanding to the Sharia (i.e. Islamic law)
particularly on its execution and consistence (Alman, 2012).
Corporate governance is an arrangement of connections between an organization's
administration, its board, its shareholders and different partners. It gives the structure through
which the objectiveness of the organization is set, and the methods for accomplishing those targets
and observing execution are resolved (Norhafiza & Ibrahim, 2007).
According to Waemustafa & Sukri (2015) defines credit risk happened in Islamic banks'
Murabahah financing when client pick to drop to purchase the ware making the bank be at risk for
misfortunes while neglecting to finish the portion reimbursement for the products as stipulated
likewise causes credit hazard to Islamic banks.
The finding of this review demonstrates that liquidity proportion (LIQUID) is decidedly
critical with ROA this suggests Islamic banks receive a moderate methodology in overseeing
liquidity issue by keeping up adequate money hold and in the meantime these banks can produce
benefit. (Waemustafa & Sukri, 2016).
4 | P a g e
3.0 DESCRIPTIVE ANALYSIS
3.1 RISK ASSESTMENT
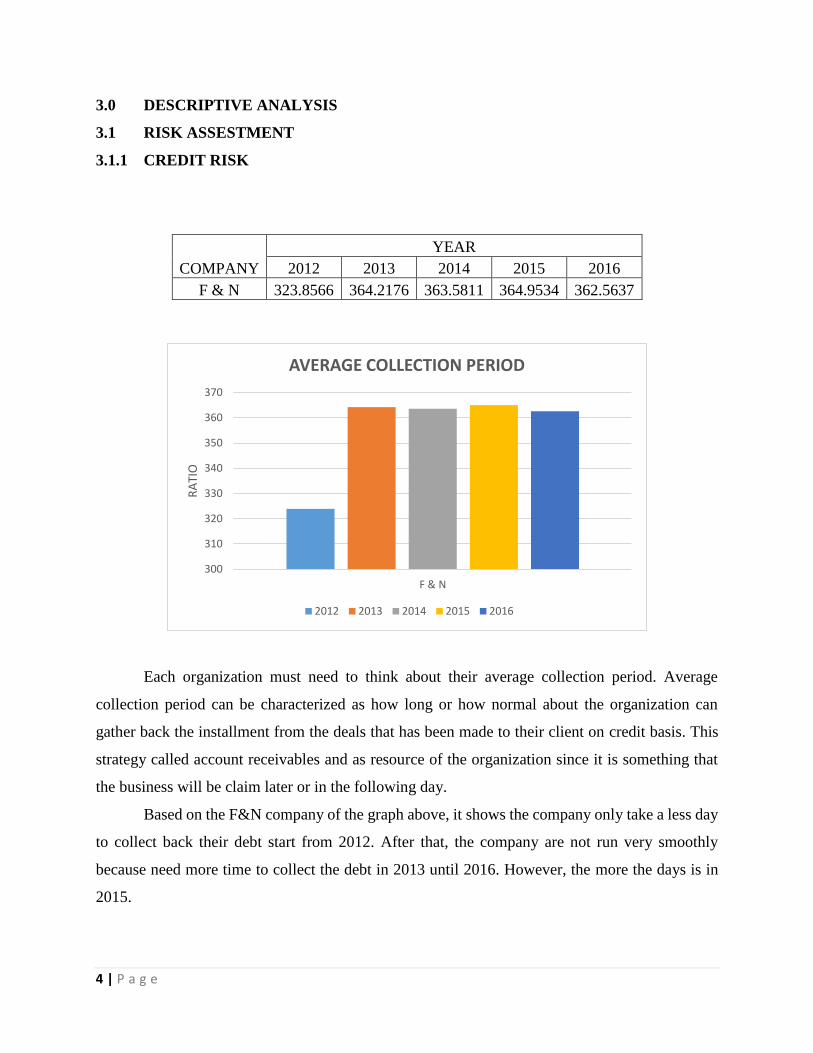
3.1.1 CREDIT RISK
Each organization must need to think about their average collection period. Average
collection period can be characterized as how long or how normal about the organization can
gather back the installment from the deals that has been made to their client on credit basis. This
strategy called account receivables and as resource of the organization since it is something that
the business will be claim later or in the following day.
Based on the F&N company of the graph above, it shows the company only take a less day
to collect back their debt start from 2012. After that, the company are not run very smoothly
because need more time to collect the debt in 2013 until 2016. However, the more the days is in
2015.
300
310
320
330
340
350
360
370
F & N
RA
TIO
AVERAGE COLLECTION PERIOD
2012 2013 2014 2015 2016
COMPANY
YEAR
2012 2013 2014 2015 2016
F & N 323.8566 364.2176 363.5811 364.9534 362.5637
5 | P a g e
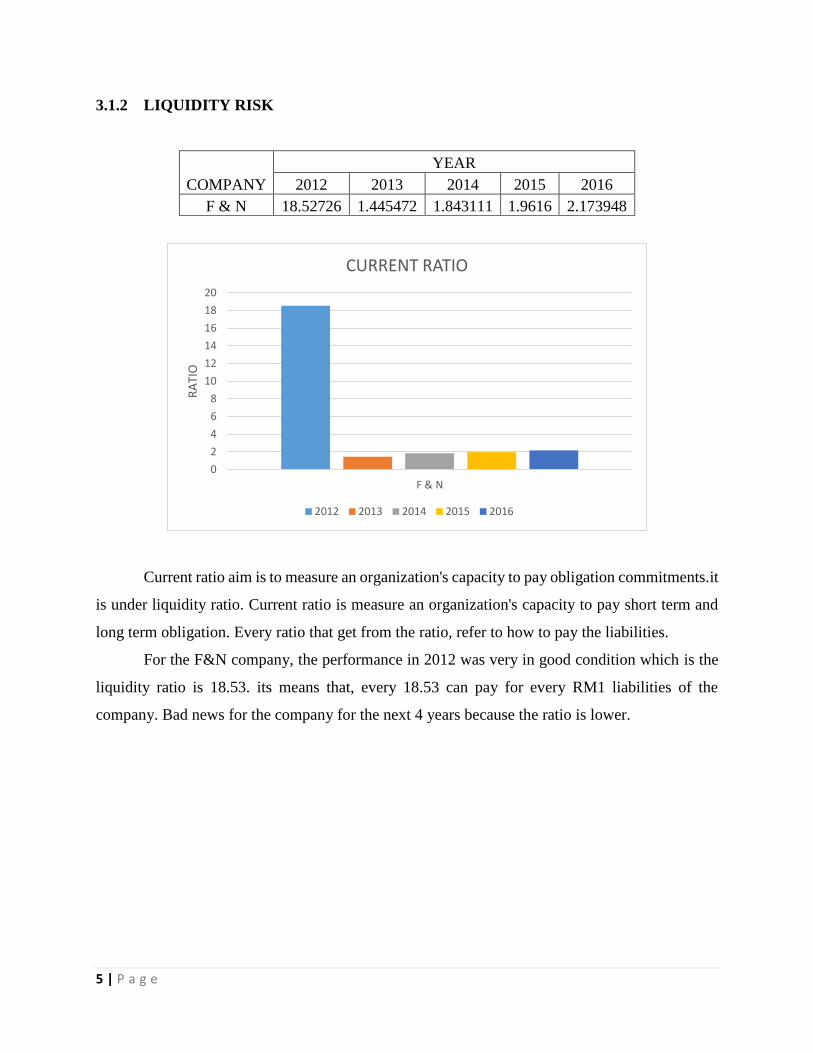
3.1.2 LIQUIDITY RISK
COMPANY
YEAR
2012 2013 2014 2015 2016
F & N 18.52726 1.445472 1.843111 1.9616 2.173948
Current ratio aim is to measure an organization's capacity to pay obligation commitments.it
is under liquidity ratio. Current ratio is measure an organization's capacity to pay short term and
long term obligation. Every ratio that get from the ratio, refer to how to pay the liabilities.
For the F&N company, the performance in 2012 was very in good condition which is the
liquidity ratio is 18.53. its means that, every 18.53 can pay for every RM1 liabilities of the
company. Bad news for the company for the next 4 years because the ratio is lower.
0
2
4
6
8
10
12
14
16
18
20
F & N
RA
TIO
CURRENT RATIO
2012 2013 2014 2015 2016
6 | P a g e
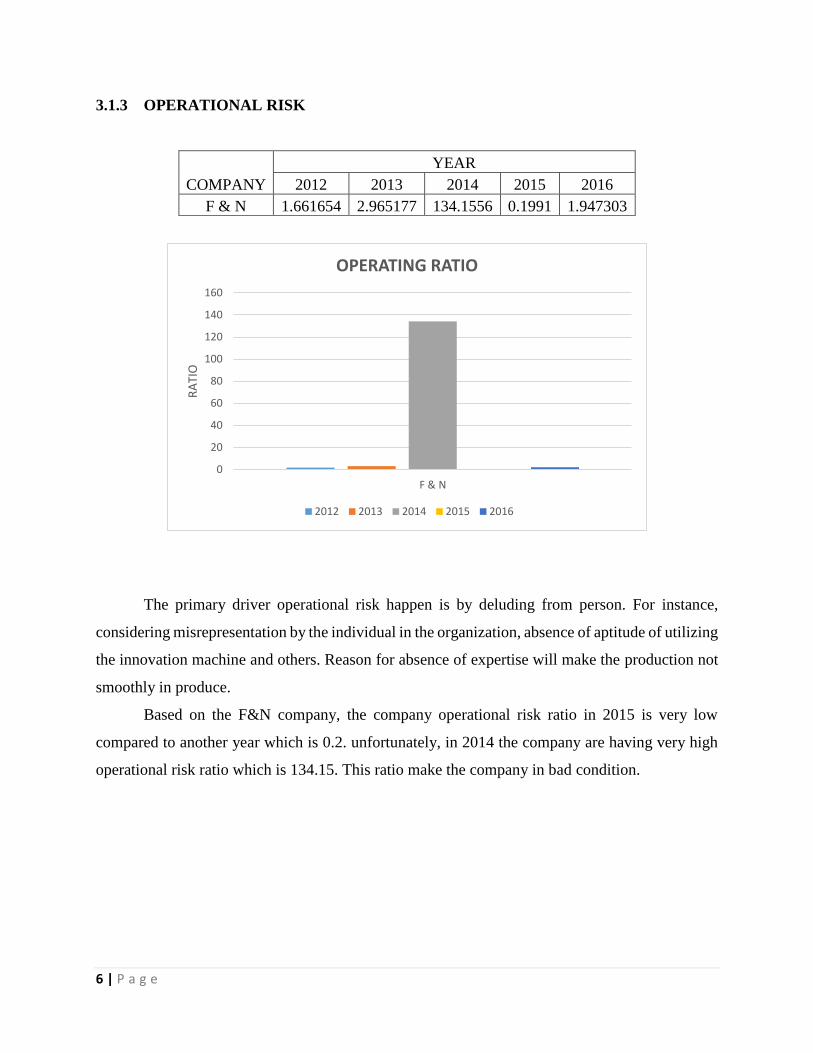
3.1.3 OPERATIONAL RISK
COMPANY
YEAR
2012 2013 2014 2015 2016
F & N 1.661654 2.965177 134.1556 0.1991 1.947303
The primary driver operational risk happen is by deluding from person. For instance,
considering misrepresentation by the individual in the organization, absence of aptitude of utilizing
the innovation machine and others. Reason for absence of expertise will make the production not
smoothly in produce.
Based on the F&N company, the company operational risk ratio in 2015 is very low
compared to another year which is 0.2. unfortunately, in 2014 the company are having very high
operational risk ratio which is 134.15. This ratio make the company in bad condition.
0
20
40
60
80
100
120
140
160
F & N
RA
TIO
OPERATING RATIO
2012 2013 2014 2015 2016
7 | P a g e
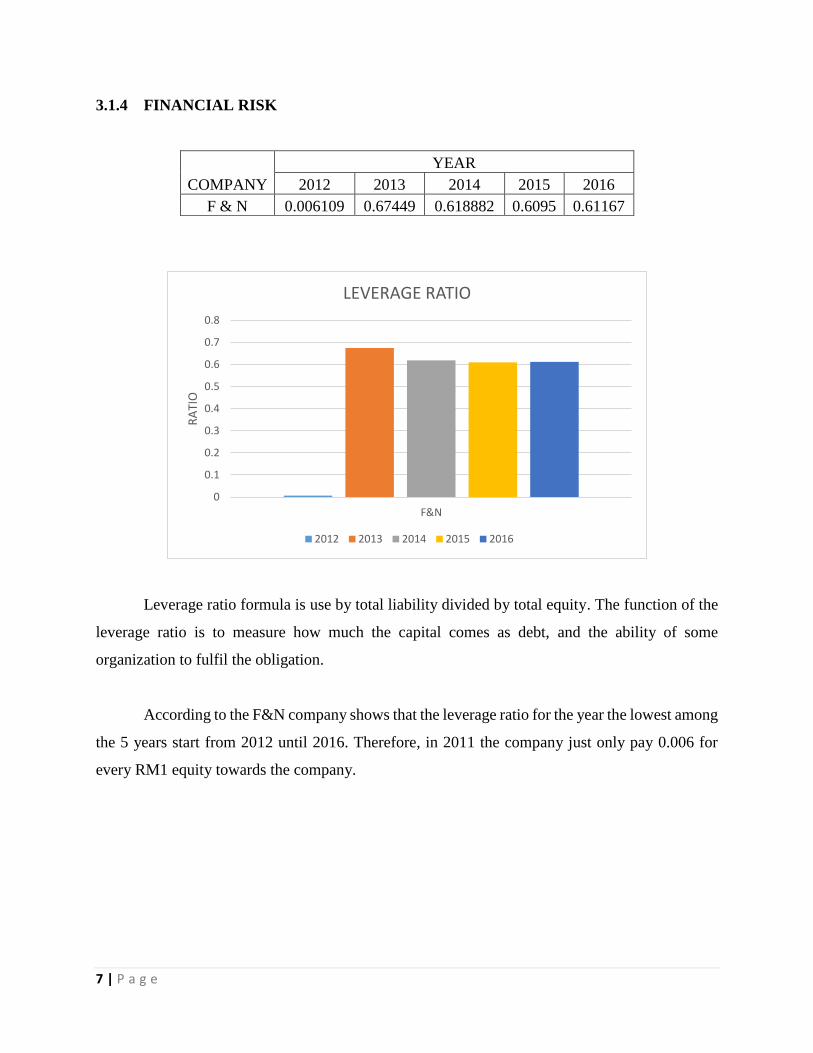
3.1.4 FINANCIAL RISK
COMPANY
YEAR
2012 2013 2014 2015 2016
F & N 0.006109 0.67449 0.618882 0.6095 0.61167
Leverage ratio formula is use by total liability divided by total equity. The function of the
leverage ratio is to measure how much the capital comes as debt, and the ability of some
organization to fulfil the obligation.
According to the F&N company shows that the leverage ratio for the year the lowest among
the 5 years start from 2012 until 2016. Therefore, in 2011 the company just only pay 0.006 for
every RM1 equity towards the company.
0
0.1
0.2
0.3
0.4
0.5
0.6
0.7
0.8
F&N
RA
TIO
LEVERAGE RATIO
2012 2013 2014 2015 2016
8 | P a g e
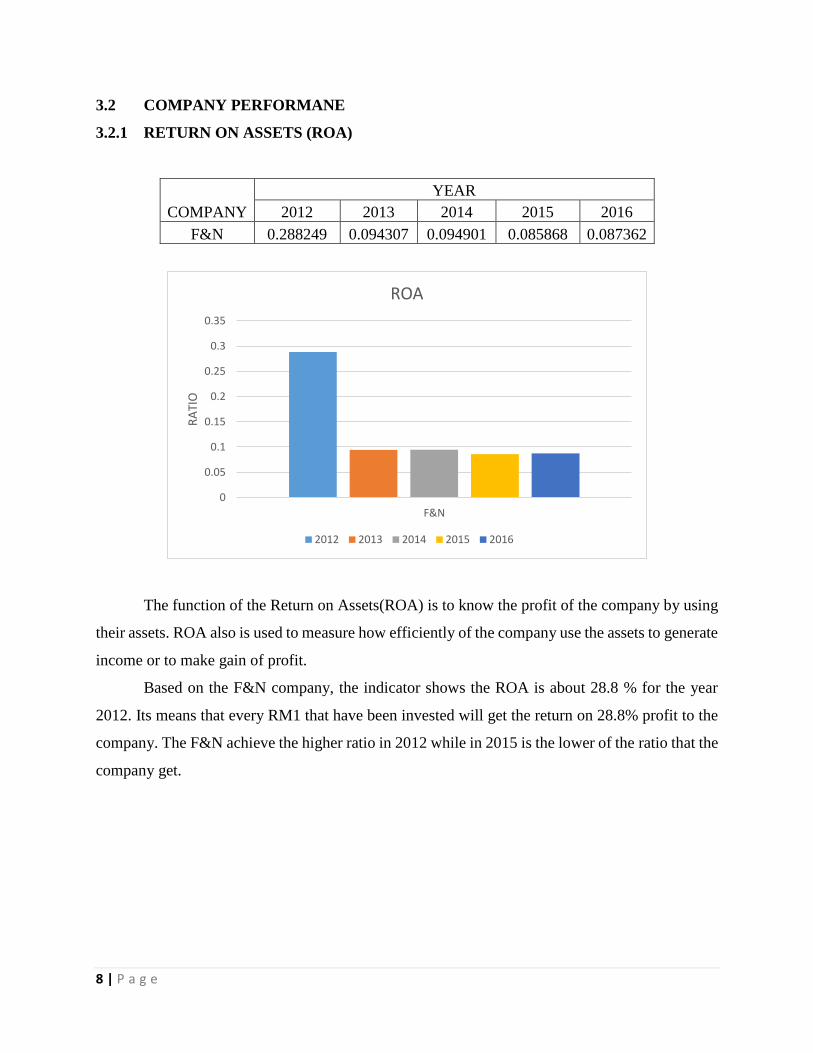
3.2 COMPANY PERFORMANE
3.2.1 RETURN ON ASSETS (ROA)
COMPANY
YEAR
2012 2013 2014 2015 2016
F&N 0.288249 0.094307 0.094901 0.085868 0.087362
The function of the Return on Assets(ROA) is to know the profit of the company by using
their assets. ROA also is used to measure how efficiently of the company use the assets to generate
income or to make gain of profit.
Based on the F&N company, the indicator shows the ROA is about 28.8 % for the year
2012. Its means that every RM1 that have been invested will get the return on 28.8% profit to the
company. The F&N achieve the higher ratio in 2012 while in 2015 is the lower of the ratio that the
company get.
0
0.05
0.1
0.15
0.2
0.25
0.3
0.35
F&N
RA
TIO
ROA
2012 2013 2014 2015 2016
9 | P a g e
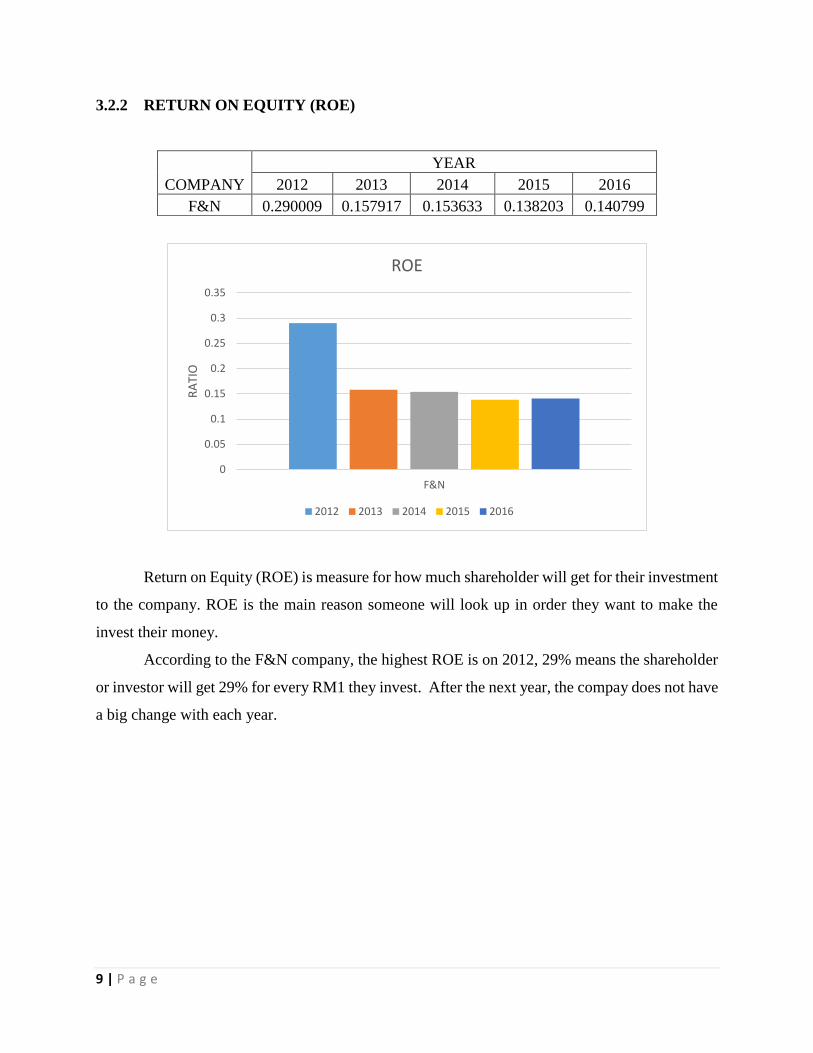
3.2.2 RETURN ON EQUITY (ROE)
COMPANY
YEAR
2012 2013 2014 2015 2016
F&N 0.290009 0.157917 0.153633 0.138203 0.140799
Return on Equity (ROE) is measure for how much shareholder will get for their investment
to the company. ROE is the main reason someone will look up in order they want to make the
invest their money.
According to the F&N company, the highest ROE is on 2012, 29% means the shareholder
or investor will get 29% for every RM1 they invest. After the next year, the compay does not have
a big change with each year.
0
0.05
0.1
0.15
0.2
0.25
0.3
0.35
F&N
RA
TIO
ROE
2012 2013 2014 2015 2016
10 | P a g e
4.0 DISCUSSION AND CONCLUSION
4.1 DISCUSSION
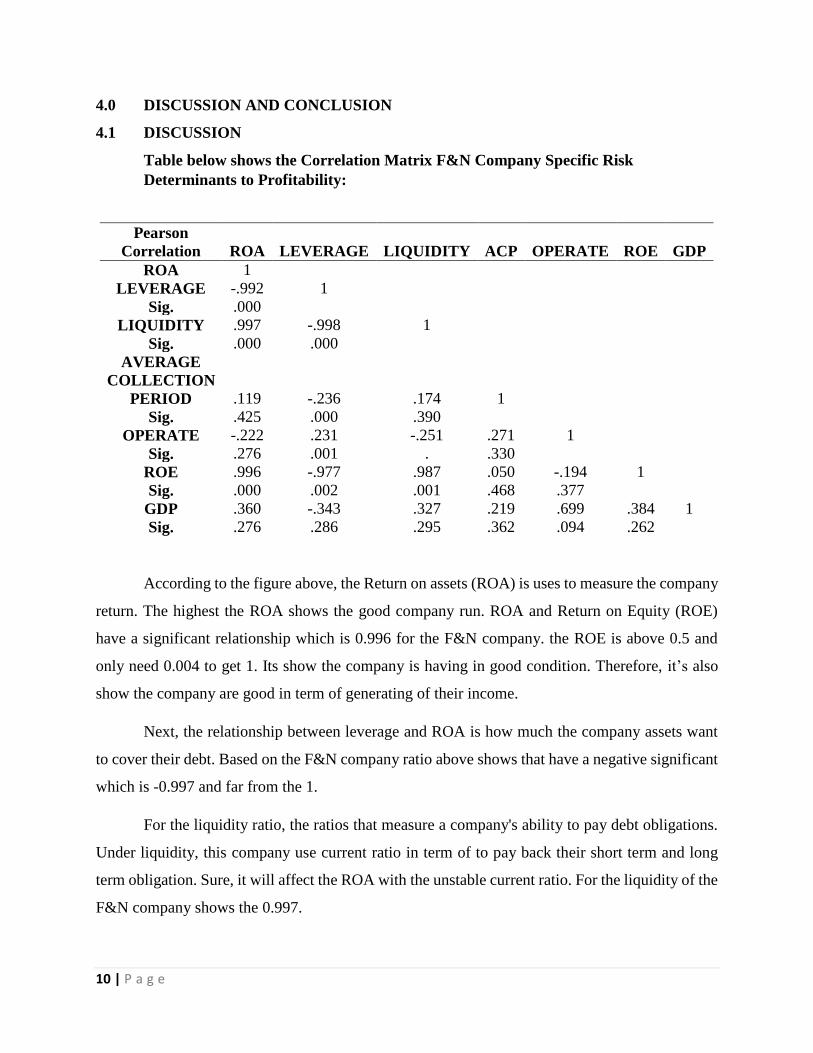
Table below shows the Correlation Matrix F&N Company Specific Risk
Determinants to Profitability:
According to the figure above, the Return on assets (ROA) is uses to measure the company
return. The highest the ROA shows the good company run. ROA and Return on Equity (ROE)
have a significant relationship which is 0.996 for the F&N company. the ROE is above 0.5 and
only need 0.004 to get 1. Its show the company is having in good condition. Therefore, it’s also
show the company are good in term of generating of their income.
Next, the relationship between leverage and ROA is how much the company assets want
to cover their debt. Based on the F&N company ratio above shows that have a negative significant
which is -0.997 and far from the 1.
For the liquidity ratio, the ratios that measure a company's ability to pay debt obligations.
Under liquidity, this company use current ratio in term of to pay back their short term and long
term obligation. Sure, it will affect the ROA with the unstable current ratio. For the liquidity of the
F&N company shows the 0.997.
Pearson
Correlation ROA LEVERAGE LIQUIDITY ACP
OPERATE ROE
GDP
ROA 1
LEVERAGE -.992 1
Sig. .000
LIQUIDITY .997 -.998 1
Sig. .000 .000
AVERAGE
COLLECTION
PERIOD .119 -.236 .174 1
Sig. .425 .000 .390
OPERATE -.222 .231 -.251 .271 1
Sig. .276 .001 . .330
ROE .996 -.977 .987 .050 -.194 1
Sig. .000 .002 .001 .468 .377
GDP .360 -.343 .327 .219 .699 .384 1
Sig. .276 .286 .295 .362 .094 .262
11 | P a g e
Average collection period can be defined as how long about the company can collect back
the sales that has been made on credit basis. The higher the day collecting period will affect ROA
ratio and vice versa. F&N company shows the relation between ROA and Average collecting
period is 0.119.
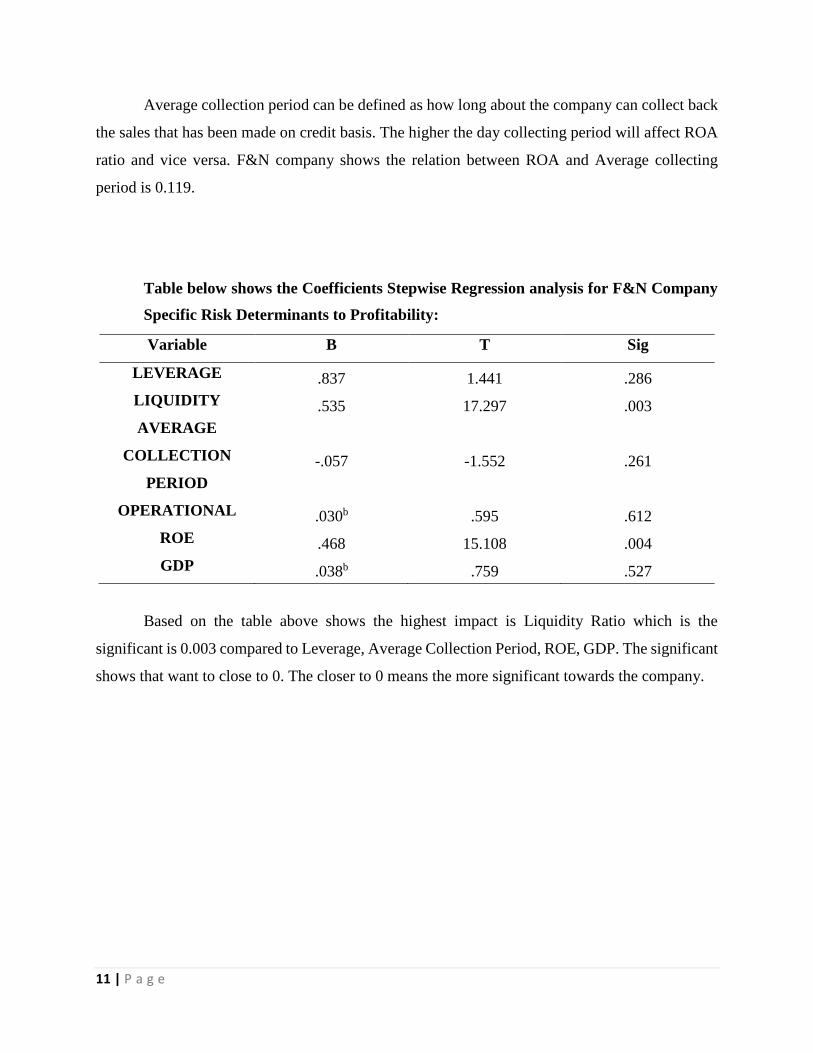
Table below shows the Coefficients Stepwise Regression analysis for F&N Company
Specific Risk Determinants to Profitability:
Variable B T Sig
LEVERAGE .837 1.441 .286
LIQUIDITY .535 17.297 .003
AVERAGE
COLLECTION
PERIOD
-.057 -1.552 .261
OPERATIONAL .030b .595 .612
ROE .468 15.108 .004
GDP .038b .759 .527
Based on the table above shows the highest impact is Liquidity Ratio which is the
significant is 0.003 compared to Leverage, Average Collection Period, ROE, GDP. The significant
shows that want to close to 0. The closer to 0 means the more significant towards the company.
12 | P a g e
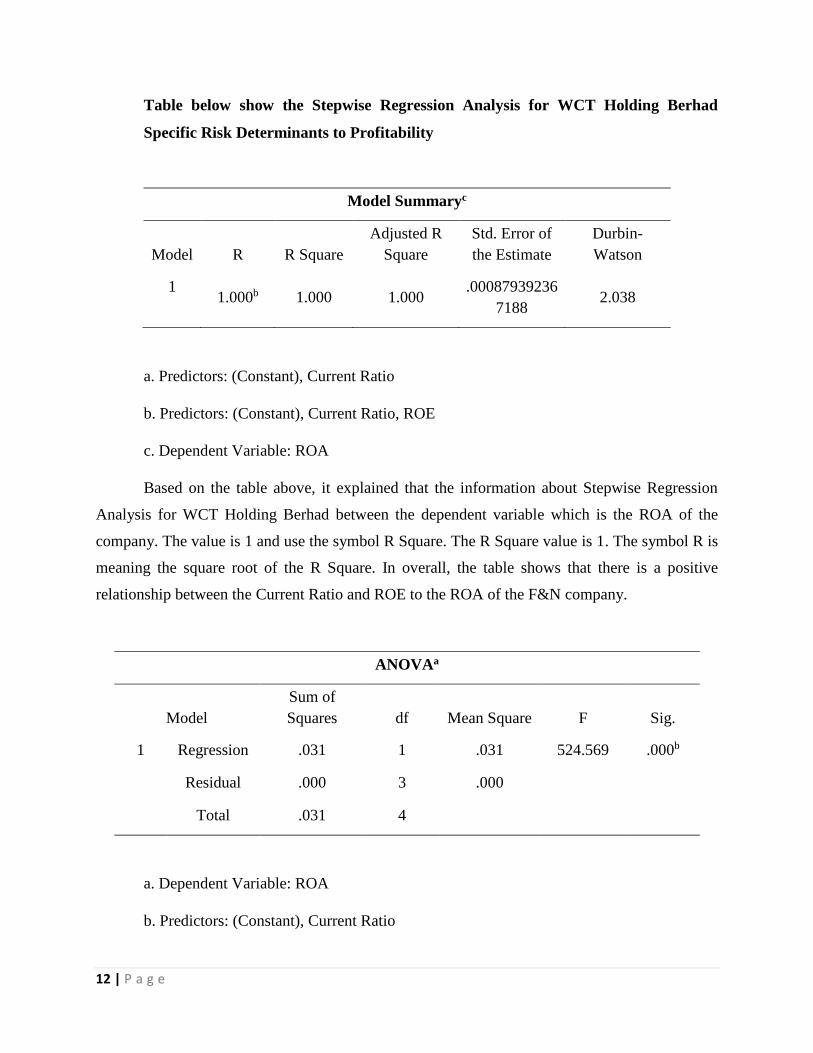
Table below show the Stepwise Regression Analysis for WCT Holding Berhad
Specific Risk Determinants to Profitability
Model Summaryc
Model R R Square
Adjusted R
Square
Std. Error of
the Estimate
Durbin-
Watson
1 1.000b 1.000 1.000
.00087939236
7188 2.038
a. Predictors: (Constant), Current Ratio
b. Predictors: (Constant), Current Ratio, ROE
c. Dependent Variable: ROA
Based on the table above, it explained that the information about Stepwise Regression
Analysis for WCT Holding Berhad between the dependent variable which is the ROA of the
company. The value is 1 and use the symbol R Square. The R Square value is 1. The symbol R is
meaning the square root of the R Square. In overall, the table shows that there is a positive
relationship between the Current Ratio and ROE to the ROA of the F&N company.
ANOVAa
Model
Sum of
Squares df Mean Square F Sig.
1 Regression .031 1 .031 524.569 .000b
Residual .000 3 .000
Total .031 4
a. Dependent Variable: ROA
b. Predictors: (Constant), Current Ratio
13 | P a g e
c. Predictors: (Constant), Current Ratio, ROE
The value is .000 and it less than .05. Because of this, we can conclude that there’s a
statistically significant difference between the mean number 0 words remembered for all the
conditions (ROA, ROE, Current Ratio).
4.2 CONCLUSION
In conclusion, for overall of the F&N Company for the 5 years can see that the company
are having variety of risk such as credit risk, liquidity risk, financial risk and operating risk. There
also cannot be denied that every company or institution also faced the same risk. It depends on
how the company faced the risk either they accept, reduce or transfer the risk. Every risk has a
relationship with the ROA and ROE of the company. As we can see to the F&N Company
performance, it shows the company only perform on the year 2012 only and after the 4 years later,
the company are having conflict or having a bad situation.
Based on the observation, a positive relationship is measured within profitability with the
return on assets (ROA) and return on equity (ROE). Besides, the operational profitability function
is how a company do to manage their company. In addition, the average collection period is about
how many days’ company can collect back their debt. As mention earlier, the average for the 2012
is very low means the company not take long days to collect back. It shows the company are having
in the good condition only for those year but not to the next four years. It’s also will make the
ROA will increase plus give the positive relationship.
Moreover, the negative relationship will make the company become loss. For instance, if
the average collection period of the company is high, will make the company not having profit in
short term. For the recommendation, if company want to focus on profit, the company should focus
and aware about the risk that the company will faced or standby for the risk coming. The best
company is from the best corporate governance which is can handle the good company in good
condition.
14 | P a g e
5.0 REFERENCES
Alman, M. (2012). Shari’ah Supervisory Board Composition Effects on Islamic Banks' Risk
Taking Behaviour. 1-44.
Bursa Malaysia. (n.d.). Retrieved 3 10, 2017, from http://www.bursamalaysia.com/market/
FocusEconomics. (n.d.). Retrieved 3 22, 2017, from Economic Forecasts from the World's
Leading Economists: http://www.focus-economics.com/countries/malaysia Investopedia. (2017).
Retrieved 3 20, 2017, from http://www.investopedia.com/terms/c/currentratio.asp
Kolapo T. Funso, A. R. (2012). Credit Risk and Commercial Banks' Performance in Nigeria: A
Panel Model Approach. Australian Journal of Business and Management Research Vol: 2, 31-38.
Sharifah Norhafiza Syed Ibrahim, H. M. (2007). The Relationship between Corporate Governance
Disclosures and Balance Sheet Ratios. Gading Business and Management Journal Vol: 11, 33-40.
Waeibrorheem Waemustafa, S. S. (2015). Bank Specific and Macroeconomics Dynamic
Determinants of Credit Risk in Islamic Banks and Conventional Banks. International Journal of
Economics and Financial Issues, 476-481.
Waeibrorheem Waemustafa, S. S. (2016). Systematic and Unsystematic Risk Determinants of
Liquidity Risk Between Islamic and Conventional Banks. International Journal of Economics and
Financial Issues, 1321-1327.
Weibrorheem Waemustafa, A. A. (2015). Mode of Islamic Bank Financing: Does Effectiveness of
Shariah Supervisory Boards Matter? .Aust. J. Basic & Appl. Sci., 9(37): , 458


