
Domain of Physiology and Fribourg Cognition Center
Department of Medicine
University of Fribourg
Switzerland
Multisensory integration in non-human primates and
humans
Thesis
Presented to the Faculty of Science of the University of Fribourg (Switzerland)
in consideration for the award of the academic grade of Doctor rerum naturalium
Field : Neuroscience
By
Florian Lanz
From
Switzerland
Thesis No xxxx
Imprimerie Saint-Paul
2013

2
Accepted by the Faculty of Science of the University of Fribourg (Switzerland) upon the
recommendation of Professor Eric Rouiller, Doctor Gérard Loquet, Professor Pierre Lavenex
and Professor Micah Murray.
Fribourg,
Thesis supervisor : Dean :
Prof. Eric Rouiller Prof. Fritz Müller

3
“Qu’importe la surdité de l’oreille, quand l’esprit entend? La seule
surdité, la vraie surdité, la surdité incurable, c’est celle de
l’intelligence”
Victor Hugo à Ferdinand Berthier
“Ce qui est essentiel à la perception sensorielle n’est pas ce qui
sépare les sens les uns des autres, mais ce qui les unit entre eux; à
chacune de nos expériences internes (même non sensorielles) et à
notre environnement.”
Erich von Hornbostel,
The Unity of the Senses, 1927.

4
Acknowledgements
With this paragraph, I would like to extend my grateful thanks to all the people who
have contributed to the outcome of this thesis.
I want first to express my appreciation to Professor Eric Rouiller, my thesis
supervisor, who welcomed me in his research group and allowed me to do this work in the
best conditions. Thank you for your patience, your proofreading, your invaluable piece of
advices and for your presence throughout this path.
Dr. Gérard Loquet please accepts my sincere thanks for your patience, your
availability and your invaluable advices both in professional and private field. Thank you for
all the time that you have spared for the elaboration of Matlab and TDT programs and for all
these proofreadings so important and beneficial.
I sincerely thank Véronique Moret for her advice, for her help and her time dedicated
to the analysis and the creation of multimedia supports (figures and videos). Thank you for
the shared discussions, not always scientifically related.
A big thank you to Joseph Corpataux, Jacques Maillard and Laurent Bossy for taking
care of our animals. Thank you for your help, your advice as for the animal detention. And
thank you for all these good moments spent outside the institute (e.g. dinners shared together).
A thank you to Xavier Lanz and colleagues for their help in the elaboration and the
manufacturing of our various devices.
Thank you to Professor Micah Murray and to Professor Pierre Lavenex, both experts
for my thesis. Thank you for your corrections and for your time.
Thanks to Adjia Hamadjida and Simon Badoud for having shared scientific and not
scientific moments around a coffee or a meal. Thanks to David Michel and Karine Sciboz for
your advice and the dinners shared together.
A special thanks to my parents, my family and Julie for their support without defect and who
helped me to successfully reach the point where I am today.
Finally I must express my appreciation to each collaborator from Professor Eric
Rouiller’s laboratory who welcomed me and with whom I have learned by one way or another
so much in sciences. Thank you for the good atmosphere, the advice and the support.
And thanks to Lionel and Jazz

5
Contents Foreword ................................................................................................................................... 8
Avant-Propos et résumé ......................................................................................................... 10
Glossary ................................................................................................................................... 12
I. Introduction ......................................................................................................................... 17
I.1 Auditory System ............................................................................................................. 17
I.1.1 Theoretical considerations ....................................................................................... 17
I.1.1.1 Anatomy ............................................................................................................ 17
I.1.1.2 Physiology of hearing ....................................................................................... 20
I.1.1.3 Ascending auditory pathway ............................................................................. 23
I.2 Visual system .................................................................................................................. 25
I.2.1 Theoretical considerations ....................................................................................... 25
I.2.1.1 Anatomy ............................................................................................................ 27
I.2.1.2 Physiology of the vision .................................................................................... 28
I.2.1.3 Visual Ascending Pathways .............................................................................. 30
I.3 Somatosensory system .................................................................................................... 32
I.4 Multisensory integration ................................................................................................. 34
I.4.1 Generalities .............................................................................................................. 34
I.4.1.1 Illusions ............................................................................................................. 37
I.4.1.2 Benefits ............................................................................................................. 41
I.4.1.3 Reaction time .................................................................................................... 42
I.4.2 Probabilistic models ................................................................................................. 44
I.4.3 Spatiotemporal perspective ...................................................................................... 45
1.4.4 Types of crossmodal integration ............................................................................. 46
1.4.4.1 Stochastic resonance ........................................................................................ 46
1.4.4.2 Phase coherence ............................................................................................... 47
I.4.5 Neuronal perspective................................................................................................ 48
I.4.5.1 Bayes integration concept ................................................................................. 48
I.4.5.2 Multisensory integration concept ...................................................................... 50
I.4.5.3 Multisensory neurons ........................................................................................ 51
I.4.5.3.1 Superior colliculus ..................................................................................... 51
I.4.5.3.2 Multisensory integration principles ........................................................... 54

6
1.4.5.4 The cortical primary sensory areas ................................................................... 57
I.4.5.4.1 Auditory cortex .......................................................................................... 57
I.4.5.4.2 Visual cortex .............................................................................................. 59
I.4.5.4.3 Somatosensory cortex ................................................................................ 61
I.4.5.4.4 Premotor cortex .......................................................................................... 61
I.4.6 Audio-visual interactions ......................................................................................... 64
I.4.7 Hierarchy of integration of cross modal stimuli ...................................................... 67
I.5 Objective of the Research ............................................................................................... 69
II. General Materials and Methods ...................................................................................... 72
II.1 Subjects .......................................................................................................................... 72
II.1.1 Non-human primates .............................................................................................. 72
II.1.2 Human subjects ....................................................................................................... 73
II.2 Behavioural Protocol ..................................................................................................... 74
II.2.1 Stimuli .................................................................................................................... 74
II.2.2 Sensory-motor task ................................................................................................. 75
II.2.3 Auditory and visual threshold ................................................................................. 76
II.2.4 Multisensory integration ......................................................................................... 77
II.3 Surgery in non-human primates .................................................................................... 78
II.4 Different steps for monkeys behavioural training and CT and MRI acquisition protocol
.............................................................................................................................................. 78
II.4.1 Non-human primates behavioural training ............................................................. 78
II.4.2 CT and MRI acquisition protocol ........................................................................... 80
II.5 Electrophysiology .......................................................................................................... 83
II.5.1 Single-unit recordings in non-human primates....................................................... 83
II.5.2 Electroencephalography (EEG) in the human subjects .......................................... 83
II.6 Timeline in non-human primates ................................................................................... 85
II.7 Article in methodology .................................................................................................. 87
III. Results ............................................................................................................................... 98
III.1 Non-human results ....................................................................................................... 98
III.2 Human results ............................................................................................................. 115
III.2.1 Introduction ......................................................................................................... 115
III.2.2 Material and Methods: ........................................................................................ 116
III.2.3 Results ................................................................................................................. 117
III.2.3.1 Reaction Times (RTs): multisensory facilitation ......................................... 117

7
III.2.3.2 Stimuli intensity effects on RTs ................................................................... 121
III.2.3.3 Bimodal gain ................................................................................................ 125
III.2.3.4 Electrophysiological results ......................................................................... 126
III.2.3.4.1 Global Field Potential (GFP) ................................................................. 128
III.2.3.4.2 ERP topography .................................................................................... 129
III.2.3.4.3 Source estimation .................................................................................. 130
III.2.4 Discussion ........................................................................................................... 131
IV. General Discussion ......................................................................................................... 134
IV.1 Methodology .............................................................................................................. 134
IV.2 Behavior .................................................................................................................... 138
IV.2.1 Behavior in non-human primates ........................................................................ 139
IV.2.2 Behavior in human subjects ................................................................................ 143
IV.3 Electrophysiology ...................................................................................................... 145
IV.3.1 Neuronal recordings in non-human primates ...................................................... 146
IV.3.2 Electrophysiological recordings (EEG) in humans ............................................. 149
IV.4 Necessity to evaluate the behavior and the electrophysiology................................... 153
IV.5 Perspectives ................................................................................................................ 153
V. References ........................................................................................................................ 155
VI. Appendix ......................................................................................................................... 176
VII. Curriculum Vitae ......................................................................................................... 181

8
Foreword
The multisensory integration concept does not date from the 80s or the 90s of the past
century, but it takes its origin in much older times. Indeed, this concept was developed by
Aristote (384-322 BC), Greek philosopher. His question was: "How the human acquires the
events perceptual experience of the outside world?" In modern terms, we could ask how we
can perceive our outside environment by integrating various stimuli resulting from different
modalities.
It seems that this perception cannot occur without our 5 senses and without a
coordinator, the brain, able to integrate this information and process it in order to generate an
adequate action (behavioural response). To achieve such a complex integration task, various
regions of the brain are devoted to each of our sensory modalities. Generally, every modality
is optimized for what it is defined. Nevertheless, and according to Aristotle's rules, the brain
would it not gain to create a synergy between these modalities, with the aim of improving our
perception? This question turns into an affirmation, because when an event, an action implies
several modalities at the same time, and in the corresponding space, the brain is able to
integrate this various information in a unified perception. This phenomenon, commonly
named "multisensory integration", underlies certain interactions during the integrative
processes. These effects can be expressed as profits (e.g. decrease of the reaction time for the
task execution, better performance) or as deficits (illusions: ventriloquism, McGurk effect).
To understand these multisensory integration phenomena, it is necessary, from a
neurological point of view, to determine where and how these various attributes are
processed. Since around thirty years, numerous studies conducted on animals allowed to
better address this issue and to establish general principles of multi-modal integration. These
studies also allowed to demonstrate that the multisensory integration does not occur only in
associative areas, but earlier already in unisensory areas (e.g. auditory areas, visual area, etc).
Several studies showed the existence of intra-cortical connectivity between the auditory and
visual area, but few investigations so far were focused on a possible role played by the
premotor cortex, a sensorimotor area of convergence (auditory, visual information and
somatosensory), leading to the preparation and the organization of a motor (behavioural)
response. Indeed, the premotor area is very important in the initiation of voluntary
movements, especially when activated by external stimuli. To assure a fast behavioural
response, particularly a reaction time decreased when triggered by a multimodal stimulation,

9
the presence of connections between the premotor cortex and subcortical areas, such as the
superior colliculus and the thalamus seems plausible. The goal of the present study was first
to validate a bimodal behavioral detection task in primates (both monkeys and human
subjects) and collect behavioral and electrophysiological data in non-human primates (n=2)
and in humans (n=14). We evaluated various multisensory criteria bound to the multisensory
behavior (reaction time, performance, errors) and, in a second step, derived
electrophysiological data from the premotor cortex in the non-human primates and from the
whole brain in human subjects, all when performing the same behavioral detection task.
The behavioural results obtained in this study demonstrated a reaction time decrease in
multimodal condition (visuo-acoustic), as compared with a unisensory condition (visual or
acoustic alone). In animals (monkeys), this bimodal gain, or facilitatory effect, followed the
principle of inverse effectiveness: the higher the intensity of the stimuli, the smaller is the
facilitatory effect. This principle of inverse effectiveness was not verified in the human
subjects in the present experimental conditions. Concerning the electrophysiological results,
the single unit recordings conducted on monkeys in the premotor cortex showed this presence
of neurons responding to acoustic or to visual stimuli, however with a change of response
when these two stimuli were presented simultaneously. This observation suggests the
existence of multisensory integration process in the premotor cortex at neuronal level. The
neuronal activities observed in relation to the detection behavioral paradigm in the premotor
cortex allowed us to define two classes of neurons, namely "Response pattern” and
“Modulation pattern”. In humans, the results derived from EEGs revealed the presence of
early neural activities possibly linked to multisensory integration and taking place from 60
msec post-stimulation.
This work has allowed us to better understand some of the neuronal processes
involved in multi-modal integration, in particular at the level of the premotor cortex in the
non-human primates, as a contributor to a larger network possibly involving also subcortical
areas like the thalamus. Furthermore, the studies conducted in parallel in human subjects,
using the same protocol as in the non-human primates, will allow future transfer of
knowledge towards clinical questions.
10
Avant-Propos et résumé
Le concept d’intégration multisensorielle ne date pas des années 80 ou 90 mais
remonte à des temps bien plus anciens. En effet, ce concept a été développé par le philosophe
grec Aristote (384-322 av. J.-C.) qui se demandait «Comment l’homme acquiert l’expérience
perceptuelle des évènements du monde extérieur?». En des termes plus contemporains on
pourrait se demander comment on peut percevoir notre environnement extérieur en intégrant
différents stimuli provenant de modalités différentes.
Il apparaît que cette perception extérieure ne peut pas avoir lieu sans nos sens et sans
un chef d’orchestre, le cerveau, capable d’intégrer ces informations et de les traiter pour
générer une action adéquate (réponse comportementale). Pour ce faire, différentes régions du
cerveau sont dévolues à chacune de nos modalités sensorielles. D’une manière générale,
chaque modalité est optimisée pour ce pour quoi elle est définie. Néanmoins, et selon les
préceptes d’Aristote, le cerveau ne gagnerait-il pas à créer une synergie entre ces modalités
dans le but d’améliorer notre perception? Cette question est une affirmation, car lorsqu’un
événement, une action implique plusieurs modalités en même temps, et dans un même espace,
le cerveau est capable d’intégrer ces différentes informations de manière unifiée. Ce
phénomène, communément nommé «intégration multisensorielle», induit certaines
interactions lors des processus intégratifs. Ces effets peuvent se traduire en tant que bénéfices
(par exemple, diminution du temps de réaction pour l’exécution d’une tâche, augmentation de
la performance) ou en tant que déficits (illusions: ventriloquisme, effet McGurk).
Pour comprendre ces phénomènes d’intégration multisensorielle, il s’avère nécessaire,
d’un point de vue neurologique, de déterminer où et comment ces différentes informations
sont traitées. Depuis une trentaine d’années, de nombreuses études menées chez les animaux
ont permis de mieux appréhender ce point et ainsi d’établir les principes fondamentaux de
l’intégration multi-modale. Ces études ont également permis de démontrer que l’intégration
multisensorielle n’a pas lieu que dans des aires associatives mais également plus en amont au
niveau d’aires unisensorielles (e.g. aire auditive, aire visuelle,….). Plusieurs études ont mis en
avant cette intra-connectivité entre l’aire auditive et l’aire visuelle, mais peu se sont
intéressées au cortex prémoteur, lieu de convergence sensoriel (informations auditives,
visuelles et somatosensorielles) en vue de la préparation et de l’organisation d’une réponse
motrice. Cette aire motrice est en effet très importante dans l’initiation du mouvement,
déclenché à partir de stimuli externes. Pour assurer une réponse comportementale rapide, plus
particulièrement un temps de réaction raccourci suite à la présentation d’une stimulation

11
multimodale, l’existence de connections entre le cortex prémoteur et des régions sous
corticales telles que le colliculus supérieur et le thalamus paraît vraisemblable. C’est cette
analyse qui a été entreprise dans le présent travail en effectuant différents tests, dont des
enregistrements comportementaux et électrophysiologiques chez le primate non-humain (n=2)
et des enregistrements comportementaux et de potentiels évoqués chez l’humain (n=14). Nous
avons étudié différents critères multisensoriels liés au comportement (temps de réaction,
performance, erreurs) et aux données électrophysiologiques collectées lors de l’intégration
audio-visuelle au niveau du cortex prémoteur chez le primate non-humain et de l’ensemble du
cerveau chez l’humain.
Les résultats comportementaux obtenus dans ce travail ont démontré une diminution
du temps de réaction en stimulation multimodale en comparaison aux conditions
unisensorielles. Chez les animaux ce gain bimodal, ou effet facilitateur communément appelé
principe d’efficacité inverse, établit que plus l’intensité de stimulation augmente moins l’effet
facilitateur est présent. Ce principe n’a pas été retrouvé chez l’être humain dans les conditions
expérimentales testées dans le présent protocole. En ce qui concerne les résultats
électrophysiologiques, les enregistrements effectués chez les animaux ont démontré que le
cortex prémoteur comprend bien des neurones qui sont influencés par des stimuli aussi bien
auditifs que visuels et que, surtout, ces réponses sont différentes lorsque que ces mêmes
stimuli sont présentés de manière simultanée. Cette observation suggère la présence d’une
intéraction multisensorielle au niveau neuronal dans le cortex prémoteur. Les enregistrements
neuronaux dans le cortex prémoteur ont montré la présence de deux grandes classes de
neurones influencés par la tâche de détection comportementale, que l’on a désignées par
patrons de «réponses» et patrons de «modulations». Chez l’humain, pour la même tâche
comportementale, les résultats obtenus par EEG révèlent des activités neuronales précoces à
partir de 60 msec post-stimulation, en relation avec une possible interaction bimodale.
Ce travail nous a permis de mieux comprendre les processus neuronaux impliqués
dans l’intégration multi-modale au niveau du cortex prémoteur et s’intègre dans une étude
globale visant à mettre en relation ces processus propres à cette région cortical et ceux
régissant l’intégration multisensorielle dans d’autres régions du cerveau faisant partie d’un
même réseau, par exemple au niveau du thalamus. Ceci dans un but d’approfondir d’un point
de vue électrophysiologique les découvertes faites préalablement en anatomie. De plus, les
études menées en parallèle chez l’homme avec le même protocole que celui utilisé chez les
primates non-humains permettront dans le futur d’effectuer un transfert direct de la
connaissance acquise vers d’éventuelles applications cliniques.

12
Glossary
A Auditory stimulus
AD Alhzeimer’s disease
AP Action Potential
AES Anterior Ectosylvian Sulcus
AEV Anterior Ectosylvian Visual area
ASD Autism spectrum disorders
FAES Auditory field of the Anterior Ectosylvian Sulcus
BM Basilar Membrane
CN Caudal Nucleus
CNS Central Nervous System
CIC Central nucleus (Inferior Colliculus)
DSC Deep layer of Superior Colliculus
DCIC Dorsal Cortex (Inferior Colliculus)
EAM External Auditory Meatus
ECX External Cortex (Inferior Colliculus)
EEG Electroencephalogram
EP Evoked potential
ERP Event-related Potential
FG Fusiform Gyrus

13
fMRI Functional magnetic resonance imaging
FST Fundus of the Superior Temporal visual area
GFP Global Field Power
IC Inferior Colliculus
ICC Inferior Colliculus central nucleus
ICP Pericentral nucleus of the Inferior Colliculus
ICX External nucleus of the Inferior Colliculus
IHCs Inner Hair Cells
IT Inferior Temporal cortex
ITG Inferior Temporal Gyrus
LGN Lateral Geniculate Nucleus
LIP Lateral Intraparietal area
LSO Lateral Superior Olive
MGN Medial Geniculate Nucleus
MIP Medial Intraparietal area
MNTB Medial Nucleus of the Trapezoid Body
MSO Medial Superior Olive
MST Medial Superior Temporal visual area
OHCs Outer Hair Cells
PhR Photoreceptors
14
PM Premotor Cortex
PMd Dorsal Premotor Cortex
PMv Ventral Premotor Cortex
POI Period of Interest
PPC Posterior Parietal Cortex
ROI Region of Interest
RT Reaction Time
SEM Scanning Electron Microscope
SIV Somatosensory area of AES
SAI Stratum Album Intermedium
SAP Stratum Album Profundum
SC Superior Colliculus
SGI Stratum Griseum Intermedium
SGP Stratum Griseum Profundum
SGS Stratum Griseum Superficiale
SN Substantia Nigra
SO Stratum Opticum
SO Superior Olive
SOAs Stimulus Onset Asynchronies
SOC Superior Olivary Complex

15
STP Superior Temporal Polysensory area
STS Superior Temporal Sulcus
SZ Stratum Zonale
TBW Temporal Binding Window
V Visual stimulus
VA Visuo-acoustic stimulus
VIP Ventral Intraparietal area
Cross modal stimuli: Stimuli from two or more different sensory modalities. This
must not be mixed up with the word “multisensory”.
Multisensory integration: Neuronal process by which information is integrated and
processed from cross modal stimuli.
Multisensory neuron: Neuron responding to stimuli originating from two or more
sensory modalities.
Additivity: Response which is the exact arithmetic sum of the responses to
the separate unisensory stimuli.
Subadditivity: Response which is below the arithmetic sum of the responses to
the separate unisensory stimuli.
Superadditivity: Response which exceeds the arithmetic sum of the responses to
the separate unisensory stimuli.
Multisensory enhancement: When the response from the cross-modal stimulus is greater
than the most effective of its unisensory stimuli.

16
Multisensory depression: When the response from the cross-modal stimulus is less than
the most effective of its unisensory stimuli.
Inverse effectiveness: The degree of multisensory integration increases as the
responsiveness to unisensory stimuli decreases.
Receptive field: Represents a region of space in which a stimulus can alter the
neuronal spiking. This concept can be extended to the neural system.

17
I. Introduction
Before going into the depth of various concepts regarding multisensory integration, we
shall briefly introduce the three main sensory modalities (auditory, visual and
somatosensory), which have been considered in the multisensory literature, and briefly
present here each of them from an individual point of view. These few introductory
paragraphs aim at grasping the fundamental principles rather than describing each sensory
modality into great details.
The first part of this basic introduction will be dedicated to the auditory system and
has been extracted from my Master’s degree thesis conducted in the same laboratory.
I.1 Auditory System
I.1.1 Theoretical considerations
The auditory system consists of several structures arranged in series and in parallel
controlling different functions, all aiming towards a common point which is the acoustic
signal perception. The auditory system includes a peripheral part, the ear, and a central part,
the central auditory system. The ear can be further split into three different structures
(external, middle and inner ear), both from anatomical and functional point of views (Bear et
al., 2002; Faller et al., 1999; Haines, 2002; Monney-Jacomme, A.-V., 2004). The part of the
inner ear devoted to the control of balance (vestibular system) is not considered here.
I.1.1.1 Anatomy
External ear
The external ear (Figure 1), the visible part of the auditory system, is composed of the
pinna (or auricle) and the external auditory meatus (EAM). The border between the external
and the middle ear is a thin membrane, the tympanic membrane (or the eardrum) able to
vibrate in response to a variation of air pressure in the environment.

18
Figure 1: Anatomy of the peripheral auditory system. Modified from http://www.yournursingtutor.com/wp-content/uploads/2012/06/9727799_l.jpg.
Middle ear
The middle ear (Figure 1) is formed by four structures: the tympanic membrane, the
tympanic cavity, the ossicular chain and the Eustachian tube.
The tympanic membrane forms a hermetic separation between the EAM and the
tympanic cavity which is an air-filled space in the temporal bone. The first bone of the
ossicular chain, the malleus, is in contact with the tympanic membrane. The two other
ossicles, the incus and the stapes, associated with the malleus close the connection with the
oval window. This chain of ossicles, maintained in place with two small muscles (tensor
tympani and stapedius) forms the arms of a control lever, contributing to the amplification of
the acoustic signal (1.4 times). However, the main amplification of the acoustic signal in the
middle ear is performed by the principle of surface ratio “tympanic membrane / oval window
membrane”, with a gain of about 17 times. The equal air pressure distribution between the
external and the middle ear is ensured by the Eustachian tube which communicates with the
nasopharynx.

19
Inner ear
The middle ear is separated from the inner ear by the membrane of the oval window.
The inner ear (Figure 1) is located in the petrous part of the temporal bone, and can be divided
into an acoustic and a vestibular (not treated here) part.
The acoustic part is located in the spiral osseous labyrinth: the cochlea. Within the
cochlea two membranes separate three scala: the scala vestibuli, the scala media and the scala
tympani (Figure 2). The scala vestibuli is separated from the scala media by the Reissner’s
membrane and the scala media from the scala tympani by the basilar membrane (BM). The
scala tympani and the scala vestibuli contain an extracellular fluid, the perilymph, for which
the ionic composition is comparable to the one observed in extracellular fluid, such as plasma
or cerebrospinal fluid (in other words rich in sodium (Na+). The scala media contains
endolymph, an extracellular fluid paradoxically rich in potassium (K+).
Figure 2: Artistic view of a human cochlea. Modified from http://www.elu.sgul.ac.uk/rehash/guest/scorm/183/package/content/cochlea_cross_section.html and http://lyricsdog.eu/s/biomedical%20illustration.
The BM supports many sensory and accessory cells, which all form the organ of Corti (Figure
2). The sensory cells are hair cells, supporting on their surface bundles of approximately 100
stereocils interconnected by tip links which control the opening of cations channels (mainly
potassium). The hair cells can be distinguished according to their localization and their
arrangement on the BM (Figure 3). The inner hair cells (IHCs) form a simple row from base
to apex, whereas the outer hair cells (OHCs) form three parallel rows which follow the same

20
course. The organ of Corti is covered by fine colourless gelatinous fibers, the tectorial
membrane, which is attached to the limbus of the osseous spiral lamina (Figure 3), close to
the vestibular canal. This tectorial membrane is in contact with the stereocils of the OHCs but
not with the stereocils of the IHCs.
Figure 3: Scanning electron microscope (SEM) microphotography (X1300) of the OHC and IHC from Loquet et al., 1999 (reproduced with permission).
I.1.1.2 Physiology of hearing
The pinna contributes to the localization of the sound source. Sound is then
transmitted to the eardrum by the external auditory meatus (EAM), which selectively
amplifies specific frequencies (from 0.5 to about 5 kHz in human). Under the influence of the
sound, the eardrum vibrates and transmits its oscillatory movements via the ossicular chain
(middle ear) to the membrane of the oval window. This chain plays a role in the amplification
and attenuation (role of ear protection in response to high intensity) of the oscillatory
movement. The ossicular chain allows the passage of sound wave from aerial to liquid
environment (internal ear), with a theoretical loss of energy however compensated by the two
mechanisms of amplification taking place in the middle ear (see above).
When the membrane of the oval window begins to vibrate during the sound emission,
the engendered movements of the endolymph creates waves of propagation through the BM
up to the apex. The amplitude and the distribution of the wave depend on the intensity and the
21
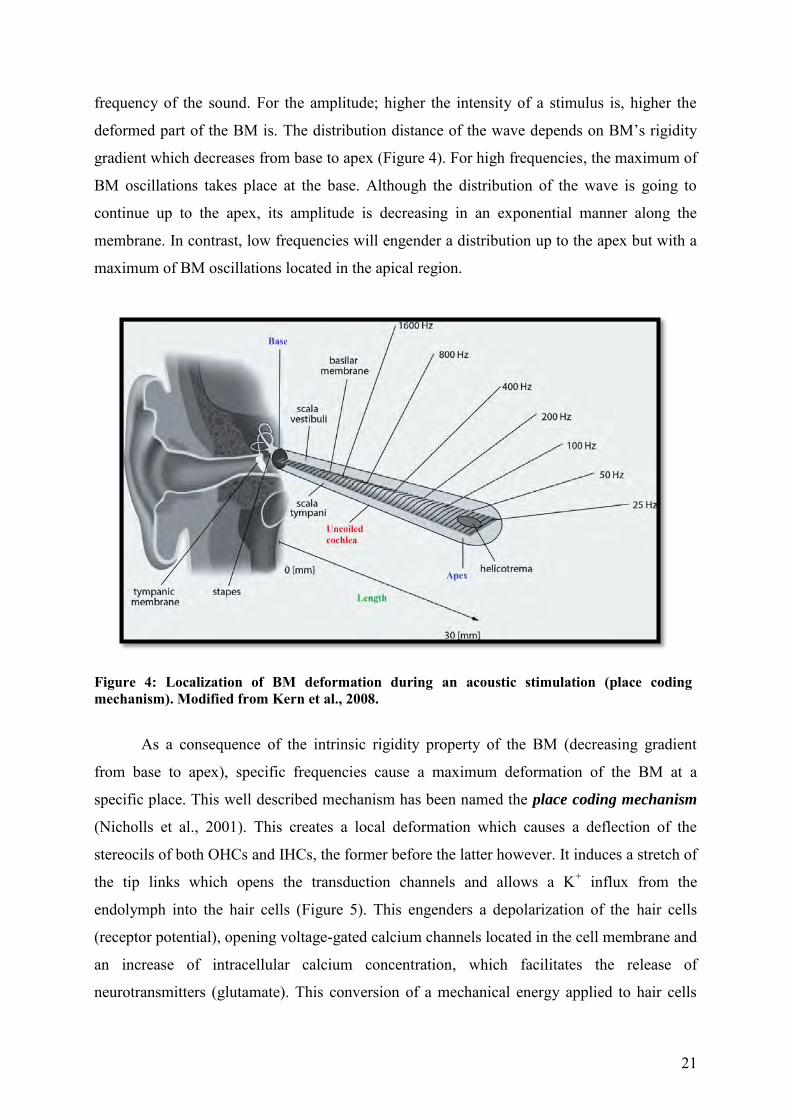
frequency of the sound. For the amplitude; higher the intensity of a stimulus is, higher the
deformed part of the BM is. The distribution distance of the wave depends on BM’s rigidity
gradient which decreases from base to apex (Figure 4). For high frequencies, the maximum of
BM oscillations takes place at the base. Although the distribution of the wave is going to
continue up to the apex, its amplitude is decreasing in an exponential manner along the
membrane. In contrast, low frequencies will engender a distribution up to the apex but with a
maximum of BM oscillations located in the apical region.
Figure 4: Localization of BM deformation during an acoustic stimulation (place coding mechanism). Modified from Kern et al., 2008.
As a consequence of the intrinsic rigidity property of the BM (decreasing gradient
from base to apex), specific frequencies cause a maximum deformation of the BM at a
specific place. This well described mechanism has been named the place coding mechanism
(Nicholls et al., 2001). This creates a local deformation which causes a deflection of the
stereocils of both OHCs and IHCs, the former before the latter however. It induces a stretch of
the tip links which opens the transduction channels and allows a K+ influx from the
endolymph into the hair cells (Figure 5). This engenders a depolarization of the hair cells
(receptor potential), opening voltage-gated calcium channels located in the cell membrane and
an increase of intracellular calcium concentration, which facilitates the release of
neurotransmitters (glutamate). This conversion of a mechanical energy applied to hair cells

22
into an electrical energy (receptor potential) is known as the transduction phenomenon. In
addition, the hair cells are tuned mechanically because the fibers along the BM are
specifically activated when a frequency is received. This selectivity principle is named
cochleotopic or tonotopic map for frequency. These mechanical properties should be
understood with the electric characteristics of the cells’ membrane. Indeed IHCs
depolarizations play a role in sound detection and inform the brain about vibration
occurrences within the organ of Corti. OHCs have a role essentially restricted locally in the
cochlea, in the coding of signal amplitude and frequency selectivity through the well-known
cochlear amplifier mechanism. This role of the OHCs relies on the electromotility properties
of the OHC bodies thanks to a transmembrane protein, the prestine (Médecine/science, 2001;
Tang et al., 2005), identified by Zheng et al. in 2000.
Figure 5: Principle of electromotility. a) When the basilar membrane undergoes a deformation the tectorial membrane slides over the hair cells and deforms the stereocils. b) The stereocils bending opens the k+ channels and depolarizes the hair cells. Modified from From Neuron to
brain (Nicholls et al., 2001).
It is important to note that the site of the BM deformation is the same for all stimuli in
the range of 70 Hz to 200 Hz where no neurons were found. This shows that frequency
selectivity cannot only be explained with mechanical and electrical mechanism (Bear and al.,
2002). The complementary system to the cochleotopic map that has been assumed is the
phase-locking mechanism (Köppl C., 1997), which is a general mechanism in sensory
physiology. In the auditory system, this mechanism shows, in response to tones of low
frequencies, a close correlation (synchronization) between neuronal discharges and each

23
period of a sinusoidal sound wave (Figure 6). Phase-locking (temporal coding) is believed to
contribute frequency analysis for frequencies going from 20 Hz to about 4 kHz. For
intermediate frequencies, stimulus frequency coding is performed by a tonotopic mechanism
plus a phase-locking one. For high frequencies, the phase-locking synchronisation disappears
and only tonotopic mechanisms become effective. This complementary system has been
confirmed by Moore (1973) who has demonstrated that place and temporal mechanisms play
together a role in pitch discrimination. According to Moore (1973), the temporal coding
mechanism would be more efficient for frequencies below 5 kHz, whereas the place
mechanism is in charge of frequencies above 5 kHz.
Figure 6: Phase-locking mechanism as a function of sound wave’s -frequency. Modified from Bear et al., 2002.
I.1.1.3 Ascending auditory pathway
Neural inputs, which originate from the ganglion of Corti, travel through the tract of
axons which form the cochlear root of the auditory nerve (VIIIth cranial nerve, Figure 7). This
nerve contains around thirty thousand of axons (originating from the thirty thousands of
primary auditory neurons in the spiral ganglion, distributed into type I (dominant, about 90%)
fibres and type II nerve fibres (about 10%). These axons follow a pathway punctuated with

24
groups of neurons, the cochlear nuclei, which aim at refining the processing of the auditory
information. The first encountered nucleus is the cochlear nucleus (obligatory synapse on the
secondary auditory neurons) and the entry point is the ventral root (giving access to the more
voluminous ventral cochlear nucleus), followed by the dorsal cochlear nucleus. These nuclei
considered as the first site of neuronal processing are situated, in the auditory region of the
fossa rhomboidea. The following nucleus along the auditory pathways, located in the pons, is
the superior olivary complex (SOC), which represents an important component in both
ascending and descending auditory pathways. In addition, the SOC is the main first station at
which the information from each ear converges. The SOC further splits between the lateral
superior olives (LSO), the medial superior olive (MSO) and the medial nucleus of the
trapezoid body (MNTB). In the SOC, the interaural time difference is discriminated mainly
by the MSO and the interaural intensity difference mainly by the LSO. A further (third)
essential nucleus along the auditory pathways is the inferior colliculus (IC), representing an
obligatory relay for most of the afferent information that will be transferred later to the
auditory thalamus. Some neurons of the cochlear nuclei and SOC may project indirectly to the
IC, via the nucleus of the lateral lemniscus (Figure 7). From an anatomical point of view, the
IC is subdivided into three parts (Rockel et al., 1973 a and b): the central nucleus (ICC), the
pericentral nucleus (ICP) and the external nucleus (ICX). From a physiological point of view,
the IC allows the detection and the discrimination of a sound wave amplitude change, named
pitch detection. Interestingly with regard to the theme of this thesis, it was demonstrated that
the ICX responds to sensory stimuli other than acoustics. In particular, Aitkin et al. (1978)
demonstrated that some bimodal neurons respond to auditory and tactile stimuli. The
following relay is the medial geniculate bodies, component of the thalamus (thalamic relay
system). These relays are reached thanks to the lateral lemniscus: tract of axons having the
form of a ribbon. The lemniscus is a beam of ascending and crossed fibers for the greater part.
The lemniscus, as mentioned previously of ends in the medial geniculate body, which turns
out to be the seat of the central neurons. From there, axons pass by the acoustic radiation to
terminate in the primary auditory cortex, being in the superior temporal convolution. The
primary auditory cortex is the first region to receive auditory input at cortical level.
Based on this simplified introduction, we can notice that the auditory system is
complex, and that it is totally adapted to the perception of complex sounds, in particular it can
analyse efficiently and discriminate the frequency (Hz), the intensity (dB), and the
localization of sounds.

25
Figure 7: Representation of the auditory pathways. From the website: http://www.neuroreille.com/promenade/english/audiometry/ex_ptw/explo_ptw.htm. (All rights reserved © 1999 – 2007).
I.2 Visual system
This second introductory chapter is dedicated to the visual system. As mentioned
earlier the aim is not to get into details but to make a brief overview of the visual system.
I.2.1 Theoretical considerations
Light is a set of electromagnetic waves visible for the human eyes. We are speaking
here of wavelengths ranging from 380 to 780 nm, where every wavelength corresponds to a
colour (Figure 8). For example, blue is located around 400 nm, green around 500 nm and red
around 700 nm. It is Isaac Newton who demonstrated during the XVIIIth century that the mix
of the wavelengths emitted by the sun is perceived as a white colour, whereas a light source of
a single wavelength produces a single colour belonging to the rainbow’s palette.

26
Figure 8: Wave spectrum. From the site: http://www.pion.cz/en/article/electromagnetic-
spectrum.
In space, light moves straight till it encounters obstacles like objects and molecules. There it
interacts through either:
- A reflection by changing its movement direction (as a function of the angle
between the incident beam of light and the object surface),
- An absorption by transferring its energy to a particle or a surface,
- A refraction when the beam of light is deviated when passing from a more or less
transparent environment to another.
This latter type of interaction takes place in the eye where differentiation of darkness and
colours happens.
As introduced in the auditory system and in analogy to this paragraph (in the § I.1.1),
the visual system is composed of structures arranged in series and/or in parallel controlling
different functions and processing the visual information to obtain a complex and unified
visual cue perception.
The visual system includes a peripheral part, the eye, and a central part, the central
visual system (Bear et al., 2002; Faller et al., 1999). Contrary to the auditory system it is not
possible to divide the eye according to its anatomy or its function. Indeed, as the ear, the eye

27
receives the physical stimulus (light in that case) but, in addition and in contrast to the ear,
already performs in the eye a highly sophisticated processing of the incoming information at
the level of the retina (in the § I.2.1.2).
I.2.1.1 Anatomy
The peripheral part of the visual system, the eye, consists in different parts (Figure 9).
On the exposed side of the eyeball, the pupil is an opening which allows the entry of the light
inside the eyeball up to the retina. The pupil looks black due to the presence of retinal
pigments which absorb the light. The pupil acts as an optical system where the diaphragm
controls the quantity of light which is entering by modifying the diameter of its opening. Such
opening of the pupil is controlled by a circular muscle: the iris. The colour of the iris is
determined by the concentration of melanin which is also an essential pigment of the skin and
the hair. The iris and pupil are covered by the cornea which receives its blood supply from a
point situated below the aqueous humor. The cornea is prolonged by the white of the eye or
the sclera which forms the stiff wall of the eyeball. The eyeball is mobile and its movements
are guaranteed by three pairs of muscles inserted into the sclera. However these muscles are
not visible because they are behind a transparent mucous membrane which hides the inside of
the eyelids and unites them with the eyeball. This membrane produces the mucus which
greases the surface of the eye. In the back of the eye is a surface of about 0.5 mm in thickness
and covering 75 % of the eyeball: it is the retina. It forms the sensory part of the visual
receptor. Indeed, this layer allows, via specialized photoreceptors, the transformation of light
(electromagnetic energy) into bio-electric energy (receptor potentials first and then action
potentials). This transduction phenomenon happens within the retina which is considered to
be an integral part of the brain. From a functional point of view, the eye is very similar to a
camera by catching a sharp image of our world onto the retina. The optical nerve, formed by
the axons originating from the retina (the so-called ganglion cells), leaves the eye from the
back, goes out of the orbits, and travels at the base of the brain near the pituitary gland. It
joins the central visual pathway which will be more detailed in paragraph I.2.1.3.

28
Figure 9. Representation of the eyeball structure. Modified from the site:
http://www.eyezonemedical.com/?page_id=386.
I.2.1.2 Physiology of the vision
Visual perception requires the existence of photoreceptors (PhR) which are
photosensitive cells. These receptors can be divided into two classes: cones and rods. These
two photoreceptors present similar structure and function (transduction of the light in the
external segment), but are different in their response delays and their sensitivity.
1 ° Cones: Cones contain one specific pigment which turns out to be sensitive to a certain
range of wavelengths. Generally, across cones, there are three different pigment types which
absorb green light (531 nm), blue light (419 nm), or red light (559 nm). This sensitivity to
three colours allows humans and non-human primates to see in colour during daylight and
that is called photopic vision (or macular). The absence of one or several cone types makes
the retina insensitive to the corresponding wavelengths. It is the case for patients suffering
from color-blindness, dischromatopsies or achromatopsies. From a quantitative point of view,

29
the number of cones decreases as we go away from the centre of the fovea. As a consequence,
colour vision corresponds to the central vision (fovea).
2° Rods: In contrast to the cones, the rods have slow responses and express a sensitivity in
night-vision (known as scotopic vision or peripheral vision). By definition, this vision is only
in black, white and nuances of grey, because rods do not absorb colours. However rods play a
role in movements’ detection in association with the visual cortex. Rods’ density is maximal
in periphery of the retina and decreases when we approach the fovea.
The visual information resulting from the phototransduction made by the photoreceptors is
transmitted to other cells that can be considered as kind of interneurons (although they do not
all generate action potentials, but rather slow potentials, such as the bipolar cells). These cells
correspond to the different layers of bipolar cells, amacrines cells and horizontal cells and are
connected to the ganglion cells (true neurons), which axons will form the optic nerve. The
ganglion cells play an important role in the temporal and spatial coding of the light admitted
onto the retina. It is important to note that the light must cross all the retinal (transparent)
layers first before reaching the photoreceptors.
Retinal ganglion cells: These neurons have a receptive field of circular shape and formed by
photoreceptors, horizontal cells and bipolar cells. This receptive field is usually divided into
two parts: the center and the surround with an antagonism center-surround. More precisely,
there are two types of ganglion neurons: center-ON and center-OFF. Cells center-ON present
an excitation when the center is stimulated by a light whereas an inhibition is produced when
the surround area is reached by light. On the contrary, center-OFF are excited when the light
reaches the surround, and inhibited when it reaches the center. Consequently, the ganglion
cells are responsible for contrasts’ detection. It is important to note that ganglion neurons are
of two main types: type P cells (parvus) and type M cells (magnus). These cells have well
defined roles and are at the origin of different visual pathways, which are described in the
next paragraph (in the § I.2.1.3). The M cells represent approximately 5 % (or 10 % according
to the literature (e.g. Baseler and Sutter, 1997)) of the ganglion neurons and emit AP in the
case of stimuli of low contrasts. These cells are adapted to movement discrimination. On the
contrary, type P cells (around 80 and 90 % of the ganglion cell population) have receptive
fields smaller and more sustained AP. These cells are sensitive to the shape and to various
wavelengths. The remaining percentages of cells are not-P and not-M cells which play a role
in colors detection. P cells give rise to the ventral neuronal paths of visual system, whereas M
cells give rise to the dorsal neuronal paths (in the § I.2.1.3 for details).

30
I.2.1.3 Visual Ascending Pathways
Neuronal inputs originating from cones and rods are transmitted to the visual cortex
through the ascending visual pathways (Figure 10). These pathways consist first in the left
and right optical nerves formed by the temporal and nasal bundle of axons. These fibers
merge at the level of the optic chiasma situated in front of the infundibulum. The nasal fibres
cross at the level of the chiasma but not the temporal fibres. At the chiasma level takes place a
decussation of the optical ways, which allows a crossed processing of the information. It
means that the right tract conveys the information concerning the visual left hemifield and the
left tract conveys the information concerning the visual right hemifield. Both optical tracts
end in the lateral geniculate nucleus (LGN) in the thalamus. From a cytoarchitectonic point of
view, the type P cells are connected with layer P of the LGN, whereas the type M cells are
connected with layer M of the LGN. This nucleus is considered as the first sensory relay of
the visual information. One can note that the LGN receives feedback connections from the
primary visual cortex, but also from the optic tectum, also named superior colliculus (SC). In
addition to what has already been said in the section "Auditory system", some other
information concerning the SC (developed in details in § I.4.5.3.1) and the visual system will
be introduced here. One of the main functions of the SC, situated in the midbrain, is the
coordination of the eye movements relative to the head. Consequently one of SC’s role is to
direct gaze (Sparks, 1986; Meredith and Stein, 1983) via saccadic eye movements, and the
head towards the source of stimulation. These studies demonstrate the spatial aspects
controlled by the SC and especially in terms of orientation. Furthermore the sensory inputs
are not limited to the visual system, but are also coming from both the auditory and the
somatic systems (Gordon, 1973; Middlebrooks and Knudsen, 1984). These are the three
sensory systems which were investigated in the present work.
Following the transfer of information to the SC and to the LGN, through the optic
radiation, the visual inputs will reach the visual cortex. From an anatomical point of view, the
visual cortex is located in the occipital lobe of the brain and is the largest cerebral cortex
devoted to a specific sensory modality; in the non-human primates, the visual cortical areas
cover until 50 % of the neocortex (Sereno et al., 1994). Usually the visual cortex refers to
both the primary visual cortex, also known as the striate cortex (Baseler and Sutter, 1997) or
V1 (area 17 according to Brodmann’s classification (Brodmann, 1909; Falchier et al., 2002))
and the secondary visual cortex, known as the extrastriate visual cortex (V2, V3, V4 and V5).
The visual cortex then transmits information to the inferior temporal and to the posterior

31
parietal cortex, via two separate pathways, named the dorsal and the ventral streams. These
pathways are engendered by both types of ganglionar cells (M and P cells) (in the § I.2.1.2).
Generally, the dorsal stream reaching the posterior parietal cortex, is called the «where »
pathway and plays a role in the spatial visual information processing, whereas the ventral
stream reaching the inferior temporal cortex is called the «what» pathway and plays a role in
the recognition and identification of visual stimuli (objects; including color).
Figure 10: Representation of the visual pathways. Modified from the article Deborah et al., 2005.
Through this chapter we showed that the visual system is well adapted to its function
and allows the perception of shapes, colours, movements, and intensities differences.
32
I.3 Somatosensory system
The somatosensory system, also called sensitivity of the body, is the main sensory
system in humans, considering the surface of its receptor organ (the skin). However,
compared to the visual and the auditory systems which correspond to individual modalities,
the somatosensory system is multimodal because it integrates mechanical, thermal and
chemical inputs. Here are the different modalities which are part of the somatosensory
system:
1° The proprioception: this function provides indications to the central system about the body
position in space. One particularity of this modality is that it can be conscious or unconscious.
The conscious perception implicates different submodalities, such as the sensation of
vibrations and tactile information. The unconscious perception depends on receptors
responding to contractions or tensions of respectively muscles and tendons.
2° The kinesthesis or kinesthesia: This function concerns the conscious perception of
movements by giving information concerning the position and the movements of the body.
This modality is independent from tactile and visual senses. The information originates from
receptors placed in joints and muscles and is transmitted to the central nervous system in a
continuous manner through sensory afferents. This function allows subjects for example to
reach an object, to grasp it precisely, or to walk. All this process happens without conscious
actions. Indeed, we do not have to think about the various movements to be performed when
we walk.
3° The cutaneous senses or commonly named sense of touch: this function represents the
ability to perceive through body contacts objects from the environment and forces.
4° The nociception: this function allows informing the CNS about pain thanks to pain
receptors, collectively called nociceptors. These receptors are located at various spots over the
body and can be divided into cutaneous, muscular and articular receptors. Nociceptors can
detect the thermal, mechanical, and chemical changes, and then transport this information to
the brain via afferent nerves. As cross-modal neurons, nociceptors can be polymodal. Indeed,
these receptors respond to mechanical, chemical and thermal stimuli.
From an anatomical point of view, the somatosensory system is the only system which
is linked by efferents with the brain and the spinal cord (Willis et al., 1991). At the cortex
level, the somatosensory area is located in the postcentral gyrus of the parietal lobe. As for all
other sensory areas, there is a spatial map (somatotopic), called in this case the homunculus
(Figure 11) where tactile information is preferentially treated. It is important to note that the

33
processing of somatosensory information is spread out all over the CNS (Table 1). For
example the spinal cord combines motor and sensory nerves and elaborates reflexes on the
basis of somatosensory inputs. At the level of the cerebellum somatosensory information play
a role in motricity and balance.
Figure 11: Representation of the Penfield Homunculus. From http://sciblogs.co.nz/misc-ience/files/2010/06/penfield-homunculus.jpg. Table 1: Distribution of the somatosensory information processing in the CNS. Cerebral cortex Tactile information ( homonculus)
Cerebellum Control of balance and motricity
Spinal cord Motor Reflex
Thalamus Cognitive treatement and forwarding information to the cortex
Hypothalamus Hormonal and neuroendrinal control
Reticular system Attention control
Limbic system Emotion
The ascending somatosensory pathways form a neuronal chain going from the receptors to
the cerebral cortex. This path is formed by three neurons:
- The primary neuron: with its cell body located in the peripheral ganglion (spinal or
cranial),

34
- The secondary neuron: which makes a synapse with a third neuron in the spinal cord
or in the thalamus,
- The tertiary neuron: which ends at the level of the cerebral cortex.
Through this chapter, we can say like Sherrington in 1924 that the somatosensory “receptors
are points of the organism specialized for the surrounding world to act upon” and that this
system is highly contributing to complex responses including motor movements, behaviors
and social interactions. Like visual and auditory systems, the somatosensory system interacts
with other modalities to improve the environmental perception.
I.4 Multisensory integration
I.4.1 Generalities
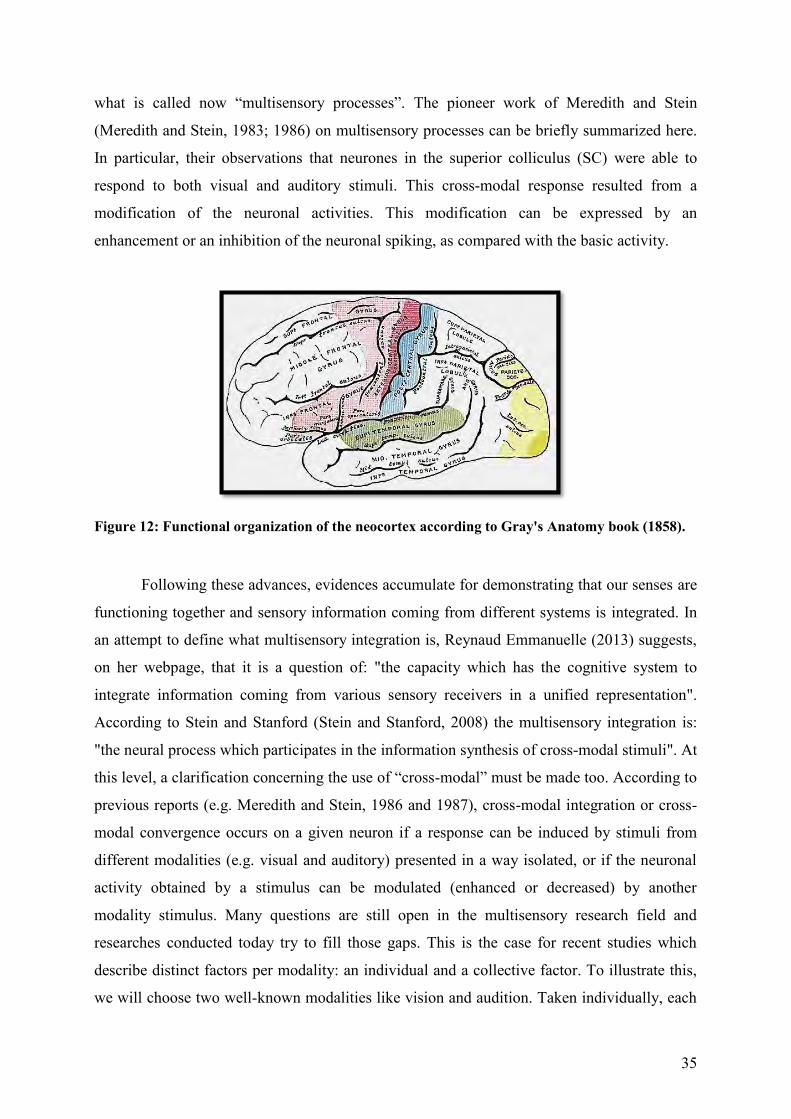
Since the mid of 19th century till 1950s scientists were dividing the neocortex, into
three functional subdivisions : the motor, the sensory and the association areas (see review in
Masterton and Berkley, 1974). This view is illustrated in Figure 12 where cortical areas have
been investigated on the basis of the dual principle of perception (by the senses) and reaction.
Such neocortical divisions were contradicted by the review of Masterton and Berkley (1974)
which reports a collection of evidences during 20 years for demonstrating that cortical areas
are more heterogeneous across auditory, visual, motor, somatosensory, frontal and temporal
cortex. During the last half of the 20th century, technological developments have considerably
helped neurosciences’ research. During this period the neuroscientific approach was focussed
on the 5 senses individually: hearing, vision, touch, taste and smell (in line with Aristotle’s
view). Through this process physiologists have even identified other sensory modalities
connected to new receptors, such as the vestibular system, the proprioceptors, and the thermo
receptors. Thereby the perception has been considered to be “modular”. For example, the
hearing system consists of various modules sensitive to various characteristics like the
frequency, the intensity and some more. This manner of studying the various sensory systems
went on during the 80s and 90s. Recently, such an approach has been contested because it
could not bring any satisfying answer to the fundamental questions about mechanisms
underlying the ability to globally perceive the environment. This questioning brought together
for the first time neuroscientists and philosophers of science in order to start thinking about
35
what is called now “multisensory processes”. The pioneer work of Meredith and Stein
(Meredith and Stein, 1983; 1986) on multisensory processes can be briefly summarized here.
In particular, their observations that neurones in the superior colliculus (SC) were able to
respond to both visual and auditory stimuli. This cross-modal response resulted from a
modification of the neuronal activities. This modification can be expressed by an
enhancement or an inhibition of the neuronal spiking, as compared with the basic activity.
Figure 12: Functional organization of the neocortex according to Gray's Anatomy book (1858).
Following these advances, evidences accumulate for demonstrating that our senses are
functioning together and sensory information coming from different systems is integrated. In
an attempt to define what multisensory integration is, Reynaud Emmanuelle (2013) suggests,
on her webpage, that it is a question of: "the capacity which has the cognitive system to
integrate information coming from various sensory receivers in a unified representation".
According to Stein and Stanford (Stein and Stanford, 2008) the multisensory integration is:
"the neural process which participates in the information synthesis of cross-modal stimuli". At
this level, a clarification concerning the use of “cross-modal” must be made too. According to
previous reports (e.g. Meredith and Stein, 1986 and 1987), cross-modal integration or cross-
modal convergence occurs on a given neuron if a response can be induced by stimuli from
different modalities (e.g. visual and auditory) presented in a way isolated, or if the neuronal
activity obtained by a stimulus can be modulated (enhanced or decreased) by another
modality stimulus. Many questions are still open in the multisensory research field and
researches conducted today try to fill those gaps. This is the case for recent studies which
describe distinct factors per modality: an individual and a collective factor. To illustrate this,
we will choose two well-known modalities like vision and audition. Taken individually, each

36
modality is efficient when stimulated with the appropriate stimulus. For example with the
visual system humans are able to detect with precision a shift of a visual stimulus. Moreover,
a little change in the direction of a stimulus which is represented by two levels, the azimuth
(horizontal level) and the elevation (vertical level), is easily identified. On the other side, the
auditory system allows humans to perceive sounds coming from 360° (individual modality).
However, it has been demonstrated that the resolution of the auditory system is lower than the
one of the visual system. Put into a “collective” perspective, the senses of vision and hearing
are together going to interact to increase the precision of localization of the direction change.
We can also mention the increase of the probability of detection of this change when both
stimuli are perceived. To add another relevant example we can discuss about speech.
Spontaneously, we could think that speech implicates only an auditory process (McGurk and
McDonald, 1976), but it includes visual lip movements too (McGurk and McDonald, 1976;
Driver, 1996). Furthermore, in a congruent situation (i.e. if the lip-movements and the sounds
from the speaker reflect the same event) the lip-reading contributes to better speech
perception (Sumby and Pollack, 1954; Saito et al., 2005; Rouger et al., 2007 ; Ross et al.,
2007). The estimated gains thanks to this multimodal combination raise the ratio acoustic
signal over noise from 11 to 20 dB, which results in better understanding speech, especially in
presence of background noise.
We know that human and non-human primates have evolved in a complex
environment generating multiple sensory inputs. Vertebrate nervous system has evolved to
process information from different modalities. One important role of the brain is to decode
multiple information from the environment caught by peripheral sensory organs, then
integrate and finally encode them with the aim to create a coherent perception. To do that, the
brain dedicated regions able to integrate converging information from several modalities
(Stein and Meredith, 1993).
The effects of multisensory integration are multiple. Indeed, according to Driver and
Noesselt (2008), the stimulation of a modality can affect the appreciation of a property
normally applied to another modality. That is what we will introduce in the following
paragraphs multisensory effects when environmental parameters are well controlled and give
rise to illusions or when it brings clear benefits, namely facilitatory effects, to the subject.

37
I.4.1.1 Illusions
Concerning the "multisensory" illusions specifically during a visuo-acoustic task like
the one investigated in the present thesis, we have found two categories:
1) when visual processing can influence the auditory experience,
2) when auditory processing can alter the visual experience.
In the first category, the point is about visual illusions, which happen when there is a
dissociation between the perception of an object or an event and the physical reality. In other
words we can speak about a perception of something that does not exist like in the following
examples.
- The ventriloquism: This word originates from a Latin phrase “venter”
(belly) and “loqui” (speak) which means “speaking from the stomach”. Historically the
ventriloquism was a religious practice (Schmidt, 1998). Indeed the ventriloquist was able to
interpret sounds resulting from stomach and was able to predict future. From a more rational
point of view, ventriloquism is an act in which a person changes his voice so that it gives the
illusion that the voice is coming from elsewhere. So we can state that the direct vision of
some articulatory lips movements influence the spatial discrimination of a sound source
(Driver, 1996). Moreover the ventriloquist’s art consists usually in minimizing the lips
movement (the compellingness) in order that the audience associates the word (resulting from
the ventriloquist) with the lips movements of the dolly; although keeping a consistence
between the dolly lips movement and what is heard. So we can add another statement which
is that the percept of an auditory stimulus is captured by the spatial location of a visual
stimulus. Therefore we can conclude like Recanzone (2009) that the efficiency of an illusion
depends on three factors: the timing of the two stimuli, the spatial disparity and the
compellingness.
- The McGurk effect. This phenomenon was found accidently and was
described for the first time in 1976 by Harry McGurk and John MacDonald (McGurk and
McDonald, 1976). This illusion occurred when mismatching auditory (e.g., /apa/) and visual
(e.g., /aka/) syllables were presented (http://www.youtube.com/watch?v=G-lN8vWm3m0). In
this example subjects perceived a different syllable (/ata/) which is a syllable that is neither
seen, nor heard. A recent study (Szycik et al., 2012) using functional MRI tried to define the
brain areas involved in the McGurk effect. The active brain areas were found in the posterior

38
part of STS, bilaterally. According to some studies, certain neurological disorders produce a
significantly reduced McGurk effect. This has been observed in young people affected by
dyslexia (Bastien-Toniazzo et al., 2010), in patients affected by Alhzeimer’s disease (AD)
(Delbeuck et al., 2007) and in children with specific spectrum disorders (ASD) (Mongillo et
al., 2008). Concerning the mechanisms involved, the report of Delbeuck et al. (2007) suggests
that AD people have a dysfunction in the interactions between brain areas which could be due
to a reduction of corpus callosum’s size (dysfunction between hemispheres communication).
ASD patients, especially children, show difficulties in using visual information from the face
in particular in speech perception conditions. Along the same line, other authors (Schultz et
al., 2000; Kikuchi et al., 2009) underline that ASD children face emotional problems linked to
information processing from faces as described in autism. In such patients fMRI analysis done
by Schultz et al. (2000) showed a reduction of the activity in the fusiform gyrus (FG) area and
an increase of the activity in the inferior temporal gyrus (ITG) (Figure 13). In children
affected by a specific language impairment (SLI) the McGurk effect is significantly reduced
compared to control children (Norrix et al., 2007).
Using the McGurk effect as an investigation tools in such patients allows the scientists
to understand better the various steps of signal processing in the context of visual perception.
Indeed, this type of illusion represents an incapacity to recreate the physical reality and
therefore open-up our understanding of the visual information steps.

39
Figure 13: Composite activation maps superimposed on averaged anatomical images by group (NC1, NC2, autism) and task (Face, Object) using regions of interest outlined in green. Activations in normal control group NC1 and NC2 (A, B, C, D) are not significantly different. Right and left are reversed by radiologic convention. Note the inferior temporal gyrus (ITG) activity during face processing in the autism group (E, F). Modified from Schultz et al., 2000.
The illusions mentioned above (Ventriloquism and McGurk effect) show that the
vision can alter the hearing perception. Reciprocally, certain illusions show us that hearing
can alter the visual perception.

40
- Illusory flashing: This illusions demonstrated in 2002 by Shams et al.,
(2002) (Figure 14) happens when a flash is accompanied by several beeps. The flash is
surprisingly not perceived as being unique but multiple as it is in reality for the beeps.
Figure 14: Illusory flashing. Modified from Shams et al., 2002
Until now we discussed alteration between the vision and the hearing perception,
however other modalities, such as the balance or the touch, can be altered. We shall illustrate
this by the next two examples.
- Oculogravic illusion: This illusion is due to a combined effect of gravity
and when the body of a subject is pushed by an acceleration This occurs in fighter pilots for
example who get a wrong information from the otolith organs when the aircraft accelerates
(or decelerates) giving them a feeling of a false climb/descent.
- Parchment skin illusion: This illusion is due to an audiotactile
interaction and happens when the sound is synchronized with hand-rubbing. This modifies the
tactile sensations (Jousmäki and Hari, 1998).
In conclusion, these few examples and descriptions of illusion phenomena
demonstrate that they are obtained under specific conditions (e.g. spatio-temporal conditions,
which be treated later), and they are part of the phenomena of cross modal integration.

41
I.4.1.2 Benefits
In contrast with the previous approach where environmental parameters are changed in
order to mislead the integrative centres (illusions), it was observed that cross-modal
integration brings significant benefits (Stein and Meredith, 1993; Kayser et al., 2007a).
Indeed, from a behavioural point of view, studies showed that cross-modal integration allows
an improvement of RTs (Giard and Peronnet, 1999; Reynolds and Day, 2007; Rowland et al.,
2007; Brandwein et al., 2011), an improvement of performances and an increase of detection
probabilities of an event (Meredith and Stein, 1986; Giard and Peronnet, 1999; Calvert and
Thesen, 2004; Wallace and Stein, 2007; Stein and Stanford, 2008). In everyday life such
integrative function happens for example during driving which requires inputs from several
modalities among which we find the visual, the auditory, the somatosensory, the vestibular
and the motor systems. In particular, the visual system allows us to get a dynamic image of
the road; the auditory system helps us to remain alert to the engine and the environment; the
somatosensory system sends messages to the SNC about the car’s movements, the vestibular
system about acceleration, and all that results in activation of the motor system to move and
adjust the gears. Interestingly, one can note that such an ability to integrate cross-modal
stimuli is not innate but appears through a learning process (McIntosh et al., 1998; Stein and
Stanford, 2008). To support this, the study of Wallace and Stein in 1997 demonstrated in the
cat that during the first postnatal days (n=10) neurons in the superior colliculus (SC) are
unable to process cross-modal stimuli, when animals are raised in darkness (Wallace et al.,
2004). Therefore they concluded that early sensory experiences are crucial for developing
such ability by the SNC. The acquisition of a senses’ synergy through experience have been
claimed by Wallace and Stein in 2007 and confirmed by the study of Yu et al. in 2010. In this
latter study it was demonstrated that the neuronal responses from the SC deep layers show
gradually ability in cross-modal integration as a function of postnatal cross-modal
experiences. Without these experiences multisensory neurons have the ability to respond to
different modalities but no inputs are integrated. This ability appears during a postnatal period
when rapid and numerous changes take place in the neuronal architecture. This period is
known as a "sensory" period. In addition it has been noticed that certain multisensory tasks
are delayed until the superior colliculus neurons have the capacity for cross-modal
integration (Yu et al., 2010). This would suggest learning by stages, which means that the
strength of the integrated responses increases gradually as a function of cross-modal

42
experience. This phenomenon may be active as well in reaction times following cross-modal
integrations.
I.4.1.3 Reaction time
The first studies of RTs during psychological experiments appeared at the beginning
of the 19th century (Bessel, 1823). Then a new interest for these studies was observed in the
1950s in particular with Dubois-Reymond (Figure 15) who tried to measure the speed of the
neuronal transmission. Indeed, RTs’ studies are important to investigate the processes
between stimuli and their responses. However RTs are subject to certain variability on the
basis of different factors:
Figure 15: Emile Dubois-Reymond
A) Cue intensity: several studies demonstrated that the more the intensity of the
stimulus increased the shorter the response time became. This relation was established by
Piéron in the 20s (Piéron, 1920) and was formulated as follow: RT = (a/in) + k where i
corresponded to the intensity, a to the time, k to a constant and n to a variable which differed
according to the stimulation type and the different conditions. The reaction is influenced by
the duration of the signal and by the area that is the spatial field. For example, an increase of
the spatial area (=special summation) or/and of time (=temporal summation) improves
reaction times.
B) Sensory modality: this factor is essentially linked to peripheral mechanisms rather
than central processes. It is about:
1) Differences in time relatives to the afferent conduction. For example if we
compare the hearing and visual systems, it will take 8 to 10 msec for an auditory

43
cue to reach the SNC, whereas it will take between 20 and 40 msec for a visual
cue to reach the SNC,
2) The change of state which is longer in certain sensory systems. For example, the
changes in the visual system are slower compared to those in the hearing system.
3) There is also a significant variability among sensory systems (see Table 2).
Table 2: Reaction times for different sensory modalities. Table 1.2. modified from Welford (1980)
Study Stimulus Reaction Time
(msec)
Woodworth and Schlosberg
(1954)
Light 180
Sound 140
Robinson (1934) Touch 155
Kiesow (1903) Salt on tip of tongue 308
Sugar on tip of tongue 446
Baxter and Travis (1938) Rotation of the person 520
Change in the direction
of rotation of the person 720
Wright (1951) Intense radiant heat 330
C) Stimulus complexity: This last point refers to the stimulation information process.
The less we have to integrate separate stimulus attributes (e.g. shape, angles, colour), the
faster the central organization of the sensory activity.
To complete the picture, here is a brief summary about RT and its measurement:
- First the signal is received by the adequate sense organ then conveyed to the brain via the
afferent channel. This stage is relatively short and takes about few milliseconds.
- Second the cue is identified by the brain,
- Third the cue is compared with prior sensory representations and a choice of response is
made,
- Fourth: the response is initiated through an action.
So the RT is the time difference between the perception of the signal (step 1 above) and the
motor response (step 4 above). One can note that during RT measurement the longest stages

44
are steps 2 and 3. To shorten RT, Hershenson demonstrated in 1962 that using a bimodal
stimulation in place of an unimodal stimulation facilitates reactions. This is what we will
describe in the following paragraph from a statistical perspective.
I.4.2 Probabilistic models
Historically the decrease of RT observed in multisensory contexts has been linked to a
facilitation induced by two or more different stimuli and described as the redundant signal
effect (RSE). This effect has been studied through three different classes of models:
1) The race model (Raab, 1962), or the separate activation model, in which it is assumed that
shorter RTs are linked to the modality which first detects the signal. In this model, the
facilitation in response to two competing stimuli is predicted according to a statistical
phenomenon, described as a probability summation. Indeed, and as written in Cappe et al.,
2010:”the likelihood of either of the two stimuli yielding a fast RT is higher than that from
either stimulus alone”. Consequently it is the reaction times of the fastest modality that is
considered. The weakness of this model is that it does not consider neural convergence and
interactions.
2) The coactivation model (Miller, 1982) predicts that the interaction between unimodal
channels happens somewhere in the processing system before the initiation of the behavioural
response. A possible integrative phenomenon is tested with Miller’s inequality which predicts
that the cumulative response time distribution for the combined stimuli never exceeds the
summed distribution of the single stimuli. The equation is expressed as following :
P(RT(VA)) < (P(RT(A)) + P(RT(V))) – (P(RT(A)) x P(RT(V))) (Corballis, 1998; Cappe et
al., 2010 a). Violation of this inequality demonstrates the presence of integrative processes.
3) The time-window-of-integration (TWIN) model (Colonius et al., 2004, 2009). This model
is a combination of the two previous ones and is based on three stages’ assumptions:
A° First Stage Assumption: It corresponds to the early sensory processing, where there
is a “race” among the peripheral neural excitations in the different sensory pathways
generated by the cross-modal stimulus.
B° Second Stage Assumption: It corresponds to the neuronal integration of the
different inputs and the preparation of the adequate response. For example, in the case of
saccadic eye movements, this stage comprises the preparation of an ocular motor response.

45
The multisensory effect acts at the processing time level, either by a decrease or by an
increase.
C° Time-Window-of-Integration Assumption: The “window of integration”
corresponds to a given period in which the first stage’s process must be finished. In this case a
multisensory integration occurs. This “window of integration” can be considered as a
temporal filter between the various sensory inputs which determines the multisensory
integration. As a consequence, this model allows fixing a temporal rule during multisensory
integration which was not the case in the first two models.
I.4.3 Spatiotemporal perspective
As shown in the previous paragraphs, the behavioural effects of cross-modal
integration have been well demonstrated by different authors. In the following section, we
would like to recall about the multisensory effects which are dependent on spatiotemporal
relations between the different sensory inputs (Wallace et al., 2004).
1° Temporal influence. With regard to the present work, we will focus on auditory
and visual stimuli. In this context, one can note that a facilitation (=latency reduction)
happens regarding the timing of the visual versus the auditory stimulus. Most of the studies
using an audiovisual combination reported a facilitation when the auditory stimulus was
presented after the visual stimulus (Miller, 1986; Slutsky and Recanzone, 2001). In contrast,
Frens and al. (1995) found that the optimal or maximal facilitation was obtained when the
auditory stimulus was presented slightly before or synchronously with the visual stimulus.
The range of the various temporal intervals which can engender a beneficial effect, that is
facilitation, is known in terms of “temporal binding window” (TBW) (Stevenson and
Wallace, 2013). The TBW could be defined as follow: this is the “range of stimulus onset
asynchronies [SOAs] in which multiple sensory inputs have a high probability of altering
responses” (Stevenson and Wallace, 2013). The TBW can be modulated according to two
characteristics: the type of stimulus and the task chosen. In the case of asynchrony
discrimination between the presentation of an auditory and a visual stimulus, the subjects can
present a certain tolerance. In other words, the subjects cannot perceive the asynchrony as it
is. This tolerance applies when the visual stimulus precedes the auditory stimulus. It happens
when the auditory stimulus is speech (Dixon and Spitz, 1980) since there is a difference of

46
speed propagation between the vision and sound waves. Indeed the brain learns how to
manage this discrepancy and take into account the lower speed propagation of the sound
wave. In case of an auditory stimulus precedes a visual stimulus, such effect of tolerance has
no impact. Consequently the asynchrony is better detected.
According to several authors (Stevenson et al., 2010; Vroomen and Keetels, 2010), the
temporal relationship between stimuli is a very important criterion in the way inputs are
integrated and what strength is resulting from this integration. This importance can be clearly
seen when the temporal processing between modalities is impaired as it is the case in patients
affected by autism or dyslexia.
2° Spatial influence. In parallel to these temporal aspects, the facilitation is also
dependent on the spatial origin of the various stimuli. According to Stein et al. (1988) (study
conducted in cats with an orientation/reaction task) the best performance is obtained when the
cues of various modalities are presented in a spatial alignment. In other words spatial
scattering tends to diminish performances when some multisensory integration is happening.
This is supported by some studies like the one of Lee et al. (1991) which demonstrates that
saccadic RTs decrease when a tone (auditory cue) was spatially aligned with the visual
targets.
This section confirms that more detailed studies concerning the role of spatiotemporal
conditions in multisensory integration are necessary. Besides, some knowledge keeps growing
on the different types of crossmodal integration and this will be the topic of the next part.
1.4.4 Types of crossmodal integration
1.4.4.1 Stochastic resonance
The discovery of stochastic resonance is quite recent (beginning of 80s) and is a
phenomenon whereby a signal becomes better identifiable (enhanced) if noise is added to it
(Harper, 1979). In the context of multisensory integration Harper demonstrated in 1979 that
the use of a white noise could facilitate the sensibility to visual flicker in human subjects.
More recently Manjarrez et al. (2007) and Sasaki et al. (2008) reached the same conclusions.
According to Manjarrez et al. (2007) a sub-threshold visual stimulus (flashes) is enhanced

47
when a certain amount of white noise is added. In contrast, the same visual stimulus delivered
in supra-threshold conditions does not improve the perception. To explain this phenomenon
three neural hypotheses have been suggested:
1° Synaptic convergence: This facilitation can be described as the synaptic convergence of
inputs from different modalities on multisensory neurons, such as the auditory and visual
afferent inputs. This is in line with the evidence formulated for the SC (in the § I.4.5.3.1) in
which multisensory neurons exhibit an overlap of different receptive fields; in this case
auditory and visual (e.g. Wallace et al., 1993).
2° Impact on the "dynamic range" of SC neurons: We can recall that the dynamic range is the
stimulus intensity range within which neurons are discharging and which goes from threshold
up to saturation (May and Sachs, 1992; Manjarrez et al., 2007). Therefore according to the
latter authors the addition of white noise could spread the dynamic range of multisensory
neurons. This view is perfectly in line with studies from Perrault et al. (2003; 2005) who
reported that the integrative function of a neuron is correlated to its dynamic range As a
consequence, every unisensory dynamic range is smaller than multisensory dynamic ranges.
3° Coherence Resonance or internal stochastic resonance (Manjarrez et al., 2002): To show a
stochastic resonance the brain needs a certain amount of external noise plus a stimulus.
However non-linear systems can, in case of no external stimuli, still engender a stochastic
resonance which results for example in a behavior. This concept refers to the notion of
internal stochastic resonance.
1.4.4.2 Phase coherence
Neural oscillations at the level of large groups of neurons can be observed in
electroencephalograms (EEG technique). Such activities generally arise from neurons which
synchronize their firing patterns as in sensori-motor and cognitive functions (Sendowski et al.,
2008). These oscillations in neuronal ensembles happen at different frequencies than the
firing frequency of individual neurons and have been divided in 5 frequency bands:
- the delta activity from 0.5 to 3.5 Hz,
- the theta activity from 4 to 7 Hz,
- the alpha activity from 8 to 12 Hz,
- the beta activity from 13 to 30 Hz,
- the gamma activity which is superior to 30 Hz

48
It has been demonstrated that gamma activities were involved in sensory modalities
like vision, hearing, somatosensory system and olfaction. Therefore the analysis of neuronal
signals coherence should allow us to establish the existing relations between sensory
modalities. Studies performed with a protocol using audiovisual stimuli (e.g. Stein et al.,
1999; Senkowski, 2005) showed an enhancement of the evoked oscillations, in particular the
beta waves, during crossmodal stimulations. This enhancement is superior to the sum of
unisensory evoked responses in certain brain regions that were called Regions Of Interest
(ROI). During the referring to an object with words that has been presented orally or visually,
von Stein et al. (1999) demonstrated that during the crossmodal integration there was an
enhanced coherence of 13-18 Hz activity (beta waves) between electrodes located on the
temporal and parietal cortex. This study does not show an increase in signal amplitude but
rather an overlapping of activities originating from different sites. In other words we can
speak about an enhancement of the phase-locking between neuronal activities from different
cortical areas. In contrast the work of Posner et al. (1988) with a similar task but with PET
scan acquisition did not show any overlapping activities between brain areas.
I.4.5 Neuronal perspective
I.4.5.1 Bayes integration concept
Before getting into multisensory integration at a neuronal level, I would like first to
introduce an approach used since Helmholtz (1911) to describe the processes of integration.
That is the Bayesian inference which is a statistical method for describing the systems of
perception and cognition in a mathematical way. This approach establishes the probability of
an event from the probability of other events which were beforehand estimated. In other
words, this theory takes into account the multiple inputs the brain has to manage and which
keep varying. While integrating such information the brain creates a coherent perception of
our environment. According to the concept of "Bayes optimal integration" (Klemen and
Chambers, 2011) certain levels in the brain hold internal probabilistic models of events which
are updated by inputs from lower hierarchical level (forward connections). According to these
authors “higher order areas, in turn, supply lower level areas with predictions, or in Bayesian
terms, “priors” (backward connections). On this basis authors have built the model of cue

49
combination which assumes that the sensory cues originate from the same object (Murray et
al., 2012). Integrating information in such a context is beneficial but probably less when the
cues originate from two different sources. For example while driving it would be beneficial to
perceive a horn noise and to see the car in front of us: we would increase our alertness.
However if the horn was originating from a car behind us and we would still see the car in
front of us, it would make no sense if our brain was rather integrating these two signals
originating from the same object. In this case several modalities are involved and constantly
“forward” cues to the brain that must be processed regardless if they result from the same
object or from several objects. Sometimes the brain is facing a problem and must decide if it
is necessary to combine or not the various signals. For the brain the answer lies in a causal
inference to determine if these cues result from one source, an event or from several sources.
For that the brain uses several criteria bound to these cues such as the temporal and spatial
influence (in the § I.4.3), but also the interactions between these cues. Concerning the
temporal and spatial influences, we saw (in the § I.4.3) that the larger the discrepancy
between sources is, the less the brain is able to process a unified perception. According to
Murray et al. (2012) these discrepancies can be classified according to three classes: 1 ° the
fusion when there is no difference (two signals resulting from the same source), 2 ° the partial
integration when the difference is moderated and, 3 ° the segregation, when there is a lack of
interaction due to a too large discrepancy. When the discrepancy is very low or there is none
(fusion in this case) the integration of the cues is from a mathematical point of view linear.
When the discrepancy is moderate or large, the integration is not any more linear and a
probabilistic model shall be used (Shams et al., 2005; Angelaki et al., 2009; Murray et al.,
2012). Such a model allows determining the probability that two modalities interact and the
formula is as follow (modified from Shams et al., 2005):
⁄ ⁄⁄⁄
where S1 and S2 corresponds respectively to two sources for the sensory cues x1 and x2; P
(x1/S1) and P (x2/S2) represent respectively the likelihood that the cue x results from the
source S. P (S1/S2) is a prior probability often called the prior and, representing the events x1
and x2 in the environment. To summarize this model we can write that it allows an estimation
of the environment compared with the received cues.

50
I.4.5.2 Multisensory integration concept
Anatomically the neocortex is the outside layer of both hemispheres and can be
subdivided into three functional types (Masterton and Berkley, 1974): the sensory, the motor
and the associative cortex. The neocortex is also organized in 6 layers numbered from I to VI
and involved in functions such as the sensory perception, the generation of motor commands,
spatial reasoning, thoughts as well as the language. Until the end of the 20th century one
thought that the neurons from the sensory areas were strictly unimodal whereas the neurons of
the associative superior areas were specific responding to combined stimulations. Following
the pioneer work of Stein and Meredith in 1993 in the SC the scientific community
accumulated evidences that during cross-modal integration the neurons of the associative
areas send signals back to the lower areas (backward connections), to the unisensory areas, as
well as in regions involved in the perception and the execution of actions. Different methods
have been used to characterize multisensory areas:
A° Anatomical: neuronal tracing studies allowed to establish the various connections
between the specific sensory areas (Rouiller et al., 1998; Rouiller and Durif, 2004; Cappe and
Barone, 2005; Morel et al., 2005; Cappe et al., 2009).
B° Physiological: the electrophysiological studies allowed to record the responses of
the modalities during uni- or multisensory stimulations (Molholm et al., 2002; Cappe et al.,
2010; Kayser et al., 2010; Brandwein et al., 2011; Franciotti et al., 2011; Senkowski et al.,
2011).
C° Imaging: the studies using imaging allowed to show the various levels of
activation of a population of neurons during a stimulation (Calvert et al., 2000; Bremmer et
al., 2001; Saito et al., 2005; Doehrmann et al., 2010; Gentile et al., 2011; Naumer et al., 2011;
Szycik et al., 2012).
Several studies made with fMRI (e.g. Calvert et al., 2001; Doehrmann et al., 2010)
demonstrated that unisensory areas could be activated, or at least modified by stimulations of
several senses. This phenomenon was described as "early sensory integration" (Giard and
Peronnet, 1999; Molholm et al., 2002) but in fact dated from the 70s. Indeed this idea has
been suggested after the recording of auditory responses at the level of the primary visual
cortex but the technologies of this period limited the possibilities of double checking therefore
this type of research was abandoned.

51
I.4.5.3 Multisensory neurons
From a neuronal point of view, the cross-modal integration can be defined as a
significant difference between the evoked potentials, number of impulses, during a cross-
modal stimulation and the evoked potentials during one of the most effective stimulation
(Meredith and Stein, 1983; Wallace and Stein, 2007, Stein and Stanford, 2008). These
significant differences are revealed by an enhancement or by a depression of the neuronal
response. We can add to this definition the fact that a multisensory neuron is a neuron
responding to the stimulation of more than one sensory modality or else a neuronal response
to one modality altered significantly by the stimulation of another modality (Wallace and
Stein, 2007).
Electrophysiological studies on cross-modal integration have been conducted in both non-
human primates (e.g. Groh and Sparks, 1996; Wallace et al., 1996; Basso and Wurtz, 1998;
Schroeder et al., 2001; Bell, 2005; Ghazanfar and Schroeder, 2006; Smiley et al., 2007) and
humans (Giard and Perronet, 1999; Cappe et al., 2010b Senkowski et al., 2011). Moreover
other mammals have been used for this type of research like cats (Gordon, 1973;
Middlebrooks and Knudsen, 1984; Meredith and Stein, 1986; Wallace et al., 1993; Wallace
and Stein, 1994), ferrets (Bizley and King, 2008) (Meredith et al., 2012), rats (Brett-Green et
al., 2003; Skaliora, 2004; Menzel, 2005; Rodgers et al., 2008), mice (Cohen et al., 2011) and
guinea pigs (Shore, 2005; Shore et al., 2007). We can note that cross-modal integration
studies started in the cat mainly because of the easy access to the brain associative areas for
electrophysiological records. Therefore from a historical point of view, the most studied
structure is the superior colliculus (SC) (Figure 16). At this site converge signals from visual,
auditory and somatosensory modalities, which make this area playing a major role in
attention, eyes movement generation and, head and pinnae movements.
I.4.5.3.1 Superior colliculus
From an anatomical point of view and according to the arrangement of neuronal soma,
the colliculi can be differentiated in various layers. The SC is formed by seven layers (from
superficial to deep) as following: the stratum zonale (SZ), the stratum griseum superficiale
(SGS), the stratum opticum (SO), the stratum griseum intermedium (SGI), the stratum album
intermedium (SAI), the stratum griseum profundum (SGP) and the stratum album profundum
(SAP). To simplify, these layers can be grouped in two divisions: the superficial (SZ, SGS

52
and SO) and the deep (SGI, SAI, SGP and SAP) layers. The differentiation of these layers is
determined according to two criteria: the colliculi afferences and the neuronal responses
engendered by stimulation of different sensory modalities. That is why researchers speak
about a laminar representation in the CS. According to Wallace and al. (1996) (Figure 16),
during a visual stimulation, the responding cells are located in the superficial layers of the SC
whereas cells responding to auditory and/or cross-modal stimuli are more in the deep layers.
According to Sparks’ study (1986) the superficial layers received inputs from the retina and
the visual cortex. Furthermore, in non-human primates a retinotopic map was presented by
reference? Where cells of each colliculus were activated by stimuli coming from the
contralateral visual field. These neurons responded to stationary and moving stimuli; the latter
engendering more important responses. In contrast, the deeper layers, referred to
“multisensory layers” (Meredith and Stein, 1986; Meredith et al., 1987; McHaffie et al., 2012)
received inputs from ascending and descending unisensory afferent sources from cortical and
subcortical areas. These inputs originate from sensory modalities and motor areas determining
maps of visual, auditory and somatosensory space (Amlôt et al., 2003). The proportion of SC
deep layers cells able to respond to cross-modal stimuli are provided by Meredith et al. (1987)
and displayed in Figure 17. Importantly, Spark demonstrated in 1986 that SC deep layers
neurons respond to visual stimuli but the proportion of such cells decreases while going
deeper into the layers. The largest number of neurons discharges during saccadic eye
movements. More precisely, 45 % of cells show an increase of responses, while 20 % of cells
show a depression. Among these cells showing a depression 80 % respond only to one type of
stimulus. According to Bell and al. (2005), the auditory and cross-modal stimuli can influence
the sensory and pre-motor activities in the deep layers of the SC and evoke changes in the
behavior. Indeed, according to specific criteria and which will be described in the following
sub-chapter, stimuli close to the detection threshold showed a facilitation effect for SC
multisensory neurons. Authors suggested a formula allowing to calculate the magnitude of the
interaction in percentage (Meredith and Stein, 1986, 1987; Wallace et al., 1996):
[(CM-SMmax) x 100 ] / SMmax = %
where CM corresponds to impulses evoked by the cross-modal stimulus and SMmax the
number of impulses evoked by the best unisensory stimulus. The obtained magnitude may
reveal phenomenon of potentialisation (or superadditivity) when multisensory responses
exceed the sum of those evoked by unisensory stimulations (Stanford and Stein, 2007) and
phenomenon of sub-additivity when cell responses are decreased (Wallace et al., 1993).
These principles are described in more details below.

53
Figure 16: Representation of neurons cluster by modality in the Superior Colliculus: Modified from Wallace et al., 1996.
Figure 17: Neurons distribution in dSC (deep layer of superior colliculus). On all neurons (n=108) in deep layers, more than 25% were multisensory. The results demonstrated a predominance of neurons responding to visual stimuli. Modified from Wallace et al., 1996.

54
I.4.5.3.2 Multisensory integration principles
First, the spatial principle of multisensory integration: For bimodal neurons, the
receptive field of two different modalities very often overlaps and the appropriate stimulation
leads to enhanced responses. This is what is called the coincidence spatial principle (Stein,
1998). According to Meredith et al. (1987) it was demonstrated that the more the spatial
disparity increases the more bimodal responses decrease.
Second, the temporal principle of multisensory integration (Figure 18): This
principle is related to the synchrony or the asynchrony of stimuli. In particular, the sensitivity
of bimodal neurons is dependent on the time between two stimuli. This is about a principle of
temporal coincidence (Wallace et al., 1996). A neural response is enhanced during a bimodal
stimulation when the time’s gap between two stimuli is very short. In contrast, longer time
gaps engender normal unisensory responses. However it is important to note that the maximal
response is determined by the overlapping of the activity patterns rather than a perfect
synchrony (Meredith et al., 1987; Wallace et al., 1996; Kayser et al., 2005; Stein and
Stanford, 2008). As a consequence, the larger the temporal disparity between unisensory
stimuli is, the fewer enhancements are recorded. Besides, one can wonder how the brain
engenders adequate bimodal responses if the stimuli are asynchronous. The answer lies over
the duration of neuronal activity induced by the stimulus. Indeed, this neuronal activity will
be long enough to allow an overlapping with the neuronal activity resulting from the
stimulation of the second modality. According to Meredith et al. (1987), this time window is
around 100 msec. The asynchrony between two stimuli may engender three types of
responses: an increase, an increase and a decrease, or a decrease. These three types of
responses can be found in the same neuron and are dependent on the time gap between the
two stimuli. One important aspect in the temporal principle is the overlap of the discharge
patterns. For example discharge domains could show 1°) a high discharge rate followed by a
fall or 2°) a progressive discharge increase followed by a progressive decrease. This seems to
be dependent on the physical properties of the neuron.
To be complete, the time interval between two stimuli of different modalities has an effect on
the magnitude of the response, but also on the sign of the integration, namely towards an
enhancement or a depression. 4 sub-principles can be established to explain cross-modal
integration:
a : maximal levels of response enhancement are generated by overlapping the peak discharge
period evoked by each modality.

55
b : the magnitude of this enhancement decayed monotonically to zero as the peak discharge
periods became progressively more temporally disparate.
c : with further increases in temporal disparity, the same stimulus combinations that
previously produced enhancement could often produce depression, and
d : these kinds of interactions could frequently be predicted from the discharge trains initiated
by each stimulus alone.
Figure 18: Decreasing the temporal disparity between 2 stimuli from different sensory modalities can dramatically increase the magnitude of response enhancement. Modified from Meredith et al., 1987.
Third, the Principle of inverse effectiveness: This principle is linked to stimulus
intensity and can be formulated like the closer to threshold the stimuli are, the more the gains
produced by the combination will be important (Figure 19; Meredith and Stein, 1986; Stein
and Meredith, 1993; Wallace et al., 1996).
According to Carriere et al. (2008), the three principles introduced above do not allow
to predict the specificity of a multisensory neuron. Nevertheless, these principles can
contribute to determine what type of multisensory integration takes place.

56
Figure 19: Inverse effectiveness in multisensory integration. Modified from Stanford and Stein 2007.
Fourth, the receptive field of the sensory neuron contributes to multisensory
interaction too. Indeed, as stated by Carriere et al. (2008) and Stein and Stanford (2008) the
area of sensory space where the multisensory neuron is specificially activated (receptive field)
could be modified by another modality to which it responds.
The cross-modal integration intervenes not only in the superior colliculi (SC) but also
in other subcortical areas like the basal nuclei.

57
1.4.5.4 The cortical primary sensory areas
For a long time considered as unisensory, evidence are accumulating to demonstrate
that cortical primary sensory areas can integrate information of different modalities and treat
them in parallel thanks to connections referred as "heteromodal connections". In this case we
can speak about early multisensory convergence and we will consider three cortical areas: the
auditory, the visual and the somatosensory cortices.
I.4.5.4.1 Auditory cortex
The auditory cortex is an area that has been well studied in the multisensory research
field. Many other studies showed as well that the auditory cortex is able to process
somatensory information (Calvert et al., 1997; Foxe et al., 2002; Murray, 2004), visual cues
(Giard and Peronnet, 1999; Foxe et al., 2000; Molholm et al., 2002; King and Walker, 2012),
tactile cues (Kayser et al., 2005) and olfactive cues (Cohen et al., 2011). These findings were
made in humans, in primates, and also in mice with various methods: electrophysiological
recordings (Schroeder and Foxe, 2002; Wallace et al., 2004; Ghazanfar, 2005), functional
imaging (Kayser et al., 2005; Pekkola et al., 2005; Kayser et al., 2007b) and
magnetoencephalography. From an anatomical point of view, the major multisensory
interactions take place at the level of areas surrounding belt and parabelt areas (Figure 18). At
first, it seemed that these influences resulted from multisensory neurons from the thalamus
projecting on these various areas of the auditory cortex; that is a subcortical origin. These
influences could also be due to connections with associative areas such as STS, visual or
somatosensory areas. From a physiological point of view, these multisensory integrations
allow an improvement of the auditory processing, but also a modulation of the responses from
the auditory cortex (Stein and Stanford, 2008). This modulatory effect can be explained by
the various visual and somatosenory cortices inputs and originating mainly from layer IV of
the auditory cortex (Falchier et al., 2002). This layer is the place where thalamic projections
arrive. The studies of Falchier et al. (2010) and Stein and Stanford (2008) demonstrate that
various projections from visual areas arrive on the auditory areas. This anatomical study
shows that area V2 and prostriata send projections to various auditory areas, among which we
find the caudal parabelt of the auditory area (CPB) and the temporoparietal area (Tpt) (Figure
18). Furthermore, according to an older study of Falchier et al. (2002) it would seem that the

58
visual inputs can influence cells at the level of the areas of the belt areas as well as A1. In
complement to this study, Kayser et al. (2007) demonstrated by functional imaging that area
CPB and Tpt (incorporated into CPB in this study) were highly activated. That was not the
case for areas A1 and CM (Kayser et al., 2007). Nevertheless, the study of Kayser et al.
(2009a) (Kayser et al., 2009) demonstrate a multisensory interaction at the level of A1. It is
however necessary to specify that this interaction takes place only in awake animals.
Figure 20: Representation of different cortical pathways between auditory and visual cortices. From Falchier et al. (2010).

59
I.4.5.4.2 Visual cortex
Similarly to the auditory cortex, the visual cortex is well studied in the multisensory
research field. The proofs concerning a non-visual integration at the level of this region were
brought by anatomical studies but also with electrophysiological studies (Giard and Peronnet,
1999; Calvert et al., 2001). Previous studies (Morrell, 1972; Fishman and Michael, 1973)
have already demonstrated that neurons of the visual cortex could respond to stimuli other
than visual. The study of Morrell (1972) demonstrated that in the visual cortex of the cat
approximately 41% of neurons showed an activation during an acoustic stimulation. Another
interesting point from this study was that these neurons expressed a receptive field which was
aligned with the visual receptive field. Consequently there was a spatial specificity of these
neurons. However the physiological roles of these activations are unknown. In the study of
Fishman and Michael (1973), also conducted in the cat, 38% of neurons responded to both
acoustic and visual stimuli. Similarly Morrell (1972) demonstrated that these bimodal neurons
expressed a coincidence between visual and auditory receptive fields. In addition, this study
suggested that these neurons played a role in spatial localization of stimuli. Another study by
Miller and Vogt (1984) , demonstrated auditory projections on the visual cortex of the rat.
More recent studies (Giard and Peronnet, 1999; Falchier et al., 2002; Rockland, 2003;
Cappe and Barone, 2005; Martuzzi et al., 2007; Wang et al., 2008) also demonstrated
multimodal integration at the level of the visual cortex in both humans primates. In a more
general study showing the multisensory interactions at the level of the primary cortices,
Martuzzi et al. (2006) demonstrated that the primary cortices responded to the stimulation of
other sensory systems via thanks to the BOLD Dynamics technique (Figure 19). Using BOLD
dynamics helped to show a correlation between the BOLD peak latency and reaction times. In
other words, during bimodal stimulation, shorter RTs are observed (facilitation), and a shift in
the BOLD peak latency. Consequently, this study confirms the idea of multisensory
convergence.

60
Figure 21: Representation of an activation map for each type of stimulation. Each stimulus activates the primary sensory cortices. Modified from Martuzzi et al. (2006)
Numerous studies concerning the audiovisual convergence in the visual cortex result from
anatomical studies, such as Falchier et al. (2002), Rockland and Ojima (2003), Cappe and
Barone (2005). Rockland and Ojima (2003) study shows direct connections between auditory
cortex and V1 and V2 areas. Associative areas of the parietal bone association cortices, such
as PG (of area Brodman 7a) and PF, have projections to the calcarine fissure. For reminder,
PG and PF, due to their convergence of visual and proprioceptive information, allows the
localization of an object relative to the body. Here are the results obtained after neuronal
trackers injection in various sites of the auditory cortex of macaque monkeys (Table 3)
(Macaca mulatta) (Rockland and Ojima, 2003).

61
Table 3: Results obtained after tracers injections in the caudolateral and middle lateral belt of macaque monkeys. From Rockland and Ojima (2003).
Injection sites Number of injections Projections
Caudolateral belt 3 injections In dorsal V2
Sparsely to V1
Middle lateral belt 1 injection In V2
Sparsely to V1
This study also reveals that the auditory projections end in layers 1 and 6 of the cortices V1
and V2. This observation follows the conclusions made by Falchier et al. (2002).
Consequently this type of connection can be classified "as connection feedback" or "top -
down connection".
I.4.5.4.3 Somatosensory cortex
With regard to the theme of this thesis, it turns out that very few studies investigated
the question of the visuo-acoustic integration at the level of the somatosensory cortex.
However study in the non-human primate revealed that some somatosensory neurons
responded to audiovisual stimuli and tactile stimuli (Zhou and Fuster, 2000; 2004).
I.4.5.4.4 Premotor cortex
From an anatomical point of view, the premotor cortex (area of Brodmann 6) or
"secondary motor cortex" (M2), is situated in the frontal lobe, and it is part of the motor
cortex in the large sense. The premotor cortex is clearly distinct from the primary motor
cortex (area of Brodmann 4 or M1). More precisely, the area 6 of Brodmann comprises the
so-called SMA (Supplementary Motor Area, located in the mesial area 6) and PM (Premotor
Cortex, located in the lateral area 6). The premotor cortex PM can be divided into two parts:
the ventral premotor area (PMv) and the dorsal premotor area (PMd) (Kurata, 1991). These
two regions can be subdivided further into two parts, the rostral part and the caudal part thus
corresponding to 4 areas: PMv-r, PMv-c, PMd-r and PMd-c (see e.g. Boussaoud et al., 2005).
From a physiological point of view, the premotor cortex plays an important role in the control
of the movement in response to various external sensory stimuli (Weinrich and Wise, 1982;

62
Godschalk et al., 1985; Wise et al., 1986). As reported by Roland et al. (Roland et al., 1980):
the premotor cortex in man "is activated when a new motor program is established… or when
the motor program is changed on the basis of sensory information".
As reported for the non-human primate, the premotor cortex is a site of convergence of
visual, auditory, tactile and somoatosensory inputs (Graziano, 1999; Graziano et al., 1999;
Graziano, 2001). Nevertheless, 73% of the neurons recorded in PM are synchronized with the
movement, that is they have a clear motor role (Weinrich and Wise, 1982). It was defined by
Weinrich and Wise (1982) that the time to introduce a movement from a cue of initiation, that
is the reaction time, is in the order of 300 msec. In their experimental paradigm, the motor
time was 173 msec on average. This information concerning the timing of movements
triggered by external stimuli is important in the context of the present thesis: see chapter
«Results».
1° PMv: The ventral premotor cortex, divided into PMv-r and PMv-c, referred to also
as areas F5 and F4 (see Matelli et al., 1989), are electrically micro-excitable. These two areas
contain the representations of various parts of the body, mainly the arm, the neck, the hand
and mouth movements. The majority of neurons respond to the tactile stimuli (Hamadijida’s
Ph.D Thesis). However, approximately 40 % of neurons respond to visual stimuli (Graziano
et al., 1999). The responses of these bimodal neurons (Fogassi et al., 1996) exhibit a
concordance as for their receptive fields (Figure 22). Interestingly, there are even trimodal
neurons in PMv, responding to tactile, visual and acoustic stimuli. The auditory receptive
field overlaps with the visual and tactile receptive fields. We can also mention that the
response in 34 % of these neurons is not influenced by the acoustic intensity, but rather by the
distance between the sound source and the head of the monkey: beyond 10 cms, the sound
does not produce any response. 34 % of these trimodal neurons are influenced by the sound
amplitude but not by the distance. 25 % are influenced by the sound amplitude and by the
distance. In summary, these trimodal neurons have the capacity to determine the distance of
the sound source. From an electrophysiological point of view, the response latencies to sound
are found in a range comparable to the latencies observed in response to visual stimuli, from
45 to 200 msec. A major characteristic of PMv, mainly it rostral part (PMv-r or area F4) is the
presence of the so-called "mirrors neurons", reported by Rizzolatti and his colleagues. These
neurons discharge in a comparable way when the animal executes a movement or when it
observes the movement made by others, such as the experimenter or another monkey
(Rizzolatti et al., 1996).

63
Figure 22: Representation of the receptive fields of a bimodal neurons in PMv. From Graziano (1999).
There are important projections reaching PMv originating from the parietal cortex (Matelli et
al., 1986), in particular the area 7a. For reminder, the area 7a plays a role in the visuo-motor
coordination, due to convergence between vision and proprioception. PMv also receives
projections of the anterior intraparietal area (AIP). The neurons in AIP code for the shape, the
orientation, as well as the size of objects manipulated by the subject. Consequently, this area
plays a major role in the planning of the movements such as grasping of objects and for their
manipulation based on visual inputs. We can also mention that PMv receives projections from
the prefrontal cortex (PFc) and, of course, there are reciprocal connections between PMv
other motor cortical areas (M1, SMA, cingulate motor cortex). Subcortically, the premotor
areas receive strong connections from the thalamus, mainly the motor thalamus but also other
thalamic nuclei to a lesser extent (see e.g. Morel et al., 2005). These projections are
reciprocal, as PMv projects back to the thalamus, giving rise to corticothalamic projections
(e.g. Kermadi et al., 1998). According to Markowitsch (1987) (Markowitsch et al., 1987), the
thalamo-premotor projections are less numerous on PMv than on PMd. In contrast, the
projections of the pulvinar on PMv are denser than on PMd.
2° PMd: From a physiological and anatomical point of view, there are similarities
between PMd and PMv. Indeed, the PMd is formed by two areas: areas F7 and F2 (Matelli et
al., 1989), corresponding respectively to PMd-r and PMd-c (see Hamadjida, Thesis). These
areas, also electrically microexcitable (though F7 much less than F2), contain the following
main representations: arm and foot. Studies in the 80s demonstrated that PMd plays an
important role in visuo-motor tasks. The studies of Weinrich (Weinrich and Wise, 1982;
Weinrich et al., 1984) demonstrated that neurons in PMd exhibit a modulation of their
discharge during a visual stimulus, when the latter had a motor significance. From the
electrophysiological point of view, the latency in response to a visual stimulation is below

64
250 msec (Godschalk et al., 1981; 1985). The influence of auditory stimuli is less prominent.
Indeed, a study of Weinrich (Weinrich and Wise, 1982) showed that only a restricted number
of neurons, 2 out of 87, responded to an acoustic stimulation. In summary, there is little
auditory inputs to PMd, clearly less than to PMv. Nevertheless, Vaadia (1989) (Vaadia, 1989)
demonstrated that there were responses to the auditory stimuli in PMd, however these are
present only when the acoustic signal is used to trigger a movement. It is the same for the
visual stimuli.
PMd also receives projections originating from parietal areas, such as PO (area
parieto-occipital) and MIP (area intraparietal median) (Wise and al., 1997). Here are some
reminders concerning these two parietal areas. PO contains neurons with receptive fields
sensitive to the orientation and the direction of stimuli. As for MIP, the neurons are sensitive
to the visual stimuli and/or to somatosensory stimuli. With respect to the connections with the
primary motor area (M1), only PMd-c (F2) receives inputs from M1. These connections are
reciprocal, that is PMd-c projects to M1. On the other hand, PMd-r (F7) is not connected with
M1 (Ghosh and Gattera, 1995)( Jouffrais, Thesis). In contrast, PMd-c has no connection with
the prefrontal cortex, whereas PMd-r is connected with various areas of the prefrontal cortex
(Ghosh and Gattera, 1995; Jouffrais, Thesis). As mentioned in the part concerning the
connections of PMv, PMd is also connected with the thalamus (see e.g. Morel et al., 2005).
I.4.6 Audio-visual interactions
The present chapter is focused on audiovisual interactions (the topic of the present
thesis), although multisensory interactions are very diverse, such as visuo-tactile (Botvinick
and Cohen, 1998; Zhou and Fuster, 2000; Gori et al., 2011), audio-visual interactions (Giard
and Peronnet, 1999; Fort et al., 2002; Molholm et al., 2002; Cappe et al., 2010; Doehrmann et
al., 2010; Naumer et al., 2011; Gori, 2012; Lanz et al., 2013b) or auditory-somatosensory
interactions (Foxe et al., 2002; Murray, 2005; Sperdin, 2009).
We begin here with the presentation of the “pioneering” work by Giard and Peronnet
(1999), demonstrating behavioral and electrophysiological data during an audiovisual task of
objects recognition in human subjects. The visual stimuli consisted in a circle deformed
horizontally ("visual" object A) or vertically ("visual" object B). The auditory stimuli
presented a pure tone of 540 Hz ("auditory" object A) or 560 Hz ("auditory" object B). For
this protocol, the stimuli were presented either in an unisensory condition (auditory or visual)

65
or in a combined condition, "visual" and " auditory " objects A or the "visual " and " auditory"
objects B. Briefly, the subject had to differentiate for every trial which object A or B was
presented by pressing one of the two available buttons (a button for objects A and one for
objects B). The behavioral results are consistent with data in the literature, namely a shorter
reaction time was observed when the modalities were combined. The average reaction times
were 562 msec during crossmodal stimulation and, 621 and 631 msec during auditory or
visual stimulation alone, respectively (Giard and Peronnet, 1999). Besides these behavioral
results, the study was also interested in the attention of the subjects to stimuli. Some subjects
were more attentive when the unisensory stimulus was auditory, while others were more
aware to a visual stimulus. This attentive bias, derived from the reaction times to responses
during unisensory stimulus was referred to as sensory dominance, and two groups were
defined: 1) Subjects with a visual dominance (visual TR < auditory TR) and 2) Subjects with
an auditory dominance (auditory TR < visual TR). This differentiation in two groups is very
interesting for the subsequent part of the study by Giard and Peronnet. Indeed, and
additionally to these behavioral results, these authors measured the neural activity using
EEGs.
The EEG results showed a neuronal interaction 40 msec after the onset of the
crossmodal stimulation. This interaction evoked an early activity during the multisensory
integration. The sensory dominance analysis made by Giard and Peronnet (1999) allowed
enhancing the very interesting effects of the integration at the level of the visual cortex. This
interaction was identified by the differentiation of EPs (evoked potentials) in response to
crossmodal stimuli and the sum of EPs in response to the unisensory stimuli: [AV-(A+V)].
Here are the conclusions (Figure 23):
- Human subjects with visual dominance: the early interactions took place
between 90 and 105 msec (significant interaction) in these temporal regions. These results
suggested an increased activity in the auditory cortex by the addition of the visual stimulus.
- People with auditory dominance. The early interactions took place between 40
and 150 msec in the occipital regions.

66
Figure 23: Modified representation of ERPs topography obtained between 40-200 msec. by Giard and Peronnet (1999). The different maps represent the difference between sensory dominance subjects obtained between the AV condition minus the sum of the unimodal conditions.
Consequently, the conclusion of these experiments was: "the interactions in the
sensory cortex are more important in the cortex of the non-dominant modality» (Giard and
Peronnet, 1999; Fort’s Thesis, 2002). Other studies, more recent, revealed this early activity
as well (Molholm et al., 2002; Talsma et al., 2007; Senkowski et al., 2011). The study of
Molholm et al., (2002) aimed at confirming the work of Giard and Peronnet (1999), while
simplifying the behavioral task. As Giard and Peronnet (1999), the behavioral results of
Molholm et al. demonstrated a significant decrease of the reaction time during crossmodal
stimulation. As Giard and Peronnet, and more recently Sun and al. (2009), the study of
Molholm et al. (2002) demonstrated an early activity starting from 45 msec after the
combined stimulation. This activity also took place at the level of the visual cortex. The
authors explained this similarity of early activity in the visual cortex in two ways: a direct or
an indirect pathway. Before introducing these two interpretations, we allow to remind briefly
that during an auditory stimulation, the auditory cortex is activated after 15-20 msec, to be

67
transmitted further (the auditory processing stream). Therefore, the information (inputs) is
transmitted to the visual cortex via two possible pathways:
- Direct pathway: it would be direct connections between the auditory cortices and the
visual cortex/cortices, for instance between the areas of the parabelt and V2. These
projections are collectively called feed-forward projection or «heteromodal» projections.
- Indirect pathway: it would be an indirect pathway, which involves a relay between
the auditory cortex and the visual cortex. In this case, feed-forward projections would reach
associative areas (or multisensory convergence areas), such as STS, IPS, and would afterward
be transmitted to the visual cortex via feedback projections.
These two postulates of Molholm and al. (2002) were integrated into the van Atteveldt
and al. (2013) study that summarizes three alternatives supporting the idea of integration in
low-level sensory cortices. The first two are the same as those of Molholm and al. (2002), that
is a direct and an indirect pathway. It is obvious that these postulates were also considered by
other authors, such as Cappe and al. (2010) and Schroeder and al. (Schroeder et al., 2004).
The third alternative lies in interactions of low-level cortices, by feedback projections coming
from superior areas (higher-order multisensory cortices). This proposal of Calvert et al.
((Calvert et al., 2001)) corresponds to an indirect pathway as quoted previously, but without
feed-forward projections.
According van Atteveldt et al. (2013), the first two proposals are applicable in a
complementary way and according to the type of task (detection, identification,
discrimination). Complex tasks (such as perception of words or objects identification) would
require the indirect pathway, i.e. feedback projections from top level cortical areas (higher-
order multisensory cortices) or from multisensory convergence areas. For tasks concerning
the localization and/or the detection of stimuli (as in the present thesis) it seems that the
involved pathway is the direct one, corresponding to lateral connections (in the § I.4.6) or
commonly called heteromodal connections (Cappe et al., 2010), as well as feed-forward
connections via the thalamus (in the § I.4.6).
I.4.7 Hierarchy of integration of cross modal stimuli
This chapter aims at defining the multisensory interactions under a more global aspect,
that is how and where the various connections (forward, backward, and laterals) converge
(Driver and Noesselt, 2008; Cappe and al., 2009; Klemen and Chambers, 2011). Two
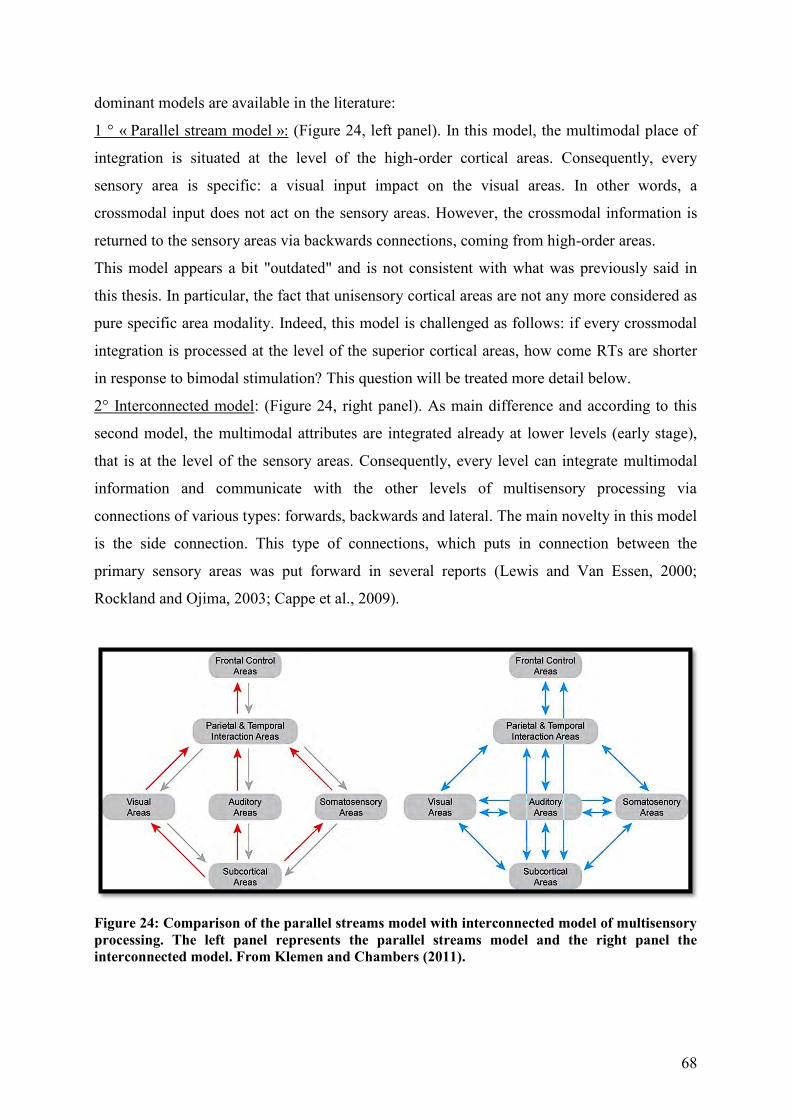
68
dominant models are available in the literature:
1 ° « Parallel stream model »: (Figure 24, left panel). In this model, the multimodal place of
integration is situated at the level of the high-order cortical areas. Consequently, every
sensory area is specific: a visual input impact on the visual areas. In other words, a
crossmodal input does not act on the sensory areas. However, the crossmodal information is
returned to the sensory areas via backwards connections, coming from high-order areas.
This model appears a bit "outdated" and is not consistent with what was previously said in
this thesis. In particular, the fact that unisensory cortical areas are not any more considered as
pure specific area modality. Indeed, this model is challenged as follows: if every crossmodal
integration is processed at the level of the superior cortical areas, how come RTs are shorter
in response to bimodal stimulation? This question will be treated more detail below.
2° Interconnected model: (Figure 24, right panel). As main difference and according to this
second model, the multimodal attributes are integrated already at lower levels (early stage),
that is at the level of the sensory areas. Consequently, every level can integrate multimodal
information and communicate with the other levels of multisensory processing via
connections of various types: forwards, backwards and lateral. The main novelty in this model
is the side connection. This type of connections, which puts in connection between the
primary sensory areas was put forward in several reports (Lewis and Van Essen, 2000;
Rockland and Ojima, 2003; Cappe et al., 2009).
Figure 24: Comparison of the parallel streams model with interconnected model of multisensory processing. The left panel represents the parallel streams model and the right panel the interconnected model. From Klemen and Chambers (2011).

69
I.5 Objective of the Research
The above general introduction to the present thesis manuscript allowed covering
some fundamental aspects concerning the multisensory integration, with emphasis on visuo-
acoustic integration. As mentioned throughout this general introduction (in the § I.1, I.2 and
I.3), we can understand that each sensory system was developed mainly for the specific type
of information it is supposed to process. This modality specificity does not lead to an equal
"quality" for the integration of every modality. As demonstrated by Giard and Peronnet
(1999), in the course of visuo-acoustic integration, the subjects exhibited a sensory
dominance, either an auditory or a visual dominance. This dominance can be demonstrated by
the shortest mean of reaction times (RTs) for every modality.
However, in the daily life, it is necessary to integrate these various modalities to
process and then to obtain a unified perception of our external environment. This multimodal
integration, governed by spatiotemporal relationships (in the § I.4.3), prompted numerous
studies (e.g. Giard and Peronnet, 1999; Calvert et al., 2001; Murray et al., 2004), conducted
on human subjects, and also on non-human primates or other animal species. These
electrophysiological studies allowed to define the various parameters of a multisensory
neuron (e.g. super-additivity of SC neurons, Meredith and Stein, 1986), to demonstrate that in
specific-modality areas bimodal interactions may occur (e.g. auditory and visuo-acoustic
responses in the auditory cortex; Molholm et al., 2002), and to demonstrate that these
interactions occurred early during the sensory processing (e.g. ~45 msec post-stimulus; Giard
and Peronnet, 1999). Anatomical studies also allowed to determine heteromodal connections
between unisensory areas (Cappe et al., 2009b), but also between subcortical structures (e.g.
thalamus) and cortical areas (e.g. Morel et al., 2005; Cappe et al., 2009a), possibly
contributing as anatomical support for early multimodal interactions.
The initial and general aim of the present Ph.D. thesis was to elucidate some of the
electrophysiological bases of the audio-visual integration, in a sensory convergence and
sensory-motor integration area, the premotor cortex, in the model of non-human primates
(macaque monkeys). It was demonstrated that the visual cortex receives projections/inputs
from the auditory cortex and that bimodal neurons respond to auditory stimuli (e.g. Falchier et
al., 2002). A recent study also showed that cells in the auditory cortex also respond to visual
stimuli (see Celine Cappe’s Ph.D. thesis). In the continuation of this previous work by Céline
Cappe, the aim of the present work was to record neuronal activity in the premotor cortex of
macaque monkeys during a multisensory-motor integration task. We hypothesize that the

70
premotor cortex may be a site for rapid (early) convergence of acoustic and visual
inputs, leading to faster motor responses (shorter reaction times) triggered by bimodal
(visuo-acoustic) stimulation, as compared to motor responses with longer reaction times
resulting from unimodal stimulation (visual alone or acoustic alone). To the best of our
knowledge, such investigation on the role of the premotor cortex in a rapid detection of
bimodal stimuli is truly original.
To this aim, several preliminary steps are however needed, corresponding to the
development of specific methodological skills. Although the behavioural detection protocol
was used previously in this laboratory (see Céline Cappe’s Ph.D thesis), it was limited by a
relatively imprecise control of the visual stimuli. For this reason, the protocol was
significantly modified in order to accurately control the intensities of the acoustic and visual
stimuli, as well as precisely establish for each monkey or human subject their threshold of
perception for each individual modality (in the § II). Indeed, every variable, such as the
choice of the auditory, visual, visuo-acoustic stimuli, their intensities, the target, the initiation
of the trials by the subject, the software controlling the experiments, were all re-designed in
order to improve and validate the entire experimental protocol. A first (though highly time-
consuming) step was to train two new macaque monkeys to perform this re-designed
detection behavioural protocol and make sure that these monkeys indeed exhibit the expected
bimodal behavioural facilitation (shorter RTs in response to visuo-acoustic stimuli than in
response to unimodal stimuli). In prevision of a very long lasting investigation in each
monkey, a further goal was to develop new technical approaches to implant a chronic
headpost fixation device and a chronic recording chamber, with the guarantee that they will
stay in place during the several years during which the investigations will be conducted in
these 2 monkeys.
Previous anatomical studies (e.g. Morel and al., 2005; Cappe et al., 2009b)
demonstrated inputs to the premotor from “sensory” zones of the thalamus, in particular from
the pulvinar nucleus, which may represent a very rapid route underlying visuo-motor
integration, bypassing separate unimodal information processing in the auditory and visual
cortices. The present work represents a first approach in order to validate these anatomically
based predictions, by conducting electrophysiological recordings in the premotor cortex
(present thesis work) and later on in the thalamus (e.g. pulvinar nucleus). The project in the
thalamus would thus be the logical continuation of the present study, to be conducted on the
same still alive two monkeys by another investigator.

71
In parallel to the present project conducted mainly on macaque monkeys, in order to
make a bridge with humans, we introduced a feasibility study conducted on few human
subjects (in the § II). To this further aim, the same psychophysical protocol, as developed for
the non-human primates, was applied to human subjects. The hypothesis is that the
multisensory facilitation properties observed in the non-human primates (monkeys; Lanz et
al., 2013b) can be reproduced in humans, both on the behavioural and electrophysiological
points of view (EEG replacing individual neuronal recordings in the latter case). In other
words, the long-term goal is also a matter of translational research. We may compare, for
example, non-human primate EEG and behavioural data with human EEG and behavioural
data, during the same detection paradigm and, in case of similarity, extrapolate
electrophysiology unitary data from the non-human primate to the human.

72
II. General Materials and Methods
The general technical aspects, namely materials and methods, used in this thesis will
be reported in this chapter. A specific technical refinement, dealing with a new approach to
anchor implants on the skull of non-human primates (macaques) will be reported separately,
in the form of the first chapter of results in the thesis.
The present general chapter of methods aims at giving an initial and broad outline of
the various methodological approaches (subjects, behavior, electrophysiology, surgery) used.
More details will be presented in the various chapters of the results, especially in the two
articles already published at the time the thesis manuscript was finalized (Lanz et al., 2013 a
and b). Consequently, the next sub-chapters will often refer to these two articles for the
purpose of not repeating over and over the same information.
All the experiments presented in this thesis were carried out in Professor Eric
Rouiller’s laboratory, at the department of Medicine, Domain of Physiology and Fribourg
Cognition Center, at the University of Fribourg (Switzerland). For non-human primates, all
experimental protocols were approved by cantonal and federal Swiss veterinary authorities
(veterinary authorizations numbers 173-06, 173-07, 156-04, 156-06, 156-08, 18/10).
Furthermore, the experiments were conducted according to both guidelines of the National
Institute of Health (Guide for the Care and Use of laboratory Animals, 1996) and of the
European Community (Guidelines for Animals Protection and Use for Experimentation). We
can also mention the compliance with the ARRIVE guidelines (Animal Research: Reporting
In Vivo Experiments).
For the new design development of the head fixation device and the chronic recording
chamber, collaborations were established with the engineering school (Department of
Mecanics) of Fribourg, Medicoat AG (Mägenwil), S+D Scherly (La Roche) and with the
Hôpital fribourgeois (HFR) (Department of Radiology).
II.1 Subjects
II.1.1 Non-human primates
The topic of this sub-chapter is reported in detail in the article Lanz et al. 2013b (in the
§ Subjects). Briefly the experiments were conducted on two adult males Macaca fascicularis

73
(Figure 25) coming from our own breeding (a colony of macaques was maintained for
breeding in our facility until 2008). One animal is an 11-years-old macaque, weighting around
8.0 kg in 2013 (Mk-LI). The second animal is a 9-years-old macaque, weighting around 8.0
kg in 2013 (Mk-JZ). The animals, grouped by 2 to 5 subjects, were housed in a detention
room of 45 m3 (15 m3 until 2010), as previously reported in more detail (Kaeser et al., 2011;
Schmidlin et al., 2011). Each monkey was placed under the responsibility of the same
experimenter (myself in the present case for the 2 monkeys Mk-LI and Mk-JZ). It is crucial to
mention here that before initiating any behavioural training in the laboratory, it was necessary
to habituate the monkeys to move voluntarily without intervention of the experimenter from
the detention room into a primate chair, allowing the transport of the animal to the laboratory
and performing the task in the set-up. This step is highly time consuming (about 3 months)
and when properly executed allow the transfer of the animal to the laboratory with stress for
the animal and risks for the experimenter. The transfer of the monkeys to the primate chair is
illustrated in the form of a video sequence is the article published by Schmidlin et al. (2011).
Figure 25: Photograph of a Macaca fascicularis (Laboratory of Physiology, Fribourg, 2007).
II.1.2 Human subjects
In parallel with the studies conducted on the non-human primates, a parallel
investigation was conducted on human subjects. Young adults (n=14) aged 20- to 30- years
old were enrolled in this study. Ten subjects were enrolled in the behavioural part of the study
whereas 4 additional subjects were involved in the combined behavioural/electrophysiological
(EEG) protocol. The distribution between genders was equal: 7 females and 7 males. All

74
participants had normal hearing, as confirmed by audiometric threshold evaluation.
Furthermore, all participants had normal or corrected-to-normal vision. Human subjects were
recruited from the group of friends and colleagues in the laboratory. It is important to mention
here that, before the first session, all subjects had no preliminary experience with this
protocol. From an ethical point of view, before the first session, informed written and oral
consent was obtained from all subjects. An ethical committee approved all procedures.
II.2 Behavioural Protocol
II.2.1 Stimuli
This sub-chapter describes the characteristics of the auditory and visual stimuli used
for this thesis work, although the same information can be found in the article Lanz et al.
2013b (in the § Stimuli) focused on non-human primate data. For the human subjects, the
stimuli used (excepted for the auditory stimulus during one type of session) as well as their
calibration were the same as in the monkey experiments. Briefly, a white noise burst of 250
msec. was used as auditory stimulus. Nevertheless, we can mention that the auditory stimulus
used during the behavioural sessions in the human subjects was a pure tone burst (1 kHz) of
250 msec. duration. These auditory stimuli were delivered under free-field condition (via two
loudspeakers placed laterally with respect to the position of the subject’s head). The intensity
was chosen according to the protocol and the initial auditory absolute threshold, established
previously. In complement, and not mentioned in the article, in the audiometric room used for
the experiments, there was a residual unavoidable background noise, presenting a specific
spectrum (Figure 26). The spectral properties of the background noise are very important,
especially when pure tone bursts were used as stimulus (in our case restricted to the
behavioural sessions with human subjects). Indeed, thresholds cannot be lower than the
background noise level. Figure 26 illustrates the spectral properties of the background noise
present in the audiometric room. As visual stimulus (250 msec. duration), a green light-
emitting diode (LED) was used. The choice of a LED was made for two reasons (more details
in the related results article). The first one is the opportunity to precisely control the intensity,
by changing the voltage of the LED. The second reason is the small size of the LED, forcing
the subject to fixate its gaze on the center of the screen.

75
Figure 26: Representation of the background noise present in the audiometric room.
II.2.2 Sensory-motor task
All subjects, the non-human primates and the human subjects, had to carry out a
sensory-motor task in a sound-attenuated chamber (Figure 27). To summarize, the subject had
to press a lever to initiate a trial, then to release it in order to reach a touch pad in response to
a stimulus delivered after a random delay (auditory, visual or visuo-acoustic) (Smith and
Olszyk, 1997; Durif et al., 2003; Cappe et al., 2010a). In case of correct response, the animals
received a reward in form of food pellets. Wanting to keep exactly the same set-up and
protocol for the human subjects, a pellet was also delivered in case of correct response.
However, for the human subject, the cue in case of success was the noise of the pellets
distributor. This task was used for all the protocols, such as auditory and visual thresholds
measurement, but also for the multisensory sessions. More detail information has been
reported in the article Lanz et al., 2013b (in the § Sensory-motor task).

76
A
B
Figure 27: (A) Photograph of the audiometric set-up equipped for subject's function testing (Laboratory of Physiology, Fribourg, 2007). (B) Photograph of the audiometric set-up with a non-human primate in a primate chair (Laboratory of Physiology, Fribourg, 2013).
II.2.3 Auditory and visual threshold
The auditory and visual thresholds were obtained by means of an adaptive staircase
method. This method, a psychophysical technique (Levitt, 1971), was a variation of the

77
descending and ascending method of the limits. For the thresholds’ search, complementary
but essential information must be brought here. Indeed, the period of search for thresholds
was not the same between the non-human primates and the human subjects. In the non-human
primates, we first established the auditory thresholds. Then, the search for the visual
thresholds was carried out during a second time period (Table 4). On the other hand, the
auditory and visual thresholds in the human subjects were assessed just before the behavioural
multisensory session. Nevertheless, in the course of the electrophysiological recordings, only
the auditory thresholds were measured before the EEGs. The chosen visual threshold was an
average of the 10 subjects derived from previous behavioural sessions. This procedure was
introduced with the aim of decreasing the time spent in the audiometric room and so trying to
keep a maximal level of attention.
Table 4: Information on the different time periods spent for the sensory thresholds’ acquisition in the 2 non-human primates.
Auditory Visual
Mk-LI 5 months 4 months
Mk-JZ 2 months 3 months
To keep coherence in the intensity units, as usually done for the auditory values, the
visual thresholds were also expressed in dB. We used this relative unit, because it refers back
to a physical quantity without dimension and represents the decimal logarithm of a ratio of
two values. The precise description of how intensities were calculated in dB can be found in
the article Lanz et al., 2013b (in the § Thresholds assessment).
II.2.4 Multisensory integration
For multisensory session the same sensory-motor task was used. However during this
task the gaze was locked. For non-human primates, a headpost fixation piece was implanted
in order to keep the animal’s head in a fixed position (see next § II.3). In the human subjects a
device similar to that used in optometry was used to restrain head movements. During this
multisensory task, the auditory and the visual stimuli were randomly presented individually or
in combination. For more detail see the paragraph Multisensory sessions of the article Lanz et
al., 2013b.

78
II.3 Surgery in non-human primates
As mentioned above, the electrophysiological recordings conducted in non-human
primates required a restriction of the monkey’s head movements to decrease possible artifacts.
To this aim, we modified and developed a head fixation device. The design of this device
articulated around a choice of material: the use of titanium screws and an osseo-integration
procedure, with the goal to not use orthopedic or dental cement, which is detrimental for the
skull. In the same idea, we have developed a new design of chronic recording chamber also
using screws and osseo-integration, again without dental or orthopedic cement. All the details
concerning these devices, as well as the implantation surgery, post-operative daily care details
and results are described in the article Lanz et al., 2013a.
II.4 Different steps for monkeys behavioural training and CT and MRI acquisition protocol
II.4.1 Non-human primates behavioural training
This part is intended to describe the training for non-human primates in order for them
to perform correctly the multisensory task. This task consisted in responding to three types of
stimuli (auditory, visual and visuo-acoustic) individually or in combination. From a general
point of view, the various steps required more than one year (variable according to each
animal). Therefore the learning was an important and determining phase of the present work.
As a first stage the animal was taught to respond to auditory stimuli with a movement of the
hand. Here are the details of the various steps:
1 ° when the animal has been domesticated and comes naturally in the primate’s chair (initial
stage for every monkey involved in a protocol), we placed it in the experimental room then in
the audiometric room without the execution of a specific task. The aim was to win the trust of
the animal. This stage lasted few days.
2° the learning phase which was started here required an action from the animal which
consisted in a lever manipulation (pressure on a lever). This lever will be used in the final task
and will be inducing the trial. First we taught the animal to press the lever in order to receive a
reward. This “lever-reward” relation was very important to fix for the continuation of the
learning. This training, like all the next phases, firstly took place next to the animal. So the

79
animal was mimicking our way of activating the lever. Rapidly the animal carried out the task
alone in the set-up (consolidation phase) and the researcher supervised the task from the
outside via a webcam.
3° the next step consisted in introducing the notion of lever holding (temporal aspect), when
the animal had to keep the lever pressed during a random time. For this the trainer (always
next to the animal) was equipped with an electric delivery box allowing the release of a
reward at random times. As a consequence the animal learnt how to keep the lever pressed
until it received a pellet. Quickly this random time was automatized (thanks to various Matlab
and TDT subroutines) and the supervision could be done outside the set-up. This stage
required few weeks
4° the next step consisted in introducing a stimulus. The animal did not have to release the
lever any more when it received a reward, but it had to release it as soon as it perceived a
stimulus. The first stimulus used was an auditory stimulation. At this stage, the animal was
free to take the necessary time to respond (no response window or period during which the
animal had to respond). The auditory stimuli were chosen among pure tone bursts of various
frequencies, noises, different intensities,… .Therefore the animal could in the future respond
to any auditory stimulus without an additional learning. After this step, we defined a response
window of 800 msec duration. This required several weeks (a few months) until the animal
demonstrated a certain stability and reliability in the task execution.
5° afterwards, the last component of the equipment, the touch pad, was introduced. This
component allowed us to make sure that the subject well perceived the stimulus. Indeed when
the animal perceived the stimulus, it had to release the lever to press a touch pad placed in
front of it. This was meant to confirm the perception of the stimulus. A reconditioning from
the animal was necessary at this step so that it assimilated the touch pad with the reward. Like
all the stages mentioned above, this step was again carried out close to the animal.
6° the next step was the measurement of the auditory thresholds. This stage required a high
stability of the animal. The acquisition of such data is described in the publication of Lanz et
al., 2013b (in the § Thresholds assessment). The acquisition required several months with the
aim of collecting stable thresholds.
As a second stage, the animal was taught to respond to a second modality by using visual
stimuli.
7° introducing visual stimuli required to recondition the animal. For this stage we deleted
(momentarily) the auditory stimulus which is replaced by a visual stimulus. As during the
introduction of the auditory stimulus (step 4°), the animal was free to take the necessary time

80
to respond (no response window or period during which the animal had to respond). The
visual stimulus was a flash emitting by a green LED (light-emitting diode). After this step, we
defined a response window of 800 msec duration. This required few months until the animal
demonstrated a certain stability and reliability in the task execution.
8 ° as soon as the responses to visual stimuli were acquired and stable visual thresholds
started to be collected. A description of the measurements can be found in the article of Lanz
et al., 2013b (in the § Thresholds assessment).
In the third part of the training the animal was taught to respond to audio-visual stimuli.
9° as what was done with auditory or visual stimuli, visuo-acoustic stimuli were introduced
separately. The animal was trained until it demonstrated stability and reliability in its
responses.
10° at this stage three different types of stimuli were introduced in the task. The choice of the
stimulus type was totally random (automatized procedure) and this step required a longer
period than all the steps before and challenged the animal.
11° finally the last component of the present task which was a visual target was introduced to
the animal. Such a target aimed at fixing the gaze of the subject (in the center of the screen)
could be easily taken as a visual stimulus by the animal so that it required a period of
adaptation and a reconditioning. The role of this target could be understood from an
electrophysiological point of view when it is known that eyes movements might create
artefacts during visual detection tasks. This target appeared when the animal pressed on the
lever (in the § Sensory-motor task in Lanz et al., 2013b) and both together initiated the trial.
Importantly these training stages were punctuated with various surgeries aimed at
implanting devices necessary for the head fixation and for electrophysiological recordings.
II.4.2 CT and MRI acquisition protocol
For the design of our various implants (headpost fixation and chronic recording
chambers) we have performed different imaging acquisitions like CT scan or MRI (see Lanz
et al., 2013a) in the cantonal Hospital of Fribourg (Hôpital fribourgeois). These protocols
were performed after agreement with the local veterinary authorities (Fribourg, Switzerland)
who allowed the transportation of the animals from the laboratory to the hospital. One can
note that a transport authorization was obtained beforehand from the veterinary office for
each acquisition. We are briefly going to report the two imaging procedures perform in our
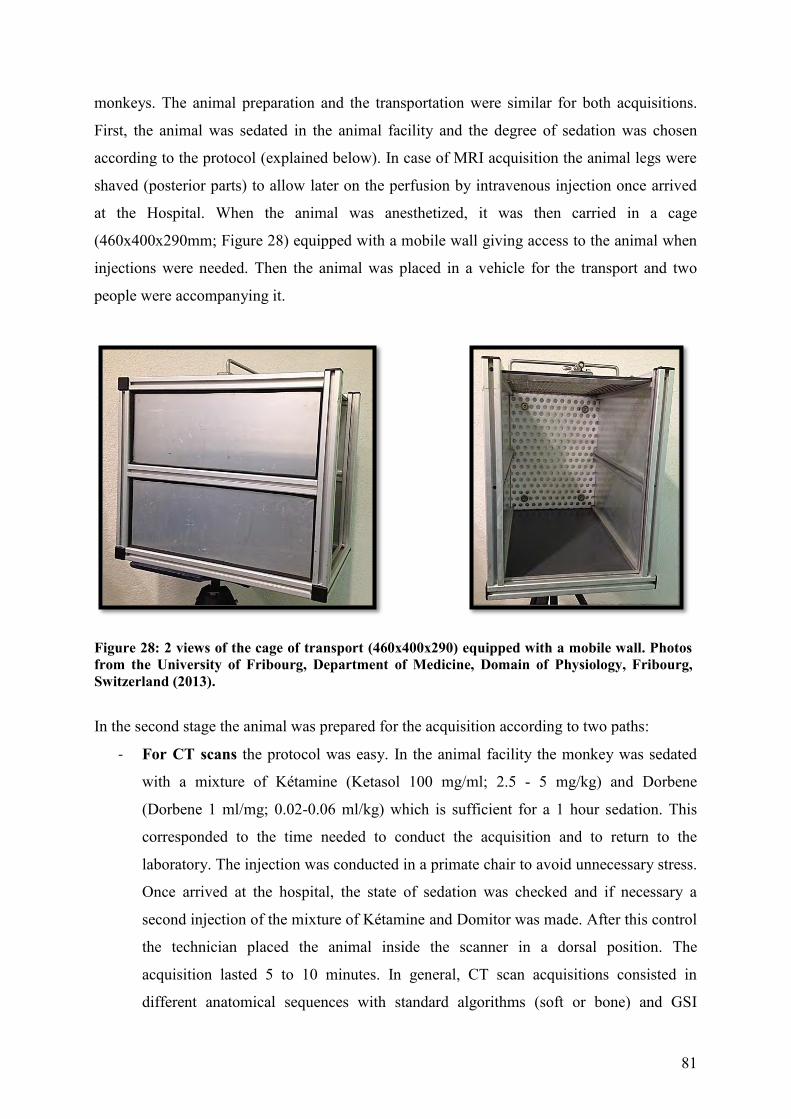
81
monkeys. The animal preparation and the transportation were similar for both acquisitions.
First, the animal was sedated in the animal facility and the degree of sedation was chosen
according to the protocol (explained below). In case of MRI acquisition the animal legs were
shaved (posterior parts) to allow later on the perfusion by intravenous injection once arrived
at the Hospital. When the animal was anesthetized, it was then carried in a cage
(460x400x290mm; Figure 28) equipped with a mobile wall giving access to the animal when
injections were needed. Then the animal was placed in a vehicle for the transport and two
people were accompanying it.
Figure 28: 2 views of the cage of transport (460x400x290) equipped with a mobile wall. Photos from the University of Fribourg, Department of Medicine, Domain of Physiology, Fribourg, Switzerland (2013).
In the second stage the animal was prepared for the acquisition according to two paths:
- For CT scans the protocol was easy. In the animal facility the monkey was sedated
with a mixture of Kétamine (Ketasol 100 mg/ml; 2.5 - 5 mg/kg) and Dorbene
(Dorbene 1 ml/mg; 0.02-0.06 ml/kg) which is sufficient for a 1 hour sedation. This
corresponded to the time needed to conduct the acquisition and to return to the
laboratory. The injection was conducted in a primate chair to avoid unnecessary stress.
Once arrived at the hospital, the state of sedation was checked and if necessary a
second injection of the mixture of Kétamine and Domitor was made. After this control
the technician placed the animal inside the scanner in a dorsal position. The
acquisition lasted 5 to 10 minutes. In general, CT scan acquisitions consisted in
different anatomical sequences with standard algorithms (soft or bone) and GSI

82
imagery (for acquisition when the animal was implanted) performed in a GE
Discovery HD 750 (Figure 29).
Figure 29: GE Discovery CT HD 750 scanner. Image modified from http://www.ctmedicalscanners.com/ge-ct-scanners/ge-discovery-ct750-hd-ct-scanner/.
- For MRI, the protocol was more complex. The transport to the MRI facility was
performed under sedation with Ketamine (Ketasol ; 100 mg/ml ; 2.5 – 5 mg/kg) and
benzodiazepine (Midazolam chlorhydrate; 0.1 – 0.2 mg/kg) mixed in the same syringe
and injected in i.m.. As for the CT scan the injection was made in a primate chair. At
the MRI facility the animal is placed inside the scanner in a ventral position with the
head in extension hold in place by a MRI compatible set-up (in Plexiglas) (Figure 30).
During the whole procedure the animal was anesthetized by a continuous i.v. injection
of propofol / Ringer-lactate solution mixture (0.1 – 0.4 mg/kg/min) plus ketamine
(0.0625 mg/kg/min) using long sterile tubing from outside the MRI room. An
automatic syringe controlled the flow. The vital parameters of the animal (ECG, O2
saturation) were continuously monitored with a special captor. Oxygen supply was
also provided. The animal was surrounded by heat-insulating materials in order to
avoid hypothermia. In general MRI acquisitions consisted in different anatomical
sequences (3DT1, T2, DTI, FLAIR, SWAN, etc.) performed in a GE 3 tesla scanner.
A standard 32 channels head coil was used for the acquisition.

83
Figure 30: 2 different views of the animal placed in ventral position with the head in extension hold in place by a MRI compatible set-up (in Plexiglas). Photos from the University of Fribourg, Department of Medicine, Domain of Physiology, Fribourg, Switzerland (2013).
In both cases, the return of the animal in the laboratory facility was made under
permanent control to monitor the awakening phase.
II.5 Electrophysiology
II.5.1 Single-unit recordings in non-human primates
The electrophysiology recording sessions were performed in non-human primates
during the cross-modal task. Before the beginning of electrophysiological recordings, the
animal had to reach a plateau of performance in the behavioural data (see above). Neuronal
extracellular activity was recorded in the right premotor cortex (PM) of both monkeys
through the implanted chronic recording chamber (see article Lanz et al., 2013a for more
detail). The choice of the stimuli intensities and the data analysis are explained in the
paragraph Electrophysiology of the article Lanz et al., 2013b.
II.5.2 Electroencephalography (EEG) in the human subjects
Beforehand, it is important to mention that this part of the study is only a pilot study, a
kind of feasibility study carried on a limited number of human subjects (n=4). Indeed, this
study aimed at advancing the stability and the replication of the method used in the non-

84
human primates. However, it was obvious that this study in parallel aims, in the future, at
creating a bridge between the non-human primates and human subjects.
The EEGs were performed in human subjected enrolled in the cross-modal task.
Before electrophysiological recordings acquisition, the human subject’s auditory threshold
was determined (the visual threshold was the average value derived from the 10 subjects
engaged in the behavioural session). The EEG recordings were performed with a cap
containing 65 active electrodes regularly distributed over the scalp (Figure 31: actiCAP, Brain
product GmbH, Gilching, Germay). The EEGs recordings required an impedance of 25 kΩ on
the active electrodes, obtained by placing an electrolyte-gel in between the electrode and the
skin (ABRALYT HiCl 10%, Abrasive Electrolyte-Gel; EasyCap GmbH, Steingrabenstrasse
14, 82211 Herrsching, Germany). The Global Field Power (GFP) was derived from the entire
brain’s surface.
Figure 31: Photograph of a 65 electrodes cap used for EEG recordings. From the website of Brain product GmbH
The evoked potentials (EPs) signals were amplified (BrainAmp DC, Brain product
GmbH, Gilching, Germany, filtered (High Pass and Low Pass), collected, displayed online
and stored on a SSD drive using a 64-channel EEG system (BrainVision Recorder, Brain
product GmbH, Gilching, Germany).
The sensory-motor task was generated and controlled by a customized workstation,
elaborated form RpvdsEX software (Tucker-Davis Techonologies, US) and an eye tracking
system (ISCAN Inc., USA). However the electrophysiological data were recorded with the

85
software BrainVision (BrainVision Recorder / Analyzer, Brain product GmbH, Gilching,
Germany).
These data, analysed offline, were then exported into the Cartool software, developed
by Denis Brunet (Geneva University Hospital and Medical School, Geneva, Switzerland)
(Brunet et al., 2011). For the analysis (offline), various filters were used. The EPs signal was
filtered between 1 Hz (high pass) and 40 Hz (low pass). In case of contamination with 50 Hz
electric noise, we could use a 50 Hz notch. EPs were derived from more than 200 averaged
sweeps. For every stimulus delivered, the recording time window started 100 msec pre-
stimulus and terminated 500 msec post-stimulus (total duration: 600 msec). For each signal
and for defined pre-stimulus delay, every mean signal was recorded, then subtracted from this
signal for all time points. This procedure, commonly named «Baseline Correction», allowed
making sure that the effects observed during post-stimulus period were not present during the
pre-stimulus phase. In the present experimental protocol, the baseline correction used is in a
time window of 100 msec. before the stimulation.
II.6 Timeline in non-human primates
To summarize the time course of the various consecutive experimental steps, a
timeline for each monkey is shown in the next figure (Figure 32). This figure is also shown in
the article Lanz et al., 2013a.
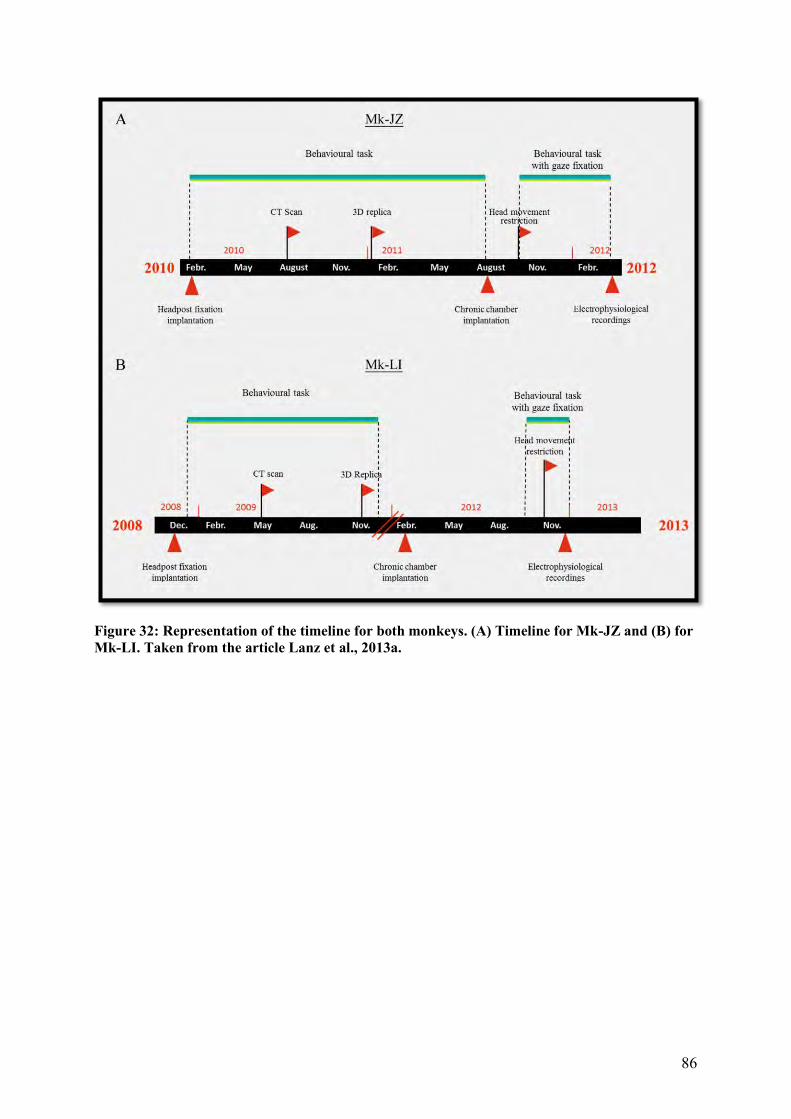
86
Figure 32: Representation of the timeline for both monkeys. (A) Timeline for Mk-JZ and (B) for Mk-LI. Taken from the article Lanz et al., 2013a.

87
II.7 Article in methodology
The present thesis work required first to develop new approaches in order to conduct
behavioural and electrophysiological investigations in non-human primates over a very long
period of time (several years). In the past, according to our experience in the laboratory, when
dental or orthopedic cement was used to anchor head fixation devices or chronic recording
chambers, the bone skull suffered very badly from the presence of the cement, leading to a
strong degradation of the bone health condition. As a result, the implants were lost,
conducting to the interruption of the experiment, with the frustrating loss of the enormous
time invested before to train the monkeys. Indeed, after the deterioration of the bone skull, it
was nearly impossible to re-implant the monkeys. For this reason, our goal was to refine the
implantation method in order to ensure a fixation mode which lasts several years. The
hypothesis was that if cement is omitted in the fixation procedure, one may obtain a more
stable anchoring, lasting several years. However, such an approach requires implanting the
animal far earlier, so that the bone can grow above the implanted material. A further
hypothesis was that such osseo-integration can be enhanced using an appropriate coating,
attracting the bone rather than repulsing it as the cement does. This part of the thesis work
thus follows the principle of the 3Rs in the context of animal experimentation (“Refinement”
in the present case).
A precise and comprehensive survey of this whole methodological development, with
the related results, can be found in the article (Lanz et al., 2013a). More specifically, it
describes the development of a headpost fixation device in titanium (with the aim of fixing
the gaze), the new design of chronic recording chambers in tekapeek, as well as the surgery
necessary for the various implantations and different results. In addition, several procedures
dealing with the maintenance of the implants (cleaning of the chronic chamber, cleaning of
the skin around the implants, etc) are illustrated in the form of video sequences, accessible as
described in the article Lanz et al., 2013a.

88
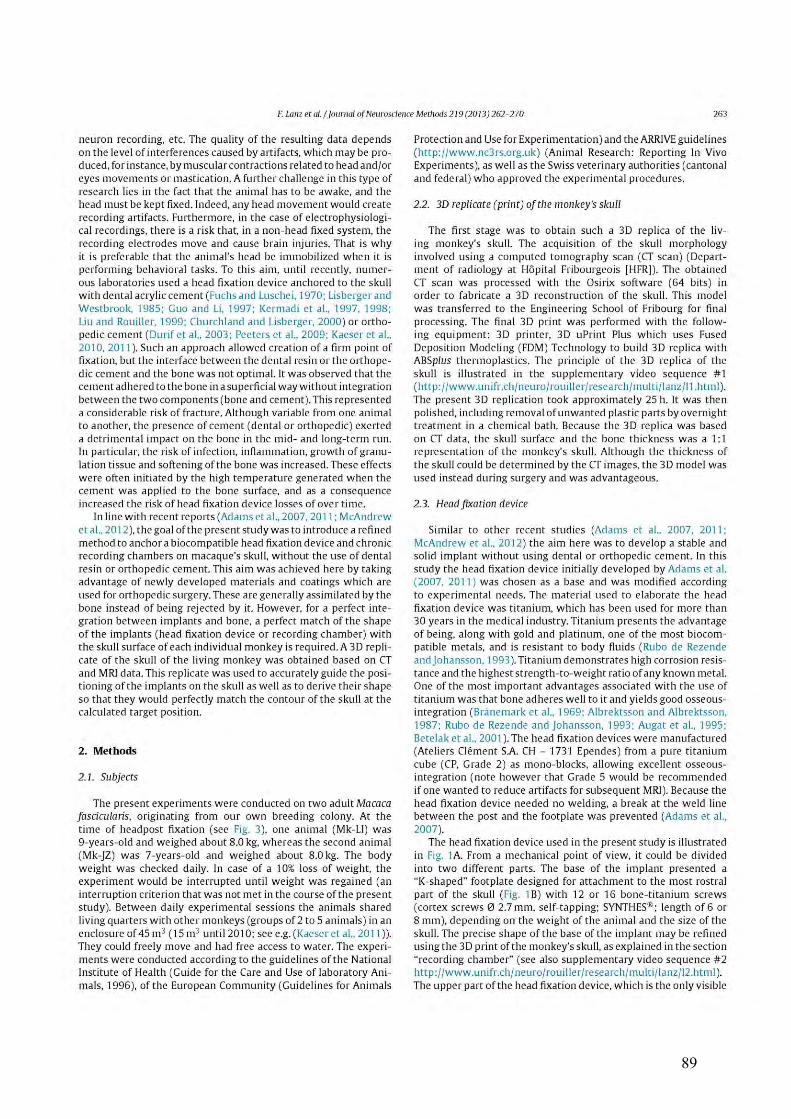
89

90
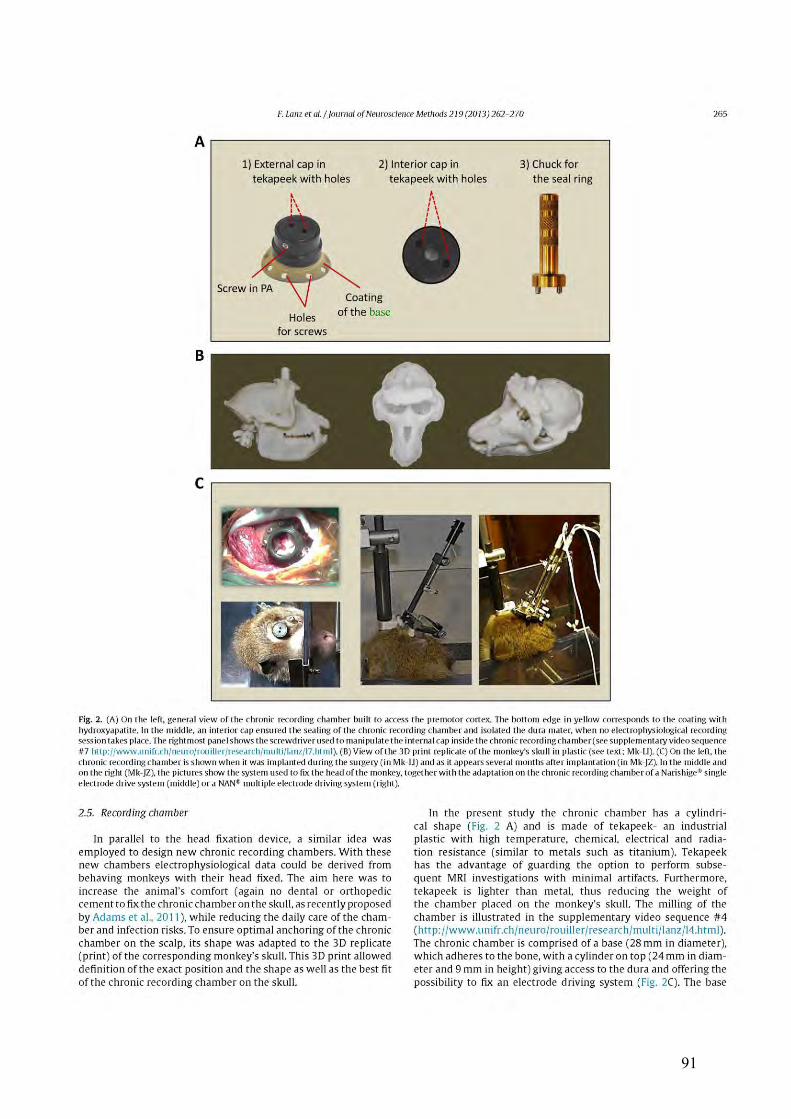
91

92

93

94
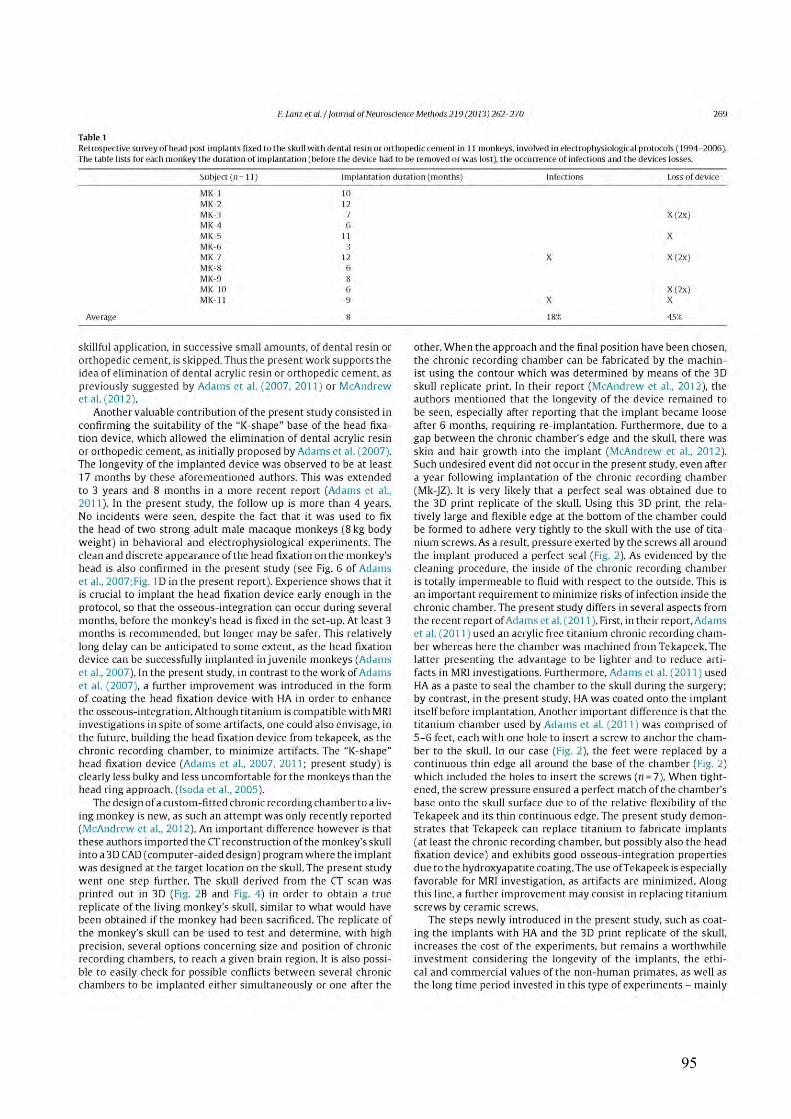
95

96

97
Conclusion
The work, reported in the article Lanz et al., 2013a, extended and refined previous
studies conducted by Adams et al. (2007 and 2011) in order to optimize the anchoring of
various implants in the field of the non-human primates’ chronic experiments. We thought
that the use of the hydroxyapatite in the device coating was necessary for the optimization of
the research with our experimental models. This in spite of the constraint time: indeed, several
months (3 months) were necessary between the surgery and the first head fixation (in the case
of the head fixation device). The advantages of these implants were: 1. The longevity of the
anchoring (no loss of device); 2. The use of personalized implants, that was custom-fitted
implants; 3. A decrease of infection occurrences; 4. The possibility to remove and replace an
implant; 5. The reduction of the number of animals used in this type of experiments (3R
initiative, in this case “Reduce”).

98
III. Results
III.1 Non-human results
The aim of the present thesis work, following the development of new methodological
approaches, was to record neuronal activity in the premotor cortex of non-human primates
(Macaca fascicularis) during a multisensory-motor integration task. With these
electrophysiological recordings, we aim at testing the hypothesis according to which the
premotor cortex (PM) is a site of early convergence of auditory and visual inputs.
Consequently, the PM may initiate faster motor responses when triggered by multimodal (in
our case visuo-acoustic) stimulation, as compared to unimodal stimulation. In the past, in our
laboratory (Céline Cappe’s Ph.D thesis), it was demonstrated in the non-human primates that
during a visuo-acoustic integration, the bimodal reaction times (RTs) was shorter than the
unimodal RTs. Secondly, based on single-unit electrophysiological recordings, it was shown
that in a specific-modality cortex (in this case, the auditory cortex), some neurons were able
to respond to auditory or/and to bimodal (=multimodal neurons) stimuli. Other recent studies
(Kayser et al., 2009; Falchier et al., 2010) confirmed this finding, as well as in other
unisensory cortex, such as the visual cortex (e.g. Wang et al., 2008).
For this study, we focused our interest to a polysensory, sensorimotor cortical area, the
premotor cortex (PM), where different inputs from various modalities converge (auditory,
visual, and somatosensory). The results of these investigations obtained in two monkeys can
be found in the article (Lanz et al., 2013b). Briefly it describes the different behavioural
assessments of the multisensory integration process in monkeys, such as reaction times, the
percentage of errors and errors progression with practice. During a second step, single unit
recordings were derived from PM in the same two monkeys executing the behavioural
paradigm.

99

100

101

102

103

104

105
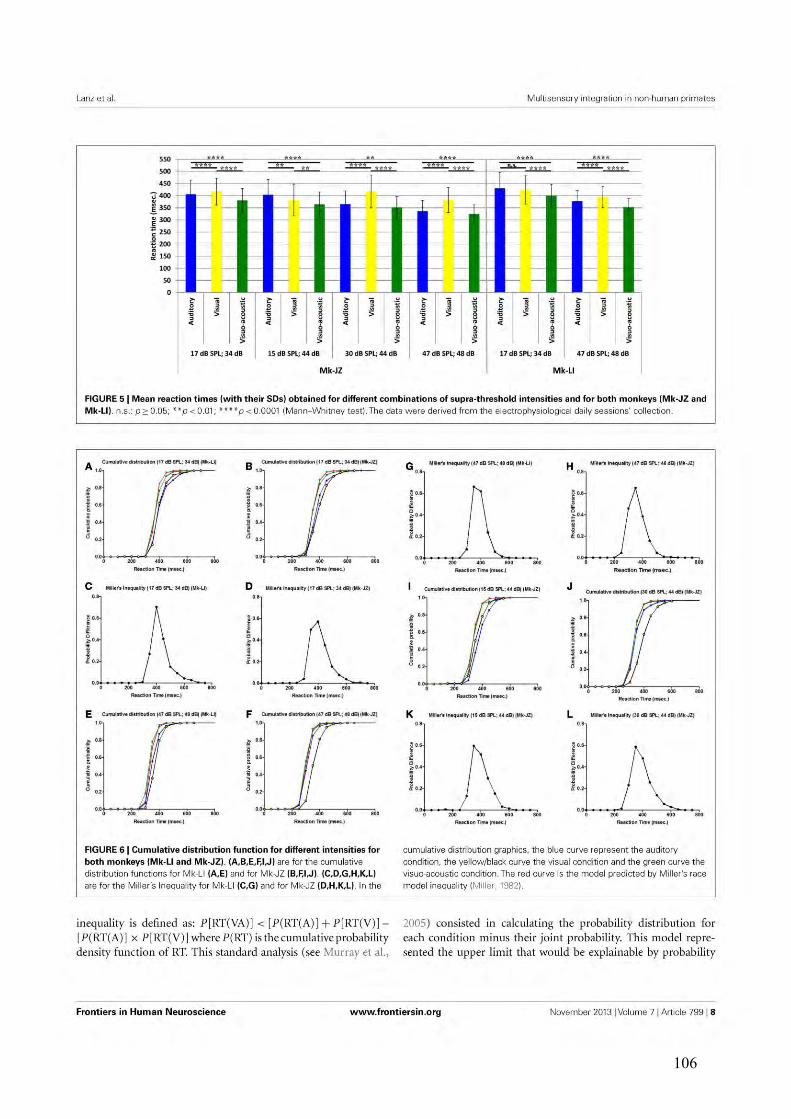
106
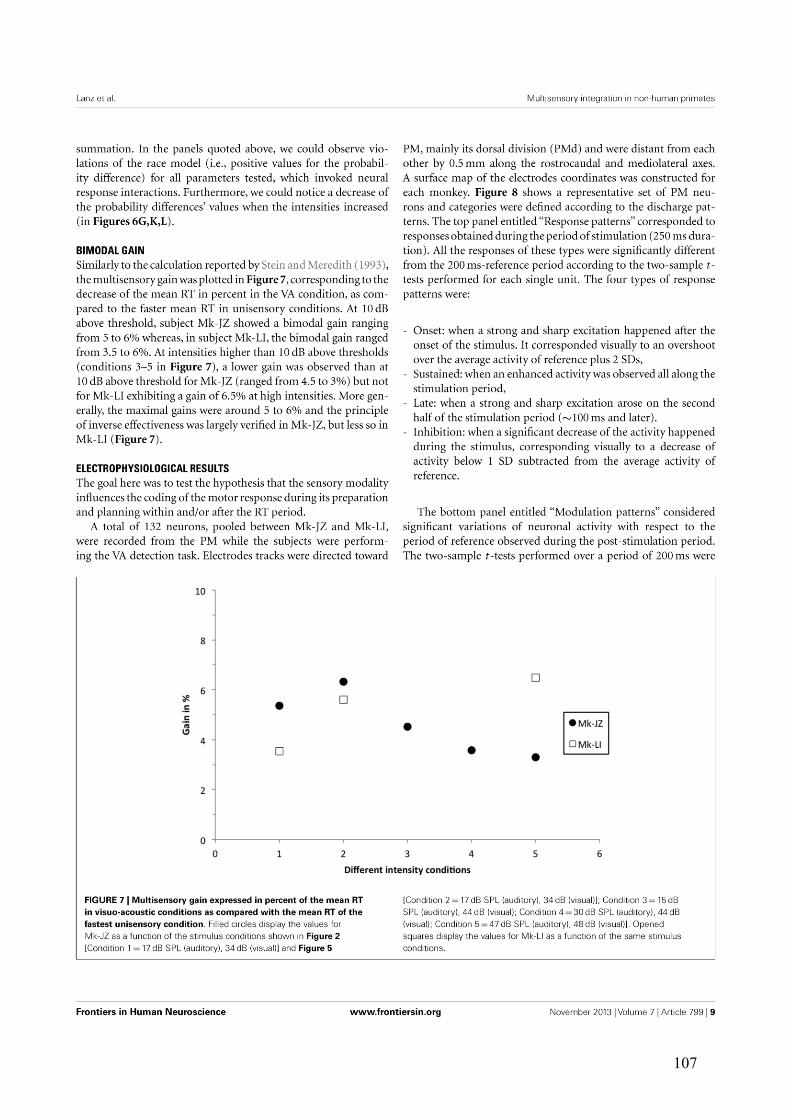
107

108

109

110

111

112

113
114
Conclusion
The present study, reported in the article Lanz et al., 2013b, yielded from a
behavioural point of view in non-human primates results consistent with the literature
(Rowland et al., 2007; Wallace et al., 2007, Cappe et al., 2010). The common conclusions are
that the bimodal stimulation improved the detection speed (decrease of RTs) and the
performance (decrease of errors). The second part of this work relates to the single unit
recordings derived from the premotor cortex (PM). From these electrophysiological data, we
were able to create a classification of PM neurons according to the response patterns and the
modulation patterns when the monkeys performed the multisensory behavioural task. These
data are consistent with a convergence of auditory and visual information in PM at neuronal
level, in the context of the present multisensory paradigm. However, the precise temporal
issue, namely the decrease of RT in the bimodal condition, remains to be investigated in more
detail at neuronal level, in combination with recordings and interventions in other brain
regions (also sub-cortically), believed to be part with PM to the neural network involved in
such multisensory integration process.

115
III.2 Human results
III.2.1 Introduction
As reminder (see Audiovisual integration in the Introduction), multisensory studies are
not restricted to the animal models. Indeed, very numerous studies on the broadcasting
(audiovisual) interactions (e.g. Giard and Peronnet, 1999; Molholm et al., 2002, Cappe et al.,
2010a, Senkoski et al., 2011; Gori et al., 2012), visuo-tactile (Gori et al., 2011) and auditory-
somatosensory (Murray et al., 2005; Sperdin et al., 2009) interactions were conducted on
human subjects. In this Ph.D thesis, we aim at extending knowledge on audiovisual
integration, derived from the pioneer studies of Giard and Peronnet, (1999) and Molholm et
al. (2002) which brought important behavioural and electrophysiological result. Briefly, these
studies demonstrated that, during a multi-modal stimulation (auditory and visual), reaction
times (RTs) were significantly shorter than unisensory RTs. These results are in line with data
derived from animals (Stein and Meredith, 1993; Cappe et al., 2010b). This behavioural
facilitatory effect during a multi-modal stimulation is commonly namely redundant signal
effect (RSE) (Raab, 1962, Miller 1982). The redundant signal effect, when proven by an
evaluation of the summation of probability, is indicative of a neuronal interaction occurring
early in the information processing. The behavioural analyses do not allow demonstrating
mechanisms as well as identifying the brain regions where these neuronal interactions take
place, electrophysiological studies are necessary. These electrophysiological studies (Giard
and Peronnet, 1999; Molholm et al., 2002, Talsma et al. 2007, Sun et al., 2009; Senkowski et
al., 2011) have demonstrated that this neuronal interaction occurred early after the stimulus
and that various brain regions were involved. First neuronal interaction occurred after 45 - 50
msec (Giard and Peronnet, 1999; Cappe et al., 2010a; Senkowski et al., 2011) in the posterior
scalp.
The present human data represent a counterpart of the study conducted on non-human
primates and reported in the article corresponding to the previous chapter of results. As
mentioned above in the chapter "Material and Methods", these human data were derived from
a feasibility study aiming at establishing in the future a link between the non-human primates
and human subjects based on the same experimental protocol of multisensory integration
(Chapter “Perspectives”).

116
As in the above article reporting on non-human primate data, this chapter will be divided in
two parts:
1. Behavioural assessment of multisensory integration: The reaction times (in the § III.2.3.1),
the analysis of the stimuli intensity effects (in the § III.2.3.2), as well as the bimodal gain (in
the § III.2.3.3) are the behavioural parameters presented in these paragraphs and derived from
a study conducted under my supervision with two students in biomedical sciences in the
course of their bachelor work. The behavioural results were obtained from a population of 10
subjects.
2. Electrophysiological assessment of multisensory integration (in the § III.2.3.4): The EEG
investigation was conducted in 4 human subjects, all members of the laboratory, who
performed the same multisensory task as that considered for the behavioural data. The present
electrophysiological part represents a pilot study at the level of the present Ph.D. thesis, which
may be extended to a larger population of human subjects (n=20) in a future step.
III.2.2 Material and Methods:
The methodological description for this experimental part was provided in the chapter
II (General Materials and Methods). Consequently, we here only remind essential essential
aspects.
The study was conducted on a total population of 14 human subjects (aged 20- to 30-
years old), distributed according to two different assessments of multisensory integration (in
the § II.1.2). Ten subjects were enrolled in the behavioural assessment and 4 other subjects in
the electrophysiological assessment. The distribution between genders was equal: 7 females
and 7 males. The multisensory integration evaluations were based on a positive reinforcement
protocol (Durif et al., 2003; Lanz et al., 2013b), requiring a sensory-motor task (in the § II.2.2
and II.2.4). For four subjects enrolled in the electrophysiological recordings, an EEG cap
containing 65 active electrodes regularly distributed over the scalp (in the § II.5.2) was used.
To be able to quantify the multisensory effect, two parameters were evaluated
according to the protocol in which the human subjects were enrolled: 1) Reaction times
(RTs), as well as the stimuli intensity effects on RTs during the behavioural assessment
obtained in three conditions: at 10, 20 and 30 dB above the sensory thresholds (obtained for
each individual modality); 2) The global field power (GFP) and the event-related potentials

117
(ERPs) topography during the electrophysiological assessment at 30 dB above the sensory
thresholds.
III.2.3 Results
III.2.3.1 Reaction Times (RTs): multisensory facilitation
For all human subjects (n=10), in which the sensory (auditory and visual) thresholds
were determined individually, the data were obtained from behavioural tests performed in
three distinct conditions: at 10, 20 and 30 dB above the threshold obtained for each individual
modality. For each intensity condition, the block of data consisted of 90 random trials. Data
were collected for each subject during a single test session. The distribution of RTs in
response to visual, auditory or visuo-acoustic stimulation, and for each condition, is displayed
in Figure 33, as obtained from 3 representative individual human subjects (S4, S6 and S8).
The seven other subjects are displayed in the part Appendix (Appendix 1).
A

118
B
C
Figure 33: Mean reaction times and their SDs obtained at 10, 20 and 30 dB above the unimodal thresholds. Data from 3 individual human subjects (S4, S6 and S8). n.s.: p≥0.05 ; *:p<0.05 ; **: p<0.01 ; ****: p<0.0001 (Mann-Whitney Test).
Generally, the graphs of Figure 33 show that, as expected, there is a decrease in RT
when the intensity of stimulation increased (10, 20 and 30 dB above the thresholds) for the 3
conditions (V, A and AV). We also noticed that the mean visual RTs (yellow bars) were
longer than mean auditory RTs (blue bars), themselves longer than the mean visuo-acoustic

119
RTs (green bars). The mean visuo-acoustic RTs were shorter than the fastest mean RTs
obtained in response to unimodal stimulation (in this case the auditory stimulus), although this
difference was statistically significant for the subject S4 only.
Below, the description of the data obtained for the three individual human subjects illustrated
in Figure is presented.
First individual subject (Figure 33 A): S4
1° At 10 dB above the unimodal thresholds: the mean visual RT (437 msec) was not
significantly different (Mann-Whitney Test; p≥0.05) from the mean auditory RT (428 msec).
The mean visuo-acoustic RT (385 msec) was significantly shorter (p<0.05) than the RTs
obtained for each of the two unisensory stimulations. The mean RT in response to the visuo-
acoustic stimulation was significantly shorter (43 msec) than the fastest mean RT obtained in
response to unimodal stimulation (auditory in the present case).
2° At 20 dB above the unimodal thresholds: the mean auditory RT (358 msec) was
significantly shorter (p<0.05) than the mean visual RT (384 msec). The mean visuo-acoustic
RT (333 msec) was significantly shorter (p<0.05) than the mean RTs in response to each of
the two unisensory stimulations. The difference between the auditory and the visual mean
RTs was about 26 msec and the mean RT in response to the visuo-acoustic stimulation was
shorter (25 msec) than the fastest mean RT obtained in response to unimodal stimulation
(auditory in the present case).
3° At 30 dB above the unimodal thresholds: the mean visual RT (357 msec) was statistically
significantly shorter (p<0.05) than the mean auditory RT (333 msec). The mean visuo-
acoustic RT (309 msec) was significantly shorter than the unimodal mean auditory
(p<0.0001) and visual (p<0.01) RTs, with a decrease of 24 msec as compared to the fastest
unisensory stimulation (auditory).
Second individual subject (Figure 33 B): S6
1° At 10 dB above the unimodal thresholds: the results show that the mean visual RT (445
msec) was significantly longer (Mann-Whitney Test, p<0.05) than the mean auditory RT (396
msec). The mean visuo-acoustic RT (374 msec) was significantly shorter (p<0.0001) than the
mean visual RT, and also shorter (by 22 msec) than the mean auditory RT, although this
difference was not statistically significant (p≥0.05).
2° At 20 dB above the unimodal thresholds: the mean visual RT (345 msec) was significantly
longer (p<0.0001) than the mean auditory RT (287 msec). The mean visuo-acoustic RT (278
msec) was significantly shorter (p<0.0001) than the mean visual RT, but no statistically

120
significant difference (p≥0.05) was observed between the auditory and the visuo-acoustic
mean RTs, the latter being 9 msec shorter than the mean auditory RT.
3° At 30 dB above the unimodal thresholds: the mean auditory RT (265 msec) was
significantly shorter (p<0.0001) than the mean visual RT (319 msec). The mean visuo-
acoustic RT (260 msec) was significantly shorter (p<0.0001) than the mean visual RT, and
also shorter than the mean auditory RT (by 5 msec), but this last difference was not
statistically significant.
Third individual subject (Figure 33 C): S8
From a statistical point of view, this individual human subject (S8) is very comparable to the
second one (S6), in other words exhibiting statistically significant shorter mean auditory RTs
than mean visual RTs, at all 3 intensities tested. Furthermore, the mean visuo-acoustic RTs
were shorter than the mean visual RTs (statistically significant differences) and also shorter
than the mean auditory RTs, but the latter difference was not statistically significant, at all 3
intensities tested. The detailed RTs can be seen in Figure 33.
For the purpose of yielding a more global view of the behavioural results in the whole
group of human subjects, Figure 34 shows the distribution of the mean RTs in response to
visual, auditory or visuo-acoustic stimulations, and for each condition, cumulating the 10
human subjects enrolled in this part of the study. For the analysis of the cumulated data, we
have split the results according to the three intensity conditions.
1. At 10 dB above the unimodal thresholds: The results showed that mean visual RT (458
msec) was significantly longer (Mann-Whitney Test, p<0.0001) than the mean auditory RT
(422 msec). The mean visuo-acoustic RT (385 msec) was significantly shorter (p<0.0001)
than RTs for both unisensory stimulation. The difference between the auditory and the visual
mean RTs was about 36 msec and the mean RT in response to the visuo-acoustic stimulation
was shorter (37 msec) than the fastest mean RT obtained in response to unimodal stimulation
(Auditory in the present case).
2. At 20 dB above the unimodal thresholds: The mean visual RT (422 msec) was
significantly longer (p<0.001) than the mean auditory RT (384 msec), representing a
difference of ~38 msec. The mean visuo-acoustic RT (353 msec) was significantly shorter
than the mean unimodal auditory (p=0.0002) and visual RTs (p<0.0001), representing a
reduction of 31 msec with respect to the fastest unimodal stimulation (Auditory).

121
3. At 30 dB above the unimodal thresholds: The mean visual RT (392 msec) was not
statistically different (p≥0.05) from the mean auditory RT (385 msec). However, interestingly
the mean visuo-acoustic RT (341 msec) was significantly shorter (p<0.0001) than the
unimodal mean auditory and visual RTs, with a decrease of 44 msec as compared to the
fastest unisensory stimulation (again Auditory in the present case).
Figure 34: Mean reaction times and their SDs obtained at 10, 20 and 30 dB above the unimodal thresholds. Data cumulated from 10 human subjects. n.s.: p≥0.05 ; ***: p<0.001 ; ****: p<0.0001 (Mann-Whitney Test).
III.2.3.2 Stimuli intensity effects on RTs
In Figure 35, for the same data pool, we have reported the variation of mean RTs as a
function of stimuli intensities. The mean RT differences between all stimulation conditions
have been tested statistically using a Mann-Whitney Test. The results showed that, as
expected, an increase of the visual intensities led to a statistically significant decrease
(p<0.0001) of the RTs (yellow bars in Figure 35). The decrease in mean visual RTs was 36
msec between +10 and +20 dB above threshold, whereas it was 30 msec between +20 and
+30 dB above threshold. For the auditory stimulation alone (blue bars in Figure 35), the
effects of intensity were less systematic. Between +10 and +20 dB above threshold, the
decrease of the mean RT (38 msec) was statistically significant (p<0.0001). In contrast, the
mean RT difference between +20 and +30 dB above threshold was not statistically significant

122
(p≥0.05), limited to an increase of 1 msec. Concerning the visuo-acoustic stimulation
condition (green bars in Figure 35), the effects of the intensity were comparable to those
observed for the auditory stimulation alone. The results showed that increase of intensity from
+10 to +20 dB above threshold led to a decrease of mean RT (32 msec), which is statistically
significant (p<0.0001). Increasing the visuo-acoustic stimulation from +20 to +30 dB above
threshold provoked a limited decrease of mean RT (12 msec), statistically significant
(p<0.05). In all three modalities, the differences in mean RTs between stimulations at +10 dB
versus +30 dB above threshold were statistically significant (Figure 35).
Figure 35: Mean Reaction times and their SDs obtained for the three conditions of intensities within each modality (visual in yellow, auditory in blue and visuo-acoustic in green). Cumulated data obtained from 10 human subjects. n.s.: p≥0.05 ; *: p<0.05 ; ***: p<0.001 ; ****: p<0.0001 (Mann-Whitney Test).
To follow the same logic as the analysis of data presented in the non-human primate
article (Lanz et al., 2013b), we analyzed the cumulative distribution function and the Miller
race model inequality (Miller, 1982) for the present human behavioural data. This analysis
was conducted with the aim of determining if a redundant signal effect (RSE) is present or
not. Consequently, we calculated for every condition the cumulative distribution functions,
displayed in the left panels of Figure 36. The more the curve is shifted to the left, the shorter
is the RT, meaning a higher probability of occurrence at a given RT value. For every intensity

123
condition, if compared to the auditory and visual unimodal curves, one can observe a leftward
shift for cross-modal stimulation (AV) (corresponding to green curves in Figure 36).
In parallel and in addition, an analysis of Miller’s Inequality was tested for each
intensity condition. As a reminder, this equation defines itself as follows: P(RT(VA)) <
(P(RT(A)) + 8 P(RT(V))) – (P(RT(A)) x P(RT(V))). When the real value is bigger than the value
attended by the model, the model is violated (i.e. positive values for the probability difference). In
case of positive value, it means that a neural response interaction is involved, which was the case
in the 3 intensity conditions tested (10, 20 and 30 dB above threshold; right panels in Figure 36).
However, in contrast to the results obtained with the non-human primates (in the § III.1), we did
not obtain a decrease of the probability differences’ values when the intensities increased (Figure
36, right panels).

124
+10 dB
+20 dB
+30 dB
Figure 36: Cumulative distribution function for three intensity conditions and cumulated for the 10 human subjects. Left panels are for the cumulative distribution function and the right panels for the Miller’s Inequality. In the cumulative distribution functions, the yellow/black curves represent the visual condition, the blue curve the auditory condition and the green curve the visuo-acoustic condition. The red curve is the Miller’s race model inequality prediction (Miller, 1982).
0 200 400 600 8000.0
0.5
1.0
Reaction Time (msec.)
Cu
mu
lati
ve
pro
ba
bilit
y
0 200 400 600 8000.0
0.2
0.4
0.6
0.8
Reaction Time (msec.)
Pro
bab
ilit
y D
iffe
rence
0 200 400 600 8000.0
0.5
1.0
Reaction Time (msec.)
Cu
mu
lati
ve p
rob
ab
ilit
y
0 200 400 600 8000.0
0.2
0.4
0.6
0.8
Reaction Time (msec.)
Pro
bab
ilit
y D
iffe
ren
ce
0 200 400 600 8000.0
0.5
1.0
Reaction Time (msec.)
Cu
mu
lati
ve
pro
bab
ilit
y
0 200 400 600 8000.0
0.2
0.4
0.6
0.8
Reaction Time (msec.)
Pro
bab
ilit
y D
iffe
ren
ce

125
III.2.3.3 Bimodal gain
As reported in the article on the non-human primates (Lanz et al., 2013b), as well as in
the literature (Stein and Meredith, 1993; Cappe et al., 2010a), the bimodal or multisensory
gains were plotted in Figure 37, representing the decrease in percent of the mean RTs in
response to the visuo-acoustic stimulation as compared to the fastest unimodal stimulation.
We can observe that in the intensity conditions 1 and 2, which are +10 and +20 dB above
threshold respectively, the bimodal gains were similar (between 8.9 and 8.1 %). However in
the intensity condition 3 (+30 dB above threshold), surprisingly the bimodal gain even
increased up to 11.6 %, thus representing an unexpected increase of bimodal gain with
intensity. In other words, this observation does not coincide with the principle of inverse
effectiveness, at least in the range of intensities tested here in the present sample of 10
subjects.
Figure 37: Representation of the bimodal gain. These bimodal gains are expressed in percent, corresponding to the decrease of mean visuo-acoustic RT in % with respect to the mean RT of the fastest unisensory modality. Intensity condition 1 = 10 dB above the sensory thresholds. Intensity condition 2 = 20 dB above the thresholds and Intensity condition 3 = 30 dB above the thresholds.
126
III.2.3.4 Electrophysiological results
Before the description of our pilot (feasibility) study per se, we start first with
preliminary results derived from the very first subject enrolled in this detection task
associated with EEGs recordings. This initial subject did not appear in the feasibility study,
because this session was used only to test the equipment and the protocol. However, and in
spite of higher intensities used than the sensory thresholds (+ 30 dB), the results are
interesting and worth to be to introduce into this thesis.
The first results obtained were the analysis of global field power (GFP). To do it, we
had analyzed the GFP for every modality (Figure 38). The GFP was obtained by averaging
400 trials during a single session. The visual examination of the three GFPs revealed
differences between the latency and intensity of the evoked potentials (EPs), for each
modality. The EEG follow the trend observed for the behavioural results. The EPs latency in
response to the visuo-acoustic stimulation was shorter than the EP latencies in response to
unimodal stimulations (between 15 and 30 msec). Furthermore, the auditory EP latency was
shorter than the visual EP latency. This difference was only a few milliseconds (around 15
msec). The amplitude of the EPs also varied according to the modalities. The amplitude of
EPs in response to bimodal stimulation was larger than the unimodal EPs amplitude. The
amplitude of the auditory EP was smaller than that of the visual EP.
In addition, we performed an analysis of the overlapped waveforms and the GFPs
between the three modalities and the sum of the individual visual GFP and auditory GFP
(Figure 39). The latency observed for the multisensory stimulation was shorter than the
latency for the sum GFP (around 30 msec).

127
Figure 38: Representation of the overlapped waveforms of all electrodes (A,C,E) and the Global
Field Power (B,D,F) for each modality (Auditory in blue; Visual in yellow; Audio-visual in
green).
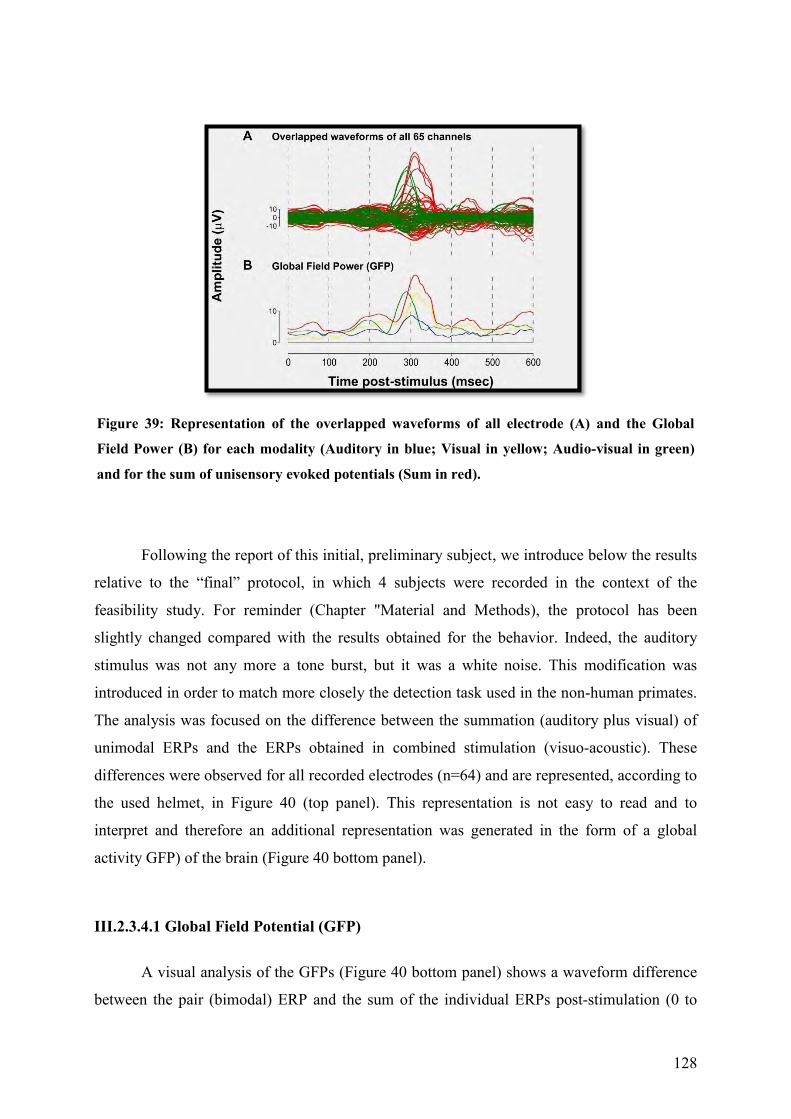
128
Figure 39: Representation of the overlapped waveforms of all electrode (A) and the Global
Field Power (B) for each modality (Auditory in blue; Visual in yellow; Audio-visual in green)
and for the sum of unisensory evoked potentials (Sum in red).
Following the report of this initial, preliminary subject, we introduce below the results
relative to the “final” protocol, in which 4 subjects were recorded in the context of the
feasibility study. For reminder (Chapter "Material and Methods), the protocol has been
slightly changed compared with the results obtained for the behavior. Indeed, the auditory
stimulus was not any more a tone burst, but it was a white noise. This modification was
introduced in order to match more closely the detection task used in the non-human primates.
The analysis was focused on the difference between the summation (auditory plus visual) of
unimodal ERPs and the ERPs obtained in combined stimulation (visuo-acoustic). These
differences were observed for all recorded electrodes (n=64) and are represented, according to
the used helmet, in Figure 40 (top panel). This representation is not easy to read and to
interpret and therefore an additional representation was generated in the form of a global
activity GFP) of the brain (Figure 40 bottom panel).
III.2.3.4.1 Global Field Potential (GFP)
A visual analysis of the GFPs (Figure 40 bottom panel) shows a waveform difference
between the pair (bimodal) ERP and the sum of the individual ERPs post-stimulation (0 to

129
450 msec post-stimulus). This difference began at ~60 msec after the onset of the stimulation.
This latency is coherent with previously reported data (Giard and Peronnet 1999; Foxe et al.,
2008; Cappe et al., 2010b). For the continuation of our study, we focused on a period of
interest (POI) ranging from 60 to 90 msec.
Figure 40: Representation of the waveforms differences between the pair and sum ERPs. Top panel: Representation of ERPs for all electrodes (n=64), displayed for the “pair” (bimodal) in black and the “sum” in red. Bottom panel: Waveform from GFP (global field potential) for the pair in black and the sum in red. A difference between these curves is observed during a period of interest (POI); between 60 and 90 msec post-stimulation.
III.2.3.4.2 ERP topography
For this analysis we estimated the topographic differences between the pair ERPs and
the sum ERPs. The period of analysis corresponded to the previously quoted period that is
between 60 and 90 msec. The topography resulting from this analysis showed a maximal

130
difference over the right temporal scalp (Figure 41). This maximal difference, pointed in the
Figure by a cross, as the results obtained by analysis of the Miller’s race model Inequality,
indicates that a neuronal interaction took place during the combined (AV) stimulation.
Figure 41: Representations of the ERPs topography between 60 and 90 msec after stimulus onset. The two voltage maps on the right in blue represent the difference between the AV condition minus the sum of the unimodal conditions (A plus V stimuli). The positivity obtained on the posterior and temporal regions in both views indicates a subbaditive interaction.
III.2.3.4.3 Source estimation With this analysis and during our POI, we wanted to localize electric sources in the brain. For
this we have used a distributed source estimation procedure; the “LAURA” based on the MNI
template with 5007 points of inverse solution. Recent studies on auditory and visual
integration support the application of the LAURA approach (Murray et al., 2004; Murray et
al., 2006).
According to the obtained results (Figure 42), we could notice that neuronal interactions
during the period going from 60 to 90 msec post-stimulation took place to the right at the
level of the visual cortex, but also at the level of the auditory cortex. Similar results were
obtained in a previous study by Cappe and collaborators (Cappe et al., 2010b). However it
seems that the part of the visual cortex activated in our case is more caudal, that is in the
posterior parietal cortex. This would correspond to the activation of areas 18/19, which are
secondary and tertiary visual areas respectively, but also the area 7 (associative parietal
cortex).

131
Figure 42: Representation of the inverse solution (POI: 60 – 90 msec).
III.2.4 Discussion
Our present data collected on human subjects (feasibility study) showed a facilitatory
effect when the unimodal stimuli were combined, as previously reported (Giard and Peronnet,
1999; Forster et al., 2002; Molholm et al., 2002; Lovelace et al., 2003; Martuzzi et al., 2007;
Senkowski et al., 2011). This effect was reflected by reaction times shorter during the visuo-
acoustic stimuli presentation than during unimodal stimuli. This effect occurred for all tested
intensities conditions (10, 20 and 30 dB above the thresholds). We also notice that the mean
auditory reaction times (RTs) (in unimodal condition) were shorter than the mean visual
reaction times. This difference was also observed by Giard and Peronnet (1999), reported as

132
auditory dominance. It means that an auditory dominant subject will have shorter reaction
times for the auditory stimuli and conversely in case of visual dominance. This notion of
sensory dominance was important during the reading of the event-related potentials (ERPs)
topography. Indeed, differences at the level of the activated areas during the early neuronal
interactions occur according to the sensory dominance of the subject. This notion is detailed
in the general discussion (in the § IV.2.2). Like Senkowski et al. (2011), we performed an
assessment of the stimuli intensity effects on RTs, this with the aim of confirming or
contradicting the inverse effectiveness (IE) principle, principle according to which the gain
during a bimodal stimulation is more important when the intensities of stimulation are close to
absolute sensory thresholds. In contrast to what we obtained in the non-human primates (Lanz
et al., 2013b) and Senkowski and al. (2011) obtained in humans, we were not able to
demonstrate an IE here on our human subjects. Our result demonstrated even a more
important gain when we increased the intensities of stimulations, though in the 10 to 30 dB
range tested.
The Miller’s Inequality analyses demonstrated us that this facilitatory effect,
commonly named redundant effect signal (RSE) was greater than the prediction by the Race
model (Raab, 1962). Consequently, the audiovisual integration was not due to an independent
processing from sensory inputs (=Race model), but these interactions were due to early
neuronal processing. Several candidates, such as subcortical regions could influence this
facilitatory effect. As such, we could cite the thalamus. Indeed, anatomical studies (Morel et
al., 2005; Cappe et al., 2009b) highlighted the thalamic projections to the premotor cortex,
originating from multisensory thalamic nuclei. Consequently, the interactions in the thalamus
may contribute to faster motor responses triggered by the visuo-acoustic stimulation.
In the second part of this study, we recorded the global field power (GFP) during the
same multisensory-motor task. As compared with the literature (Giard and Peronnet, 1999;
Molholm et al., 2002; Cappe et al., 2010; Senkowski et al., 2011), the ERPs topography
revealed an early interaction during the bimodal stimulation. The latency observed in the
literature demonstrated early interaction between 45 – 50 msec post-stimulation; in our case
the interaction occurred after 60 msec. With regard to the literature we can mention that our
intensities were weaker, what could explain this difference of latency. Indeed, as proven in
the results on behavior, a stimuli intensity increase caused a decrease of reaction times. This
notion is not to be confused with the multimodal gain decrease when we increase the
intensities (IE principle). From a topographical point of view we observed a maximal
difference over the right temporal scalp. That is in line with the literature.

133
In conclusion, we saw that the results obtained from a behavioural and
electrophysiological point of view are generally consistent with the results of various studies
available in the literature. The low number of human subjects (n=4) does not allow us to
apply relevant statistics. However, we can say that this protocol, used previously in the non-
human primates, is stable and repeatable. Thereby we can satisfy our second hypothesis
according to which the multisensory properties observed in the monkeys can be reproduced in
the human subjects. This conclusion supports the aim of transferring in the future the
knowledge acquired in the non-human primates towards the humans (translational research)
(in the § IV and V).

134
IV. General Discussion
This general discussion will articulate around the three axes delineated by three main
lines of research conducted in the course of the present Ph.D. thesis: (i) the initial
methodological developments; (ii) the behavioural investigations; (iii) the
electrophysiological studies. It is proposed at that step to treat altogether the behavioural and
electrophysiological data obtained in both the non-human primates and in the human subjects.
The present work is a logical continuation of a previous work conducted in the laboratory of
Professor Eric Rouiller, concerning the multisensory integration at the level of the auditory
cortex (Céline Cappe's Ph.D. thesis, 2007). More specifically, in her thesis work Céline
Cappe has established in non-human primates the presence of various multisensory cortico-
cortical (heteromodal connections) interactions, as well as at thalamo-cortical level;
furthermore, she demonstrated the presence of neurons responsive to visual and visuo-
acoustic stimuli in the auditory cortex. The present thesis represented a crucial step towards a
necessary refinement of the experimental protocol and an extension of the investigations to
another cortical area, the premotor cortex in non-human primates. In addition, the present
work successfully established the translation of the experimental protocol from the non-
human primates to human subjects. The main facets of the present thesis work are: 1) adapt
and improve the previous multisensory detection protocol in both non-human primates and
humans (Lanz et al. 2013 a et b; feasibility study), in order to allow the recording of neurons
in other cortical areas (e.g. premotor cortex, thalamus) in monkeys and EEG in humans; 2)
compare our behavioural data for this detection paradigm with previous studies available in
the literature (in the § Behavioural results); 3) analyze and interpret the electrophysiological
data, single unit recordings in the premotor cortex of two monkeys (in the §
Electrophysiological Results in Lanz et al., 2013b) and EEG in four human subjects
(feasibility study).
IV.1 Methodology
For the general discussion related to the initial methodological developments, we will
linger mainly on further issues dealing with the various chronic implants used in the non-
human primate model. However, let’s start with a few considerations related to the
modifications introduced to the different parameters defining the detection protocol finally

135
applied to both non-human primates and human subjects. As compared to the previous
protocol (Cappe’s thesis), a major change affected the visual parameters, such the properties
of the stimulus itself and the target for the gaze fixation. These modifications are the result of
preliminary discussions with Dr Pascal Würth, specialized in the acquisition of data on the
visual system (University hospital of Bern). The modifications are as follows:
- The target for the gaze fixation is no more a cross or a square, but a round shaped target
placed in the center of a black background screen. Indeed, by using a round target, we
naturally "facilitate" the gaze fixation by the subject. The previous choice of a cross as target
presented the inconvenience that the subject was prompted make saccadic eye movements
with the aim of scanning the four extremities of the cross. Indeed it is crucial to avoid eyes’
movement artifacts during the electrophysiological recordings.
- The shape of the flash stimulus was also modified. We used a round green LED (1.9 mm
circle). This LED was placed in the center of the target. The advantage of this central position
is again to focus the gaze during the presentation of the visual or visuo-acoustic stimuli.
Furthermore, the use of a LED allowed increasing the precision in the control of the light
intensity. Indeed, the intensity can be finely modulated by subtle modifications of its
frequency of excitation (more details in § Stimuli Lanz et al., 2013b). Therefore, and in
contrast to the previous protocol, we could here precisely measure the detection visual
threshold. This notion fits into the logic applied for the search of the auditory thresholds
thanks to a detection task.
As far as the auditory stimulus is concerned, no modification was introduced here, as
compared to Céline Cappe's thesis. We may question the possibility (in the future) to modify
the loudspeakers’ position. Indeed, according to the literature (Hughes et al., 1994; Frens et
al., 1995), the multisensory integration is facilitated when stimuli are located in the same
spatial alignment. Consequently, we may consider placing our loudspeakers in front of the
subject and not laterally. Nevertheless, in the present experimental conditions, the expected
multisensory facilitatory effect (e.g. decrease of the reaction time) was clearly present, thus
fulfilling the behavioural prerequisite requested to conduct the electrophysiological
investigations.
The second, main methodological development conducted in the course of the present
work concerns the various devices and chronic implants, as well as the 3D replica of the
monkeys’ skull with the aim to construct personalized implants (see detail in Lanz et al.,
2013a). As reminder, it is a headpost fixation implant in titanium and chronic recording

136
chambers in tekapeek. The use and the design of these devices were developed with the aim
of firstly increasing the animal’s comfort (3Rs Initiative) and, secondly, to guarantee the
stability of the implants on a long period of time, in order to prolong the time window of
electrophysiological investigations. The refinement of the method can be summarized by the
following characteristics:
- Non-use of dental or orthopedic cement to anchor the chronic implants to the skull.
- Natural osseo-integration by using hydroxyapathite coating.
- Decrease of the post-operative risk of infections by an antibacterial agent applied to the
hydroxyapathite coating (Medicoat AG).
- Longevity of the devices and no accidental loss of the implants.
- Custom-fitted implant according the 3D replica of the skull.
For the experimenter, these newly developed implants have also advantages:
- Decrease of daily care (e.g. cleaning).
- Fewer risks of infections or loss of the implants.
- Possibility to easily remove and replace the implants.
- Skull and bone thickness visualization with the 3D replica of the skull.
Moreover, there are further advantages linked to the non-use of dental or orthopedic
cement, as already argued by Adam et al. (2007, 2011), as well as by McAndrew et al. (2012).
The use of screws in titanium only, instead of cement covering screws for the implants
anchor, results in a decrease of the implant’s weight on the animal’s head, for a better daily
comfort. The use of screw only without cement necessitates however some precautions during
the surgery. It was indeed important to continuously flow saline solution during the insertion
of screws into the bone, in order to avoid an increase of the temperature, which may affect the
health of the bone. This precaution thus decreases the subsequent risks of loss and infections
at the level of the skull. Finally, the use of screws only without cement reduced dramatically
duration of surgery, as one can avoid the tedious and highly time consuming application of
cement layers by layers around the implant. In summary this first part of the thesis, extending
the techniques of Adam et al. (2007 and 2011) and of McAndrew et al. (2012) defines new
ethical guidelines in the spirit of the 3 Rs initiative, with the goal to improve the conditions of
the laboratory animals.

137
According to the overall chronology of the experimental protocol in non-human
primates (see Figure 32 in the § II.6), the first device implanted is the headpost fixation. This
implant in titanium is placed on the skull at its foreseen position, most rostrally as possible in
order to leave open all options to access brain areas, from the prefrontal cortex to the occipital
cortex. The legs of this device, forming a K shape of a thickness of 1.5 mm, allowed instantly
adjustments during the surgery to optimally fit the morphology of the animal’s skull. The
preoperative pre-shaping based on the use of the 3D Replica of the skull is however largely
sufficient to ensure a good fit with the skull contour, thus making the final adjustment a minor
task for the surgeon. The 3D replica of the skull was developed on the basis of a CT scan, and
then in the form of a collaboration with the school of architects and engineers of Fribourg.
The 3D replica of the skull is a major technical advancement as provides a precise
morphological representation of the skull (thickness of the bone, the roughness of the bone),
leading to personalize the various implants according to their anticipated location on the
skull’s surface. The length of the legs of the K-shape headpost, determined by the number of
screws per leg, is defined according to the weight of the animal. However the length of the
axis, the visible part of the device, is of 2 cm to avoid any problem with the environment of
the animal (e.g. height of the wire mesh of transfer cages). However, and according to
strengths and resistance calculations (S+D Scherly, La Roche, Switzerland), it may well be
that this length can be reduced.
A further improvement concerning this headpost device maybe the choice of the
material used to fabricate it. Indeed, we opted for a titanium rank 2, as used by Adams et al.
(2007). However, after more recent discussion with the S+D Scherly’s engineers, the use of a
titanium rank 5 may be a more adequate choice, especially if the experimental protocol
requires MRI acquisitions afterward. The significant difference between the rank 2 and the
rank 5 lies in the "amount" of artifacts engendered by the rank 2 titanium. The rank 5 titanium
is expected to generate none or very few artifacts during MRI acquisitions.
The second newly developed implant device is the chronic recording chamber. The
design of this chamber was also based towards the idea to not use cement for its anchoring.
For that, we again used titanium screws and the principle of osseo-integration. This approach
offered the same advantages for the animal as those obtained for the headpost fixation.
Thanks to the use of a home-made adapter, this chamber allows the use of a variety of multi-
electrodes or a single electrode drivers.

138
The advantage of using tekapeek to fabricate the chronic recording chambers lies in
the reduced weight (as compared to metal), as well as the possibility to conduct MRI session
acquisitions with little artifacts. For the future, and based on its validation by resistance
calculations, we may also produce the headpost fixation from tekapeek, to further reduce
artifacts during MRI or CT scan acquisitions. Nevertheless, in this context, there is still the
issue of using titanium screws, creating small artifacts. We can circumvent this problem in the
future with the insertion of porcelain screws or trying to stick the device with some glue
composed of hydroxyapatite (e.g. HydroSet Injectable HA Bone Substitute, Stryker®), with a
glue hardening in a few minutes and composed of synthetic bone as well.
In the future, and as mentioned above for the headpost fixation device, the size of
chronic recording chamber may also be reduced (based on a discussion with Prof. Stuart
Baker, Newcastle University). In our case, such size reduction would be an advantage,
because it would limit the length of the electrodes guides and thus decrease the risk of error as
for the angle of penetration with the recording electrodes. To reduce this kind of errors as
much as possible, we may have to manufacture for every non-human primate personalized
guides. For the next generation of chronic chambers, that will be used for the thalamic
recordings for instance (in the § V), a reduced length chamber will be considered, in addition
to a protrusion laterally in order to cover the skull opening caused by the previous chamber
above the premotor cortex (in the § Recording chamber, Lanz et al., 2013a).
In conclusion for this methodological part, and according to the results described in
the two recently published articles (Lanz et al., 2013 a and b), we can say that our general
experimental protocol in non-human primates is stable, reproducible and thus can be
considered as validated for future experiments.
IV.2 Behavior
For the general discussion related to the behavioural data obtained in non-human
primates and in human subjects, we will dwell on further issues dealing with the facilitatory
effect induced by a reaction time decrease in response to a visuo-acoustic stimulation, as
compared to unimodal stimulation. This part of the discussion will be split into two to sub-
139
chapter. The first one dedicated to the results obtained in the non-human primates and the
second for the results obtained in the human subjects.
IV.2.1 Behavior in non-human primates
In this sub-chapter, we will treat the various aspects bound to the behavioural results
obtained during the various phases of this thesis. We can mention that this sub-chapter was
already widely discussed in the second article (Lanz et al., 2013b). As described in the part
"Material and Methods", the behavioural evaluation was divided into two parts: the absolute
sensory thresholds research (auditory and visual) and the measure of various behavioural
parameters (RTs, percentage of success, types of errors, effect of the intensity during
unisensory and combined stimuli) bound to the multisensory task. This division follows the
temporal aspect of the project. In other words, the determination of the sensory thresholds was
a crucial step in the animal training for the purpose of achieving the final version of the
mutisensory-motor integration task, during which the various parameters (enumerated above)
were measured.
Consequently the first obtained behavioural data were the sensory absolute thresholds
(Appendix 1). It is easy to compare the auditory thresholds obtained with those of the
literature. Indeed, several studies conducted on the non-human primates are available. Briefly
(§ “Results, Absolute sensory thresholds”, Lanz et al., 2013b), the obtained auditory
thresholds (6.6 dB SPL for Mk-JZ and 7.9 dB SPL in Mk-LI) were very similar to auditory
thresholds (1-8 dB SPL) reported in the literature (Stebbins et al., 1966; Stebbins, 1973; 1975;
Pfingst et al., 1978; Smith and Olszyk, 1997) in various monkey species and using other
psychophysical methods.
Concerning the other modality, that was the visual thresholds (~24 dB), a comparison
with the literature (e.g. Cappe et al., 2010a) is difficult, if not impossible. For example: by
taking Céline Cappe’s thesis (protocol the most comparable to ours), too many modifications
at the level of the visual stimulus as well as in the measure of the threshold were brought,
making a direct comparison impossible. Consequently the comparison with previous studies
the literature, in which the protocols were even more different than in Cappe’s work, is not
possible either. However, there is apparently not strong reason to question the pertinence of
the visual thresholds measurements we have performed, as this psychophysical method has

140
already been conducted in the field of auditory threshold assessment (e.g. Smith and Olszyk,
1997).
Following the sensory thresholds evaluations, we continued the training of the animal,
to obtain behavioural data acquired when performing the multisensory-motor task per se.
Among the many parameters considered in the analysis and discussion parts of the
corresponding article (Lanz et al., 2013b), we shall focus here on the essential attribute,
namely the reaction times (RT). In a general manner, the RTs obtained in response to cross-
modal stimuli in the different intensity conditions tested are consistent with a facilitatory
effect, reflected by a decrease of RTs, as compared to individual auditory or visual
stimulation. This RT decrease was statistically significant in most cases in comparison to the
RTs obtained in unisensory conditions. These observations are in agreement with those
obtained in the study of Cappe et al. (2010a) in non-human primates, as well as other studies
conducted in human subjects (Giard and Peronnet, 1999; Molholm et al., 2002; Sperdin et al.,
2009; Fiebelkorn et al., 2011; Senkowski et al., 2011). This behavioural facilitation usually
known as redundant signals effect (RSE) might be best simulated with one or the other of two
different models: a) the race model (Raab, 1962; in the § I.4.2 and in Lanz et al., 2013b) and
b) the co-activation model (Miller 1982; in the § I.4.2 and in Lanz et al., 2013b). In our case,
the cross-modal RTs exceed the predictions established during the summation of probability,
what demonstrates a "redundant effect signal" (RSE). To determine if this RSE is the
consequence of one of the two models quoted above, we applied Miller’s inequality for every
condition. The results (Figures 6 Lanz et al., 2013b) showed a violation of these inequalities;
meaning the involvement of a neuronal interaction occurring early before the subject
generates a movement (Lanz et al., 2013b). Several anatomical (e.g. Morel et al., 2005; Cappe
et al., 2009b) and electrophysiological (Giard and Peronnet, 1999; Molholm et al. 2002;
Calvert et al., 2001) studies suggest possible brain locations and mechanisms possibly
involved in such early multisensory interactions. At cortical level, a network of inter-
connected polymodal areas could play a role as a putative origin of these RSE. For example,
we could quote the VIP area which receives inputs from somatosensory, auditory, visual and
vestibular systems (Duhamel et al., 1998; Schroeder and Foxe, 2002), or the prefrontal cortex,
receiving inputs from visual and auditory cortical areas (e.g. Romanski et al., 1999). These
projections or inputs confer to some neurons in these brain areas the capacity to respond to
several modalities and maybe integrate them into a unified perception. At the beginning of the
2000s, it was unexpectedly demonstrated that cortical areas considered so far as purely
unimodal had direct connections, namely heteromodal connections, with other unimodal

141
cortical areas (Schroeder et al., 2001; Falchier et al., 2002; Rockland and Ojima, 2003, Cappe
et al., 2007). Older studies also demonstrated the multimodal neurons existence within an
unimodal area (e.g. in the auditory cortex of the monkey: Watanabe and Iwai, 1991).
Consequently, the results derived from these studies diverge from the usual concept that
multisensory integration is involved only and late in the hierarchy in higher-order associative
areas; in contrast, these new data revealed that cross-modal integration may take place early
already in unisensory cortices, at rather low levels of cortical processing (Giard and Peronnet,
1999, Molholm et al., 2002, Schröder and Foxe, 2005; Ghazanfar and Schröder, 2006; Céline
Cappe’s Thesis, 2007). In our experimental protocol, the very fast generation of movements
triggered by a multisensory stimulus is likely to involve low level polysensory areas of
convergence, possibly sub-cortically, providing rapid access to cortical responsible for the
initiation of the movements (e.g. premotor cortex). According to previous anatomical studies
(Morel et al., 2005; Cappe et al., 2009b), inputs from polysensory nuclei of the thalamus to
the premotor cortex have been demonstrated and indeed may represent a rapid pathway for
the visuo-acoustic-motor integration. A potential candidate would be the pulvinar nucleus of
the thalamus. Indeed, the study of Cappe (Cappe et al., 2009b) demonstrated that this nucleus
receives projections from different sensory cortices. Furthermore, the thalamus is in position
to relay transthalamically quick and secure information between two remote cortical areas
(e.g. Rouiller and Welker 2000; Sherman and Guillery, 2006; Cappe et al., 2009b), including
the premotor cortex. Based on these anatomical and connectional data, the pulvinar nucleus is
an ideal candidate as anatomical support for the fast initiation of movements in response to
the detection of multisensory stimuli. This “thalamic” concept is elaborated in more detail in
the discussion of the article (Lanz et al., 2013b).
We have just seen that the RTs analysis based on the application of the Miller’s
inequality demonstrated that the multi-modal RTs decrease is due to a neuronal interaction.
However, and in the views of the various used conditions (modulations of intensities), other
parameters relating to RTs can be analyzed, such as the principle of inverse effectiveness. As
mentioned in the Introduction, the facilitatory effect, expressed in RT decrease (in msec.) or
in bimodal gain (in percent; see Lanz et al, 2013b), shows a relationship between its efficacy
and the intensities of the respective stimuli. This relationship, commonly named inverse
effectiveness (Stein and Meredith, 1993; Holmes, 2009), specifies that when the intensity of
the stimuli increases, the bimodal facilitatory effect decreases. In our case, this would mean
the more the visual and auditory intensities increase the more the difference between the

142
unimodal and the multi-modal RTs decreases. In line with the results obtained by Cappe et al.
(2010a), as well as in her thesis, and in spite of an intensity range limited between 10 and 40
dB over the threshold, we have also observed the inverse effectiveness effect, for both
monkeys enrolled in the non-human primate study.
In recent publications (Cappe et al., 2010a; Sendowski et al. 2011), a relation between
the inverse effectiveness and the Miller’s inequality can be applied: the more the intensity is
close to the threshold, bigger is the amplitude of the inequality. However, after analyses of the
Miller’s inequality, it turns out that we did not notice this relation between the intensity and
the inequality amplitude. As a reminder, this observation of the inverse effectiveness was
demonstrated first of all during electrophysiological acquisitions (Meredith and Stein, 1986),
in the superior colliculus (SC). The fact of not being able to observe this effect on the
inequality may be explained by two factors:
1 ° According to Klemen and Chambers (2011), multisensory interactions can occur without
the criteria established in the models of the SC. This argument follows the Angelaki and al.
(2010) hypothesis, suggesting that the super-additive responses are not necessarily a criterion
for all multisensory interactions.
2° The intensities tested were close to the sensory thresholds, in order to emphasize the
robustness of the facilitatory effect due to the multisensory integration. The application of
higher intensities may have better demonstrated this inverse effectiveness effect on inequality
possibly more predominant at higher ranges of intensity.
As additional information to the analyses of RTs (important part of the behavioural
data), we analyzed the errors (percentages, types of errors). The importance of these data must
not be minimized, but their impact is less important. Nevertheless, like mentioned in the
literature (e.g. Meredith and Stein, 1986; Giard and Peronnet, 1999; Calvert and Thesen,
2004; Wallace and Stein, 2007; Stein and Stanford, 2008), better performance occurred
during a multi-modal integration, as compared to unimodal conditions. For us, the same
conclusion was met, as shown by the statistically significant decrease of the number of errors
in the bimodal condition (Figure 4 C and D, Lanz et al., 2013b).
In conclusion, these behavioural data obtained in non-human primates enables us to
validate the entire experimental protocol (in the § I.5). Indeed, we observed the expected
bimodal behavioural facilitation with a significantly decrease of the RTs in response to
combined stimuli and the principle of inverse effectiveness was largely followed in the non-
human primate model (in the § III.1). Consequently, these behavioural results prompted the

143
new development of methodological skills, with the aim to test our initial hypothesis,
suggesting that the premotor cortex may be a site for early convergence of visuo-acoustic
integration.
IV.2.2 Behavior in human subjects
As mentioned throughout this thesis, a feasibility study was conducted on human
subjects. The basic idea being to be able to compare the human results with those obtained on
the non-human primates with an identical protocol. Consequently, and according to this aim,
the behavioural analyses were identical in the two groups of subjects (monkeys and humans).
The structure of the discussion relative to the human subjects will be also the same as for
monkeys for the sake of consistency.
We will begin here with some initial comments concerning the sensory thresholds.
Indeed, the average auditory and visual thresholds were not calculated in the course of the
behavioural assessment per se. Indeed, the sensory thresholds (in the § II.2.3) were
determined once before the behavioural session per se and for every subject. Furthermore,
every subject carried out only once the behavioural session. Consequently, the variability
inter-subject is too large for, from a scientific point of view, to cumulate these data. However,
the absolute auditory thresholds obtained in response to 1000 Hz pure tones were consistent
with the values reported in the literature, i.e. between 5 and 10 dB SPL (Botte et al., 1989).
The comparison of the visual thresholds with those of the literature is again more difficult,
because, to our knowledge and as commented in the non-human primate behavioural
discussion, no similar protocol was used previously. We are aware that this aspect of the
protocol differs from that of the monkeys, in which the thresholds were averaged from data
collected over several months. However, there are several arguments which can explain this
difference:
- The human subjects (n=10) involved in this behavioural protocol did not
perform electrophysiological recordings. Consequently the duration necessary
for the task execution is not long enough to observe an attention decrease.
- In contrast to monkeys, the human subjects do not need a learning period,
requiring consolidation periods to carry out this sensory-motor task.

144
- In contrast to the humans, the two monkeys were involved both in behavioural
and electrophysiological assessments. Consequently, it would be tedious to
evaluate, for example, the sensory thresholds before each electrophysiological
data acquisition. Indeed, between the time required for the sensory measures
and the time required for the electrodes positioning, the animal would be
demotivated or would not be concentrated enough for the continuation of the
experiment.
- Furthermore, the multisensory task learning required several steps including
consolidation/stabilization phases. For example, during the period of auditory
threshold measurement (several months), the data of the first weeks were not
considered, because the animal exhibited too much variability.
The choices as for the various parameters of stimuli (type of acoustic cue, shape of the
flash, the color of the flash, the intensity) do not allow easy comparisons with the literature
concerning the audio-visual integration in human subjects. Nonetheless, several studies (e.g.
Giard and Peronnet, 1999; Molholm et al., 2002; Senkowski et al., 2011) were conducted on
human subject in the context an audiovisual integration, though with significant differences in
their protocol.
As discussed for the non-human primates, we are going to detail the RTs aspect.
Indeed, the study of Giard and Peronnet (1999) showed shorter mean auditory RTs than mean
visual RTs during audiovisual integration (RTa < RTv). In contrast, the study of Sun and al.
(2009) demonstrated shorter RTs for the visual stimuli than for the auditory stimuli (RTv <
RTa). In our case, the results are comparable to those obtained by Giard and Perronet (RTa <
RTv). Consequently, if we believe in the rules of the sensory dominance, as proposed by
Giard and Peronnet (1999), our subjects would present an auditory dominance (auditory RT <
visual RT). We shall discuss impacts of this sensory dominance on the results in the next sub-
chapter (in the § IV.3.2).
The observation of RTs during the various conditions (+10, +20 and +30 dB) indicates
a facilitatory effect when the presented stimuli were combined. This effect is statistically
significant by comparison with mean RTs obtained in response to unisensory stimuli. This
observation is consistent with previous data available in the literature (Giard and Peronnet,
1999, Molholm et al., 2002; Ross et al., 2007; Senkowski et al., 2011). These observations in
the human subjects are also in line with those observed in non-human primates (Cappe et al.,
2010a; Lanz et al., 2013b). The expression in percent of this facilitatory effect, the so-called

145
bimodal gain, also revealed a substantial gain in term of RTs decrease. Therefore, we applied
the same analyses as in the non-human primates, in order to demonstrate the existence of the
redundant signal effect (RSE), as well as the notion that the cross-modal RTs exceed the
predictions established during the summation of probability. Additionally, we applied Miller’s
inequality, which showed a violation of the model. Consequently, in line with the monkeys
data, these results cannot be simply explained by the shorter modality processing, indicative
then of neuronal integration occurring early.
However, and in contrary to what was expected, we did not see the inverse
effectiveness (IE) effect. It is possible that our choice of intensities tested was not the most
pertinent and that higher intensities would have required to address this inverse effectiveness
effect issue. The latter interpretation is supported by data derived from the study of
Senkowski and al. (2011). These authors were able to determine during an audio-visual task
in human subjects the principle of IE. It is important to note this effect is low (but present)
and that the chosen intensities were clearly higher (40, 65 and 90 dB) than ours.
The relationship (Senkowski et al., 2011) between the intensity increase and the amplitude
increase of the Miller’s Inequality could not be demonstrated in our case. Indeed, in our study,
the amplitude of the facilitatory effect had no relation with the intensity of stimulation.
In conclusion, the behavioural results allowed to validate the multisensory-motor task
newly developed in human subjects as well. The human behavioural results demonstrated the
facilitatory effect obtained with a combined stimulus. What suggests that the induced RSE
takes place early in neuronal integrating processing at cortical level. Furthermore, the
similarity of the results between the non-human primates and the human subjects with the
same task allows validating this psychophysical protocol with the goal, in the future, to offer
an extrapolation from the animal model to the human model. Besides the protocol validation
itself, we confirmed (at least for the behavioural part) our working hypothesis that the
multisensory facilitation properties observed in the non-human primates with this specific
experimental protocol can be successfully reproduced in humans.
IV.3 Electrophysiology
For the general discussion related to the electrophysiology data obtained in non-human
primates and in human subjects, we will dwell on further issues dealing with the single-unit

146
recordings in non-human primates (n=2) (detailed in Lanz and al. (2013b)) and with
electroencephalography data (EEG) in the human subjects (n=4). This part of the discussion
will be split into two to sub-chapter according the subjects and the type of recordings.
The electrophysiological part aimed at responding to our main hypothesis, according
to which the premotor cortex (PM) may be a site for early convergence of audiovisual inputs
in the context of the present bimodal detection task, as well as based on previous data in other
contexts (Graziano 1999 and 2001). As an initial introduction to this chapter, a brief reminder
is needed concerning two articles of reference dealing with audiovisual integration at the
electrophysiological level (Giard and Perronet 1999; Molholm et al. 2002). These two articles
make collectively reference to the precocity of the neuronal interactions (=early convergence).
These interactions were observed as early as from 40 msec (45 msec for Molholm et al. 2002)
post-stimulation. In complement to these observations, which can be compared with our
results, it is interesting to notice the effect of visual or auditory dominance mentioned by
Giard and Perronet (1999), a property observed for the first time.
In parallel to these human studies, electrophysiological recordings conducted in the
non-human primates in the 90s (e.g. Wise et al., 1997) demonstrated the role of PM in the
preparation of the voluntary movement. The very fast motor response and neuronal responses
(with certain pattern) to a multisensory stimulation can be the consequence of a premature
convergence of sensory information, for example at the subcortical level. This hypothesis is
supported by various studies at subcortical levels, linked with the motor cortex, such as the
superior colliculus (Meredith and Stein, 1986; Rezvani and Corneil, 2008; Cuppini, 2010).
IV.3.1 Neuronal recordings in non-human primates
The discussion about the non-human primates’ electrophysiological recordings was
already treated (in detail) in the article specifically concerning the results (Lanz and al.,
2013b). However, we propose here to summarize the content and to bring some additional
arguments.
Data based on the activity of a total of 132 neurons (pooled between the two monkeys)
during a visuo-acoustic detection task allowed us to determine/define several neuronal
patterns. We were able to classify the neurons into 7 patterns of activity distributed into two
main classes (Table 6): 1) the "responses" patterns, defined by neuronal activity modifications
during the presentation of the stimulus and 2) "modulation" patterns, neuronal spiking

147
changes taking place after the sensory stimulation. In the first class, four patterns were
identified:
a) ONSET: strong and sharp excitation at the stimulus onset.
b) Sustained: excitatory neuronal activity present during the entire stimulation
period.
c) Late: strong and sharp excitation in the second part of the stimulation period
(~100 msec latency and latter).
d) Inhibition: the neuronal activity decreased during the stimulus below 1 SD
subtracted from the average activity of reference.
In the second class the modulations of activity are composed by 3 patterns:
a) OFFSET: strong and sharp excitation after the stimulation period.
b) Post-sustained: enhanced neuronal activity along the post-stimulation period
c) Inhibition: decrease of neuronal activity after the stimulations period.
Table 6: Distribution of the single neurons’ activity type into two main classes, with different patterns obtained during electrophysiological recordings in non-human primates.
Response Patterns Modulation Patterns
ONSET OFFSET
Sustained Post-sustained
Late Inhibition
Inhibition
This classification was introduced according to criteria relative to the neuronal activity
(enhancement or decrease) in comparison to a 200 msec-reference period preceding the
stimulation, as well as to the latency of these activities (during the stimulation or post-
stimulation). The terms, “Response and Modulation” (< 250 msec), chosen to define these
neuronal classes are very important. In the case of response patterns neurons, we could
conclude that the stimulation affected rather directly the spiking activity of a PM neuron. In
this case, especially with ONSET neurons, we are in presence of multisensory neurons or of
unisensory neurons able to respond either to an auditory stimulus or a visual stimulus.
Although we are in PM, such neurons behave more like “sensory” cells than neurons linked to
the motor attributes of the behavioural task. In the case of modulation patterns, although the
neuronal activity is also linked to the stimulation, such activity is likely to be more related to

148
the preparation of the motor response itself, possibly modulated by the modality of the
sensory stimulus. The two classes of neurons in PM (Responses and Modulation Patterns)
may thus reflect two successive epochs along the entire sensory-motor integration leading to
the generation of the motor act triggered by the detection of an expected sensory stimulus.
Due to the massive training, if not overtraining, of the two monkeys for this task, it is very
likely that the motor acts are highly automatized and may thus be delegated to other (lower)
structures than the motor cortical areas (e.g. subcortically in the brain stem or in the basal
ganglia). As a result, the “motor” activity in PM may be reduced for such a detection task
after intensive training, as compared to an earlier training phase. This may explain the
relatively low proportion of neurons in PM truly influenced during the present study, as
activity was recorded when the monkeys were overtrained. It would certainly be interesting to
record activity in PM earlier during the training phase, although this is clearly more
challenging as the monkeys exhibit more chaotic behaviors, not necessarily compatible with
stable and long enough periods of activity to collect enough trials. As far as the comparison
with the existing literature is concerned, besides what was said in the related article (Lanz et
al., 2013b), especially studies in non-human primates, there are few electrophysiological
studies, such as EEGs, or imaging studies, such as fMRI, conducted in human subjects (e.g.
Jones and Callan, 2003; Lee and Noppeney, 2011; Okada et al., 2013) in the context of
multisensory integration in the premotor cortex (see below human data). However, and to the
best of our knowledge, no specific study based on single unit recordings was made to date in
PM in the context of a sensory detection task per se, as most studies were based on the
principle of a conditional task with delay. More precisely, no similar study requiring a
detection behavioural paradigm, and comparing unisensory stimulations and bimodal
stimulations, was made to date in non-human primates.
In conclusion, these PM single-unit electrophysiological data in non-human primates
demonstrated the presence of two main classes of neurons, the Response and the Modulation
patterns, which were both influenced in the course of the detection behavioural task
performed by the monkeys. According to the neuronal activity patterns and the latencies of
these activities observed, these PM neurons remain candidates as players in the rapid
translation from sensory detection into motor acts, with the possibility that differences in
responses between modalities may be the substrate for differences in RT depending on
whether the stimulation was unimodal or bimodal. Further studies with recordings in the
thalamus, combined with reversible inactivation investigations also in the thalamus (e.g.
149
pulvinar nucleus), are needed to further elucidate the precise neuronal circuit underlying early
multisensory facilitation, as observed in such bimodal detection paradigm. Separate reversible
inactivations of primary, secondary visual and auditory cortical areas, as well as associative
cortical areas, may also indicate to what extents each of them are involved or not in such
detection task. Such an approach may also help to decipher the precise role played by
subcortical associative nuclei (SC, thalamus) in early multisensory integration.
IV.3.2 Electrophysiological recordings (EEG) in humans
As mentioned along this Ph.D thesis, a feasibility study conducted on human subjects
was developed and analyzed according to comparable criteria as those applied in the non-
human primate study. The feasibility study aimed at establishing the link between the single-
unit recordings obtained in the non-human primates and the EEGs results obtained in the
human beings. This concept of link will be further developed in the paragraph "Perspective”
(in the § V). It is true that it is not straightforward to compare electrophysiological data when
recording techniques and the systems of acquisition are not the same between animals and
humans. In the direction of unifying the experimental approaches, at the moment, the EEGs
recordings in the monkeys require several adjustments, especially in awake and behaving
monkeys (see Gindrat et al., 2013 in preparation; EEG data in anesthetized monkeys). Indeed,
no study so far reported EEG recordings during a sensory-motor task in the non-human
primates. The EEG studies conducted on awake non-human primates (Gardner et al., 1984;
McCarthy et al., 1991; Peterson et al., 1995; El Kharroussi et al., 1997) are very rare and they
do not involve a protocol requiring a voluntary action of the animal. At the other extreme,
intra-cortical recordings in human beings is not possible at the moment, due to technical and
ethical limitations. Consequently, and as described in the next chapter (in the § V), the EEG
recordings in non-human primates remains an option, although the technical difficulties are
serious for an application to behaving monkeys.
Back to our EEG data in humans, we can mention that the data were derived from
three human subjects (n=3), the fourth one was eliminated from the analysis due to substantial
artifacts during the acquisition which may have biased the results. Consequently, an extension
of this study to additional subjects is necessary to obtain more satisfactory results on
statistical point of view.

150
Therefore, this limited number of subjects at that step restricts the direct comparison
with the literature, with studies based on larger numbers of human subjects (Giard and
Peronnet, 1999; Molholm et al., 2002; Fort et al., 2002; Talsma et al., 2007; Cappe et al.,
2010b; Senkowski et al., 2011). Nevertheless, we observed in our EEG data early interactions
at ~60 msec. latency, consistent with those obtained by the authors mentioned above. These
data are indicative of an early interaction at neuronal level in relation to the multisensory
process. Consequently, we focused our analysis on a latency period ranging from 60 to 90
msec post-stimulation. This latency range is comparable to one considered by Cappe et al.
(2010b), as well as Giard and Peronnet (1999): 40 to 90 msec post-stimulation. This temporal
analysis (early neuronal interactions) is complementary to the behavioural results described in
the previous chapters and, altogether, they suggest that the facilitatory bimodal effect
reflected by the RTs may result from these early neural interactions (Lanz et al., 2013b). The
analysis of the EEG in the humans offers a more comprehensive spatial representation of
activities than the single-unit recordings, limited to the restricted brain area investigated. The
spatial analysis (ERPs topography analysis) is likely to provide useful indications regarding
the very first brain regions involved in the audiovisual integration required in our detection
paradigm. To determine the brain areas involved in relevant information processing during
periods going from 60 to 90 msec post stimulation onset, we have compared the ERPs
obtained during bimodal stimuli (= Pair ERPs) and the ERPs representing the sum of the
visual and auditory ERPs (= Sum ERPs). In other words we applied the following formula:
where x represents the robust activity difference regions; AV the pair ERPs’ topography and
A+V the sum ERPs’ togography. Several studies used the same approach (Giard and
Peronnet, 1999, Cappe et al., 2010b; Senkowski et al., 2011). In our case, we observed an
activation of the posterior et right temporal region. These results, in spite of a limited number
of subjects, are consistent with those reported by Giard and Peronnet (1999), Cappe et al.
(2010), as well as Senkowski et al. (2011). In contrast however to Senkowski et al. (2011),
but in agreement with Cappe and al. (2010b), we did not find multisensory interaction at the
level of the anterior electrodes. According to Talsma and al. (2007, 2010), interactions at such
frontal level indicates an implication of attentional mechanisms. What do we understand by
attention? By this question, we are going to introduce here some additional information about
the role played by attention in multimodal integration. Indeed, this theme was not developed
in the introduction of this Ph.D thesis. Attention is a cognitive process defined as, according
to William James (1890):

151
“Everyone knows what attention is. It is the taking possession by the mind, in clear and vivid form, of one out of what seem several simultaneously possible objects or trains of thought. Focalization, concentration, of consciousness are of its essence. It implies withdrawal from some things in order to deal effectively with others, and is a condition which has a real opposite in the confused, dazed, scatterbrained state which in French is called distraction, and Zerstreutheit in German”
Attention can be divided into two principle components: the selective attention and the
divided attention. Briefly, in the selective attention, we can speak about visual and auditory
attention. The selective attention brings in a concept of facilitation and inhibition. Indeed, a
modality is facilitated whereas the other one is inhibited. In our case, the divided attention is
pertinent because it represents the ability to pay attention to more than one task at same time.
This definition is very similar then to the definition which we may formulate to characterize
multisensory integration. And just like multisensory integration, the divided attention
improves with training (Sternberg and Sternberg, 2009). Nevertheless what are the
neurological principles necessary for the attention? How do we pay our attention? Researches
allowed to advance two processing (also similar from a terminological point of view to those
used in multisensory): it is the « bottom-up » and the « top-down » processing:
- The bottom-up is also called exogenous attention or stimulus-driven attention
(Fort’s thesis, 2002; Cappe’s thesis, 2007; Talsma et al., 2010). This form of
attention can be oriented by the physical properties of stimuli, for example. This
orientation is automatic and may consequently be not voluntary. According to
Posner and Petersen (1990), this process of attention involves the parietal and
temporal cortices, as well as the brainstem. In case of exogenous attention, the
display of a stimulus of different modality, but spatially matched, the processing of
this second one will be facilitated.
- The top-down is also known as endogenous attention or goal-driven attention
(Talsma et al., 2010). The endogenous attention allows selecting an attribute over
another. This process is voluntary. Consequently, the person pays its attention
towards a specific sensory information. This process takes place in the frontal
cortex, as well as in the basal ganglia (Posner and Petersen, 1990; Posner and
Rothbart, 1998; Pessoa et al., 2003; Pessoa et al., 2009). Endogenous attention also
improves the performances during conditions of low sensitivity (facilitatory
effect).
In conclusion, we can see that the attention has an influence on the cross-modal
interactions. According to Fort (Fort’s Ph.D Thesis, 2002), the attention has effectively an

152
influence on the bimodal interactions, but this effect depends on the sensory dominance of the
subjects (in the § IV.2.2) (e.g. auditory or visual) and on the cortical area under investigation
(e.g. auditory cortex / visual cortex). Fort’s Ph.D thesis, very interestingly, demonstrated a
non-parallelism, according to the terms of her author, as for the phenomena observed in the
various cortices. Indeed, the interactions in the auditory cortex were dependent on the
attention. It means that, in subjects with auditory dominance (what is the case in our study
with human) and in the auditory cortex, an inhibition of the processing of combined stimuli is
observed when the subject pays its attention on the visual stimuli. However, the recordings in
the visual cortex demonstrate activities during combined stimuli, irrespective of the attention
carried out by the subject.
To return to the analysis of the EEGs, it appears that defining the process of attention
solely on the activation of the anterior electrodes is inadequate. Indeed, the various processes
of attention (bottom-up and top-down), as well as the study of Talsma and Woldorff (2005a),
suggest neural activations in broader brain areas in relation to attentional processing. For
example, the study of Talsma (2005a), dealing with selective attention and multisensory
integration, allowed the identification of brain regions involved, based on the latency period.
It turned out that the process of attention began at the level of the frontal cortex after 100
msec., followed by an activity in the centro-medial region between 160 and 190 msec. In our
case, we did not notice significant early interactions at the level of the frontal cortex. For this,
two explanations are plausible: 1) Our analysis focused on the latency period going from 60
to 90 msec, precedes the relevant period reported by Talsma and Woldorff (2005a). 2) EEGs
have a high temporal resolution, but less so on the spatial aspect and therefore the present
spatial analysis may have missed some focus of activity.
The analysis of sources estimations, an approach developed by Murray et al., (2004,
2006), confirmed that neuronal interactions occuring during this early period (60-90 msec),
based on the topographic analyses of the ERPs, yield comparable results as the analysis
LAURA. Nevertheless, we were able to notice that some activated areas are not as posterior
as that seen in the topography analysis. It is the case for example for the areas 18/19 (visual
secondary areas), as well as the area 7 (somatosensory area).
In conclusion, we were able to observe early evoked brain activity during EEGs
recordings. These results are consistent with those obtained in the literature (Giard and
Peronnet, 1999; Molholm et al., 2002; Fort et al., 2002; Talsma et al., 2007; Cappe et al.,

153
2010; Senkowski et al., 2011). The localization, as well as the early activity period, is
compatible with the information concerning subjects with auditory dominance (Giard and
Peronnet, 1999). Indeed, for this type of subjects, interactions take place between 40 and 150
msec, in occipital regions. Our feasibility study represents a first step towards the goal to
collect reproducible electrophysiological data in human subjects, when executing a protocol
comparable to that conducted on the non-human primates.
IV.4 Necessity to evaluate the behavior and the electrophysiology
In the discussion developed above, we separated voluntarily the behavioural and
electrophyisological results. However it is necessary to keep in head that generally these
results cannot be separated. Indeed they form a whole. For it we are going to refer to the
studies of Gu et al., (2008) as well as Angelaki et al., 2009 which demonstrated the
importance to integrate a psychophysical behavioural task during the study of the neuronal
mechanisms.
It was demonstrated that the multisensory integration follows predictions where the Bayesian
statistical inferences (in the § I.4.5.1) can be applied. Indeed, psychophysical studies
(between 2000 and 2005) (e.g. Alais and Burr, 2004; Kersten et al., 2004), against the studies
led to the anesthetized animals (e.g. Meredith and Stein, 1986, Wallace et al., 1993)
demonstrated that the integration of various cues followed a combined linear integration.
From a probabilistic point of view, when a subject is in the presence of two perceptual cues,
the prediction wants that this subject shows a greater perceptual sensitivity than during the
presence of a single signal (Gu et al., 2008). In other words the unified perception is due to
the estimation of individual cue and this according to a linear model (For review (Angelaki
and al., 2009). Consequently to understand better the neural processing of sensory integration,
it is important to conduct studies on multisensory tasks assessment, that is psychophysics.
E.g. Studies similar to those led to the humans (e.g. Alais and Burr, 2004).
IV.5 Perspectives
In the present work data collected in both human and non-human primates represent
an important step in better understanding how the brain integrates two sensory modalities to

154
bring a unified perception of the environment. However, along the collection of these data, we
could figure out that the behavioral data collected from our non-human primate model could
be further used by trying to put them directly in relation with the various neuronal
distributions, classes and neuronal discharge patterns in order to label each behavioral during
the sensorimotor task. More precisely, an analysis establishing the connection between RT
and the electrophysiological recordings could be done for example for the purpose of
understanding the timing between the neuronal discharge/inhibition and the phase of
movement initiations. A mapping of the various neurons according to their classification
could be also made. This would allow determining if there are groups of neurons active
according to common criteria (of the same category) or instead more spreading.
Another important point would be to find a way to “bridge” the studies between non-human
and human primates. To achieve this the monkeys’ recording chambers should be removed
some EEGs’ should be recorded in awaken monkeys engaged in the same protocol. .
Therefore, we would have electrophysiological recordings like EEGs, LFPs and unitary
recordings at the level of the auditory cortex (previous work, Céline Cappe’s Thesis, 2007)
and in the premotor cortex and we would be able to compare these data with the EEGs
recorded from humans. It would result that in case of similarities, some multisensory
integration principles could be described in humans at neuronal level. To go one step forward,
a new recording chamber could be implanted in the non-human primate model to collect
neuronal responses from the thalamus in order to demonstrate from an electrophysiologcial
point of view the presence of cortico-thalamic projections that we indicated in the discussion
section of the present work.
Finally this approach would have a clinical impact by contributing to a better
adjustment of different biomedical devices for example by compensating a modality during a
cross-modal perception. One can also imagine that the discovery of new principles regulating
the exchange between high and low hierarchical levels could bring new insights in the
treatment of affections like autism or Asperger’s disease.

155
V. References Adams DL, Economides JR, Jocson CM, Horton JC. A Biocompatible Titanium Headpost
for Stabilizing Behaving Monkeys. Journal of Neurophysiology 98: 993–1001, 2007.
Adams DL, Economides JR, Jocson CM, Parker JM, Horton JC. A watertight acrylic-free
titanium recording chamber for electrophysiology in behaving monkeys. Journal of
Neurophysiology 106: 1581–1590, 2011.
Aitkin LM, Dickhaus H, Schult W, Zimmermann M. External nucleus of inferior
colliculus: auditory and spinal somatosensory afferents and their interactions. Journal of
Neurophysiology 41: 837–847, 1978.
Alais D, Burr D. The Ventriloquist Effect Results from Near-Optimal Bimodal Integration.
Current Biology 14: 257–262, 2004.
Albrektsson T, Albrektsson B. Osseointegration of bone implants: A review of an
alternative mode of fixation. Acta Orthopaedica Scandinavica 58: 567–577, 1987.
Allman, B.L., Keniston, L.P., Meredith, M.A. Not just for bimodal neurons anymore: The
contribution of unimodal neurons to cortical multisensory processing. Brain
Topography 21, 157-167, 2009
Amlôt R, Walker R, Driver J, Spence C. Multimodal visual-somatosensory integration in
saccade generation. Neuropsychologia 41: 1–15, 2003.
Angelaki DE, Gu Y, DeAngelis GC. Multisensory integration: psychophysics,
neurophysiology, and computation. Current Opinion in Neurobiology 19: 452–458,
2009.
Augat P, Claes L, Hanselmann K-F, Suger G, Fleischmann W. Increase of stability in
external fracture fixation by hydroxyapatite-coated bone screws. J. App. Biomater. 6:
99–104, 1995.
Baseler HA, Sutter EE. M and P components of the VEP and their visual field distribution.
Vision Research 37: 675–690, 1997.
Basso MA, Wurtz RH. Modulation of neuronal activity in superior colliculus by changes in
target probability. J. Neurosci. 18: 7519–7534, 1998.
Bastien-Toniazzo M, Stroumza A, Cavé C. Audio-visual perception and integration in
developmental dyslexia: An exploratory study using the McGurk effect. Current
psychology letters. Behaviour, brain & cognition 25, 2010.
Bear MF, Connors BW, Paradiso MA. Neuroscience: Exploring the brains, second Edition,

156
Lippincott Williams & Wilkins, 2002.
Bell AH. Crossmodal Integration in the Primate Superior Colliculus Underlying the
Preparation and Initiation of Saccadic Eye Movements. Journal of Neurophysiology 93:
3659–3673, 2005.
Bessel, F.H. Astronomische Beobachtungen in Königsberg 8, 3-8, 1823
Betelak KF, Margiotti EA, Wohlford ME, Suzuki DA. The use of titanium implants and
prosthodontic techniques in the preparation of non-human primates for long-term
neuronal recording studies. Journal of Neuroscience Methods 112: 9–20, 2001.
Bizley JK, King AJ. Visual–auditory spatial processing in auditory cortical neurons. Brain
Research 1242: 24–36, 2008.
Botte M.C, Canévet G, Demany L, Sorin C. Psychoacoustique et perception auditive, série
audition, les Editions INSERM, 1989.
Boussaoud D, Tanné-Gariépy J, Wannier T, Rouiller EM. Callosal connections of dorsal
versus ventral premotor areas in the macaque monkey: a multiple retrograde tracing
study. BMC Neurosci 6: 67, 2005.
Brandwein AB, Foxe JJ, Russo NN, Altschuler TS, Gomes H, Molholm S. The
Development of Audiovisual Multisensory Integration Across Childhood and Early
Adolescence: A High-Density Electrical Mapping Study. Cerebral Cortex 21: 1042–
1055, 2011.
Brånemark PI, Adell R, Breine U, Hansson BO, Lindström J, Ohlsson A. Intra-osseous
anchorage of dental prostheses. I. Experimental studies. Scand J Plast Reconstr Surg 3:
81–100, 1969.
Bremmer F, Schlack A, Shah NJ, Zafiris O, Kubischik M, Hoffmann K, Zilles K, Fink
GR. Polymodal motion processing in posterior parietal and premotor cortex: a human
fMRI study strongly implies equivalencies between humans and monkeys. Neuron 29:
287–296, 2001.
Brett-Green B, Fifková E, Larue DT, Winer JA, Barth DS. A multisensory zone in rat
parietotemporal cortex: Intra- and extracellular physiology and thalamocortical
connections. J. Comp. Neurol. 460: 223–237, 2003.
Brodmann K. Vergleichende Lokalisationslehre der Grosshirnrinde. Leipzig : Johann
Ambrosius Bart, 1909
Brunet D, Murray MM, Michel CM. Spatiotemporal Analysis of Multichannel EEG:
CARTOOL. Computational Intelligence and Neuroscience 2011: 1–15, 2011.
157
Calvert GA, Bullmore ET, Brammer MJ, Campbell R, Williams SC, McGuire PK,
Woodruff PW, Iversen SD, David AS. Activation of auditory cortex during silent
lipreading. Science 276: 593–596, 1997.
Calvert GA, Campbell R, Brammer MJ. Evidence from functional magnetic resonance
imaging of crossmodal binding in the human heteromodal cortex. Curr. Biol. 10: 649–
657, 2000.
Calvert GA. Crossmodal processing in the human brain: insights from functional
neuroimaging studies. Cereb. Cortex 11: 1110–1123, 2001a.
Calvert GA, Hansen PC, Iversen SD, Brammer MJ. Detection of Audio-Visual Integration
Sites in Humans by Application of Electrophysiological Criteria to the BOLD Effect.
NeuroImage 14: 427–438, 2001b.
Calvert GA, Thesen T. Multisensory integration: methodological approaches and emerging
principles in the human brain. Journal of Physiology-Paris 98: 191–205, 2004.
Cappe C, Barone P. Heteromodal connections supporting multisensory integration at low
levels of cortical processing in the monkey. European Journal of Neuroscience 22:
2886–2902, 2005.
Cappe C, Morel A, Rouiller EM. Thalamocortical and the dual pattern of corticothalamic
projections of the posterior parietal cortex in macaque monkeys. Neuroscience 146:
1371–1387, 2007.
Cappe C. Intégration multisensorielle et motrice chez le primate non humain: approches
anatomique, comportementale et électrophysiologique, Thèse n° 1560, Université de
Fribourg et Paul Sabatier Toulouse, 2007.
Cappe C, Rouiller EM, Barone P. Multisensory anatomical pathways. Hearing Research
258: 28–36, 2009a
Cappe C, Morel A, Barone P, Rouiller EM. The Thalamocortical Projection Systems in
Primate: An Anatomical Support for Multisensory and Sensorimotor Interplay.
Cerebral Cortex 19: 2025–2037, 2009b.
Cappe C, Murray MM, Barone P, Rouiller EM. Multisensory facilitation of behavior in
monkeys: effects of stimulus intensity. J Cogn Neurosci 22: 2850–2863, 2010a.
Cappe C, Thut G, Romei V, Murray MM. Auditory-Visual Multisensory Interactions in
Humans: Timing, Topography, Directionality, and Sources. Journal of Neuroscience
30: 12572–12580, 2010b.
Carriere BN, Royal DW, Wallace MT. Spatial Heterogeneity of Cortical Receptive Fields

158
and Its Impact on Multisensory Interactions. Journal of Neurophysiology 99: 2357–
2368, 2008.
Churchland MM, Lisberger SG. Apparent motion produces multiple deficits in visually
guided smooth pursuit eye movements of monkeys. Journal of Neurophysiology 84:
216–235, 2000.
Cohen L, Rothschild G, Mizrahi A. Multisensory Integration of Natural Odors and Sounds
in the Auditory Cortex. Neuron 72: 357–369, 2011.
Colonius H, Diederich A, Steenken R. Time-window-of-integration (TWIN) model for
saccadic reaction time: effect of auditory masker level on visual-auditory spatial
interaction in elevation. Brain Topogr 21: 177–184, 2009.
Colonius H, Diederich A. Multisensory interaction in saccadic reaction time: a time-
window-of-integration model. J Cogn Neurosci 16: 1000–1009, 2004.
Cook SD, Thomas KA, Delton JE, Volkman TK, Whitecloud TS, Key JF.
Hydroxylapatite coating of porous implants improves bone ingrowth and interface
attachment strength. J. Biomed. Mater. Res. 26: 989–1001, 1992.
Corballis M. Interhemispheric neural summation in the absence of the corpus callosum.
Brain 121: 1795–1807, 1998.
Cuppini, C. An emergent model of multisensory integration in superior colliculus neurons.
Front. Integr. Neurosci. (2010). doi: 10.3389/fnint.2010.00006.
Delbeuck X, Collette F, Van der Linden M. Is Alzheimer's disease a disconnection
syndrome? Neuropsychologia 45: 3315–3323, 2007.
Dixon NF, Spitz L. The detection of auditory visual desynchrony. Perception 9: 719–721,
1980.
Doehrmann O, Weigelt S, Altmann CF, Kaiser J, Naumer MJ. Audiovisual functional
magnetic resonance imaging adaptation reveals multisensory integration effects in
object-related sensory cortices. Journal of Neuroscience 30: 3370–3379, 2010.
Driver J. Enhancement of selective listening by illusory mislocation of speech sounds due to
lip-reading. Nature 381: 66–68, 1996.
Driver J, Noesselt T. Multisensory interplay reveals crossmodal influences on “sensory-
specific” brain regions, neural responses, and judgments. Neuron 57: 11–23, 2008.
Duhamel J-R, Colby CL, Goldberg ME. Ventral intraparietal area of the macaque:
congruent visual and somatic response properties. Journal of Neurophysiology 79: 126–
136, 1998.

159
Durif C, Jouffrais C, Rouiller EM. Single-unit responses in the auditory cortex of monkeys
performing a conditional acousticomotor task. Exp Brain Res 153: 614–627, 2003.
Falchier A, Clavagnier S, Barone P, Kennedy H. Anatomical evidence of multimodal
integration in primate striate cortex. Journal of Neuroscience 22: 5749–5759, 2002.
Falchier A, Schroeder CE, Hackett TA, Lakatos P, Nascimento-Silva S, Ulbert I,
Karmos G, Smiley JF. Projection from Visual Areas V2 and Prostriata to Caudal
Auditory Cortex in the Monkey. Cerebral Cortex 20: 1529–1538, 2010.
Faller, A, Sprumont, P, Schünke, M. Le corps humain, 4ème édition, Editions
universitaires, Fribourg, Suisse, 1999
Fiebelkorn IC, Foxe JJ, Butler JS, Molholm S. Auditory facilitation of visual-target
detection persists regardless of retinal eccentricity and despite wide audiovisual
misalignments. Exp Brain Res 213: 167–174, 2011.
Fishman MC, Michael P. Integration of auditory information in the cat's visual cortex.
Vision Research 13: 1415–1419, 1973.
Fogassi L, Gallese V, Fadiga L, Luppino G, Matelli M, Rizzolatti G. Coding of
peripersonal space in inferior premotor cortex (area F4). Journal of Neurophysiology
76: 141–157, 1996.
Forster B, Cavina-Pratesi C, Aglioti SM, Berlucchi G. Redundant target effect and
intersensory facilitation from visual-tactile interactions in simple reaction time. Exp
Brain Res 143: 480–487, 2002.
Fort A, Delpuech C, Pernier J, Giard M-H. Dynamics of cortico-subcortical cross-modal
operations involved in audio-visual object detection in humans. Cereb. Cortex 12:
1031–1039, 2002.
Fort A. Corrélats électrophysiologiques de l'intégration des informations auditives et
visuelles dans la perception intermodale chez l'homme, Ph.D Thesis, Université
Lumière Lyon II, 2002.
Foxe JJ, Morocz IA, Murray MM, Higgins BA, Javitt DC, Schroeder CE. Multisensory
auditory-somatosensory interactions in early cortical processing revealed by high-
density electrical mapping. Brain Res Cogn Brain Res 10: 77–83, 2000.
Foxe JJ, Wylie GR, Martinez A, Schroeder CE, Javitt DC, Guilfoyle D, Ritter W,
Murray MM. Auditory-somatosensory multisensory processing in auditory association
cortex: an fMRI study. Journal of Neurophysiology 88: 540–543, 2002.
Foxe JJ, Strugstad EC, Sehatpour P, Molholm S, Pasieka W, Schroeder CE, McCourt
160
ME. Parvocellular and Magnocellular Contributions to the Initial Generators of the
Visual Evoked Potential: High-Density Electrical Mapping of the “C1” Component.
Brain Topogr 21: 11–21, 2008.
Franciotti R, Brancucci A, Penna SD, Onofrj M, Tommasi L. Neuromagnetic responses
reveal the cortical timing of audiovisual synchrony. NSC (July 21, 2011). doi:
10.1016/j.neuroscience.2011.07.018.
Frens MA, Van Opstal AJ, Van der Willigen RF. Spatial and temporal factors determine
auditory-visual interactions in human saccadic eye movements. Attention, Perception,
& Psychophysics 57: 802–816, 1995a.
Frens MA, Van Opstal AJ, Van der Willigen RF. Spatial and temporal factors determine
auditory-visual interactions in human saccadic eye movements. Percept Psychophys 57:
802–816, 1995b.
Fuchs AF, Luschei ES. Firing patterns of abducens neurons of alert monkeys in relationship
to horizontal eye movement. Journal of Neurophysiology 33: 382–392, 1970.
Gardner EP, Hämäläinen HA, Warren S, Davis J, Young W. Somatosensory evoked
potentials (SEPs) and cortical single unit responses elicited by mechanical tactile stimuli
in awake monkeys. Electroencephalogr Clin Neurophysiol 58: 537–552, 1984.
Gentile G, Petkova VI, Ehrsson HH. Integration of Visual and Tactile Signals From the
Hand in the Human Brain: An fMRI Study. Journal of Neurophysiology 105: 910–922,
2011.
Ghazanfar AA. Multisensory Integration of Dynamic Faces and Voices in Rhesus Monkey
Auditory Cortex. Journal of Neuroscience 25: 5004–5012, 2005.
Ghazanfar A, Schroeder C. Is neocortex essentially multisensory? Trends in Cognitive
Sciences 10: 278–285, 2006.
Ghosh S, Gattera R. A comparison of the ipsilateral cortical projections to the dorsal and
ventral subdivisions of the macaque premotor cortex. Somatosens Mot Res 12: 359–378,
1995.
Giard MH, Peronnet F. Auditory-visual integration during multimodal object recognition in
humans: a behavioral and electrophysiological study. J Cogn Neurosci 11: 473–490,
1999.
Gindrat AD, Quairaux C, Britz J, Brunet D, Lanz F, Michel CM, Rouiller EM. Whole-
scalp EEG mapping of somatosensory evoked potentials in macaque monkeys: a model
for lesion-dependent plasticity, in preparation.

161
Godschalk M, Lemon RN, Nijs HG, Kuypers HG. Behaviour of neurons in monkey peri-
arcuate and precentral cortex before and during visually guided arm and hand
movements. Exp Brain Res 44: 113–116, 1981.
Godschalk MM, Lemon RNR, Kuypers HGH, van der Steen JJ. The involvement of
monkey premotor cortex neurones in preparation of visually cued arm movements.
Behavioural Brain Research 18: 143–157, 1985.
Gordon B. Receptive fields in deep layers of cat superior colliculus. Journal of
Neurophysiology 36: 157–178, 1973.
Gori M, Mazzilli G, Sandini G, Burr D. Cross-Sensory Facilitation Reveals Neural
Interactions between Visual and Tactile Motion in Humans. Front Psychol 2: 55, 2011.
Gray H. Anatomy Descriptive and Surgical, 1st ed. London: John W.Parker and Son, West
Strand. 1858
Graziano MS, Hu XT, Gross CG. Visuospatial properties of ventral premotor cortex.
Journal of Neurophysiology 77: 2268–2292, 1997.
Graziano MS. Where is my arm? The relative role of vision and proprioception in the
neuronal representation of limb position. Proc. Natl. Acad. Sci. U.S.A. 96: 10418–
10421, 1999.
Graziano MS. A system of multimodal areas in the primate brain. Neuron 29: 4–6, 2001.
Graziano MSM, Reiss LAL, Gross CGC. A neuronal representation of the location of
nearby sounds. Nature 397: 428–430, 1999.
Groh JM, Sparks DL. Saccades to somatosensory targets. III. eye-position-dependent
somatosensory activity in primate superior colliculus. Journal of Neurophysiology 75:
439–453, 1996.
Gu Y, Angelaki DE, DeAngelis GC. Neural correlates of multisensory cue integration in
macaque MSTd. Nat Neurosci 11: 1201-1210, 2008.
Guo K, Li CY. Eye position-dependent activation of neurones in striate cortex of macaque.
Neuroreport 8: 1405–1409, 1997.
Haines DE, March D. Fundamental Neuroscience, 2nd edition, Churchill Livingstone, 323-
339, 2002
Hamadjida A. Mécanisme de récupération fonctionnelle suite à une lésion unilatérale du
cortex moteur primaire chez le macaque: connexions et réorganisation des aires
corticales, Thèse n°1748, Imprimerie Saint-Paul, 2012.
Harper DW. Signal detection analysis of effect of white noise intensity on sensitivity to

162
visual flicker. Percept Mot Skills 48: 791–798, 1979.
Harris WH, Sledge CB. Total hip and total knee replacement. New England Journal of
Medicine 323: 801–807, 1990.
Helmholtz von H. Handbuch der physiologischen Optik von H. von Helmholtz. 1911.
Hershenson M. Reaction time as a measure of intersensory facilitation. Journal of
Experimental Psychology 63: 289–293, 1962.
Ho C, Santangelo V, Spence C. Multisensory warning signals: when spatial correspondence
matters. Exp Brain Res 195: 261–272, 2009.
Holmes NP. The Principle of Inverse Effectiveness in Multisensory Integration: Some
Statistical Considerations. Brain Topogr 21: 168–176, 2009.
Hughes HC, Reuter-Lorenz PA, Nozawa G, Fendrich R. Visual-auditory interactions in
sensorimotor processing: Saccades versus manual responses. Journal of Experimental
Psychology: Human Perception and Performance 20: 131–153, 1994.
Isoda M, Tsutsui K-I, Katsuyama N, Naganuma T, Saito N, Furusawa Y, Mushiake H,
Taira M, Tanji J. Design of a head fixation device for experiments in behaving
monkeys. Journal of Neuroscience Methods 141: 277–282, 2005.
Jaffe WL, Morris HB, Nessler JP, Naughton M, Shen J. Hydroxylapatite-coated acetabular
shells with arc deposited titanium surface roughening and dual radius design. Bull NYU
Hosp Jt Dis 65: 257–262, 2007.
Jones JAJ, Callan DED. Brain activity during audiovisual speech perception: an fMRI study
of the McGurk effect. Neuroreport 14: 1129–1133, 2003.
Jouffrais C. Le codage des mouvements volontaires: référentiel et coordination.
Enregistrements unitaires dans le cortex prémoteur et moteur du singe. Thèse n° 147-
2000 (France) et thèse n° 1311 (Suisse), Imprimerie de l'université de Fribourg, 2000.
Jousmäki V, Hari R. Parchment-skin illusion: sound-biased touch. Curr. Biol. 8: R190,
1998.
Kaeser M, Wyss AF, Bashir S, Hamadjida A, Liu Y, Bloch J, Brunet JF, Belhaj-Saif A,
Rouiller EM. Effects of Unilateral Motor Cortex Lesion on Ipsilesional Hand's Reach
and Grasp Performance in Monkeys: Relationship With Recovery in the Contralesional
Hand. Journal of Neurophysiology 103: 1630–1645, 2010.
Kaeser M, Brunet J-F, Wyss A, Belhaj-Saif A, Liu Y, Hamadjida A, Rouiller EM, Bloch
J. Autologous adult cortical cell transplantation enhances functional recovery following
unilateral lesion of motor cortex in primates: a pilot study. Neurosurgery 68: 1405–16–

163
discussion 1416–7, 2011.
Kayser C, Petkov CI, Augath M, Logothetis NK. Integration of Touch and Sound in
Auditory Cortex. Neuron 48: 373–384, 2005.
Kayser C, Petkov CI, Augath M, Logothetis NK. Functional Imaging Reveals Visual
Modulation of Specific Fields in Auditory Cortex. Journal of Neuroscience 27: 1824–
1835, 2007a.
Kayser C, Petkov CI, Logothetis NK. Visual Modulation of Neurons in Auditory Cortex.
Cerebral Cortex 18: 1560–1574, 2007b.
Kayser C, Petkov CI, Logothetis NK. Multisensory interactions in primate auditory cortex:
fMRI and electrophysiology. Hearing Research 258: 80–88, 2009.
Kayser C, Logothetis NK, Panzeri S. Visual enhancement of the information representation
in auditory cortex. Curr. Biol. 20: 19–24, 2010.
Kermadi I, Liu Y, Tempini A, Rouiller EM. Effects of reversible inactivation of the
supplementary motor area (SMA) on unimanual grasp and bimanual pull and grasp
performance in monkeys. Somatosens Mot Res 14: 268–280, 1997.
Kermadi I, Liu Y, Tempini A, Calciati E, Rouiller EM. Neuronal activity in the primate
supplementary motor area and the primary motor cortex in relation to spatio-temporal
bimanual coordination. Somatosens Mot Res 15: 287–308, 1998.
Kermadi I, Liu Y, Rouiller EM. Do bimanual motor actions involve the dorsal premotor
(PMd), cingulate (CMA) and posterior parietal (PPC) cortices? Comparison with
primary and supplementary motor cortical areas. Somatosens Mot Res 17: 255–271,
2000.
Kern A, Heid C, Steeb WH, Stoop N, Stoop R. Biophysical Parameters Modification Could
Overcome Essential Hearing Gaps. PLoS Comp Biol 4: e1000161, 2008.
Kharroussi El M, Françon D, Benjelloun W, Hugon M. Potentiels évoqués somesthésiques
proprioceptifs et cutanés chez le babouin: Cycles d'excitabilité et inhibitions
GABAergiques. Neurophysiologie Clinique/Clinical Neurophysiology 27: 89–108,
1997.
Kikuchi Y, Senju A, Tojo Y, Osanai H, Hasegawa T. Faces Do Not Capture Special
Attention in Children With Autism Spectrum Disorder: A Change Blindness Study.
Child Dev 80: 1421–1433, 2009.
King AJ, Walker KMM. Integrating information from different senses in the auditory
cortex. Biol Cybern 106: 617–625, 2012.
164
Klemen J, Chambers CD. Current perspectives and methods in studying neural mechanisms
of multisensory interactions. Neuroscience and Biobehavioral Reviews (May 20, 2011).
doi: 10.1016/j.neubiorev.2011.04.015.
Köppl CC. Phase locking to high frequencies in the auditory nerve and cochlear nucleus
magnocellularis of the barn owl, Tyto alba. J. Neurosci. 17: 3312–3321, 1997.
Kurata K. Corticocortical inputs to the dorsal and ventral aspects of the premotor cortex of
macaque monkeys. Neuroscience Research 12: 263–280, 1991.
Lanz F, Lanz X, Scherly A, Moret V, Gaillard A, Gruner P, Hoogewoud H-M, Belhaj-
Saif A, Loquet G, Rouiller EM. Journal of Neuroscience Methods. Journal of
Neuroscience Methods 219: 262–270, 2013a.
Lanz F, Moret V, Rouiller EM, Loquet G. Multisensory integration in non-human primates
during a sensory-motor task. Front Hum Neurosci (November 21, 2013b). doi:
10.3389/fnhum.2013.00799/abstract.
Lee C, Chung S, Kim J, Park J. Auditory facilitation of visually guided saccades. Society
for Neuroscience Abstracts, 17, 862. 1991.
Lee H, Noppeney U. Long-term music training tunes how the brain temporally binds signals
from multiple senses. Proc. Natl. Acad. Sci. U.S.A. 108: E1441–50, 2011.
Levitt H. Transformed up-down methods in psychoacoustics. J. Acoust. Soc. Am. 49: Suppl
2:467–477, 1971.
Lewis JW, Van Essen DC. Corticocortical connections of visual, sensorimotor, and
multimodal processing areas in the parietal lobe of the macaque monkey. J. Comp.
Neurol. 428: 112–137, 2000.
Lisberger SG, Westbrook LE. Properties of visual inputs that initiate horizontal smooth
pursuit eye movements in monkeys. J. Neurosci. 5: 1662–1673, 1985.
Liu Y, Rouiller EM. Mechanisms of recovery of dexterity following unilateral lesion of the
sensorimotor cortex in adult monkeys. Exp Brain Res 128: 149–159, 1999.
Loquet GG, Campo PP, Lataye RR. Comparison of toluene-induced and styrene-induced
hearing losses. Neurotoxicol Teratol 21: 689–697, 1999.
Lovelace C. An irrelevant light enhances auditory detection in humans: a psychophysical
analysis of multisensory integration in stimulus detection. Cognitive Brain Research 17:
447–453, 2003.
Luppino G, Rizzolatti G. The Organization of the Frontal Motor Cortex. News Physiol. Sci.
15: 219–224, 2000.
165
Manjarrez E, Rojas-Piloni JG, Méndez I, Martínez L, Vélez D, Vázquez D, Flores A.
Internal stochastic resonance in the coherence between spinal and cortical neuronal
ensembles in the cat. Neurosci. Lett. 326: 93–96, 2002.
Manjarrez E, Mendez I, Martinez L, Flores A, Mirasso CR. Effects of auditory noise on
the psychophysical detection of visual signals: Cross-modal stochastic resonance.
Neurosci. Lett. 415: 231–236, 2007.
Markowitsch HJ, Irle E, Emmans D. Cortical and subcortical afferent connections of the
squirrel monkey's (lateral) premotor cortex: evidence for visual cortical afferents. Int. J.
Neurosci. 37: 127–148, 1987.
Martuzzi R, Murray MM, Michel CM, Thiran JP, Maeder PP, Clarke S, Meuli RA.
Multisensory Interactions within Human Primary Cortices Revealed by BOLD
Dynamics. Cerebral Cortex 17: 1672–1679, 2007.
Masterton RB, Berkley MA. Brain function: changing ideas on the role of sensory, motor,
and association cortex in behavior. Annu Rev Psychol 25: 277–312, 1974.
Matelli M, Camarda R, Glickstein M, Rizzolatti G. Afferent and efferent projections of the
inferior area 6 in the macaque monkey. J. Comp. Neurol. 251: 281–298, 1986.
Matelli M, Luppino G, Fogassi L, Rizzolatti G. Thalamic input to inferior area 6 and area 4
in the macaque monkey. Journal of Comparative Neurology 280: 468–488, 1989.
May BJB, Sachs MBM. Dynamic range of neural rate responses in the ventral cochlear
nucleus of awake cats. Journal of Neurophysiology 68: 1589–1602, 1992.
McAndrew RM, VanGilder JLL, Naufel SN, Tillery SIH. Individualized recording
chambers for non-human primate neurophysiology. Journal of Neuroscience Methods
207: 86–90, 2012.
McCarthy G, Wood CC, Allison T. Cortical somatosensory evoked potentials. I. Recordings
in the monkey Macaca fascicularis. Journal of Neurophysiology 66: 53–63, 1991.
McGurk H, McDonald J. Hearing lips and seeing voices. Nature 264: 746–748, 1976.
McHaffie JG, Fuentes-Santamaria V, Alvarado JC, Fuentes Farias AL, Gutierrez-
Ospina G, Stein BE. Anatomical features of the intrinsic circuitry underlying
multisensory integration in the superior colliculus In: Stein BE, ed. The new handbook
of multisensory processing. Cambridge (MA): MIT Press; 31-47, 2012.
McIntosh AR, Cabeza RE, Lobaugh NJ. Analysis of neural interactions explains the
activation of occipital cortex by an auditory stimulus. Journal of Neurophysiology 80:
2790–2796, 1998.

166
Médecine/Sciences n°10 (17). La prestine, une protéine qui swingue, 1065-1067, 2001
Menzel RR. Multisensory and Secondary Somatosensory Cortex in the Rat. Cerebral Cortex
15: 1690–1696, 2005.
Meredith MA, Stein BE. Interactions among converging sensory inputs in the superior
colliculus. Science 221: 389–391, 1983.
Meredith MA, Stein BE. Visual, auditory, and somatosensory convergence on cells in
superior colliculus results in multisensory integration. Journal of Neurophysiology 56:
640–662, 1986.
Meredith MA, Nemitz JW, Stein BE. Determinants of multisensory integration in superior
colliculus neurons. I. Temporal factors. J. Neurosci. 7: 3215–3229, 1987.
Meredith MA, Keniston LP, Allman BL. Multisensory dysfunction accompanies
crossmodal plasticity following adult hearing impairment. Neuroscience 214: 136–148,
2012.
Middlebrooks JC, Knudsen EI. A neural code for auditory space in the cat's superior
colliculus. J. Neurosci. 4: 2621–2634, 1984.
Miller J. Divided attention: Evidence for coactivation with redundant signals. Cognitive
Psychology 14: 247–279, 1982.
Miller MWM, Vogt BAB. Direct connections of rat visual cortex with sensory, motor, and
association cortices. J. Comp. Neurol. 226: 184–202, 1984.
Miller J. Timecourse of coactivation in bimodal divided attention. Percept Psychophys 40:
331–343, 1986.
Molholm S, Ritter W, Murray MM, Javitt DC, Schroeder CE, Foxe JJ. Multisensory
auditory-visual interactions during early sensory processing in humans: a high-density
electrical mapping study. Brain Res Cogn Brain Res 14: 115–128, 2002.
Mongillo EA, Irwin JR, Whalen DH, Klaiman C, Carter AS, Schultz RT. Audiovisual
Processing in Children with and without Autism Spectrum Disorders. J Autism Dev
Disord 38: 1349–1358, 2008.
Monney-Jacomme, A. Etude morphologique et fonctionnell des projections auditives et non-
auditives du noyau cochléaire chez le cochon d'Inde, Thèse n°1452, Imprimerie de
Miséricorde, Fribourg, 2004.
Moore BC. Frequency difference limens for short-duration tones. J. Acoust. Soc. Am. 54:
610–619, 1973.
Morel A, Liu J, Wannier T, Jeanmonod D, Rouiller EM. Divergence and convergence of

167
thalamocortical projections to premotor and supplementary motor cortex: a multiple
tracing study in the macaque monkey. European Journal of Neuroscience 21: 1007–
1029, 2005.
Morrell F. Visual system's view of acoustic space. Nature 238: 44–46, 1972.
Murray MM. Setting Boundaries: Brain Dynamics of Modal and Amodal Illusory Shape
Completion in Humans. Journal of Neuroscience 24: 6898–6903, 2004.
Murray MM, Molholm S, Michel CM, Heslenfeld, DJ, Ritter W, Javitt DC, Schroeder
CE, Foxe JJ. Grabbing Your Ear: Rapid Auditory-Somatosensory Multisensory
Interactions in Low-level Sensory Cortices Are Not Constrained by Stimulus
Alignment. Cerebral Cortex 15: 963–974, 2005.
Murray MM. Rapid Brain Discrimination of Sounds of Objects. Journal of Neuroscience 26:
1293–1302, 2006.
Murray MM, Wallace MT, Shams L. Early Integration and Bayesian Causal Inference in
Multisensory Perception. Boca Raton (FL): CRC Press, 2012.
Naumer MJ, Bosch JJF, Wibral M, Kohler A, Singer W, Kaiser J, Ven V, Muckli L.
Investigating human audio-visual object perception with a combination of hypothesis-
generating and hypothesis-testing fMRI analysis tools. Exp Brain Res 213: 309–320,
2011.
Nicholls J.G, Martin, A.R, Wallace, B.G, Fuchs, P.A. From Neuron to Brain, Fourth
Edition, Sinauer Associate, Inc., 355-378, 2001
Norrix LWL, Plante EE, Vance RR, Boliek CAC. Auditory-visual integration for speech
by children with and without specific language impairment. J Speech Lang Hear Res
50: 1639–1651, 2007.
Okada K, Venezia JH, Matchin W, Saberi K, Hickok G. An fMRI Study of Audiovisual
Speech Perception Reveals Multisensory Interactions in Auditory Cortex. PLoS ONE 8:
e68959, 2013.
Peeters R, Simone L, Nelissen K, Fabbri-Destro M, Vanduffel W, Rizzolatti G, Orban
GA. The Representation of Tool Use in Humans and Monkeys: Common and Uniquely
Human Features. Journal of Neuroscience 29: 11523–11539, 2009.
Pekkola J, Ojanen V, Autti T, Jääskeläinen IP, Möttönen R, Tarkiainen A, Sams M.
Primary auditory cortex activation by visual speech: an fMRI study at 3 T. Neuroreport
16: 125–128, 2005.
Perrault TJ. Neuron-Specific Response Characteristics Predict the Magnitude of

168
Multisensory Integration. Journal of Neurophysiology 90: 4022–4026, 2003.
Perrault TJ. Superior Colliculus Neurons Use Distinct Operational Modes in the Integration
of Multisensory Stimuli. Journal of Neurophysiology 93: 2575–2586, 2005.
Perrault TJ, Stein BE, Rowland BA. Non-stationarity in multisensory neurons in the
superior colliculus. Front Physiol 2: 144, 2011.
Pessoa L, Kastner S, Ungerleider LG. Neuroimaging studies of attention: from modulation
of sensory processing to top-down control. J. Neurosci. 23: 3990–3998, 2003.
Pessoa L, Rossi A, Japee S, Desimone R, Ungerleider LG. Attentional control during the
transient updating of cue information. Brain Research 1247: 149–158, 2009.
Peterson NNN, Schroeder CEC, Arezzo JCJ. Neural generators of early cortical
somatosensory evoked potentials in the awake monkey. Electroencephalogr Clin
Neurophysiol 96: 248–260, 1995.
Pfingst BE, Laycock J, Flammino F, Lonsbury-Martin B, Martin G. Pure tone thresholds
for the rhesus monkey. Hearing Research 1: 43–47, 1978.
Piéron, H. Nouvelles recherches sur l'analyse du temps de latence sensorielle et sur la loi qui
relie ce temps à l'intensité de l'excitation, Année Psychologique 22, 58-142, 1920
Posner MI, Petersen SE, Fox PT, Raichle ME. Localization of cognitive operations in the
human brain. Science 240: 1627–1631, 1988.
Posner MI, Petersen SE. The Attention System of the Human Brain. 1990.
Posner MI, Rothbart MK. Attention, self-regulation and consciousness. Philosophical
Transactions of the Royal Society B: Biological Sciences 353: 1915–1927, 1998.
Raab DH. Statistical facilitation of simple reaction times. Trans N Y Acad Sci 24: 574–590,
1962.
Recanzone GH. Interactions of auditory and visual stimuli in space and time. Hearing
Research 258: 89–99, 2009.
Reynolds RF, Day BL. Fast visuomotor processing made faster by sound. The Journal of
Physiology 583: 1107–1115, 2007.
Rezvani S, Corneil BD. Recruitment of a Head-Turning Synergy by Low-Frequency Activity
in the Primate Superior Colliculus. Journal of Neurophysiology 100: 397–411, 2008.
Rizzolatti G, Fadiga L, Gallese V, Fogassi L. Premotor cortex and the recognition of motor
actions. Brain Res Cogn Brain Res 3: 131–141, 1996.
Rockel AJ, Jones EG. The neuronal organization of the inferior colliculus of the adult cat. I.
The central nucleus. J. Comp. Neurol. 147: 11–59, 1973a.

169
Rockel AJ, Jones EG. The neuronal organization of the inferior colliculus of the adult cat. II.
The pericentral nucleus. J. Comp. Neurol. 149: 301–333, 1973b.
Rockland K, Ojima H. Multisensory convergence in calcarine visual areas in macaque
monkey. International Journal of Psychophysiology 50: 19–26, 2003.
Rodgers KM, Benison AM, Klein A, Barth DS. Auditory, Somatosensory, and
Multisensory Insular Cortex in the Rat. Cerebral Cortex 18: 2941–2951, 2008.
Roland PE, Skinhoj E, Lassen NA, Larsen B. Different cortical areas in man in
organization of voluntary movements in extrapersonal space. Journal of
Neurophysiology 43: 137–150, 1980.
Romanski LM, Tian B, Fritz J, Mishkin M, Goldman-Rakic PS, Rauschecker JP. Dual
streams of auditory afferents target multiple domains in the primate prefrontal cortex.
Nat Neurosci 2: 1131–1136, 1999.
Romanski LM. Representation and Integration of Auditory and Visual Stimuli in the Primate
Ventral Lateral Prefrontal Cortex. Cerebral Cortex 17: i61–i69, 2007.
Ross LA, Saint-Amour D, Leavitt VM, Javitt DC, Foxe JJ. Do You See What I Am
Saying? Exploring Visual Enhancement of Speech Comprehension in Noisy
Environments. Cerebral Cortex 17: 1147–1153, 2007.
Rouger J, Lagleyre S, Fraysse B, Deneve S, Deguine O, Barone P. Evidence that cochlear-
implanted deaf patients are better multisensory integrators. Proc. Natl. Acad. Sci. U.S.A.
104: 7295–7300, 2007.
Rouiller EME, Tanné JJ, Moret VV, Kermadi II, Boussaoud DD, Welker EE. Dual
morphology and topography of the corticothalamic terminals originating from the
primary, supplementary motor, and dorsal premotor cortical areas in macaque monkeys.
J. Comp. Neurol. 396: 169–185, 1998.
Rouiller EM, Welker E. A comparative analysis of the morphology of corticothalamic
projections in mammals. Brain Res. Bull. 53: 727–741, 2000.
Rouiller EM, Durif C. The dual pattern of corticothalamic projection of the primary auditory
cortex in macaque monkey. Neurosci. Lett. 358: 49–52, 2004.
Rowland BA, Quessy S, Stanford TR, Stein BE. Multisensory Integration Shortens
Physiological Response Latencies. Journal of Neuroscience 27: 5879–5884, 2007.
Rubo de Rezende ML, Johansson CB. Quantitative bone tissue response to commercially
pure titanium implants. Journal of Materials Science: Materials in Medicine 4: 233–
239, 1993.

170
Saito DN, Yoshimura K, Kochiyama T, Okada T, Honda M, Sadato N. Cross-modal
binding and activated attentional networks during audio-visual speech integration: a
functional MRI study. Cereb. Cortex 15: 1750–1760, 2005.
Sasaki H, Sakane S, Ishida T, Todorokihara M, Kitamura T, Aoki R. Suprathreshold
stochastic resonance in visual signal detection. Behavioural Brain Research 193: 152–
155, 2008.
Schmidlin E, Kaeser M, Gindrat AD, Savidan J, Chatagny P, Badoud S, Hamadjida A,
Beaud M-L, Wannier T, Belhaj-Saif A, Rouiller EM. Behavioral Assessment of
Manual Dexterity in Non-Human Primates. JoVE 57, 2011.
Schmidt LE. From demon possession to magic show: Ventriloquism, religion, and the
enlightenment. CHURCH HISTORY-SCOTTDALE- 67: 274–304, 1998.
Schroeder CE, Foxe J. Multisensory contributions to low-level, “unisensory” processing.
Current Opinion in Neurobiology 15: 454–458, 2005.
Schroeder CE, Lindsley RW, Specht C, Marcovici A, Smiley JF, Javitt DC.
Somatosensory input to auditory association cortex in the macaque monkey. Journal of
Neurophysiology 85: 1322–1327, 2001.
Schroeder CE, Foxe JJ. The timing and laminar profile of converging inputs to multisensory
areas of the macaque neocortex. Brain Res Cogn Brain Res 14: 187–198, 2002.
Schroeder CE, Foxe J. Multisensory contributions to low-level, “unisensory” processing.
Current Opinion in Neurobiology 15: 454–458, 2005.
Schultz RTR, Gauthier II, Klin AA, Fulbright RKR, Anderson AWA, Volkmar FF,
Skudlarski PP, Lacadie CC, Cohen DJD, Gore JCJ. Abnormal ventral temporal
cortical activity during face discrimination among individuals with autism and Asperger
syndrome. Arch Gen Psychiatry 57: 331–340, 2000.
Senkowski D. Oscillatory Beta Activity Predicts Response Speed during a Multisensory
Audiovisual Reaction Time Task: A High-Density Electrical Mapping Study. Cerebral
Cortex 16: 1556–1565, 2005.
Senkowski D, Schneider TR, Foxe JJ, Engel AK. Crossmodal binding through neural
coherence: implications for multisensory processing. Trends Neurosci. 31: 401–409,
2008.
Senkowski D, Saint-Amour D, Höfle M, Foxe JJ. Multisensory interactions in early evoked
brain activity follow the principle of inverse effectiveness. NeuroImage 56: 2200–2208,
2011b.

171
Sereno MI, McDonald CT, Allman JM. Analysis of retinotopic maps in extrastriate cortex.
Cereb. Cortex 4: 601–620, 1994.
Shams L, Kamitani Y, Shimojo S. Visual illusion induced by sound. Brain Res Cogn Brain
Res 14: 147–152, 2002.
Shams L, Ma W.J, Beierholm U. Sound-induced flash illusion as an optimal percept.
Neuroreport. 16:1923–1927, 2005b
Sherman SM, Guillery RW. The role of the thalamus in the flow of information to the
cortex. Philosophical Transactions of the Royal Society B: Biological Sciences 357:
1695–1708, 2002.
Sherman SM, Guillery RW. Exploring the Thalamus and Its Role in Cortical Function. MIT
Press (MA), 2006.
Shore SE, Koehler S, Oldakowski M, Hughes LF, Syed S. Dorsal cochlear nucleus
responses to somatosensory stimulation are enhanced after noise-induced hearing loss.
European Journal of Neuroscience 27: 155–168, 2007.
Shore SE. Multisensory integration in the dorsal cochlear nucleus: unit responses to acoustic
and trigeminal ganglion stimulation. European Journal of Neuroscience 21: 3334–3348,
2005.
Skaliora I. Functional Topography of Converging Visual and Auditory Inputs to Neurons in
the Rat Superior Colliculus. Journal of Neurophysiology 92: 2933–2946, 2004.
Slutsky DA, Recanzone GH. Temporal and spatial dependency of the ventriloquism effect.
Neuroreport 12: 7–10, 2001.
Smiley JF, Hackett TA, Ulbert I, Karmas G, Lakatos P, Javitt DC, Schroeder CE.
Multisensory convergence in auditory cortex, I. Cortical connections of the caudal
superior temporal plane in macaque monkeys. J. Comp. Neurol. 502: 894–923, 2007.
Smith DW, Olszyk VB. Auditory behavioral thresholds for Japanese macaques using insert
earphones. Am. J. Primatol. 41: 323–329, 1997.
Sommer MA, Wurtz RH. Brain Circuits for the Internal Monitoring of Movements*. Annu.
Rev. Neurosci. 31: 317–338, 2008.
Sparks DL. Translation of sensory signals into commands for control of saccadic eye
movements: role of primate superior colliculus. Physiol. Rev. 66: 118–171, 1986.
Sperdin HF, Cappe C, Foxe JJ, Murray MM. Early, low-level auditory-somatosensory
multisensory interactions impact reaction time speed. Front. Integr. Neurosci. 3, 2009.
Stanford TR, Stein BE. Superadditivity in multisensory integration: putting the computation

172
in context. Neuroreport 18: 787–792, 2007.
Stebbins WC, Green S, Miller FL. Auditory sensitivity of the monkey. Science 153: 1646–
1647, 1966.
Stebbins WC. Hearing of old world monkeys (Cercopithecinae). American Journal of
Physical Anthropology 38: 357–364, 1973.
Stebbins WC. Hearing of the anthropoid primates: A behavioral analysis. The nervous system
3: 113–124, 1975.
Stein BE, Scott Huneycutt W, Alex Meredith M. Neurons and behavior: the same rules of
multisensory integration apply. Brain Research 448: 355–358, 1988.
Stein BE, Meredith MA. The Merging of the Senses. MIT Press (MA), 1993.
Stein BE, London N, Wilkinson LK, Price DD. Enhancement of Perceived Visual Intensity
by Auditory Stimuli: A Psychophysical Analysis. J Cogn Neurosci 8: 497–506, 1996.
Stein BE. Neural mechanisms for synthesizing sensory information and producing adaptive
behaviors. Exp Brain Res 123: 124–135, 1998.
Stein von A, Rappelsberger P, Sarnthein J, Petsche H. Synchronization between temporal
and parietal cortex during multimodal object processing in man. Cereb. Cortex 9: 137–
150, 1999.
Stein BE, Stanford TR. Multisensory integration: current issues from the perspective of the
single neuron. Nat Rev Neurosci 9: 255–266, 2008.
Sternberg RJ, Sternberg K. Cognitive Psychology. Cengage Learning, 2009.
Stevenson RA, Altieri NA, Kim S, Pisoni DB, James TW. Neural processing of
asynchronous audiovisual speech perception. NeuroImage 49: 3308–3318, 2010.
Stevenson RA, Wallace MT. Multisensory temporal integration: task and stimulus
dependencies. Exp Brain Res 227: 249–261, 2013.
Sumby WH, Pollack I. Visual contribution to speech intelligibility in noise. J. Acoust. Soc.
Am. 26: 212–215, 1954.
Szycik GR, Stadler J, Tempelmann C, Münte TF. Examining the McGurk illusion using
high-field 7 Tesla functional MRI. Front Hum Neurosci 6: 95, 2012.
Talsma D, Woldorff MG. Selective attention and multisensory integration: multiple phases
of effects on the evoked brain activity. J Cogn Neurosci 17: 1098–1114, 2005a.
Talsma D, Doty TJ, Woldorff MG. Selective Attention and Audiovisual Integration: Is
Attending to Both Modalities a Prerequisite for Early Integration? Cerebral Cortex 17:
679–690, 2007.

173
Talsma D, Senkowski D, Soto-Faraco S, Woldorff MG. The multifaceted interplay
between attention and multisensory integration. Trends in Cognitive Sciences 14: 400–
410, 2010.
Tang H-Y, Xia A, Oghalai JS, Pereira FA, Alford RL. High frequency of the IVS2-2A>G
DNA sequence variation in SLC26A5, encoding the cochlear motor protein prestin,
precludes its involvement in hereditary hearing loss. BMC Med Genet 6: 30, 2005.
Vaadia E. Single-unit activity related to active localization of acoustic and visual stimuli in
the frontal cortex of the rhesus monkey. Brain Behav. Evol. 33: 127–131, 1989.
van Atteveldt NM, Peterson BS, Schroeder CE. Contextual control of audiovisual
integration in low-level sensory cortices. Hum. Brain Mapp. (August 24, 2013). doi:
10.1002/hbm.22336.
Vroomen J, Keetels M. Perception of intersensory synchrony: A tutorial review. Attention,
Perception, & Psychophysics 72: 871–884, 2010.
Wallace M, Meredith MA, Stein B. Integration of multiple sensory modalities in cat cortex.
Exp Brain Res 91, 1992.
Wallace MT, Meredith MA, Stein BE. Converging influences from visual, auditory, and
somatosensory cortices onto output neurons of the superior colliculus. Journal of
Neurophysiology 69: 1797–1809, 1993.
Wallace MT, Stein BE. Cross-modal synthesis in the midbrain depends on input from cortex.
Journal of Neurophysiology 71: 429–432, 1994.
Wallace MT, Wilkinson LK, Stein BE. Representation and integration of multiple sensory
inputs in primate superior colliculus. Journal of Neurophysiology 76: 1246–1266, 1996.
Wallace MTM, Perrault TJT, Hairston WDW, Stein BEB. Visual experience is necessary
for the development of multisensory integration. J. Neurosci. 24: 9580–9584, 2004.
Wallace MT, Stein BE. Early Experience Determines How the Senses Will Interact. Journal
of Neurophysiology 97: 921–926, 2007.
Wang Y, Celebrini S, Trotter Y, Barone P. Visuo-auditory interactions in the primary
visual cortex of the behaving monkey: Electrophysiological evidence. BMC Neurosci 9:
79, 2008.
Wannier T, Liu J, Morel A, Jouffrais C, Rouiller EM. Neuronal activity in primate
striatum and pallidum related to bimanual motor actions. Neuroreport 13: 143–147,
2002.
Watanabe JJ, Iwai EE. Neuronal activity in visual, auditory and polysensory areas in the

174
monkey temporal cortex during visual fixation task. Brain Res. Bull. 26: 583–592, 1991.
Weatherall report (2006). The use of non-human primates in research.
http://royalsociety.org/The-Weatherall-report-on-the-use-of-non-human-primates-in-
research/
Weinrich M, Wise SP. The premotor cortex of the monkey. J. Neurosci. 2: 1329–1345,
1982.
Weltford AT. Reaction Times, Academic Press, 1980
Willis WD, Coggeshall RE. Sensory mechanisms of the spinal cord, Plenum Press, NY, 2nd
edition, 1991
Wise SP, Weinrich M, Mauritz K-H. Movement-related activity in the premotor cortex of
rhesus macaques. Prog. Brain Res. 64: 117–131, 1986.
Wise SP, Kurata K. Set-related activity in the premotor cortex of rhesus monkeys: effect of
triggering cues and relatively long delay intervals. Somatosens Mot Res 6: 455–476,
1989.
Wise SP, Boussaoud D, Johnson PB, Caminiti R. PREMOTOR AND PARIETAL
CORTEX: Corticocortical Connectivity and Combinatorial Computations1. NSC 20:
25–42, 1997.
Yu L, Rowland BA, Stein BE. Initiating the Development of Multisensory Integration by
Manipulating Sensory Experience. Journal of Neuroscience 30: 4904–4913, 2010.
Yu Sun, Hong Zhang, Ting Feng, Yihong Qiu, Yisheng Zhu, Shanbao Tong. Early
Cortical Connective Network Relating to Audiovisual Stimulation by Partial Directed
Coherence Analysis. IEEE Trans. Biomed. Eng. 56: 2721–2724, 2009.
Zheng J, Shen W, He DZ, Long KB, Madison LD, Dallos P. Prestin is the motor protein of
cochlear outer hair cells. Nature 405: 149–155, 2000.
Zhou YD, Fuster JM. Visuo-tactile cross-modal associations in cortical somatosensory cells.
Proc. Natl. Acad. Sci. U.S.A. 97: 9777–9782, 2000.
Zhou Y-D, Fuster JM. Somatosensory cell response to an auditory cue in a haptic memory
task. Behavioural Brain Research 153: 573–578, 2004.

175

176
VI. Appendix
Appendix 1 : Mean reaction times and their SDs obtained from 7 individual subjects
A
B

177
C
D

178
E
F

179
G
Appendix 1 Mean reaction times and their SDs obtained at 10, 20 and 30 dB above the unimodal thresholds. Data from 7 individual human subjects (S1, S2, S3, S5, S7, S9 and S10). n.s. : p≥0.05 ; * :p<0.05 ; ** :p<0.01 ; *** :p<0.001 ; **** :p<0.0001 (Mann-Whitney Test).

180
Appendix 2 : Sensory thresholds in non-human primates
Appendix 2: Auditory (in blue) and visual (in yellow) mean absolute thresholds with their SDs obtained in the two monkeys (Mk-LI and Mk-JZ). The auditory threshold assessment was conducted with daily tests corresponding overall to 5 months of training in Mk-LI and to 2 months of training in Mk-JZ. Then, after training, the auditory threshold was determined based on 8 daily tests. The visual thresholds were then determined from daily training tests conducted during 4 months in Mk-LI and during 3 months in Mk-JZ. After training, the visual threshold was determined based on 8 daily tests. n.s. p≥0.05 ; *: p<0.05.

181
VII. Curriculum Vitae
Florian Lanz Single Le Perré 35 31 year’s old 1637 Charmey Swiss +41 79 209 31 01 [email protected]
Formation
MBA, Venture Challenge, mini-MBA
High School of Management of Fribourg
2013- Present
Ph.D Student,
University of Fribourg, Switzerland
Neurophysiology: Topic: Multisensory Integration in
human and non-human primates.
2007- Present
M.Sc. in Biology, Option Developmental and Cell Biology
University of Fribourg, Switzerland
Language: English
Master thesis in neurophysiology (Group Prof. E.M.
Rouiller):
“Development of a battery of behavioural tasks relevant for measurement
of hearing and for cochlear implant research in the Macaca fascicularis”
2005 - 2007
Bachelor of Science in Biology,
University of Fribourg, Switzerland
Languages: French and German
Bachelor thesis in neurophysiology (Group Prof. E.M.
Rouiller):
“Enregistrement des seuils auditifs comportementaux chez le macaque
(Macaca fascicularis)”
2002 - 2005
General Certificate of Education, Option Biology / Chemistry
Collège du Sud, Bulle, Switzerland
1998 - 2002
Research
Auditory behavior and physiological acoustics
182
Electrophysiological recording in monkey cochlear nucleus and pulvinar nucleus
Multisensory integration in human and monkey
Teaching
Practical works in neurophysiology (medical and biomedical students) 2008 - present
Bachelor and Master Science students supervision 2008 - present
Certificate
Certificate of animal experimenter (Module 1)
Professional Experience
Voluntary fireman 2002 – present
Guard of swimming pool, Charmey, Switzerland 2002 - 2010
Caretaker of old people’s home 1998 - 2005
Ski and snowboards instructor 1998 - 2002
Collaborations
Medicoat, A.G., 5506 Mägenwil, Switzerland
Ecole d’architectes et d’ingénieurs, 1700 Fribourg, Switzerland
S + D Scherly, 1634 La Roche, Switzerland
Hôpital fribourgeois (HFR), Hôpital cantonal, radiology, 1700 Fribourg, Switzerland
Memberships
Swiss Society for Neurosciences (SSN) 2005 - present
Acoustical Society of America 2006 - 2008
Society of Neurosciences (SfN) 2013 - present
Languages
French : Native language
English : Proficient speaking and writing level
German : B1
Informatics
Windows 7, MS-Office 2010, SigmaStat, TDT, Matlab (Basis), Neurolucida
Mac OSX, MS-Office 2011, Osirix, Papers, R (statistics and graphics) (Basis), Graphpad Prism

183
Centre of interest
Music: practice one instrument
Endurance sport: racing cycle, rock-climbing
References
Prof. Dr. Eric Rouiller
Department of Medicine
Domain of Physiology and Fribourg Cognition Center
University of Fribourg, Switzerland
E-mail: [email protected]
Phone: +41 (0)26 300 86 09
PD Ph.D Gérard Loquet
Department of Medicine
Domain of Physiology and Fribourg Cognition Center
University of Fribourg, Switzerland
Courriel: [email protected]
Phone: +41 (0)26 300 87 69


