Multilateralizing Regionalism
Fitting Asia-Pacific Agreements
into the WTO System
Gary Clyde Hufbauer Peterson Institute for International Economics
Washington DC
Jeffrey J. Schott1 Peterson Institute for International Economics
Washington DC
Paper presented at the Conference on Multilateralising Regionalism
Sponsored and organized by WTO - HEI Co-organized by the Centre for Economic Policy Research (CEPR)
10-12 September 2007 Geneva, Switzerland
1 This paper has been financed by the State Secretariat for Economic Affairs (SECO). The views expressed in the paper are the opinions of its authors and do not necessarily reflect the views or positions of SECO and Switzerland, nor the views of the Peterson Institute or its staff.
HEI, SECO, NCCR Conference Geneva, 10-12 September 2007
Multilateralizing Regionalism
Fitting Asia-Pacific Agreements into the WTO System
Gary Clyde Hufbauer and Jeffrey J. Schott Peterson Institute for International Economics
Washington DC
Jisun Kim and Matthew Adler, both research assistants at the Peterson Institute, made extensive and valuable contributions to this paper. Dean A. DeRosa carried out the gravity model analysis reported in the second section. This paper has been financed by the State Secretariat for Economic Affairs (SECO). The views expressed in the paper are the opinions of its authors and do not necessarily reflect the views or positions of SECO and Switzerland, nor the views of the Peterson Institute or its staff.
2
Introduction and Overview
It is commonplace to note the proliferation of customs unions (CUs), free trade agreements
(FTAs) and kindred arrangements, often collectively called preferential trade agreements (PTAs).
In fact, the number of agreements concluded between 2000 and 2007 (185) is just under half the
number of agreements concluded during the twentieth century (374).1 These figures can be
found in table 1. In addition to a chronological summary, table 1 provides a breakdown of PTAs
by region. Countries in Europe (not including the Former Soviet Union) have concluded the most
agreements (232) to date. Countries in the Americas have concluded the second most agreements
(166). If we consider the Asia-Pacific region (Americas, East and South Asia, and Oceania) as a
unit, the total number of concluded agreements (234) matches that of Europe.
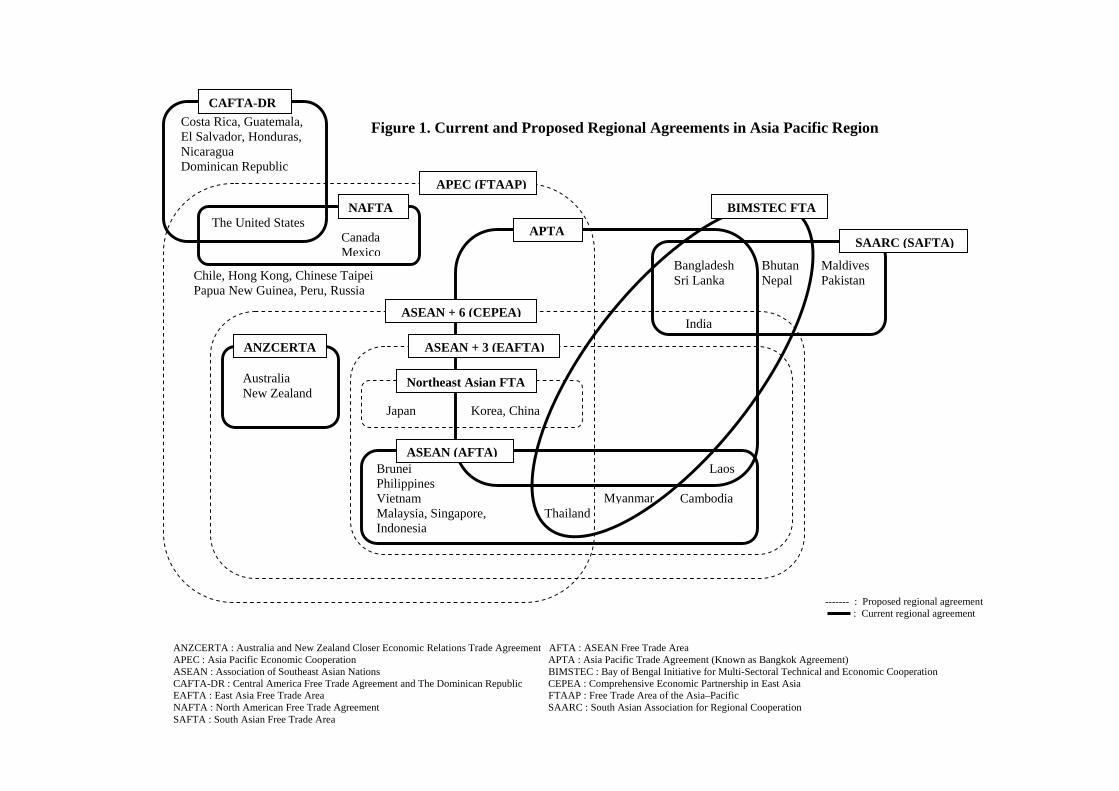
Figure 1 shows the web of PTAs in force and proposed in the Asia-Pacific region. The figure
distinguishes between agreements that are already in place (solid lines) or under consideration
(dashed lines), and names the member countries in each arrangement. As figure 1 illustrates,
many of the existing and proposed agreements overlap. In the extreme case, the FTAAP would
cover all APEC members, but not South Asian countries (notably India, Pakistan, Bangladesh,
and Sri Lanka).
To keep the picture manageable, figure 1 omits relatively small regional agreements in the Asia-
Pacific region, such as the Melanesian Spearhead Group (MSG) and the Pacific Islands
1 Figure 1 includes agreements that both have and have not been notified to the World Trade Organization. Much of our analysis here focuses on agreements that have been (or presumably will be if enacted) notified to the WTO.
3
Countries Trade Agreement (PICTA). Moreover, the size of each “box” has nothing to do with
the collective commercial importance of the countries. For example, NAFTA is the largest
existing Asia-Pacific arrangement in terms of trade volume and GDP, but it is represented by a
small box in figure 1.
The next sections examine the extent of trade and investment under PTAs for selected countries
and regions within the Asia-Pacific region.2 The data underlying this discussion are provided in
appendix tables A.1 and A.2.3 For easy reading, tables 2 and 3 summarize the appendix tables.
We conclude this overview with a summary of APEC initiatives on FTAs.
The US hub
NAFTA, which entered into force in 1994, is by far the largest free trade agreement in the Asia-
Pacific region. In 2005, NAFTA covered about 30 percent of total US merchandise trade
(imports plus exports) and about 70 percent of total Canadian and Mexican merchandise trade.
About 14 percent of inward and outward US FDI stocks are covered by NAFTA and over 60
percent of FDI stocks based in Canada and Mexico. To this day, NAFTA serves as the reference
point and template for US free trade agreements.
Stimulated by NAFTA, leaders throughout the Western Hemisphere met in Miami in 2004 to
launch work on a Free Trade Area of the Americas (FTAA). They promised to complete FTAA
negotiations by 2005, but that date has come and gone. The FTAA fell victim to the backlash 2 A detailed gravity model analysis of the effects of FTAs on trade and investment in the Asia-Pacific region is provided later in this paper. 3 These tables do not include smaller FTAs. For example, the agreement between China and Macao is not included in the table.
4
against globalization and fundamentally different perspectives in Brazil and the United States.
Meanwhile, the United States has pursued other dimensions of its free trade strategy. In 1993,
President Clinton convened the 13 APEC leaders to Blake Island, Seattle for the first APEC
Economic Leaders Meeting. This summit elevated the priority of US economic relations in the
Asia-Pacific region. Since then, the United States has advanced various plans for promoting
Asia-Pacific trade liberalization.
In 2002, the Bush administration narrowly secured Congressional approval of “fast track”
negotiating authority, renamed Trade Promotion Authority (TPA).4 Using TPA, the Bush
administration signed free trade agreements with Chile (in force in 2004), Singapore (in force in
2004), Australia (in force in 2005), five Central American countries and the Dominican Republic
(CAFTA-DR, in force with El Salvador, Honduras, Nicaragua and Guatemala in 2006), and with
Colombia, Peru, Panama and Korea (all awaiting ratification). Considering each partner among
these agreements, only the US-Korea FTA and the US-Singapore FTA individually cover more
than 1 percent of US merchandise trade. Only the US-Singapore FTA and the US-Australia FTA
cover more than 1 percent of total US FDI stocks. As a share of trade and investment, the
agreements are of course far more important to the partner countries.
The central purpose of Trade Promotion Authority (TPA) was to conclude the Doha Round under
4 Fast track negotiating authority gives the President of the United States power to negotiate agreements that the Congress can only vote up or down without amendment. Fast track was in effect, pursuant to the Trade Act of 1974 and subsequent legislation, from 1975 to 1994, and was restored in 2002 by the Trade Act of 2002. The authority expired in June 2007.
5
the auspices of the WTO. However, those talks have marked time with little progress despite six
years of negotiation. Meanwhile, the Bush Administration views bilateral and regional FTAs as a
part of a “competitive liberalization” strategy -- pushing reluctant countries either to join their
own bilateral free trade arrangements or commit to liberalization in the Doha Round.
The United States is the country most interested in advancing the Free Trade Area of the Asia-
Pacific region (FTAAP). Within the United States, Peterson Institute Director C. Fred Bergsten is
the most vocal proponent. Given the prospect for shallow WTO results, or a complete breakdown
of WTO negotiations, Bergsten has urged that the world needs a “plan B” to revive the liberal
trade agenda. He argues that the FTAAP is the best available alternative for this purpose. If
created, the FTAAP would become the world’s largest free trade area. The FTAAP would cover
about 60 percent of US two-way trade (table 2) and roughly 30 percent of total US FDI stocks
(table 3).
The China Hub
Since its WTO accession in 2001, China has concluded bilateral trade agreements with countries
around the world. However, China sees these agreements more as a tool for building diplomatic
relations than as a means of boosting commerce. This explains why Chinese FTAs are much less
comprehensive than US FTAs and exclude provisions on intellectual property, services,
investment and social issues (labor and environment).
The major objectives of China’s FTA policy were summarized in a presentation, made in 2005,
6
by the State Council and Ministry of Commerce.5 The key objectives are: 1) to play a leading
role in building an East Asian economic integration; 2) to promote a Northeast Asia FTA with
Japan and Korea; 3) to secure the supply of energy and other resources from countries such as
Australia and the Middle East.
China initially pursued FTAs with territories and countries that have strong political and
geographical ties, namely Hong Kong, Macao and ASEAN; China then expanded its list of
potential partners to strengthen relations with natural resource suppliers and to enhance its
position in world affairs. China’s potential FTA partners include: New Zealand, Australia,
Singapore, Japan, Korea, India, Mexico and Peru. China is considering the FTAAP though not
with the same level of interest as the United States. Not shown in appendix table A.1, China also
has FTAs either under negotiation or under consideration with the Gulf Cooperation Council
(GCC), Iceland and South Africa, mainly to advance its goal of security of access to energy and
natural resources.
The FTAAP would cover about 60 percent of Chinese two-way trade and about 75 percent of
Chinese FDI stocks. With the exception of the Hong Kong agreement, other Chinese agreements
cover no more than 10 percent of its trade or investment. The agreement with Hong Kong covers
roughly 10 percent of China’s two-way merchandise trade and roughly 45 percent of its FDI
stocks. The agreements, in percentage terms, are more important for China’s partners, with a
qualified exception for Hong Kong. While the agreement is more important to Hong Kong than
to China for merchandise trade, it covers roughly half of China’s FDI stocks but only about a
quarter of Hong Kong’s. 5 For more details. see Hyungdo Ahn (2006).
7
China’s surge has increased competition both within East Asia and across the Asia-Pacific region.
Other countries have altered their FTA policies accordingly. If the last decade was an era of
proliferation of FTAs within the Asia-Pacific region, the next decade could become an era of
triangular consolidation of spheres of influence with competition between the three major powers,
the United States, China and Japan.
The Japan Hub
Until very recently, the sole focus of Japan’s external economic policy was the multilateral
trading system, under the auspices of GATT and the WTO. The Asian financial crisis and the
global proliferation of FTAs prompted Japan to alter its historic opposition to preferential trade
agreements. Even so, Japan is joining the FTA race late, compared to the European Union and
the United States.6 The new Abe cabinet is pushing regional integration, and the Economy and
Fiscal Council, led by the prime minister, has launched a project team to accelerate the
conclusion of FTAs.
Japan has tilted its FTA policy by pursuing a high level of market opening in manufacturing,
services and investment, while resisting liberalization of agriculture or fisheries. The balance
between bilateral and multilateral negotiations continues to influence the timing and speed of
Japan’s FTA negotiations: Japan is anxious that FTA negotiations not undercut the Doha Round.
6 Japan’s first FTA, with Singapore in 2002, preceded China’s first FTA, with Hong Kong in 2004. Since then, however, China has embraced a more active FTA policy than Japan.
8
Japan has four FTAs in force -- with Singapore, Mexico, Malaysia and Chile --7 and collectively
they cover about 6 percent of Japan’s total two-way trade and about 5 percent of its total FDI
stocks. Japan has signed FTAs with Thailand, Chile, Indonesia and Brunei, but these are not yet
in force. Japan is currently negotiating agreements with Korea and ASEAN. These agreements
would cover 6 percent and 13 percent of Japanese trade, respectively, and 2 percent and 8 percent
of Japanese investment, respectively. Japan is also considering the FTAAP. If enacted the
agreement would cover 66 percent of Japanese trade and roughly 70 percent of Japanese
investment.
From the beginning, Japan has given priority to the ASEAN region in its FTA policy; this reflects
Japan’s substantial investments in the region, and its reliance on ASEAN resources. Japan has
used trade agreements to strengthen these ties, to further political security in Southeast Asia, and
to forestall China from becoming as the only serious commercial partner for the ASEAN group.
The ASEAN Hub
ASEAN was created in 1967 with five members (Indonesia, Malaysia, Philippines, Singapore
and Thailand). Subsequently, ASEAN has added five new members (Brunei Darussalam,
Vietnam, Lao PDR, Myanmar and Cambodia), and now comprises an economic bloc of ten
countries. In its early decades, the main purpose of ASEAN was to end guerilla wars between the
founding members, and thereby enhance the security of Southeast Asia. In the past decade, the
members put more emphasis on internal economic ties; moreover, since 2000, ASEAN has
pursued FTAs with large trading partners, namely Japan, China, Korea, Australia-New Zealand
7 The Japan-Chile FTA entered into force on September 3, 2007. Our tables will be updated in a subsequent draft reflecting that event.
9
(CER) and the United States. While ASEAN’s external FTA policy seeks to expand trade and
investment, ASEAN has been very careful to ensure that its external FTAs do not undermine its
internal integration efforts. In October 2003, the member states of ASEAN signed Bali Concord
II, which reiterates ASEAN’s commitment to create a stable, prosperous and highly competitive
ASEAN economic region. In August 2007, the ASEAN Ministers issued a declaration calling for
the elimination, by 2015, of market access barriers on the establishment of a commercial
presence in the service sector. When accomplished, this will greatly liberalize FDI in the service
industries.
Currently, ASEAN has only one FTA in force, namely with China, which covers 13 percent of
ASEAN’s total external two-way trade and roughly 7 percent of its FDI stocks. ASEAN is
considering arrangements that would expand the free trade zone to include China, Korea, and
Japan (ASEAN + 3). Under this scenario 37 percent of current ASEAN trade would be covered,
along with 32 percent of ASEAN FDI stocks. ASEAN is also considering the FTAAP; if created
the FTAAP would cover 67 percent of ASEAN’s external two-way trade and 85 percent of its
FDI stocks. In geopolitical terms, ASEAN would benefit from an FTAAP since the arrangement
would, to some extent, balance the major powers (United States, China and Japan) and give
ASEAN more scope for playing the role of “honest broker”.
The India Hub
In the mid 1990s, after decades of mediocre performance, India began to reform its internal
economic regulation and reduce its sky-high tariffs. At the same time, knowledge-based
industries took off -- especially information technology (IT) services and pharmaceuticals. India
has now become the new emerging power in the world, gaining much attention in commercial
10
and financial circles.
India’s FTA policy historically emphasized the South Asia region, but since the early 1990s,
India has adopted a “Look East” policy, attempting to strengthen ties with East Asia. India has
ten trade agreements in force and several of them are overlapping in terms of partner countries: a
non-reciprocal agreement with Nepal; a preferential trade agreement with Afghanistan; three
FTAs with Sri Lanka, Bhutan and SAFTA;8 and five “framework” agreements – those with
BIMSTEC,9 Thailand, ASEAN, Singapore and Bangladesh. Except for the framework
agreement with ASEAN, which accounts for 9 percent of India’s two-way trade, the trade
agreements with other partners cover small shares of India’s two-way trade, ranging from zero to
4 percent. Moreover, these agreements are riddled with exceptions, so that trade between India,
Pakistan and Bangladesh is far more restricted by barriers than, for example, trade between India
and Europe.
India is eager to join APEC, but existing members have their reservations. From a geopolitical
8 The South Asian Association for Regional Cooperation (SAARC) was established in 1985 with seven members (Bangladesh, Bhutan, India, the Maldives, Nepal, Pakistan and Sri Lanka). The South Asian Free Trade Area (SAFTA) among SAARC members was launched in 2006. SAFTA is a traditional trade agreement, which covers tariffs, rules of origin, safeguards, institutional structure, and dispute settlement. So far the extent of liberalization within SAFTA is limited. For more details, see appendix A in Hufbauer and Burki (2006). 9 The Bay of Bengal Initiative for Multi-Sectoral Technical and Economic Cooperation (BIMSTEC) is a sub-regional grouping with seven members (Bangladesh, India, Myanmar, Sri Lanka, Thailand, Bhutan and Nepal). It was created in June 1997, with four initial members: Bangladesh, India, Sri Lanka, and Thailand (BIST-EC or BIST-Economic Cooperation). After three new members (Myanmar, Nepal and Bhutan) joined, its name was changed to BIMSTEC.
11
standpoint, China would find it hard to put out the welcome mat; from an economic standpoint,
the United States is not enthusiastic about a new APEC member that maintains some of the
highest trade barriers in the world. Unless India dramatically changes its commercial policy, and
reaches a geopolitical accommodation with China, India will not be invited to join APEC or the
FTAAP. However, other FTAs centered on India are still possible: FTAs with Korea and Japan
are under negotiation, and a FTA with China is under consideration.
Tables 2 and 3 summarize the foregoing discussion. In these table, current and prospective FTAs
are classified under three different scenarios: agreements now in force (scenario 1); scenario 1
plus agreements signed and under negotiation (scenario 2); and scenario 2 plus agreements under
consideration including, most importantly, a possible FTAAP (scenario 3).
In scenario 1, among dominant countries, the United States shows the largest coverage of two-
way trade by FTAs now in force (33 percent). Partner countries generally conduct a larger
fraction of their two-way trade with the dominant partner than vice versa. China shows the
largest coverage of FDI by FTAs now in force (46 percent). A similar pattern for partner
countries is present for FDI stocks as for merchandise trade, but it is not as pronounced.
In scenario 2, FTAs (and other agreements) already signed and under negotiation are added to the
FTAs already in force. In this scenario, the United States and China do not show much increase
in their coverage of total two-way trade, by comparison with scenario 1, but both Japan and
ASEAN make an impressive jump. Japanese two-way total trade coverage increases from 6
percent to 22 percent, mainly due to FTAs with ASEAN and Korea, now under negotiation. The
agreements signed and under negotiation by ASEAN with Japan, Korea, Australia and New
12
Zealand would raise ASEAN’s coverage of total two-way trade from 13 percent to about 41
percent. A similar pattern exists for FDI stocks.
Scenario 3 in tables 2 and 3 depicts the coverage of present and prospective Asia-Pacific FTAs,
including, most importantly, a possible FTAAP. In this scenario, FTAs would cover more than 60
percent of total two-way trade of each dominant country except India. Under scenario 3, FDI
coverage would be similar in magnitude to trade coverage, except for the United States where
only 30 percent of FDI stocks would be covered. Taking intra-FTAAP trade into account,
scenario 3 also shows a large increase of the total two-way trade coverage of partner countries,
expanding from about 60 to around 80 percent of their world commerce.10 Since India is not a
current member of APEC and since India maintains far higher protective barriers than other
APEC countries, we assume that India would not be invited to join the FTAAP. Therefore, in
scenario 3, only 15 percent of India’s own two-way trade is covered. However, if APEC
members show genuine signs of creating a FTAAP, the prospect of being “left out” might prompt
India to radically reorient its trade policy.
Table 4 shows a matrix of “overlapping trade” among dominant countries via FTAs already in
force and potential FTAs. “Overlapping trade” is defined to occur when two dominant countries
have the same partner. The percentages in the table indicate the share of trade of the dominant
country listed in the row that overlaps, via the common partner, with the dominant country listed
in the column. The rationale for this concept is that intermediation through the common partner
may provide a limited conduit for integration between two dominant partners. However, table 4
10 Due to the substantial gaps in FDI data we do not have intra-FTAAP FDI shares. Table 3 only provides the share of all FTAAP partners FDI stocks specifically with the dominant country.
13
indicates that the current extent of overlapping trade is quite low (and, in the case of India,
nonexistent). This reflects both the regional emphasis of each dominant country, and the limited
reach of FTAs in force. Table 4 also indicates that the potential for overlapping trade would be
quite high in a FTAAP scenario.
APEC Initiatives
The Asia-Pacific Economic Cooperation (APEC) forum, established in 1989 with 12 founding
members, has grown to become the leading regional grouping in the Asia-Pacific with 21
member economies.11
In November 1994, leaders of the APEC nations gathered in Bogor, Indonesia and declared
common goals (known as the Bogor goals), including free trade and investment by 2010 for
industrialized economies and 2020 for developing economies. To advance the Bogor goals,
APEC has adopted a series of interim strategies, but none of them has proved highly successful.
The absence of binding commitments as a negotiating principle may have slowed progress in
achieving the Bogor vision.
In 1995, the APEC adopted the Osaka Action Agenda (OAA), which established a framework for
reaching the Bogor goals through unilateral trade and investment liberalization, business
facilitation, and economic and technical cooperation (known together as the three pillars).
Unilateral steps were modest and, in 1997, at their fifth meeting in Canada, the APEC trade 11 The current membership of APEC consists of 21 countries: Australia, Brunei, Canada, Chile, China, Chinese Taipei, Hong Kong, Indonesia, Japan, Korea, Malaysia, Mexico, New Zealand, Papua New Guinea, Peru, Philippines, Russia, Singapore, Thailand, the United States, and Vietnam.
14
ministers endorsed another proposal, labeled Early Voluntary Sectoral Liberalization (EVSL).
The EVSL initiative identified 15 sectors in which members agreed to strive for liberalization.
Again, achievements were modest.
Subsequent meetings of the APEC ministers were less noteworthy. According to Bergsten (2001),
the Kuala Lumpur summit in 1998 broke the momentum of trade liberalization by terminating
the effort to open additional sectors. At the Auckland summit in 1999, APEC members were in
disarray over the merits and content of a new WTO trade round. The Seattle debacle ensued three
months later.12
The next few APEC meetings were empty-handed. However, in response to the proliferation of
regional trade agreements, APEC ministers, meeting in Santiago in 2004, endorsed a call for
high-level standards for free trade agreements (FTAs) and regional trading agreements (RTAs).
At the meeting in Busan, Korea in 2005, APEC leaders adopted “the Busan Roadmap towards
the Bogor Goals”. The Roadmap endorses specific strategies, such as a strong multilateral
trading system, high-quality FTAs and RTAs, and measures to promote sustainable development.
At the APEC trade ministers meeting in Jeju, Korea in 2005, the ministers endorsed a ministerial
statement which expressed APEC support for the WTO Doha Development Agenda and a
breakthrough for Non-Agricultural Market Access (NAMA) negotiations. The meeting of APEC
Economic Leaders held in Vietnam, in 2006, reaffirmed strong support for the Doha Round and
announced the Hanoi action plan, designed to implement the Busan Roadmap.
In 2005, the Center for International Economics (CIE) evaluated APEC’s achievements and 12 For more details, see Bergsten (2001).
15
concluded that both tariff and non-tariff barriers have been reduced to a great extent. Applied
tariff barriers in the APEC region have fallen from an average of about 16 percent in 1988 to
about 6 percent in 2004; many non-tariff barriers have been either removed or converted to
tariffs or (in the case of agriculture) to tariff-rate quotas. The CIE also found that linkages among
APEC members and with the rest of world, in terms of trade and investment flows, have been
strengthened. Importantly, lower-income members have grown at particularly rapid rates.13
These beneficial outcomes largely reflect forces other than APEC. Foremost, led by China, Asia
has become a pole for rapid economic growth. APEC embraces United States and Canada as well,
and North America has enjoyed enormous productivity gains since the early 1990s. Moreover,
the Asia-Pacific region is the locus of vigorous liberalization initiatives through bilateral and
regional trade agreements: NAFTA, ANZCERTA and ASEAN (already in place) and ASEAN +3,
ASEAN+6 and a possible Northeast Asian FTA (under study).14
Whatever its accomplishments in the trade and investment field, APEC provides a unique forum
for bringing together top leaders for dialogue on political and economic issues. The newest
initiative, still in an exploratory phase, is the possible creation of a free trade area that would
embrace all APEC members. Known as a Free Trade Agreement of the Asia-Pacific, or FTAAP,
this initiative has been actively promoted by the APEC Business Advisory Council (ABAC)
since 2004. The FTAAP has been discussed among APEC members as a catalyst to spur the
revival of the Doha Development Round or as “Plan B” to restart of the process of liberalization
13 For more details, see CIE report (2005). 14 For a descriptive picture, see figure 1.
16
if the Doha Round falters.15
15 For more details, see Bergsten (2007).
17
Gravity Model Estimates16
Model Mechanics
With the proliferation of preferential trading arrangements, the gravity model has been widely
used to analyze their consequences.17 The basic gravity model evaluates thousands of one-way
or two-way bilateral trade flows, measured in a common currency (and adjusted for inflation),
against the gravitational "mass" of core explanatory variables, such as distance and combined
GDP. Additional explanatory variables are specified as well, and these are of greatest interest.
The additional variables show how much one-way or two-way trade is enlarged or reduced from
the quantity predicted by the basic core variables on account of institutional or policy features of
the partners. For instance, trading partners that share a common language or currency or have a
free trade agreement typically enjoy greater mutual trade.
To analyze customs unions and free trade agreements, a dichotomous (0, 1) explanatory variable
– often called a “dummy” or indicator variable – is introduced on the right hand side of the
regression equation to represent a preferential agreement. If the coefficient on the dummy
variable is positive and significant, then the agreement is judged to expand two-way trade
16 The gravity model analysis was carried out by Dean A. DeRosa. 17 For an introduction to gravity models applied to trade agreements see Greenaway and Milner (2002), Rose (2004), and Baldwin and Taglioni (2006). Our method follows the approach of Frankel (1997) and Choi and Schott (2001) using the general framework of the Rose (2004) gravity model with extensions from Rieder (2006) to assess the impact of a trade agreement on non-member countries.
18
between the agreement members. Additional dummy variables are introduced to assess the effect
of the agreement on a member country’s imports from and exports to a non-member country.18
Analytical Framework
Our gravity model results are initially used to summarize the effects of existing trade agreements
within the Asia-Pacific region. Following this, the results are used to extrapolate the future
effects of possible new agreements within the region.19
Data Set
Our econometric results are based on bilateral trade flows worldwide from 1976 to 2005, at the
1-digit Standard International Trade Classification (SITC) level. This data set was compiled by
DeRosa (2007) from the UN Comtrade database (using the World Integrated Trade Solution of
the World Bank). Bilateral trade flows (either one-way or two-way), the dependent variable, are
paired with several explanatory variables, shown in table 9. Year and country specific data for the
core gravity variables, such as joint-GDP and distance, and secondary gravity variables, such as
common language and common border, are taken from an extensive data set compiled by Rose
(2004). Data for free trade agreements are based on historical notifications of the date the
18 The extent of trade expansion is usually measured in percentage terms. Given the log-linear specification of dummy variables in a gravity model regression equation, the impact of a free trade agreement on bilateral trade can be computed in percentage terms as 100*[exp(bfta) – 1.00]. In this expression, bfta is the estimated coefficient for the dummy variable representing the presence of a free trade agreement, and exp(bfta) is the value of the natural number e raised to the exponent bfta. For example, if the coefficient bfta is 0.33, then the value of exp(bfta) is 1.39, and the percentage expansion in trade is estimated as 100*[1.39 – 1.00], which equals 39 percent. 19 “Future agreements” includes signed agreements which have not been ratified, agreements under negotiation, major agreements under consideration, and a possible FTAAP.

19
agreements entered into force and their contemporary participants.20 Following Rieder (2006)
among others, we include “not in agreement” indicator variables alongside the “in agreement”
indicator variables to determine the amount of trade diversion (if any) resulting from an
agreement.
We round out our data set with information on FDI stocks compiled by DeRosa (2007) from data
underlying the UNCTAD World Investment Report. FDI stock figures are considerably sparser
than bilateral trade data, resulting in a much smaller data set, about 325,000 observations over 30
years rather than nearly 2 million observations for bilateral trade. FDI stock data is typically
missing from smaller and less developed countries. Narrowing the data set in this way means that
the resulting coefficients emphasize trade relations between larger and more advanced countries.
However, there are payoffs: we can investigate the effect of FDI stocks on bilateral trade, and we
can also investigate the effect of a trade agreement on bilateral FDI stocks. Unfortunately, the
inclusion of FDI has inhibited our ability, at this time, to make estimates of actual (i.e. dollar)
impacts of FTAs. In this draft we provide primarily percentage impacts drawn from regression
results displayed in table 9.21
20 To illustrate, the NAFTA dummy for US-Mexican trade would not have a value of 1 until 1994. 21 The percentage impacts supplied in tables 6, 7, and 8 are derived from estimates of base levels of trade and the impact of FTAs (both in dollar terms). These estimates were calculated using the regression results displayed in table 9. However, we do not publish the dollar values in this paper because they were calculated solely on the basis of countries with reported FDI stock data (generally larger and more advanced countries). In a subsequent draft, we will supply dollar trade values, assuming that FDI stocks are zero when information is not available. We are reasonably confident that percentage impacts reported in tables 6, 7, and 8 will remain much the same when they are based on comprehensive trade values.
20
Calculation Scheme
Gravity model studies often aggregate customs unions (CUs) and free trade agreements (FTAs)
into one, two or three types of agreements to assess the impact of different degrees of preference
on bilateral trade.22 However we go further and use individual dummy variables for nine
prominent CUs and FTAs (or FTA types), both to identify differences between them and to better
predict the effect of potential future FTAs based on the experience of existing FTAs. For example,
we assume that the effect of a potential Japan-Korea trade deal is better predicted by using
ASEAN Free Trade Area (AFTA) coefficients than by using a generic FTA coefficient that also
reflects the experience of NAFTA and the EU. As mentioned, we distinguish nine prominent CUs
and FTAs (or FTA types) in our regression analysis.23 This provides coefficients for an analysis
of current and future trade agreements in the Asia-Pacific region and insight into actual and
potential trade diversion effects.
Table 5 summarizes our organization of actual and potential trade agreements in the Asia-Pacific
region. We differentiate between “prime partners”—larger countries—and their associates. FTAs
are separated into agreements currently in force, signed but not ratified, under negotiation, major
agreements under consideration, and a possible FTAAP. The last column indicates which
coefficient from our regression analysis was used to calculate the effect of the FTA in a given
row. The results are discussed in the next section. 22 See Hufbauer and Baldwin (2006) and Hufbauer and Burki (2006). 23 The distinct trade agreements are: European Union (EU), European Free Trade Area (EFTA), EU bilateral free trade agreements (EU FTAs), North American Free Trade Area (NAFTA), Southern Common Market (Mercosur), Chile, Mexico, Australia, and Singapore bilateral free trade agreements (CMAS FTAs—separately distinguished because these are truly free trade countries), ASEAN Free Trade Area (AFTA), South Asia Free Trade Agreement (SAFTA), and all other customs unions and free trade agreements.
21
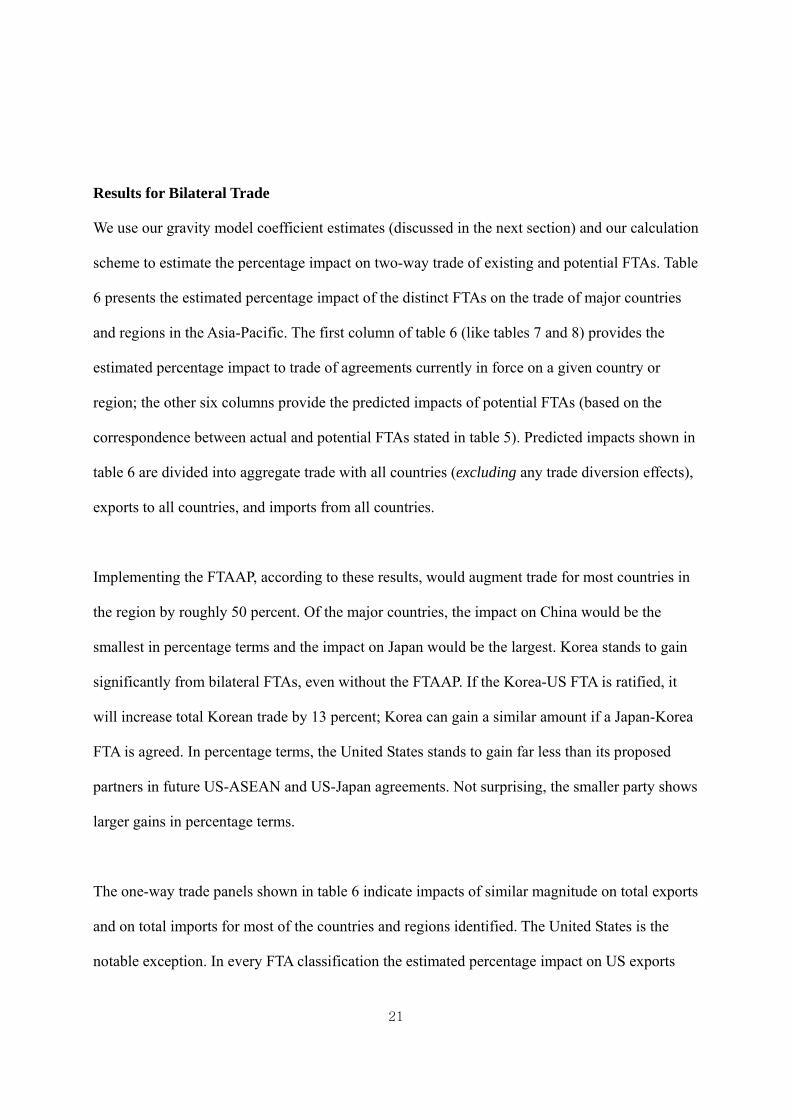
Results for Bilateral Trade
We use our gravity model coefficient estimates (discussed in the next section) and our calculation
scheme to estimate the percentage impact on two-way trade of existing and potential FTAs. Table
6 presents the estimated percentage impact of the distinct FTAs on the trade of major countries
and regions in the Asia-Pacific. The first column of table 6 (like tables 7 and 8) provides the
estimated percentage impact to trade of agreements currently in force on a given country or
region; the other six columns provide the predicted impacts of potential FTAs (based on the
correspondence between actual and potential FTAs stated in table 5). Predicted impacts shown in
table 6 are divided into aggregate trade with all countries (excluding any trade diversion effects),
exports to all countries, and imports from all countries.
Implementing the FTAAP, according to these results, would augment trade for most countries in
the region by roughly 50 percent. Of the major countries, the impact on China would be the
smallest in percentage terms and the impact on Japan would be the largest. Korea stands to gain
significantly from bilateral FTAs, even without the FTAAP. If the Korea-US FTA is ratified, it
will increase total Korean trade by 13 percent; Korea can gain a similar amount if a Japan-Korea
FTA is agreed. In percentage terms, the United States stands to gain far less than its proposed
partners in future US-ASEAN and US-Japan agreements. Not surprising, the smaller party shows
larger gains in percentage terms.
The one-way trade panels shown in table 6 indicate impacts of similar magnitude on total exports
and on total imports for most of the countries and regions identified. The United States is the
notable exception. In every FTA classification the estimated percentage impact on US exports
22
exceeds the estimated impact on US imports. We point this out to ease fears – now widespread in
the American political class – that the United States might create a web of FTAs that would
asymmetrically increase US imports, more to the benefit of FTA partners than US producers.
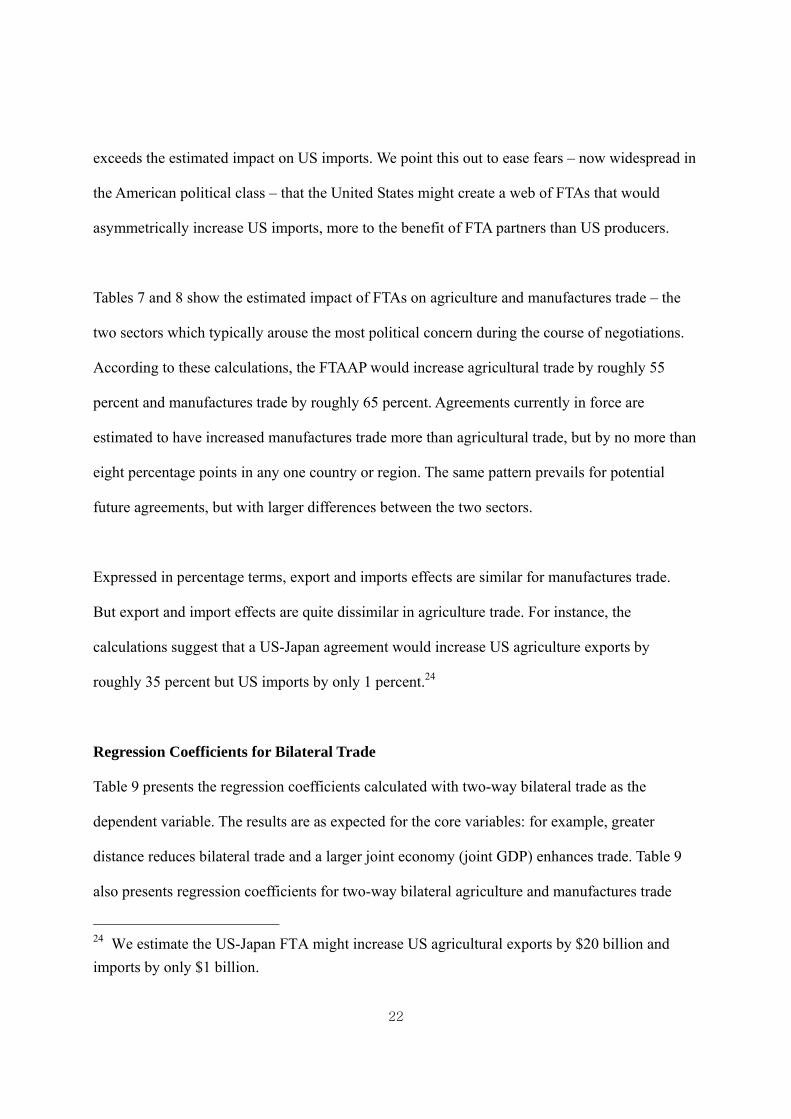
Tables 7 and 8 show the estimated impact of FTAs on agriculture and manufactures trade – the
two sectors which typically arouse the most political concern during the course of negotiations.
According to these calculations, the FTAAP would increase agricultural trade by roughly 55
percent and manufactures trade by roughly 65 percent. Agreements currently in force are
estimated to have increased manufactures trade more than agricultural trade, but by no more than
eight percentage points in any one country or region. The same pattern prevails for potential
future agreements, but with larger differences between the two sectors.
Expressed in percentage terms, export and imports effects are similar for manufactures trade.
But export and import effects are quite dissimilar in agriculture trade. For instance, the
calculations suggest that a US-Japan agreement would increase US agriculture exports by
roughly 35 percent but US imports by only 1 percent.24
Regression Coefficients for Bilateral Trade
Table 9 presents the regression coefficients calculated with two-way bilateral trade as the
dependent variable. The results are as expected for the core variables: for example, greater
distance reduces bilateral trade and a larger joint economy (joint GDP) enhances trade. Table 9
also presents regression coefficients for two-way bilateral agriculture and manufactures trade
24 We estimate the US-Japan FTA might increase US agricultural exports by $20 billion and imports by only $1 billion.
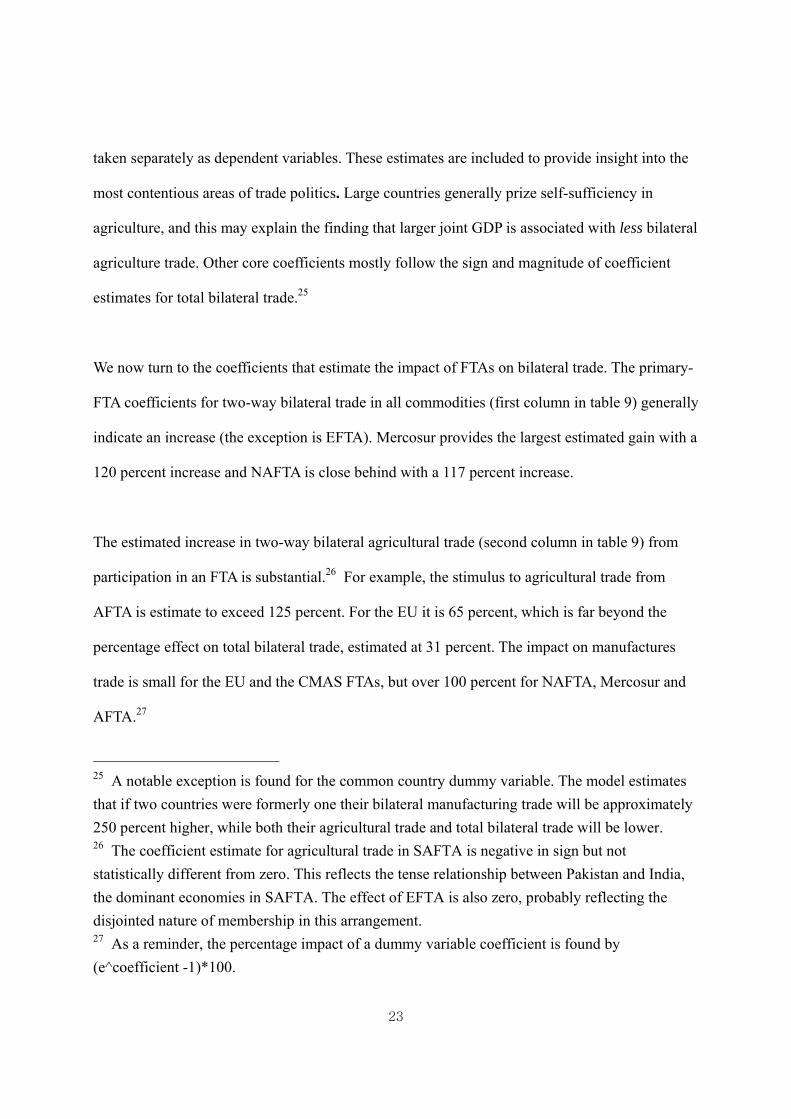
23
taken separately as dependent variables. These estimates are included to provide insight into the
most contentious areas of trade politics. Large countries generally prize self-sufficiency in
agriculture, and this may explain the finding that larger joint GDP is associated with less bilateral
agriculture trade. Other core coefficients mostly follow the sign and magnitude of coefficient
estimates for total bilateral trade.25
We now turn to the coefficients that estimate the impact of FTAs on bilateral trade. The primary-
FTA coefficients for two-way bilateral trade in all commodities (first column in table 9) generally
indicate an increase (the exception is EFTA). Mercosur provides the largest estimated gain with a
120 percent increase and NAFTA is close behind with a 117 percent increase.
The estimated increase in two-way bilateral agricultural trade (second column in table 9) from
participation in an FTA is substantial.26 For example, the stimulus to agricultural trade from
AFTA is estimate to exceed 125 percent. For the EU it is 65 percent, which is far beyond the
percentage effect on total bilateral trade, estimated at 31 percent. The impact on manufactures
trade is small for the EU and the CMAS FTAs, but over 100 percent for NAFTA, Mercosur and
AFTA.27
25 A notable exception is found for the common country dummy variable. The model estimates that if two countries were formerly one their bilateral manufacturing trade will be approximately 250 percent higher, while both their agricultural trade and total bilateral trade will be lower. 26 The coefficient estimate for agricultural trade in SAFTA is negative in sign but not statistically different from zero. This reflects the tense relationship between Pakistan and India, the dominant economies in SAFTA. The effect of EFTA is also zero, probably reflecting the disjointed nature of membership in this arrangement. 27 As a reminder, the percentage impact of a dummy variable coefficient is found by (e^coefficient -1)*100.
24
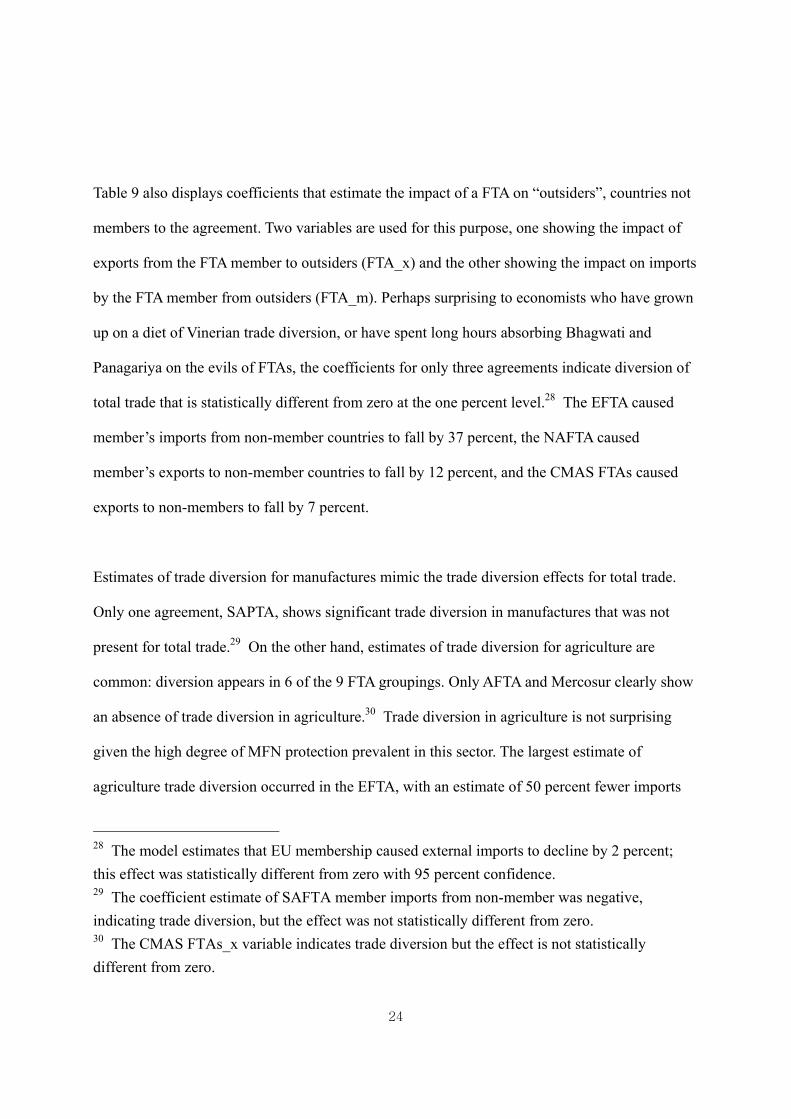
Table 9 also displays coefficients that estimate the impact of a FTA on “outsiders”, countries not
members to the agreement. Two variables are used for this purpose, one showing the impact of
exports from the FTA member to outsiders (FTA_x) and the other showing the impact on imports
by the FTA member from outsiders (FTA_m). Perhaps surprising to economists who have grown
up on a diet of Vinerian trade diversion, or have spent long hours absorbing Bhagwati and
Panagariya on the evils of FTAs, the coefficients for only three agreements indicate diversion of
total trade that is statistically different from zero at the one percent level.28 The EFTA caused
member’s imports from non-member countries to fall by 37 percent, the NAFTA caused
member’s exports to non-member countries to fall by 12 percent, and the CMAS FTAs caused
exports to non-members to fall by 7 percent.
Estimates of trade diversion for manufactures mimic the trade diversion effects for total trade.
Only one agreement, SAPTA, shows significant trade diversion in manufactures that was not
present for total trade.29 On the other hand, estimates of trade diversion for agriculture are
common: diversion appears in 6 of the 9 FTA groupings. Only AFTA and Mercosur clearly show
an absence of trade diversion in agriculture.30 Trade diversion in agriculture is not surprising
given the high degree of MFN protection prevalent in this sector. The largest estimate of
agriculture trade diversion occurred in the EFTA, with an estimate of 50 percent fewer imports
28 The model estimates that EU membership caused external imports to decline by 2 percent; this effect was statistically different from zero with 95 percent confidence. 29 The coefficient estimate of SAFTA member imports from non-member was negative, indicating trade diversion, but the effect was not statistically different from zero. 30 The CMAS FTAs_x variable indicates trade diversion but the effect is not statistically different from zero.
25
from “outsiders” than would have otherwise occurred. Again, this is not surprising given the very
high agricultural protection characteristic of EFTA members (Switzerland, Iceland, Norway).
Agriculture trade diversion effects associated with the EU and the NAFTA are remarkably
similar. These agreements caused members to reduce their agriculture exports to, and imports
from, “outside” countries by roughly 13 percent.
To conclude this section: trade diversion is important for agriculture, but it is not important for
total trade. The likely explanation is that FTA liberalization reduces the cost of manufacturing
components, and boosts the productivity of manufacturing firms, thereby stimulating both
exports to and imports from non-members. We would expect the same positive results in services
trade, if sufficient bilateral data was available to estimate gravity model coefficients.
Table 9 also provides coefficients for joint FDI stocks as an explanatory variable. For this
variable the coefficients represent implied elasticity values. According to the coefficients, a 1.0
percent increase in joint FDI stocks leads to an increase of 0.1 percent in two-way bilateral trade
in all commodities. Differentiating by sector, the implied impact is an increase of 0.08 percent in
agriculture trade; and an increase of 0.14 percent in manufactures trade. The greater sensitivity in
manufactures is unsurprising given the importance of network investment and cross-supply of
components and finished goods by multinational enterprises.
The impact of FTAs on FDI
An important motivation for entering an FTA pact – particularly for the smaller and less
developed member – is to attract foreign direct investment, not only from the larger partner but
also from third countries. We have applied the gravity model framework to evaluate the success
26
of this strategy.31
Table 10 shows the coefficient estimates for the core gravity variables, using the inward FDI
stock from the bilateral partner (either a FTA member or an outsider) as the primary dependent
variable. The sign and magnitude of the core coefficients are similar to estimates with bilateral
trade as the dependent variable, with a few notable exceptions. If two countries were formerly
one country, the inward FDI stock in each country is close to 800 percent higher than otherwise,
whereas, the trade model estimates that two-way trade would be 18 percent lower. A common
language brings about 150 percent higher FDI stocks but only 7 percent more trade. Table 10
also provides estimates of the FTA impact on FDI stocks and those coefficients are of greatest
interest.
Intuition might suggest that the primary FTA coefficients would uniformly indicate larger FDI
stocks from the bilateral partner when an FTA is in place. While this is true for several
agreements (e.g. EU, Mercosur, and AFTA), surprisingly some coefficients indicate a negative
impact on the bilateral FDI stock. Most noteworthy, the CUSFTA coefficient suggests a sharp
reduction in the bilateral FDI stock between Canada and the United States.32 We attribute this to
the substantial investment in both directions between the two countries long before CUSFTA,
often to “jump” the tariff wall, followed by the end of that particular motivation once the
CUSFTA entered into force. Since the agreement assures firms based in either country that they
31 So far as we are aware, the gravity model was first applied to evaluate the FDI attraction strategy in a study published by the Australian Productivity Commission by Adams et al. (2003). The method used here tracks the APC method. 32 For a discussion of Canada’s poor performance in attracting FDI, see Mintz and Tarasov (2007).
27
will have unfettered access to markets across the border, CUSFTA may have led to disinvestment
in small and inefficient “branch plants”. In the Mexican case, the NAFTA coefficient is also
negative, but statistically insignificant.33 Of more importance to Mexico, however, the FDI_m
coefficient attached to NAFTA is strongly positive – reflecting the spur that NAFTA provided to
European and Asian investment stakes in Mexico.
The gravity model can also be adapted to indicate the effect that an FTA has on a country’s
outward FDI to a non-member (FTA_x) simply by using outward investment to the partner
country as the dependent variable. Combining the various results tabulated in table 10, it appears
that membership in the EU increases FDI stocks between two member countries by 62 percent,
as shown by the primary EU variable. According to the same model, EU membership also
increases inward FDI from non-members by 27 percent (the EU_m term). Finally, outward FDI
from an EU member to non-members increases by 21 percent (the EU_x term). Overall, some 18
of the FTA_x and FTA_m coefficients are statistically significant (at the 90 percent or better
level), and of these 8 are negative. Investment diversion, inward or outward, may not be a
predominant characteristic of customs unions and free trade agreements, but it often happens.
33 The primary coefficient for SAFTA is also negative – attributable to strained relations between India and Pakistan. The primary coefficient for EFTA is zero, not surprising given the disjointed membership and that Switzerland is heavily invested in the European Union.
28
Policy Implications
The burst of activity detailed in the previous sections of this paper will likely continue, and could
well accelerate in response to the collapse of the Doha Round. In this section, we examine how
regional trade agreements in the Asia-Pacific could be better designed and implemented to
complement the multilateral trading system. We start with basic observations on the diverse types
of agreements already in force or under construction. We then examine options for
“multilateralizing” Asia-Pacific regionalism both by using WTO rules to shape or discipline
RTAs, and by constructing RTAs that limit discrimination and promote multilateral “building
blocks.”
Asian versus American Regionalism
Before analyzing whether Asia-Pacific regionalism can be “multilateralized”, it is important to
note that there is no such thing as an Asia-Pacific model of integration. How Asian countries
“do” trade agreements is substantially different than the US or EU model, and attempts to
harmonize them—primarily in the APEC context—have not progressed very far (as discussed
later).
Compared to the self-professed “gold standard” FTA model pursued by the United States, intra-
Asian pacts tend toward political commitments more than legal obligations, and foresee a longer
time horizon for the integration process. East Asian trade pacts also differ markedly in terms of
coverage and participation. These temporal and substantive differences merit elaboration.
First, East Asian initiatives have an aspirational quality and the time horizon is measured in
29
decades -- look at the drawn out process of the ASEAN FTA (AFTA), or the “vision” of free
trade projected in the Bogor Declaration of APEC; by contrast, US initiatives are more concrete
and focus on near to medium term results. The “Asian” approach to integration is incrementalist:
building consensus takes time; similarly, adjusting to new competition requires moderation to
buffer political regimes from the backlash of those left behind. Asian-style regionalism follows
the evolution of trade and investment in the marketplace and pauses to accommodate political
responses to the adjustment process. It reflects an historical perspective that twenty years is not
particularly long. Of course, the slow tempo now clashes with the commercial reality of a rapidly
growing China and the near-term consequences for trade and investment in the region.
Second, compared to the comprehensive scope and legal detail of provisions contained in FTAs
that the United States has negotiated, most of the Chinese and ASEAN pacts have much more
limited coverage and are replete with exceptions. Japan’s Economic Partnership Agreements
(EPAs) cover a broader range of economic activities but tread softly on agricultural reforms, on
services, and on domestic regulatory issues. In large measure, East Asian pacts ratify the status
quo and, in some sense, codify the integrated production networks already operating in the
region – networks that are linked by expanding flows of intra-regional trade and investment. In
other words, regional integration is evident in the marketplace, and governments are catching up
to acknowledge that fact and facilitate its further evolution.
However, there is an important common thread to the fabric of Asia-Pacific regionalism. In all
cases, the trade initiatives are driven by a combination of economic and political considerations,
just as APEC was at its founding almost 20 years ago. Then, like today, many countries pursued
Asia-Pacific accords to keep the United States politically, economically, and militarily engaged
30
in East Asia. That was the core objective of APEC in 1989; it is still central to the broader
initiatives that are under discussion or are being put forward at the APEC meeting in Australia in
September 2007. These include a variety of proposals centered on ASEAN, and the more recent
US proposal for a Free Trade Area of the Asia Pacific (FTAAP).34
Adapting Asia-Pacific RTAs to the WTO
Regional integration arrangements were born and raised in a multilateral world. Some of them
have loosely complied with the lax disciplines of the GATT/WTO system; most are still in their
formative years—seemingly obedient but potentially rebellious to multilateralism. This section
examines incentives or disciplines that have or could be incorporated into the WTO to reinforce
the consistency and compatibility of RTAs with the WTO, and specific provisions that might
“multilateralize” Asia-Pacific RTAs.35
We first examine what has been done to “enhance” the WTO requirements for an RTA to qualify
for the WTO’s special exemption from the most-favored-nation (MFN) principle. We then turn to
proposals to “improve” the construction of RTAs so that they complement and reinforce the
multilateral trading system.
Enhancing WTO Requirements for RTAs
34 It is also a key reason why the United States has advocated an FTAAP, particularly at a time when the future trends of US trade policy are in flux and in doubt because of the recent change in leadership in the Congress and in the presidency in January 2009. 35 Note that some of these provisions could involve “harmonization” of RTA texts. Whether such harmonization promotes multilateralism will depend on the standard to which the texts converge.
31
The WTO has flexible disciplines, contained in GATT Article XXIV and GATS Article V, that
allow RTAs to derogate from the system’s fundamental MFN principle. The language of the cited
articles is vague and prone to abuse. As a result, RTAs have included important sectoral
exceptions (e.g., agriculture) and embody rules of origin that effectively discriminate against
third country trade and investment. Countries have consistently bent the multilateral disciplines
without fear of significant GATT/WTO surveillance, much less enforcement via dispute
settlement cases. Only one RTA has passed muster and affirmatively deemed to be GATT/WTO
consistent; none have been condemned as GATT/WTO illegal. Most inhabit a legal limbo in
which WTO member countries “reserve their rights” to return to the matter some time in the
future — though no member has ever exercised that right.
A vast literature explores these problems and offers numerous creative but ultimately impractical
ideas for fixing them. The definitions and standards by which RTAs are judged against with
WTO norms are deliberately fuzzy and are likely to remain so. To date, efforts to negotiate new
multilateral disciplines on RTAs have yielded modest and mostly hortatory results.
The Uruguay Round included an “Understanding on the Interpretation of Article XXIV of the
General Agreement on Tariffs and Trade 1994” which attempted inter alia to clarify key
obligations regarding the transition period for phasing in RTA liberalization (“should exceed 10
years only in exceptional cases”) and the use of weighted average applied tariffs to determine
whether the RTA raised barriers to third-country trade. In addition, the Uruguay Round created a
new Trade Policy Review Mechanism to monitor the trade policies of member countries,
including “their impact on the functioning of the multilateral trading system.” However, with the
exception of the world’s largest RTA, the European Union, the policies and practices of RTAs
32
generally have not been the subject of periodic TPRM reviews. In any event, WTO members
firmly stated that the TPRM was not “intended to serve as a basis for the enforcement of specific
obligations under the Agreements or for dispute settlement procedures, or to impose new policy
commitments on Members” (Annex 3 of the Marrakesh Agreement).36
In the Doha Round, rules on RTAs again have been vetted, pursuant to paragraph 29 of the Doha
Ministerial Declaration of November 2001, with the aim of “clarifying and improving disciplines
and procedures under existing WTO provisions applying to regional trade agreements.” In this
area, the Doha negotiations have surprisingly produced some results. In December 2006, the
WTO General Council established a new “Transparency Mechanism for Regional Trade
Agreements” that is being implemented on a provisional basis pending completion of the
comprehensive Doha Round accords. This approach follows the precedent of the TPRM, which
was authorized and applied provisionally, after the Montreal mid-term review in 1988, and until
the Uruguay Round accords were signed in 1994.
Will the new transparency mechanism help promote the consistency of new RTAs with the WTO
disciplines of GATT Article XXIV and GATS Article V? As drafted, the new obligations are
constructive and marginally useful. Their main objective is to get countries to notify the WTO
when they are negotiating RTAs and then supplement that notice with details about the pact once
it is signed (para. 1). Article XXIV already obligates members to notify RTAs; the provisional
accord seeks to speed up the process and specifies that notifications generally should be made
“no later than” the time of ratification and “before the application of preferential treatment
between the parties” (para. 3). Either the Committee on Regional Trade Agreements or the 36 For a detailed assessment of the TPRM, see Keesing (1998).
33
Committee on Trade and Development (for pacts between developing countries) will then review
the submissions based on a “factual presentation of the RTA” prepared by the WTO Secretariat,
normally within one year of the notification date. However, the mechanism forbids the
Secretariat report from making “any value judgement” and precludes the use of the report in any
dispute settlement procedure (paras. 9 and 10).
Importantly, the new mechanism requires that RTA members notify “changes affecting the
implementation of an RTA” as soon as possible after they occur, and submit a final report on the
completion of the implementation of the pact (paras. 14 and 15). These submissions will alert
WTO members when RTA preferences, or RTA provisions such as rules of origin, are modified,
and afford members the opportunity for additional consultations on the RTA (para. 16).37
The biggest problem with the new mechanism is not the notification procedures but rather the
notification requirements. The data required relate primarily to tariffs on goods and other
traditional border measures (including quotas and safeguard measures). For services, RTA
members are supposed to submit general economic statistics; however regulatory policies and
practices that confer preferences on firms from RTA member countries are not included.
“Relevant statistics on foreign direct investment (FDI)” are required only for services—odd,
since many developing countries complain that a major problem caused by RTAs is investment
diversion in manufacturing!
37 Schott (1996, 22) noted that WTO surveillance of RTAs fails “to track regional pacts after they are signed, when transition provisions or rule changes can significantly affect market access for third-country suppliers.” New procedures should help remedy that problem.
34
In sum, despite the new transparency mechanism, WTO members continue to favor their
traditional “don’t ask too much, don’t tell too much” policy toward RTAs. Their caution reflects
in large measure the old “glass house syndrome”: countries are reticent to “throw stones” at
others for fear that their own agreements will come under scrutiny. This malady is ubiquitous in
the WTO, since almost every member belongs to one or several regional arrangements.
Making RTAs more WTO Friendly
Can incentives to reinforce multilateralism be built into Asia-Pacific pacts? To answer this
question, we examine efforts to harmonize policies through the development of APEC guidelines
on RTA “best practices.” We then address rule-making provisions (e.g., accession clauses; rules
of origin) that seek to broaden access to preferential treatment until the regional pact
approximates the MFN principle of the multilateral trading system.
APEC Guidelines for Bilateral Arrangements.
The Asia-Pacific region is home to a large and growing number of RTAs. Almost all these
countries also are members of the WTO and thus obligated to construct and implement their
RTAs in compliance with WTO obligations. Given the diverse nature of these pacts, APEC
members have sought to develop guidelines for rights and obligations covered by RTAs that
would encourage the harmonization of regional pacts toward a high standard and thus promote
the achievement of the Bogor vision of free trade and investment in the Asia-Pacific region
(Scollay 2006).
At the APEC Ministerial Meeting in Santiago, Chile in 2004, member countries agreed to
develop a set of non-binding “best practices” guidelines for FTAs. The Best Practices guidelines
35
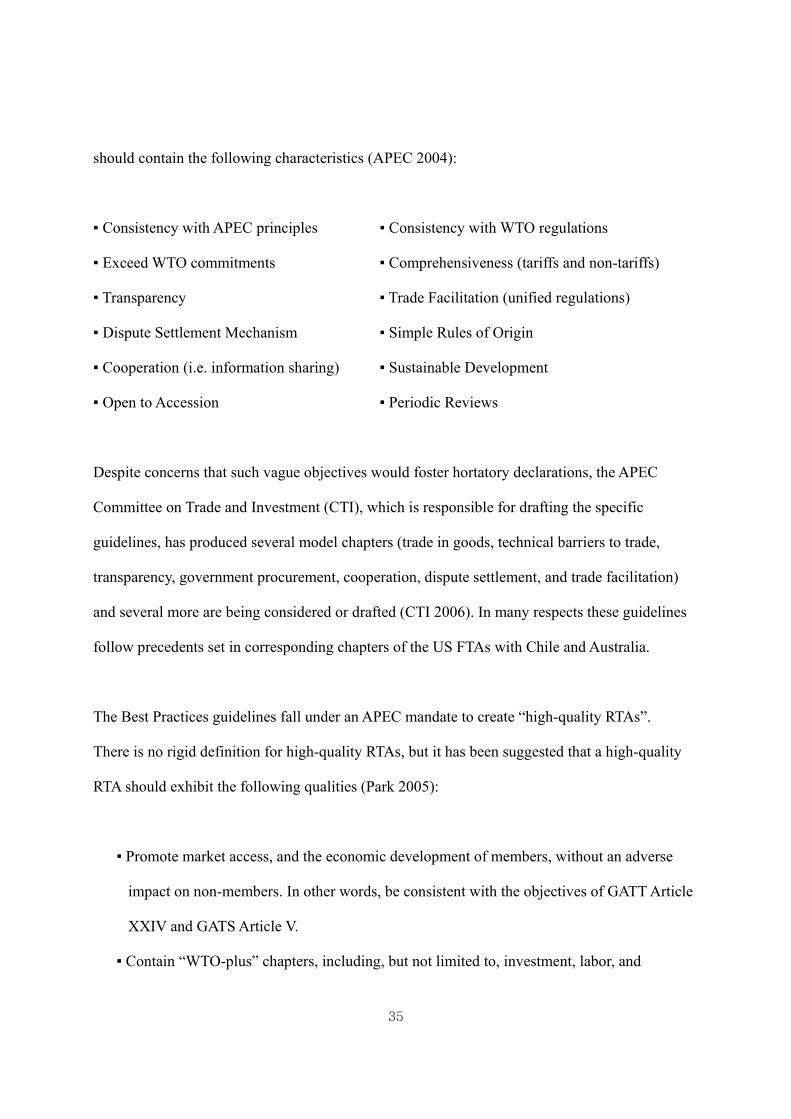
should contain the following characteristics (APEC 2004):
▪ Consistency with APEC principles ▪ Consistency with WTO regulations
▪ Exceed WTO commitments ▪ Comprehensiveness (tariffs and non-tariffs)
▪ Transparency ▪ Trade Facilitation (unified regulations)
▪ Dispute Settlement Mechanism ▪ Simple Rules of Origin
▪ Cooperation (i.e. information sharing) ▪ Sustainable Development
▪ Open to Accession ▪ Periodic Reviews
Despite concerns that such vague objectives would foster hortatory declarations, the APEC
Committee on Trade and Investment (CTI), which is responsible for drafting the specific
guidelines, has produced several model chapters (trade in goods, technical barriers to trade,
transparency, government procurement, cooperation, dispute settlement, and trade facilitation)
and several more are being considered or drafted (CTI 2006). In many respects these guidelines
follow precedents set in corresponding chapters of the US FTAs with Chile and Australia.
The Best Practices guidelines fall under an APEC mandate to create “high-quality RTAs”.
There is no rigid definition for high-quality RTAs, but it has been suggested that a high-quality
RTA should exhibit the following qualities (Park 2005):
▪ Promote market access, and the economic development of members, without an adverse
impact on non-members. In other words, be consistent with the objectives of GATT Article
XXIV and GATS Article V.
▪ Contain “WTO-plus” chapters, including, but not limited to, investment, labor, and
36
environmental standards.
▪ Provide for accession by future members.
▪ Time implementation to coincide with deadlines for the Bogor Goals.
A draft for a model FTA chapter on investment has already been circulated for review by APEC
countries, and work on drafts for sensitive chapters covering the environment, competition policy,
and temporary entry of business persons has already begun (CTI 2007). Unfortunately, the initial
reactions to the investment draft echo the fractious debates that ended up in past failures to
negotiate investment agreements, both in the OECD and the WTO.
To date, the guidelines have not had a perceptible impact on trade negotiations. National
initiatives continue to follow national templates. Attempts to harmonize existing pacts have
failed to bridge the basic divide over the appropriate standard. APEC efforts to craft model
provisions for WTO-plus issues have fallen afoul of the same controversies that have limited
progress within the WTO. The most positive impact may be educational: the “best practices”
exercise may help government officials learn lessons from the experience of other countries in
their respective RTA ventures. But it remains an open question whether those lessons will
support the process of multilateralizing regionalism.
Open-ended Accession Clauses
Following the NAFTA model established in the early 1990s, RTAs in the Asia-Pacific region
have sometimes included accession clauses that supposedly afford other countries an opportunity
to join the agreement. None of them have ever been utilized. Why?
37
From an academic perspective, the ability to expand the customs territory of an RTA by allowing
new members to sign onto existing obligations seems desirable; the RTA rules would then cover
a larger market and the implicit protection afforded by some RTA provisions, especially rules of
origin would be diluted. In practice, however, the process is far from automatic. Member
countries almost always resist gratuitous entry by “outsiders,” mainly because that would reduce
the implicit protection provided by the original deal. The “guts” of any accession, whether to
an RTA or to the WTO, is the negotiation of a national schedule for implementing reforms, as
well as specific exceptions to the liberalization timetable. Moreover, no country has ever totally
committed to free trade and investment in an RTA—not even Hong Kong thanks to its
restrictions on trade and investment in the service sector! So the concept of “open
regionalism”—long bruited in the Asia-Pacific context—is really just an ideal end point rather
than a pathway to achieving the Bogor Goal of free trade and investment. Strong resistance to
adoption of the “cumulation” concept for meeting rules of origin tests in US FTAs illustrates the
lack of political will to expand RTAs without mercantilist “payment” through reciprocal
concessions.
Rules of Origin
Rules of origin were aptly called “tools of discrimination” by a senior US Treasury official
during the NAFTA negotiations. While necessary to determine which goods qualify for RTA
preferences, they inherently limit the application of the preferences to a targeted class of products
based on their specific requirements. To coin a phrase, “the devil is the details”! The more
complex and industry-specific the origin requirements, the more the rules will have a chilling
effect on trade, in large part by raising the cost of compliance. Indeed, in the US-Canada context,
some firms have decided that the additional transactions costs would be higher than the MFN
38
tariff and thus have not applied for the FTA preferences.
As we have argued elsewhere, the best solution to discriminatory origin rules is to eliminate the
source of the problem: the margin of preference between MFN tariffs and the RTA rate. Even
though the United States initially proposed the elimination of industrial tariffs in the Doha Round,
few countries were willing to accept the challenge (and US officials no longer revive that
proposal). As a half-way measure to that desirable result, we have suggested in the NAFTA
context that the North American partners harmonize over a short period of time the tariffs that
each member applies to third countries on an MFN basis. The key to this approach, however, is
that the standard of convergence should be the lowest rate applied by any of the RTA members.
Such an approach can be achieved in the NAFTA context, and perhaps in other regional
groupings as well. It could be a problem, however, in some APEC countries that maintain a large
gap between their WTO tariff bindings and the currently applied rates.
Asia-Pacific Regionalism: Prospects growing forward
“Competitive liberalization” is thriving in East Asia, propelled by a strengthening of regional
integration among the members of the Association of Southeast Asian Nations (ASEAN) and the
new wave of Chinese initiatives with other Asian countries, following China’s accession to the
World Trade Organization (WTO) six years ago. China’s trade talks with the ASEAN group and
India have prompted Japan and Korea to emulate the Chinese initiatives. Like Japan and Korea,
China also has concluded a FTA with Chile and is pursuing trade initiatives (though not “free
trade” agreements) in other regions. Its policy is designed to enhance security of access to raw
materials and to diversify its rapidly growing export markets.
39
APEC is now considering broader integration initiatives, including the FTAAP. The September
meeting of APEC leaders in Australia could well embark on what might be called competitive
liberalization studies, assessing the political and economic merits of variant trading agreements,
ranging from ASEAN+3 to a possible FTAAP. The last APEC meeting already delivered a
mandate to begin looking into these alternatives, and the process of research and development
could accelerate at the meetings in Sydney in September 2007 -- particularly if there are few
signs of a breakthrough in the Doha Round talks.
The APEC study process will inevitably uncover widely differing ambitions and scope among
the Asia-Pacific agreements profiled in table 5. However, all the models suggested – ASEAN+1,
ASEAN+3, ASEAN+6, or even FTAAP – have at their heart the ASEAN FTA. Yet even today
AFTA is not an integrated unit.38 An inevitable conclusion is that further integration will take
time, and market forces will more often lead policy initiatives than the other way around.
Evolution of integration in East Asia and the Asia-Pacific region will depend importantly on
what happens in the WTO and the outcome of the Doha Round. If the WTO process collapses, or
delivers meager results, that will have important implications. On balance, either a WTO collapse
or shallow outcome will likely spur the creation of new pacts in East Asia and the Asia-Pacific
region.
38 ASEAN+1 is really three possible individual ASEAN agreements between China, Japan, and Korea. ASEAN+3 is a possible free trade area encompassing ASEAN, China, Japan, and Korea. ASEAN+6 is a possible free trade area encompassing ASEAN, China, Japan, Korea, Australia, New Zealand and India. FTAAP is a possible free trade area among all the current members of APEC.
40
The big question mark is whether the WTO outcome and the competitive liberalization spirit will
spawn a trilateral deal between China, Korea, and Japan. Such a pact is currently under study.
Whether study will pave the road to FTA negotiations remains to be seen. We are skeptical, since
such studies often are commissioned simply to defer decisions on politically sensitive matters—
much like the recent ASEAN decision with respect to the Japanese proposal for the ASEAN+6
initiative. But a Northeast Asian FTA would link three powerful manufacturing economies with
substantial financial resources and all but ensure eventual expansion to the “ASEAN+3” East
Asian free trade zone, since each Northeast Asian country is conducting parallel negotiations
with ASEAN members.
None of these agreements include Taiwan, and in fact they all discriminate against Taiwan. The
US-Korea FTA will likely cause significant trade diversion away from Taiwanese exports to both
Korean and US exports. Future agreements that Japan might reach with Korea and the United
States will do the same. That may not be a big economic problem for everyone else, but does
raise important political questions. The FTAAP is the only option vetted to date that could
accommodate the intractable Taiwan problem.
Will all this bilateral activity lead to the fulfillment of the original APEC vision of free trade and
investment by 2020, agreed at Bogor in 1994? The APEC Business Advisory Council is not so
sure and accordingly advocated a fresh look at the FTAAP option in a report to the APEC
leaders when they met in Santiago, Chile, in November 2004. Not surprisingly, the official
reaction was muted. No American or Japanese politician wants to talk about free trade with
China—even as a long-term proposition. But events may propel reconsideration, particularly if
41
the Doha Round goes into hibernation and subsequent efforts at trade liberalization are centered
on bilateral FTAs. That outcome could easily create an atmosphere of commercial discrimination
in the Asia-Pacific region which would make an FTAAP look quite attractive.
42
References Adams, Richard, Phillipa Dee, Jyothi Goli, and Greg McGuire. 2003. The Trade and Investment Effects of Preferential Trading Arrangements—Old and New Evidence. Staff Working Paper. Canberra: Australia Productivity Commission. Asia-Pacific Economic Cooperation (APEC). 2004. Best Practices for RTAs/FTAs in APEC. Submitted by SOM Chair for consideration to 16th APEC Ministerial Meeting in Santiago, Chile. Forum Doc No. 2004/CSOM/028rev1. Doc. No. 2004/AMM/003, Agenda Item V.2. Baldwin, Richard E., and Daria Taglioni. 2006. Gravity for Dummies and Dummies for Gravity Equations. Discussion Paper Series, no: 5850. London: Centre for Economic Policy Research. Bergsten, C Fred. 2001. “Brunei: Turning Point for APEC,” Policy Brief 01-1, Washington: Peterson Institute for International Economics, January 2001. Bergsten, C Fred. 2007. “Toward a Free Trade Area of the Asia Pacific,” Policy Brief 07-2, Washington: Peterson Institute for International Economics, February 2007. Choi, Inbom and Jeffrey Schott. 2001. Free Trade between Korea and the United States? Washington: Institute for International Economics. CIE report. 2005. Open Economies Delivering to People, 2005: Regional integration and outcomes in the APEC region, Center for International Economics. Committee on Trade and Investment, APEC. 2006. Appendix 1 to Committee on Trade and Investment Report to Asia Pacific Economic Cooperation Ministers, CTI Agreed RTAs/FTAs Model Measures Texts. Retrieved from: www.apec.org/etc/medialib/ apec_media_library/downloads/committees/cti/pubs/2006.Par.0021.File.v1.1 (accessed August 16 2007). Committee on Trade and Investment, APEC. 2007. Achievements and Current Activities. www.apecsec.org.sg/apec/apec_groups/committees/committee_on_trade.html. (accessed August 16 2007). DeRosa, Dean A. 2007. The Trade Effects of Preferential Arrangements: New Evidence from the
43
Australia Productivity Commission. Working Paper Series no: WP 07-1. Washington: Peterson Institute for International Economics. Frankel, Jeffrey A.1997. Regional Trading Blocs in the World Economic System. Washington: Institute for International Economics. Greenaway, David, and Chris Milner. 2002. Regionalism and Gravity. Scottish Journal of Political Economy 49: 574-85. Hufbauer, Gary C., and Richard E. Baldwin. 2006. The Shape of a Swiss-US Free Trade Agreement. Washington: Peterson Institute for International Economics. Hufbauer, Gary C., and Shahid Javed Burki. 2006. Sustaining Reform with a US-Pakistan Free Trade Agreement. Washington: Peterson Institute for International Economics. Hyungdo, Ahn. 2006. “FTA policies of CJK and Prospects of CJK FTA,” Korea Institute for International Economic Policy. Keesing, Donald B. 1998. Improving Trade Policy Reviews in the World Trade Organization. Policy Analyses in International Economics 52. Washington: Institute for International Economics, April. Mintz, Jack M. and Andrey Tarasov. 2007. Canada is Missing out on Global Capital Market Integration. E-brief. Toronto: C.D. Howe Institute. Park, Sung-Hoon. 2006. Sub-regionalism (FTAs/RTAs) in the APEC Region and the Road to the Bogor Goals. In Broadening the Horizon for Pacific Economic Cooperation: Korean Perspective. Papers presented at the Korean National Committee for Pacific Economic Cooperation (KOPEC). Seoul, Korea. Plumper, Thomas, and Vera E. Troeger. 2007. Efficient Estimation of Time-Invariant and Rarely Changing Variables in Finite Sample Panel Analyses with Unit Fixed Effects. Political Analysis 15, no 2: 124-39. Rieder, Roland. 2006. Playing Dominoes in Europe: An Empirical Analysis of the Domino Theory for the EU, 1962-2004. HEI Working Paper no: 11/2006. Geneva: Graduate Institute of
44
International Studies. Rose, Andrew K. 2004. Do We Really Know that the WTO Increases Trade? American Economic Review 94, no 1: 98-114. Schott, Jeffrey J., ed. 1996. The World Trading System: Challenges Ahead. Washington: Institute for International Economics. Scollay, Robert. 2006. WTO Rules on RTAs/FTAs from Perspective of Developing Economies. APEC Workshop on Best Practices in Trade Policy for RTAs/FTAs: Practical Lessons and Experience for Developing Economies. Ha Noi Viet Nam, Doc. No. 2006/SOM1/CTI/FTA-RTA/003.
Chile, Hong Kong, Chinese Taipei Papua New Guinea, Peru, Russia
Brunei Laos Philippines Vietnam Cambodia Malaysia, Singapore, Thailand Indonesia
APEC (FTAAP)
ASEAN + 6 (CEPEA)
ASEAN + 3 (EAFTA)
ASEAN (AFTA)
APTA
Bhutan Nepal
BIMSTEC FTA
Maldives Pakistan
SAARC (SAFTA)
Bangladesh Sri Lanka
------- : Proposed regional agreement : Current regional agreement
ANZCERTA : Australia and New Zealand Closer Economic Relations Trade Agreement AFTA : ASEAN Free Trade Area APEC : Asia Pacific Economic Cooperation APTA : Asia Pacific Trade Agreement (Known as Bangkok Agreement) ASEAN : Association of Southeast Asian Nations BIMSTEC : Bay of Bengal Initiative for Multi-Sectoral Technical and Economic Cooperation CAFTA-DR : Central America Free Trade Agreement and The Dominican Republic CEPEA : Comprehensive Economic Partnership in East Asia EAFTA : East Asia Free Trade Area FTAAP : Free Trade Area of the Asia–Pacific NAFTA : North American Free Trade Agreement SAARC : South Asian Association for Regional Cooperation SAFTA : South Asian Free Trade Area
Japan Korea, China
Northeast Asian FTA
India
The United States Canada Mexico
Costa Rica, Guatemala, El Salvador, Honduras, Nicaragua Dominican Republic
NAFTA
Australia New Zealand
ANZCERTA
CAFTA-DR
Figure 1. Current and Proposed Regional Agreements in Asia Pacific Region
Myanmar
HEI, SECO, NCCR Conference Geneva, 10-12 September 2007
Multilateralizing Regionalism
Fitting Asia-Pacific Agreements into the WTO System
Gary Clyde Hufbauer and Jeffrey J. Schott Peterson Institute for International Economics
Washington DC
Supplementary Tables Jisun Kim and Matthew Adler, both research assistants at the Peterson Institute, made extensive and valuable contributions to this paper. Dean A. DeRosa carried out the gravity model analysis reported in the second section. This paper has been financed by the State Secretariat for Economic Affairs (SECO). The views expressed in the paper are the opinions of its authors and do not necessarily reflect the views or positions of SECO and Switzerland, nor the views of the Peterson Institute or its staff.
Supplement to Gravity Model Estimates
This supplement provides dollar impact tables of FTAs for selected regions and countries,
calculated using the gravity model coefficients as explained in the main text. Updated
corresponding percentage impact tables are also provided. In the main text, the
percentage impact tables were calculated solely on the basis of countries with reported
FDI stock data. Primarily these are larger and more advanced countries. The calculations
in this supplement additionally cover countries with unreported FDI stock data. For these
countries, the calculations assume a small FDI stock -- just enough to perform the
calculations. Hence the figures in these supplementary tables cover a comprehensive set
of Asia-Pacific countries.
Table S.1 shows average annual dollar trade, over the period 2001-2005, for selected
Asian-Pacific countries and regions. These amounts serve as the base figures to calculate
the percentage impacts displayed in Tables S.3, S.5, and S.7.1
The alternative dollar trade impact figures that were used to calculate the percentage
impacts shown in the main text and those provided here are nearly identical. Tables S.2,
S.4, and S.6 provide the dollar trade impact estimates on a comprehensive basis. The
biggest changes from the dollar trade impact figures underlying the percentages reported
in the main text occur, as expected, in those FTA groups without full FDI stock data. The
percentage impact figures, shown in Tables S.3, S.5 and S.7, correspond respectively to
1 By contrast, the corresponding base levels of trade used in the main test are calculated using the regression coefficients in Table S.8, but assigning a dummy value of zero to all FTAs.
Tables 6, 7, and 8 in the main text. Every percentage impact in the supplemental tables is
higher than the corresponding impact from the main text tables. FTAs are not suddenly
more influential; rather, the explanation is that the base levels of trade reported in Table
S.1 are somewhat smaller than the base levels previously calculated.
Among the notable dollar trade impact figures in Table S.2 are these:
▪ An estimated $4.8 trillion increase in APEC two-way merchandise trade if the FTAAP was fully implemented;
▪ An estimated $150 billion increase in US two-way trade if the US-ASEAN FTA was
implemented; ▪ An estimated $300 billion increase in ASEAN two-way trade if the US-ASEAN FTA
was implemented; ▪ And an estimated $200 billion increase in ASEAN trade if the ASEAN+3 FTA was
implemented.
Tables S.4 and S.6 provide the estimated impacts of FTAs, in dollar terms, on agriculture
and manufactures trade, respectively.
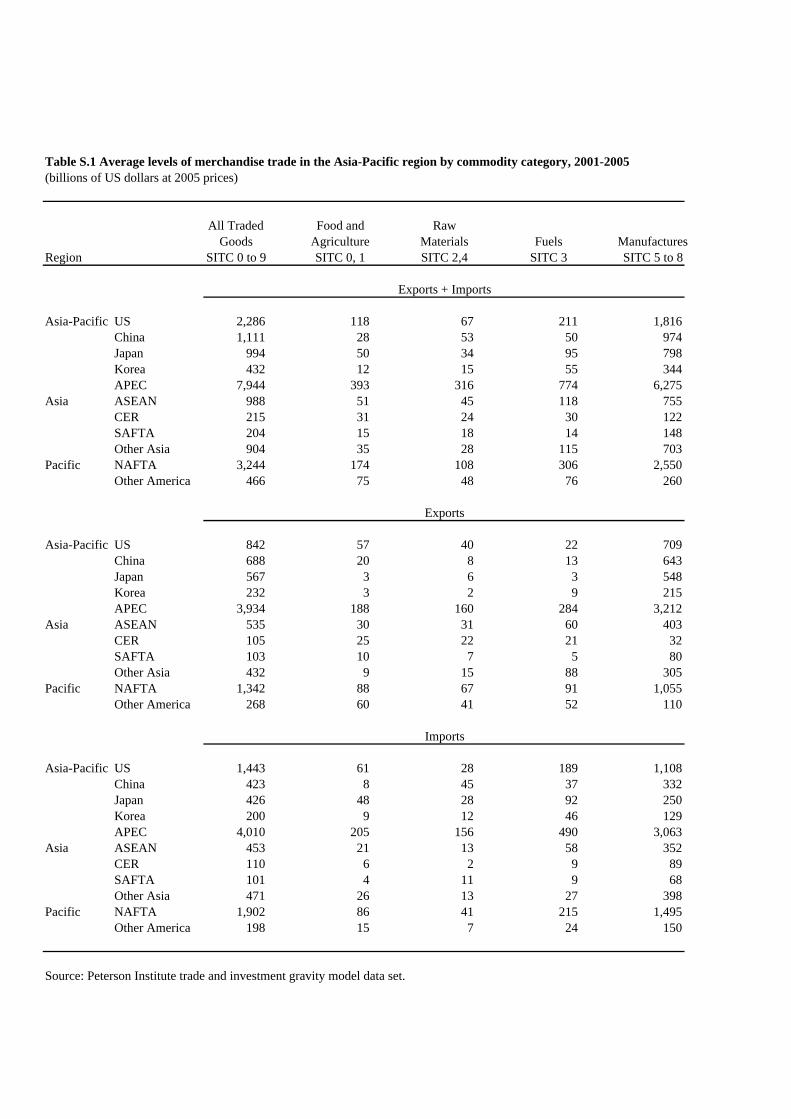
All Traded Food and RawGoods Agriculture Materials Fuels Manufactures
Region SITC 0 to 9 SITC 0, 1 SITC 2,4 SITC 3 SITC 5 to 8
Asia-Pacific US 2,286 118 67 211 1,816China 1,111 28 53 50 974Japan 994 50 34 95 798Korea 432 12 15 55 344APEC 7,944 393 316 774 6,275
Asia ASEAN 988 51 45 118 755CER 215 31 24 30 122SAFTA 204 15 18 14 148Other Asia 904 35 28 115 703
Pacific NAFTA 3,244 174 108 306 2,550Other America 466 75 48 76 260
Asia-Pacific US 842 57 40 22 709China 688 20 8 13 643Japan 567 3 6 3 548Korea 232 3 2 9 215APEC 3,934 188 160 284 3,212
Asia ASEAN 535 30 31 60 403CER 105 25 22 21 32SAFTA 103 10 7 5 80Other Asia 432 9 15 88 305
Pacific NAFTA 1,342 88 67 91 1,055Other America 268 60 41 52 110
Asia-Pacific US 1,443 61 28 189 1,108China 423 8 45 37 332Japan 426 48 28 92 250Korea 200 9 12 46 129APEC 4,010 205 156 490 3,063
Asia ASEAN 453 21 13 58 352CER 110 6 2 9 89SAFTA 101 4 11 9 68Other Asia 471 26 13 27 398
Pacific NAFTA 1,902 86 41 215 1,495Other America 198 15 7 24 150
Source: Peterson Institute trade and investment gravity model data set.
Table S.1 Average levels of merchandise trade in the Asia-Pacific region by commodity category, 2001-2005(billions of US dollars at 2005 prices)
Exports + Imports
Exports
Imports
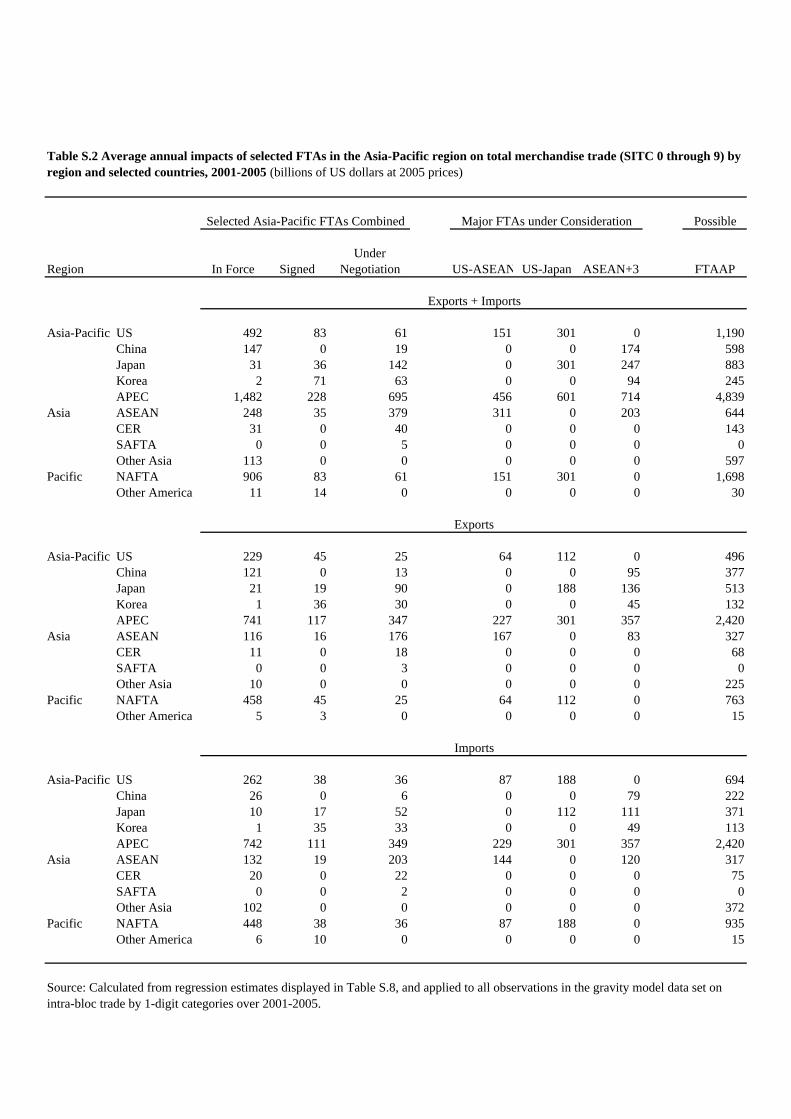
Possible
UnderRegion In Force Signed Negotiation US-ASEAN US-Japan ASEAN+3 FTAAP
Asia-Pacific US 492 83 61 151 301 0 1,190China 147 0 19 0 0 174 598Japan 31 36 142 0 301 247 883Korea 2 71 63 0 0 94 245APEC 1,482 228 695 456 601 714 4,839
Asia ASEAN 248 35 379 311 0 203 644CER 31 0 40 0 0 0 143SAFTA 0 0 5 0 0 0 0Other Asia 113 0 0 0 0 0 597
Pacific NAFTA 906 83 61 151 301 0 1,698Other America 11 14 0 0 0 0 30
Asia-Pacific US 229 45 25 64 112 0 496China 121 0 13 0 0 95 377Japan 21 19 90 0 188 136 513Korea 1 36 30 0 0 45 132APEC 741 117 347 227 301 357 2,420
Asia ASEAN 116 16 176 167 0 83 327CER 11 0 18 0 0 0 68SAFTA 0 0 3 0 0 0 0Other Asia 10 0 0 0 0 0 225
Pacific NAFTA 458 45 25 64 112 0 763Other America 5 3 0 0 0 0 15
Asia-Pacific US 262 38 36 87 188 0 694China 26 0 6 0 0 79 222Japan 10 17 52 0 112 111 371Korea 1 35 33 0 0 49 113APEC 742 111 349 229 301 357 2,420
Asia ASEAN 132 19 203 144 0 120 317CER 20 0 22 0 0 0 75SAFTA 0 0 2 0 0 0 0Other Asia 102 0 0 0 0 0 372
Pacific NAFTA 448 38 36 87 188 0 935Other America 6 10 0 0 0 0 15
Table S.2 Average annual impacts of selected FTAs in the Asia-Pacific region on total merchandise trade (SITC 0 through 9) by region and selected countries, 2001-2005 (billions of US dollars at 2005 prices)
Source: Calculated from regression estimates displayed in Table S.8, and applied to all observations in the gravity model data set on intra-bloc trade by 1-digit categories over 2001-2005.
Selected Asia-Pacific FTAs Combined
Exports + Imports
Exports
Imports
Major FTAs under Consideration
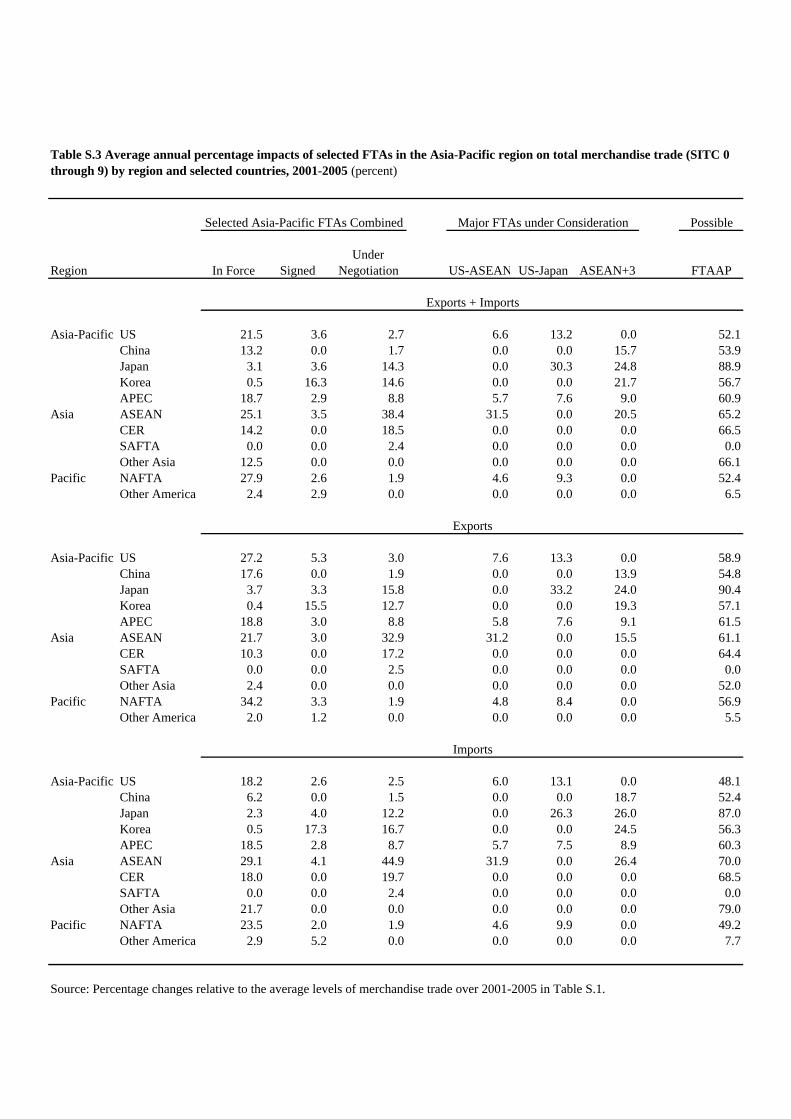
Possible
UnderRegion In Force Signed Negotiation US-ASEAN US-Japan ASEAN+3 FTAAP
Asia-Pacific US 21.5 3.6 2.7 6.6 13.2 0.0 52.1China 13.2 0.0 1.7 0.0 0.0 15.7 53.9Japan 3.1 3.6 14.3 0.0 30.3 24.8 88.9Korea 0.5 16.3 14.6 0.0 0.0 21.7 56.7APEC 18.7 2.9 8.8 5.7 7.6 9.0 60.9
Asia ASEAN 25.1 3.5 38.4 31.5 0.0 20.5 65.2CER 14.2 0.0 18.5 0.0 0.0 0.0 66.5SAFTA 0.0 0.0 2.4 0.0 0.0 0.0 0.0Other Asia 12.5 0.0 0.0 0.0 0.0 0.0 66.1
Pacific NAFTA 27.9 2.6 1.9 4.6 9.3 0.0 52.4Other America 2.4 2.9 0.0 0.0 0.0 0.0 6.5
Asia-Pacific US 27.2 5.3 3.0 7.6 13.3 0.0 58.9China 17.6 0.0 1.9 0.0 0.0 13.9 54.8Japan 3.7 3.3 15.8 0.0 33.2 24.0 90.4Korea 0.4 15.5 12.7 0.0 0.0 19.3 57.1APEC 18.8 3.0 8.8 5.8 7.6 9.1 61.5
Asia ASEAN 21.7 3.0 32.9 31.2 0.0 15.5 61.1CER 10.3 0.0 17.2 0.0 0.0 0.0 64.4SAFTA 0.0 0.0 2.5 0.0 0.0 0.0 0.0Other Asia 2.4 0.0 0.0 0.0 0.0 0.0 52.0
Pacific NAFTA 34.2 3.3 1.9 4.8 8.4 0.0 56.9Other America 2.0 1.2 0.0 0.0 0.0 0.0 5.5
Asia-Pacific US 18.2 2.6 2.5 6.0 13.1 0.0 48.1China 6.2 0.0 1.5 0.0 0.0 18.7 52.4Japan 2.3 4.0 12.2 0.0 26.3 26.0 87.0Korea 0.5 17.3 16.7 0.0 0.0 24.5 56.3APEC 18.5 2.8 8.7 5.7 7.5 8.9 60.3
Asia ASEAN 29.1 4.1 44.9 31.9 0.0 26.4 70.0CER 18.0 0.0 19.7 0.0 0.0 0.0 68.5SAFTA 0.0 0.0 2.4 0.0 0.0 0.0 0.0Other Asia 21.7 0.0 0.0 0.0 0.0 0.0 79.0
Pacific NAFTA 23.5 2.0 1.9 4.6 9.9 0.0 49.2Other America 2.9 5.2 0.0 0.0 0.0 0.0 7.7
Exports + Imports
Exports
Imports
Source: Percentage changes relative to the average levels of merchandise trade over 2001-2005 in Table S.1.
Table S.3 Average annual percentage impacts of selected FTAs in the Asia-Pacific region on total merchandise trade (SITC 0 through 9) by region and selected countries, 2001-2005 (percent)
Selected Asia-Pacific FTAs Combined Major FTAs under Consideration
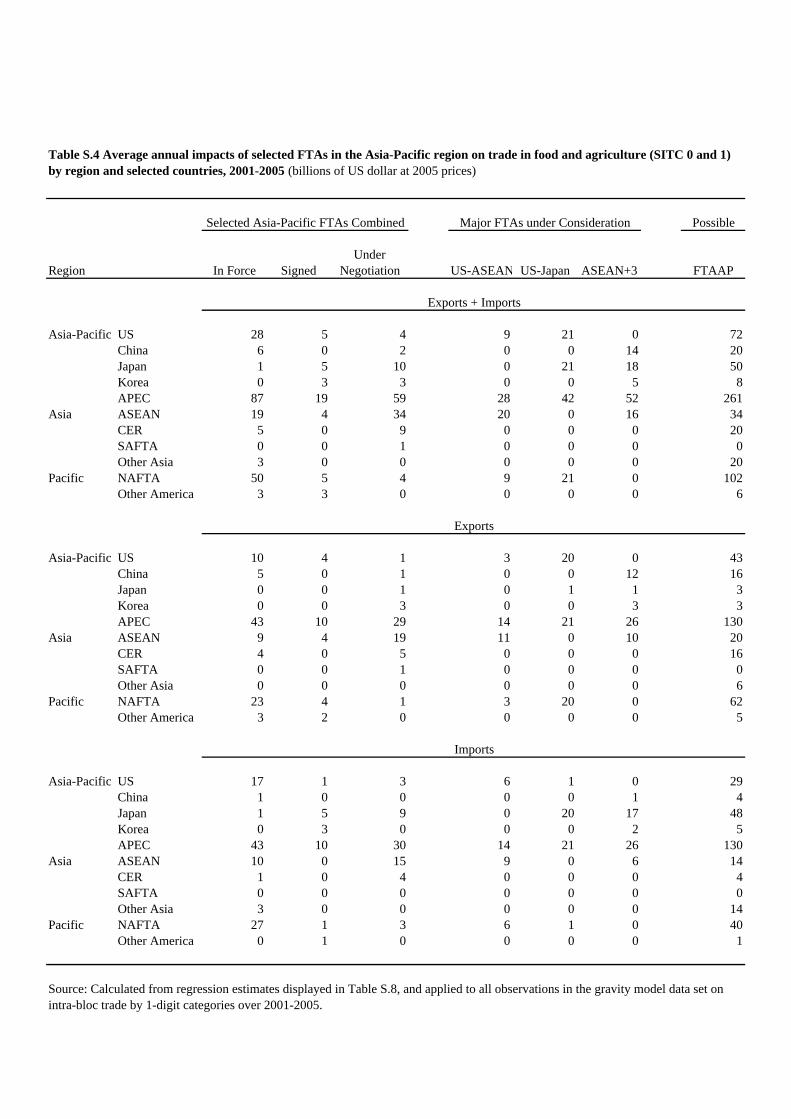
Possible
UnderRegion In Force Signed Negotiation US-ASEAN US-Japan ASEAN+3 FTAAP
Asia-Pacific US 28 5 4 9 21 0 72China 6 0 2 0 0 14 20Japan 1 5 10 0 21 18 50Korea 0 3 3 0 0 5 8APEC 87 19 59 28 42 52 261
Asia ASEAN 19 4 34 20 0 16 34CER 5 0 9 0 0 0 20SAFTA 0 0 1 0 0 0 0Other Asia 3 0 0 0 0 0 20
Pacific NAFTA 50 5 4 9 21 0 102Other America 3 3 0 0 0 0 6
Asia-Pacific US 10 4 1 3 20 0 43China 5 0 1 0 0 12 16Japan 0 0 1 0 1 1 3Korea 0 0 3 0 0 3 3APEC 43 10 29 14 21 26 130
Asia ASEAN 9 4 19 11 0 10 20CER 4 0 5 0 0 0 16SAFTA 0 0 1 0 0 0 0Other Asia 0 0 0 0 0 0 6
Pacific NAFTA 23 4 1 3 20 0 62Other America 3 2 0 0 0 0 5
Asia-Pacific US 17 1 3 6 1 0 29China 1 0 0 0 0 1 4Japan 1 5 9 0 20 17 48Korea 0 3 0 0 0 2 5APEC 43 10 30 14 21 26 130
Asia ASEAN 10 0 15 9 0 6 14CER 1 0 4 0 0 0 4SAFTA 0 0 0 0 0 0 0Other Asia 3 0 0 0 0 0 14
Pacific NAFTA 27 1 3 6 1 0 40Other America 0 1 0 0 0 0 1
Table S.4 Average annual impacts of selected FTAs in the Asia-Pacific region on trade in food and agriculture (SITC 0 and 1) by region and selected countries, 2001-2005 (billions of US dollar at 2005 prices)
Source: Calculated from regression estimates displayed in Table S.8, and applied to all observations in the gravity model data set on intra-bloc trade by 1-digit categories over 2001-2005.
Selected Asia-Pacific FTAs Combined
Exports + Imports
Exports
Imports
Major FTAs under Consideration
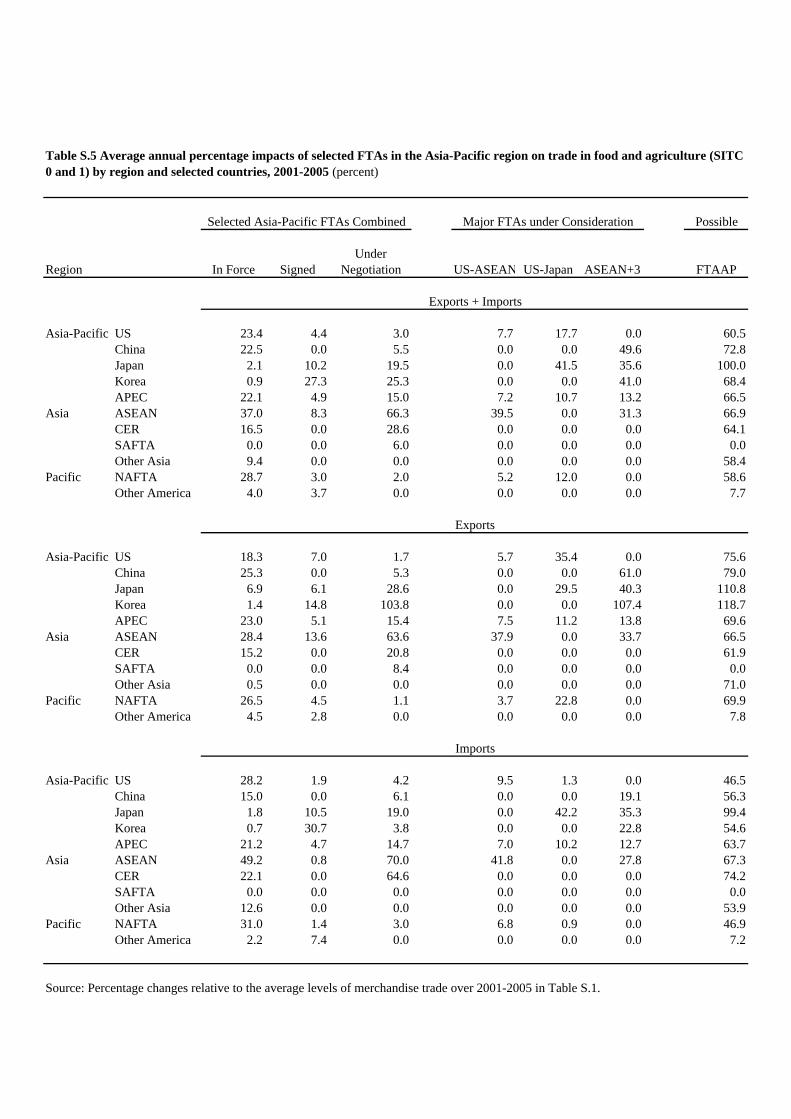
Possible
UnderRegion In Force Signed Negotiation US-ASEAN US-Japan ASEAN+3 FTAAP
Asia-Pacific US 23.4 4.4 3.0 7.7 17.7 0.0 60.5China 22.5 0.0 5.5 0.0 0.0 49.6 72.8Japan 2.1 10.2 19.5 0.0 41.5 35.6 100.0Korea 0.9 27.3 25.3 0.0 0.0 41.0 68.4APEC 22.1 4.9 15.0 7.2 10.7 13.2 66.5
Asia ASEAN 37.0 8.3 66.3 39.5 0.0 31.3 66.9CER 16.5 0.0 28.6 0.0 0.0 0.0 64.1SAFTA 0.0 0.0 6.0 0.0 0.0 0.0 0.0Other Asia 9.4 0.0 0.0 0.0 0.0 0.0 58.4
Pacific NAFTA 28.7 3.0 2.0 5.2 12.0 0.0 58.6Other America 4.0 3.7 0.0 0.0 0.0 0.0 7.7
Asia-Pacific US 18.3 7.0 1.7 5.7 35.4 0.0 75.6China 25.3 0.0 5.3 0.0 0.0 61.0 79.0Japan 6.9 6.1 28.6 0.0 29.5 40.3 110.8Korea 1.4 14.8 103.8 0.0 0.0 107.4 118.7APEC 23.0 5.1 15.4 7.5 11.2 13.8 69.6
Asia ASEAN 28.4 13.6 63.6 37.9 0.0 33.7 66.5CER 15.2 0.0 20.8 0.0 0.0 0.0 61.9SAFTA 0.0 0.0 8.4 0.0 0.0 0.0 0.0Other Asia 0.5 0.0 0.0 0.0 0.0 0.0 71.0
Pacific NAFTA 26.5 4.5 1.1 3.7 22.8 0.0 69.9Other America 4.5 2.8 0.0 0.0 0.0 0.0 7.8
Asia-Pacific US 28.2 1.9 4.2 9.5 1.3 0.0 46.5China 15.0 0.0 6.1 0.0 0.0 19.1 56.3Japan 1.8 10.5 19.0 0.0 42.2 35.3 99.4Korea 0.7 30.7 3.8 0.0 0.0 22.8 54.6APEC 21.2 4.7 14.7 7.0 10.2 12.7 63.7
Asia ASEAN 49.2 0.8 70.0 41.8 0.0 27.8 67.3CER 22.1 0.0 64.6 0.0 0.0 0.0 74.2SAFTA 0.0 0.0 0.0 0.0 0.0 0.0 0.0Other Asia 12.6 0.0 0.0 0.0 0.0 0.0 53.9
Pacific NAFTA 31.0 1.4 3.0 6.8 0.9 0.0 46.9Other America 2.2 7.4 0.0 0.0 0.0 0.0 7.2
Table S.5 Average annual percentage impacts of selected FTAs in the Asia-Pacific region on trade in food and agriculture (SITC 0 and 1) by region and selected countries, 2001-2005 (percent)
Selected Asia-Pacific FTAs Combined Major FTAs under Consideration
Exports + Imports
Exports
Imports
Source: Percentage changes relative to the average levels of merchandise trade over 2001-2005 in Table S.1.
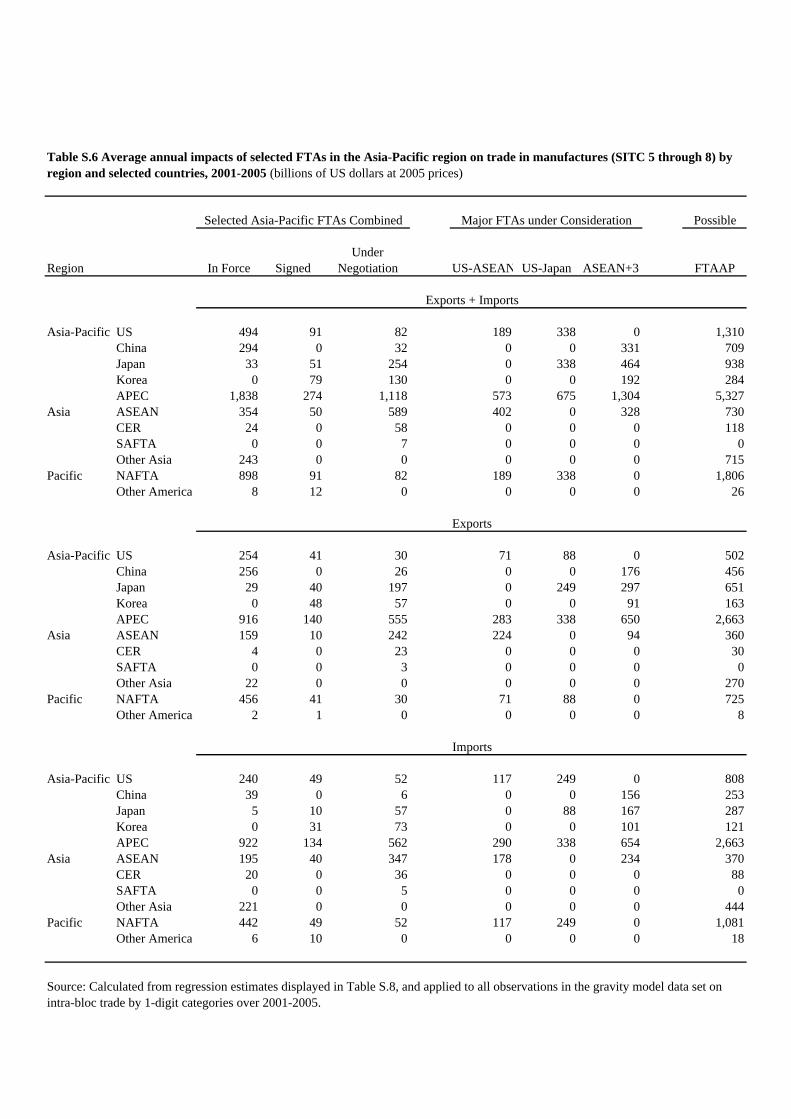
Possible
UnderRegion In Force Signed Negotiation US-ASEAN US-Japan ASEAN+3 FTAAP
Asia-Pacific US 494 91 82 189 338 0 1,310China 294 0 32 0 0 331 709Japan 33 51 254 0 338 464 938Korea 0 79 130 0 0 192 284APEC 1,838 274 1,118 573 675 1,304 5,327
Asia ASEAN 354 50 589 402 0 328 730CER 24 0 58 0 0 0 118SAFTA 0 0 7 0 0 0 0Other Asia 243 0 0 0 0 0 715
Pacific NAFTA 898 91 82 189 338 0 1,806Other America 8 12 0 0 0 0 26
Asia-Pacific US 254 41 30 71 88 0 502China 256 0 26 0 0 176 456Japan 29 40 197 0 249 297 651Korea 0 48 57 0 0 91 163APEC 916 140 555 283 338 650 2,663
Asia ASEAN 159 10 242 224 0 94 360CER 4 0 23 0 0 0 30SAFTA 0 0 3 0 0 0 0Other Asia 22 0 0 0 0 0 270
Pacific NAFTA 456 41 30 71 88 0 725Other America 2 1 0 0 0 0 8
Asia-Pacific US 240 49 52 117 249 0 808China 39 0 6 0 0 156 253Japan 5 10 57 0 88 167 287Korea 0 31 73 0 0 101 121APEC 922 134 562 290 338 654 2,663
Asia ASEAN 195 40 347 178 0 234 370CER 20 0 36 0 0 0 88SAFTA 0 0 5 0 0 0 0Other Asia 221 0 0 0 0 0 444
Pacific NAFTA 442 49 52 117 249 0 1,081Other America 6 10 0 0 0 0 18
Table S.6 Average annual impacts of selected FTAs in the Asia-Pacific region on trade in manufactures (SITC 5 through 8) by region and selected countries, 2001-2005 (billions of US dollars at 2005 prices)
Source: Calculated from regression estimates displayed in Table S.8, and applied to all observations in the gravity model data set on intra-bloc trade by 1-digit categories over 2001-2005.
Selected Asia-Pacific FTAs Combined
Exports + Imports
Exports
Imports
Major FTAs under Consideration
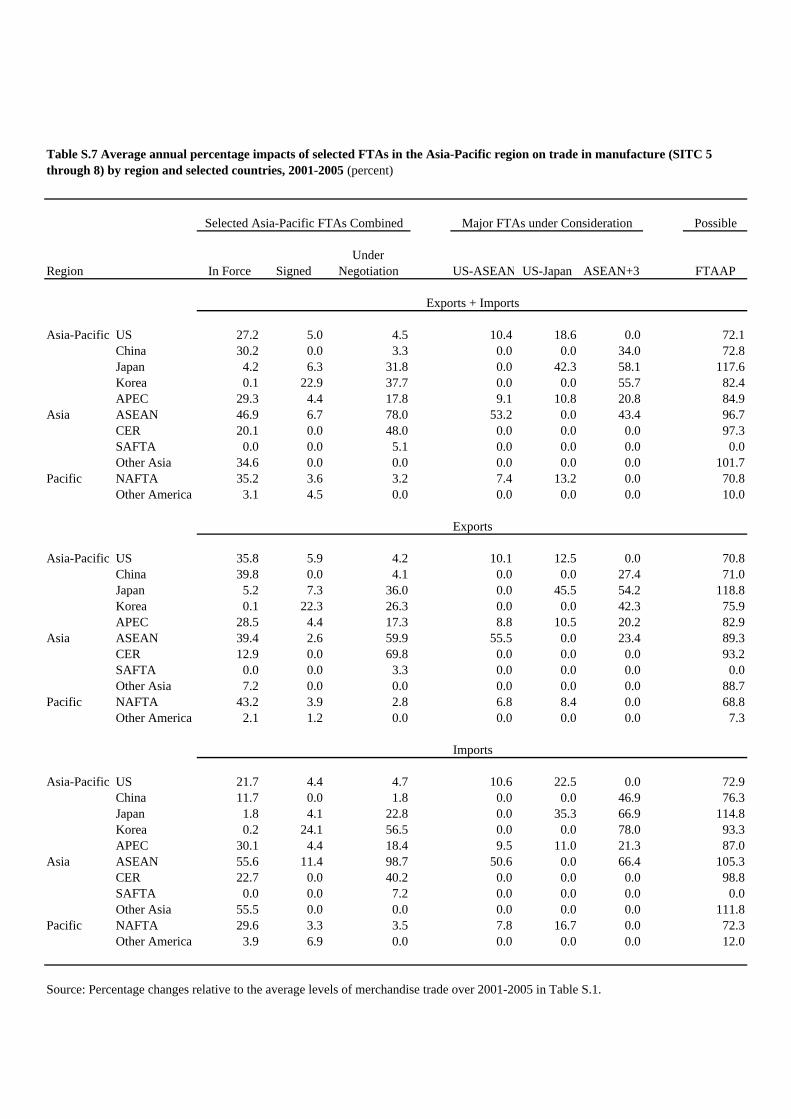
Possible
UnderRegion In Force Signed Negotiation US-ASEAN US-Japan ASEAN+3 FTAAP
Asia-Pacific US 27.2 5.0 4.5 10.4 18.6 0.0 72.1China 30.2 0.0 3.3 0.0 0.0 34.0 72.8Japan 4.2 6.3 31.8 0.0 42.3 58.1 117.6Korea 0.1 22.9 37.7 0.0 0.0 55.7 82.4APEC 29.3 4.4 17.8 9.1 10.8 20.8 84.9
Asia ASEAN 46.9 6.7 78.0 53.2 0.0 43.4 96.7CER 20.1 0.0 48.0 0.0 0.0 0.0 97.3SAFTA 0.0 0.0 5.1 0.0 0.0 0.0 0.0Other Asia 34.6 0.0 0.0 0.0 0.0 0.0 101.7
Pacific NAFTA 35.2 3.6 3.2 7.4 13.2 0.0 70.8Other America 3.1 4.5 0.0 0.0 0.0 0.0 10.0
Asia-Pacific US 35.8 5.9 4.2 10.1 12.5 0.0 70.8China 39.8 0.0 4.1 0.0 0.0 27.4 71.0Japan 5.2 7.3 36.0 0.0 45.5 54.2 118.8Korea 0.1 22.3 26.3 0.0 0.0 42.3 75.9APEC 28.5 4.4 17.3 8.8 10.5 20.2 82.9
Asia ASEAN 39.4 2.6 59.9 55.5 0.0 23.4 89.3CER 12.9 0.0 69.8 0.0 0.0 0.0 93.2SAFTA 0.0 0.0 3.3 0.0 0.0 0.0 0.0Other Asia 7.2 0.0 0.0 0.0 0.0 0.0 88.7
Pacific NAFTA 43.2 3.9 2.8 6.8 8.4 0.0 68.8Other America 2.1 1.2 0.0 0.0 0.0 0.0 7.3
Asia-Pacific US 21.7 4.4 4.7 10.6 22.5 0.0 72.9China 11.7 0.0 1.8 0.0 0.0 46.9 76.3Japan 1.8 4.1 22.8 0.0 35.3 66.9 114.8Korea 0.2 24.1 56.5 0.0 0.0 78.0 93.3APEC 30.1 4.4 18.4 9.5 11.0 21.3 87.0
Asia ASEAN 55.6 11.4 98.7 50.6 0.0 66.4 105.3CER 22.7 0.0 40.2 0.0 0.0 0.0 98.8SAFTA 0.0 0.0 7.2 0.0 0.0 0.0 0.0Other Asia 55.5 0.0 0.0 0.0 0.0 0.0 111.8
Pacific NAFTA 29.6 3.3 3.5 7.8 16.7 0.0 72.3Other America 3.9 6.9 0.0 0.0 0.0 0.0 12.0
Exports + Imports
Exports
Imports
Source: Percentage changes relative to the average levels of merchandise trade over 2001-2005 in Table S.1.
Table S.7 Average annual percentage impacts of selected FTAs in the Asia-Pacific region on trade in manufacture (SITC 5 through 8) by region and selected countries, 2001-2005 (percent)
Selected Asia-Pacific FTAs Combined Major FTAs under Consideration
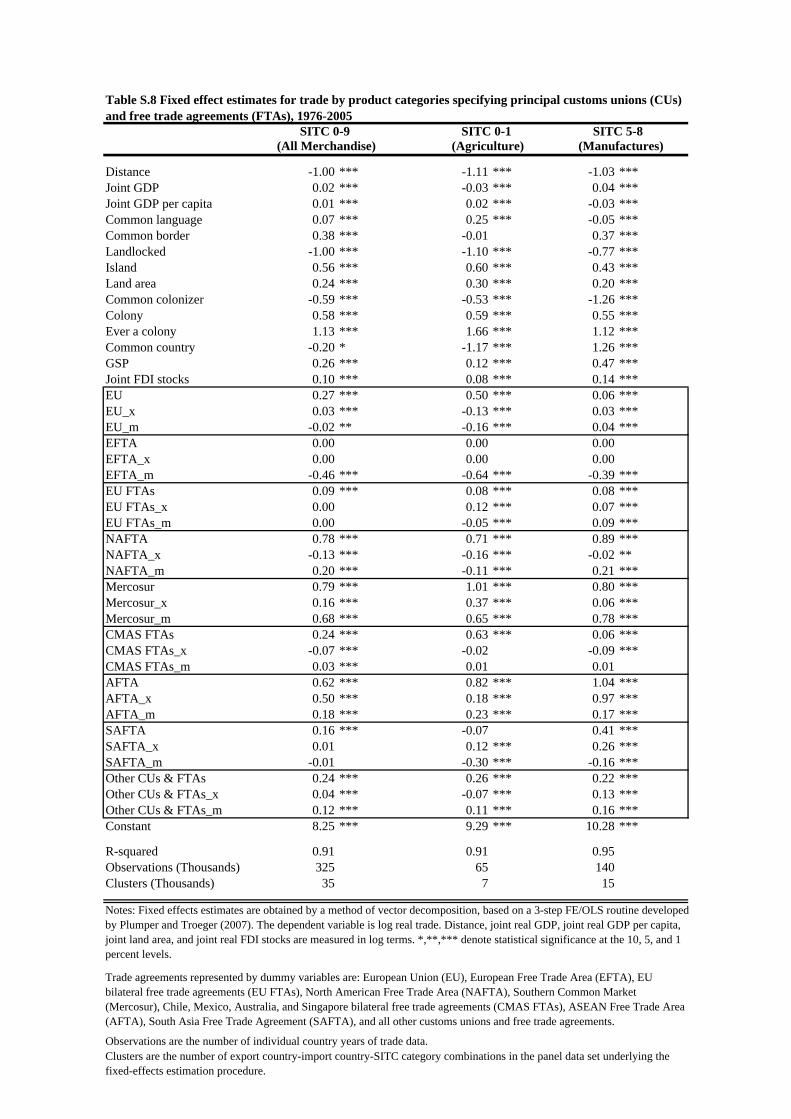
Distance -1.00 *** -1.11 *** -1.03 ***Joint GDP 0.02 *** -0.03 *** 0.04 ***Joint GDP per capita 0.01 *** 0.02 *** -0.03 ***Common language 0.07 *** 0.25 *** -0.05 ***Common border 0.38 *** -0.01 0.37 ***Landlocked -1.00 *** -1.10 *** -0.77 ***Island 0.56 *** 0.60 *** 0.43 ***Land area 0.24 *** 0.30 *** 0.20 ***Common colonizer -0.59 *** -0.53 *** -1.26 ***Colony 0.58 *** 0.59 *** 0.55 ***Ever a colony 1.13 *** 1.66 *** 1.12 ***Common country -0.20 * -1.17 *** 1.26 ***GSP 0.26 *** 0.12 *** 0.47 ***Joint FDI stocks 0.10 *** 0.08 *** 0.14 ***EU 0.27 *** 0.50 *** 0.06 ***EU_x 0.03 *** -0.13 *** 0.03 ***EU_m -0.02 ** -0.16 *** 0.04 ***EFTA 0.00 0.00 0.00 EFTA_x 0.00 0.00 0.00 EFTA_m -0.46 *** -0.64 *** -0.39 ***EU FTAs 0.09 *** 0.08 *** 0.08 ***EU FTAs_x 0.00 0.12 *** 0.07 ***EU FTAs_m 0.00 -0.05 *** 0.09 ***NAFTA 0.78 *** 0.71 *** 0.89 ***NAFTA_x -0.13 *** -0.16 *** -0.02 **NAFTA_m 0.20 *** -0.11 *** 0.21 ***Mercosur 0.79 *** 1.01 *** 0.80 ***Mercosur_x 0.16 *** 0.37 *** 0.06 ***Mercosur_m 0.68 *** 0.65 *** 0.78 ***CMAS FTAs 0.24 *** 0.63 *** 0.06 ***CMAS FTAs_x -0.07 *** -0.02 -0.09 ***CMAS FTAs_m 0.03 *** 0.01 0.01 AFTA 0.62 *** 0.82 *** 1.04 ***AFTA_x 0.50 *** 0.18 *** 0.97 ***AFTA_m 0.18 *** 0.23 *** 0.17 ***SAFTA 0.16 *** -0.07 0.41 ***SAFTA_x 0.01 0.12 *** 0.26 ***SAFTA_m -0.01 -0.30 *** -0.16 ***Other CUs & FTAs 0.24 *** 0.26 *** 0.22 ***Other CUs & FTAs_x 0.04 *** -0.07 *** 0.13 ***Other CUs & FTAs_m 0.12 *** 0.11 *** 0.16 ***Constant 8.25 *** 9.29 *** 10.28 ***
R-squared 0.91 0.91 0.95Observations (Thousands) 325 65 140Clusters (Thousands) 35 7 15
Observations are the number of individual country years of trade data.
Trade agreements represented by dummy variables are: European Union (EU), European Free Trade Area (EFTA), EU bilateral free trade agreements (EU FTAs), North American Free Trade Area (NAFTA), Southern Common Market (Mercosur), Chile, Mexico, Australia, and Singapore bilateral free trade agreements (CMAS FTAs), ASEAN Free Trade Area (AFTA), South Asia Free Trade Agreement (SAFTA), and all other customs unions and free trade agreements.
Clusters are the number of export country-import country-SITC category combinations in the panel data set underlying the fixed-effects estimation procedure.
(All Merchandise) (Agriculture) (Manufactures)
Notes: Fixed effects estimates are obtained by a method of vector decomposition, based on a 3-step FE/OLS routine developed by Plumper and Troeger (2007). The dependent variable is log real trade. Distance, joint real GDP, joint real GDP per capita, joint land area, and joint real FDI stocks are measured in log terms. *,**,*** denote statistical significance at the 10, 5, and 1 percent levels.
Table S.8 Fixed effect estimates for trade by product categories specifying principal customs unions (CUs) and free trade agreements (FTAs), 1976-2005
SITC 0-9 SITC 0-1 SITC 5-8
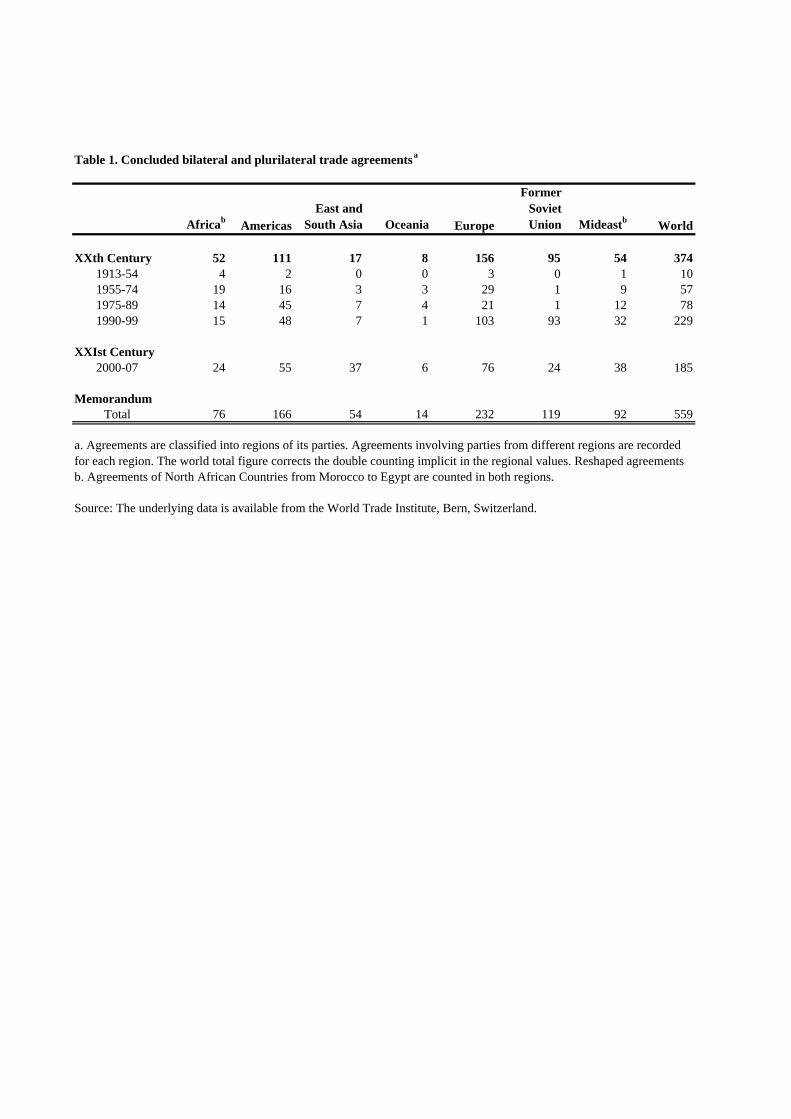
Table 1. Concluded bilateral and plurilateral trade agreementsa
Africab AmericasEast and
South Asia Oceania Europe
Former Soviet Union Mideastb World
XXth Century 52 111 17 8 156 95 54 3741913-54 4 2 0 0 3 0 1 101955-74 19 16 3 3 29 1 9 571975-89 14 45 7 4 21 1 12 781990-99 15 48 7 1 103 93 32 229
XXIst Century2000-07 24 55 37 6 76 24 38 185
MemorandumTotal 76 166 54 14 232 119 92 559
b. Agreements of North African Countries from Morocco to Egypt are counted in both regions.
Source: The underlying data is available from the World Trade Institute, Bern, Switzerland.
a. Agreements are classified into regions of its parties. Agreements involving parties from different regions are recorded for each region. The world total figure corrects the double counting implicit in the regional values. Reshaped agreements
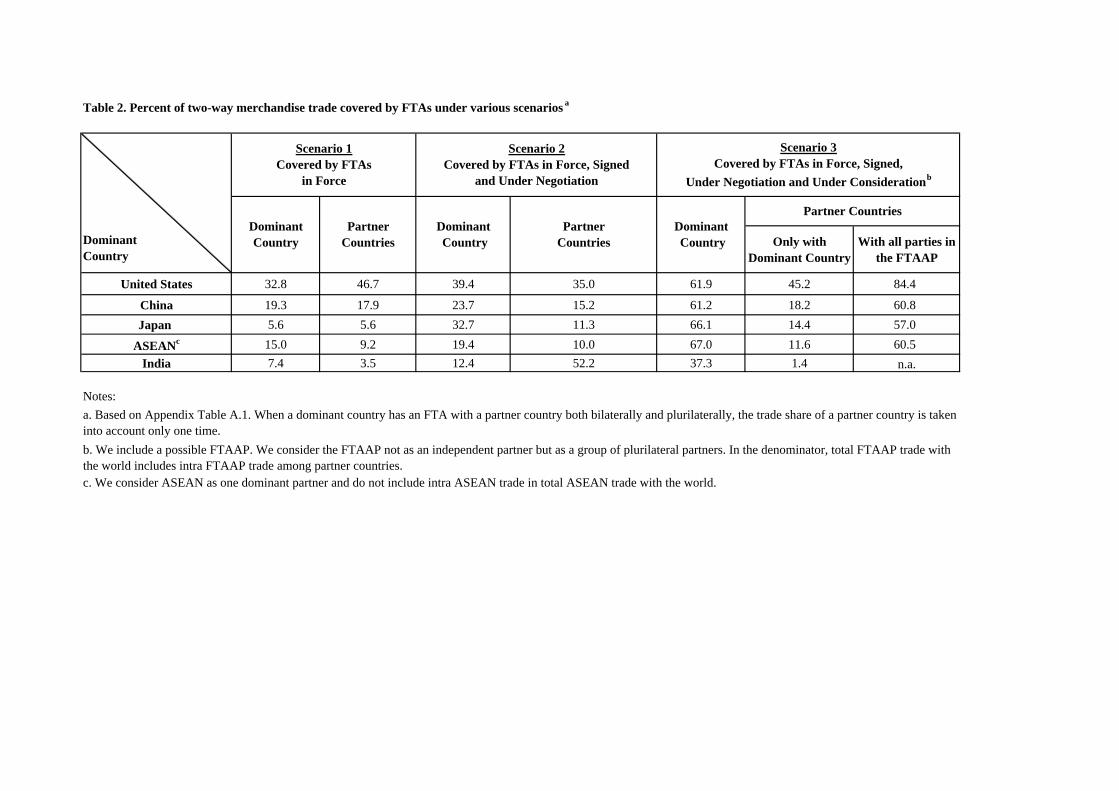
Table 2. Percent of two-way merchandise trade covered by FTAs under various scenarios a
Only with Dominant Country
With all parties in the FTAAP
United States 32.8 46.7 39.4 35.0 61.9 45.2 84.4
China 19.3 17.9 23.7 15.2 61.2 18.2 60.8Japan 5.6 5.6 32.7 11.3 66.1 14.4 57.0
ASEANc 15.0 9.2 19.4 10.0 67.0 11.6 60.5India 7.4 3.5 12.4 52.2 37.3 1.4 n.a.
Notes:
c. We consider ASEAN as one dominant partner and do not include intra ASEAN trade in total ASEAN trade with the world.
b. We include a possible FTAAP. We consider the FTAAP not as an independent partner but as a group of plurilateral partners. In the denominator, total FTAAP trade with the world includes intra FTAAP trade among partner countries.
Scenario 1Covered by FTAs
in Force
Scenario 2Covered by FTAs in Force, Signed
and Under Negotiation
DominantCountry
Partner Countries
Dominant Country
Partner Countries
Dominant Country
a. Based on Appendix Table A.1. When a dominant country has an FTA with a partner country both bilaterally and plurilaterally, the trade share of a partner country is taken into account only one time.
Partner Countries
Scenario 3Covered by FTAs in Force, Signed,
Under Negotiation and Under Considerationb
Dominant Country
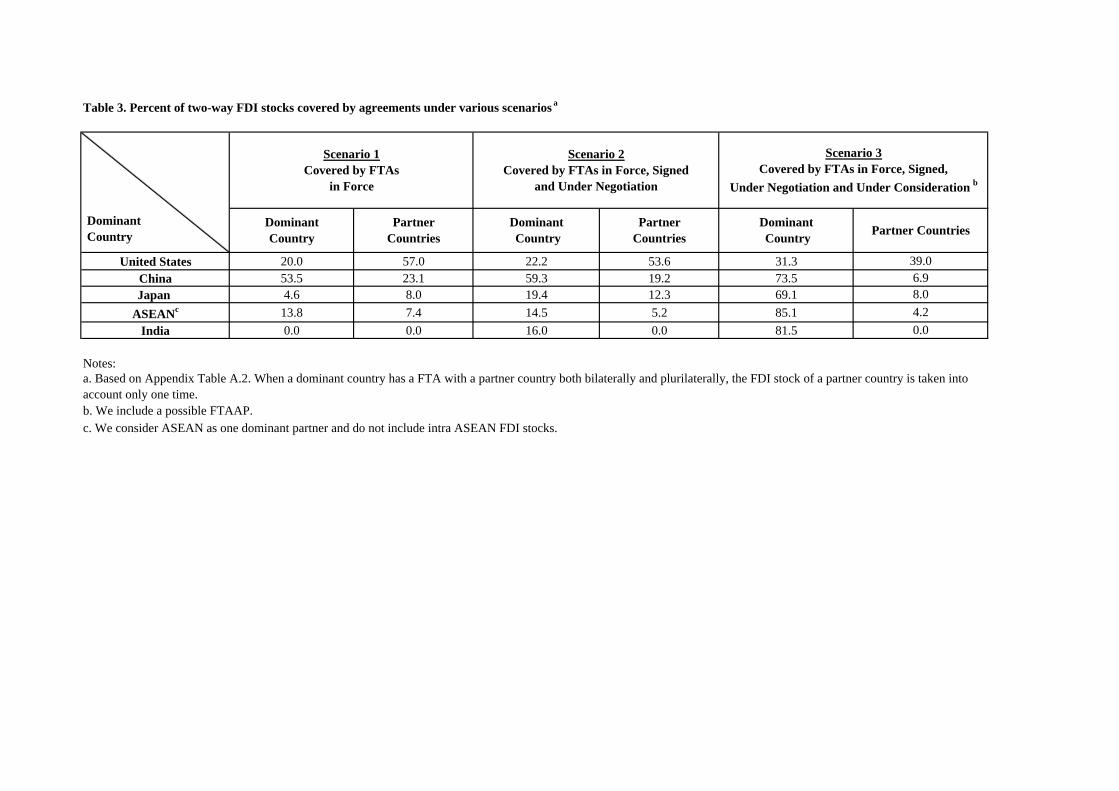
Table 3. Percent of two-way FDI stocks covered by agreements under various scenarios a
United States 20.0 57.0 22.2 53.6 31.3China 53.5 23.1 59.3 19.2 73.5Japan 4.6 8.0 19.4 12.3 69.1
ASEANc 13.8 7.4 14.5 5.2 85.1India 0.0 0.0 16.0 0.0 81.5
Notes:
b. We include a possible FTAAP. c. We consider ASEAN as one dominant partner and do not include intra ASEAN FDI stocks.
Scenario 3Covered by FTAs in Force, Signed,
Under Negotiation and Under Consideration b
DominantCountry
Partner Countries
Dominant Country
Partner Countries
Dominant Country
a. Based on Appendix Table A.2. When a dominant country has a FTA with a partner country both bilaterally and plurilaterally, the FDI stock of a partner country is taken into account only one time.
Partner Countries
39.06.98.04.20.0
Scenario 1Covered by FTAs
in Force
Scenario 2Covered by FTAs in Force, Signed
and Under Negotiation
Dominant Country
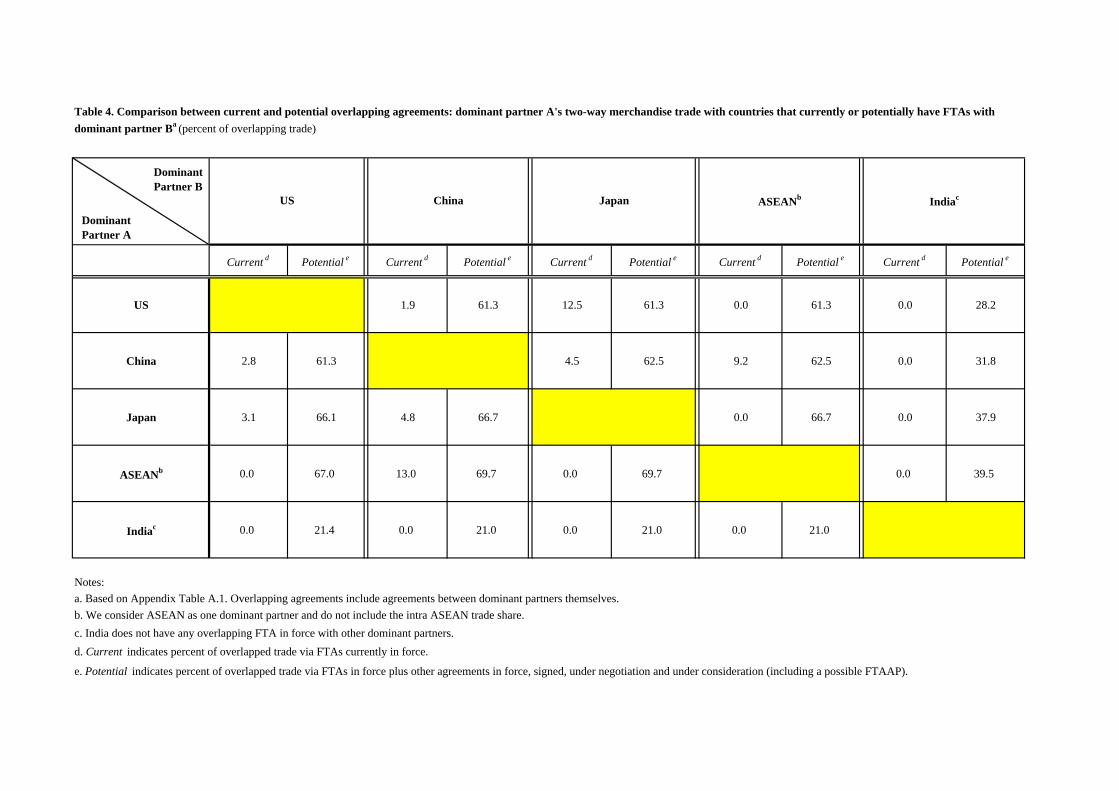
Current d Potential e Current d Potential e Current d Potential e Current d Potential e Current d Potential e
US 1.9 61.3 12.5 61.3 0.0 61.3 0.0 28.2
China 2.8 61.3 4.5 62.5 9.2 62.5 0.0 31.8
Japan 3.1 66.1 4.8 66.7 0.0 66.7 0.0 37.9
ASEANb 0.0 67.0 13.0 69.7 0.0 69.7 0.0 39.5
Indiac 0.0 21.4 0.0 21.0 0.0 21.0 0.0 21.0
Notes:
b. We consider ASEAN as one dominant partner and do not include the intra ASEAN trade share. c. India does not have any overlapping FTA in force with other dominant partners.d. Current indicates percent of overlapped trade via FTAs currently in force.
e. Potential indicates percent of overlapped trade via FTAs in force plus other agreements in force, signed, under negotiation and under consideration (including a possible FTAAP).
ChinaUS Japan ASEANb Indiac
Table 4. Comparison between current and potential overlapping agreements: dominant partner A's two-way merchandise trade with countries that currently or potentially have FTAs with dominant partner Ba (percent of overlapping trade)
a. Based on Appendix Table A.1. Overlapping agreements include agreements between dominant partners themselves.
Dominant Partner A
Dominant Partner B
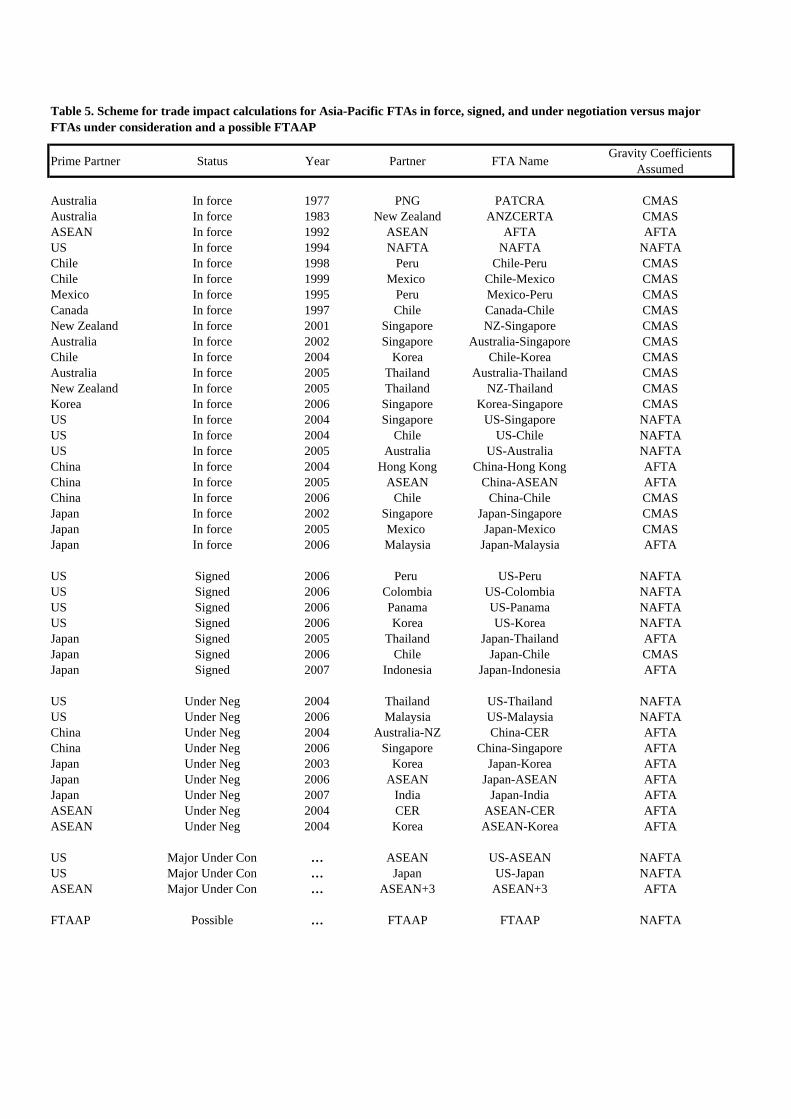
Prime Partner Status Year Partner FTA Name Gravity Coefficients Assumed
Australia In force 1977 PNG PATCRA CMASAustralia In force 1983 New Zealand ANZCERTA CMASASEAN In force 1992 ASEAN AFTA AFTAUS In force 1994 NAFTA NAFTA NAFTAChile In force 1998 Peru Chile-Peru CMASChile In force 1999 Mexico Chile-Mexico CMASMexico In force 1995 Peru Mexico-Peru CMASCanada In force 1997 Chile Canada-Chile CMASNew Zealand In force 2001 Singapore NZ-Singapore CMASAustralia In force 2002 Singapore Australia-Singapore CMASChile In force 2004 Korea Chile-Korea CMASAustralia In force 2005 Thailand Australia-Thailand CMASNew Zealand In force 2005 Thailand NZ-Thailand CMASKorea In force 2006 Singapore Korea-Singapore CMASUS In force 2004 Singapore US-Singapore NAFTAUS In force 2004 Chile US-Chile NAFTAUS In force 2005 Australia US-Australia NAFTAChina In force 2004 Hong Kong China-Hong Kong AFTAChina In force 2005 ASEAN China-ASEAN AFTAChina In force 2006 Chile China-Chile CMASJapan In force 2002 Singapore Japan-Singapore CMASJapan In force 2005 Mexico Japan-Mexico CMASJapan In force 2006 Malaysia Japan-Malaysia AFTA
US Signed 2006 Peru US-Peru NAFTAUS Signed 2006 Colombia US-Colombia NAFTAUS Signed 2006 Panama US-Panama NAFTAUS Signed 2006 Korea US-Korea NAFTAJapan Signed 2005 Thailand Japan-Thailand AFTAJapan Signed 2006 Chile Japan-Chile CMASJapan Signed 2007 Indonesia Japan-Indonesia AFTA
US Under Neg 2004 Thailand US-Thailand NAFTAUS Under Neg 2006 Malaysia US-Malaysia NAFTAChina Under Neg 2004 Australia-NZ China-CER AFTAChina Under Neg 2006 Singapore China-Singapore AFTAJapan Under Neg 2003 Korea Japan-Korea AFTAJapan Under Neg 2006 ASEAN Japan-ASEAN AFTAJapan Under Neg 2007 India Japan-India AFTAASEAN Under Neg 2004 CER ASEAN-CER AFTAASEAN Under Neg 2004 Korea ASEAN-Korea AFTA
US Major Under Con … ASEAN US-ASEAN NAFTAUS Major Under Con … Japan US-Japan NAFTAASEAN Major Under Con … ASEAN+3 ASEAN+3 AFTA
FTAAP Possible … FTAAP FTAAP NAFTA
Table 5. Scheme for trade impact calculations for Asia-Pacific FTAs in force, signed, and under negotiation versus major FTAs under consideration and a possible FTAAP
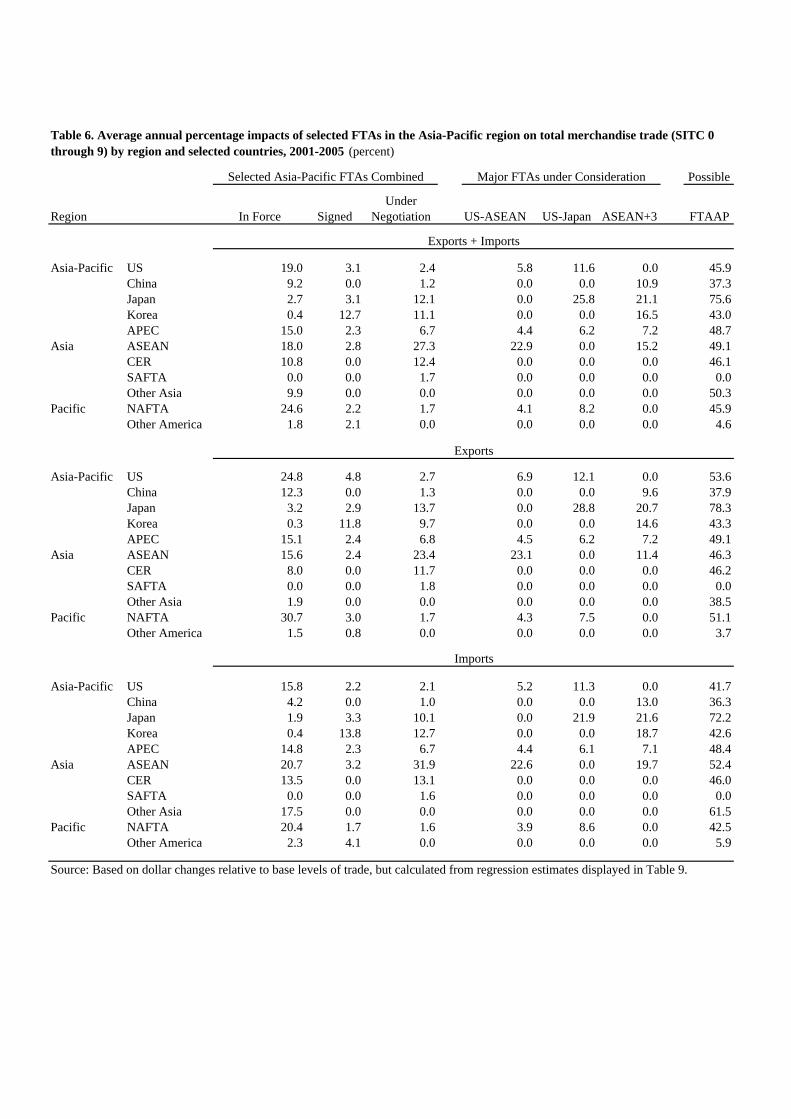
Possible
UnderRegion In Force Signed Negotiation US-ASEAN US-Japan ASEAN+3 FTAAP
Asia-Pacific US 19.0 3.1 2.4 5.8 11.6 0.0 45.9China 9.2 0.0 1.2 0.0 0.0 10.9 37.3Japan 2.7 3.1 12.1 0.0 25.8 21.1 75.6Korea 0.4 12.7 11.1 0.0 0.0 16.5 43.0APEC 15.0 2.3 6.7 4.4 6.2 7.2 48.7
Asia ASEAN 18.0 2.8 27.3 22.9 0.0 15.2 49.1CER 10.8 0.0 12.4 0.0 0.0 0.0 46.1SAFTA 0.0 0.0 1.7 0.0 0.0 0.0 0.0Other Asia 9.9 0.0 0.0 0.0 0.0 0.0 50.3
Pacific NAFTA 24.6 2.2 1.7 4.1 8.2 0.0 45.9Other America 1.8 2.1 0.0 0.0 0.0 0.0 4.6
Asia-Pacific US 24.8 4.8 2.7 6.9 12.1 0.0 53.6China 12.3 0.0 1.3 0.0 0.0 9.6 37.9Japan 3.2 2.9 13.7 0.0 28.8 20.7 78.3Korea 0.3 11.8 9.7 0.0 0.0 14.6 43.3APEC 15.1 2.4 6.8 4.5 6.2 7.2 49.1
Asia ASEAN 15.6 2.4 23.4 23.1 0.0 11.4 46.3CER 8.0 0.0 11.7 0.0 0.0 0.0 46.2SAFTA 0.0 0.0 1.8 0.0 0.0 0.0 0.0Other Asia 1.9 0.0 0.0 0.0 0.0 0.0 38.5
Pacific NAFTA 30.7 3.0 1.7 4.3 7.5 0.0 51.1Other America 1.5 0.8 0.0 0.0 0.0 0.0 3.7
Asia-Pacific US 15.8 2.2 2.1 5.2 11.3 0.0 41.7China 4.2 0.0 1.0 0.0 0.0 13.0 36.3Japan 1.9 3.3 10.1 0.0 21.9 21.6 72.2Korea 0.4 13.8 12.7 0.0 0.0 18.7 42.6APEC 14.8 2.3 6.7 4.4 6.1 7.1 48.4
Asia ASEAN 20.7 3.2 31.9 22.6 0.0 19.7 52.4CER 13.5 0.0 13.1 0.0 0.0 0.0 46.0SAFTA 0.0 0.0 1.6 0.0 0.0 0.0 0.0Other Asia 17.5 0.0 0.0 0.0 0.0 0.0 61.5
Pacific NAFTA 20.4 1.7 1.6 3.9 8.6 0.0 42.5Other America 2.3 4.1 0.0 0.0 0.0 0.0 5.9
Selected Asia-Pacific FTAs Combined
Table 6. Average annual percentage impacts of selected FTAs in the Asia-Pacific region on total merchandise trade (SITC 0 through 9) by region and selected countries, 2001-2005 (percent)
Major FTAs under Consideration
Exports + Imports
Exports
Imports
Source: Based on dollar changes relative to base levels of trade, but calculated from regression estimates displayed in Table 9.
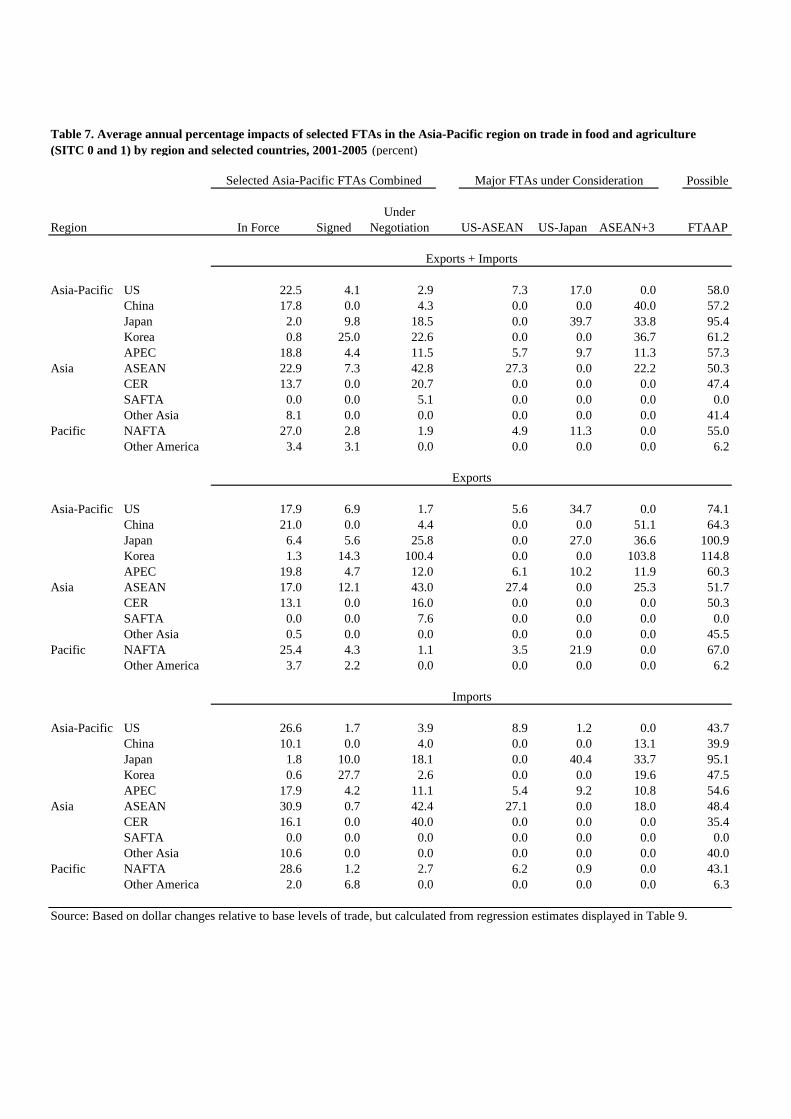
Possible
UnderRegion In Force Signed Negotiation US-ASEAN US-Japan ASEAN+3 FTAAP
Asia-Pacific US 22.5 4.1 2.9 7.3 17.0 0.0 58.0China 17.8 0.0 4.3 0.0 0.0 40.0 57.2Japan 2.0 9.8 18.5 0.0 39.7 33.8 95.4Korea 0.8 25.0 22.6 0.0 0.0 36.7 61.2APEC 18.8 4.4 11.5 5.7 9.7 11.3 57.3
Asia ASEAN 22.9 7.3 42.8 27.3 0.0 22.2 50.3CER 13.7 0.0 20.7 0.0 0.0 0.0 47.4SAFTA 0.0 0.0 5.1 0.0 0.0 0.0 0.0Other Asia 8.1 0.0 0.0 0.0 0.0 0.0 41.4
Pacific NAFTA 27.0 2.8 1.9 4.9 11.3 0.0 55.0Other America 3.4 3.1 0.0 0.0 0.0 0.0 6.2
Asia-Pacific US 17.9 6.9 1.7 5.6 34.7 0.0 74.1China 21.0 0.0 4.4 0.0 0.0 51.1 64.3Japan 6.4 5.6 25.8 0.0 27.0 36.6 100.9Korea 1.3 14.3 100.4 0.0 0.0 103.8 114.8APEC 19.8 4.7 12.0 6.1 10.2 11.9 60.3
Asia ASEAN 17.0 12.1 43.0 27.4 0.0 25.3 51.7CER 13.1 0.0 16.0 0.0 0.0 0.0 50.3SAFTA 0.0 0.0 7.6 0.0 0.0 0.0 0.0Other Asia 0.5 0.0 0.0 0.0 0.0 0.0 45.5
Pacific NAFTA 25.4 4.3 1.1 3.5 21.9 0.0 67.0Other America 3.7 2.2 0.0 0.0 0.0 0.0 6.2
Asia-Pacific US 26.6 1.7 3.9 8.9 1.2 0.0 43.7China 10.1 0.0 4.0 0.0 0.0 13.1 39.9Japan 1.8 10.0 18.1 0.0 40.4 33.7 95.1Korea 0.6 27.7 2.6 0.0 0.0 19.6 47.5APEC 17.9 4.2 11.1 5.4 9.2 10.8 54.6
Asia ASEAN 30.9 0.7 42.4 27.1 0.0 18.0 48.4CER 16.1 0.0 40.0 0.0 0.0 0.0 35.4SAFTA 0.0 0.0 0.0 0.0 0.0 0.0 0.0Other Asia 10.6 0.0 0.0 0.0 0.0 0.0 40.0
Pacific NAFTA 28.6 1.2 2.7 6.2 0.9 0.0 43.1Other America 2.0 6.8 0.0 0.0 0.0 0.0 6.3
Table 7. Average annual percentage impacts of selected FTAs in the Asia-Pacific region on trade in food and agriculture (SITC 0 and 1) by region and selected countries, 2001-2005 (percent)
Selected Asia-Pacific FTAs Combined Major FTAs under Consideration
Exports + Imports
Exports
Imports
Source: Based on dollar changes relative to base levels of trade, but calculated from regression estimates displayed in Table 9.
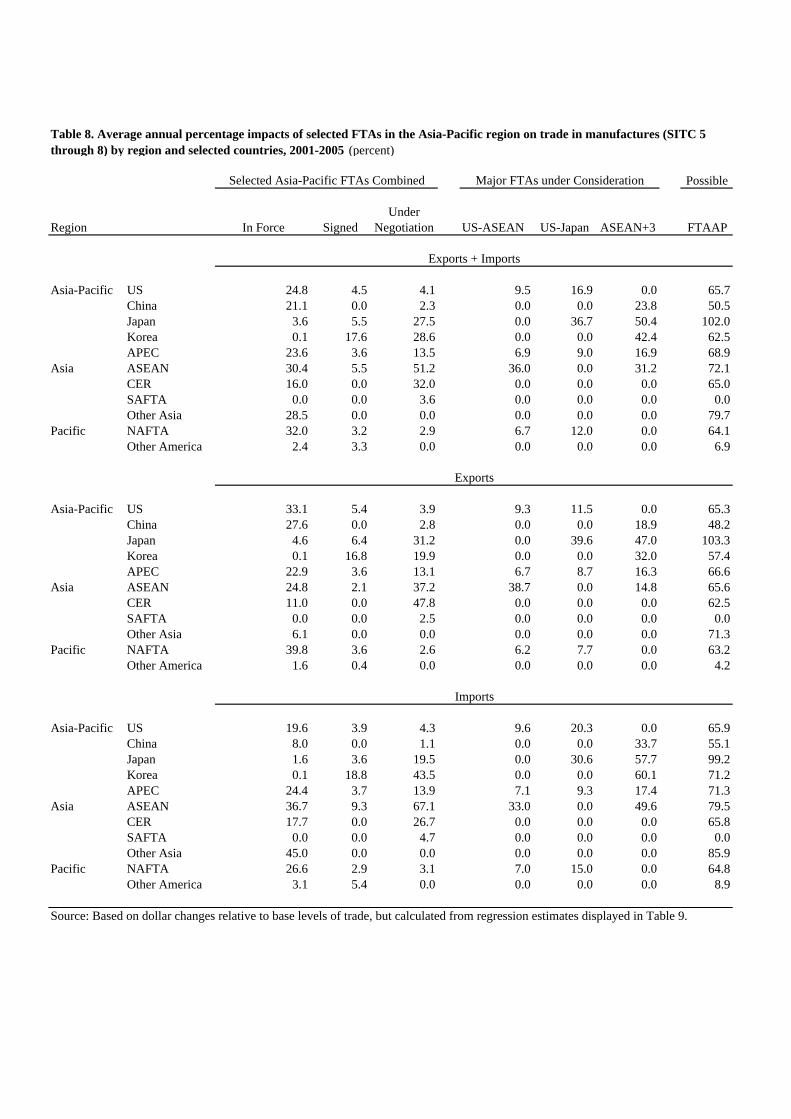
Possible
UnderRegion In Force Signed Negotiation US-ASEAN US-Japan ASEAN+3 FTAAP
Asia-Pacific US 24.8 4.5 4.1 9.5 16.9 0.0 65.7China 21.1 0.0 2.3 0.0 0.0 23.8 50.5Japan 3.6 5.5 27.5 0.0 36.7 50.4 102.0Korea 0.1 17.6 28.6 0.0 0.0 42.4 62.5APEC 23.6 3.6 13.5 6.9 9.0 16.9 68.9
Asia ASEAN 30.4 5.5 51.2 36.0 0.0 31.2 72.1CER 16.0 0.0 32.0 0.0 0.0 0.0 65.0SAFTA 0.0 0.0 3.6 0.0 0.0 0.0 0.0Other Asia 28.5 0.0 0.0 0.0 0.0 0.0 79.7
Pacific NAFTA 32.0 3.2 2.9 6.7 12.0 0.0 64.1Other America 2.4 3.3 0.0 0.0 0.0 0.0 6.9
Asia-Pacific US 33.1 5.4 3.9 9.3 11.5 0.0 65.3China 27.6 0.0 2.8 0.0 0.0 18.9 48.2Japan 4.6 6.4 31.2 0.0 39.6 47.0 103.3Korea 0.1 16.8 19.9 0.0 0.0 32.0 57.4APEC 22.9 3.6 13.1 6.7 8.7 16.3 66.6
Asia ASEAN 24.8 2.1 37.2 38.7 0.0 14.8 65.6CER 11.0 0.0 47.8 0.0 0.0 0.0 62.5SAFTA 0.0 0.0 2.5 0.0 0.0 0.0 0.0Other Asia 6.1 0.0 0.0 0.0 0.0 0.0 71.3
Pacific NAFTA 39.8 3.6 2.6 6.2 7.7 0.0 63.2Other America 1.6 0.4 0.0 0.0 0.0 0.0 4.2
Asia-Pacific US 19.6 3.9 4.3 9.6 20.3 0.0 65.9China 8.0 0.0 1.1 0.0 0.0 33.7 55.1Japan 1.6 3.6 19.5 0.0 30.6 57.7 99.2Korea 0.1 18.8 43.5 0.0 0.0 60.1 71.2APEC 24.4 3.7 13.9 7.1 9.3 17.4 71.3
Asia ASEAN 36.7 9.3 67.1 33.0 0.0 49.6 79.5CER 17.7 0.0 26.7 0.0 0.0 0.0 65.8SAFTA 0.0 0.0 4.7 0.0 0.0 0.0 0.0Other Asia 45.0 0.0 0.0 0.0 0.0 0.0 85.9
Pacific NAFTA 26.6 2.9 3.1 7.0 15.0 0.0 64.8Other America 3.1 5.4 0.0 0.0 0.0 0.0 8.9
Table 8. Average annual percentage impacts of selected FTAs in the Asia-Pacific region on trade in manufactures (SITC 5 through 8) by region and selected countries, 2001-2005 (percent)
Selected Asia-Pacific FTAs Combined Major FTAs under Consideration
Exports + Imports
Exports
Imports
Source: Based on dollar changes relative to base levels of trade, but calculated from regression estimates displayed in Table 9.
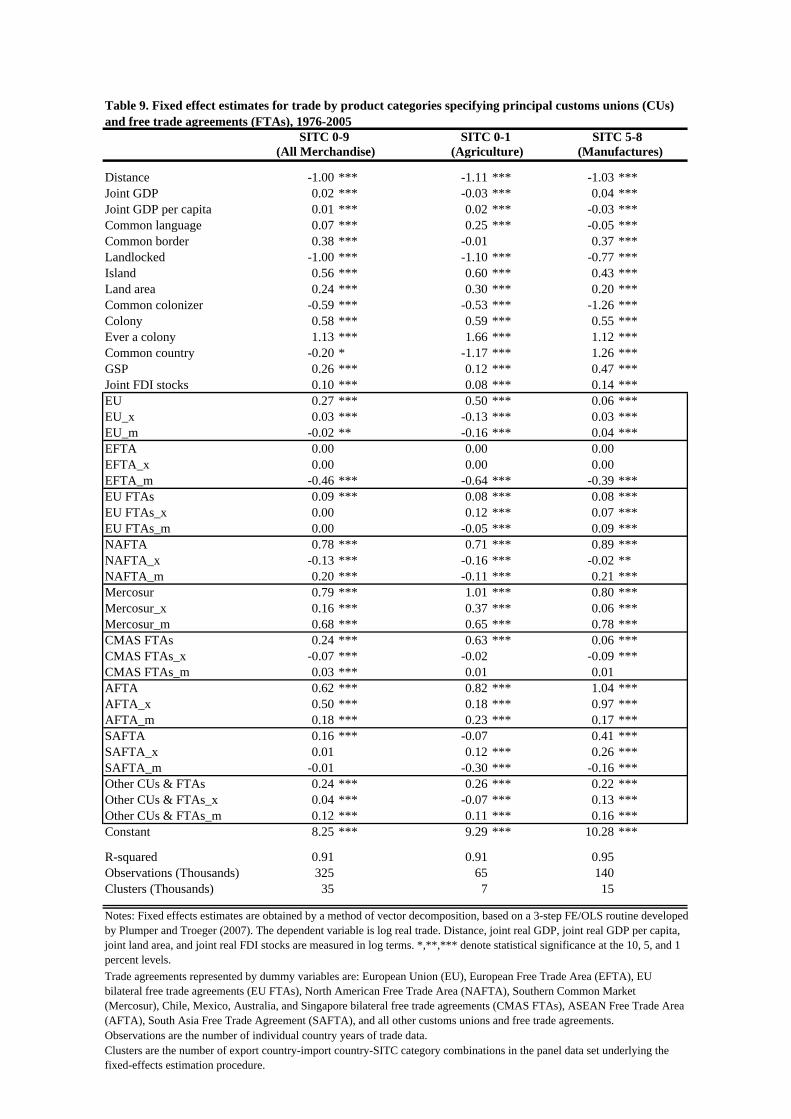
Distance -1.00 *** -1.11 *** -1.03 ***Joint GDP 0.02 *** -0.03 *** 0.04 ***Joint GDP per capita 0.01 *** 0.02 *** -0.03 ***Common language 0.07 *** 0.25 *** -0.05 ***Common border 0.38 *** -0.01 0.37 ***Landlocked -1.00 *** -1.10 *** -0.77 ***Island 0.56 *** 0.60 *** 0.43 ***Land area 0.24 *** 0.30 *** 0.20 ***Common colonizer -0.59 *** -0.53 *** -1.26 ***Colony 0.58 *** 0.59 *** 0.55 ***Ever a colony 1.13 *** 1.66 *** 1.12 ***Common country -0.20 * -1.17 *** 1.26 ***GSP 0.26 *** 0.12 *** 0.47 ***Joint FDI stocks 0.10 *** 0.08 *** 0.14 ***EU 0.27 *** 0.50 *** 0.06 ***EU_x 0.03 *** -0.13 *** 0.03 ***EU_m -0.02 ** -0.16 *** 0.04 ***EFTA 0.00 0.00 0.00 EFTA_x 0.00 0.00 0.00 EFTA_m -0.46 *** -0.64 *** -0.39 ***EU FTAs 0.09 *** 0.08 *** 0.08 ***EU FTAs_x 0.00 0.12 *** 0.07 ***EU FTAs_m 0.00 -0.05 *** 0.09 ***NAFTA 0.78 *** 0.71 *** 0.89 ***NAFTA_x -0.13 *** -0.16 *** -0.02 **NAFTA_m 0.20 *** -0.11 *** 0.21 ***Mercosur 0.79 *** 1.01 *** 0.80 ***Mercosur_x 0.16 *** 0.37 *** 0.06 ***Mercosur_m 0.68 *** 0.65 *** 0.78 ***CMAS FTAs 0.24 *** 0.63 *** 0.06 ***CMAS FTAs_x -0.07 *** -0.02 -0.09 ***CMAS FTAs_m 0.03 *** 0.01 0.01 AFTA 0.62 *** 0.82 *** 1.04 ***AFTA_x 0.50 *** 0.18 *** 0.97 ***AFTA_m 0.18 *** 0.23 *** 0.17 ***SAFTA 0.16 *** -0.07 0.41 ***SAFTA_x 0.01 0.12 *** 0.26 ***SAFTA_m -0.01 -0.30 *** -0.16 ***Other CUs & FTAs 0.24 *** 0.26 *** 0.22 ***Other CUs & FTAs_x 0.04 *** -0.07 *** 0.13 ***Other CUs & FTAs_m 0.12 *** 0.11 *** 0.16 ***Constant 8.25 *** 9.29 *** 10.28 ***
R-squared 0.91 0.91 0.95Observations (Thousands) 325 65 140Clusters (Thousands) 35 7 15
Observations are the number of individual country years of trade data.
Table 9. Fixed effect estimates for trade by product categories specifying principal customs unions (CUs) and free trade agreements (FTAs), 1976-2005
Clusters are the number of export country-import country-SITC category combinations in the panel data set underlying the fixed-effects estimation procedure.
SITC 0-9 SITC 0-1
Notes: Fixed effects estimates are obtained by a method of vector decomposition, based on a 3-step FE/OLS routine developed by Plumper and Troeger (2007). The dependent variable is log real trade. Distance, joint real GDP, joint real GDP per capita, joint land area, and joint real FDI stocks are measured in log terms. *,**,*** denote statistical significance at the 10, 5, and 1 percent levels.Trade agreements represented by dummy variables are: European Union (EU), European Free Trade Area (EFTA), EU bilateral free trade agreements (EU FTAs), North American Free Trade Area (NAFTA), Southern Common Market (Mercosur), Chile, Mexico, Australia, and Singapore bilateral free trade agreements (CMAS FTAs), ASEAN Free Trade Area (AFTA), South Asia Free Trade Agreement (SAFTA), and all other customs unions and free trade agreements.
SITC 5-8 (All Merchandise) (Agriculture) (Manufactures)
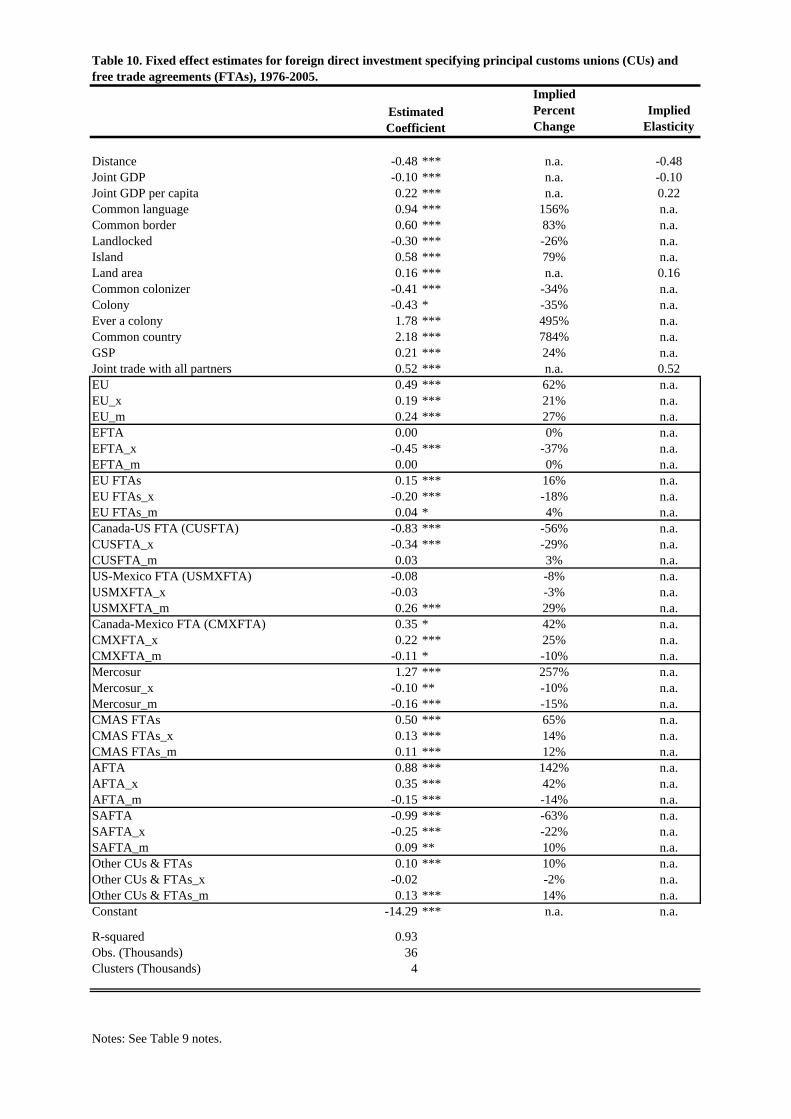
Implied Percent Change
Implied Elasticity
Distance -0.48 *** n.a. -0.48Joint GDP -0.10 *** n.a. -0.10Joint GDP per capita 0.22 *** n.a. 0.22Common language 0.94 *** 156% n.a.Common border 0.60 *** 83% n.a.Landlocked -0.30 *** -26% n.a.Island 0.58 *** 79% n.a.Land area 0.16 *** n.a. 0.16Common colonizer -0.41 *** -34% n.a.Colony -0.43 * -35% n.a.Ever a colony 1.78 *** 495% n.a.Common country 2.18 *** 784% n.a.GSP 0.21 *** 24% n.a.Joint trade with all partners 0.52 *** n.a. 0.52EU 0.49 *** 62% n.a.EU_x 0.19 *** 21% n.a.EU_m 0.24 *** 27% n.a.EFTA 0.00 0% n.a.EFTA_x -0.45 *** -37% n.a.EFTA_m 0.00 0% n.a.EU FTAs 0.15 *** 16% n.a.EU FTAs_x -0.20 *** -18% n.a.EU FTAs_m 0.04 * 4% n.a.Canada-US FTA (CUSFTA) -0.83 *** -56% n.a.CUSFTA_x -0.34 *** -29% n.a.CUSFTA_m 0.03 3% n.a.US-Mexico FTA (USMXFTA) -0.08 -8% n.a.USMXFTA_x -0.03 -3% n.a.USMXFTA_m 0.26 *** 29% n.a.Canada-Mexico FTA (CMXFTA) 0.35 * 42% n.a.CMXFTA_x 0.22 *** 25% n.a.CMXFTA_m -0.11 * -10% n.a.Mercosur 1.27 *** 257% n.a.Mercosur_x -0.10 ** -10% n.a.Mercosur_m -0.16 *** -15% n.a.CMAS FTAs 0.50 *** 65% n.a.CMAS FTAs_x 0.13 *** 14% n.a.CMAS FTAs_m 0.11 *** 12% n.a.AFTA 0.88 *** 142% n.a.AFTA_x 0.35 *** 42% n.a.AFTA_m -0.15 *** -14% n.a.SAFTA -0.99 *** -63% n.a.SAFTA_x -0.25 *** -22% n.a.SAFTA_m 0.09 ** 10% n.a.Other CUs & FTAs 0.10 *** 10% n.a.Other CUs & FTAs_x -0.02 -2% n.a.Other CUs & FTAs_m 0.13 *** 14% n.a.Constant -14.29 *** n.a. n.a.
R-squared 0.93Obs. (Thousands) 36Clusters (Thousands) 4
Notes: See Table 9 notes.
Table 10. Fixed effect estimates for foreign direct investment specifying principal customs unions (CUs) and free trade agreements (FTAs), 1976-2005.
Estimated Coefficient
The implied elasticity values apply to the non-dummy variables since both the dependent variable (FDI stocks) and the independent variables are expressed in logarithmic terms. The elasticity value can be interpreted as the percentage impact on inward FDI stocks from a 1.00 percent increase in a given independent variable.
The dependent variable is the inward stock of FDI in the subject country from its bilateral partner when estimating the primary coefficients (e.g. EU, EFTA, etc.) and the inward FDI diversion coefficients (e.g. (EU_m, EFTA_m, etc.). The dependent variable is the outward stock of FDI from the subject country to a partner country that is not a member of the CU or FTA in question when estimating the outward FDI diversion coefficients (e.g. EU_x EFTA_x, etc.).
In the case of CUSFTA and NAFTA members, the "entry dates" of the respective trade agreements are advanced by two years, on the argument that new flows of FDI anticipated the signing of the respective agreements.
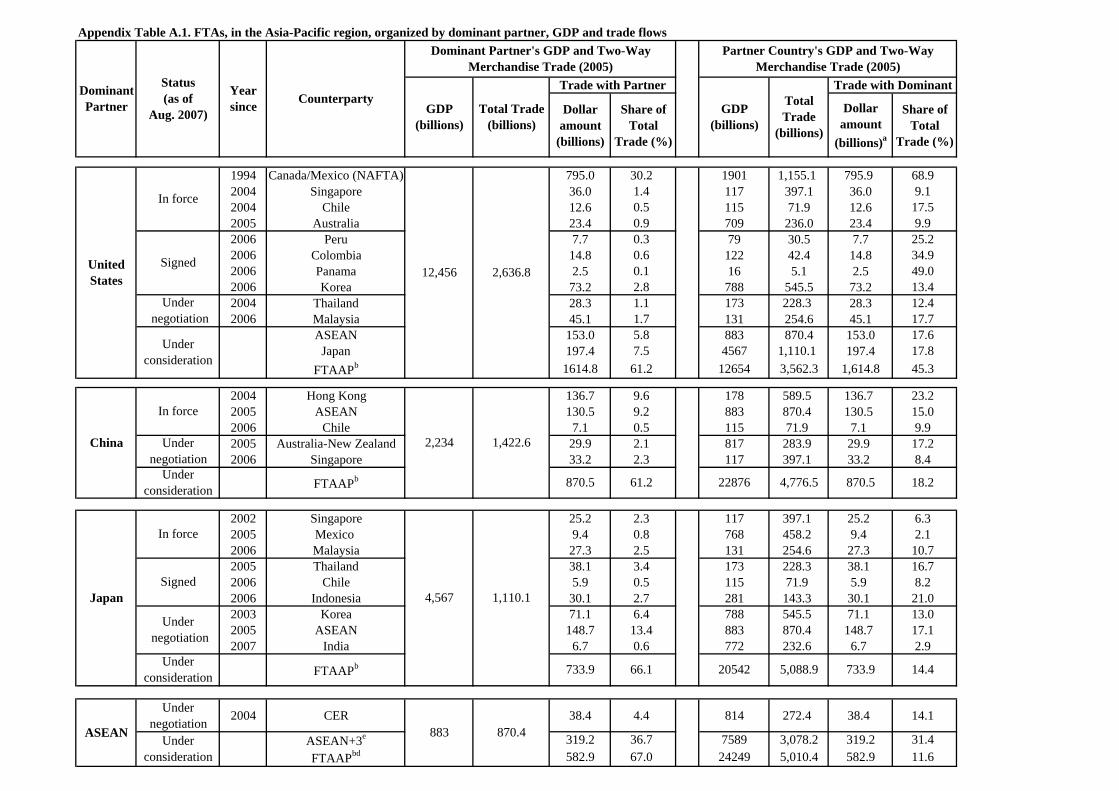
Dollar amount
(billions)
Share of Total
Trade (%)
Dollar amount
(billions)a
Share of Total
Trade (%)
1994 Canada/Mexico (NAFTA) 795.0 30.2 1901 1,155.1 795.9 68.92004 Singapore 36.0 1.4 117 397.1 36.0 9.12004 Chile 12.6 0.5 115 71.9 12.6 17.52005 Australia 23.4 0.9 709 236.0 23.4 9.92006 Peru 7.7 0.3 79 30.5 7.7 25.22006 Colombia 14.8 0.6 122 42.4 14.8 34.92006 Panama 2.5 0.1 16 5.1 2.5 49.02006 Korea 73.2 2.8 788 545.5 73.2 13.42004 Thailand 28.3 1.1 173 228.3 28.3 12.42006 Malaysia 45.1 1.7 131 254.6 45.1 17.7
ASEAN 153.0 5.8 883 870.4 153.0 17.6Japan 197.4 7.5 4567 1,110.1 197.4 17.8
FTAAPb 1614.8 61.2 12654 3,562.3 1,614.8 45.3
2004 Hong Kong 136.7 9.6 178 589.5 136.7 23.22005 ASEAN 130.5 9.2 883 870.4 130.5 15.02006 Chile 7.1 0.5 115 71.9 7.1 9.92005 Australia-New Zealand 29.9 2.1 817 283.9 29.9 17.22006 Singapore 33.2 2.3 117 397.1 33.2 8.4
2002 Singapore 25.2 2.3 117 397.1 25.2 6.32005 Mexico 9.4 0.8 768 458.2 9.4 2.12006 Malaysia 27.3 2.5 131 254.6 27.3 10.72005 Thailand 38.1 3.4 173 228.3 38.1 16.72006 Chile 5.9 0.5 115 71.9 5.9 8.22006 Indonesia 30.1 2.7 281 143.3 30.1 21.02003 Korea 71.1 6.4 788 545.5 71.1 13.02005 ASEAN 148.7 13.4 883 870.4 148.7 17.12007 India 6.7 0.6 772 232.6 6.7 2.9
Under negotiation 2004 CER 38.4 4.4 814 272.4 38.4 14.1
ASEAN+3e 319.2 36.7 7589 3,078.2 319.2 31.4FTAAPbd 582.9 67.0 24249 5,010.4 582.9 11.6
Appendix Table A.1. FTAs, in the Asia-Pacific region, organized by dominant partner, GDP and trade flows
Japan
5,088.9 733.9 14.4
4,567 1,110.1
870.5 18.2
China
Under consideration FTAAPb 733.9 66.1 20542
870.5 61.2 22876 4,776.5
Signed
FTAAPb
In force
Under negotiation
2,234 1,422.6
883 870.4Under consideration
ASEAN
Under consideration
In force
Signed
Under negotiation
12,456 2,636.8
Under negotiation
Under consideration
Status(as of
Aug. 2007)
Year since Counterparty
United States
In force
Dominant Partner's GDP and Two-Way Merchandise Trade (2005)
Partner Country's GDP and Two-Way Merchandise Trade (2005)
GDP (billions)
Total Trade (billions)
Trade with Partner
GDP (billions)
Total Trade
(billions)
Trade with Dominant Dominant Partner
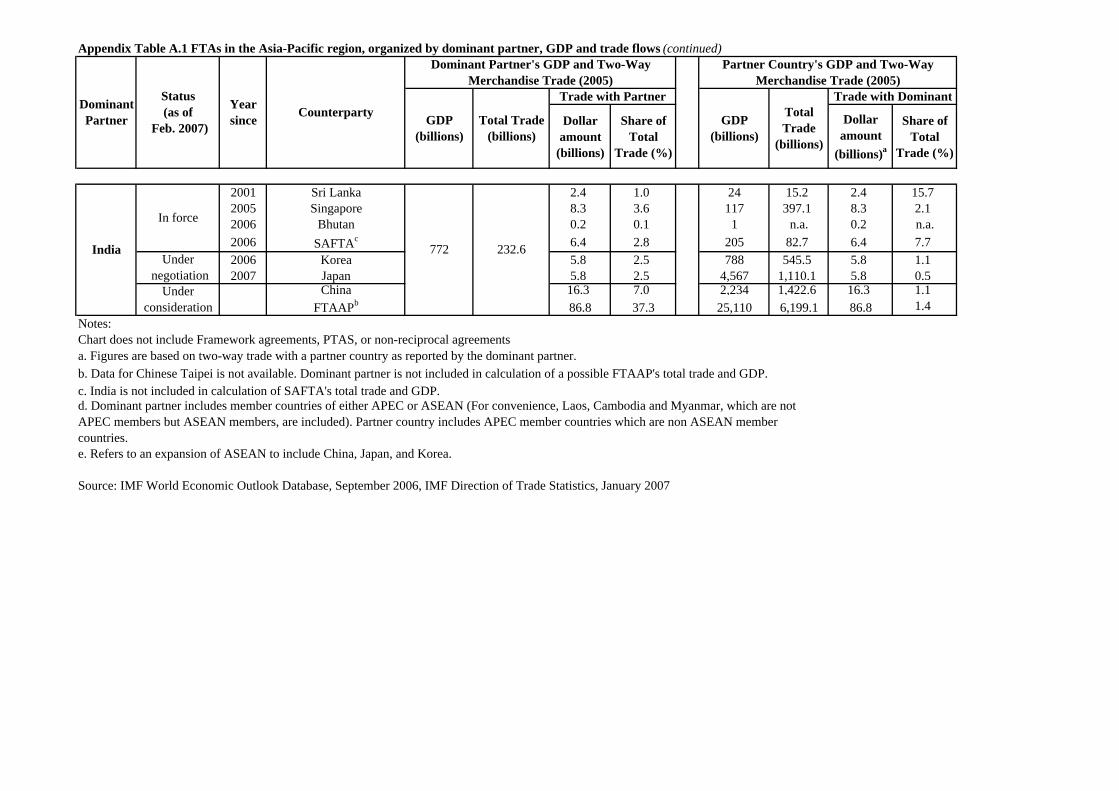
Dollar amount
(billions)
Share of Total
Trade (%)
Dollar amount
(billions)a
Share of Total
Trade (%)
2001 Sri Lanka 2.4 1.0 24 15.2 2.4 15.72005 Singapore 8.3 3.6 117 397.1 8.3 2.12006 Bhutan 0.2 0.1 1 n.a. 0.2 n.a.2006 SAFTAc 6.4 2.8 205 82.7 6.4 7.72006 Korea 5.8 2.5 788 545.5 5.8 1.12007 Japan 5.8 2.5 4,567 1,110.1 5.8 0.5
China 16.3 7.0 2,234 1,422.6 16.3 1.1FTAAPb 86.8 37.3 25,110 6,199.1 86.8 1.4
Notes: Chart does not include Framework agreements, PTAS, or non-reciprocal agreements
c. India is not included in calculation of SAFTA's total trade and GDP.
e. Refers to an expansion of ASEAN to include China, Japan, and Korea.
Source: IMF World Economic Outlook Database, September 2006, IMF Direction of Trade Statistics, January 2007
a. Figures are based on two-way trade with a partner country as reported by the dominant partner. b. Data for Chinese Taipei is not available. Dominant partner is not included in calculation of a possible FTAAP's total trade and GDP.
Under consideration
772 232.6 India
Trade with Dominant
Appendix Table A.1 FTAs in the Asia-Pacific region, organized by dominant partner, GDP and trade flows (continued)
Total Trade (billions)
Trade with Partner
GDP (billions)
Total Trade
(billions)
Dominant Partner
Partner Country's GDP and Two-Way Merchandise Trade (2005)
GDP (billions)
In force
Under negotiation
Status(as of
Feb. 2007)
Year since Counterparty
Dominant Partner's GDP and Two-Way Merchandise Trade (2005)
d. Dominant partner includes member countries of either APEC or ASEAN (For convenience, Laos, Cambodia and Myanmar, which are not APEC members but ASEAN members, are included). Partner country includes APEC member countries which are non ASEAN member countries.
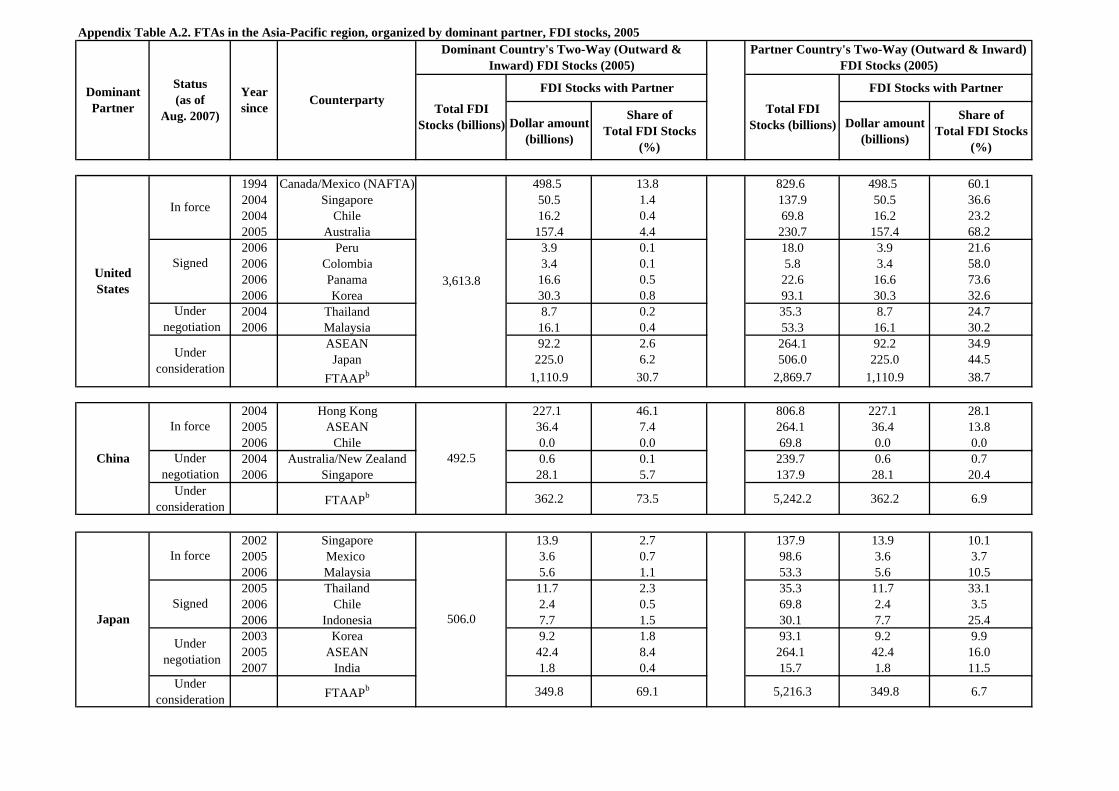
Dollar amount (billions)
Share of Total FDI Stocks
(%)
Dollar amount (billions)
Share of Total FDI Stocks
(%)
1994 Canada/Mexico (NAFTA) 498.5 13.8 829.6 498.5 60.12004 Singapore 50.5 1.4 137.9 50.5 36.62004 Chile 16.2 0.4 69.8 16.2 23.22005 Australia 157.4 4.4 230.7 157.4 68.22006 Peru 3.9 0.1 18.0 3.9 21.62006 Colombia 3.4 0.1 5.8 3.4 58.02006 Panama 16.6 0.5 22.6 16.6 73.62006 Korea 30.3 0.8 93.1 30.3 32.62004 Thailand 8.7 0.2 35.3 8.7 24.72006 Malaysia 16.1 0.4 53.3 16.1 30.2
ASEAN 92.2 2.6 264.1 92.2 34.9Japan 225.0 6.2 506.0 225.0 44.5
FTAAPb 1,110.9 30.7 2,869.7 1,110.9 38.7
2004 Hong Kong 227.1 46.1 806.8 227.1 28.12005 ASEAN 36.4 7.4 264.1 36.4 13.82006 Chile 0.0 0.0 69.8 0.0 0.02004 Australia/New Zealand 0.6 0.1 239.7 0.6 0.72006 Singapore 28.1 5.7 137.9 28.1 20.4
Under consideration FTAAPb 362.2 73.5 5,242.2 362.2 6.9
2002 Singapore 13.9 2.7 137.9 13.9 10.12005 Mexico 3.6 0.7 98.6 3.6 3.72006 Malaysia 5.6 1.1 53.3 5.6 10.52005 Thailand 11.7 2.3 35.3 11.7 33.12006 Chile 2.4 0.5 69.8 2.4 3.52006 Indonesia 7.7 1.5 30.1 7.7 25.42003 Korea 9.2 1.8 93.1 9.2 9.92005 ASEAN 42.4 8.4 264.1 42.4 16.02007 India 1.8 0.4 15.7 1.8 11.5
Under consideration FTAAPb 349.8 69.1 5,216.3 349.8 6.7
Under negotiation
China
In force
492.5 Under negotiation
Japan
In force
506.0 Signed
FDI Stocks with Partner
UnitedStates
In force
3,613.8 Signed
Under negotiation
Under consideration
Appendix Table A.2. FTAs in the Asia-Pacific region, organized by dominant partner, FDI stocks, 2005
Dominant Partner
Status(as of
Aug. 2007)
Year since Counterparty
Total FDI Stocks (billions)
FDI Stocks with Partner
Total FDI Stocks (billions)
Dominant Country's Two-Way (Outward & Inward) FDI Stocks (2005)
Partner Country's Two-Way (Outward & Inward) FDI Stocks (2005)
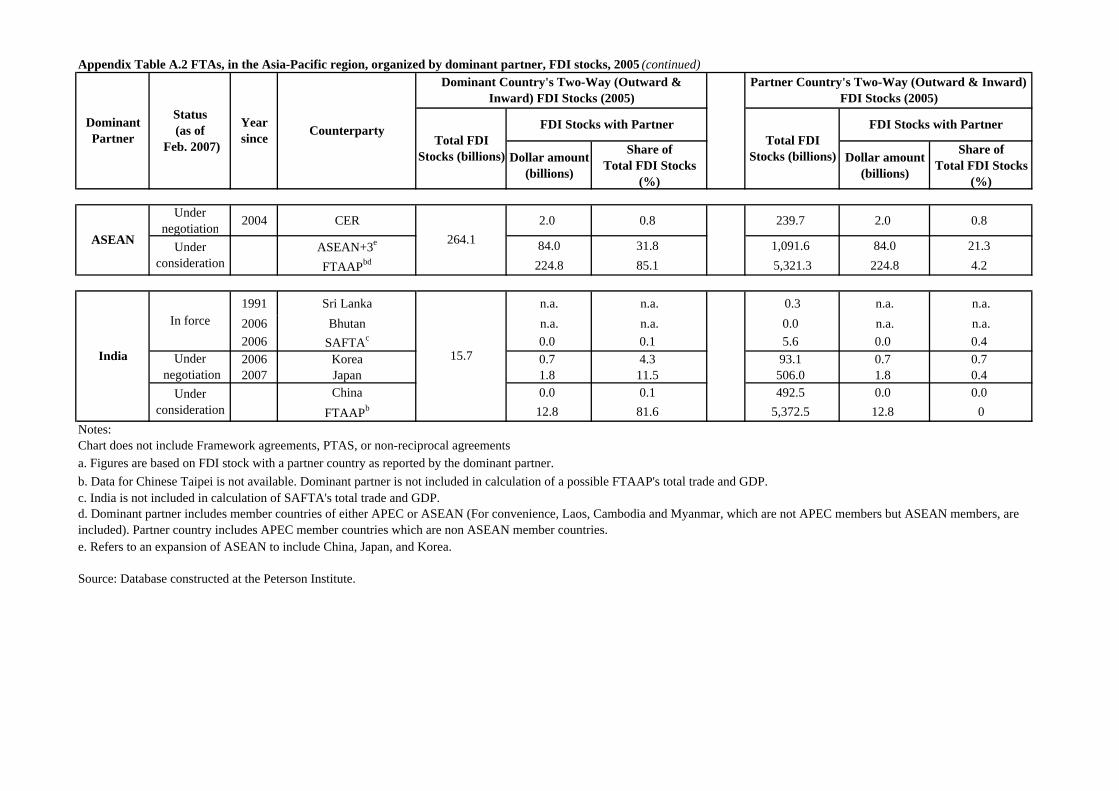
Dollar amount (billions)
Share of Total FDI Stocks
(%)
Dollar amount (billions)
Share of Total FDI Stocks
(%)
Under negotiation 2004 CER 2.0 0.8 239.7 2.0 0.8
ASEAN+3e 84.0 31.8 1,091.6 84.0 21.3FTAAPbd 224.8 85.1 5,321.3 224.8 4.2
1991 Sri Lanka n.a. n.a. 0.3 n.a. n.a.2006 Bhutan n.a. n.a. 0.0 n.a. n.a.2006 SAFTAc 0.0 0.1 5.6 0.0 0.42006 Korea 0.7 4.3 93.1 0.7 0.72007 Japan 1.8 11.5 506.0 1.8 0.4
China 0.0 0.1 492.5 0.0 0.0FTAAPb 12.8 81.6 5,372.5 12.8 0
Notes: Chart does not include Framework agreements, PTAS, or non-reciprocal agreements
c. India is not included in calculation of SAFTA's total trade and GDP.
e. Refers to an expansion of ASEAN to include China, Japan, and Korea.
Source: Database constructed at the Peterson Institute.
ASEAN 264.1Under consideration
Under consideration
15.7
Partner Country's Two-Way (Outward & Inward) FDI Stocks (2005)
Total FDI Stocks (billions)
FDI Stocks with PartnerTotal FDI
Stocks (billions)
FDI Stocks with PartnerStatus(as of
Feb. 2007)
Year since Counterparty
Dominant Country's Two-Way (Outward & Inward) FDI Stocks (2005)
d. Dominant partner includes member countries of either APEC or ASEAN (For convenience, Laos, Cambodia and Myanmar, which are not APEC members but ASEAN members, are included). Partner country includes APEC member countries which are non ASEAN member countries.
India
In force
Under negotiation
a. Figures are based on FDI stock with a partner country as reported by the dominant partner. b. Data for Chinese Taipei is not available. Dominant partner is not included in calculation of a possible FTAAP's total trade and GDP.
Appendix Table A.2 FTAs, in the Asia-Pacific region, organized by dominant partner, FDI stocks, 2005 (continued)
Dominant Partner


