
T E X A S M U N I C I P A L R E T I R E M E N T S Y S T E M
M O R T A L I T Y E X P E R I E N C E I N V E S T I G A T I O N S T U D Y
F O R T H E P E R I O D E N D I N G D E C E M B E R 3 1 , 2 0 1 1

December 31, 2013
Board of Trustees
Texas Municipal Retirement System
Austin, Texas
Dear Members of the Board:
Subject: Results of Mortality Analysis
This report documents our findings and recommendations on the mortality experience of the
Texas Municipal Retirement System (TMRS), especially pertaining to the current annuity
purchase factors. Our report includes a discussion of the recent experience of the System, it
presents our recommendations for new actuarial assumptions and methods, and it provides
information about the actuarial impact of these recommendations on the liabilities and other key
actuarial measures of TMRS.
With the Board of Trustees’ having approved the recommendations in this report, we believe the
actuarial condition of the System will be more accurately measured and portrayed. As a result,
current employer contribution rates will remain stable and there will be less pressure on
increasing employer rates in the future.
The following is a summary of our recommendation on the mortality assumption and
methodologies which were approved by the Board at the October 9, 2013 meeting to be first
reflected in the December 31, 2013 actuarial valuation:
1. Change the valuation assumption for healthy retirees and beneficiaries to the RP-2000
Combined Mortality Table with Blue Collar Adjustment for males and females, with the
male rates increased by 109% and the female rates increased by 103%, with full
generational mortality projections by Scale BB.
2. Change the annuity purchase factors to be based on a 70%/30% male/female weighting of
the RP-2000 Combined Mortality Table with Blue Collar Adjustment with the rates
increased by 107.5% , with full generational mortality projections by Scale BB. Mortality
for beneficiaries will be the reverse 30%/70% weighting.
3. Phase into the new annuity purchase factors over a 13 year period beginning in Calendar
Year 2015.
4. Avoid any employer contribution rates from decreasing/increasing to the extent possible by
decreasing/increasing the amortization period to the extent allowable under TMRS Statute
and Board Rules.
Members of the Board
Page 2
December 31, 2013
This experience investigation study was conducted in accordance with generally accepted
actuarial principles and practices, and in full compliance with the Actuarial Standards of Practice
as issued by the Actuarial Standards Board. All of the undersigned are members of and meet the
Qualification Standards of the American Academy of Actuaries.
We wish to thank TMRS staff for its assistance in this project, in particular, Ms. Leslee Hardy,
Director of Actuarial Services.
Respectfully submitted,
Mark R. Randall, MAAA, FCA, EA Joseph P. Newton, FSA, EA, MAAA
Executive Vice President Senior Consultant and Actuary
Brad Stewart, ASA, EA, MAAA

Texas Municipal Retirement System
Table of Contents
Table of Contents
PAGE COVER LETTER
SECTION I 2 ANALYSIS OF EXPERIENCE AND RECOMMENDATIONS
SECTION II 15 ACTUARIAL IMPACT OF RECOMMENDATIONS
SECTION III 18 SUMMARY OF NEW ASSUMPTIONS
SECTION VI 20 SUMMARY OF DATA AND EXPERIENCE

SECTION I
A N A LY S IS OF EX P ER IEN C E
A N D R EC O MMEN D ATIO N S
Texas Municipal Retirement System
Section I
Analysis of Experience and Recommendations
3
Analysis of Experience and Recommendations
Introduction
In determining liabilities, contribution rates and funding periods for retirement plans, actuaries
must make assumptions about the future. Among the assumptions that must be made are:
Retirement rates
Mortality rates
Termination rates
Disability rates
Investment return rate
Salary increase rates
Inflation rate
For some of these assumptions, such as the mortality rates, past experience provides important
evidence about the future. For other assumptions, such as the investment return rate, the link
between past and future results is much weaker. In either case, though, actuaries should review
their assumptions periodically and determine whether these assumptions are consistent with actual
past experience and with anticipated future experience. This current study is focused solely on
retiree mortality rates and the related factors used to annuitize members’ account balances.
This study is generally based on experience during the three-year period of January 1, 2009 to
December 31, 2011. Additional analysis that included the calendar year 2012 data confirmed the
original results described in this report. The last experience study was prepared in 2011, in
conjunction with the completion of the December 31, 2010 actuarial valuation report. That report
generally covered experience during the period of January 1, 2005 to December 31, 2009.
In conducting experience studies, actuaries generally use data over a period of several years. This
is necessary in order to gather enough data so that the results are statistically significant and
deemed credible.
In an experience study, we first determine the number of deaths, retirements, etc. that occurred
during the period. Then we determine the number expected to occur, based on the current actuarial
assumptions. The number “expected” is determined by multiplying the probability of the
occurrence at the given age, by the “exposures” at that same age. Finally we calculate the A/E
ratio, where "A" is the actual number (of retirements, for example) and "E" is the expected number.
If the current assumptions were "perfect", the A/E ratio would be 100%. When it varies much
from this figure, it is a sign that a new assumption may be needed. (However, in some cases we
prefer to set our assumptions to produce an A/E ratio a little above or below 100%, in order to
introduce some conservatism.) Of course we not only look at the assumptions as a whole, but we
also review how well they fit the actual results by gender, by age, and by service.
Texas Municipal Retirement System
Section I
Analysis of Experience and Recommendations
4
Finally, if the data leads the actuary to conclude that new tables are needed, the actuary typically
"graduates" or smoothes the results since the raw results can be quite uneven from age to age or
from service year to service year.
Please bear in mind that, while the recommended assumption set represents our best current
estimate, there are other reasonable assumption sets that could be supported. Some reasonable
assumption sets would show higher or lower liabilities or costs.
A C T U A R I A L S T A N D A R D S O F P R A C T I C E
The issue of future mortality improvement is one that the governing bodies of our profession have
recently become more concerned about. This has resulted in recent changes to the relevant
Actuarial Standard of Practice, ASOP 35, Selection of Demographic and Other Noneconomic
Assumptions for Measuring Pension Obligations and published practice notes. The standard now
requires pension actuaries to make and disclose an assumption as to expected mortality
improvement after the valuation date. The following are excerpts directly from the Standard:
“As mortality rates have continued to decline over time, concern has increased about the impact
of potential future mortality improvements on the magnitude of pension commitments. Section
3.5.3 of current ASOP No. 35 lists “the likelihood and extent of mortality improvement in the
future” as a factor for the actuary to consider in selecting a mortality assumption. In the view of
many actuaries, the guidance regarding mortality assumptions should more explicitly recognize
estimated future mortality improvement as a fundamental and necessary assumption, and the
actuary’s provision for such improvement should be disclosed explicitly and transparently.”
“The resources reviewed by the Pension Committee showed that demographers generally
expect that mortality will continue to improve. These resources noted that some scientists argue
that human life has biological limits, and that the rate of mortality improvement could slow as a
result of obesity or other emerging health issues, but that such limits and countervailing factors
do not alter the scientific consensus of likely continuing improvements in mortality.”
“The actuary should consider the effect of mortality improvement both prior to and subsequent
to the measurement date. With regard to mortality improvement, the actuary should do the
following:
i. adjust mortality rates to reflect mortality improvement prior to the measurement
date. For example, if the actuary starts with a published mortality table, the
mortality rates may need to be adjusted to reflect mortality improvement from the
effective date of the table to the measurement date. Such an adjustment is not
necessary if, in the actuary’s professional judgment, the published mortality table
reflects expected mortality rates as of the measurement date.
ii. include an assumption as to expected mortality improvement after the
measurement date. This assumption should be disclosed in accordance with
Texas Municipal Retirement System
Section I
Analysis of Experience and Recommendations
5
section 4.1.1, even if the actuary concludes that an assumption of zero future
improvement is reasonable as described in section 3.1. Note that the existence of
uncertainty about the occurrence or magnitude of future mortality improvement
does not by itself mean that an assumption of zero future improvement is a
reasonable assumption.”
As you will note, we have highlighted the above sentences we feel need to be emphasized. To
meet this standard, a recent trend in actuarial models is to use mortality tables that explicitly
incorporate projected mortality improvements over time. This type of table (or series of tables) is
called “generational mortality.” Historically, actuarial models have been constrained to static
mortality tables due to two reasons (1) a general belief that there was a limit on the ultimate
longevity and (2) the added complexity of a generational mortality type model and limitations in
computational power. A static mortality table would be used and updated with each experience
study to reflect the most recent mortality. Historically, this would almost always result in adoption
of lower mortality rates creating losses for plans and unfunded past service liabilities.
With advances in computing power, it has become a more mainstream practice to incorporate
generational mortality models. The idea behind adopting a generational mortality model is to
avoid the experience study “correction” factor. While minor adjustments may need to be made in
the future, the constant bias towards needing to reduce mortality rates is avoided.
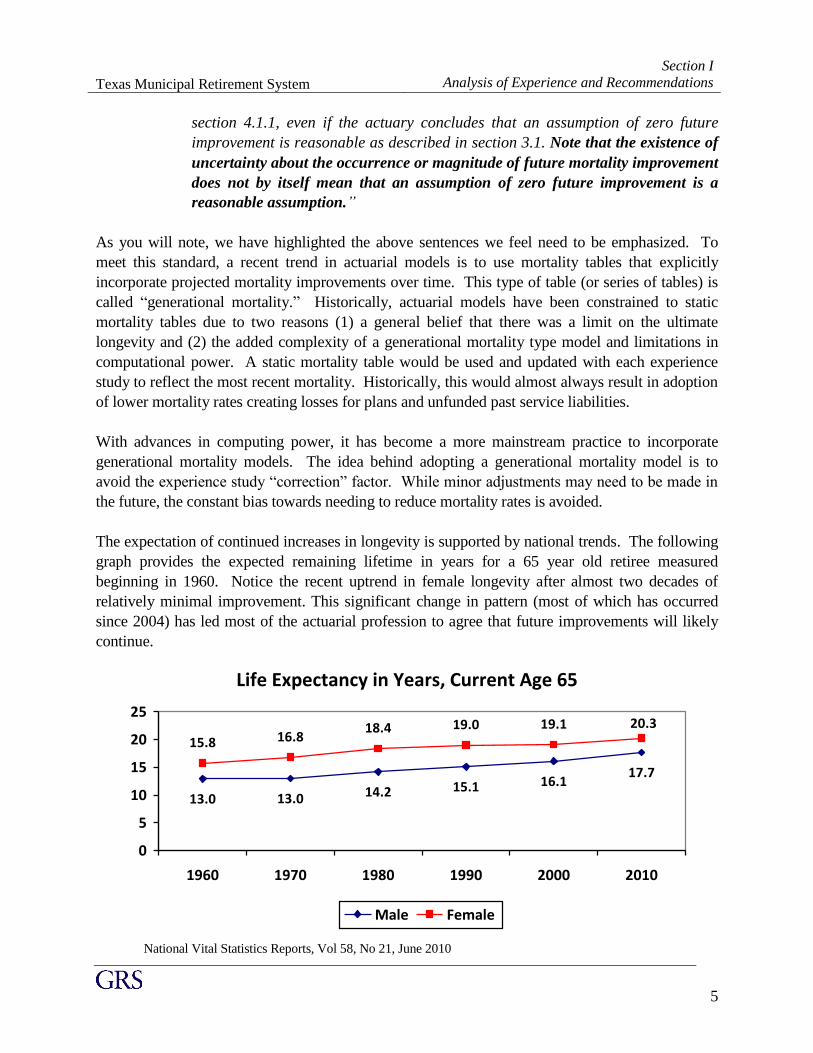
The expectation of continued increases in longevity is supported by national trends. The following
graph provides the expected remaining lifetime in years for a 65 year old retiree measured
beginning in 1960. Notice the recent uptrend in female longevity after almost two decades of
relatively minimal improvement. This significant change in pattern (most of which has occurred
since 2004) has led most of the actuarial profession to agree that future improvements will likely
continue.
Life Expectancy in Years, Current Age 65
13.0 13.0 14.2 15.1 16.117.7
15.8 16.818.4 19.0 19.1 20.3
0
5
10
15
20
25
1960 1970 1980 1990 2000 2010
Male Female
National Vital Statistics Reports, Vol 58, No 21, June 2010

Texas Municipal Retirement System
Section I
Analysis of Experience and Recommendations
6
National Vital Statistics Reports, Vol 60, No 4, January 2011
The most current mortality tables were provided in a recent report by the Society of Actuaries’
Retirement Plans Experience Committee’s (RPEC) published in September of 2012. The
following are excerpts from that report:
“As part of its periodic review of retirement plan mortality experience, RPEC initiated a Pension
Mortality Study in 2010. This study, which is still in progress, includes a comprehensive review
of recent mortality experience of uninsured retirement plans in the United States. The SOA
anticipates publishing a new set of retirement plan mortality tables and mortality improvement
rates in late 2013, or early 2014, that would be the successors to the RP-2000 tables and Scale
AA.
At an early stage of its analysis, the Mortality Improvement Sub-team of RPEC noticed that
mortality improvement experience in the United States since 2000 has differed from that
anticipated by Scale AA. In particular, there was a noticeable degree of mismatch between the
Scale AA rates and actual mortality experience for ages under 50, and the Scale AA rates were
lower than the actual mortality improvement rates for most ages over 55. Given that the Pension
Mortality Study is still many months from completion, RPEC is publishing an interim
improvement Scale BB, which can be used by pension actuaries as an alternative to Scale AA for
the projection of base mortality rates beyond calendar year 2000. Scale BB was developed using
certain techniques that have not been used previously in the construction of mortality
improvement scales published by the SOA. These techniques, including the analysis of US
mortality trends on a two-dimensional (age and calendar year) basis, are described in Sections 4
and 5. These important new techniques notwithstanding, the final gender-specific Scale BB rates
published in this report vary solely by age, and hence can be used with existing pension
valuation software.”
“RPEC recognizes that there is a wide range of opinion with respect to future levels of mortality
in the United States and that the assumptions underlying any set of mortality improvement rates
must necessarily reflect some degree of subjectivity. RPEC characterizes the assumptions that
underpin Scale BB (including a 1.0% long-term rate of mortality improvement and limited
cohort effects) as middle-of–the road, being neither overly optimistic nor too pessimistic with
respect to future longevity improvements in the United States.”
“In light of the nearly continuous pattern of increasing longevity in the United States over the
past century, the Committee recommends that actuaries incorporate adequate provisions for
future mortality improvement into their calculations. Taking into consideration the methodology
used to develop Scale BB (Section 5.3) and RPEC’s preference for generational projection of
mortality over static approximations (Section 7.1), the committee encourages users of Scale BB
to do so on a fully generational basis.”
Based on the recent strengthening of the Standards of Practice, we are recommending the
application of Scale BB, the most recent industry standard mortality improvement table used in
both pension and life insurance work. By doing this, future mortality rates will be projected to
continually decrease each year in the future. Therefore, the life expectancy at age 60 for someone
Texas Municipal Retirement System
Section I
Analysis of Experience and Recommendations
7
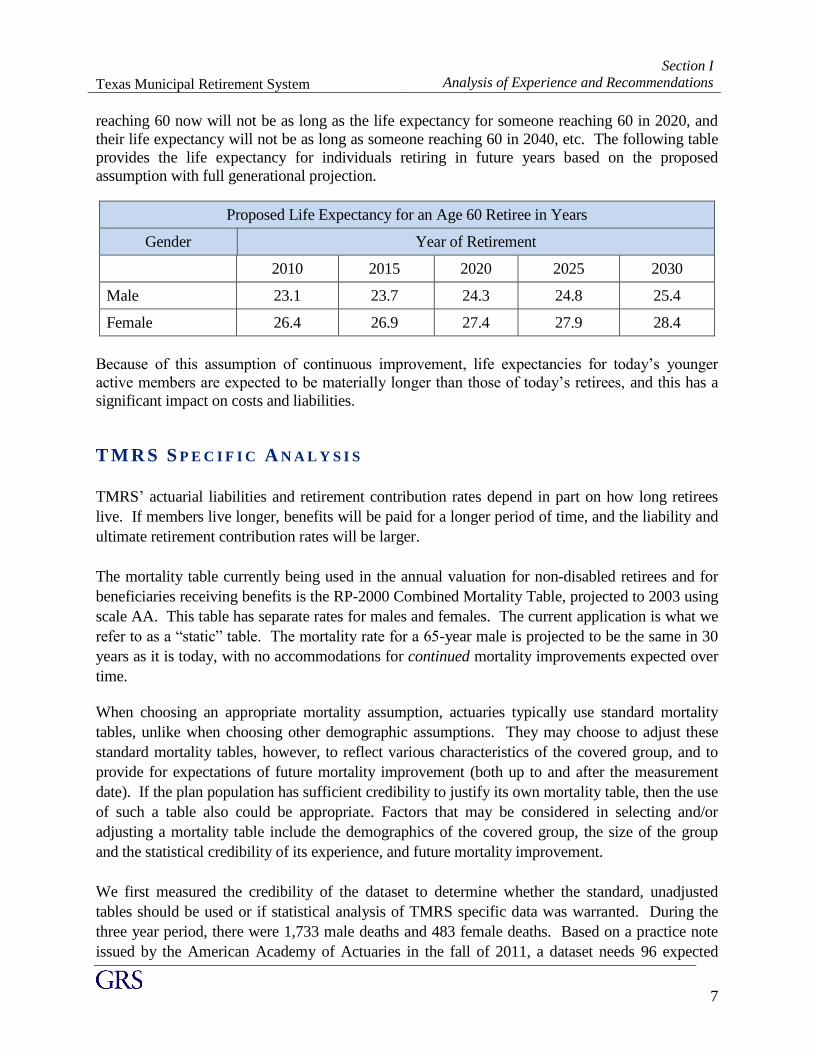
reaching 60 now will not be as long as the life expectancy for someone reaching 60 in 2020, and
their life expectancy will not be as long as someone reaching 60 in 2040, etc. The following table
provides the life expectancy for individuals retiring in future years based on the proposed
assumption with full generational projection.
Proposed Life Expectancy for an Age 60 Retiree in Years
Gender Year of Retirement
2010 2015 2020 2025 2030
Male 23.1 23.7 24.3 24.8 25.4
Female 26.4 26.9 27.4 27.9 28.4
Because of this assumption of continuous improvement, life expectancies for today’s younger
active members are expected to be materially longer than those of today’s retirees, and this has a
significant impact on costs and liabilities.
T M R S S P E C I F I C A N A L Y S I S
TMRS’ actuarial liabilities and retirement contribution rates depend in part on how long retirees
live. If members live longer, benefits will be paid for a longer period of time, and the liability and
ultimate retirement contribution rates will be larger.
The mortality table currently being used in the annual valuation for non-disabled retirees and for
beneficiaries receiving benefits is the RP-2000 Combined Mortality Table, projected to 2003 using
scale AA. This table has separate rates for males and females. The current application is what we
refer to as a “static” table. The mortality rate for a 65-year male is projected to be the same in 30
years as it is today, with no accommodations for continued mortality improvements expected over
time.
When choosing an appropriate mortality assumption, actuaries typically use standard mortality
tables, unlike when choosing other demographic assumptions. They may choose to adjust these
standard mortality tables, however, to reflect various characteristics of the covered group, and to
provide for expectations of future mortality improvement (both up to and after the measurement
date). If the plan population has sufficient credibility to justify its own mortality table, then the use
of such a table also could be appropriate. Factors that may be considered in selecting and/or
adjusting a mortality table include the demographics of the covered group, the size of the group
and the statistical credibility of its experience, and future mortality improvement.
We first measured the credibility of the dataset to determine whether the standard, unadjusted
tables should be used or if statistical analysis of TMRS specific data was warranted. During the
three year period, there were 1,733 male deaths and 483 female deaths. Based on a practice note
issued by the American Academy of Actuaries in the fall of 2011, a dataset needs 96 expected
Texas Municipal Retirement System
Section I
Analysis of Experience and Recommendations
8
deaths for each gender to be declared fully credible with 95% confidence. Other sources state
higher requirements, such as 1,000 deaths per gender, but the total deaths in excess of 2,000
suggests the data is fully credible and a TMRS specific assumption is appropriate.
The analysis itself was performed on the amount of annuity, not on the individual lives. Or, each
member was weighted by the amount of their annuity. This is consistent with the methods utilized
to develop the RP-2000 table and with several published reports documenting the relationship
between the level of income (or economic wealth) and longevity.
We begin by determining the expected number of deaths in each year at each age for males and
females. Then we compare the actual number to the expected number. The ratio of the actual
deaths to the expected deaths—the A/E ratio—then tells us whether the assumptions are
reasonable. Historically for this assumption, using a static mortality table, an A/E ratio of between
110% and 120% has traditionally been desired for conservatism and to build in a margin for
continued future improvements in mortality rates. For example, in the last experience study, the
A/E ratio was 107% under the old assumptions and 113% after the change.
There were 1,733 deaths among the male retirees and 483 deaths among female retirees during the
study period. However, weighted by the amount of annuity, this represented $2.28 million in
monthly annuity payments for men and $0.45 million for females. Based on the current mortality
assumption, we expected $2.01 million and $0.49 million deaths, respectively. This produced A/E
ratios of 113% for males, 91% for females, or 109% in total. Based on these ratios, the overall
static mortality assumption has lost some of its conservatism for future mortality improvements
since the prior study, although it may still be reasonable if the prior methodology were being
continued.
Another approach when measuring mortality experience is to estimate the life expectancy from a
given age based on the statistical results. Based on the current assumption, it would be expected
that a male member who has attained age 60 to live 22.1 more years to age 82.1 and a female who
has attained age 60 to live 24.6 years to age 84.6. Based on the actual data, males were living 21.3
years and females were living 24.6 years. Combined, the assumption was 22.6 with an actual
experience of 21.9 years. Again, there was some margin from improvement in the current
assumption, but the amount of margin was decreasing.
Unlike a static mortality table where an A/E ratio between 110% and 120% is generally desired to
allow for a margin, the change in the underlying structure of the assumption to the use of
generational projections, an A/E ratio of 100% is desirable because the margin is built into future
mortality rates. Utilizing life expectancy, the goal would be to have actual life expectancy and the
assumed expectancy exactly match at as many points as possible.
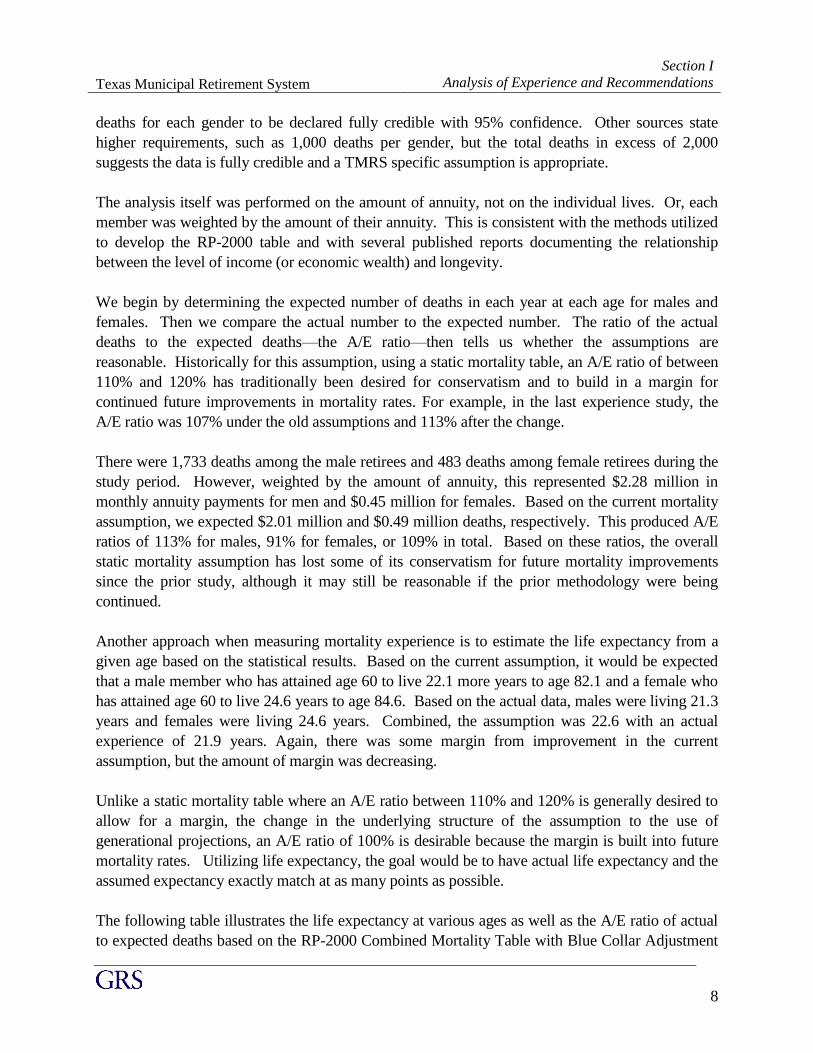
The following table illustrates the life expectancy at various ages as well as the A/E ratio of actual
to expected deaths based on the RP-2000 Combined Mortality Table with Blue Collar Adjustment
Texas Municipal Retirement System
Section I
Analysis of Experience and Recommendations
9
for males and females, with the male rates increased by 109% and the female rates increased by
103%.
Males Females
Actual Expected A/E Actual Expected A/E
Deaths $2.28M $2.27M 100% $0.47M $0.49M 91%
Life Expectancy at Age:
55 25.4 25.6 100.8% 29.1 29.2 100.1%
60 21.3 21.3 100.2% 24.6 24.6 100.0%
65 17.4 17.4 99.7% 20.4 20.4 100.1%
70 13.9 13.9 99.4% 16.4 16.5 100.9%
75 10.8 10.7 99.2% 12.7 13.1 103.0%
80 8.2 8.1 99.2% 9.5 10.1 106.1%
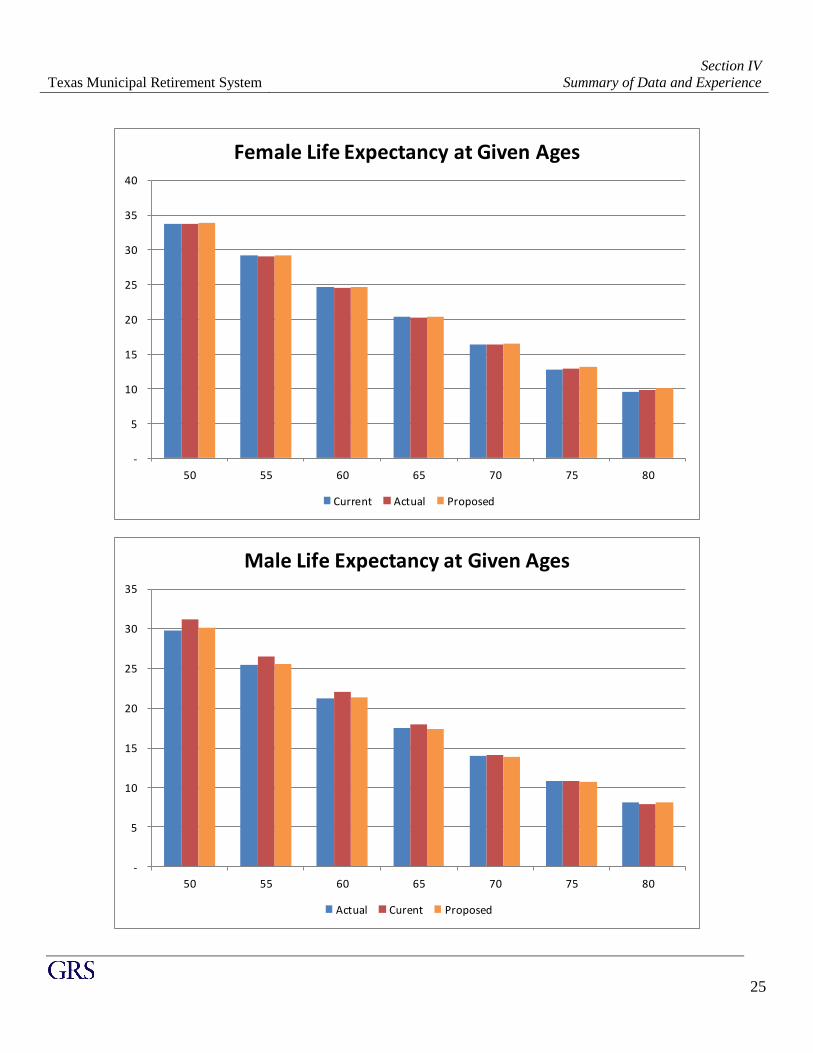
As shown, the adjusted tables provide a very close match to the actual experience, especially based
on life expectancy.
In addition, we are recommending the application of Scale BB onto the base tables, which will
build in continuous increases in life expectancy into the future. The base year for both tables is
2000. That is, improvement is projected from that year to each year in the future. In setting the base
tables, we compared the base tables, projected to 2010, roughly the midpoint of the experience
study data, with actual deaths. This is what is shown on the detailed tables in Section IV, pages 22-
24.
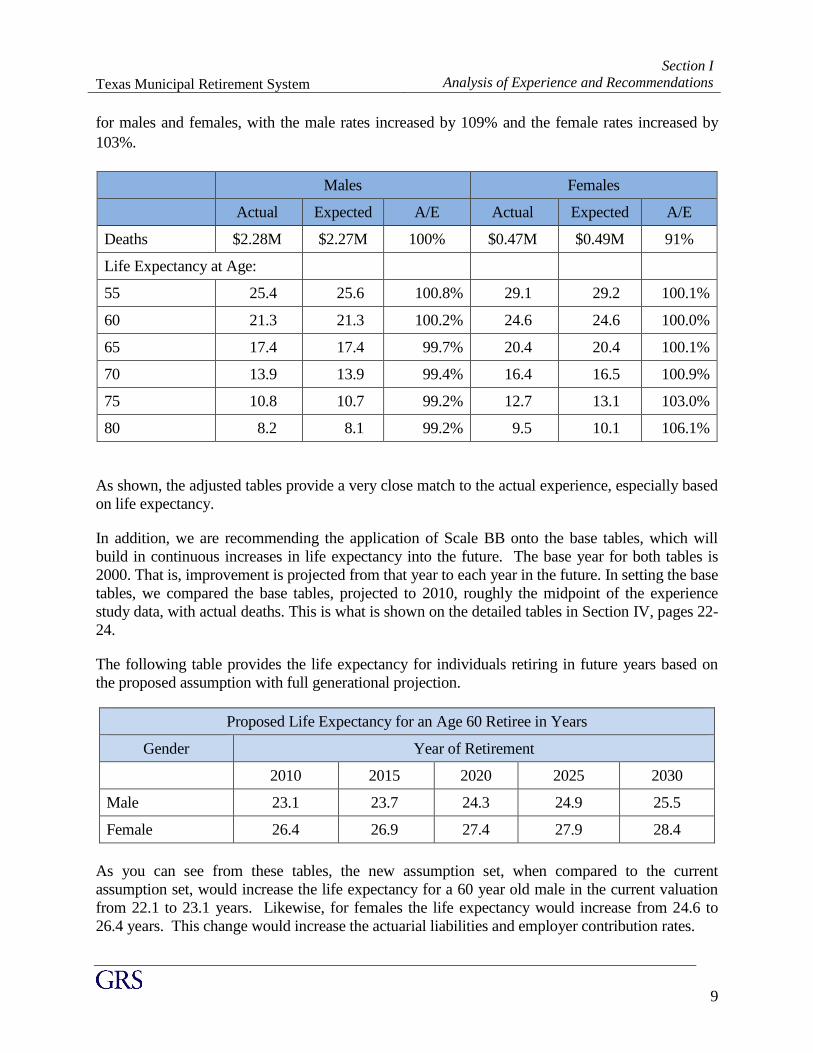
The following table provides the life expectancy for individuals retiring in future years based on
the proposed assumption with full generational projection.
Proposed Life Expectancy for an Age 60 Retiree in Years
Gender Year of Retirement
2010 2015 2020 2025 2030
Male 23.1 23.7 24.3 24.9 25.5
Female 26.4 26.9 27.4 27.9 28.4
As you can see from these tables, the new assumption set, when compared to the current
assumption set, would increase the life expectancy for a 60 year old male in the current valuation
from 22.1 to 23.1 years. Likewise, for females the life expectancy would increase from 24.6 to
26.4 years. This change would increase the actuarial liabilities and employer contribution rates.
Texas Municipal Retirement System
Section I
Analysis of Experience and Recommendations
10
A N N U I T Y P U R C H A S E F A C T O R S
Members of TMRS have their annuities calculated by taking their total member contributions plus
employer match plus any updated service credit balance at the date of retirement and dividing by
an annuity purchase factor based on the member’s age. The current annuity purchase factors were
developed based on the UP-1984 Mortality Table, with a 2 year setback. A setback is an actuarial
technique to extend the life expectancy. The probability of mortality for a member in a given year
will not be based on the member’s age at the time of the calculation, but instead will be calculated
as if the member were two years younger. The current annuity purchase factors were developed in
1981 and have not been updated since.
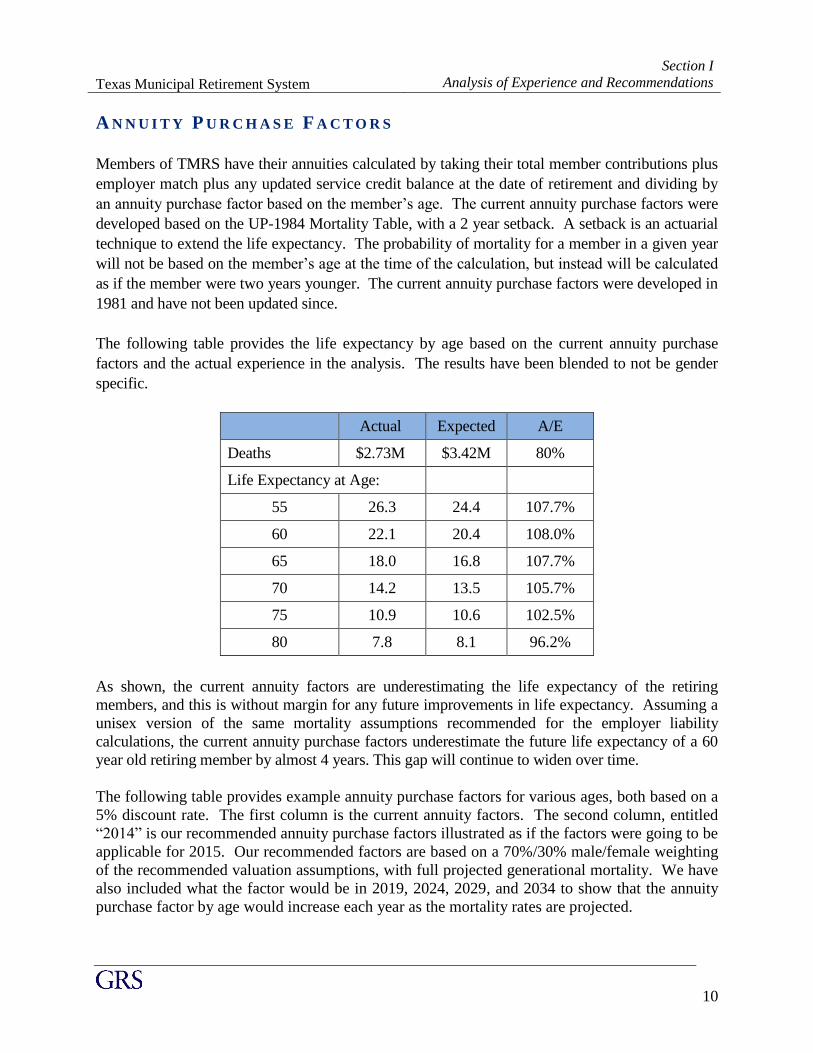
The following table provides the life expectancy by age based on the current annuity purchase
factors and the actual experience in the analysis. The results have been blended to not be gender
specific.
Actual Expected A/E
Deaths $2.73M $3.42M 80%
Life Expectancy at Age:
55 26.3 24.4 107.7%
60 22.1 20.4 108.0%
65 18.0 16.8 107.7%
70 14.2 13.5 105.7%
75 10.9 10.6 102.5%
80 7.8 8.1 96.2%
As shown, the current annuity factors are underestimating the life expectancy of the retiring
members, and this is without margin for any future improvements in life expectancy. Assuming a
unisex version of the same mortality assumptions recommended for the employer liability
calculations, the current annuity purchase factors underestimate the future life expectancy of a 60
year old retiring member by almost 4 years. This gap will continue to widen over time.
The following table provides example annuity purchase factors for various ages, both based on a
5% discount rate. The first column is the current annuity factors. The second column, entitled
“2014” is our recommended annuity purchase factors illustrated as if the factors were going to be
applicable for 2015. Our recommended factors are based on a 70%/30% male/female weighting
of the recommended valuation assumptions, with full projected generational mortality. We have
also included what the factor would be in 2019, 2024, 2029, and 2034 to show that the annuity
purchase factor by age would increase each year as the mortality rates are projected.

Texas Municipal Retirement System
Section I
Analysis of Experience and Recommendations
11
Annuity Purchase Factor by Age based on Recommended Assumptions and a 5%
Discount Rate
Age Current Factor Proposed Factor by Year of Retirement
2014 2019 2024 2029 2034
50 174.55 190.63 191.92 193.17 194.39 195.57
55 160.34 176.79 178.46 180.08 181.66 183.19
60 144.61 160.48 162.59 164.65 166.65 168.59
65 127.62 142.15 144.65 147.09 149.46 151.77
As shown, the new factors would be substantially larger than the current factors. For a retiring
60 year old, the change from 2013 to 2014 would mean a member’s benefit would be
approximately 10% lower than using the current factors.
The impact from this type of immediate change would cause many members to retire before the
new factors were adopted, which would have negative consequences to all stakeholders. We
would recommend the new factors be phased into over a number of years so that individual
members would not have an economic incentive to retire before they are ready. The following
table provides three benefit estimations for a member reaching 20 years of service at age 50 with
a current salary of $45,000, a current employee balance of $81,000 and matching employer funds
of $162,000. In each scenario, the member is assumed to continue to work earning a 3% salary
increase each year until age 65. The line represents the monthly dollar amount of benefit the
member would be entitled to if the member retired at the stated age. The three scenarios show
the growth in benefit based on (1) the current factors, (2) the proposed factors implemented
immediately, and (3) a 13 year phase into the new factors.
Age Current New Factors 13 year phase in
50 1,392 1,274 1,392
51 1,541 1,406 1,525
52 1,705 1,550 1,669
53 1,883 1,705 1,823
54 2,078 1,874 1,989
55 2,290 2,058 2,168
56 2,523 2,258 2,361
57 2,778 2,475 2,570
58 3,058 2,712 2,796
59 3,363 2,968 3,040
60 3,699 3,249 3,306
61 4,068 3,555 3,595
62 4,474 3,889 3,910
63 4,920 4,251 4,251
64 5,411 4,648 4,648
65 5,951 5,082 5,082
Texas Municipal Retirement System
Section I
Analysis of Experience and Recommendations
12
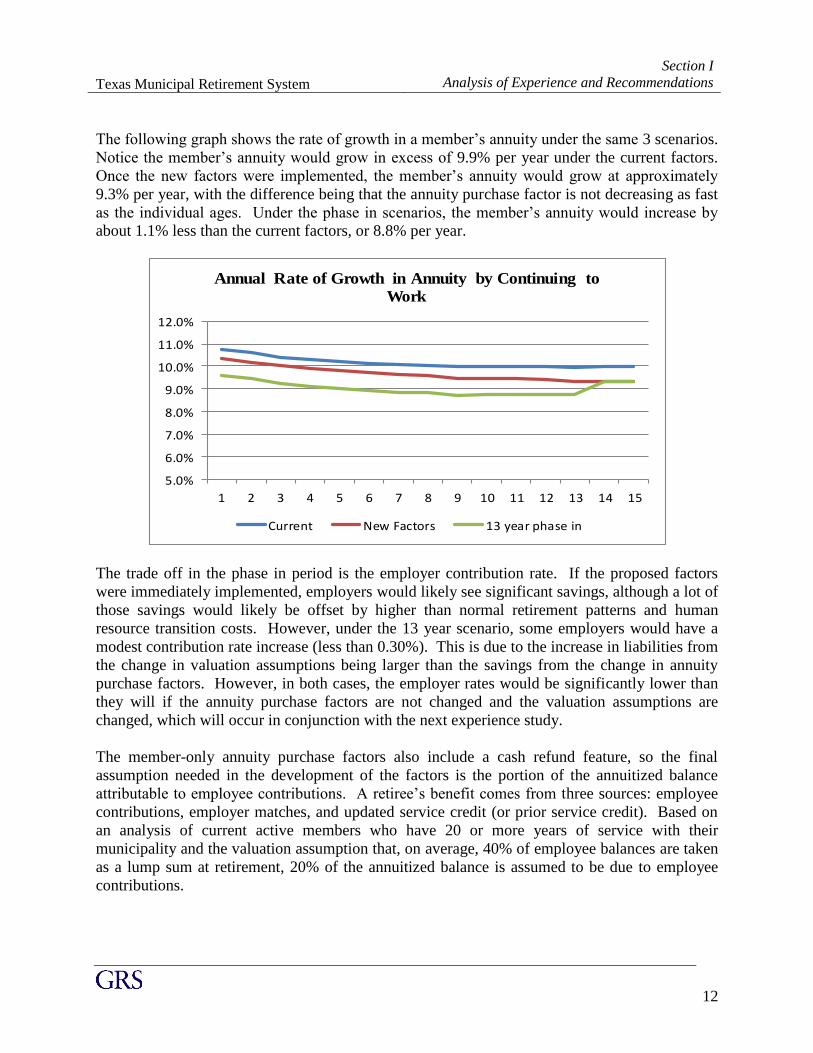
The following graph shows the rate of growth in a member’s annuity under the same 3 scenarios.
Notice the member’s annuity would grow in excess of 9.9% per year under the current factors.
Once the new factors were implemented, the member’s annuity would grow at approximately
9.3% per year, with the difference being that the annuity purchase factor is not decreasing as fast
as the individual ages. Under the phase in scenarios, the member’s annuity would increase by
about 1.1% less than the current factors, or 8.8% per year.
5.0%
6.0%
7.0%
8.0%
9.0%
10.0%
11.0%
12.0%
1 2 3 4 5 6 7 8 9 10 11 12 13 14 15
Annual Rate of Growth in Annuity by Continuing to
Work
Current New Factors 13 year phase in
The trade off in the phase in period is the employer contribution rate. If the proposed factors
were immediately implemented, employers would likely see significant savings, although a lot of
those savings would likely be offset by higher than normal retirement patterns and human
resource transition costs. However, under the 13 year scenario, some employers would have a
modest contribution rate increase (less than 0.30%). This is due to the increase in liabilities from
the change in valuation assumptions being larger than the savings from the change in annuity
purchase factors. However, in both cases, the employer rates would be significantly lower than
they will if the annuity purchase factors are not changed and the valuation assumptions are
changed, which will occur in conjunction with the next experience study.
The member-only annuity purchase factors also include a cash refund feature, so the final
assumption needed in the development of the factors is the portion of the annuitized balance
attributable to employee contributions. A retiree’s benefit comes from three sources: employee
contributions, employer matches, and updated service credit (or prior service credit). Based on
an analysis of current active members who have 20 or more years of service with their
municipality and the valuation assumption that, on average, 40% of employee balances are taken
as a lump sum at retirement, 20% of the annuitized balance is assumed to be due to employee
contributions.
Texas Municipal Retirement System
Section I
Analysis of Experience and Recommendations
13
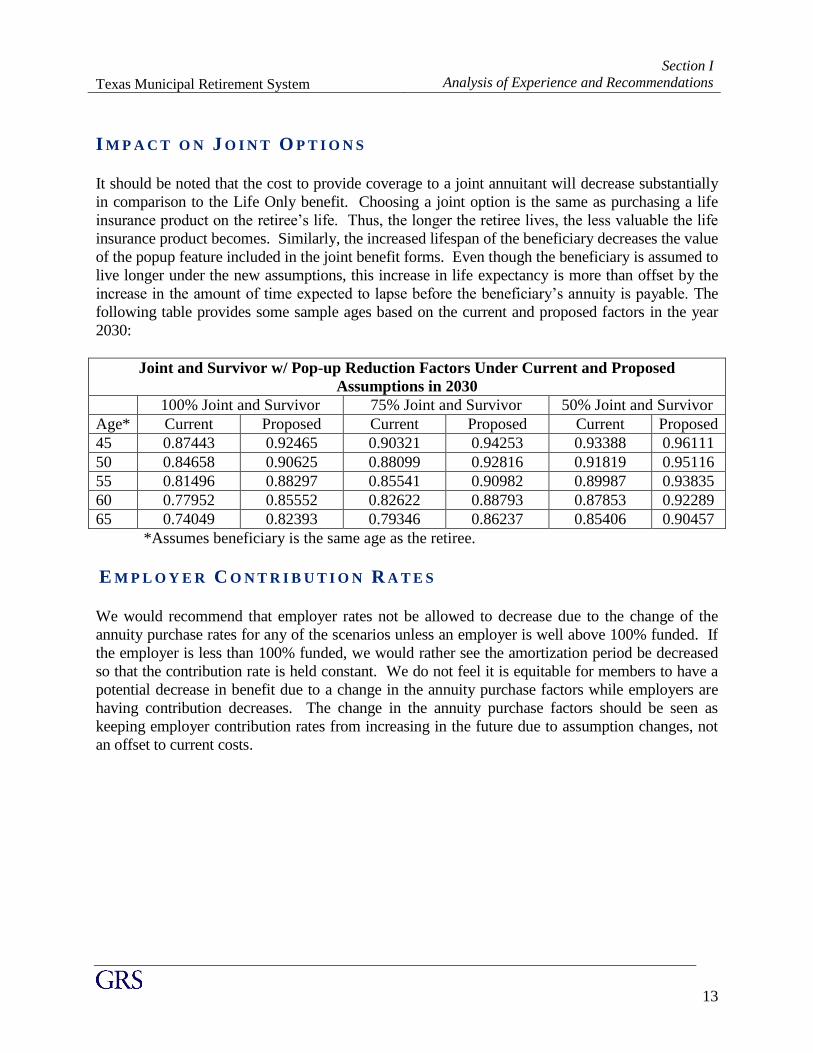
I M P A C T O N J O I N T O P T I O N S
It should be noted that the cost to provide coverage to a joint annuitant will decrease substantially
in comparison to the Life Only benefit. Choosing a joint option is the same as purchasing a life
insurance product on the retiree’s life. Thus, the longer the retiree lives, the less valuable the life
insurance product becomes. Similarly, the increased lifespan of the beneficiary decreases the value
of the popup feature included in the joint benefit forms. Even though the beneficiary is assumed to
live longer under the new assumptions, this increase in life expectancy is more than offset by the
increase in the amount of time expected to lapse before the beneficiary’s annuity is payable. The
following table provides some sample ages based on the current and proposed factors in the year
2030:
Joint and Survivor w/ Pop-up Reduction Factors Under Current and Proposed
Assumptions in 2030
100% Joint and Survivor 75% Joint and Survivor 50% Joint and Survivor
Age* Current Proposed Current Proposed Current Proposed
45 0.87443 0.92465 0.90321 0.94253 0.93388 0.96111
50 0.84658 0.90625 0.88099 0.92816 0.91819 0.95116
55 0.81496 0.88297 0.85541 0.90982 0.89987 0.93835
60 0.77952 0.85552 0.82622 0.88793 0.87853 0.92289
65 0.74049 0.82393 0.79346 0.86237 0.85406 0.90457
*Assumes beneficiary is the same age as the retiree.
E M P L O Y E R C O N T R I B U T I O N R A T E S
We would recommend that employer rates not be allowed to decrease due to the change of the
annuity purchase rates for any of the scenarios unless an employer is well above 100% funded. If
the employer is less than 100% funded, we would rather see the amortization period be decreased
so that the contribution rate is held constant. We do not feel it is equitable for members to have a
potential decrease in benefit due to a change in the annuity purchase factors while employers are
having contribution decreases. The change in the annuity purchase factors should be seen as
keeping employer contribution rates from increasing in the future due to assumption changes, not
an offset to current costs.

Texas Municipal Retirement System
Section I
Analysis of Experience and Recommendations
14
R E C O M M E N D A T I O N S
The following is a summary of our recommendations on the mortality assumption and
methodologies:
1. Change the valuation assumption for healthy retirees and beneficiaries to the RP-2000
Combined Mortality Table with Blue Collar Adjustment for males and females, with the
male rates increased by 109% and the female rates increased by 103%, with full
generational mortality projections by Scale BB.
2. Change the annuity purchase factors to be based on a 70%/30% male/female weighting of
the RP-2000 Combined Mortality Table with Blue Collar Adjustment with the rates
increased by 107.5% , with full generational mortality projections by Scale BB. Mortality
for beneficiaries will be the reverse 30%/70% weighting.
3. Phase into the new annuity purchase factors over a 13 year period beginning in Calendar
Year 2015.
4. Avoid any employer contribution rates from decreasing/increasing to the extent possible by
decreasing/increasing the amortization period to the extent allowable under TMRS Statute
and Board Rules.
A T T A C H E D E X H I B I T S
The following Section II summarizes the estimated actuarial cost impact of our recommendations
System-wide on page 16 followed by two charts on page 17 summarizing the estimated impact on
contribution rate on TMRS cities. Section III then details our new mortality assumptions to be
employed going forward.
Finally, the exhibits in Section IV should generally be self-explanatory. For example, on page 22,
we show the exhibit analyzing the unisex post retirement mortality rates. The second column
shows the total amount of annuity payments of retirees who died during the study period. Column
(3) shows the total exposures. This is the total amount of annuities for retirees who were alive
during any of the years. Column (4) shows the probability of death based on the raw data. That is,
it is the result of dividing the actual amount of benefits of retirees who died (col. 2) by the amount
exposed (col. 3). Column (5) shows the current mortality rate and column (6) shows the new
recommended mortality rate. Columns (7) and (8) show the expected amount of annuities of
retirees who died based on the current and proposed termination assumptions. Columns (9) and
(10) show the Actual-to-Expected ratios under the current and proposed termination assumptions.
SECTION II
A C TU A R IA L IMPA C T O F REC O MMEN D ATIO N S

Texas Municipal Retirement System
Section II
Actuarial Impact of Recommendations
16
Estimated Actuarial Impact of Recommendations
For illustrative purposes, the following tables compare key statistics from the January 1, 2012
actuarial valuation report before and after taking into account the recommended new assumptions.
Any actual changes, if any, in our recommendations concerning contribution rates will be
addressed in the upcoming December 31, 2013 actuarial valuation report.
Comparison of System-wide Funded Status and Rates ($ amounts in millions)
Current With Updated Mortality
and 13 Year Phase In
Present Value of Benefits $30,293 $29,880
Actuarial Accrued Liability (AAL) $22,545 $22,541
Actuarial Value of Assets $19,646 $19,646
Unfunded Actuarial Accrued Liability $2,899 $2,895
Funded Ratio 87.1% 87.2%
Full Retirement Contribution Rates:
Straight Average 8.34% 8.27%
Payroll Weighted Average 13.10% 13.05%
Normal Cost % 9.51% 9.09%
Prior Service % 3.59% 3.96%

Texas Municipal Retirement System
Section II
Actuarial Impact of Recommendations
17
Distribution of Impact on Rates (All Cities)
0
100
200
300
400
500
600
700
-1.60% -1.20% -1.00% -0.80% -0.60% -0.40% -0.20% 0.00% 0.20%
Distribution of Impact on Rates for Cities with 100 or More Actives
0
20
40
60
80
100
120
140
160
180
200
-1.00% -0.80% -0.60% -0.40% -0.20% 0.00%

SECTION III
S U MMA RY OF N EW A S S UM P TIO N S
Texas Municipal Retirement System
Section III
Summary of New Assumptions
19
SUMMARY OF ACTUARIAL METHODS AND ASSUMPTIONS REGARDING
MORTALITY
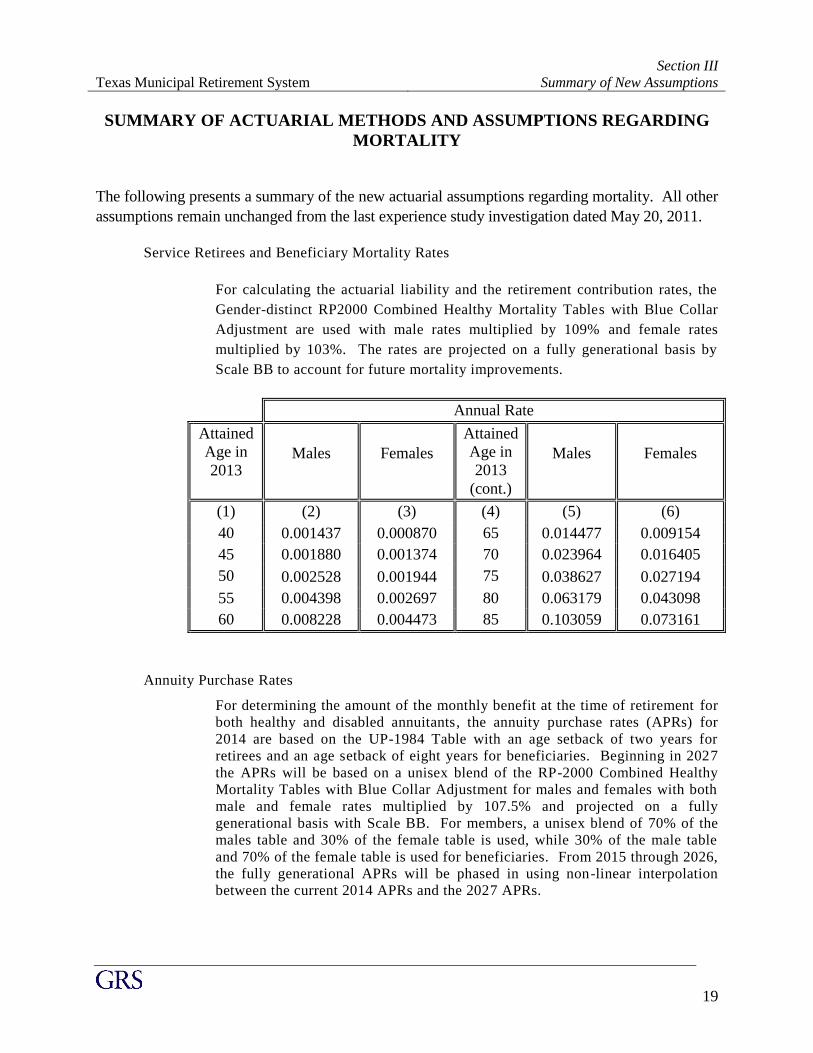
The following presents a summary of the new actuarial assumptions regarding mortality. All other
assumptions remain unchanged from the last experience study investigation dated May 20, 2011.
Service Retirees and Beneficiary Mortality Rates
For calculating the actuarial liability and the retirement contribution rates, the
Gender-distinct RP2000 Combined Healthy Mortality Tables with Blue Collar
Adjustment are used with male rates multiplied by 109% and female rates
multiplied by 103%. The rates are projected on a fully generational basis by
Scale BB to account for future mortality improvements.
Annual Rate
Attained
Age in
2013
Males
Females
Attained
Age in
2013
(cont.)
Males
Females
(1) (2) (3) (4) (5) (6)
40 0.001437 0.000870 65 0.014477 0.009154
45 0.001880 0.001374 70 0.023964 0.016405
50 0.002528 0.001944 75 0.038627 0.027194
55 0.004398 0.002697 80 0.063179 0.043098
60 0.008228 0.004473 85 0.103059 0.073161
Annuity Purchase Rates
For determining the amount of the monthly benefit at the time of retirement for
both healthy and disabled annuitants, the annuity purchase rates (APRs) for
2014 are based on the UP-1984 Table with an age setback of two years for
retirees and an age setback of eight years for beneficiaries. Beginning in 2027
the APRs will be based on a unisex blend of the RP-2000 Combined Healthy
Mortality Tables with Blue Collar Adjustment for males and females with both
male and female rates multiplied by 107.5% and projected on a fully
generational basis with Scale BB. For members, a unisex blend of 70% of the
males table and 30% of the female table is used, while 30% of the male table
and 70% of the female table is used for beneficiaries. From 2015 through 2026,
the fully generational APRs will be phased in using non-linear interpolation
between the current 2014 APRs and the 2027 APRs.

SECTION IV
S U MMA RY OF D ATA A N D EX P ER IEN C E
Texas Municipal Retirement System
Section IV
Summary of Data and Experience
21
List of Tables
POST- RETIREMENT MORTALITY EXPERIENCE - UNISEX ....................................................................... 22
POST-RETIREMENT MORTALITY EXPERIENCE FOR NON-DISABLED FEMALE RETIREES ......................... 23
POST-RETIREMENT MORTALITY EXPERIENCE FOR NON-DISABLED MALE RETIREES ............................. 24
MALE LIFE EXPECTANCIES AT GIVEN AGES ........................................................................................... 25
FEMALE LIFE EXPECTANCIES AT GIVEN AGES ....................................................................................... 25 59
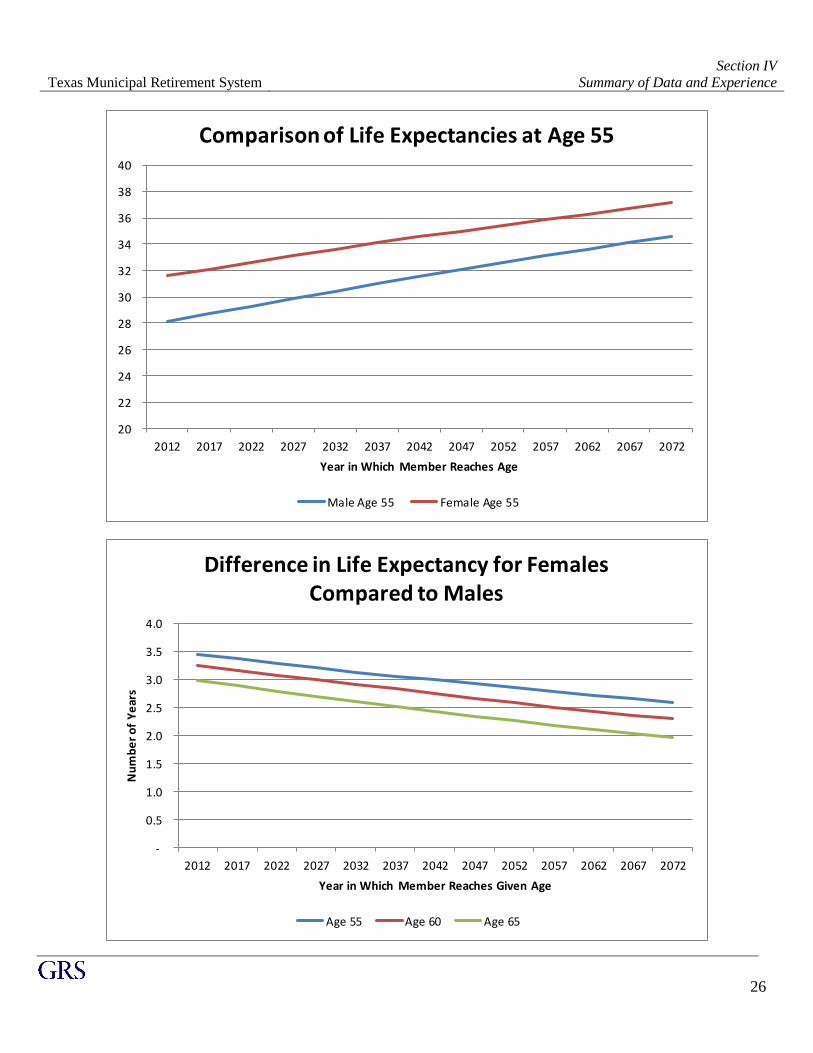
COMPARISON OF LIFE EXPECTANCIES AT AGE 55 ................................................................................. 26
DIFFERENCE IN LIFE EXPECTANCY FOR FEMALES COMPARED TO MALES ............................................. 26
Texas Municipal Retirement System
Section IV
Summary of Data and Experience
22
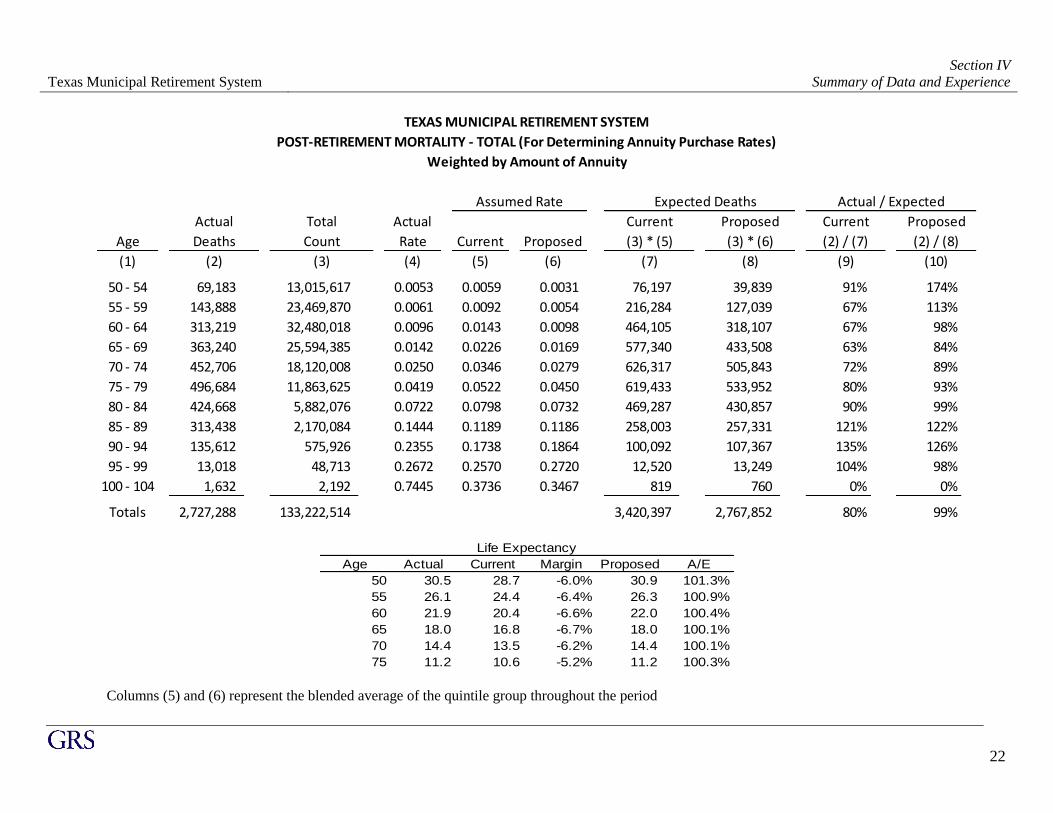
TEXAS MUNICIPAL RETIREMENT SYSTEM
POST-RETIREMENT MORTALITY - TOTAL (For Determining Annuity Purchase Rates)
Assumed Rate Expected Deaths Actual / Expected
Actual Total Actual Current Proposed Current Proposed
Age Deaths Count Rate Current Proposed (3) * (5) (3) * (6) (2) / (7) (2) / (8)
(1) (2) (3) (4) (5) (6) (7) (8) (9) (10)
50 - 54 69,183 13,015,617 0.0053 0.0059 0.0031 76,197 39,839 91% 174%
55 - 59 143,888 23,469,870 0.0061 0.0092 0.0054 216,284 127,039 67% 113%
60 - 64 313,219 32,480,018 0.0096 0.0143 0.0098 464,105 318,107 67% 98%
65 - 69 363,240 25,594,385 0.0142 0.0226 0.0169 577,340 433,508 63% 84%
70 - 74 452,706 18,120,008 0.0250 0.0346 0.0279 626,317 505,843 72% 89%
75 - 79 496,684 11,863,625 0.0419 0.0522 0.0450 619,433 533,952 80% 93%
80 - 84 424,668 5,882,076 0.0722 0.0798 0.0732 469,287 430,857 90% 99%
85 - 89 313,438 2,170,084 0.1444 0.1189 0.1186 258,003 257,331 121% 122%
90 - 94 135,612 575,926 0.2355 0.1738 0.1864 100,092 107,367 135% 126%
95 - 99 13,018 48,713 0.2672 0.2570 0.2720 12,520 13,249 104% 98%
100 - 104 1,632 2,192 0.7445 0.3736 0.3467 819 760 0% 0%
Totals 2,727,288 133,222,514 3,420,397 2,767,852 80% 99%
Weighted by Amount of Annuity
Age Actual Current Margin Proposed A/E
50 30.5 28.7 -6.0% 30.9 101.3%
55 26.1 24.4 -6.4% 26.3 100.9%
60 21.9 20.4 -6.6% 22.0 100.4%
65 18.0 16.8 -6.7% 18.0 100.1%
70 14.4 13.5 -6.2% 14.4 100.1%
75 11.2 10.6 -5.2% 11.2 100.3%
Life Expectancy
Columns (5) and (6) represent the blended average of the quintile group throughout the period
Texas Municipal Retirement System
Section IV
Summary of Data and Experience
23
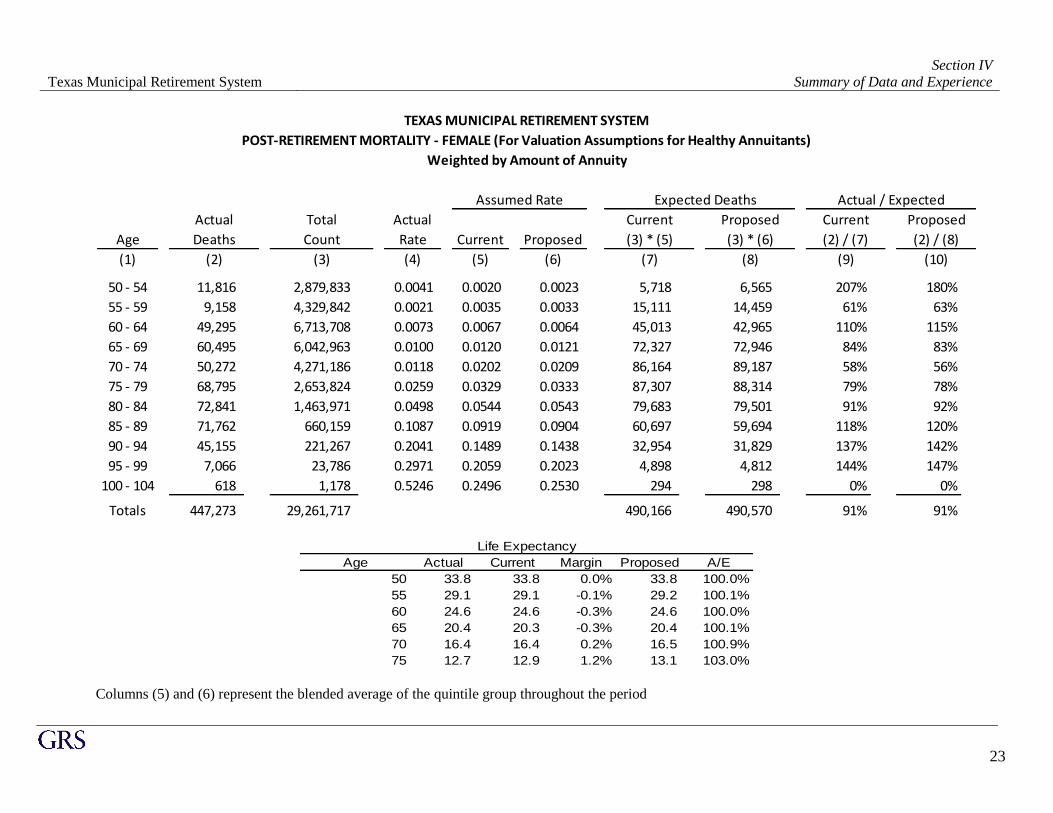
TEXAS MUNICIPAL RETIREMENT SYSTEM
POST-RETIREMENT MORTALITY - FEMALE (For Valuation Assumptions for Healthy Annuitants)
Assumed Rate Expected Deaths Actual / Expected
Actual Total Actual Current Proposed Current Proposed
Age Deaths Count Rate Current Proposed (3) * (5) (3) * (6) (2) / (7) (2) / (8)
(1) (2) (3) (4) (5) (6) (7) (8) (9) (10)
50 - 54 11,816 2,879,833 0.0041 0.0020 0.0023 5,718 6,565 207% 180%
55 - 59 9,158 4,329,842 0.0021 0.0035 0.0033 15,111 14,459 61% 63%
60 - 64 49,295 6,713,708 0.0073 0.0067 0.0064 45,013 42,965 110% 115%
65 - 69 60,495 6,042,963 0.0100 0.0120 0.0121 72,327 72,946 84% 83%
70 - 74 50,272 4,271,186 0.0118 0.0202 0.0209 86,164 89,187 58% 56%
75 - 79 68,795 2,653,824 0.0259 0.0329 0.0333 87,307 88,314 79% 78%
80 - 84 72,841 1,463,971 0.0498 0.0544 0.0543 79,683 79,501 91% 92%
85 - 89 71,762 660,159 0.1087 0.0919 0.0904 60,697 59,694 118% 120%
90 - 94 45,155 221,267 0.2041 0.1489 0.1438 32,954 31,829 137% 142%
95 - 99 7,066 23,786 0.2971 0.2059 0.2023 4,898 4,812 144% 147%
100 - 104 618 1,178 0.5246 0.2496 0.2530 294 298 0% 0%
Totals 447,273 29,261,717 490,166 490,570 91% 91%
Weighted by Amount of Annuity
Age Actual Current Margin Proposed A/E
50 33.8 33.8 0.0% 33.8 100.0%
55 29.1 29.1 -0.1% 29.2 100.1%
60 24.6 24.6 -0.3% 24.6 100.0%
65 20.4 20.3 -0.3% 20.4 100.1%
70 16.4 16.4 0.2% 16.5 100.9%
75 12.7 12.9 1.2% 13.1 103.0%
Life Expectancy
Columns (5) and (6) represent the blended average of the quintile group throughout the period

Texas Municipal Retirement System
Section IV
Summary of Data and Experience
24
TEXAS MUNICIPAL RETIREMENT SYSTEM
POST-RETIREMENT MORTALITY - MALE (For Valuation Assumptions for Healthy Annuitants)
Assumed Rate Expected Deaths Actual / Expected
Actual Total Actual Current Proposed Current Proposed
Age Deaths Count Rate Current Proposed (3) * (5) (3) * (6) (2) / (7) (2) / (8)
(1) (2) (3) (4) (5) (6) (7) (8) (9) (10)
50 - 54 57,367 10,135,784 0.0057 0.0026 0.0033 26,399 33,497 217% 171%
55 - 59 134,730 19,140,028 0.0070 0.0046 0.0060 87,894 115,708 153% 116%
60 - 64 263,924 25,766,310 0.0102 0.0085 0.0108 218,578 278,736 121% 95%
65 - 69 302,745 19,551,422 0.0155 0.0153 0.0184 299,958 359,913 101% 84%
70 - 74 402,434 13,848,822 0.0291 0.0260 0.0301 360,200 416,231 112% 97%
75 - 79 427,889 9,209,801 0.0465 0.0444 0.0486 408,801 447,339 105% 96%
80 - 84 351,827 4,418,105 0.0796 0.0765 0.0790 337,851 348,850 104% 101%
85 - 89 241,676 1,509,925 0.1601 0.1290 0.1271 194,846 191,913 124% 126%
90 - 94 90,457 354,659 0.2551 0.2022 0.1987 71,721 70,466 126% 128%
95 - 99 5,952 24,927 0.2388 0.2835 0.2918 7,068 7,273 84% 82%
100 - 104 1,014 1,014 1.0000 0.3432 0.3649 348 370 0% 0%
Totals 2,280,015 103,960,797 2,013,664 2,270,296 113% 100%
Weighted by Amount of Annuity
Age Actual Current Margin Proposed A/E
50 29.7 31.1 4.7% 30.1 101.3%
55 25.4 26.5 4.4% 25.6 100.8%
60 21.3 22.1 3.6% 21.3 100.2%
65 17.4 17.9 2.6% 17.4 99.7%
70 13.9 14.1 1.3% 13.9 99.4%
75 10.8 10.8 -0.7% 10.7 99.2%
Life Expectancy
Columns (5) and (6) represent the blended average of the quintile group throughout the period
Texas Municipal Retirement System
Section IV
Summary of Data and Experience
25
-
5
10
15
20
25
30
35
40
50 55 60 65 70 75 80
Female Life Expectancy at Given Ages
Current Actual Proposed
-
5
10
15
20
25
30
35
50 55 60 65 70 75 80
Male Life Expectancy at Given Ages
Actual Curent Proposed
Texas Municipal Retirement System
Section IV
Summary of Data and Experience
26
20
22
24
26
28
30
32
34
36
38
40
2012 2017 2022 2027 2032 2037 2042 2047 2052 2057 2062 2067 2072
Year in Which Member Reaches Age
Comparison of Life Expectancies at Age 55
Male Age 55 Female Age 55
-
0.5
1.0
1.5
2.0
2.5
3.0
3.5
4.0
2012 2017 2022 2027 2032 2037 2042 2047 2052 2057 2062 2067 2072
Nu
mb
er
of
Ye
ars
Year in Which Member Reaches Given Age
Difference in Life Expectancy for Females Compared to Males
Age 55 Age 60 Age 65


