Morphology and Physical/End-Use Properties of Recycled Polypropylene-Corn Cob Powder Composites
Chukwudike Onuoha1,a*, Okechukwu Onyemaobi2,b, Charles Anyakwo3,c and Genevieve Onuegbu4,d
1-3Department of Materials and Metallurgical Engineering, Federal University of Technology, Owerri, Nigeria
4Department of Polymer and Textile Engineering, Federal University of Technology, Owerri, Nigeria
a*[email protected], [email protected], [email protected], [email protected]
Keywords: Recycled Polypropylene, Morphology, Physical Properties, Composites, Corn Cob, Spherulites
Abstract. This study investigates the morphological and physical/end-use properties of corn cob
powder-filled recycled polypropylene composites. The composites were prepared by incorporating
corn cob powder of particle sizes 150 µm, 300 µm and 425 µm respectively at filler loadings of 5 to
25 wt%. The properties were determined according to standard test procedures. Results showed that
the incorporation of corn cob powder as filler resulted to enhancement of water absorption and
solvent sorption, which were found to increase with both increase in filler loading and increase in
filler particle size, probably due to the hydrophilic nature of corn cob powder. It was also
discovered that solvent sorption was most pronounced with benzene, followed by toluene and lastly
xylene, in accordance with the relative proximity of their solubility parameters to that of
polypropylene. Flame propagation rate was also found to improve by the incorporation of corn cob
powder due to its high content of cellulose, a combustible organic matter. However, specific
gravities of the composites were found to be lower than for the unfilled polypropylene, an
implication that the composites produced are lighter in weight than the unfilled. Specific gravity
increased with increase in filler loading but decreased with increase in particle size. The
Morphological studies showed increase in the number of spherulites with increase in filler loading
and increase in the size of the spherulites with increase in particle size. Further observation showed
that the particle sizes and pores sizes detected increased with increase in filler particle size probably
due to poor interaction and distribution of coarse particles. It is hoped that this present study will to
help place the usefulness of corn cob as filler in the development of thermoplastic composites in
future and develop its niche in the scientific record.
Introduction
There is a growing interest in the use of natural/bio-fibers/fillers as reinforcements for
biodegradable polymers because natural/bio-fibers/fillers have the functional capability to substitute
for glass fibers. Furthermore, rising oil prices and increased activity in regards to environmental
pollution prevention have also pushed recent research and development of biodegradable polymers.
In light of petroleum shortages and pressures for decreasing the dependence on petroleum products,
there is an increasing interest in maximizing the use of renewable materials. The use of agricultural
resources as source of raw materials to the industry not only provides a renewable source, but could
also generate a non-food source of economic development for farming and rural areas. Appropriate
research and development in the area of agricultural based fillers/fibers filled plastics could lead to
new value-added, non-food uses of agricultural materials. The cost of natural fibers are in general
less than the plastic, and thus high fiber loading can result in significant material cost savings. The
cost of compounding is unlikely to be much more than for conventional mineral/inorganic based
presently used by plastics industry. Significant environmental advantages include: preservation of
International Journal of Engineering and Technologies Submitted: 2017-03-20ISSN: 2297-623X, Vol. 11, pp 1-12 Revised: 2017-05-29doi:10.18052/www.scipress.com/IJET.11.1 Accepted: 2017-07-04© 2017 SciPress Ltd., Switzerland Online: 2017-07-13
SciPress applies the CC-BY 4.0 license to works we publish: https://creativecommons.org/licenses/by/4.0/

fossil-based raw materials; complete biological degradability; reduction in the volume of refuse;
reduction of carbon dioxide released to the atmosphere; as well as increased utilization of
agricultural resources. The most important advantages of using polymers are, ease of processing,
high productivity and low cost, in combination with their versatility [1].
However, there are some drawbacks too, such as low microbial resistance, high moisture
absorption of natural fibers that can result in swelling of the fibres which arouse concern about the
dimensional stability of the agro or natural fibre composites. Other than that, the main drawback of
the use of natural fibre as fillers is the low processing temperature permissible due to the possibility
of fibre degradation and/or the possibility of volatile emissions that could affect the composite
properties. Agro-residue or field crop such as cereal straw, flax straw, rice husk, bagasse, cornstalk,
wheat straw and corncob which categorized as natural fibres are recently being considered as an
alternative for the wood-plastic composites which are at present dominating the natural fibre-
composite market [2,3].
The addition of fillers to polypropylene would generally have some positive effect on its
mechanical properties but even such, some drawbacks are also bound to be as most fillers and
reinforcements are polar and polypropylene being a non-polar, it will result to poor adhesion
between the filler and the polymer. This incompatibility will lead to poor dispersion and insufficient
reinforcement with accompanying poor mechanical properties. Thus, solution to solve this problem
would be incorporating a compatibilizer [2,4].
Plastic waste is a major component of global municipal solid waste and presents a promising
raw material source for composite production. Hence, the development of new value-added
products, with the aim of utilizing agro wastes and low cost recycled thermoplastics (which would
otherwise be added to landfills) is assuming greater importance [5].
Plastic industry uses inorganic fillers such as talc, calcium carbonate, mica and glass or
carbon fibres to modify the performance of thermoplastics. Inorganic fillers provide rigidity and
temperature resistance; however, these fillers are costly and abrasive to the processing equipment
[6].
Recently, organic fillers produced from agricultural wastes have gained tremendous attention
from plastic industry. The primary advantages of using organic fillers in thermoplastics can be
listed as low densities, low cost, non-abrasiveness, high filling levels, low energy consumption,
biodegradability, availability of a wide variety of fibres throughout the world and generation of a
rural/agricultural-based economy [7].
Corncob (CC), also spelled corn cob, is the central core of an ear of maize (Zea mays sp.). It
is the part of the ear on which the kernels grow. The ear is also considered a "cob" or "pole" but it is
not fully a "pole" until the ear is shucked, or removed from the plant material around the ear [8].
The innermost part of the cob is white and has a consistency similar to foam plastic.
Corn cob is a lignocellulosic material composed of cellulose (38.8% + 2.5%), hemicellulose
(44.4% + 5.2%) and lignin (11.9% +�2.3%). These polymeric fibres consist of monomeric
molecules. Cellulose is built of C6 sugars; hemicellulose mainly of the C5; sugars xylose and
arabinose and lignin consists of phenolic macromolecules [9].
Corncobs find use as industrial source of the chemical furfural, fibre in fodder for ruminant
livestock (despite low nutritional value), thickeners that can be added to soup stock or made into
traditional sweetened corncob jelly, bedding for animals as cobs absorb moisture and provide a
compliant surface, a mild abrasive for cleaning building surfaces, when coarsely ground, biofuel
and charcoal production [10,8].
Much research efforts are geared towards possible ways of recycling wastes for reuse to keep
environment clean and safe. Corn cobs are available in abundance, nontoxic, biodegradable and
cheap. Hence, the use of corn cob in producing recycled polypropylene composites is therefore
hoped to convert wastes to wealth, tackle the problem of environmental pollution, reduce the
material cost and produce biodegradable composites.
2 Volume 11

Materials and Methods
Polypropylene (PP) used in this research was a product of SK Global Chemicals Limited,
Korea obtained from CeePlast Limited Aba, Abia State. It has a melt flow index of 0.4g/10 min at
230 0C and density of 0.922g/cm
3.
Recycled polypropylene was sourced from Ihiagwa village, Owerri West L.G.A., Imo State
and was thoroughly washed, dried and sliced to tiny pieces.
The compartibilizer; maleic anhydride-grafted-polyethylene (MAPE) used was bought from
CEEPlast Industry, Aba, a product of Sigma Aldarich Company, U.S.A. It has the following
properties: maleic anhydride = 0.5 wt%, viscosity = 500 cP (140 0C) and saponification value =
60 KOH/g.
Corn cobs were sourced locally from Iyalu Ibere, Ikwuano Local Government Area of Abia
State, Nigeria. The cobs were properly cleaned, dried, ground and sieved to three sieve sizes namely
150, 300 and 425 μm.
Preparation of Polypropylene Composites
The polypropylene composites of corn cob powder were prepared by thoroughly mixing 100g
of virgin polypropylene and 100g of recycled polypropylene with appropriate filler contents (5, 10,
15, 20 and 25 wt%). Two control samples were prepared; (1) by using 200 g of virgin PP only and
(2) by mixing 100 g of virgin PP and 100 g of recycled PP without the addition of any filler as
shown in Table 1.
Table 1. Composition of Evaluated Formulations.
Code Virgin PP
(g)
Recycled PP
(g)
CC
(wt%)
V (Control 1) 200 0 0
VR (Control 2) 100 100 0
C1 100 100 5
C2 100 100 10
C3 100 100 15
C4 100 100 20
C5 100 100 25
Each mixture was melted and homogenized with the filler in an injection moulding machine.
The operation was carried out at an injection pressure of 100 kgf/cm2 (9.81 MPa) and temperature
of 200 0C. The mixture was then extruded as sheets with dimensions of 150 x 150 x 4mm. Test
samples were prepared from the sheets for the physical properties testing. This was done for the
three particle sizes studied.
Determination of Specific Gravity (Relative Density) Test
The hydrostatic weighing method was used in this test. Since the samples float and do not
sink in water unaided, a less dense liquid such as gasoline was used for this test instead of water. A
massless thread was used in suspending the specimens in air and gasoline during measurement by
means of a sensitive spring balance. The test specimen was first weighed in air to obtain the weight
in air (𝑊𝑠,𝑎𝑖𝑟) and later immersed in gasoline to obtain the weight in gasoline (𝑊𝑠,𝑔𝑎𝑠.). The specific
gravity of the specimen with respect to gasoline was calculated as follows:
𝑆𝑝𝑒𝑐𝑖𝑓𝑖𝑐 𝑔𝑟𝑎𝑣𝑖𝑡𝑦 𝑤𝑟𝑡 𝑔𝑎𝑠𝑜𝑙𝑖𝑛𝑒, 𝑆𝐺𝑤𝑟𝑡𝑔𝑎𝑠. =𝑊𝑠,𝑎𝑖𝑟
𝑊𝑠,𝑎𝑖𝑟−𝑊𝑠,𝑔𝑎𝑠. (1)
International Journal of Engineering and Technologies Vol. 11 3

The actual specific gravity of the sample (i.e. relative to water) was calculated by multiplying
equation (1) with the specific gravity of gasoline
𝑆𝑝𝑒𝑐𝑖𝑓𝑖𝑐 𝑔𝑟𝑎𝑣𝑖𝑡𝑦 𝑜𝑓 𝑠𝑎𝑚𝑝𝑙𝑒, 𝑆𝐺 = (𝑊𝑠,𝑎𝑖𝑟
𝑊𝑠,𝑎𝑖𝑟−𝑊𝑠,𝑔𝑎𝑠.) × 0.74 (2)
where the specific gravity of gasoline = 0.74.
Determination of Water Absorption
This was determined according to ASTM procedure (ASTM D96-06). Rectangular specimens
were cut from each sample and weighed to the nearest 0.001g. The samples were immersed in water
for 24 hours at room temperature. Excess water on sample surface was removed before reweighing.
The percentage increase in mass during immersion was calculated to the nearest 0.01% using the
following equation:
AW (%) = Weight after 24 hrs – initial weight
𝑖𝑛𝑖𝑡𝑖𝑎𝑙 𝑤𝑒𝑖𝑔ℎ𝑡 x
100
1 (3)
Determination of Flame Retardant Property
This was determined using a modification of ASTM D 4804. A 10 mm mark was measured
and marked out on each of the cut samples. The specimen was then clamped horizontally on a retort
stand with the marked 10 mm distance protruding out of the clamp. The free end of each sample
was ignited and the time taken for the sample to ignite recorded as the ignition time (It). The sample
was allowed to burn to the 10 mm mark (Dp) and the propagation time (Ip) was recorded. The rate of
burning was calculated using the equation:
Rate of burning (mm/s) = 𝐷𝑃
𝑃𝑡 − 𝐼𝑡 (4)
where Dp = Propagation distance (mm), Pt = Flame propagation time (s), It = Ignition time (s).
Determination of Solvent Sorption (Swelling Behaviour)
Samples were cut from the composites, weighed, labeled and put into 3 sample bottles labeled
B, T and X. Thirty millilitres of benzene, toluene and xylene were respectively poured into the
sample bottles. The set-up was left at room temperature for 24 hours. At expiration, each sample
was removed from the bottle. The solvents adhering to the surface of the samples were carefully
wiped out using filter papers. The net sample was weighed and recorded as follows:
M1 = Mass of dry sample (g)
M2 = Mass of wet sample (g)
∆M = Change in mass (M2 – M1) (g)
The molar percentage uptake of each solvent per gram of the composite (Qt) was calculated using
the formula:
Qt = (
𝑀𝑎𝑠𝑠 𝑜𝑓 𝑠𝑜𝑙𝑣𝑒𝑛𝑡
𝑀𝑜𝑙𝑎𝑟 𝑚𝑎𝑠𝑠 𝑜𝑓 𝑠𝑜𝑙𝑣𝑒𝑛𝑡)
𝐼𝑛𝑖𝑡𝑖𝑎𝑙 𝑀𝑎𝑠𝑠 𝑜𝑓 𝑠𝑜𝑙𝑢𝑡𝑒 𝑥
100
1
i.e.
Qt = (
∆𝑀
𝑀𝑜𝑙𝑎𝑟 𝑚𝑎𝑠𝑠 𝑜𝑓 𝑠𝑜𝑙𝑣𝑒𝑛𝑡)
𝑀1 𝑥
100
1 (5)
Morphological analysis was also carried out using Scanning Electron Microscope (Phenom:
product of Phenom World, Eindhoven, Netherlands; Model: ProX). The specimen was made
conductive by introducing a minimum of a 5nm gold onto it and then cut into 2 x 2 mm using a
sputter cutting machine. The sample was then placed on the column of the Scanning Electron
Microscope (SEM) where the image was focused on navigation camera and then transferred to
4 Volume 11
electron mode in accordance to the desired magnification e.g. 50, 80, 100 or 200µm. The samples
were thus analyzed to determine the microstructure of the composites, from which the distribution,
orientation and interaction of the fillers in the composite and the interfacial adhesion of the filler
and polymer matrix were examined.
Results and Discussion
Results of Physical and End-Use Properties: Specific Gravity, Water Absorption, Flame
Propagation and Solvent Sorption (Swelling Behaviour) as influenced by filler loading and filler
particle size are presented in Tables 2. The physical and end-use properties of the two controls are
also included in Tables 2, to serve as references for comparing the effect of filler loading and filler
particle size. It can be generally observed that all the physical and end-use properties investigated
increased with increase in filler loading, except flame propagation rate which decreased with
increase in filler loading. Furthermore, the general trend observed is that all the end-use properties
of the filled polypropylene composites (except specific gravity) are higher than those of the unfilled
polypropylene.
Table 2. Result of Physical and End-use properties of PP-CC Composites.
Sample
Code
Filler
Loading
(Wt %)
PHYSICAL AND END-USE PROPERTIES*
S.G
W.A
(%)
F.P
(mm/s)
S.S
(Mole %)/g
Benzene Toluene Xylene
150 µm
V 0 0.92 0.27 0.29 0.0546 0.0418 0.0372
VR 0 0.91 0.29 0.33 0.0546 0.0442 0.0381
C1 5 0.86 0.83 0.38 0.0546 0.0598 0.0433
C2 10 0.87 1.06 0.36 0.0781 0.0650 0.0457
C3 15 0.89 1.24 0.35 0.0837 0.0653 0.0517
C4 20 0.89 1.49 0.34 0.0839 0.0672 0.0574
C5 25 0.90 2.29 0.31 0.0915 0.0851 0.0631
300 µm
C6 5 0.84 1.19 0.36 0.0659 0.0690 0.0420
C7 10 0.85 1.58 0.35 0.0783 0.0634 0.0437
C8 15 0.86 2.17 0.33 0.0834 0.0691 0.0446
C9 20 0.88 2.26 0.29 0.0858 0.0736 0.0495
C10 25 0.89 2.70 0.26 0.0925 0.0903 0.0500
425 µm
C11 5 0.83 2.14 0.38 0.0729 0.0802 0.0450
C12 10 0.84 2.42 0.37 0.0858 0.0840 0.0592
C13 15 0.85 2.76 0.36 0.0914 0.0867 0.0650
C14 20 0.85 2.84 0.33 0.0946 0.0900 0.0677
C15 25 0.87 2.88 0.29 0.0962 0.0944 0.0704
*S.G = Specific Gravity, W.A = Water Absorption, F.P = Flame Propagation, S.S = Solvent
Sorption (Swelling Behaviour).
It can be seen from Table 2 that the initial increase or decrease in the physical and end-use
properties was as a result of the incorporation of the recycled PP into the virgin PP. This change in
behaviour (compare data for sample V and sample VR) is probably due to the fact that recycled PP
is less plastic and hence harder than virgin PP. Therefore, it can be said that the recycled PP acted
as filler. However, sample V was chosen here as the control since the effect of recycled PP is the
same on all the composites because they all contained the same amount of recycled PP.
International Journal of Engineering and Technologies Vol. 11 5
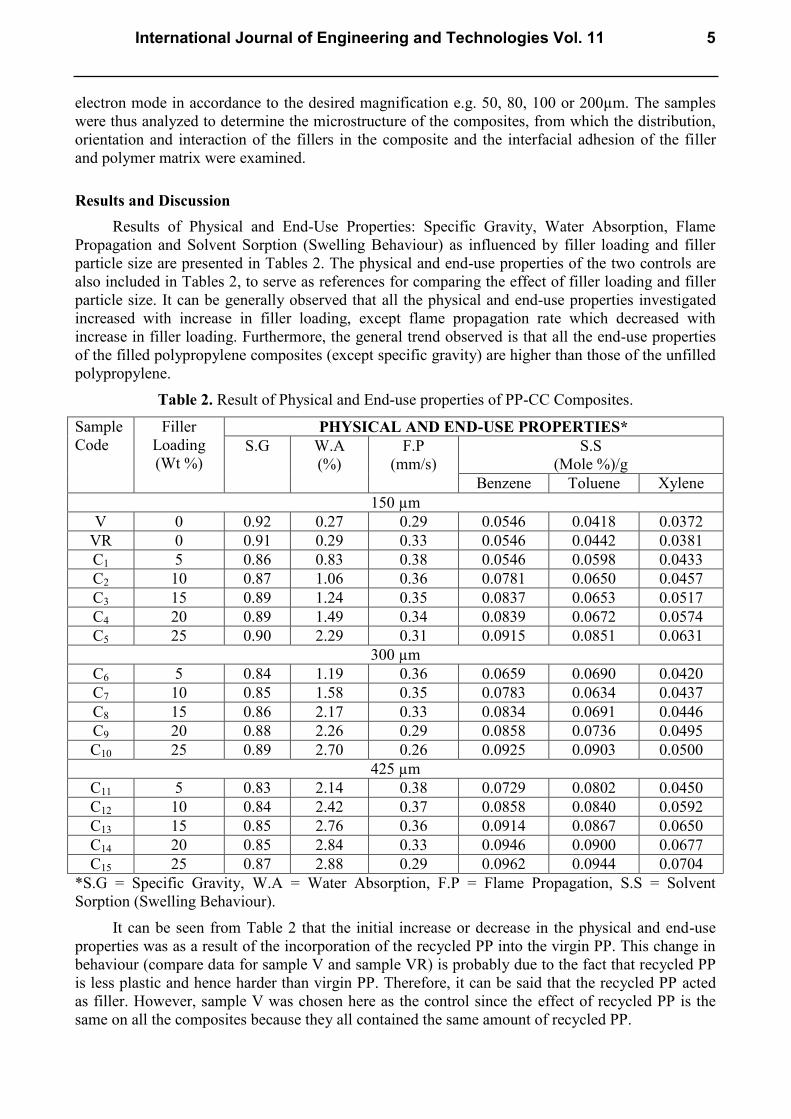
The result of specific gravity is shown in Fig. 1. From the result, it can be seen that the
specific gravities of the filled samples are lower than the control at all the filler loadings and filler
particle size studied. This can be attributed to the fact that Corn cob is lighter in weight and
occupies a substantial amount of space, resulting to lighter composites.
The increase in specific gravity with increase in filler loading is probably due to the better
distribution of the filler in the polymer matrix. The decrease in the specific gravity or relative
density with increase in the filler particle size is attributable to the greater uniform distribution of
the smaller sized fillers in the polymer matrix and the better packing efficiency of small particles
within the matrix. That is, more stuff was packed in the same volume compared to when large filler
particles were used. Large sized filler particles packed less efficiently and contributed less to the
density of the PP. This means that coarse filler particles led to poor dispersion of filler resulting in
agglomeration and consequent reduction in specific gravity, evident in the decrease of specific
gravity at larger particle sizes. This result is in agreement with earlier works carried out for bean
pod particulat. This work is in agreement with earlier works carried out by [11 and 12].
Figure 1. Variation of Specific Gravity with Filler Loading.
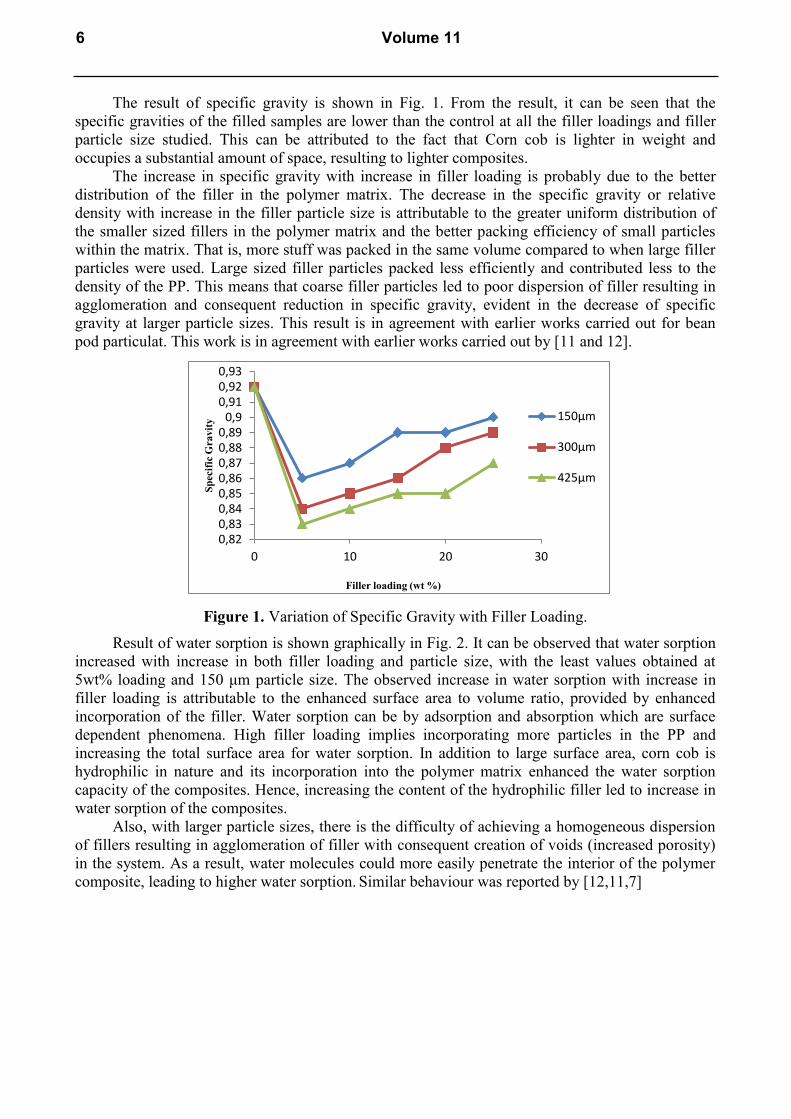
Result of water sorption is shown graphically in Fig. 2. It can be observed that water sorption
increased with increase in both filler loading and particle size, with the least values obtained at
5wt% loading and 150 μm particle size. The observed increase in water sorption with increase in
filler loading is attributable to the enhanced surface area to volume ratio, provided by enhanced
incorporation of the filler. Water sorption can be by adsorption and absorption which are surface
dependent phenomena. High filler loading implies incorporating more particles in the PP and
increasing the total surface area for water sorption. In addition to large surface area, corn cob is
hydrophilic in nature and its incorporation into the polymer matrix enhanced the water sorption
capacity of the composites. Hence, increasing the content of the hydrophilic filler led to increase in
water sorption of the composites.
Also, with larger particle sizes, there is the difficulty of achieving a homogeneous dispersion
of fillers resulting in agglomeration of filler with consequent creation of voids (increased porosity)
in the system. As a result, water molecules could more easily penetrate the interior of the polymer
composite, leading to higher water sorption. Similar behaviour was reported by [12,11,7]
0,820,830,840,850,860,870,880,890,9
0,910,920,93
0 10 20 30
Sp
ecif
ic G
ravit
y
Filler loading (wt %)
150µm
300µm
425µm
6 Volume 11
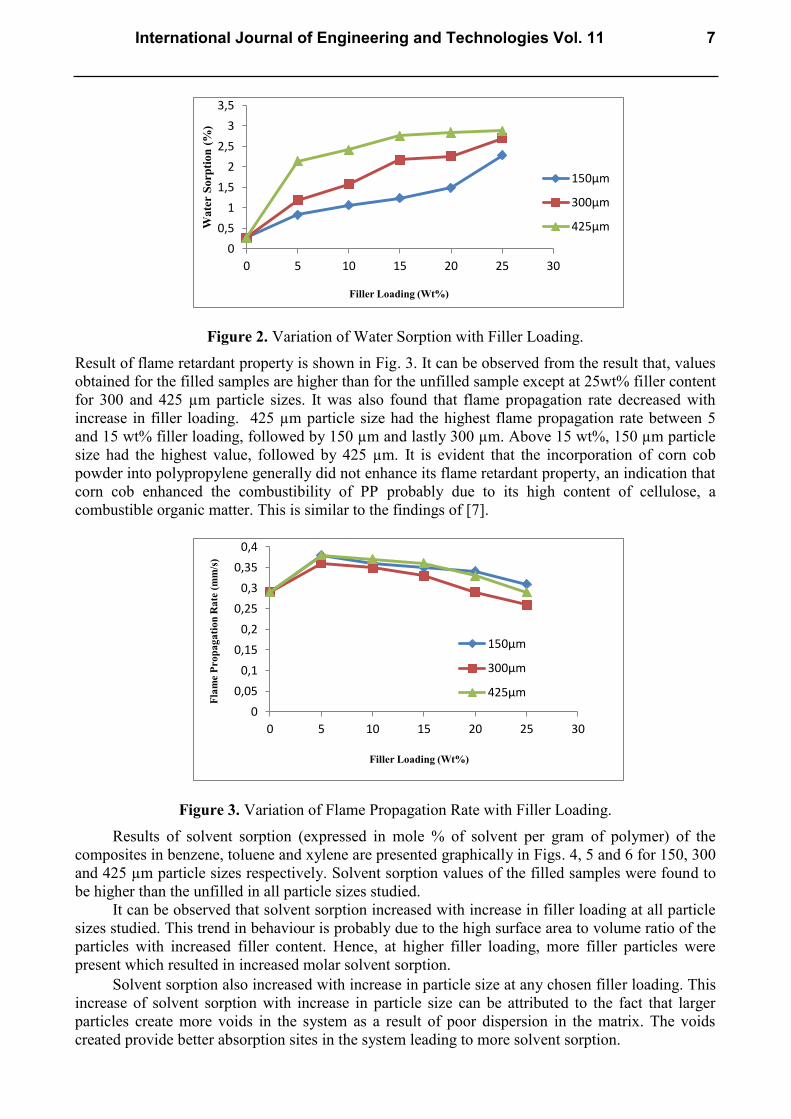
Figure 2. Variation of Water Sorption with Filler Loading.
Result of flame retardant property is shown in Fig. 3. It can be observed from the result that, values
obtained for the filled samples are higher than for the unfilled sample except at 25wt% filler content
for 300 and 425 µm particle sizes. It was also found that flame propagation rate decreased with
increase in filler loading. 425 µm particle size had the highest flame propagation rate between 5
and 15 wt% filler loading, followed by 150 µm and lastly 300 µm. Above 15 wt%, 150 µm particle
size had the highest value, followed by 425 µm. It is evident that the incorporation of corn cob
powder into polypropylene generally did not enhance its flame retardant property, an indication that
corn cob enhanced the combustibility of PP probably due to its high content of cellulose, a
combustible organic matter. This is similar to the findings of [7].
Figure 3. Variation of Flame Propagation Rate with Filler Loading.
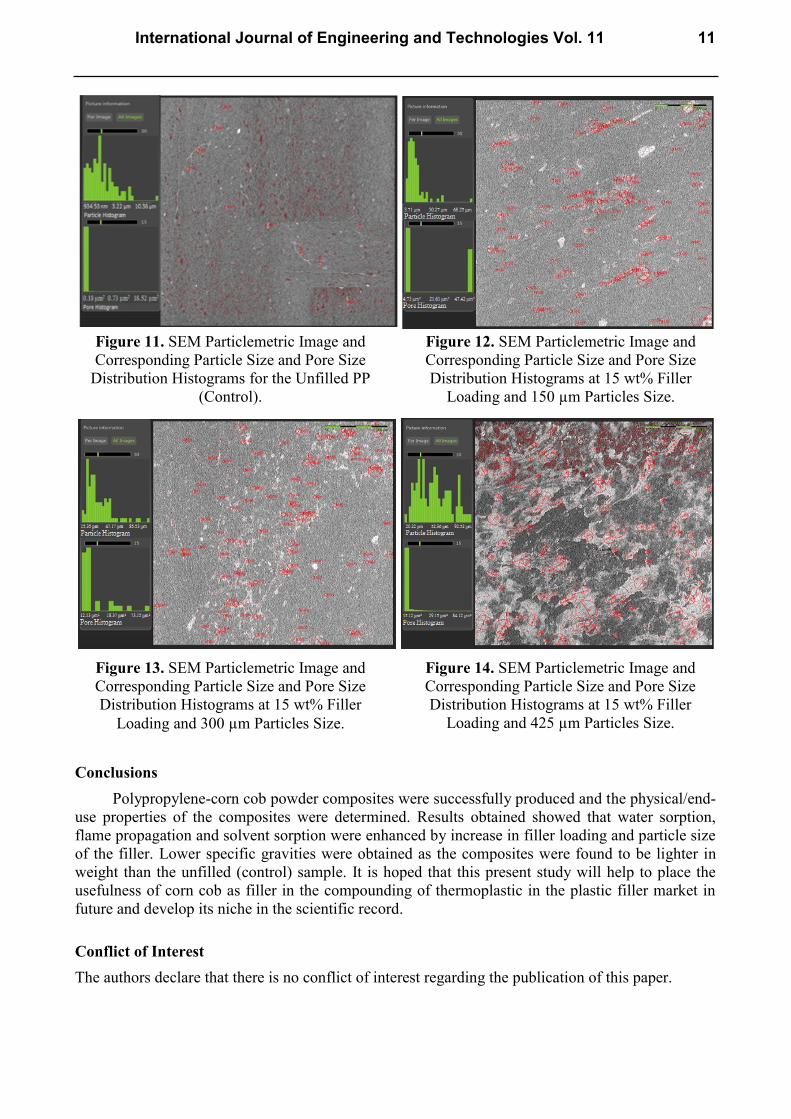
Results of solvent sorption (expressed in mole % of solvent per gram of polymer) of the
composites in benzene, toluene and xylene are presented graphically in Figs. 4, 5 and 6 for 150, 300
and 425 µm particle sizes respectively. Solvent sorption values of the filled samples were found to
be higher than the unfilled in all particle sizes studied.
It can be observed that solvent sorption increased with increase in filler loading at all particle
sizes studied. This trend in behaviour is probably due to the high surface area to volume ratio of the
particles with increased filler content. Hence, at higher filler loading, more filler particles were
present which resulted in increased molar solvent sorption.
Solvent sorption also increased with increase in particle size at any chosen filler loading. This
increase of solvent sorption with increase in particle size can be attributed to the fact that larger
particles create more voids in the system as a result of poor dispersion in the matrix. The voids
created provide better absorption sites in the system leading to more solvent sorption.
0
0,5
1
1,5
2
2,5
3
3,5
0 5 10 15 20 25 30
Wate
r S
orp
tion
(%
)
Filler Loading (Wt%)
150µm
300µm
425µm
0
0,05
0,1
0,15
0,2
0,25
0,3
0,35
0,4
0 5 10 15 20 25 30
Fla
me P
ro
pa
ga
tion
Ra
te (
mm
/s)
Filler Loading (Wt%)
150µm
300µm
425µm
International Journal of Engineering and Technologies Vol. 11 7
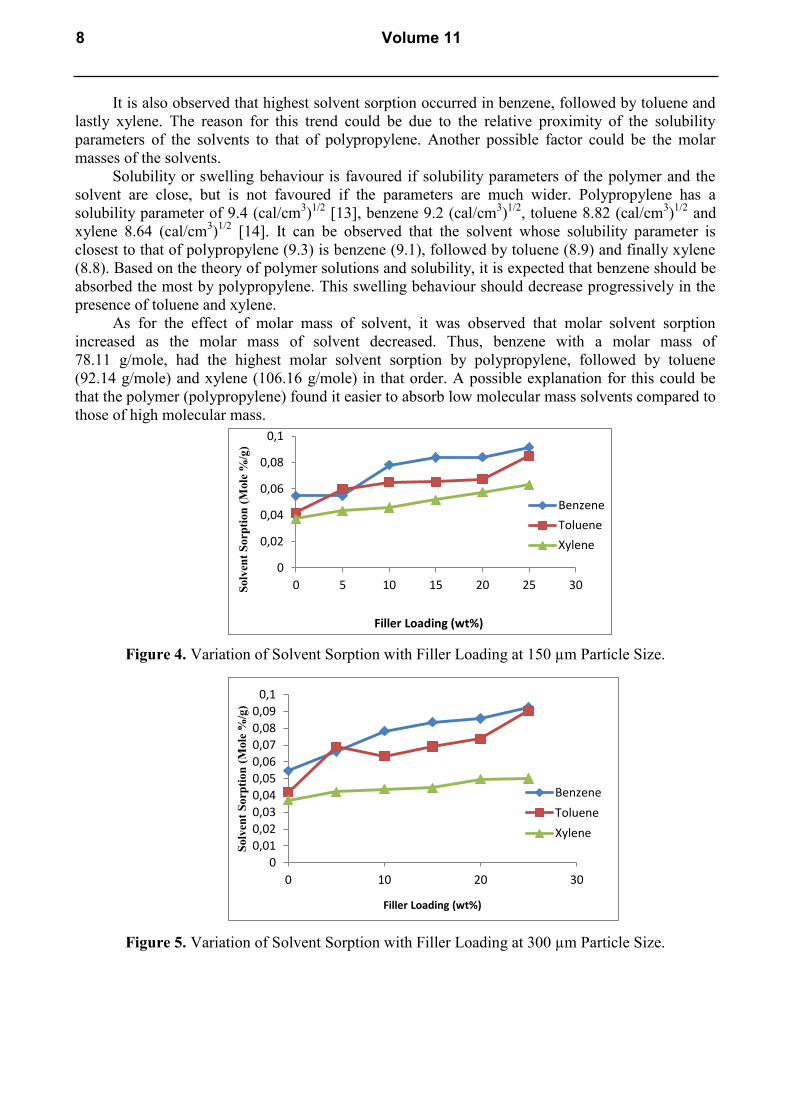
It is also observed that highest solvent sorption occurred in benzene, followed by toluene and
lastly xylene. The reason for this trend could be due to the relative proximity of the solubility
parameters of the solvents to that of polypropylene. Another possible factor could be the molar
masses of the solvents.
Solubility or swelling behaviour is favoured if solubility parameters of the polymer and the
solvent are close, but is not favoured if the parameters are much wider. Polypropylene has a
solubility parameter of 9.4 (cal/cm3)1/2
[13], benzene 9.2 (cal/cm3)1/2
, toluene 8.82 (cal/cm3)1/2
and
xylene 8.64 (cal/cm3)1/2
[14]. It can be observed that the solvent whose solubility parameter is
closest to that of polypropylene (9.3) is benzene (9.1), followed by toluene (8.9) and finally xylene
(8.8). Based on the theory of polymer solutions and solubility, it is expected that benzene should be
absorbed the most by polypropylene. This swelling behaviour should decrease progressively in the
presence of toluene and xylene.
As for the effect of molar mass of solvent, it was observed that molar solvent sorption
increased as the molar mass of solvent decreased. Thus, benzene with a molar mass of
78.11 g/mole, had the highest molar solvent sorption by polypropylene, followed by toluene
(92.14 g/mole) and xylene (106.16 g/mole) in that order. A possible explanation for this could be
that the polymer (polypropylene) found it easier to absorb low molecular mass solvents compared to
those of high molecular mass.
Figure 4. Variation of Solvent Sorption with Filler Loading at 150 µm Particle Size.
Figure 5. Variation of Solvent Sorption with Filler Loading at 300 µm Particle Size.
0
0,02
0,04
0,06
0,08
0,1
0 5 10 15 20 25 30Solv
ent
Sorp
tion
(M
ole
%/g
)
Filler Loading (wt%)
Benzene
Toluene
Xylene
0
0,01
0,02
0,03
0,04
0,05
0,06
0,07
0,08
0,09
0,1
0 10 20 30
Solv
ent
Sorp
tion
(M
ole
%/g
)
Filler Loading (wt%)
Benzene
Toluene
Xylene
8 Volume 11
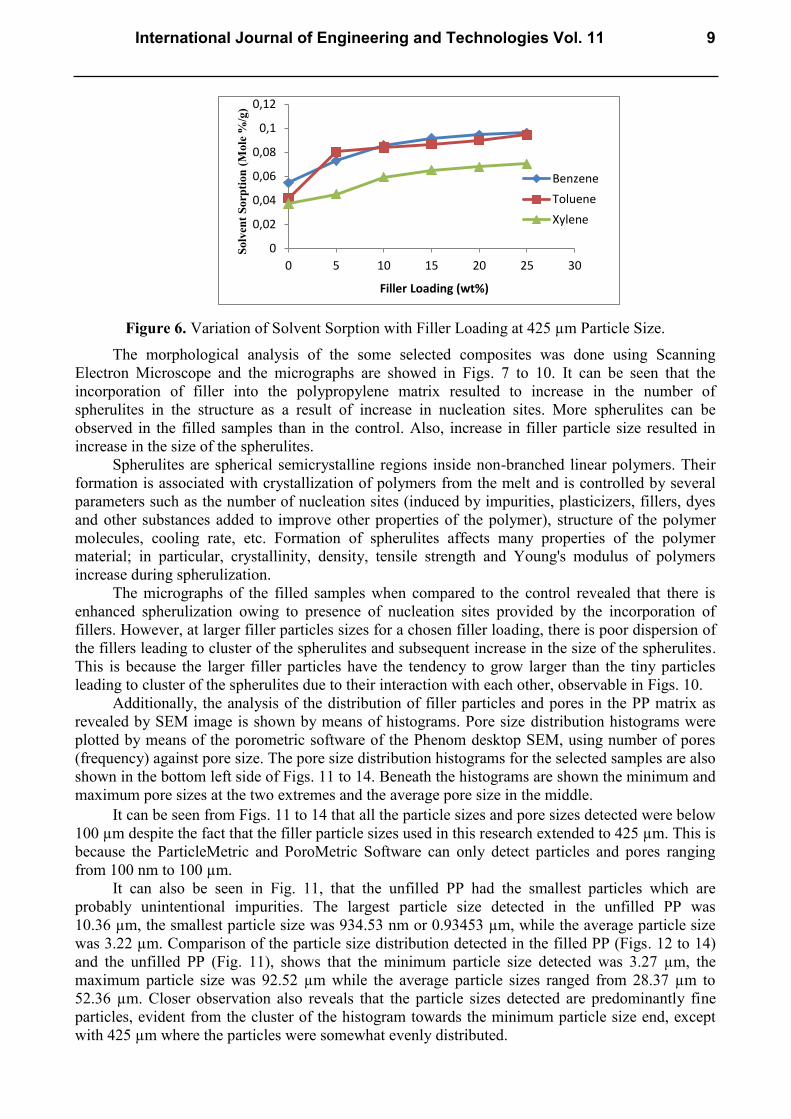
Figure 6. Variation of Solvent Sorption with Filler Loading at 425 µm Particle Size.
The morphological analysis of the some selected composites was done using Scanning
Electron Microscope and the micrographs are showed in Figs. 7 to 10. It can be seen that the
incorporation of filler into the polypropylene matrix resulted to increase in the number of
spherulites in the structure as a result of increase in nucleation sites. More spherulites can be
observed in the filled samples than in the control. Also, increase in filler particle size resulted in
increase in the size of the spherulites.
Spherulites are spherical semicrystalline regions inside non-branched linear polymers. Their
formation is associated with crystallization of polymers from the melt and is controlled by several
parameters such as the number of nucleation sites (induced by impurities, plasticizers, fillers, dyes
and other substances added to improve other properties of the polymer), structure of the polymer
molecules, cooling rate, etc. Formation of spherulites affects many properties of the polymer
material; in particular, crystallinity, density, tensile strength and Young's modulus of polymers
increase during spherulization.
The micrographs of the filled samples when compared to the control revealed that there is
enhanced spherulization owing to presence of nucleation sites provided by the incorporation of
fillers. However, at larger filler particles sizes for a chosen filler loading, there is poor dispersion of
the fillers leading to cluster of the spherulites and subsequent increase in the size of the spherulites.
This is because the larger filler particles have the tendency to grow larger than the tiny particles
leading to cluster of the spherulites due to their interaction with each other, observable in Figs. 10.
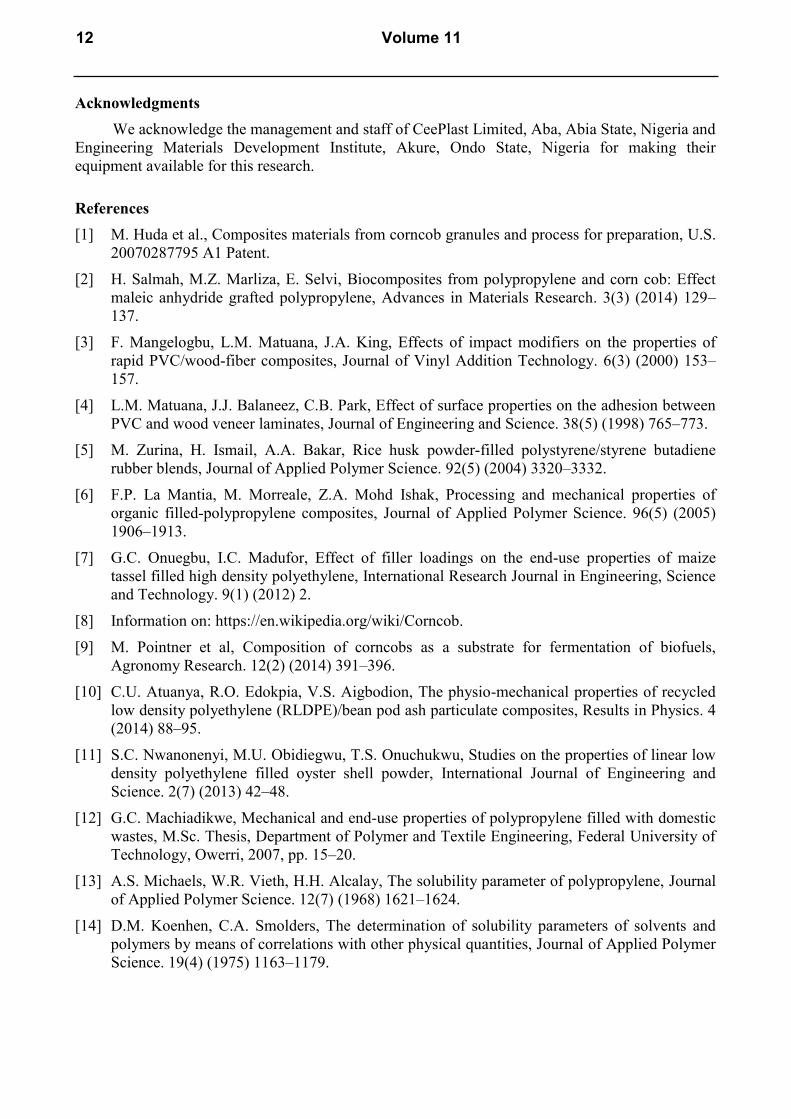
Additionally, the analysis of the distribution of filler particles and pores in the PP matrix as
revealed by SEM image is shown by means of histograms. Pore size distribution histograms were
plotted by means of the porometric software of the Phenom desktop SEM, using number of pores
(frequency) against pore size. The pore size distribution histograms for the selected samples are also
shown in the bottom left side of Figs. 11 to 14. Beneath the histograms are shown the minimum and
maximum pore sizes at the two extremes and the average pore size in the middle.
It can be seen from Figs. 11 to 14 that all the particle sizes and pore sizes detected were below
100 µm despite the fact that the filler particle sizes used in this research extended to 425 µm. This is
because the ParticleMetric and PoroMetric Software can only detect particles and pores ranging
from 100 nm to 100 µm.
It can also be seen in Fig. 11, that the unfilled PP had the smallest particles which are
probably unintentional impurities. The largest particle size detected in the unfilled PP was
10.36 µm, the smallest particle size was 934.53 nm or 0.93453 µm, while the average particle size
was 3.22 µm. Comparison of the particle size distribution detected in the filled PP (Figs. 12 to 14)
and the unfilled PP (Fig. 11), shows that the minimum particle size detected was 3.27 µm, the
maximum particle size was 92.52 µm while the average particle sizes ranged from 28.37 µm to
52.36 µm. Closer observation also reveals that the particle sizes detected are predominantly fine
particles, evident from the cluster of the histogram towards the minimum particle size end, except
with 425 µm where the particles were somewhat evenly distributed.
0
0,02
0,04
0,06
0,08
0,1
0,12
0 5 10 15 20 25 30
Solv
ent
Sorp
tion
(M
ole
%/g
)
Filler Loading (wt%)
Benzene
Toluene
Xylene
International Journal of Engineering and Technologies Vol. 11 9

Similarly, it can be seen in Fig. 11, that the unfilled PP had the smallest pores probably due to
lack of filler. The largest pore size detected in the unfilled PP was 18.52 µm2 in area; the smallest
pore was 0.18 µm2 in area, while the average pore size was 0.73 µm
2. Comparison of the pore size
distribution in the filled PP (Figs. 12 to 14) and unfilled PP (Fig. 11) shows that 0.18 µm2 was the
smallest pore size in all the samples.
The particle sizes and pore sizes detected were also found to increase with increase in particle
size of the fillers investigated. These observations are in agreement with the fact that increasing the
filler particle size implied enlarging the pore spaces in the matrix due to the difficulty of distributing
coarse particles very well within the matrix and the poor interaction of the coarse particles.
Figure 7. SEM Micrograph of the control Figure 8. SEM Micrograph at 15 wt% filler
experiment. loading and 150 µm particle size.
Figure 9. SEM Micrograph at 15 wt% filler Figure 10. SEM Micrograph at 15 wt% filler
loading and 300 µm particle size. loading and 425 µm particle size.
10 Volume 11
Conclusions
Polypropylene-corn cob powder composites were successfully produced and the physical/end-
use properties of the composites were determined. Results obtained showed that water sorption,
flame propagation and solvent sorption were enhanced by increase in filler loading and particle size
of the filler. Lower specific gravities were obtained as the composites were found to be lighter in
weight than the unfilled (control) sample. It is hoped that this present study will help to place the
usefulness of corn cob as filler in the compounding of thermoplastic in the plastic filler market in
future and develop its niche in the scientific record.
Conflict of Interest
The authors declare that there is no conflict of interest regarding the publication of this paper.
Figure 11. SEM Particlemetric Image and
Corresponding Particle Size and Pore Size
Distribution Histograms for the Unfilled PP
(Control).
Figure 12. SEM Particlemetric Image and
Corresponding Particle Size and Pore Size
Distribution Histograms at 15 wt% Filler
Loading and 150 µm Particles Size.
Figure 13. SEM Particlemetric Image and
Corresponding Particle Size and Pore Size
Distribution Histograms at 15 wt% Filler
Loading and 300 µm Particles Size.
Figure 14. SEM Particlemetric Image and
Corresponding Particle Size and Pore Size
Distribution Histograms at 15 wt% Filler
Loading and 425 µm Particles Size.
International Journal of Engineering and Technologies Vol. 11 11
Acknowledgments
We acknowledge the management and staff of CeePlast Limited, Aba, Abia State, Nigeria and
Engineering Materials Development Institute, Akure, Ondo State, Nigeria for making their
equipment available for this research.
References
[1] M. Huda et al., Composites materials from corncob granules and process for preparation, U.S.
20070287795 A1 Patent.
[2] H. Salmah, M.Z. Marliza, E. Selvi, Biocomposites from polypropylene and corn cob: Effect
maleic anhydride grafted polypropylene, Advances in Materials Research. 3(3) (2014) 129–
137.
[3] F. Mangelogbu, L.M. Matuana, J.A. King, Effects of impact modifiers on the properties of
rapid PVC/wood-fiber composites, Journal of Vinyl Addition Technology. 6(3) (2000) 153–
157.
[4] L.M. Matuana, J.J. Balaneez, C.B. Park, Effect of surface properties on the adhesion between
PVC and wood veneer laminates, Journal of Engineering and Science. 38(5) (1998) 765–773.
[5] M. Zurina, H. Ismail, A.A. Bakar, Rice husk powder-filled polystyrene/styrene butadiene
rubber blends, Journal of Applied Polymer Science. 92(5) (2004) 3320–3332.
[6] F.P. La Mantia, M. Morreale, Z.A. Mohd Ishak, Processing and mechanical properties of
organic filled-polypropylene composites, Journal of Applied Polymer Science. 96(5) (2005)
1906–1913.
[7] G.C. Onuegbu, I.C. Madufor, Effect of filler loadings on the end-use properties of maize
tassel filled high density polyethylene, International Research Journal in Engineering, Science
and Technology. 9(1) (2012) 2.
[8] Information on: https://en.wikipedia.org/wiki/Corncob.
[9] M. Pointner et al, Composition of corncobs as a substrate for fermentation of biofuels,
Agronomy Research. 12(2) (2014) 391–396.
[10] C.U. Atuanya, R.O. Edokpia, V.S. Aigbodion, The physio-mechanical properties of recycled
low density polyethylene (RLDPE)/bean pod ash particulate composites, Results in Physics. 4
(2014) 88–95.
[11] S.C. Nwanonenyi, M.U. Obidiegwu, T.S. Onuchukwu, Studies on the properties of linear low
density polyethylene filled oyster shell powder, International Journal of Engineering and
Science. 2(7) (2013) 42–48.
[12] G.C. Machiadikwe, Mechanical and end-use properties of polypropylene filled with domestic
wastes, M.Sc. Thesis, Department of Polymer and Textile Engineering, Federal University of
Technology, Owerri, 2007, pp. 15–20.
[13] A.S. Michaels, W.R. Vieth, H.H. Alcalay, The solubility parameter of polypropylene, Journal
of Applied Polymer Science. 12(7) (1968) 1621–1624.
[14] D.M. Koenhen, C.A. Smolders, The determination of solubility parameters of solvents and
polymers by means of correlations with other physical quantities, Journal of Applied Polymer
Science. 19(4) (1975) 1163–1179.
12 Volume 11


