Download - Monthly Indicators Recent Figures Trends
Monthly Indicators Recent Figures Trends
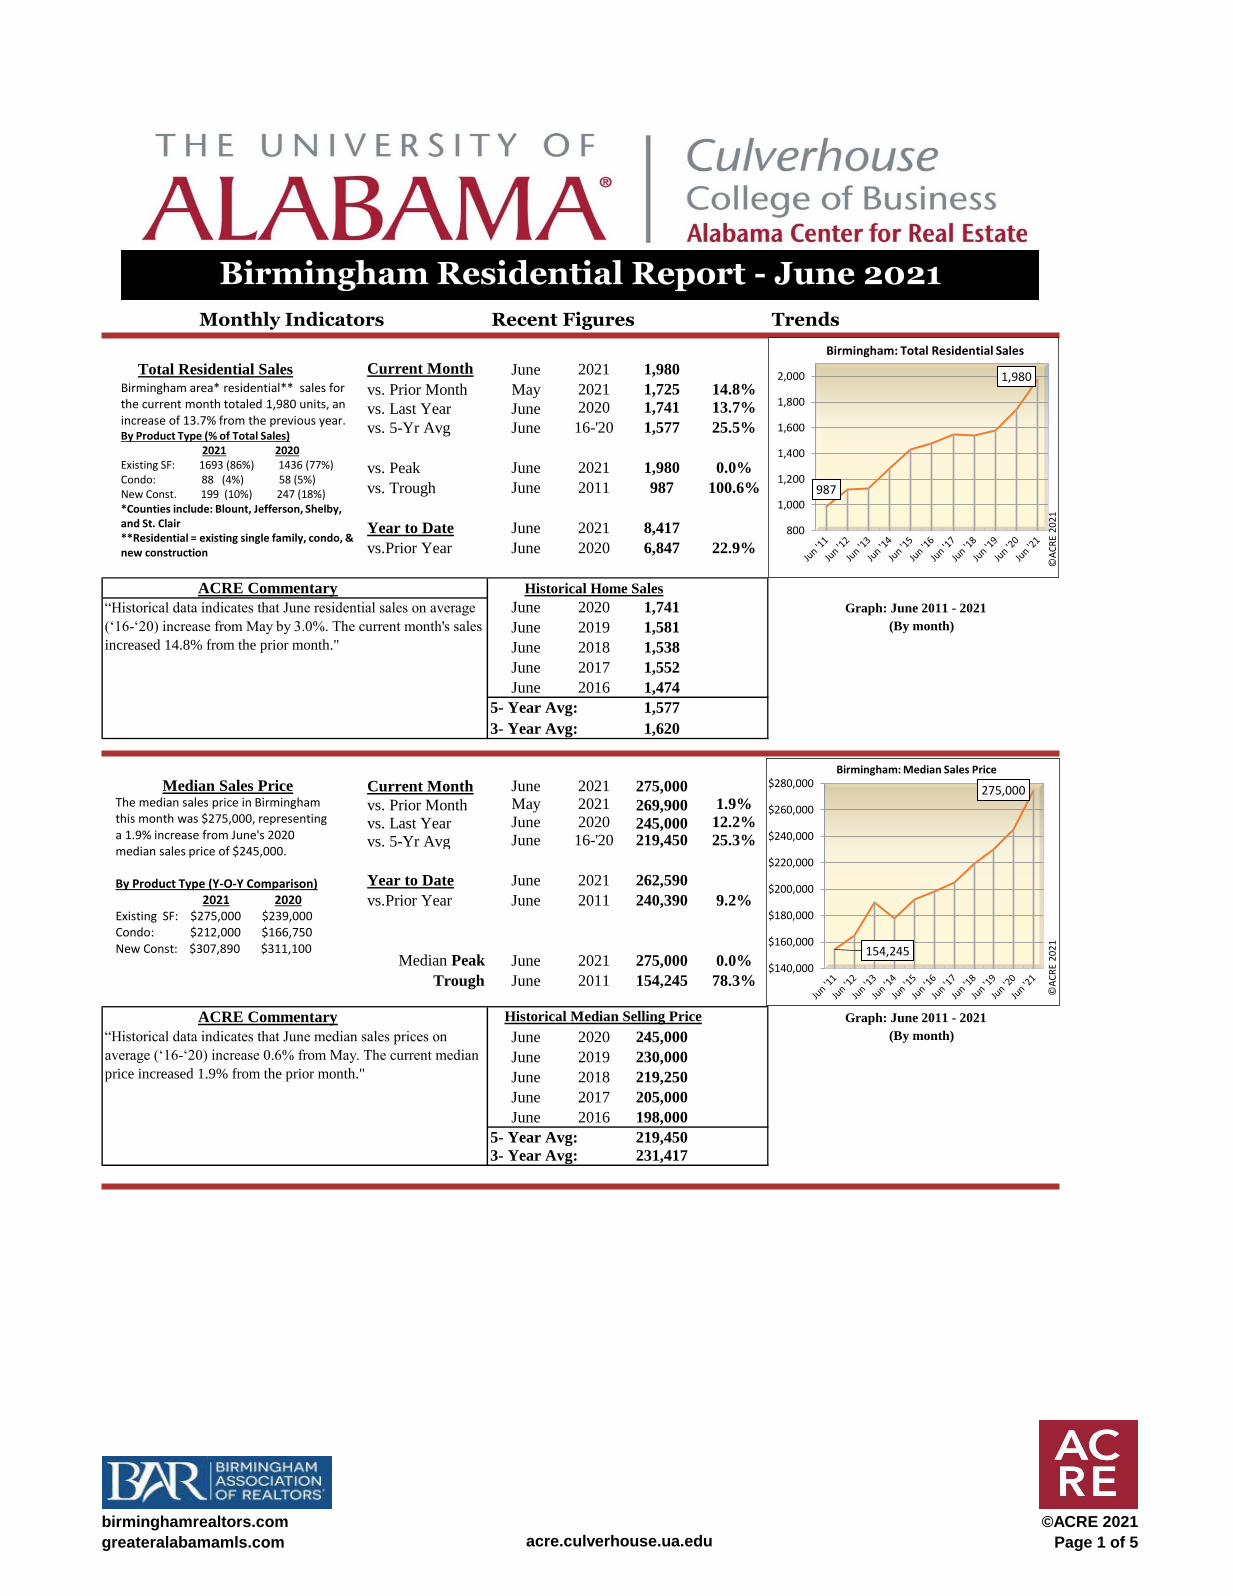
Total Residential Sales Current Month June 2021 1,980
vs. Prior Month May 2021 1,725 14.8%
vs. Last Year June 2020 1,741 13.7%
vs. 5-Yr Avg June 16-'20 1,577 25.5%
vs. Peak June 2021 1,980 0.0%
vs. Trough June 2011 987 100.6%
Year to Date June 2021 8,417
vs.Prior Year June 2020 6,847 22.9%
ACRE Commentary Historical Home Sales
June 2020 1,741 Graph: June 2011 - 2021
June 2019 1,581 (By month)
June 2018 1,538
June 2017 1,552
June 2016 1,474
5- Year Avg: 1,577
3- Year Avg: 1,620
Median Sales Price Current Month June 2021 275,000
vs. Prior Month May 2021 269,900 1.9%
vs. Last Year June 2020 245,000 12.2%
vs. 5-Yr Avg June 16-'20 219,450 25.3%
Year to Date June 2021 262,590
vs.Prior Year June 2011 240,390 9.2%
Median Peak June 2021 275,000 0.0%
Trough June 2011 154,245 78.3%
ACRE Commentary Historical Median Selling Price Graph: June 2011 - 2021
June 2020 245,000 (By month)
June 2019 230,000
June 2018 219,250
June 2017 205,000
June 2016 198,000
5- Year Avg: 219,450
3- Year Avg: 231,417
“Historical data indicates that June residential sales on average
(‘16-‘20) increase from May by 3.0%. The current month's sales
increased 14.8% from the prior month."
“Historical data indicates that June median sales prices on
average (‘16-‘20) increase 0.6% from May. The current median
price increased 1.9% from the prior month."
Birmingham Residential Report - June 2021
Birmingham area* residential** sales forthe current month totaled 1,980 units, an increase of 13.7% from the previous year.By Product Type (% of Total Sales)
2021 2020Existing SF: 1693 (86%) 1436 (77%)Condo: 88 (4%) 58 (5%)New Const. 199 (10%) 247 (18%)*Counties include: Blount, Jefferson, Shelby, and St. Clair**Residential = existing single family, condo, & new construction
The median sales price in Birminghamthis month was $275,000, representing a 1.9% increase from June's 2020 median sales price of $245,000.
By Product Type (Y-O-Y Comparison)2021 2020
Existing SF: $275,000 $239,000Condo: $212,000 $166,750New Const: $307,890 $311,100
987
1,980
800
1,000
1,200
1,400
1,600
1,800
2,000
Birmingham: Total Residential Sales
©A
CR
E 20
21
154,245
275,000
$140,000
$160,000
$180,000
$200,000
$220,000
$240,000
$260,000
$280,000Birmingham: Median Sales Price
©A
CR
E 20
21
birminghamrealtors.com
greateralabamamls.com acre.culverhouse.ua.edu
©ACRE 2021
Page 1 of 5
Monthly Indicators Recent Figures Trends
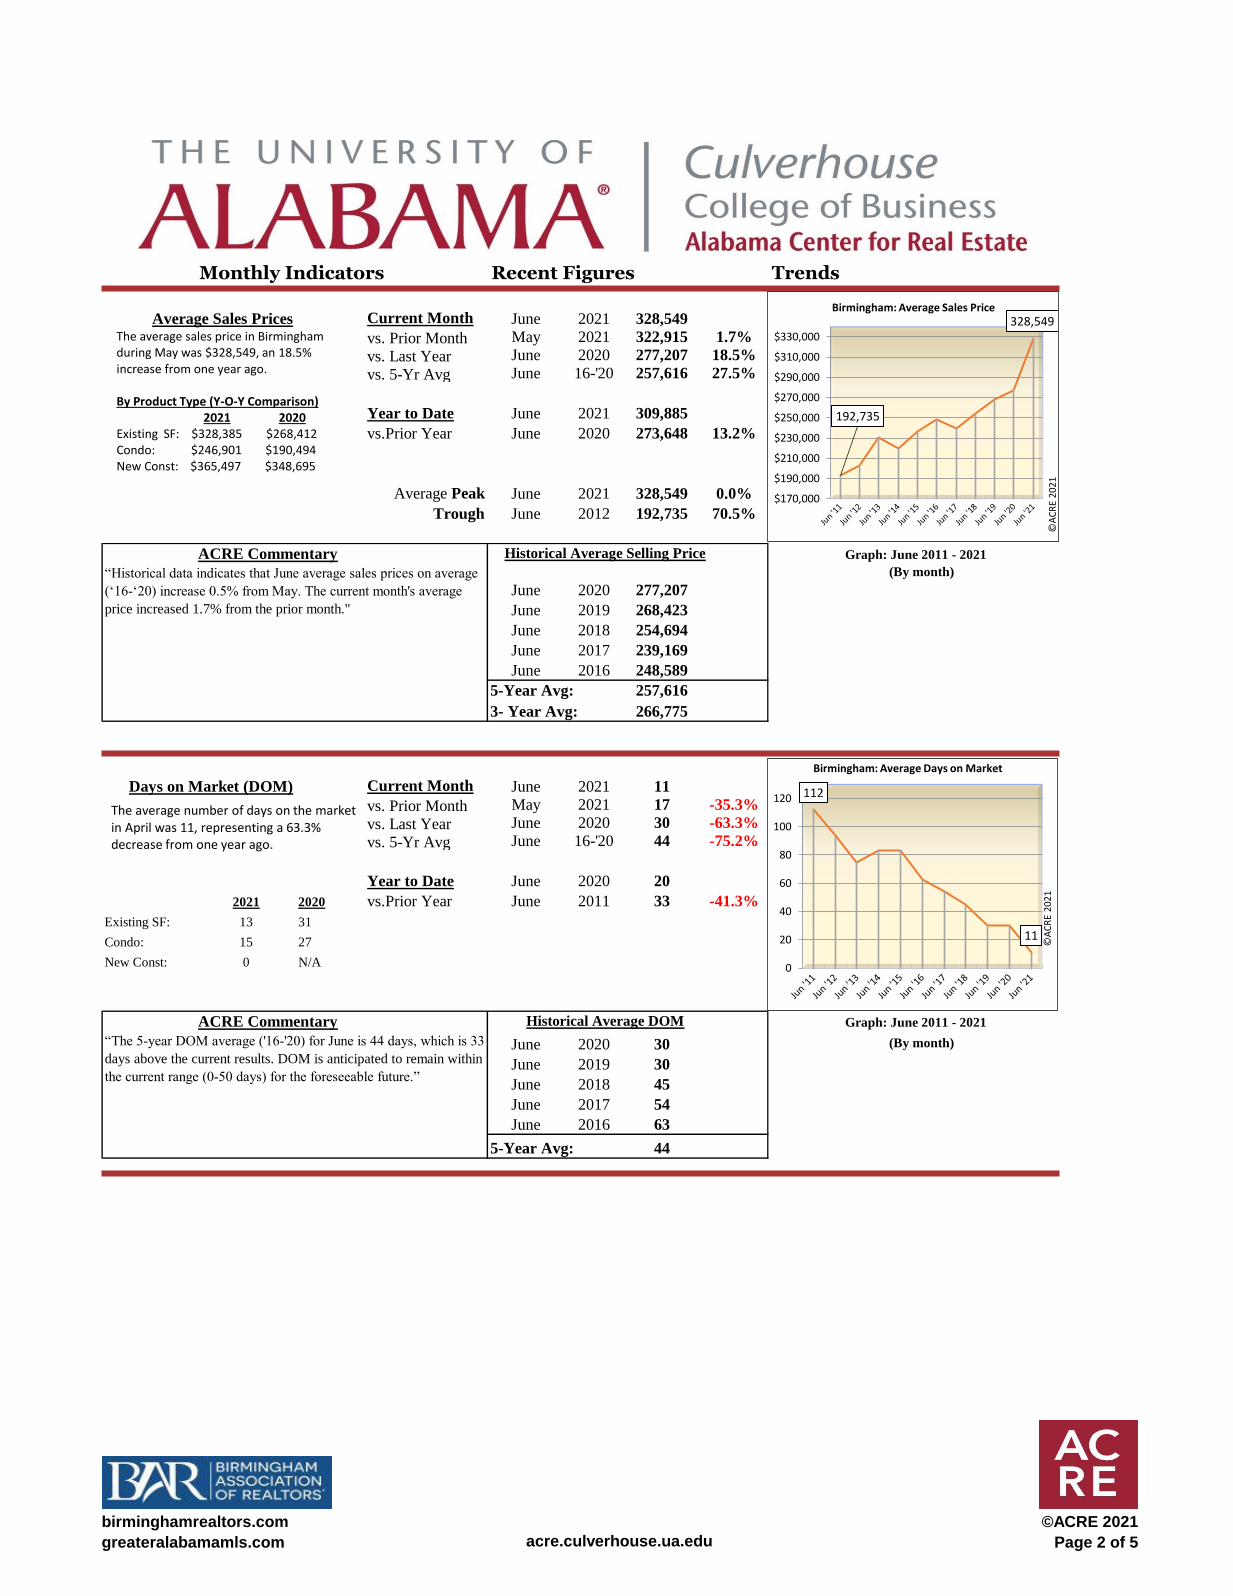
Average Sales Prices Current Month June 2021 328,549
vs. Prior Month May 2021 322,915 1.7%
vs. Last Year June 2020 277,207 18.5%
vs. 5-Yr Avg June 16-'20 257,616 27.5%
Year to Date June 2021 309,885
vs.Prior Year June 2020 273,648 13.2%
Average Peak June 2021 328,549 0.0%
Trough June 2012 192,735 70.5%
ACRE Commentary Historical Average Selling Price Graph: June 2011 - 2021
(By month)
June 2020 277,207
June 2019 268,423
June 2018 254,694
June 2017 239,169
June 2016 248,589
5-Year Avg: 257,616
3- Year Avg: 266,775
Days on Market (DOM) Current Month June 2021 11
vs. Prior Month May 2021 17 -35.3%
vs. Last Year June 2020 30 -63.3%
vs. 5-Yr Avg June 16-'20 44 -75.2%
Year to Date June 2020 20
2021 2020 vs.Prior Year June 2011 33 -41.3%
Existing SF: 13 31
Condo: 15 27
New Const: 0 N/A
ACRE Commentary Historical Average DOM Graph: June 2011 - 2021
June 2020 30 (By month)
June 2019 30
June 2018 45
June 2017 54
June 2016 63
5-Year Avg: 44
“Historical data indicates that June average sales prices on average
(‘16-‘20) increase 0.5% from May. The current month's average
price increased 1.7% from the prior month."
“The 5-year DOM average ('16-'20) for June is 44 days, which is 33
days above the current results. DOM is anticipated to remain within
the current range (0-50 days) for the foreseeable future.”
The average sales price in Birmingham during May was $328,549, an 18.5% increase from one year ago.
By Product Type (Y-O-Y Comparison)2021 2020
Existing SF: $328,385 $268,412Condo: $246,901 $190,494New Const: $365,497 $348,695
The average number of days on the market in April was 11, representing a 63.3% decrease from one year ago.
112
11
0
20
40
60
80
100
120
Birmingham: Average Days on Market
©A
CR
E 20
21
192,735
328,549
$170,000
$190,000
$210,000
$230,000
$250,000
$270,000
$290,000
$310,000
$330,000
Birmingham: Average Sales Price
©A
CR
E 20
21
birminghamrealtors.com
greateralabamamls.com acre.culverhouse.ua.edu
©ACRE 2021
Page 2 of 5
Monthly Indicators Recent Figures Trends
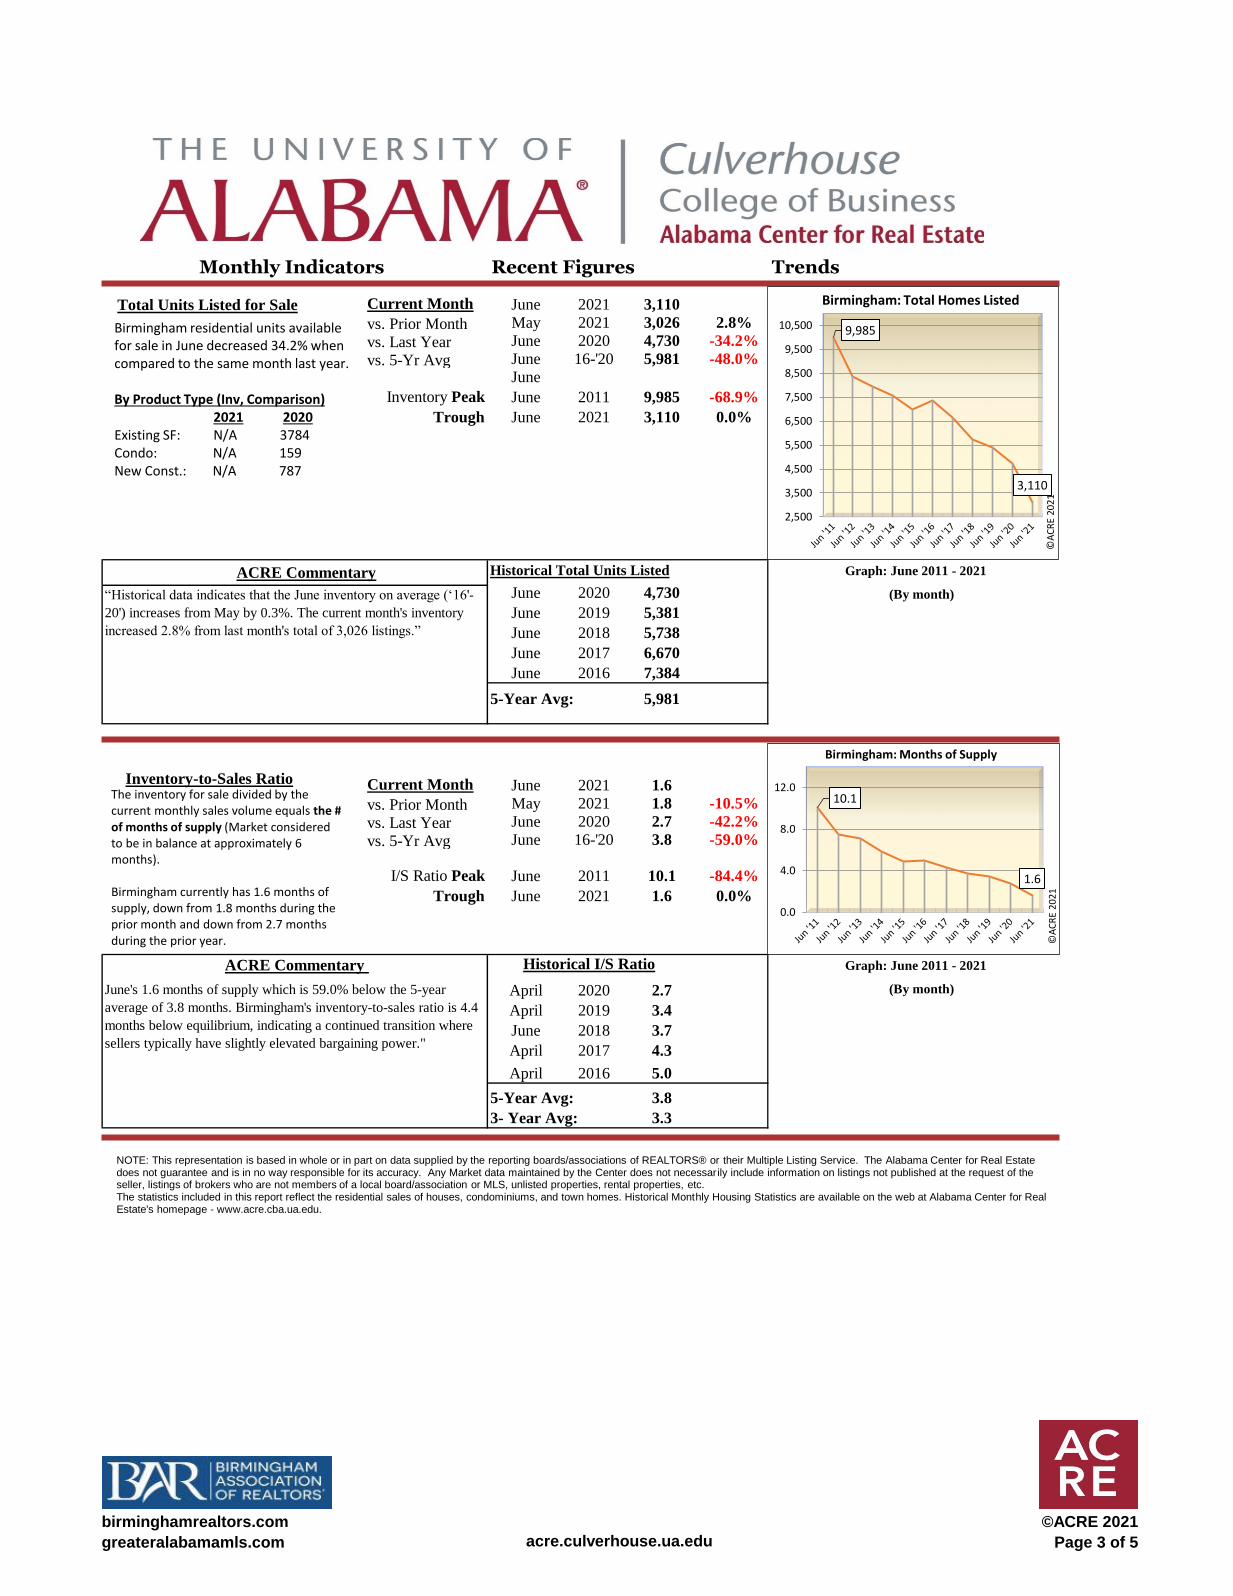
Total Units Listed for Sale Current Month June 2021 3,110
vs. Prior Month May 2021 3,026 2.8%
vs. Last Year June 2020 4,730 -34.2%
vs. 5-Yr Avg June 16-'20 5,981 -48.0%
June
Inventory Peak June 2011 9,985 -68.9%
Trough June 2021 3,110 0.0%
Historical Total Units Listed Graph: June 2011 - 2021
June 2020 4,730 (By month)
June 2019 5,381
June 2018 5,738
June 2017 6,670
June 2016 7,384
5-Year Avg: 5,981
Inventory-to-Sales Ratio Current Month June 2021 1.6
vs. Prior Month May 2021 1.8 -10.5%
vs. Last Year June 2020 2.7 -42.2%
vs. 5-Yr Avg June 16-'20 3.8 -59.0%
I/S Ratio Peak June 2011 10.1 -84.4%
Trough June 2021 1.6 0.0%
Historical I/S Ratio Graph: June 2011 - 2021
April 2020 2.7 (By month)
April 2019 3.4
June 2018 3.7
April 2017 4.3
April 2016 5.0
5-Year Avg: 3.8
3- Year Avg: 3.3
ACRE Commentary
“Historical data indicates that the June inventory on average (‘16'-
20') increases from May by 0.3%. The current month's inventory
increased 2.8% from last month's total of 3,026 listings.”
ACRE Commentary
June's 1.6 months of supply which is 59.0% below the 5-year
average of 3.8 months. Birmingham's inventory-to-sales ratio is 4.4
months below equilibrium, indicating a continued transition where
sellers typically have slightly elevated bargaining power."
Birmingham residential units available for sale in June decreased 34.2% when compared to the same month last year.
By Product Type (Inv, Comparison)2021 2020
Existing SF: N/A 3784Condo: N/A 159New Const.: N/A 787
The inventory for sale divided by the current monthly sales volume equals the # of months of supply (Market considered to be in balance at approximately 6 months).
Birmingham currently has 1.6 months of supply, down from 1.8 months during the prior month and down from 2.7 monthsduring the prior year.
NOTE: This representation is based in whole or in part on data supplied by the reporting boards/associations of REALTORS® or their Multiple Listing Service. The Alabama Center for Real Estate does not guarantee and is in no way responsible for its accuracy. Any Market data maintained by the Center does not necessarily include information on listings not published at the request of the seller, listings of brokers who are not members of a local board/association or MLS, unlisted properties, rental properties, etc.The statistics included in this report reflect the residential sales of houses, condominiums, and town homes. Historical Monthly Housing Statistics are available on the web at Alabama Center for Real Estate's homepage - www.acre.cba.ua.edu.
9,985
3,110
2,500
3,500
4,500
5,500
6,500
7,500
8,500
9,500
10,500
Birmingham: Total Homes Listed
©A
CR
E 20
21
10.1
1.6
0.0
4.0
8.0
12.0
Birmingham: Months of Supply
©A
CR
E 20
21
birminghamrealtors.com
greateralabamamls.com acre.culverhouse.ua.edu
©ACRE 2021
Page 3 of 5
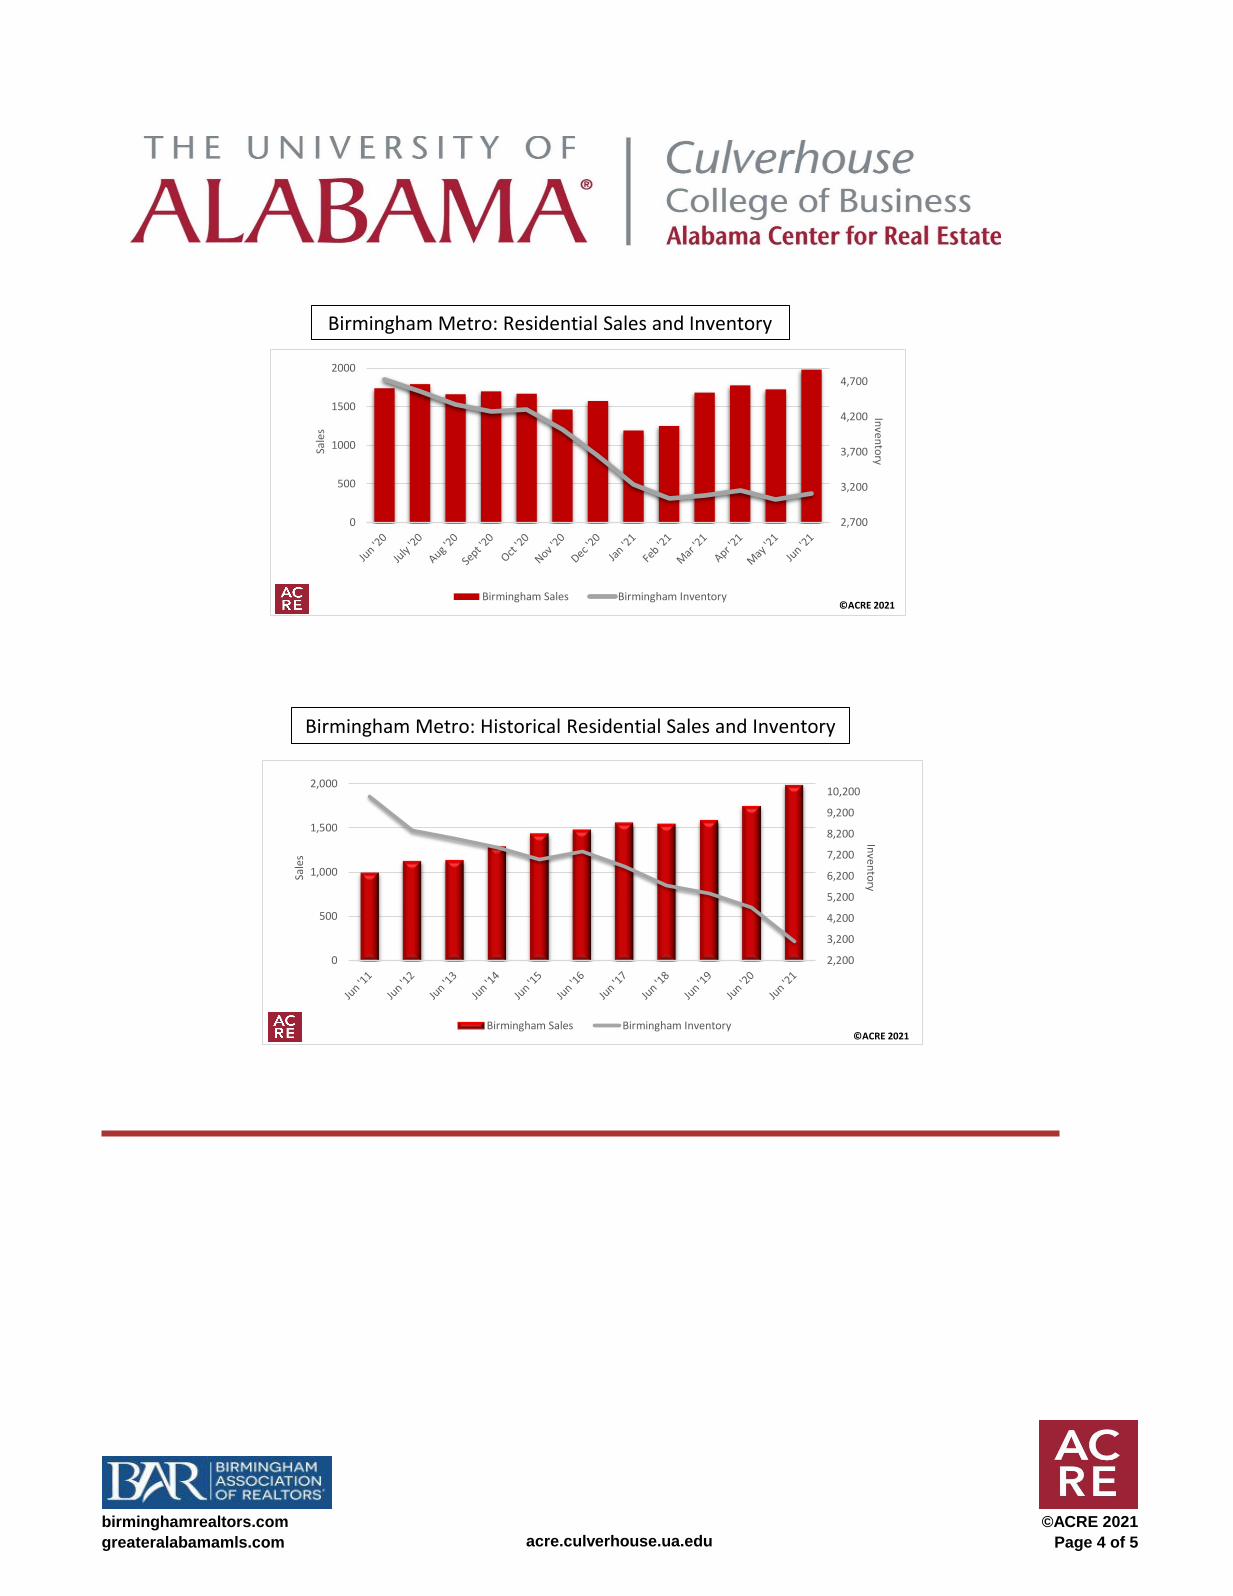
Birmingham Metro: Residential Sales and Inventory
Birmingham Metro: Historical Residential Sales and Inventory
2,700
3,200
3,700
4,200
4,700
0
500
1000
1500
2000In
vento
rySale
s
Birmingham Sales Birmingham Inventory©ACRE 2021
2,200
3,200
4,200
5,200
6,200
7,200
8,200
9,200
10,200
0
500
1,000
1,500
2,000
Inven
torySa
les
Birmingham Sales Birmingham Inventory©ACRE 2021
birminghamrealtors.com
greateralabamamls.com acre.culverhouse.ua.edu
©ACRE 2021
Page 4 of 5
.
This report is compiled and brought to you by ACRE Research. You should not treat any information expressed in ACRE Reports as a specific inducement to make a particular investment or follow a particular strategy. The Alabama Center for Real Estate (ACRE) and/or its partners/work product sponsors does not guarantee and is not responsible for the accuracy or completeness of information, and provides said information without warranties of any kind. All information presented herein is intended and should be used for educational purposes only. Nothing herein should be construed as investment advice. You should always conduct your own research and due diligence and obtain professional advice before making any investment decision. All investments involve some degree of risk. ACRE will not be liable for any loss or damage caused by your reliance on information contained in ACRE Reports.
115,000
135,000
155,000
175,000
195,000
215,000
235,000
255,000
275,000
295,000
0
20
40
60
80
100
120
Med
ian Sales P
rice
Ave
rage
Day
s o
n M
arke
t
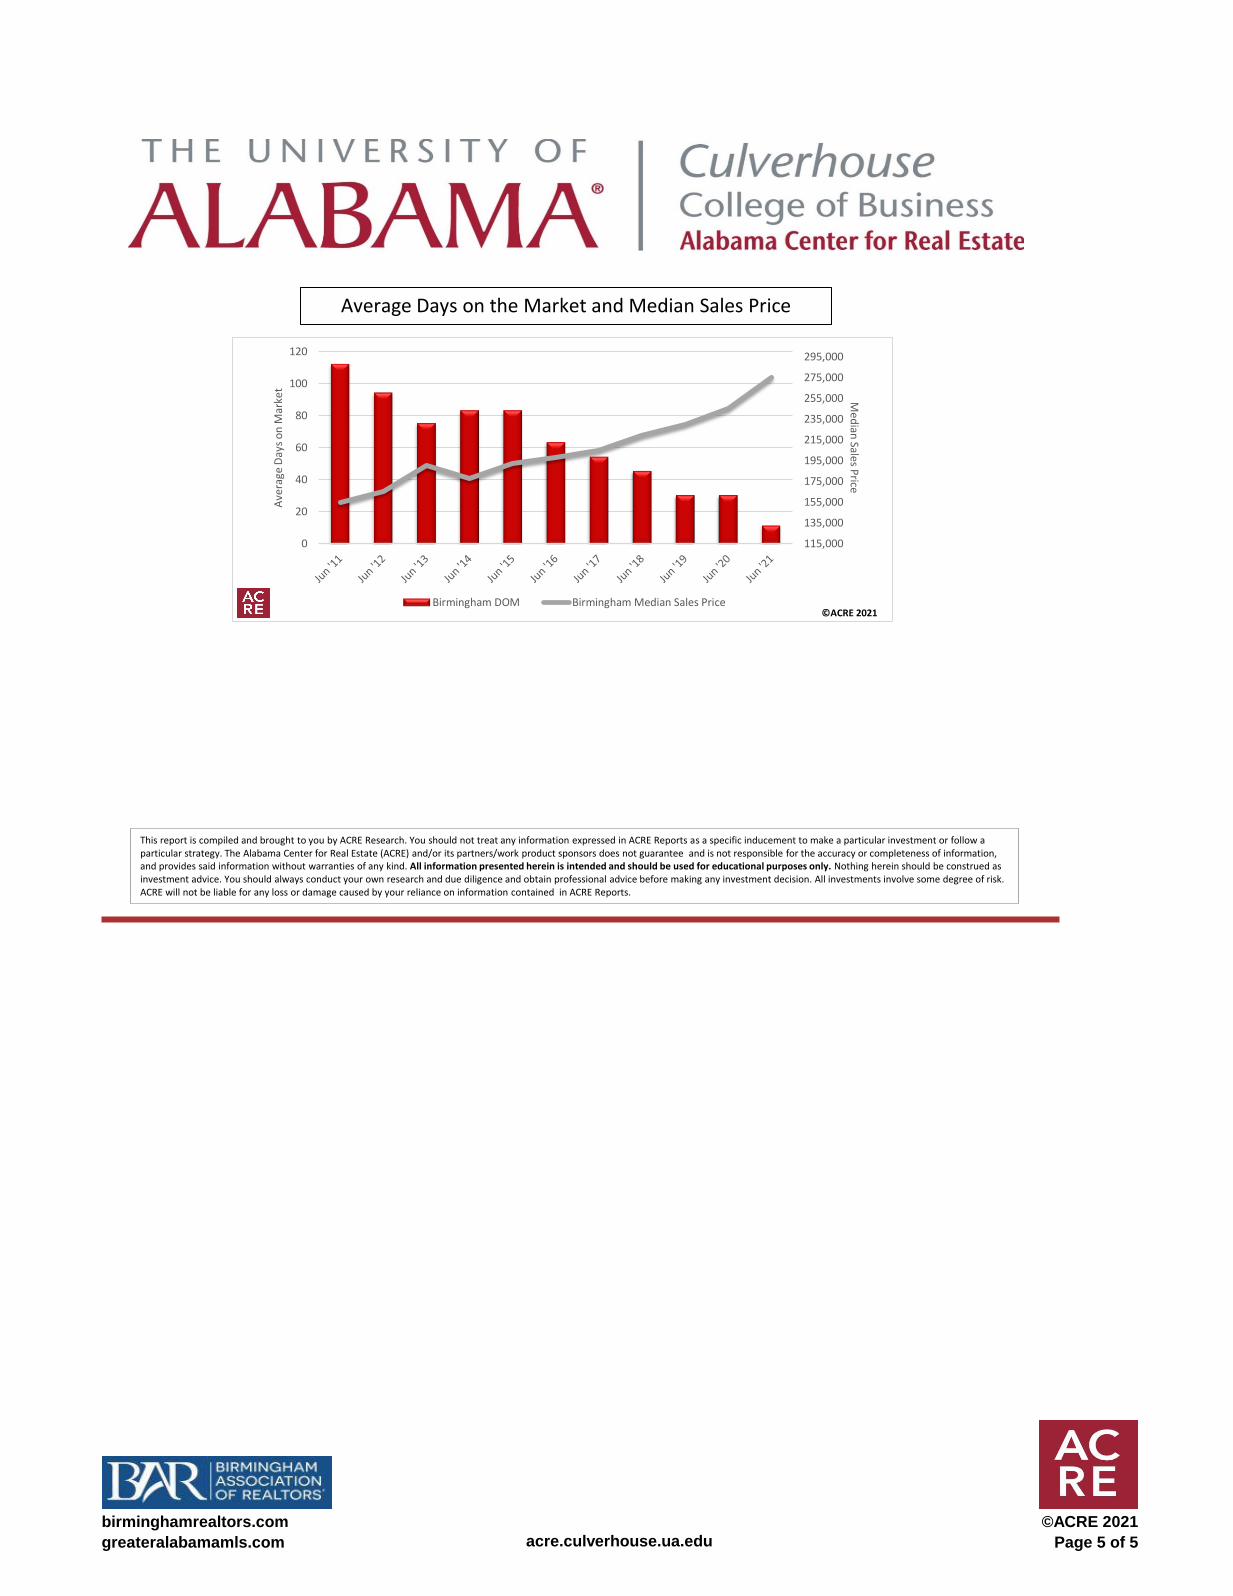
Birmingham DOM Birmingham Median Sales Price©ACRE 2021
Average Days on the Market and Median Sales Price
birminghamrealtors.com
greateralabamamls.com acre.culverhouse.ua.edu
©ACRE 2021
Page 5 of 5


