
Montana Weigh-in-Motion (WIM)
and Automatic Traffic Recorder (ATR) Strategy
Report for Task 1 Review of the State-of-Practice
Prepared by:
Yan Qi, Assistant Professor,
Montana Tech
Shane Forsythe Graduate Student
Montana State University
Jerry Stephens, Professor/Research Director
Montana State University
David Veneziano Research Scientist,
Montana State University
Western Transportation Institute Montana State University and Montana Tech
Conducted for Montana Department of Transportation
2701 Prospect Avenue P.O. Box 201001
Helena, MT 59620-1001
October 2013

ii
ABSTRACT
This task report documents a comprehensive literature review on traffic data collection programs and the results of a companion survey of such programs in a few selected states around the country. This review is the first task in a project sponsored by the Montana Department of Transportation to comprehensively review its traffic data collection program to ensure it provides the best possible traffic information in the most cost effective manner. While considering data collection by both continuous automatic traffic recorder (ATR) and weigh-in-motion (WIM) systems, this review focused on WIM programs. Information was collected on data collection technologies, transmission and management, users and uses, and collection site selection/prioritization. Several approaches were found to be available for executing all these tasks, with no one approach consistently adopted by a majority of transportation agencies.
Relative to traffic data collection technologies, sensor systems continue to improve in quality and cost, both through ongoing development of traditional sensing systems as well as the development of new systems. For ATRs these systems range from traditional pneumatic tubes and inductance loops (still the most commonly used), to more recently introduced radar, video, magnetic, and other systems. For WIMs these systems range from single load cells, bending plates, and piezoelectric sensors, all of which have been commonly used since the 1990s, to emerging fiber optic sensors. Relative to WIM systems, piezoelectric sensors are possibly the most frequently mentioned, and more specifically, quartz piezoelectric sensors, with respect to balancing data quality and cost.
The most commonly employed data communication technologies are landline, cellular, and wireless technologies. Specifically, high-speed wireless and network technologies (e.g. Dedicated Short Range Communications (DSRC), mobile network, and Ethernet) are necessary to transmit real-time data and are the trend for the new generation of ATRs/WIMs. Many software packages are available to check data for accuracy and to generate metrics needed for various activities such as pavement design, weight enforcement, transportation planning, freight management, traffic safety, asset management, etc. To facilitate data use, many states make historical traffic data available on the internet. Increasingly these data are presented using interactive maps and are integrated into GIS databases. Notably, a rapidly emerging use of WIM is for real time weight enforcement using a virtual weigh station (VWS) approach, which can impact both site and hardware selection.
The current practices of selected states (ND, SD and ME) for traffic data collection, processing, and use were directly surveyed. These states are similar to Montana with areas of low population density, geographically extensive highway networks, and natural resource based economies. These three states have comparable sized WIM and ATR programs, with Montana having a similar sized ATR program but significantly more WIM sites. The staffing and duties of the traffic data collection programs varied considerably from state to state, making it difficult to formulate comparisons of basic level-of-effort and costs. Further complicating such comparisons are the degree to which various tasks are contracted out, such as sensor installation, maintenance, and calibration. The practices of these three states appear to well illustrate the range of permutations of traffic data collection programs.

iii
TABLE OF CONTENTS
ABSTRACT .............................................................................................................................. ii TABLE OF CONTENTS ......................................................................................................... iii LIST OF TABLES .................................................................................................................... iv INTRODUCTION ..................................................................................................................... 1 LITERATURE REVIEW .......................................................................................................... 2 Traffic Data Collection Technologies ....................................................................................... 2
Automatic Traffic Recorders ....................................................................................... 2 Weigh-In-Motion ......................................................................................................... 5 Virtual Weigh Station ................................................................................................ 14
Traffic Data Transmission and Management .......................................................................... 16 Data Communication Technologies ........................................................................... 16 Data Management ...................................................................................................... 18
Traffic Data Users and Uses ................................................................................................... 22 Weight Enforcement .................................................................................................. 23 Virtual Weigh Stations ............................................................................................... 25 Highway and Pavement Design ................................................................................. 27 Freight and Fleet Management .................................................................................. 28 Other Needs and Opportunities .................................................................................. 29
Data Collection Site Selection and Prioritization ................................................................... 30 ATR Siting ................................................................................................................. 30 WIM Siting ................................................................................................................ 31 System Prioritization and Planning ............................................................................ 34
Concluding Remarks ............................................................................................................... 36 SURVEY STUDY ................................................................................................................... 38 General Description of Traffic Data Collection Program ....................................................... 38
Size of WIM and ATR Programs ............................................................................... 38 Management and Operations of Traffic Data Collection Programs ........................... 39 Program planning/prioritization ................................................................................. 42
Data Collection Technology ................................................................................................... 43 Current Technologies ................................................................................................. 43 New Technologies under Testing .............................................................................. 44
Traffic Data Collection, Analysis, and Presentation ............................................................... 44 Types of Data Collected ............................................................................................ 44 Data Format ............................................................................................................... 44 Data Analysis ............................................................................................................. 45 Data Presentation and Accessibility ........................................................................... 45 Future Goals ............................................................................................................... 45
Traffic Data Users ................................................................................................................... 46 Current traffic data users ............................................................................................ 46 Unmet data needs ....................................................................................................... 46
Concluding Remarks ............................................................................................................... 46 SUMMARY ............................................................................................................................. 48 WORKS CITED ...................................................................................................................... 50 APPENDIX A ............................................................................................................................ 1 North Dakota’s Survey Response ............................................................................................. 2 South Dakota’s Survey Response ............................................................................................. 6 Maine’s Survey Response .............................................................................................. 10

iv
LIST OF TABLES
TABLE 1. ATR Technologies ......................................................................................................... 3 TABLE 2. WIM System Outputs ..................................................................................................... 6 TABLE 3. WIM Types .................................................................................................................... 7 TABLE 4. WIM Technologies ........................................................................................................ 8 TABLE 5. WIM System Performance and Cost ............................................................................ 12 TABLE 6. WIM System Costs ...................................................................................................... 13 TABLE 7. Primary Technologies for VWS ................................................................................... 14 TABLE 8. Secondary Technologies for VWS ............................................................................... 15 TABLE 9. Communication Technologies ..................................................................................... 17 TABLE 10. WIM Site Selection Criteria ....................................................................................... 32 TABLE 11. Size of Current WIM and ATR Traffic Data Collection Program ............................. 39 TABLE 12. FTE for Each Traffic Data Collection Duty ............................................................... 40 TABLE 13. WIM Calibration ........................................................................................................ 41 TABLE 14. Annual Costs for ATR and WIM programs ............................................................... 42 TABLE 15. WIM and ATR Technologies ..................................................................................... 44

1
INTRODUCTION
Automatic Traffic Recorder (ATR) and Weigh-in-motion (WIM) systems are the two
fundamental types of data collection systems generally employed in continuously monitoring
roadway use at permanent sites on a highway network. The 62 ATR and 33 WIM systems
throughout Montana’s highway network are the major components of the state’s traffic data
collection system. With advances in wireless detector, sensor, transmission, and communication
technologies, ATR/WIM technologies continue to move forward. To provide information for the
Montana Department of Transportation (MDT) to evaluate its existing traffic data collection
program and assist in determining the future direction of this program, a systematic and
comprehensive literature review on ATR/WIM systems was conducted. This literature review
covers all major components of these systems with an emphasis on WIM systems. Sources
searched during the review include the Transport Research International Documentation (TRID)
database, transportation organization websites, federal and state agencies websites, vendor
websites, etc.
Since the information in the literature often is not current, and some states’ practices are
not described therein, the research team contacted selected states to directly learn about their
traffic data collection programs. The survey focused on states that are similar to Montana with
areas of low population density, geographically extensive highway networks, and natural
resource based economies. Information gathered from the survey encompasses all major
components of each state traffic data collection program, from basic traffic data collection
technologies, unit organization, program costs, to data collected and data uses.
Accordingly, the first part of this task report presents the results of the comprehensive
literature review on traffic data collection programs, while the second part presents the
information gathered from the survey of the state-of-practice of other comparable states. A brief
summary of the major findings from the literature review and survey study are presented at the
end of each part respectively. This task report is part of a major research effort with the
objective of performing a comprehensive review of MDT’s WIM program along with a basic
review of its ATR program.

2
LITERATURE REVIEW
This section presents the findings from the comprehensive literature review on traffic
data collection programs. The review focuses on four major components of a comprehensive
traffic data collection program, namely:
1. Data collection technologies;
2. Data transmission and processing;
3. Data users and uses; and
4. Traffic data collection site selection and prioritization.
For this review, the research team considered ATR and WIM systems, as these are the
two fundamental types of continuous traffic data collection systems. The focus of the overall
research project is on WIM programs, and this focus is carried through in this literature review.
Findings regarding each of the four major program components are presented in the following
sections.
Traffic Data Collection Technologies
This section summarizes the data collection technologies used for ATR and WIM
systems. ATR systems are generally less expensive than WIM systems, but they only provide
traffic volume and/or vehicle classification data. WIM systems provide traffic volume, vehicle
classification, and vehicle weight data, but they are more expensive to deploy. Thus, traffic data
collection programs typically use both systems, with data from the two sources being used
individually and synergistically to support data needs in a cost effective manner.
An ATR is any traffic counting device that can be placed at a specific location to record
the distribution and variation of traffic flow by the hour-of-day, day-of-week, and/or month-of-
year (FHWA 2012). While the term ATR generally encompasses automated vehicle classifiers,
portable traffic recorders, WIM systems, and any other non-manual counting device, frequently
it is used more specifically to refer to non-WIM systems, and further to permanent systems
engaged in continuous rather than short term traffic data collection (this approach, for example,
is used by MDT). In the following material, portable/short term and permanent/continuous
volume/classification data collection technologies are grouped together, with WIM systems
being discussed in a subsequent section of the report.
Automatic Traffic Recorders
ATRs use a variety of sensing technologies, from pneumatic road tubes to piezoelectric
sensors. The phenomenon used in each of these technologies varies, thus leading to advantages
and disadvantages of each technology as summarized in Table 1.

3
TABLE 1. ATR Technologies
Technology Advantages Disadvantages
Pneumatic Road Tubes Highly portable. Well understood and mature technology
Inexpensive
Susceptible to damage by traffic (therefore, not used in permanent, continuous data collection).
Requires precise setup for accurate classification.
Inductive Loop Flexible design to satisfy large variety of applications.
Insensitive to inclement weather.
Provides best accuracy for count data as compared with other commonly used techniques
Installation requires pavement cut.
Wire loops subject to stresses from traffic and temperature.
Multiple loops usually required to monitor a location
Magnetometer (two‐axis fluxgate magnetometer)
Less susceptible than loops to stresses of traffic.
Insensitive to inclement weather.
Some models transmit data over wireless radio frequency link.
Installation requires pavement cut.
Installation and maintenance require lane closure.
Models with small detection zones require multiple units for full lane detection.
Magnetic (induction or search coil magnetometer)
Can be used where loops are not feasible (e.g., bridge decks).
Some models are installed under roadway without need for pavement cuts.
Less susceptible than loops to stresses of traffic.
Installation requires pavement cut or boring under roadway.
Cannot detect stopped vehicles unless special sensor layouts and signal processing software are used.
Microwave Radio Typically insensitive to inclement weather.
Direct measurement of speed.
Multiple lane operation available.
Non‐intrusive, can be used for portable short term counts.
Continuous wave Doppler sensors cannot detect stopped vehicles.
Active Infrared (Laser Radar)
Transmits multiple beams for accurate measurement of vehicle position, speed, and class.
Multiple lane operation available.
Non‐intrusive, can be used for portable short term counts.
Operation may be affected by fog when visibility is less than ~20‐feet or blowing snow is present.
Installation and maintenance require lane closure.
Passive Infrared Multi‐zone passive sensors measure speed.
Non‐intrusive, can be used for portable short term counts.
Passive sensor may have reduced vehicle sensitivity in heavy rain, snow, and dense fog.
Some models not recommended for presence detection.
Ultrasonic Multiple lane operation available.
Capable of over‐height vehicle
Environmental conditions such as temperature change and extreme air turbulence can affect performance.

4
Technology Advantages Disadvantages
detection. Large Japanese experience base. Non‐intrusive, can be used for portable for short term counts.
Large pulse repetition periods may degrade occupancy measurement on freeways with vehicles travelling at moderate to high speeds.
Video Detection System Monitors multiple lanes and multiple detection zones/lane.
Easy to add and modify detection zones.
Rich array of data available. Non‐intrusive, can be used for portable short term counts.
Installation and maintenance require lane closure when camera is mounted over roadway.
Performance affected by inclement weather such as fog, rain, and snow.
Required 30‐ to 50‐ft camera mounting height for optimum presence detection and speed measurement.
Acoustic Passive detection. Insensitive to precipitation. Multiple lane operation available in some models.
Non‐intrusive, can be used for portable short term counts.
Cold temperature may affect vehicle count accuracy.
Specific models are not recommended with slow‐moving vehicles in stop‐and‐go traffic.
Piezoelectric Low cost. Accurate vehicle classification.
Installation requires pavement cut.
Table Source: adapted from FHWA 2006
Pneumatic road tubes rely on a flexible tube that is stretched across the road. When a
vehicle passes over the tube, the air inside the sealed tube is compressed. The data collection
unit attached to the hose then measures the pressure increase as a passing axle. To perform
classification, pneumatic systems require two tubes across the road at a known distance from one
another. Installation of pneumatic tubes does not require any modifications to the road bed.
They are, however, highly susceptible to damage by traffic and road maintenance operations.
While generally not appropriate for long term/continuous data collection, pneumatic road tubes
are the most common form of short-term ATR (FHWA 2012).
The most common technology used for continuous data collection and traffic
management is the inductive loop sensor (AASHTO 2009). Inductive loops consist of a series of
wire coils placed in the road surface. These coils are then attached to a control unit. When
operational, a current is passed through the loops and the inductance of the system is monitored.
When a large magnetic body (i.e. a vehicle) passes over or stops within the loops, a change in the
inductance is measured by the control unit. Inductive loops cannot detect individual axles; this
makes their use for classification difficult.
Magnetometer sensors, whether wired or wireless, work by measuring the local magnetic
field at the installation location. When an aberration in the magnetic field is identified, it can be
inferred that a vehicle is present (Bajwa, et al. 2011). Magnetometers can be used in locations
that may prohibit the use of inductive loops due to the small size of the magnetometer sensors
(FHWA 2006).
5
Microwave radio, infrared (active and passive), and ultrasonic sensors all rely on
measuring Doppler shift in the given emission type. Each technology outputs a signal that is
then reflected by vehicles. A vehicle is detected when a change in the reflected energy is
measured. Capable of detecting presence and speed data directly, these technologies are ideal for
locations where in-road placement is problematic as they can be installed at the road side with
minimal impact on the traffic flow (FHWA 2006).
Passive acoustic sensors rely on the noise generated by a passing vehicle. This noise can
be either the vehicle itself or the noise generated by the tires on the roadway. Some acoustic
systems are capable of detecting traffic on five lanes simultaneously (Nova Teck 2013). All
acoustic sensors utilize a two-dimensional array of microphones to detect vehicle noise (FHWA
2006).
Video detection of vehicles is achieved through video processing by an on-site computer.
A video feed is given to the computer which in-turn monitors a set location for changes in the
video. These systems require a clear view of the traffic stream and can be obscured by weather
phenomenon such as fog and snow. Modern processing technologies have made video detection
less susceptible to misidentification of shadows and reflections as vehicles (FHWA 2006).
Middleton, Parker and Longmire (2007) performed a study of non-intrusive vehicle
detection systems including video image vehicle detection, acoustic, magnetic, inductive loop,
and microwave radar systems. It was determined that none of the technologies were as accurate
as inductive loops, but microwave, radar, and magnetometers were identified as promising
technologies.
Piezoelectric cables are also commonly used for axle detection. Further discussion of
piezoelectric cables will be given in later sections of this report. For axle detection, lower
quality piezoelectric cables that are not suitable for WIM applications are used.
Weigh-In-Motion
Austroads (2000) defines WIM as, “A device that measures the dynamic axle weight of a
moving vehicle to estimate the corresponding static axle mass.” These devices provide
information on vehicle speed and weight (including individual axle weights) in addition to
collecting vehicle volume and configuration data. WIM systems are generally more expensive
than ATR systems, but they offer a greater depth of data.
One of the first WIM systems was developed in 1952 by the United States Bureau of
Public Roads (the predecessor of FHWA) (Norman and Hopkins 1952). This early system was a
reinforced concrete platform instrumented with resistance wire strain gauges. All calculations of
vehicle weight were done manually by interpreting the output of an oscilloscope attached to the
6
strain gauges. This process was labor intensive and inaccurate making it impractical for long
term data collection.
WIM technologies have continued to evolve over the past 60 years with advances in
wireless detector, sensor, transmission, and communication technologies. Modern WIM systems
typically consist of the following elements:
A scale or set of sensors on the mainline or installed on a ramp that records the
impact of the passing vehicle;
A roadside cabinet containing a processor that converts the downward force
readings of the vehicle on the scale into data estimating the vehicle’s gross weight
and axle weights; and
A communication system that transmits the collected data to the computers of
enforcement personnel or to an enterprise-level WIM database management
system (FHWA 2009b).
The accuracy of a given WIM system is a direct function of the technology used for
weight detection. Systems that are installed on the mainline require sensors that are accurate at
high speeds, while systems located on ramps need to be more accurate at lower speeds.
Generally, more expensive systems are more accurate (FHWA 2009b).
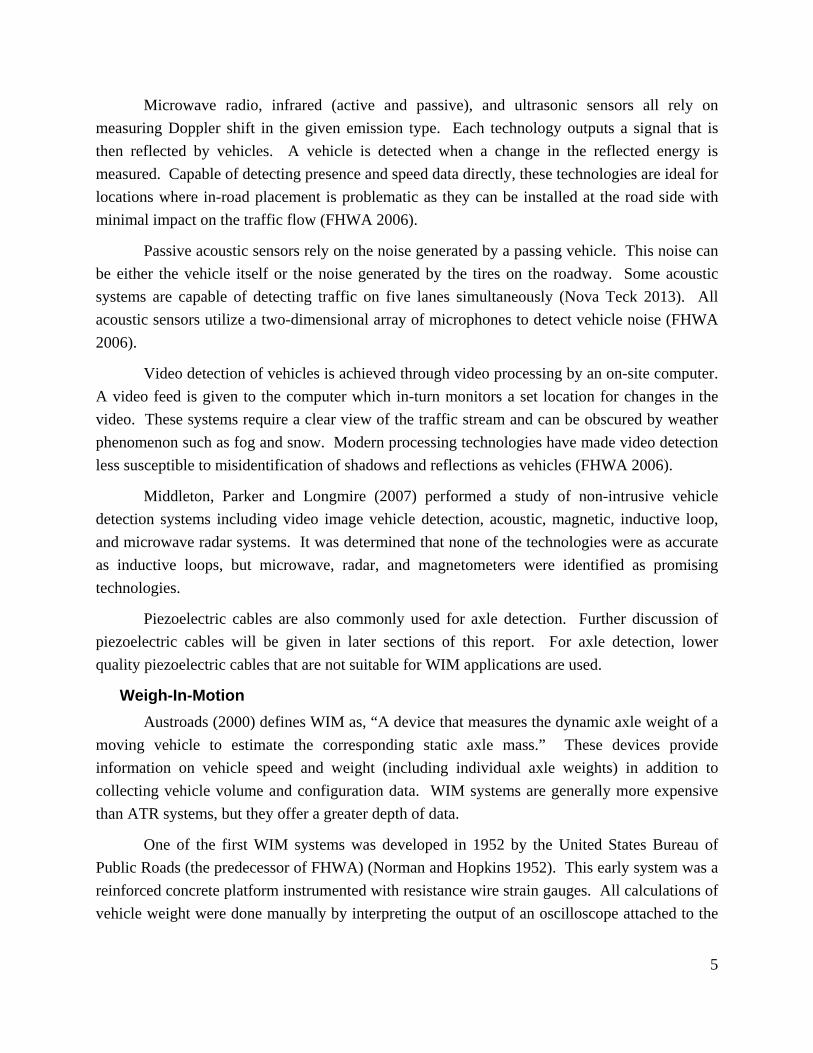
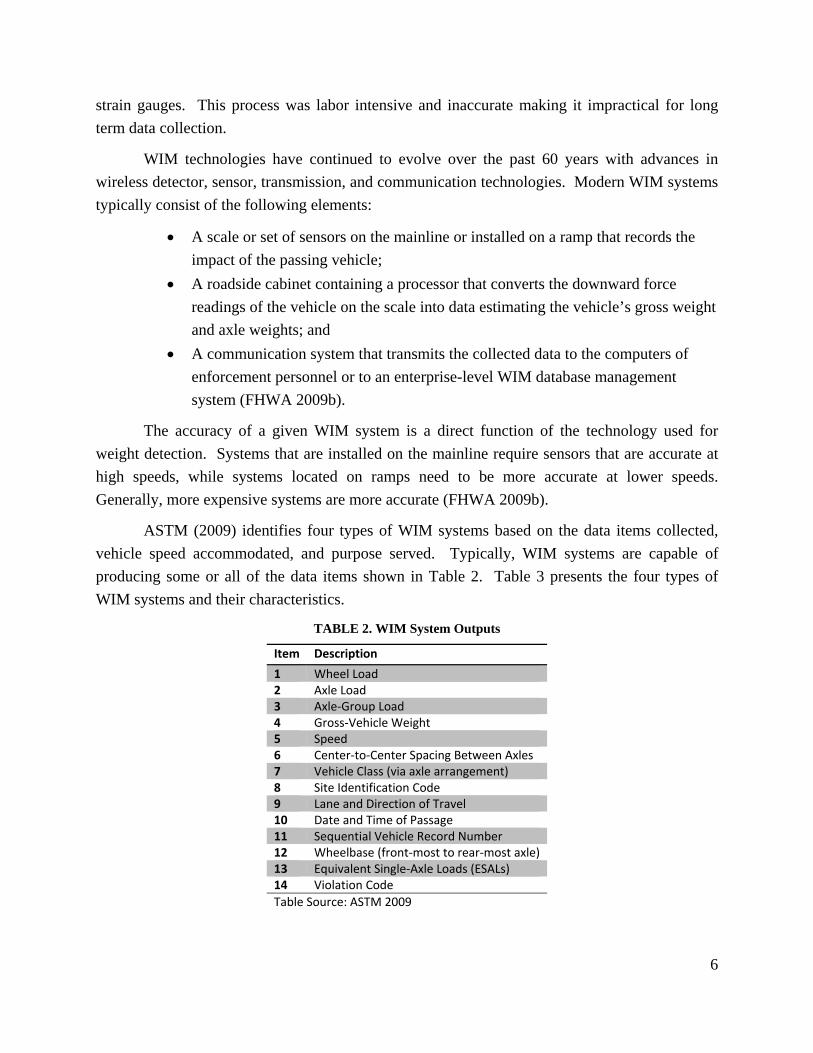
ASTM (2009) identifies four types of WIM systems based on the data items collected,
vehicle speed accommodated, and purpose served. Typically, WIM systems are capable of
producing some or all of the data items shown in Table 2. Table 3 presents the four types of
WIM systems and their characteristics.
TABLE 2. WIM System Outputs
Item Description
1 Wheel Load2 Axle Load3 Axle‐Group Load4 Gross‐Vehicle Weight5 Speed6 Center‐to‐Center Spacing Between Axles7 Vehicle Class (via axle arrangement)8 Site Identification Code9 Lane and Direction of Travel10 Date and Time of Passage11 Sequential Vehicle Record Number12 Wheelbase (front‐most to rear‐most axle)13 Equivalent Single‐Axle Loads (ESALs)14 Violation Code
Table Source: ASTM 2009
7
TABLE 3. WIM Types
Type
Speed Range (mph)
Data Items Produced
Functional Performance Requirements (Tolerance for 95% compliance)
Wheel Load Axle Group Axle‐Group Load Gross‐Vehicle Weight
I 10 to 80 All items ±25% ±20% ±15% ±10%II 15 to 80 All items except
1 ±30% ±20% ±15%
III 10 to 80 All items except 7, 12, and 13
±20% ±15% ±10% ±6%
IV 2 to 90 All items except 7, 9, 12, and 13
≥5000 ±300‐lb(2270 ±140‐kg)
≥12,000 ±500‐lb(5440 ±230‐kg)
≥25,000 ±1,200‐lb (11340 ±540‐kg)
≥60,000 ±2,500‐lb(27220 ±1130‐kg)
Table Source: ASTM 2009
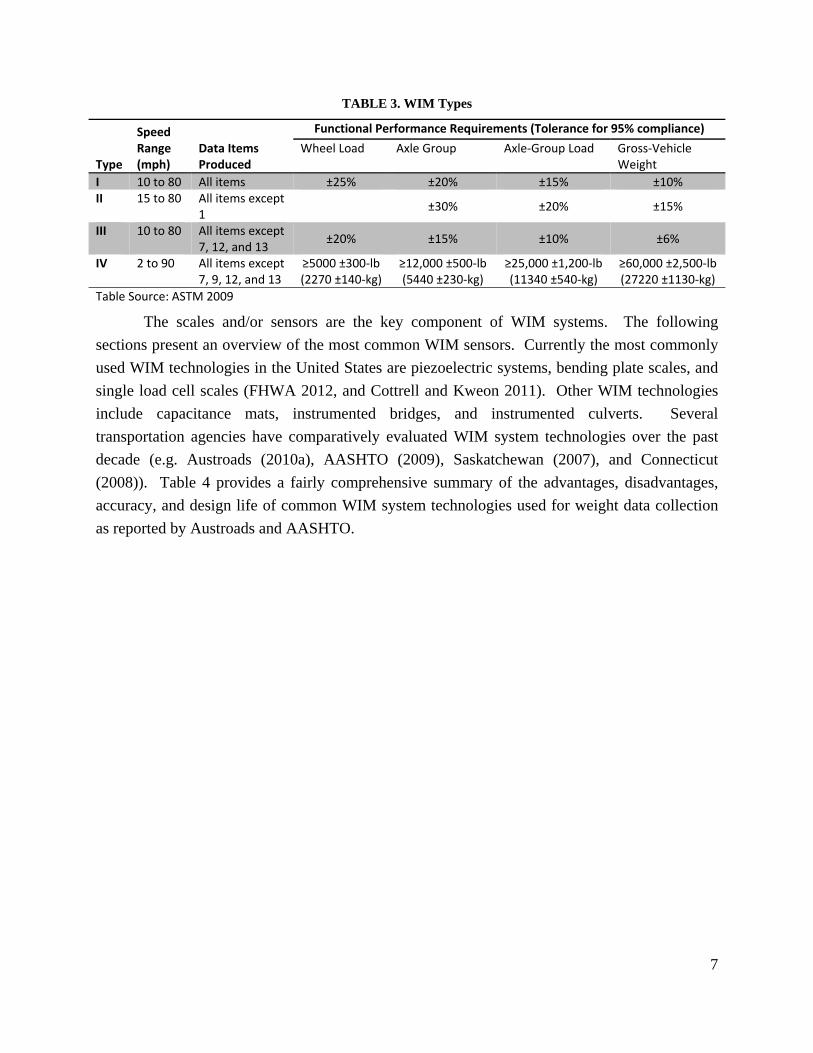
The scales and/or sensors are the key component of WIM systems. The following
sections present an overview of the most common WIM sensors. Currently the most commonly
used WIM technologies in the United States are piezoelectric systems, bending plate scales, and
single load cell scales (FHWA 2012, and Cottrell and Kweon 2011). Other WIM technologies
include capacitance mats, instrumented bridges, and instrumented culverts. Several
transportation agencies have comparatively evaluated WIM system technologies over the past
decade (e.g. Austroads (2010a), AASHTO (2009), Saskatchewan (2007), and Connecticut
(2008)). Table 4 provides a fairly comprehensive summary of the advantages, disadvantages,
accuracy, and design life of common WIM system technologies used for weight data collection
as reported by Austroads and AASHTO.

8
TABLE 4. WIM Technologies
Piezoelectric Sensors The basic sensor in piezoelectric systems is a piezoelectric
material embedded in the roadway. An electric charge is produced when pressure is applied to
the piezoelectric material. By measuring and analyzing the charge produced, the sensor can be
used to measure the weight of a passing tire or axle group. Piezoelectric WIM systems, when
calibrated and installed properly, can be expected to be accurate within 15 percent of the gross
vehicle weight for 95 percent of the vehicles that are measured (Bushman and Pratt 1998).
Based on the piezoelectric material and sensing technology, piezoelectric sensors can be
divided into several sub-types, among which piezo-polymer, piezo-ceramic, and piezo-quartz
sensors are widely used. There are a number of variations on the shape, size, cost, life, and
Technology Advantage Disadvantage Accuracy (GVW)
Sensor Life Span (years)
Bending Plate Well understood, mature technology.
High accuracy of wheel load due to whole footprint of wheel is on the plate at one time.
Resistant to environmental changes.
Requires lane closure for installation and maintenance.
Requires other sensors to classify vehicles.
±10% for 95% of vehicles
15
Piezoelectric Low cost compared to other WIM systems.
Accurate vehicle classification.
Low accuracy due to tire bridging over sensor.
Installation requires pavement cut.
Temperature sensitive (except quartz systems)
±10% for 95% of vehicles
6‐10
Capacitance Mat
Highly portable. Causes dynamic motion, thus, decreasing accuracy.
Highly visible to passing trucks.
±10% not better than ±660‐lb (300‐kg)
20
Instrumented Bridge
Some systems do not require sensors in road surface.
Does not require lane closure for installation or maintenance.
Highly accurate vehicle classification.
Low visibility from the road.
Requires a bridge at the WIM site.
±10% for 95% of vehicles
10
Instrumented Culvert
Does not require lane closure for maintenance.
Low visibility from the road.
Requires other sensors to activate system.
Requires installation of culvert at WIM site.
±10% for 95% of vehicles
10
Table Source: Austroads 2010b, and AASHTO 2009

9
environmental sensitivity of the sensors produced by various vendors. Jiang, et al (2009)
conducted research and evaluated these three types of piezoelectric sensors, specifically
polyvinylidene fluoride (PVDF), polarized ceramic, and quartz piezoelectric sensors. PVDF
sensors can be installed directly into a slot cut into the road with a relatively small cross section
for permanent applications, or taped down for portable applications. The ceramic and quartz
piezoelectric sensors are installed in a cut in the road way. These sensors must be installed flush
with the surface of any existing or new asphalt or concrete pavement surface with epoxy
adhesive. The study verified that the quartz piezoelectric sensor technology has the best weight
measurement accuracy, is insensitive to temperature change, and showed the best overall
performance among these three sensors.
Bending Plate Scale A bending plate scale typically consists of two steel platforms
placed adjacent to each other to cover the width of a traffic lane. Strain gauges are installed on
the steel plates to determine the bending strain in the steel when a tire passes over the plate. The
strain can then be converted to axle load. It is typical to have inductive loops and axle sensors at
the same site to allow for the collection of vehicle length and axle spacing data. (Bushman and
Pratt 1998).
For all bending plate installations, the roadway is cut and excavated to form a pit. The
frame is positioned in place and concrete is placed around the frame to form a secure and durable
foundation for the scale. When properly installed and calibrated, bending plate WIM systems are
expected to provide gross vehicle weights that are within 10 percent of the actual vehicle weight
for 95 percent of the vehicles measured (Bushman and Pratt 1998).
Single Load Cell System Single Load Cell WIM systems utilize a single load cell scale
to detect an axle and weigh both the right and left side of the axle simultaneously. The single
load cell scale consists of two weighing platforms placed adjacent to each other to fully cover the
width of a normal traffic lane. A single hydraulic load cell is installed at the center of each
platform to measure the force applied to the scale. As a vehicle passes over the system, the
measurements from each load cell are analyzed to determine the tire load on each platform and
then summed to obtain the axle weight. When properly installed and calibrated, single load cell
WIM systems are expected to provide a gross vehicle weight that is within six percent of the
actual vehicle weight for 95 percent of the vehicles measured (Bushman and Pratt 1998). Single
load cell scale technology has been developing rapidly over the last decade. Currently, new
techniques have been incorporated into single load cell WIM systems. For instance, the
International Road Dynamics Inc. (IRD) single load cell WIM weigh pads can be used for
medium to high speed WIM and/or vehicle classification applications (IRD 2013).
10
Capacitance Mat Capacitance mat WIM systems are commonly used for portable WIM
applications. A typical system consists of a traffic data logger, inductive loops, capacitance
weight sensor, and optional piezoelectric axle sensors (Austroads 2010a).
The portability of the system is advantageous in that it allows for short-term WIM counts.
Conversely, the portability leads to three primary issues:
The sensor is placed on the surface of the roadway, thus, creating a bump that
leads to dynamic motion of the vehicle;
The sensor is rarely large enough to measure both wheel paths leading to an
incomplete weighing of the vehicles; and
The system is highly visible to drivers, leading to avoidance of the sensor
(Austroads 2010b).
Capacitance mat WIM systems are made of layers of steel and dielectric rubber. In the
same way an electrical capacitor works, the capacitance of the systems is dependent upon the
distance between the steel plates. When a vehicle loads the sensor pad, the distance between the
steel plates is decreased, causing the capacitance to increase. The increase in capacitance can be
used to calculate the deformation of the steel and thus, the load applied to the steel plate
(Austroads 2010a).
Instrumented Bridge Instrumented bridges use strain gauges or transducers affixed to a
bridge structure to measure the deformation of the bridge. Based on the deformation of the
bridge and knowledge of the construction of the bridge, it is possible to determine the weight of
the vehicles traversing the bridge.
In Slovenia, instrumented bridges are the primary type of WIM installation (FHWA
2007). Using strain transducers embedded into the structure of the bridge, it is possible to use a
calibrated influence line for the bridge to determine the weight of individual axles without the
need for loop detectors or piezoelectric axle sensors (AASHTO 2009).
A primary advantage of instrumented bridges is the ability to install and maintain the
systems without lane closures. Another advantage is that it is hard to identify the site from the
roadway, thus limiting the practice of avoiding the sensors. A major issue with instrumented
bridges is the requirement to have a bridge at the location where the WIM system is needed.
Even in the event that a bridge is present, the roadway may not meet the geometric requirements
necessary for the accurate use of a WIM system (FHWA 2007).
Instrumented Culvert Similar to instrumented bridges, instrumented culverts use strain
gauges embedded in culvert installations to determine the weight of passing vehicles. The
system also includes axle sensors placed on the road to collect volume, speed, and classification

11
data. The culverts typically span 7.5 to 8.0-ft (2.3 to 2.4-m) with an internal height of 4.0 to 7.0-
ft (1.2 to 2.1-m). Often the control box for the WIM system can also be housed within the
culvert (Main Roads - Western Australia 2012). As with most WIM installations, instrumented
culvert sites require that the road meets certain criteria in regards to geometry, smoothness, and
grade. It is recommended that the culvert not be used for drainage; this is to ensure that humidity
does not affect the equipment housed in the culvert (Main Roads - Western Australia 2012).
Slow Speed WIM System Slow-speed weigh-in-motion (SWIM) offers an alternative to
the traditional methods of vehicle weight enforcement using static weight scales. SWIM systems
have been used for enforcement in the United Kingdom, much of Eastern Europe, the Middle
East, Asia, and South America (Strathman 1998). ASTM defines a Type IV WIM system as a
SWIM to be designed for use at weight enforcement stations to detect weight-limit or load-limit
violations (ASTM 2009). According to ASTM (2009), this type of WIM system has not yet been
approved for use in the United States, but can be deployed for conceptual development purposes.
SWIM technologies have been developed over the years to increase accuracy and reduce
system life cycle costs. Currently, various technologies are available and many vendors provide
SWIM products to meet the requirements of their clients. For instance, tire-force sensors are
recommended for Type IV WIM systems (ASTM 2009). These sensors should be capable of
estimating load and weight regardless of the lateral position of the tires within the traffic lane.
Innovation and Development WIM sensor technologies have been evolving over the
last 60 years and new types of sensors continue to emerge. Fiber-optic WIM sensors have been
heavily researched since the 1990s. While commercial products are available on the market,
fiber-optic sensors are still not widely accepted or used. Usually, a fiber-optical WIM sensor is
coupled with a photodiode detector and circuit. When a vehicle passes over the sensor and
presses on the fiber, the photodiode detector detects the loss of light intensity. The photodiode
circuit triggers a pulse if the loss of light intensity is large enough. The application would match
pulse pairs from the two sensors, calculate the vehicle speeds, and determine vehicle weights
from the pulses (Mimbela, et al. 2003). Fiber-optic sensors have several advantages over
existing sensors. They are not affected by electromagnetic interference including lighting
strikes, they can withstand harsh environments, and they have low power requirements.
Future innovations and improvements in WIM sensors and systems are aimed to increase
system accuracy, reliability and service life, and to reduce cost, simplify installation and reduce
maintenance. Future WIM sensors need to be robust to endure harsh environments, as well as
have low power requirements. Another trend in WIM system development is for the WIM
sensor/scale to combine/accommodate additional data collection to serve multiple functions such
as thermal imaging, radio frequency identification (RFID), tire profile measurement etc.

12
Cost The cost of a WIM installation and its operation can be highly variable due to the
differing characteristics of each site. Current WIM system cost information was not found in the
literature, but relative cost comparisons can possibly be made based on historic information and
information available from other locales. Bushman and Pratt (1998) stated that the cost of
piezoelectric systems was less expensive than bending plates, followed by load cell systems
being the most expensive. This observation is consistent with cost information published in the
WIM successful practices handbook prepared by Iowa State University (Center for
Transportation Research and Education 1997) repeated in Table 5. Somewhat more current
information available from Canada and Australia is presented in Table 6 and generally indicate
that this pattern continues, with costs increasing in moving from piezoelectric, to bending plate,
to load cell systems. The initial cost of bending plate systems is reported to be similar to, or
substantially higher than that of piezoelectric systems (up to double). When life expectancy and
maintenance costs are considered (Table 6), the cost of a bending plate system is only slightly
higher than a piezoelectric system (20 percent higher), except possibly in the case of quartz
piezoelectric systems. A further factor to consider in assessing costs is system accuracy, with
increased system cost generally corresponding to an increase in accuracy. Bergan, Berthelot, and
Taylor (1996)argued that in weigh station prescreening applications the incremental cost of a
system of improved quality and accuracy was negligible compared to the cost of the weigh
station operations. Measurement quality of less accurate systems, notably piezoelectric systems,
can be improved by installing multiple rows of sensors and collectively analyzing the data they
produce (Zhang, Hass and Tighe 2007).
TABLE 5. WIM System Performance and Cost
WIM System Performance (percent error on GVW at highway speeds)
Estimated Initial Cost per Lane (Equipment and Installation)
Estimated Average Cost per Lane (12‐year life span including maintenance)
Piezoelectric Sensor ±10% $9,500 $4,224 Bending Plate Scale ±5% $18,900 $4,990 Double Bending Plate Scale
±3‐5% $35,700 $7,709
Deep Pit Load Cell ±3% $52,500 $7,296
Table Source: Center for Transportation Research and Education 1997

13
TABLE 6. WIM System Costs
Cost Per Lane Piezoelectric Sensor
Bending Plate
Single Load Cell
Quartz Piezoelectric Sensor
Strain Gauge (Instrumented Culvert)
Capacitance Mat
Initial Installation (US$) Low (around $9,000)
Medium (around $20,000)
High (around $50,000)
Medium (around $20,000)
Annual Life Cycle Cost (US$)
Low (around $5,000)
Medium (around $6,000)
High (around $8,000)
High
Estimated Initial Cost (AU$)
$30,000 $20,000 $30,000 $30,000
Table Sources: Zhang, Hass and Tighe, 2007, and Austroads, 2010b
WIM Calibration Calibration of WIM systems is an important step in ensuring that the
data being received from the sites are of the highest possible quality. Papagiannakis, Quinley
and Brandt (2008) presented three general methods for calibration: test truck, traffic trucks, and
traffic data quality control (QC).
ASTM E1318 (2009) provides a test truck method that consists of a six step process:
1. Adjust all WIM settings to vendor’s recommendations or to a best estimate of
proper setting based upon previous experience.
2. Provide means for calculating the reference-value vehicle speed for each run of
each test vehicle over the WIM system sensors.
3. Have each of the two test vehicles make a series of three or more runs over the
WIM system sensors at the minimum, legal maximum, and an intermediate speed
for a total of nine or more runs per vehicle.
4. Calculate the difference in the WIM system estimate and the respective reference
values.
5. Determine the necessary changes, according to the vendor’s recommendations, to
the WIM system settings.
6. Install settings determined in step 5 and have each test vehicle make two more
runs over the WIM system at two different speeds.
Using traffic trucks involves comparing the static weight of trucks in the traffic stream
against the weight reported by the WIM equipment. This is often accomplished through
comparing the front axle weights of the trucks in the traffic stream to an expected average. This
method is advocated by the Traffic Monitoring Guide (FHWA 2012).
The third method for calibration is through traffic data QC. This method can identify and
adapt to calibration drift. By monitoring and comparing trends in the traffic stream, it is possible
to identify a situation in which the WIM system is out of calibration. Either automatic
14
adjustments or re-calibration can be used to rectify the calibration issue (Papagiannakis, Quinley
and Brandt 2008).
All WIM sites will require occasional calibration due to changes in the road surface
condition, equipment degradation, road construction over the WIM site, and other environmental
variables (ASTM 2009). Many states reported that combinations of the three calibration
methods are used and that calibration is required every six to 24 months (Papagiannakis, Quinley
and Brandt 2008).
Virtual Weigh Station
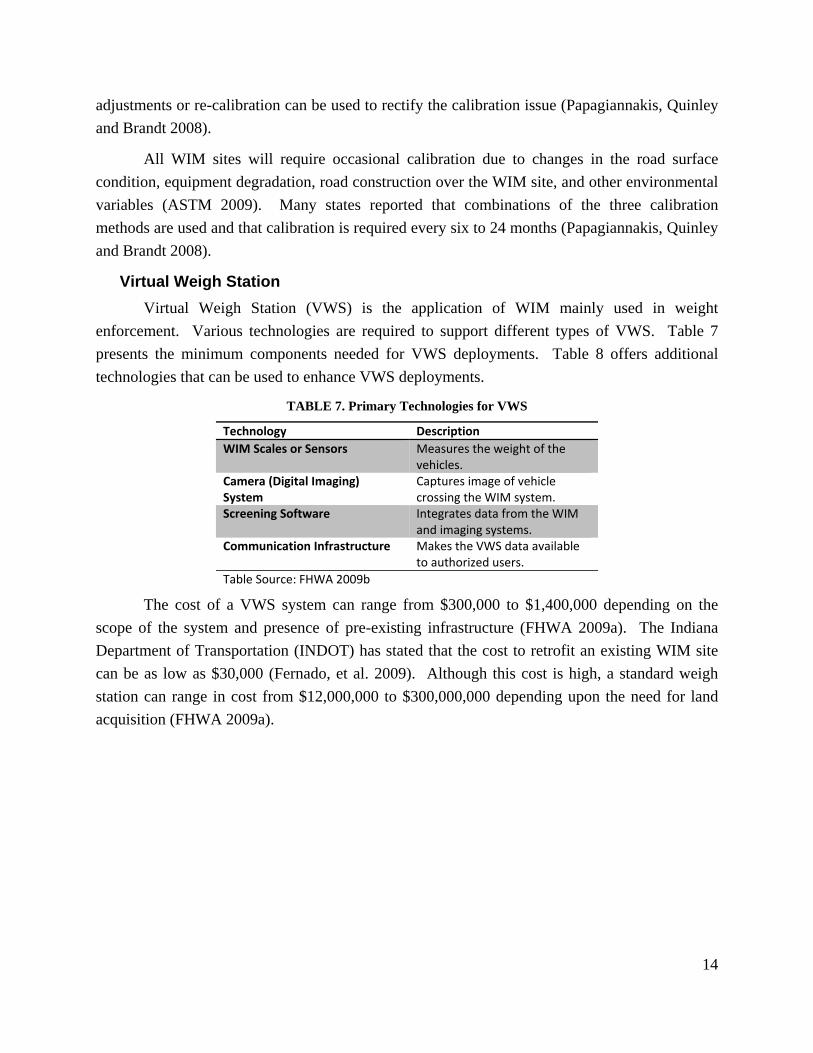
Virtual Weigh Station (VWS) is the application of WIM mainly used in weight
enforcement. Various technologies are required to support different types of VWS. Table 7
presents the minimum components needed for VWS deployments. Table 8 offers additional
technologies that can be used to enhance VWS deployments.
TABLE 7. Primary Technologies for VWS
Technology Description
WIM Scales or Sensors Measures the weight of the vehicles.
Camera (Digital Imaging) System
Captures image of vehicle crossing the WIM system.
Screening Software Integrates data from the WIM and imaging systems.
Communication Infrastructure Makes the VWS data available to authorized users.
Table Source: FHWA 2009b
The cost of a VWS system can range from $300,000 to $1,400,000 depending on the
scope of the system and presence of pre-existing infrastructure (FHWA 2009a). The Indiana
Department of Transportation (INDOT) has stated that the cost to retrofit an existing WIM site
can be as low as $30,000 (Fernado, et al. 2009). Although this cost is high, a standard weigh
station can range in cost from $12,000,000 to $300,000,000 depending upon the need for land
acquisition (FHWA 2009a).

15
TABLE 8. Secondary Technologies for VWS
Technology Description
License Plate Reader Captures and image of the vehicle’s license plate and uses optical character recognition to determine the license plate number.
Commercial Vehicle Information Exchange Window
Provides real‐time access to motor carrier safety and credentials data.
State‐issued Permit Compliance
Verifies that the proper permits exist if the vehicle is overweight.
Repository of Past Weight Performance
Provides real‐time access to the vehicle’s previous compliance records.
Driver Identification System Accurately identifies the operator of the vehicle while the vehicle is in motion.
Augmented WIM Scales Enhance the accuracy of the WIM scales.Two‐way Communication Provides the ability to share data from the vehicle.
Table Source: FHWA 2009b
While VWS is discussed in more detail in a later section of this report on the use of WIM
in weight enforcement, several VWS technologies used in prescreening vehicles at weigh
stations are introduced below. Currently, several commercial systems are available to be
incorporated with WIM or VWS for weight enforcement prescreening to reduce the time truckers
spend at weigh stations while also improving highway safety. These technologies have been
successfully implemented by several state Departments of Transportation (DOTs) and are
promoted by the United States Department of Transportation (USDOT). The following
paragraphs describe the commercial systems that have been successfully implemented by various
states.
PrePass PrePass makes it simple to pre-screen vehicles that are enrolled in the program.
When participating trucks approach a roadside weigh station, in-cab technology communicates
information about the driver, the truck, and the trucking company to an above-the-road monitor
or to an inspection officer’s hand-held device. If no compliance issues are found, the driver is
allowed to bypass the inspection facility without stopping (Help 2013).
360Smart View 360Smart View is a system that uses high-definition cameras to read a
truck’s DOT number and license plate as it enters an inspection station. The information
(collected from about 90 government databases) provides inspection officers with a compliance
snapshot for that carrier. This technology allows law enforcement to work with multiple state
and federal agencies and identify non-compliant carriers, which helps enforcement officials get
bad trucks and unsafe drivers off the road (Help 2013).
NORPASS The North American Preclearance and Safety System(NORPASS) is a
partnership of state and provincial agencies and trucking industry representatives who are
committed to promoting safe and efficient trucking throughout North America. Each trucker
who registers his/her vehicle to participate in NORPASS receives a small transponder to mount
16
on the windshield. As the truck approaches a NORPASS weigh station, a roadside reader detects
the transponder and a computer in the scale house checks the credentials. Some stations are also
equipped with WIM equipment. If everything passes, a signal is sent back to the truck and the
transponder gives a green light indicating that the driver may bypass the weigh station. If a
problem is detected with the truck, the transponder returns a red signal, indicating that the driver
must pull in. The system also samples randomly so any participating trucker can expect to
receive an occasional red light (NORPASS 2013).
Green Light Green Light is a truck weigh station pre-clearance system used only by
Oregon. Green Light is a state owned, operated, and administered database. As trucks approach
the weigh station, WIM is used to determine the weight of the vehicles at high-speed, while
automatic vehicle identification devices look for signals from a palm-size transponder mounted
inside the truck windshields. The transponder contains only a 10-digit number that is used to
identify the carrier and specific truck. A computer takes in all the information, verifies truck size
and weight, checks the carrier´s registration and safety records, and sends a green light signal
back to the transponder if the truck is "good to go" past the station (ODOT 2013).
Traffic Data Transmission and Management
The inherent efficiencies of contemporary digital technologies allow traffic monitoring
programs to generate tremendous amounts of data. Consequently, the transmission of the large
amount of traffic data from field sites to data control centers is an important aspect of traffic data
collection programs. This section presents an overview of some of the data communication and
management technologies used by various entities.
Data Communication Technologies
Communication between ATR/WIM sites and traffic control centers is an integral part of
all traffic monitoring programs. In some cases, end users rely on real-time communications with
traffic data collection sites. For instance, weight enforcement activities in Slovenia rely on real-
time communication between WIM sites and the enforcement personal (FHWA 2007). In
Minnesota, the Minnesota State Patrol (MSP) relies on real-time communication as part of their
virtual weigh station program (Mn/DOT 2007).
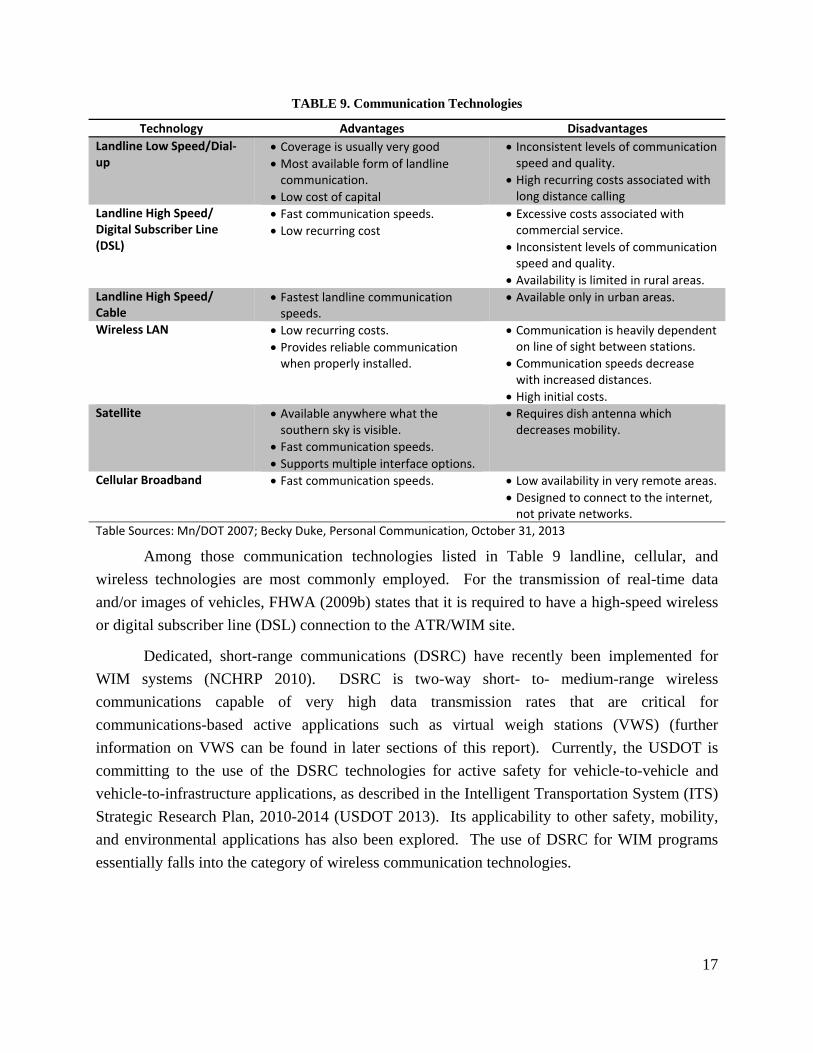
Data communication technologies for WIM programs were reviewed by Mn/DOT
(2007). Table 9 presents the various communication technologies along with their advantages
and disadvantages summarized by the Mn/DOT study.
17
TABLE 9. Communication Technologies
Technology Advantages Disadvantages
Landline Low Speed/Dial‐up
Coverage is usually very good Most available form of landline communication.
Low cost of capital
Inconsistent levels of communication speed and quality.
High recurring costs associated with long distance calling
Landline High Speed/ Digital Subscriber Line (DSL)
Fast communication speeds.
Low recurring cost Excessive costs associated with commercial service.
Inconsistent levels of communication speed and quality.
Availability is limited in rural areas. Landline High Speed/ Cable
Fastest landline communication speeds.
Available only in urban areas.
Wireless LAN Low recurring costs. Provides reliable communication when properly installed.
Communication is heavily dependent on line of sight between stations.
Communication speeds decrease with increased distances.
High initial costs. Satellite Available anywhere what the
southern sky is visible.
Fast communication speeds.
Supports multiple interface options.
Requires dish antenna which decreases mobility.
Cellular Broadband Fast communication speeds. Low availability in very remote areas.
Designed to connect to the internet, not private networks.
Table Sources: Mn/DOT 2007; Becky Duke, Personal Communication, October 31, 2013
Among those communication technologies listed in Table 9 landline, cellular, and
wireless technologies are most commonly employed. For the transmission of real-time data
and/or images of vehicles, FHWA (2009b) states that it is required to have a high-speed wireless
or digital subscriber line (DSL) connection to the ATR/WIM site.
Dedicated, short-range communications (DSRC) have recently been implemented for
WIM systems (NCHRP 2010). DSRC is two-way short- to- medium-range wireless
communications capable of very high data transmission rates that are critical for
communications-based active applications such as virtual weigh stations (VWS) (further
information on VWS can be found in later sections of this report). Currently, the USDOT is
committing to the use of the DSRC technologies for active safety for vehicle-to-vehicle and
vehicle-to-infrastructure applications, as described in the Intelligent Transportation System (ITS)
Strategic Research Plan, 2010-2014 (USDOT 2013). Its applicability to other safety, mobility,
and environmental applications has also been explored. The use of DSRC for WIM programs
essentially falls into the category of wireless communication technologies.
18
Data Management
A typical WIM system meeting the Type I requirements of ASTM E 1318 (2009) has the
capability of producing continuous high quality traffic data for a multilane roadway location for
the 14 data elements for each vehicle previously listed in Table 2.
Usually, a WIM system’s controller stores both summary (binned) data and individual
vehicle record (IVR) data for each day. For binned data, all of a day’s vehicles are typically
binned by count for hour-of-day, lane, classification, and speed range; while the IVR data
includes data elements for individual vehicles (FHWA 2010).
After these raw data have been communicated to the data control center, a software
application is then utilized to process the raw data, including validation of quality and the
generation of reports, ASCII files, and IVRs. Usually, WIM system vendors provide the data
processing software for their clients. In other cases, some agencies utilize their own custom
software applications or third party software to process the raw data, as well as to automate the
raw data transferring and/or performing data validation checks to ensure data completeness and
accuracy. Usually quality control rules check for incoming data format, volume
minimums/maximums, vehicle classification comparisons, identification of atypical days
(holidays), etc. Typical in-house software is capable of generating output reports in the FHWA’s
Traffic Monitoring Guide card format; generating daily, weekly, monthly, or continuous
summary reports in hourly increments based on vehicle speed; classification; ESAL; and weight
summaries on a lane by lane or directional basis. The typical in-house software can also
generate reports on errors, auto-calibration, site history, calibration history, and overweight
vehicles. The following sections, while not exhaustive, present just a few typical examples of
successful data processing and presentation software suites.
Travel Monitoring Analysis System The Travel Monitoring Analysis System (TMAS)
is a traffic data reporting tool created by FHWA to assist in the submission of data to FHWA.
TMAS offers many quality control checks to ensure that data is of adequate quality for use in
Federal programs. TMAS also allows for easy data sharing between states, with all data being
readily available in one location. TMAS version 1.0 was released in August 2007 with the intent
of replacing the Traffic Volume Trends system. The newest version, TMAS 2.0, was released in
September 2012 (Jessberger 2012). Many quality control improvements have been made as well
as improvements to the usability of the data.
TMAS 2.0 performs numerous quality control checks including volume, classification,
and weight checks. Many of the volume checks are performed to ensure that a complete data set
has been entered. The classification checks compare historical data to the newly entered data to
19
ensure that the new data are within acceptable variation limits. The weight checks compare
expected ranges of various metrics to ensure that the weight data are reasonable.
TMAS 2.0 can output reports on volume and classification. The volume reports can be
refined to include information on state traffic volume trends, station by hour, monthly average
daily traffic (MADT) by month with average annual daily traffic (AADT) by station/state, and
volume data uploaded by state and month. The classification reports can include class by day,
hour, and site; class by station with no data on weight; class by station monthly by day; station
multi-year by month; and class by Highway Performance Monitoring Systems (HPMS) vehicle
types by state (Jessberger 2012).
Weigh-in-motion Compliance Analysis Tool Weigh-in-motion Compliance Analysis
Tool (WIMCAT) is a software product produced by Purdue University using Visual Basic and is
currently used by Mn/DOT and INDOT (FHWA 2009b). WIMCAT helps with the analysis and
tracking of WIM data through a variety of built-in checks and algorithms. Major functions
performed by WIMCAT include:
Charting violation rates,
Providing information to assist in optimizing enforcement scheduling,
Automating the production of performance measures,
Facilitating the production of pavement damage estimates,
Flagging potential WIM equipment and raw data problems, and
Serving as a preliminary step in creating a vision for a Central Operating System
(Mn/DOT 2007).
As of 2007, WIMCAT only processed data on Class 9 and 10 vehicles to simplify its use
in the earlier development stages. The classifications to be monitored were chosen due to their
representation of the majority of heavy vehicles found in the traffic stream (Mn/DOT 2007).
WIMCAT analyzes the data and flags any abnormal or erroneous data. Some of the
checks target unreasonably high vehicle weights, differences between the left and right side of an
axle, and confirm the speed based on axle spacing. The error reports from WIMCAT can be
used to determine when calibration operations need to be performed at a given WIM site.
WIMCAT also automates the production of reports for performance measures. The
following list presents the measures that WIMCAT is able to directly report:
Percent of over-weight vehicles by class and violation type,
An excessive load ratio (ELR) taking both magnitude and volume into
consideration,
Percent over-weight trucks by levels of magnitude (ex. 0 to 10-kip (0 to 44-kN),
10 to 20-kip (44-kN to 88-kN, etc.),
20
Pavement damage due to over-weight vehicles (in dollars),
Violations listed by hour-of-day, and
Violations listed by day-of-week (Mn/DOT 2007).
Any of the data can then be used for making policy decisions, scheduling enforcement,
and/or special use reports. For scheduling enforcement, WIMCAT reports are able to track
trends that can be used to determine where enforcement efforts should be focused.
Survey Processing Software The Survey Processing Software (SPS) package was
developed by the Florida Department of Transportation (FDOT) to give the districts of Florida a
software package that would assist in traffic data quality control and data submittal. SPS was
developed using Microsoft Access, and performs four main functions: converting raw data to a
uniform format, loading the data to the SPS database, performing quality control checks, and
uploading data to the SPS mainframe (FDOT 2007).
SPS was designed to work with a variety of traffic counting devices produced by many
different vendors, which allows FDOT to save money by only needing to train technicians on
one piece of software instead of many. After data are uploaded to the SPS system the software
converts the data to a standard format regardless of the equipment that produced the data. Data
are then loaded into a database, where SPS organizes them into 24-hour blocks starting with the
first data interval. Next, a check is performed to ensure that 24-hours of data are available. If
this is not the case, the data are rejected. Then, SPS performs 14 quality control checks that
range from ensuring data integrity by checking the validity of counter-station identification
numbers to checking maximum volume per lane. If any checks are not passed the data are
flagged, and an operator must manually review the data.
After the data has passed the quality control checks, they are uploaded into a central
mainframe. Once the data has been successfully loaded to the mainframe, they are made
available for access by FDOT personal. Three reports are automatically made available: annual
summary record, daily volume record, and daily vehicle classification record. It is also possible
to create other reports if more specific information is required.
Traffic Count Database System The Traffic Count Database System (TCDS) is a
subscription based software and database service offered by Midwestern Software Solutions
(MS2, Ann Arbor, MI). TCDS performs various traffic data tasks from automatic quality control
to data visualization. Having been designed to accept input from a wide range of traffic counting
devices, TCDS allows for the consolidation of data into one central database. To visualize data,
TCDS can output a variety of reports and maps. Using a web-based interface also allows for the
use of geographic information systems (GIS) to access and visualize data from any location with
internet access.

21
TCDS is used by over 140 road agencies throughout the United States (MS2 2013). The
agencies range from State DOTs to MPOs. TCDS offers the following systems modules:
Pedestrian count database system,
Traffic signal management system,
Traffic crash location system,
Travel time database system,
Road sign management system,
Pavement management system,
Project management database system, and
Real time traffic system.
TCDS performs many quality control checks for data as it is being entered into the
database. The checks for volume and weight data are as follows (L. Wood, personal
communication, August 14, 2013):
Missing Local ID
Count Exists in TCDS
Partial Count
Duplicate Unassigned Count
Consecutive Identical Hours
Data Completeness – Short Count
Zero by X or More
Previous Year Month/ Day Average
MADT – Out of tolerance
Class Percentage
Peak Hour Percentage of Total
Directional Split
AADT – Out of Tolerance
Hourly Volume out of Range
Missing Related Count
Error on Related count
Average Steering Axle Weight
Number of Zero WIM Hours
22
TCDS will also output the following error codes for WIM data:
Fatal Error: Vehicle with over 25 axles or fewer than 2 Axles
Caution: Total Average weight not equal sum of axle weights
Caution: Any axle of vehicle out of 1 to 50-kip (4.4 to 222-kN) range
Caution: Any axle spacing of vehicle out of 1 to 50-ft (0.3 to 15.2-m) range
Warning: Vehicle with 13 to 25 axles
Overweight: Overweight limit in bold red
Traffic Data Users and Uses
Traffic data have many uses. State DOTs, MPOs, cities, counties, and other
transportation agencies use traffic data mainly to serve their internal needs, with state DOTs in
all likelihood being the primary user agency. DOT internal data uses include weight
enforcement, pavement design, transportation planning, policy making, freight management,
traffic safety, asset management, etc. In addition to serving internal DOT users, traffic data are
very useful to other government agencies, such as the Department of Commerce, Department of
Energy, and Department of Homeland Security, as transportation is an integral part of almost all
social and economic activities in contemporary culture.
With the advancement of information and communication technologies, as well as the
increased transparency of public agency operations, traffic data collected by transportation
agencies have been made more and more accessible to non-government users, such as
universities, research institutes, consulting companies, and even the general public. Many states
make historical traffic data available on their websites in a variety of formats, with one such
format increasingly being interactive maps with data collection sites marked, which when
selected by the user, further show what data is available at the site with an active link to that
data.
Recently, traffic data uses by the general public have become more common with the
advent of GPS enabled smart phones. Some companies have started to collect traffic data to
serve their clients. For instance, Google has begun using data collected through contracts with
DOTs and anonymous location and speed data sent from users of its Maps application, to give
up-to-the-minute congestion data to the users of their Maps application (Google 2009).
This section focuses on four major state DOT uses of ATR/WIM data, namely weight
enforcement, VWS, freight management, and pavement design. New developments in each area
are then reviewed and summarized followed by a brief description of other traffic data related
needs. A review of state DOT websites nationwide found that 22 states provide various elements
of their traffic data through an interactive map format.

23
Weight Enforcement
AASHTO has identified WIM as a focus technology for enhancing the effectiveness and
efficiency of vehicle size and weight enforcement in the United States (FHWA 2007).
According to a study conducted by FHWA (2007), weight enforcement using WIM systems
improves the delivery of enforcement services and motor vehicle activities, reduces emissions,
and enhances commercial and general motor vehicle safety. One of the common applications of
WIM technologies for weight enforcement is for the prescreening of truck traffic (Regan, et al.
2006). The use of WIM data for direct enforcement or automatic issuance of citations has not
gained legal clearance in many countries. One of the main hurdles for the use of WIM for direct
enforcement is the accuracy of the devices.
Many European countries have a long history of using WIM system for weight
enforcement, among which Slovenia, The Czech Republic, and France have the most advanced
programs. Slovenia does not have any fixed weight stations throughout the country but instead
relies on mobile static scales and permanent WIM systems. Enforcement personnel utilize the
data from WIM sites to identify overweight vehicles. After identification, the overweight
vehicles are directed to a safe area for static weight measurements (FHWA 2007).
Instead of using calibrated scales in conjunction with WIM pre-selection systems, the
Czech Republic has employed the Weigh-In-Motion Enforcement (WIM-E) system
manufactured by Traffic Data Systems GmbH to monitor heavy vehicle compliance and in the
event of a violation, to provide evidence for further prosecution. The first WIM-E system was
installed in December, 2007 and was approved by the Czech Meteorological Institute (CMI) in
Brno on August 15th, 2008. The system is equipped with two or three rows of sensors and one
double inductive loop per lane. The vehicle, driver, and current traversal are documented by
means of an infrared (IR) photographic camera and an IR sequence camera. With a fully
automatic process for continuously checking and registering overloaded vehicles, WIM-E
requires no subsequent manual weighing (Traffic Data Systems GmbH 2013).
France has one of the most extensive WIM networks in Europe with over 200
installations throughout the country (FHWA 2007). As of 2007, France used low-speed WIM
for direct enforcement operations. To address the accuracy required for direct enforcement using
high-speed WIM, France has developed an automatic calibration procedure that compares static
vehicle weights against the weights calculated by the WIM system. It is expected that fully
automatic weight enforcement will be in use within the next 20 years (FHWA 2007).
In the United States, use of WIM data and systems assist in weight enforcement is not a
new practice. The Montana Motor Carrier Services (MCS) has employed the State Truck
Activities Reporting System (STARS) program to improve the efficiency and effectiveness of
24
enforcement activities since 2000. While not used to dispatch enforcement in real-time, the
STARS program did monitor the temporal and areal distribution of overweight vehicles with
data collected from the WIM sites for a base year. This analysis of the data helped to plan an
enforcement deployment for the next year to best cover the locations and times where the most
weight violations were occurring. A study sponsored by MDT (Stephens and Carson 2005)
evaluated the STARS program and concluded that the the STARS program was successfully
used to reduce infrastructure damage from overweight vehicles.
In Minnesota, WIM systems are used for screening and selection of vehicles that should
be weighed with static scales. Due to pavement and weather conditions, many WIM systems are
only 90 percent accurate (Mn/DOT 2013). When using the WIM system to identify over-weight
vehicles, the WIM system accuracy is taken into consideration. For instance, Mn/DOT (2013)
stated, “With the systems being about 90 percent accurate, Class 9 and 10 vehicles that have a
legal weight limit of 80,000-lb (36290-kg) are not pulled over unless the WIM indicates that they
weigh more than 88,000-lb (36290-kg).” The WIM systems also have several warnings that
indicate if the system is operating correctly. If any error warning occurs, the WIM data will not
be used as a basis for intercepting the possible violator.
According to a study conducted by FHWA (2009b), Washington State includes WIM
technology at 14 of its weigh stations, which weigh over 80 percent of the State’s commercial
vehicles. The mainline WIM system is linked to a camera that takes a picture of a vehicle as it
crosses the WIM sensors; the image is recorded along with the vehicle’s weight data. In
Washington State, automatic identification of vehicles with transponders is done through the
Commercial-vehicle Roadside Information Sorting System (CRISS). After a vehicle is
identified, a query is made of the Commercial Vehicle Information Exchange Window
(CVIEW). The credential information contained in CVIEW is checked to ensure that the vehicle
is conforming to the State’s screening criteria. Any vehicle that has acceptable credentials is
signaled to bypass the weigh station. Any vehicle that is not equipped with a transponder is still
required to stop at the static weight station. The CRISS software displays a picture and weight
information for each vehicle as it approaches the weigh station. An algorithm determines if there
are any potential axle weight violations, which are highlighted on the computer screen at the
scale house. CRISS was the first system in the U.S. to associate digital photos of trucks with
their vehicle data on a weigh station computer to aid in visual identification and enforcement.
Wisconsin DOT has been using WIM technology for data collection but has been
reluctant to allow shared use of the data with the Division of State Patrol. The main concern
with sharing the weight data is a fear that the data will become distorted if carriers intentionally
avoid the locations with WIM installations for fear of enforcement actions (WisDOT 2013). The
need to protect the integrity of the WIM data is not unique to Wisconsin. Many states are

25
searching for innovative ways to ensure reliable and accurate data are and continue to be
collected. Recently, Louisiana passed a state law mandating WIM coupled with an Enforcement
Camera System to combat weigh-station bypass and ensure the integrity of the traffic data
collected (Louisiana 2012).
In addition to mainline implementation, WIM scales are also installed on the entry ramps
of weigh stations to weigh and sort vehicles at low speeds (FHWA 2009b). As a truck passes
over the ramp WIM site, it is prescreened for weight compliance. If the vehicle is within legal
limits, it is directed to a bypass lane and is allowed to return to the traffic stream. Conversely, if
the truck is above the prescribed threshold, it is required to stop at the static weight station for
further inspection. Compared to mainline WIM systems, ramp WIM systems weigh vehicles
moving at lower speeds and provide a more accurate measure of a vehicle’s weight (FHWA
2009b). It is reported that Kentucky, Michigan, Mississippi, and Indiana have utilized ramp
WIM at some of their weigh stations.
Virtual Weigh Stations
Another use of WIM installation for enforcement is VWS. The definition of the term
VWS is somewhat ambiguous, with the nature of VWS deployments varying widely across
states. Commonly, VWS refers to unstaffed and remotely monitored roadside enforcement
facilities. FHWA (2009b) made the following comparison of VWS to a traditional weight
station, “VWSs expand the geographic scope and effectiveness of a state’s truck size and weight
enforcement program by monitoring and screening commercial vehicles on routes that bypass
fixed inspection stations and on secondary roadways, as well as in heavily populated urban or
geographically remote locations where it may be difficult to deploy traditional enforcement
operations.”
As described in previous sections, VWS systems generally consist of:
WIM scales or sensors,
Camera (digital imaging) systems,
Screening software, and
Communication infrastructure (FHWA 2009b).
The following types of technology also may be deployed in order to support additional
VWS functionality:
License plate recognition (LPR) and/or USDOT number reader system,
Commercial Vehicle Information Exchange Window (CVIEW) or an equivalent,
State-issued permit compliance,
Repository of past weight performance,
26
Driver identification system,
Augmented WIM scales, and
Two-way communication (FHWA 2009b).
VWS often include a combination of cameras and sensors to accurately identify trucks
that do not need to stop at a static weigh station (Miller and Sharafsaleh 2010). According to a
study by Austroads (2010b), a possible ten-fold reduction in disruption costs can be realized by
using VWS as compared to static processes that require total interception of heavy vehicle
traffic. Recently, the AASHTO Technology Implementation Group (2009) launched a program
to encourage the deployment of VWSs in the United States and documented the best VWS
practice in several lead states.
FDOT employs a Virtual WIM ByPass System to curb avoidance of weigh station
facilities by heavy vehicle drivers. By using LPR systems in conjunction with WIM systems on
freeway ramps, FDOT is able to determine the compliance of heavy vehicles. If a vehicle is
found to be in violation of weight limits, an FDOT Motor Carrier Compliance Office computer
determines the penalty (FDOT 2008). At some sites, FDOT also employs Cargoscan3D
measuring lasers to capture 3-D image of vehicles with arrows identifying highest and widest
points (AASHTO 2009).
California initiated research into VWS in 2004 to address the safety and congestion
problems on I-710 due to the high volume of commercial motor vehicle traffic and the number of
overweight vehicles (Miller and Sharafsaleh 2010). A year later, Caltrans deployed a prototype
virtual weigh station, which was on display at the 12th Intelligent Transport Systems World
Congress. The prototype virtual weigh station’s in-pavement technical components include a
bending plate WIM scale, a vehicle detection system, and a camera triggering system. The VWS
prototype was used to collect data that was then utilized by the California Highway Patrol to
intercept over weight vehicles and perform static inspections. The data are also used to
determine patterns of overweight vehicles and to schedule enforcement activities. In California,
the VWS prototype often operates in conjunction with a PrePass transponder reader, which is an
automatic vehicle identification (AVI) system that enables participating transponder-equipped
commercial vehicles to be pre-screened throughout the nation at designated weigh stations, port-
of-entry facilities, and agricultural interdiction facilities.
INDOT, working closely with State Police, Motor Carrier Services, and Purdue
University, has researched and deployed VMS since 2002 (AASHTO 2009). The VWSs in
Indiana use existing fixed WIM scales along with remote cameras technology and wireless
communications to provide real-time weight data for enforcement screening. Moreover, the data
collected are analyzed for trend identification and targeting enforcement activities (AASHTO

27
2009). In North Dakota, all WIM sites are setup for both screening and basic traffic monitoring
(FHWA 2009b). State Troopers screen trucks as they pass by the WIM installation, receiving
weight data through radio communication with their laptop computers. North Dakota’s activities
are reported in more detail in the survey section of this report.
The VWS program in Minnesota was built upon the Minnesota Statewide Commercial
Vehicle Weight Compliance Strategic Plan (2005), aimed to preserve Minnesota’s infrastructure
by minimizing damage from overweight trucks. A primary focus of the program was building a
Virtual Weigh Station “starter” system at a reasonable cost and within a short time frame. This
was accomplished by using current WIM scales and applications for weight enforcement
purposes. Through the VWS program Mn/DOT has been able to outfit all of its WIM sites with
basic VWS functionality and has created nine fully functional VWSs. Incorporating digital
imaging and dynamic feedback technologies, WIM scale data are processed in new ways to
create performance measures for tracking progress and for real time enforcement screening
(Starr, et al. 2008).
The real compliance, safety, and operational benefits of VWS will be seen if the United
States is able to move towards a direct enforcement regime using advanced technology. The
system accuracy and some legal implication issues should be tackled before using weight data
for direct enforcement. Research efforts should be directed to developing VWS systems that are
capable of determining vehicle and axle weights with sufficient accuracy to enable the issuance
of citations for violations. Experiences from jurisdictions in the United States that use
direct/photo enforcement for red-light running and driving through an automated toll lane
without a transponder could be useful in this regard. Moreover, the institutional and legal
implications associated with issuing citations and/or warnings based on an automated system
should also be researched.
Highway and Pavement Design
Highway and pavement design is another major application of traffic data. The AADT,
K-factor, D-factor, and traffic growth factor are all estimated from traffic count data, which are
then used to determine the directional design hourly volume (DDHV) for highway design. In
addition, the traffic count and weight data provide the main inputs for pavement design. The
traditional AASHTO pavement design method acts on the number of ESALs expected across the
design life of a section of roadway to produce a pavement design. The relationship between
ESALs, which are dependent on vehicle axle weights and configurations – often determined
from WIM data, and pavement performance was empirically established based on an extensive
test program conducted many years ago. Recently, AASHTO developed a new mechanistic-
empirical pavement design method, which as the name implies, is the result of an extensive
effort to better characterize pavement performance based on engineering principles as well as
28
empirical observations. This design method has been implemented through the Mechanical-
Empirical Pavement Design Guide (MEPDG). With the introduction of MEPDG, the future
pavement design will rely more on traffic data inputs. The traffic data required by the MEPDG
include many metrics relating to the speed, volume, configuration, and weight of the vehicles in
the traffic stream. All required input data are obtained from traffic data collection programs.
Axle weight data by vehicle configuration typically collected by WIM systems are used to
generate axle load spectra, which are an essential and fundamental element in the mechanistic-
empirical design method (replacing the use of ESALs).
Currently, many states in the U.S. are calibrating the MEPDG software and preparing for
the use of this new approach in their pavement design. To support the new design method, the
North Carolina Department of Transportation (NCDOT), for example, sponsored a study to
develop the required inputs from WIM data (Stone, et al. 2011). This study developed seasonal
vehicle classification and truck axle loading clusters for site specific, regional and statewide
traffic inputs to be used in the mechanistic-empirical design approach. In addition, vehicle class
forecasting methods were proposed for MEPDG procedures.
Software has been developed to process WIM data in order to create the inputs required
by the mechanistic-empirical design approach. For example, PrepME, software developed by
Dr. Calvin Wang, University of Arkansas, is capable of inputting raw data into database tables,
performing traffic data checks, interpolating traffic data, and preparing 11 files that can be
directly imported into MEPDG software (Brogan, et al. 2011). Another example is the Bull
Guide software developed by Prof. Taek Kwon, University of Minnesota, Duluth, for visualizing
and evaluating WIM data for load spectra and creating input files for MEPDG software
(Mn/DOT 2011).
Freight and Fleet Management
Commercial motor vehicle carriers can benefit from the data provided by a traffic
monitoring program in many ways. Miller and Sharafsaleh (2010) studied the use of WIM data
for commercial motor vehicle carriers and summarized some of the benefits as:
Improved reliability of scheduling highway-based freight deliveries,
Improved efficiency of trips,
Increased productivity,
Leveled playing field for safe and legal carriers,
Improved confidence levels in meeting transport contracting requirements,
Enhanced company monitoring of driver performance and compliance, and
Enhanced vehicle fleet tracking and goods tracking capabilities.
29
Using WIM data for freight and fleet management is not a new practice. Over the last
decade, Europe has seen a noticeable acceleration in the development of intelligent freight
management, which are systems based on information and communication technologies in the
domain of the transportation of goods (Janin 2008). Under these systems, information (e.g.
travel information, weight information, access rights, fees and toll collection, safety and
emergency services, regulation on transportation of hazardous goods, etc.) is exchanged
electronically among those in the supply chain. The messages involved in the processes have
been standardized at an international level by the Centre for Trade Facilitation and Electronic
Business (CEFACT) organized under the umbrella of the United Nations. Moreover, in the
context of aggressive competition between companies, these systems support administrative
stakeholders in public policy making and enforcement.
In addition to being incorporated into comprehensive ITS systems, WIM data also serve
specific purposes in heavy vehicle transportation management. Pedestrian injuries and fatalities
brought about by heavy trucks are a significant issue in urban areas. WIM systems were
reported as one of the major ITS technology systems for heavy goods vehicle transport
management in the Tokyo urban area, with the purpose of reducing traffic accidents caused by
heavy goods vehicles (Taniguchi and Imanishi 2008).
Other Needs and Opportunities
In addition to the previously discussed traditional application areas, with the ever-
evolving WIM sensor technologies, the use of WIM systems has been expanded to new fields.
One new application is to enhance traffic operation and safety through real-time detection of
vehicle problems such as unbalanced axles, trucks or trailers, and lurching; tires with insufficient
pressure, excessive weight or unbalanced twin tires; and driving in the wrong direction (“ghost-
driver-detection”), and to then inform the appropriate authorities of the problem. Other
pavement and traffic management applications include “weigh-based-tolling” with individual
fees, monitoring and securing tunnels, detection of upcoming and existing traffic jams,
prediction of upcoming road maintenance issues long before they appear, and very detailed
statistics and predictions of current and future traffic flow. It can be expected that the uses of
WIM data will extend to almost all transportation activities.
Currently, the traffic data collection, highway inventory data collection, and pavement
condition surveys are usually conducted by different divisions in state DOTs. With the
automation of those data collection activities, large amounts of transportation data are now
available. Thus, there is a trend and a need to create a data warehouse to integrate ATR/WIM,
Pavement Management System, material, construction/rehabilitation, and inventory data, with
the aid of ever-evolving database and GIS software. An integrated data warehouse and a
standard data format are easier to manage and understand and better serves policy makers,

30
transportation practitioners, and the general public. These trends and needs have been
recognized at the 14th Annual North American Travel Monitoring Exposition and Conference
(NATMEC 2010). In addition, researchers reported at NATMEC (2010) that it is challenging to
generate a uniform report from systems manufactured by different companies. Currently, no
solution has been found to this challenge, although commercial management software available
from vendors such as MS2 (as previously described) may offer promise in this regard.
Data Collection Site Selection and Prioritization
As with most devices, ATR/WIM performance is affected by a number of factors. Those
factors include not only the characteristics of the vehicles being counted, classified, and/or
weighed but also the type, condition, and geometry of the road section where it is installed. To
make certain that the ATR/WIM system operates at its maximum potential, it is important to give
full consideration to site selection. In addition, every ATR/WIM deployment is a long-term
investment that requires resources for installation, maintenance, and data reduction. In a
resource constrained environment, a planning strategy is necessary to optimize an agency’s
investments in its ATR/WIM program. This section summarizes the ATR/WIM site selection
criteria and program prioritization methods reviewed in the literature.
ATR Siting
Continuous vehicle volume data are required to develop the hour-of-day, day-of-week,
and month-of-year factors that are used to expand short-term counts to AADT (FHWA 2012).
Therefore, traffic factor grouping has substantial impact on the site selection for ATRs.
The Georgia Department of Transportation (GDOT) uses one primary criterion and six
secondary criteria for selecting the location of a new ATR site.
1. Primary Selection Criterion
a. Minimum of five to eight ATR sites per traffic factor group depending
upon the traffic patterns and precision desired.
2. Secondary Selection Criteria
a. Critical nodes on high volume roads that are used in the step down
method.
b. Replacement of ATR sites that were eliminated due to construction.
c. Adequate coverage of each of the seven GDOT Districts to ensure
geographic differences in travel trends are captured.
d. Minimum of one operational ATR site per Interstate route.
e. Minimum of one operational ATR site on other major arterials.
31
f. Area of particular interest to GDOT management for planning purposes or
to meet specific Federal requirements (GDOT 2012).
In addition to the selection criteria developed by agencies, some research studies have
been conducted on optimizing ATR locations using statistical methods. In the early 1990s,
Mountain-Plains Consortium sponsored a project for the optimal placement of ATRs (Cheng,
Nachtsheim and Benson 1992). The study yielded two computer-based statistical methods using
an exchange algorithm and a two-stage sampling algorithm to locate a set of ATRs, with the
purpose of improving the overall efficiency and accuracy of AADT estimates. In the exchange
algorithm, ATR sites are sequentially added to and deleted from the site design, which generates
highly efficient designs without exhaustively searching through all possible designs. In the two-
stage sampling approach, similar sites are statistically clustered, and then the optimal weights are
calculated for each cluster. Based on these optimal weights, a random sample of sites is selected
from within each cluster. The State of Delaware also launched a project to establish a
comprehensive statewide traffic counting program comprised of ATR and WIM sites (Faghri,
Glaubitz and Parameswaran 1996). In the first phase of the project, methodologies using
descriptive analysis and seasonal grouping were developed to determine the number and location
of sites needed for each of the three types of traffic monitoring devices.
WIM Siting
Unlike ATRs that only record traffic counts and classification, WIMs also measure the
magnitude of the forces applied by the vehicle and convert this force measurement into an
estimate of vehicle weight, which imposes higher requirements on site selection. Currently, the
most commonly accepted standards on WIM site selection is ASTM E1318 (2009). The
specification provides the requirements for WIM site condition with regard to road alignment,
cross slope, lane width, surface smoothness, pavement structure, climate environment, power,
and data communication. ASTM E1318 forms the foundation for the WIM site selection criteria
and procedures developed by WIM users and vendors.
Site selection was examined by the Oklahoma Department of Transportation (ODOT) in
a research project conducted on advanced WIM (Sluss, et al. 2007). The study provides a
general checklist of site selection criteria shown in Table 10.
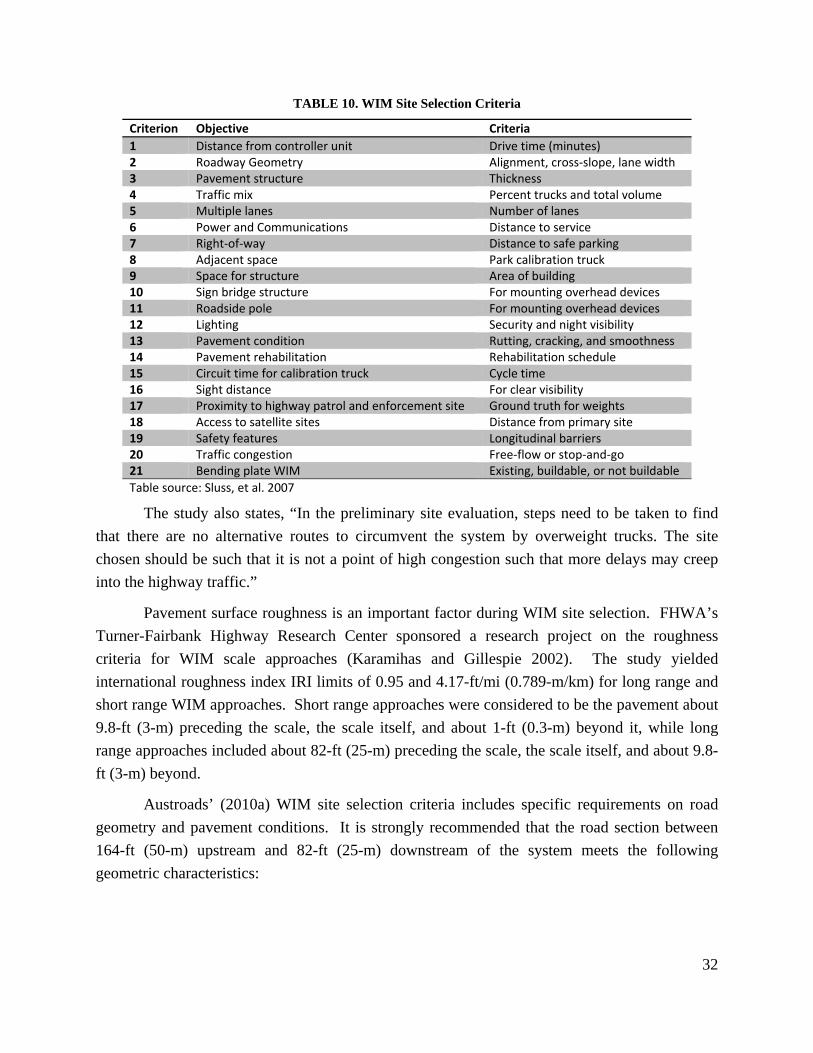
32
TABLE 10. WIM Site Selection Criteria
Criterion Objective Criteria
1 Distance from controller unit Drive time (minutes) 2 Roadway Geometry Alignment, cross‐slope, lane width3 Pavement structure Thickness4 Traffic mix Percent trucks and total volume5 Multiple lanes Number of lanes 6 Power and Communications Distance to service 7 Right‐of‐way Distance to safe parking 8 Adjacent space Park calibration truck 9 Space for structure Area of building 10 Sign bridge structure For mounting overhead devices11 Roadside pole For mounting overhead devices12 Lighting Security and night visibility 13 Pavement condition Rutting, cracking, and smoothness14 Pavement rehabilitation Rehabilitation schedule 15 Circuit time for calibration truck Cycle time16 Sight distance For clear visibility 17 Proximity to highway patrol and enforcement site Ground truth for weights 18 Access to satellite sites Distance from primary site 19 Safety features Longitudinal barriers 20 Traffic congestion Free‐flow or stop‐and‐go 21 Bending plate WIM Existing, buildable, or not buildable
Table source: Sluss, et al. 2007
The study also states, “In the preliminary site evaluation, steps need to be taken to find
that there are no alternative routes to circumvent the system by overweight trucks. The site
chosen should be such that it is not a point of high congestion such that more delays may creep
into the highway traffic.”
Pavement surface roughness is an important factor during WIM site selection. FHWA’s
Turner-Fairbank Highway Research Center sponsored a research project on the roughness
criteria for WIM scale approaches (Karamihas and Gillespie 2002). The study yielded
international roughness index IRI limits of 0.95 and 4.17-ft/mi (0.789-m/km) for long range and
short range WIM approaches. Short range approaches were considered to be the pavement about
9.8-ft (3-m) preceding the scale, the scale itself, and about 1-ft (0.3-m) beyond it, while long
range approaches included about 82-ft (25-m) preceding the scale, the scale itself, and about 9.8-
ft (3-m) beyond.
Austroads’ (2010a) WIM site selection criteria includes specific requirements on road
geometry and pavement conditions. It is strongly recommended that the road section between
164-ft (50-m) upstream and 82-ft (25-m) downstream of the system meets the following
geometric characteristics:

33
Longitudinal slope < 1 percent (class I site) or < 2 percent (other site classes) and
as far as possible must be constant (site classes according to European
specification COST 323),
Transverse slope < 3 percent, and
Radius of curvature >3280-ft (1000-m). Ideally a straight road would be
preferred.
Austroads (2010a) further recommends that rutting and deformation does not exceed .16-
in (4-mm) over the whole width of the lane and that the maximum IRI is less than 10.6-ft/mi (2-
m/km) for the 16-in (40-cm) preceding and following the sensor.
Cardinal Engineering Inc. (2013), a WIM vendor, summarized the general WIM site
selection step as follows:
1. Refer to ASTM 1318 for required roadway characteristics, i.e. smoothness,
curvature, slope, etc.
2. Conduct a site survey to determine proximity to utilities and, if required by the
application, to the weigh station.
3. Narrow the field of choices to two or three then take another look to make certain
that there are no other factors (merging traffic, adjacent power transmission lines,
etc.) that could adversely affect the performance of the scale.
4. Adequately identify the site with coordinates and description.
5. After the final selection is made, ensure that any scheduled paving or striping in
the area will not affect the scale.
In addition to the criteria provided by WIM users and vendors, several research studies
have been conducted to develop analytical models and procedures using optimization algorithms
to determine WIM locations. Mahmoudabadi and Syedhosseini (2013) proposed a procedure to
determine WIM locations for best performance using the number of once-checked trucks' axle
loads, unnecessary actions, and average installing costs as optimization criteria. Besinovic, et al.
(2013) proposed a model based on k-shortest paths to allocate WIM checkpoints while
considering that overweight trucks try to bypass checkpoints along the shortest unmonitored
alternate routes. The model was formulated as a binary program and applied to minimize the
damage due to overweight trucks, including pavement damage and environmental damage.
Sayyady, et al. (2013) performed research into models and algorithms for locating WIM
sensors on a large-scale highway network. One scenario considered in the study was how to find
the optimal locations for a given number of WIM sensors among a given collection of candidate
locations. Using the Integer Programming Model (IPM), the optimized locations for WIM
34
sensors were obtained through maximizing the similarity of truck load distribution patterns for
the set of WIM sensor locations.
At the other end of the spectrum, new sites can be more subjectively selected using a
process formally labeled by FHWA as “informed placement” (FHWA 2009b). This method
relies on general professional knowledge of locations with high incidences of overweight truck
activity to guide WIM site location. Fernando, et al. (2009) indicated that Indiana similarly sited
new installations on “troublesome” roads (and goes on to comment that they used piezoelectric
systems designed to provide VWS capability).
System Prioritization and Planning
As necessary as ATR/WIM systems are for traffic data collection and detecting
overweight trucks, these systems, particularly WIMs, require resources to install and maintain.
Therefore, prioritization and planning such systems within resource constraints is a major issue
for transportation agencies. This literature review found few studies and standards that address
this issue.
ATRs need to collect continuous data to be used for developing hour-of-day, day-of-
week, and month-of-year factors that are used to expand short-term counts to AADT. The
precision and accuracy of the factors that are developed will always be improved if more ATRs
are available, obviously a balance must be struck between the number of sites and the accuracy
of the factors (FHWA 2012). Having well established state-wide goals and objectives for the
precision and accuracy of the traffic monitoring program will help in determining what the
balance point is for the number of sites. The TMG (FHWA 2012) recommends that the division
responsible for factor development should work toward having the number of sites required to
achieve the desired accuracy and reliability. If more data is needed, the availability of such data
from other existing traffic counting programs should be investigated. Mn/DOT leverages the
data collected by local road agencies, such as county and city entities, to expand the quantity of
data collected for local roads (Mn/DOT 2012). Austroads (2010b), for example, recommends
that continuous WIM stations are also used as continuous vehicle volume count sites.
The TMG (FHWA 2012) does also provide a general guide for creating and maintaining
a WIM program, however, this guide does not address prioritization of WIM sites within
resource constraints. The general guide states:
1. Review existing weight data collection program,
2. Develop an inventory of available weight data collection locations and equipment,
3. Determine roadway weight groups to be monitored,
4. Establish roadway weight groups,
5. Determine appropriate number of weight data collection locations,

35
6. Determine the number of days that should be counted at a given WIM site,
7. Select WIM sites, and
8. Integrate WIM sites with remaining count program.
In a survey conducted by Cottrell and Kweon (2011), only nine out of 25 responding agencies
indicated that their WIM programs were developed following the TMG guidelines.
Austroad (2010b) issued a WIM management and operation manual in 2010. In the WIM
network strategy section of this manual, it lists various factors that need to be considered in
developing/guiding a WIM program:
The purpose of WIM data. It will influence the type of sites, permanent, portable
etc., their number, location and type of technology.
Opportunities to integrate WIM with other technologies such as Automated
Vehicle Identification Systems.
A plan and methodology for determining network coverage in terms of site
location, number and type.
The technologies available, their strengths and weaknesses/characteristics relevant
for the required purpose.
The equipment’s full life cycle costs (installation, calibration and maintenance).
The cost of the systems used for data processing and reporting including QA
systems and processes.
A staged plan for implementation including integration with road design,
construction and maintenance processes to minimize installation and ongoing
maintenance costs.
Staff numbers and skills requirements including training expenses.
Justification and feasibility.
Opportunities to incorporate costs into and link to other corporate programs or
initiatives such as long term pavement performance, enhancement of safety and
air quality, Safe Systems, weight enforcement etc.
Contribution of WIM sites to traffic data collection program (volume,
classification, speed) as additional permanent traffic counting sites.
A time horizon of 5 to 10 years.
The manual also describes the current practice of road agencies in Australia and New
Zealand on establishing the required number of sites. The required number of sites is determined
by assessing the sample size required to achieve the desired statistical accuracy (e.g. 90 percent
confidence level with ±10 percent accuracy) for selected “truck weight groups”. Some criteria

36
for defining truck weight groups include: geographic groups, functional classification, and truck
volume.
Several studies pointed out the importance of cost in WIM site selection. In the study
conducted by ODOT (Sluss, et al. 2007), it is stated that cost factors should be considered during
WIM site selection. Similarly, in the study performed by Sayyady, et al. (2013), a scenario for
allocating WIM sites with a budget constraint was examined. The budget-constrained problem
was considered an extension of the well-known p-median problem, and a new Lagrangian
heuristic algorithm was presented to solve the problem. However, those studies didn’t consider
other resource constraints and factors that influence WIM site selection.
Concluding Remarks
This section of the Task 1 report presents the major findings from a review of the open
literature on four subareas of traffic data collection programs, namely data collection technology,
data transmission and management, data users and uses, and data collections site
selection/prioritization. With continuing advances in technology, traffic data collection systems
similarly continue to improve relative to quality and cost, both through ongoing development of
traditional sensing systems as well as the introduction and development of new systems. As a
result, a variety of approaches are used for ATR and WIM systems. For ATRs these systems
range from traditional pneumatic tubes and inductance loops, to more recently introduced radar,
video, magnetic, etc. systems. For WIMs these systems range from single load cells, bending
plates, and piezoelectric sensors, all of which have been commonly used since the 1990’s, to
emerging fiber optic sensors. Each of these technologies has its strengths and weaknesses, and
to-date there is no single technology that monopolizes the market. That being said, and centering
on the primary focus of this investigation, i.e., WIM systems, piezoelectric sensors are possibly
the most frequently mentioned type of sensor, and more specifically, quartz piezoelectric
sensors, relative to balancing data quality and cost. Contemporary cost information, however,
was sparse in the literature, making any cost based comparisons made herein less certain in
nature.
Data transfer and communication is an integral part of a traffic data collection program.
The most commonly employed communication technologies are landline, cellular, and wireless
technologies. Specifically, high-speed wireless and network technologies (e.g. DSRC, mobile
network, Ethernet) are necessary to transmit real-time data and are the development trend for
data communication of new generation of ATRs/WIMs. After the raw data are transferred to the
data control center, an application software program is then utilized to process the raw data. The
typical software is capable of generating output reports in the FHWA’s TMG Card Format. The
software is also capable of generating daily, weekly, monthly, or continuous summary reports in
37
hourly increments based on vehicle speed, classification, ESAL, and weight summaries on a lane
by lane or directional basis. A variety of such software packages have been developed by
agencies and vendors to serve for specific purposes, such as data submittal, weight enforcement,
and data storage and presentation.
Traffic data serve many transportation related activities, including weight enforcement,
pavement design, transportation planning, policy making, freight management, traffic safety,
asset management, etc. WIM data in particular is essential to pavement design and is
increasingly being used in weight enforcement. To accommodate application of the relatively
new mechanistic-empirical pavement design method as implemented in the MEPDG, several
states have conducted studies to develop axle load spectrum using WIM data. Moreover,
software packages are available to process WIM data to create input files for MEPDG based
software. Relative to the use of WIM technologies in vehicle weight enforcement, Europe has a
long history of using the WIM/SWIM system for direct weight enforcement. Although direct
WIM weight enforcement has not been approved in the United States, (i.e., wherein tickets are
issues simply based on WIM weights), many states have employed WIMs or VWS (sometimes
in conjunction with a LPR system or an automatic vehicle identification system) to facilitate
weight enforcement. Montana has done significant work in this regard, with other pioneer states
including California, Florida, and Minnesota. Recognizing inherent advantages of WIM as
opposed to static scales for weight enforcement, some states have begun to retrofit existing WIM
systems to serve as VWS and/or insist that all new WIM sites have VWS capability.
To facilitate use of traffic data, many states make historical traffic data available on the
internet. Increasingly these data are presented using interactive maps and are integrated into a
GIS database to assist in their use across a spectrum of other activities (such asset management,
planning, etc.).
Due to resource constraints, every effort should be made to optimally locate any new data
collection sites. A single accepted method for prioritizing new data collection sites does not
exist. Criteria for site selection may include competing priorities of collecting sufficient data
system wide to a) provide a desired level of statistical accuracy to project vehicle operations
through space and time at a project level, b) allow for more efficient weight enforcement based
on identification of problem areas, and c) provide adequate data for planning purposes
throughout the state independent of absolute volume of traffic. Selection methodologies range
from the use of mathematical algorithms to significant reliance on informed opinion. On a
positive note, this situation allows each state to develop and use a prioritization scheme
appropriate to their individual situation. Of course, once a site is generally selected there are
further constraints on its associated physical characteristics that need to be met to ensure safe and
reliable data collection (i.e., pavement condition, geometrics, etc.).
38
SURVEY STUDY
To investigate the current traffic data collection practices and technologies in other states,
a questionnaire was sent to selected states. Not aimed to be exhaustive, the survey focused on
gathering information from states that are similar to Montana with areas of low population
density, geographically extensive highway networks, and natural resource based economies. The
TDCA Section identified seven states and provided contact information of the traffic data
collection program in each state. Those seven states were Idaho (ID), Oregon (OR), Minnesota
(MN), Maine (ME), Colorado (CO), North Dakota (ND), and South Dakota (SD). The survey,
itself, reviewed and augmented by the MDT TDCA Section consisted of four major sections:
1. Overview of traffic data collection program,
2. Data collection technology,
3. Traffic data collection, analysis, and presentation, and
4. Traffic data users.
The complete questionnaire is presented in Appendix A, along with the responses that
were received. At the time of preparation of this report, responses had been secured from only
three states – ND, SD and ME, despite repeated email requests and limited attempts at telephone
contact. Note that before the survey questionnaire was sent out, the research team searched the
open literature and each state DOT website and filled in some of the requested material in an
attempt to reduce the effort required to complete the entire questionnaire.
Extensive follow-up contacts were made with those entities that did respond to further
verify important information and clarify various issues, including missed, misunderstood, and
ambiguous answers.
General Description of Traffic Data Collection Program
This section summarizes the information requested to generally describe the traffic data
collection program of each respondent, including number of ATR/WIM sites, practices for
management/operation of their traffic program, and program planning/prioritization efforts.
Size of WIM and ATR Programs
Table 11 shows the number of ATR and WIM installations in each responding state. The
traffic data collection programs of ND, SD, and ME are very comparable in size, consisting of
approximately 15 WIM sites and 50 to 65 ATRs. While Montana has a similar number of ATRs
(62), Montana’s WIM program is considerably larger, consisting of 33 sites. Referring to Table
11, in general, the percentage of functioning ATRs is noticeably much higher than that of WIMs.
This difference is attributable at least in part to the greater resource demands in maintaining
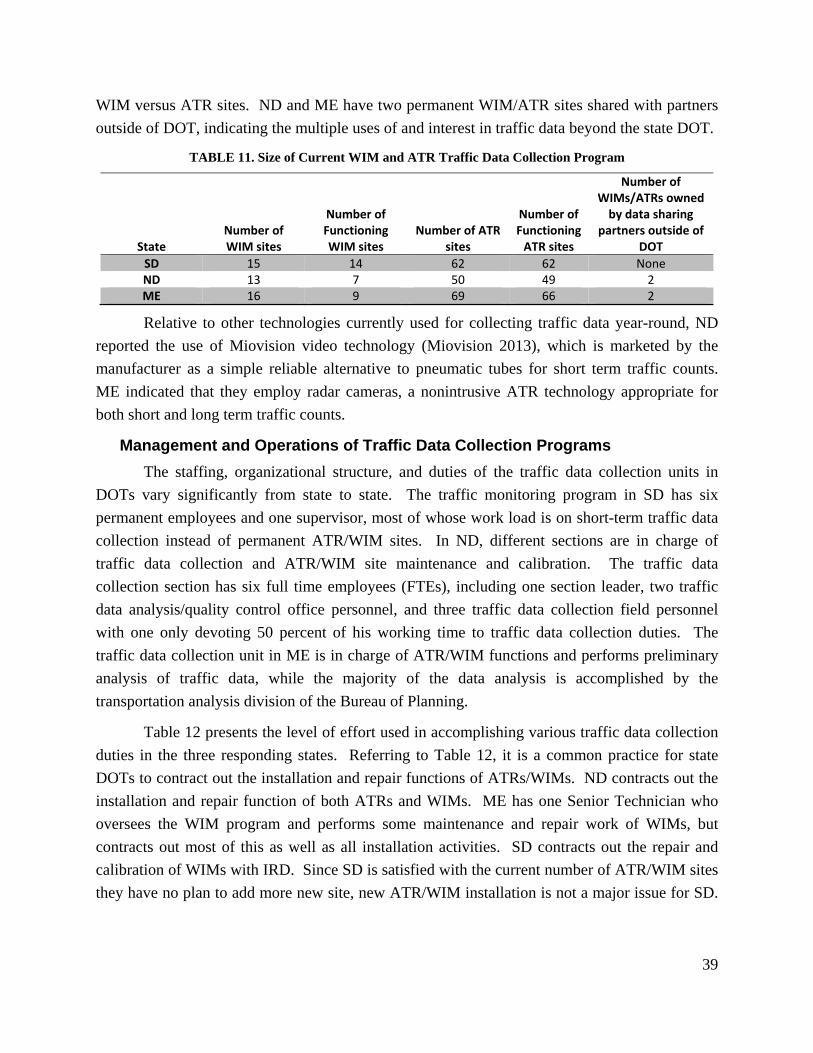
39
WIM versus ATR sites. ND and ME have two permanent WIM/ATR sites shared with partners
outside of DOT, indicating the multiple uses of and interest in traffic data beyond the state DOT.
TABLE 11. Size of Current WIM and ATR Traffic Data Collection Program
State Number of WIM sites
Number of Functioning WIM sites
Number of ATR sites
Number of Functioning ATR sites
Number of WIMs/ATRs owned by data sharing
partners outside of DOT
SD 15 14 62 62 NoneND 13 7 50 49 2ME 16 9 69 66 2
Relative to other technologies currently used for collecting traffic data year-round, ND
reported the use of Miovision video technology (Miovision 2013), which is marketed by the
manufacturer as a simple reliable alternative to pneumatic tubes for short term traffic counts.
ME indicated that they employ radar cameras, a nonintrusive ATR technology appropriate for
both short and long term traffic counts.
Management and Operations of Traffic Data Collection Programs
The staffing, organizational structure, and duties of the traffic data collection units in
DOTs vary significantly from state to state. The traffic monitoring program in SD has six
permanent employees and one supervisor, most of whose work load is on short-term traffic data
collection instead of permanent ATR/WIM sites. In ND, different sections are in charge of
traffic data collection and ATR/WIM site maintenance and calibration. The traffic data
collection section has six full time employees (FTEs), including one section leader, two traffic
data analysis/quality control office personnel, and three traffic data collection field personnel
with one only devoting 50 percent of his working time to traffic data collection duties. The
traffic data collection unit in ME is in charge of ATR/WIM functions and performs preliminary
analysis of traffic data, while the majority of the data analysis is accomplished by the
transportation analysis division of the Bureau of Planning.
Table 12 presents the level of effort used in accomplishing various traffic data collection
duties in the three responding states. Referring to Table 12, it is a common practice for state
DOTs to contract out the installation and repair functions of ATRs/WIMs. ND contracts out the
installation and repair function of both ATRs and WIMs. ME has one Senior Technician who
oversees the WIM program and performs some maintenance and repair work of WIMs, but
contracts out most of this as well as all installation activities. SD contracts out the repair and
calibration of WIMs with IRD. Since SD is satisfied with the current number of ATR/WIM sites
they have no plan to add more new site, new ATR/WIM installation is not a major issue for SD.
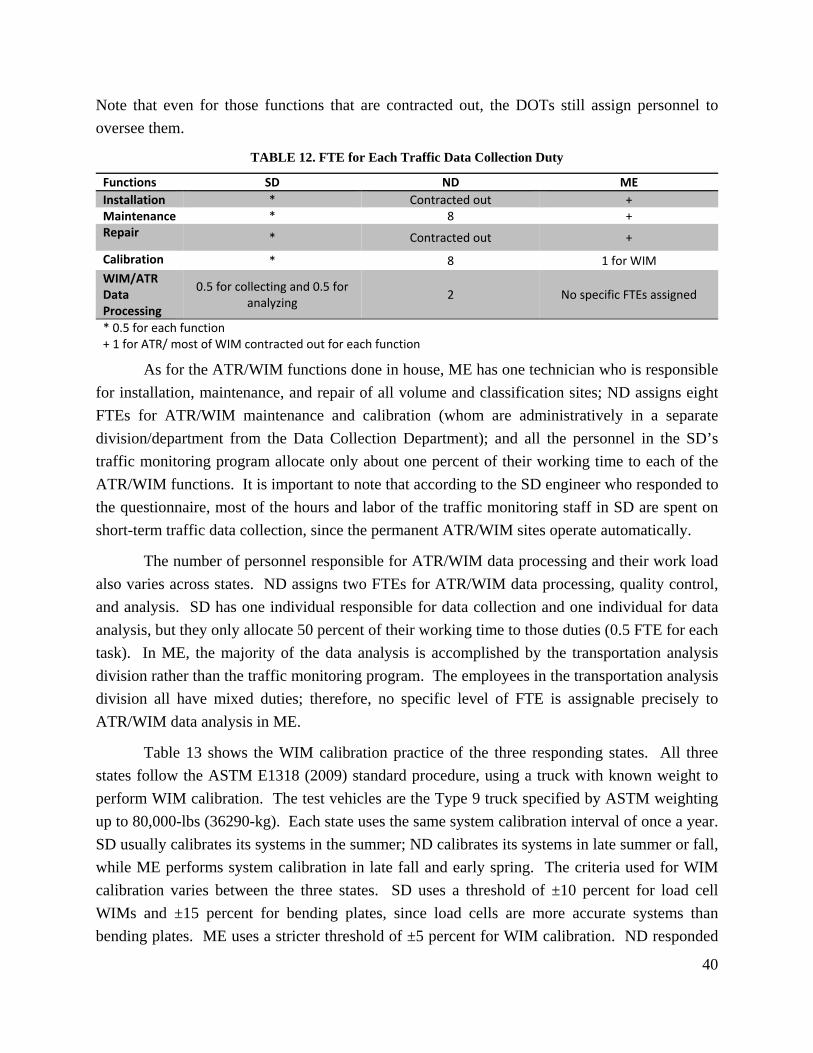
40
Note that even for those functions that are contracted out, the DOTs still assign personnel to
oversee them.
TABLE 12. FTE for Each Traffic Data Collection Duty Functions SD ND ME
Installation * Contracted out + Maintenance * 8 + Repair * Contracted out +
Calibration * 8 1 for WIM
WIM/ATR Data Processing
0.5 for collecting and 0.5 for analyzing
2 No specific FTEs assigned
* 0.5 for each function + 1 for ATR/ most of WIM contracted out for each function
As for the ATR/WIM functions done in house, ME has one technician who is responsible
for installation, maintenance, and repair of all volume and classification sites; ND assigns eight
FTEs for ATR/WIM maintenance and calibration (whom are administratively in a separate
division/department from the Data Collection Department); and all the personnel in the SD’s
traffic monitoring program allocate only about one percent of their working time to each of the
ATR/WIM functions. It is important to note that according to the SD engineer who responded to
the questionnaire, most of the hours and labor of the traffic monitoring staff in SD are spent on
short-term traffic data collection, since the permanent ATR/WIM sites operate automatically.
The number of personnel responsible for ATR/WIM data processing and their work load
also varies across states. ND assigns two FTEs for ATR/WIM data processing, quality control,
and analysis. SD has one individual responsible for data collection and one individual for data
analysis, but they only allocate 50 percent of their working time to those duties (0.5 FTE for each
task). In ME, the majority of the data analysis is accomplished by the transportation analysis
division rather than the traffic monitoring program. The employees in the transportation analysis
division all have mixed duties; therefore, no specific level of FTE is assignable precisely to
ATR/WIM data analysis in ME.
Table 13 shows the WIM calibration practice of the three responding states. All three
states follow the ASTM E1318 (2009) standard procedure, using a truck with known weight to
perform WIM calibration. The test vehicles are the Type 9 truck specified by ASTM weighting
up to 80,000-lbs (36290-kg). Each state uses the same system calibration interval of once a year.
SD usually calibrates its systems in the summer; ND calibrates its systems in late summer or fall,
while ME performs system calibration in late fall and early spring. The criteria used for WIM
calibration varies between the three states. SD uses a threshold of ±10 percent for load cell
WIMs and ±15 percent for bending plates, since load cells are more accurate systems than
bending plates. ME uses a stricter threshold of ±5 percent for WIM calibration. ND responded

41
that they make calibration runs with the calibration vehicle until they are satisfied that the site
cannot be calibrated any further or that the results cannot get any better; thus, ND does not have
specific calibration thresholds.
TABLE 13. WIM Calibration
States SD ND ME
Method truck with known weight calibration vehicle with known weight
calibrated truck
Test Vehicle SDDOT supplied class 9 semi
5‐axle semi‐tractor/trailer loaded between 76,000 to 80,000‐lb (34470 to 36290‐kg)
class 9 vehicle weighing 80,000‐lb (36290‐kg)
Threshold ±10% for load cells; ±15% for bending plates
no specific threshold ±5%
Cycle yearly yearly yearly
Table 14 shows the annual ATR and WIM program costs by various services and duties
in the surveyed states. The costs of the various state programs are difficult to compare based on
the disparities in the information provided by the respondents in this regard. SD does not have
cost records by task across their program, but they did report the combined cost of all ATR needs
is $10,000, and annual calibration costs (a contracted service) of $20,000. ND bids out
ATR/WIM installation and repair, with annual costs varying based on the number of sites
involved. ND estimated the combined cost of maintenance and data collection (power, phone
lines, etc.) at $35,000 to $40,000 per year. ND specifically reported that $110,000 was spent
annually on traffic data analysis (SD and ME did not report this cost).
ME has detailed cost information for most program tasks for both their ATR and WIM
systems. The ATR and WIM site installation are the biggest expense for ME, especially WIM
installation, which costs $85,000 to 150,000 per site. ME performs ATR and WIM maintenance
in-house, at annual estimated costs of $30,000 and $35,000, respectively. ME estimated their
annual system repair costs to be $10,000 for ATRs (done in-house) and $25,000 for WIMs
(contracted out). WIM calibration costs were reported by ME to be $30,000 per year. Recall
ME does calibration in-house. Data collection and transmission costs (power, phone lines, etc.)
were reported by ME to be $35,000 and $10,000, respectively, for their ATR and WIM
programs.

42
TABLE 14. Annual Costs for ATR and WIM programs
Services and Duties Annual Cost ($)
SD ND ME
Done in house
Contracted out
Done in house
Contracted out
Done in house
Contracted out
Installation
* + +
N/A depends on
the number of sites being
installed, but this work is
bid out
ATR-$60,000
WIM $85-150,000 per
site
Maintenance
* +
$35-$40k (includes
Traffic Data Collection)
+
ATR-$30,000 WIM-
$35,000
+
Repair
* + +
N/A depends on
the number of sites being
repaired, but this work is
bid out
ATR-$10,000
WIM-$25,000
Calibration *
WIM -$20,000 yearly
$10,000 + WIM-
$30,000 +
Traffic data collection from WIM and ATRs (i.e. telephone, power, etc.)
* + $35-$40k (includes
Maintenance) +
ATR - $35,000 WIM-
$15,000
+
Traffic data analysis * + $110,000 + + + Distribution (i.e. compiling/printing of monthly, annual publications, etc.)
* + This is an
estimate only < $5000
+
ATR-$2,500 WIM-$1000
+
* Combined cost of all Services and Duties is $10,000. + Information not provided in response.
Program planning/prioritization
Each of the responding states employed different strategies in developing their
ATR/WIM programs. SD responded that they followed the TMG (FHWA 2012) for determining
the current locations of ATR/WIM sites and will do so in planning/prioritization of future
ATR/WIM sites. SD is satisfied with their current permanent traffic data collection program.
With one more WIM site schedule to be installed in 2014, SD has no plans to add more new sites
in the near future, thus, program planning/prioritization is not an issue in SD.
The first 12 WIM sites in ND were selected near static weigh stations to supplement
weight enforcement activities, since these weigh stations were open only during limited times.
Since 2006, ATR/WIM sites have been determined using a long range ITS Deployment Plan
43
based on a) traffic volume needs for design, b) growth, and c) gaps in coverage. ND will
continue to use and update its ITS Deployment Plan, as well as listen to stakeholders and
customers in the planning/prioritization of future ATR/WIM activities/sites.
ME has different strategies in determining data collection locations based on the nature of
the data to be collected, i.e., volume, classification and/or weight data. The majority of volume
sites have been located on the higher Federal functional classes and concentrated in larger
cities/towns with high priority given to the Interstate System. Most of the 16 counties in ME
were given at least one site. Permanent classification sites were placed in areas requested by the
Bureau of Planning based on major trucking and recreational traffic routes. WIM locations were
selected to give a broad cross section of interstate truck traffic using both major and minor
routes. Planning for new sites in ME is generally based on a) needs of the Bureau of Planning,
b) areas where significant development has occurred, and c) changes in commercial vehicle
weight laws.
Data Collection Technology
This section summarizes the ATR/WIM technologies, and technologies for
communication between ATR/WIM sites and traffic control centers currently employed by the
responding states, along with new ATR/WIM technologies that they are testing for possible
future deployment.
Current Technologies
Table 15 presents the brand and/or technologies currently employed by the three
responding states for ATRs, WIMs, and data communication. Referring to Table 15, inductive
loop, piezoelectric, and radar systems are the most popular ATR technologies in the three
responding states, while piezoelectric, bending plate, and load cell WIM systems are commonly
used. This outcome is consistent with the findings from the literature review. The common
brands employed across these states include Peek (inductance loop ATR), Wavetronix (radar
ATR), Kistler (quartz piezoelectric WIM), and IRD (WIM load cell and electronics).
Communication with sites often appears to be landlines, with some fiber optic and cellular
operations.
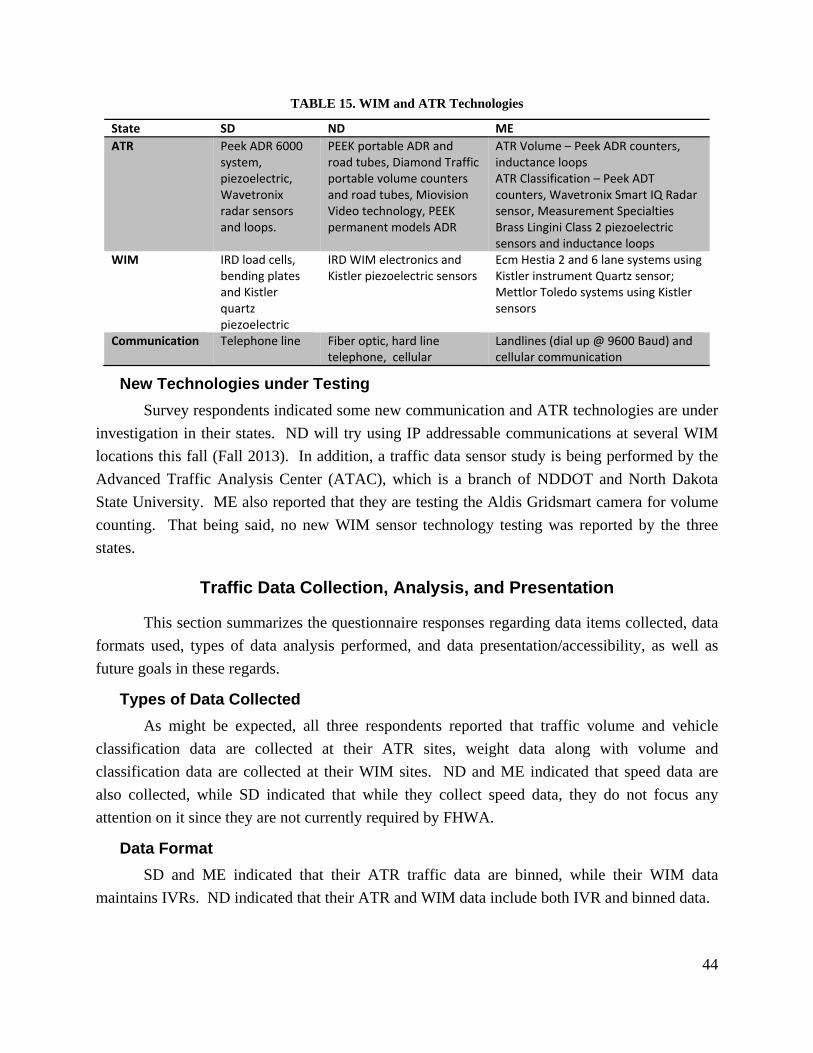
44
TABLE 15. WIM and ATR Technologies
State SD ND ME
ATR Peek ADR 6000 system, piezoelectric, Wavetronix radar sensors and loops.
PEEK portable ADR and road tubes, Diamond Traffic portable volume counters and road tubes, Miovision Video technology, PEEK permanent models ADR
ATR Volume – Peek ADR counters, inductance loops ATR Classification – Peek ADT counters, Wavetronix Smart IQ Radar sensor, Measurement Specialties Brass Lingini Class 2 piezoelectric sensors and inductance loops
WIM IRD load cells, bending plates and Kistler quartz piezoelectric
IRD WIM electronics and Kistler piezoelectric sensors
Ecm Hestia 2 and 6 lane systems using Kistler instrument Quartz sensor; Mettlor Toledo systems using Kistler sensors
Communication Telephone line Fiber optic, hard line telephone, cellular
Landlines (dial up @ 9600 Baud) and cellular communication
New Technologies under Testing
Survey respondents indicated some new communication and ATR technologies are under
investigation in their states. ND will try using IP addressable communications at several WIM
locations this fall (Fall 2013). In addition, a traffic data sensor study is being performed by the
Advanced Traffic Analysis Center (ATAC), which is a branch of NDDOT and North Dakota
State University. ME also reported that they are testing the Aldis Gridsmart camera for volume
counting. That being said, no new WIM sensor technology testing was reported by the three
states.
Traffic Data Collection, Analysis, and Presentation
This section summarizes the questionnaire responses regarding data items collected, data
formats used, types of data analysis performed, and data presentation/accessibility, as well as
future goals in these regards.
Types of Data Collected
As might be expected, all three respondents reported that traffic volume and vehicle
classification data are collected at their ATR sites, weight data along with volume and
classification data are collected at their WIM sites. ND and ME indicated that speed data are
also collected, while SD indicated that while they collect speed data, they do not focus any
attention on it since they are not currently required by FHWA.
Data Format
SD and ME indicated that their ATR traffic data are binned, while their WIM data
maintains IVRs. ND indicated that their ATR and WIM data include both IVR and binned data.

45
Data Analysis
All respondents generally analyze the traffic data they collect to generate typical
information on vehicle volume, classification, speed, and weight by location and time. ND
responded that they perform weight trend and speed analyses by time-of-day and day-of-week on
the traffic data collected. Traffic data analysis in ME is mainly accomplished by the
Transportation Analysis Division of the Bureau of Planning. The Traffic Monitoring Section of
the Traffic Engineering Division performs some basic analysis such as generating AADT and
weekly group mean factors. The analysis of WIM data is mainly for pavement design, including
calculation of ESALs for the traditional design method and developing seasonal variation and
truck load distributions by vehicle type required by the MEPDG.
Data Presentation and Accessibility
All respondents make data available to some degree and in various formats through the
internet. SD responded that a GIS system is used internally to display traffic data but that they
have no intention of more generally making GIS based data display available in light of
associated costs and possible user inability to take advantage of such a system. Data reports are
available for download online in portable document format (PDF) for external users. In ND, all
the portable traffic counts data are available on the NDDOT website for external users to view.
Other traffic data are not available online at this time, but are accessible to external users upon
request. NDDOT provides customers with traffic data in several types of formats depending on
their needs, such as ArcGIS/ArcMAP shape files, and PDF, and Excel files. In ME, the latest
annual traffic count report by county and by municipality is available online for download in
PDF. Additionally, yearly images of traffic volume by site, day and hour-of-day are developed
and made available on their website. Traffic data are scanned into the Department’s electronic
filing system and are also available by request.
Future Goals
As for the future goals regarding data collection, analysis, and presentation of ATR and
WIM data, ME expressed the intention to develop a comprehensive software system to collect,
analyze, and store all types of traffic data and to provide more information to the public online.
Currently, the in-house programs in ME utilize Microsoft Access/Excel and Visual Basic to
process and store traffic data. A GIS system is being considered to allow for easier traffic data
retrieval.

46
Traffic Data Users
This section summarizes the questionnaire responses regarding traffic data users and
unmet data needs.
Current traffic data users
With a few exceptions, all three states indicated they currently provide data to all the
internal users (planning staff, traffic operations, traffic safety, highway design, weight
enforcement, and speed enforcement) and external users (FHWA, colleges/universities,
consulting companies, and realty companies) listed in the questionnaire. SD and ND responded
that their traffic data have not been used for speed enforcement. In addition, SD noted that the
state legislature does not allow them to use weight data for weight enforcement. Besides all the
uses listed in the questionnaire, ME also indicated that they provide real time speed and traffic
condition data as well as highway images for major highways for their traveler information
system.
Unmet data needs
Only ME indicated they had unmet data needs. One such need is for more classification
data in urban areas as requested by their Bureau of Planning; however, there are only a few
technologies that are able to provide these data and they are expensive. A second need is to
process their speed data to meet new federal reporting requirements.
Concluding Remarks
The current practices of selected states (specifically SD, ND, and ME) relative to traffic
data collection (from permanent ATR and WIM sites), data processing, and data uses were
investigated through a questionnaire completed by these states. The questionnaire focused on
states that are similar to Montana with areas of low population density, geographically extensive
highway networks, and natural resource based economies.
Results of the questionnaire revealed that the three responding states have comparable
sized WIM and ATR programs, with 50 to 70 ATR sites and approximately 15 WIM sites.
Montana has a similar sized ATR program with 62 permanent sites, but a much larger WIM
program with 33 sites. The staffing, organizational structure, and duties of the traffic data
collection units varied considerably from state to state, making it difficult to formulate
comparisons of program level-of-effort and costs. Further complicating such comparisons are
the degree to which various tasks are done by outside contract. It appears to be common practice
to contract out installation and repair functions of ATRs/WIMs, although perhaps MEs practice
well describes the variability of practice in this regard, wherein these functions are done in-house
by ME for ATR systems but contracted out for WIM systems. Whether done in-house or
47
contracted out, all three responding states follow the ASTM standard procedure for WIM
calibration, which is performed annually. Relative to prioritization/planning of future data
collection sites, each state had a unique approach in this regard, from generally following TMG
guidelines, to satisfying state specific needs based on projected growth or other factors.
From a technology perspective, the questionnaire found that inductive loop, piezoelectric,
and radar systems are the commonly used technologies for ATRs, and piezoelectric sensors,
followed by bending plates and load cells are common for WIMs. The popular brands among
responded states include Peek and Wavetronix ATR systems, and IRD/Kistler WIM systems.
Dial-up landlines and cellular communication are the common communication technologies for
ATR/WIMs reported in the survey.
Commonly collected traffic data include volume, classification, and weight. Usually
traffic counts and traffic data reports are made available online for users to view and download.
Traffic data are also accessible to external users by request, with the data provided in various
types of formats (e.g. ArcGIS/ArcMAP shape files, PDF, and Excel) depending on the users’
needs. There is a trend of making more traffic data available and more easily accessible to the
public. SD reported, however, that while they made data available in map based GIS application
for internal users, such a platform was not planned for external users due to cost and possible
user system constraints.
The results of the questionnaire revealed that most of the internal and external users listed
on the questionnaire are currently served by the responded states (i.e. planning staff, traffic
operations, traffic safety, highway design, weight enforcement, speed enforcement, FHWA,
colleges/universities, research institutes, consulting companies, and realty companies). In
addition to the users listed in the questionnaire, some state also provides real-time traffic data to
serve travelers through the Traveler Information System.
48
SUMMARY
A comprehensive literature review on traffic data collection programs was conducted as
the first task in a project sponsored by the Montana Department of Transportation (MDT) to
review its traffic data collection program to ensure it provides the best possible traffic
information in the most cost effective manner. This review was complemented by a survey of
selected states expected to have general traffic operations similar to Montana to obtain more
current and complete information on traffic data collection programs than might be available in
the literature. While considering data collection by both automatic traffic recorders (ATR) and
weigh-in-motion (WIM) systems, this review focused on WIM programs.
Both the literature review and survey found that many approaches are available to
accomplish the various tasks associated with a data collection program, from basic data
collection, transmission, analysis and dissemination, to the administrative structure of the
program, itself. Further, relative to both individual tasks and the architecture of overall data
collection programs, no one model has been consistently followed by state DOTs in performing
their basic data collection function. Nonetheless, general observations from the literature review
and survey (previously presented in more detail at the conclusion of each of these sections of this
report) include:
While sensor systems continue to evolve, well established technologies continue
to be most frequently used i.e.:
o pneumatic tubes and inductance loops for ATR, with radar and magnetic
based systems offering promise and apparently being increasingly used,
and
o piezoelectric, bending plate, and single load cells for WIM (ordered by
their relative degree of use).
Current cost information was difficult to find, and the survey data in this regard
were difficult to interpret. That being said, ATR systems remain less expensive
than WIM systems. With respect to one another, WIM systems, apparently as in
the past, increase in cost from piezoelectric, quartz piezoelectric, bending plate, to
single load cell systems.
Communication technologies are landline, cellular, and wireless technologies.
With high-speed wireless and network technologies (e.g. DSRC, mobile network,
Ethernet) being necessary to transmit real-time data and are the trend for the new
generation of ATRs/WIMs.
Many software packages are available to check data for accuracy and to generate
metrics needed for various activities such as weight enforcement, pavement

49
design, transportation planning, freight management, traffic safety, asset
management, etc.
Many states make historical traffic data available on the internet. Increasingly
these data are presented using interactive maps and are integrated into GIS
databases.
A rapidly emerging use of WIM is for real time weight enforcement using a
virtual weigh station (VWS) approach (which can impact both site and hardware
selection), with some states both using this as a criteria in locating new WIM
installations as well making all WIM sites VWS compatible.
Approaches to prioritizing future WIM site locations range from a qualitative
“informed placement” approach based on professional opinion of the location of
overweight vehicle problem areas, to analytical models acting on quantitatively
expressed optimization criteria.
ND, SD, and ME, the three states that responded to the survey, have comparable
WIM and ATR programs, with Montana having a similar sized ATR program but
significantly more WIM sites.
The staffing and duties of the traffic data collection programs varied considerably
between ND, SD and ME, making it difficult to formulate comparisons of basic
level-of-effort and costs.
ND and SD contract out installation and repair functions of ATRs/WIMs,
although perhaps ME’s practice well describes the variability of practice in this
regard, wherein these functions are done in-house by ME for ATR systems but
contracted out for WIM systems.

50
WORKS CITED
AASHTO. Guidlines for Traffic Data Programs. Washington D.C.: American Association of
State Highway and Transportation Officials, 2009.
ASTM. Standard Specification for Highway Weigh-in-motion (WIM) Sytems with User
Requirements and Test Methods. Washington D.C.: American Society for Testing and
Materials, 2009.
Austroads. Weigh-in-motion (WIM) Technologies and Users. Sidney, Australia: Austroads,
2010a.
Austroads. Weigh-in-motion Management and Operation Manual. Sydney, Australia: Austroads,
2010b.
Austroads. Weigh-in-motion Technology. Sydney, Australia: Austroads, 2000.
Bajwa, Ravneet, Ram Rajagopal, Pravin Varaiya, and Robert Kavaler. In-Pavement Wireless
Sensor Network for Vehicle Classification. Berkeley: Sensys Networks Inc., 2011.
Bergan, A. T., C. F. Berthelot, and B. Taylor. "Effect of Weigh in Motion Accuraccy on Weight
Enforcement Efficiency." 1996.
Besinovic, N., N. Markovic, and P. Schonfeld. "Optimal Allocation of Truck Inspection Stations
Based on k-shortest Paths." TRB 92nd Annual Meeting Compendium of Papers.
Washington D.C.: Transporation Research Board, 2013.
Brogan, J. D., R. Tarefder, J. R. Ruiz, and G. K. Ababio. Statewide Traffic Data Collection,
Processing, Projection, and Quality Control. New Mexico Department of Transportation,
2011.
Bushman, Rob, and Andrew J. Pratt. "Weigh In Motion Technology - Economics and
Performance." North American Travel Monitoring Exposition and Conference. Charlotte,
North Carolina, 1998.
Cardinal Engineering Inc. 2013. http://cardinal-detecto.centralcarolinascale.com/highway-weigh-
site-selection.htm (accessed August 2013).
Center for Transportation Research and Education. States' Successful Practices Weigh-in-motion
Handbook. Washington D.C.: Federal Highways Administration, 1997.
Cheng, C., C. J. Nachtsheim, and P. G. Benson. Statistical Methods for Optimally Locating
Automatic Traffic Recorders. Mountain-Plains Consortium, 1992.
Cottrell, Benjamin H., and Young-Jun Kweon. Review of the Virginia Department of
Transportation's Truck Weight Data Plan for the Mechanistic-Emperical Pavement

51
Design Guide. Charlottesville: Virginia Center for Transportation Innovation and
Research, 2011.
Faghri, A., M. Glaubitz, and J. Parameswaran. "Development of Integrated Traffic Montitoring
System for Delaware." Transportation Research Record, 1996: 40-44.
FDOT. "Bypass Surgery: At Punta Gorda in Charlotte County, Florida DOT Has Been Proving
the Virtual Weigh Station Concept." ITS International 14(2) (2008): NA8 - NA9.
FDOT. Traffic Monitoring Handbook. Florida Department of Transportation, Transportation
Statistics Office, 2007.
Fernado, Emmanuel G., et al. Deploying Weigh-in-motion installations on Asphalt Concrete
Pavements. Austin: Texas Department of Transportation, 2009.
FHWA. Commercial Motor Vehicle Size and Weight Enforcement in Europe. Washington D.C.\:
Federal Highways Administration, 2007.
FHWA. Concept and Operation of Virtual Weigh Station. Washington D.C.: Federal Highways
Administration, 2009a.
FHWA. "Traffic Detector Handbook." FHWA-HRT-06-108, Washington D.C., 2006.
FHWA. "Traffic Monitoring Guide." FHWA-PL-01-021, Washington D.C., 2012.
FHWA. Truck Size and Weight Enforcement Technologies-Sate of Practice, Final Report.
Washington D.C.: U.S. DOT, 2009b.
FHWA. "WIM Data Analyst's Manual." 2010.
GDOT. 2012 Georgia Traffic Monitoring Program. Georgia Department of Transportation,
2012.
Google. Official Blog: The bright side of sitting in traffic: Crowdsourcing road congestion data.
August 25, 2009. http://googleblog.blogspot.com/2009/08/bright-side-of-sitting-in-
traffic.html (accessed June 13, 2013).
Help. Last accessed September 2013. www.helpinc.us.
IRD. Last access September 2013.
http://www.irdinc.com/systems/wim/wim_technology/slc.php.
Janin, J. F. "Intelligent Freight." Proceedings of International Conference on Heavy Vehicles.
Paris, 2008.
Jessberger, Steven. "Welcome to FHWA's TMAS Version 2.0 Demonstration." 2012.

52
Jiang, X., S.H. Vaziri, C. Haas, L. Rothenburg, G. Kennepohl, and R. Hass. "Improvements in
Piezoelectric Sensors and WIM Data Collection Technology." Annual Conference of the
Transportation Association of Canada. Vancouver, British Columbia, 2009.
Karamihas, S. M., and T. D. Gillespie. Smoothness Criteria for WIM Scale Approaches. Federal
Highway Administration, Fairbank Highway Research Center, 2002.
Louisiana. RS 32:930 Part VI-A Weigh-in-motion Photo Enforcement System. 2012.
http://www.legis.state.la.us/lss/lss.asp?doc=88346 (accessed 2012).
Mahmoudabadi, A., and S. M. Seyedhosseini. "Improving the Efficiency of Weigh-in-Motion
Systems Through Optimized Allocating Truck Checking Oriented Procedure." IATSS
Research 36(2) (2013): 123-128.
Main Roads - Western Australia. Guide to the Design of Culway. January 17, 2012.
https://www.mainroads.wa.gov.au/BuildingRoads/StandardsTechnical/RoadandTrafficEn
gineering/RoadsideItems/Pages/Guide_to_the_Design_of_Culway.aspx (accessed June
14, 2013).
Middleton, Dan, Ricky Parker, and Ryan Longmire. Investigation of Vehicle Detector
Performance and ATMS Interface. College Station: Texas Transportation Institute, 2007.
Miller, Mark A., and Ashkan Sharafsaleh. "Planning the Development of a Commercial Motor
Vehicle Virtual Weigh Station Testbed." California PATH Research Report, 2010.
Mimbela, Luz-Elena Y., Jim Pate, Scott Copeland, Las Cruces, Perry M. Kent, and John
Hamrick. Applications of Fiber Optic Sensors in Weigh-in-motion (WIM) Systems for
Monitoring Truck Weights on Pavements and Structures. Albuquerque: New Mexico
State Highway and Transportation Department, 2003.
Miovision. Miovision Technologies. 2013. http://miovision.com/.
Mn/DOT. Collecting and Managing Traffic Data on Local Roads. Mn/DOT, 2012.
Mn/DOT. Minnesota Statewide Commercial Vehicle Compliance Stratigic Plan. St. Paul:
Minnesota Department of Transportation, 2005.
Mn/DOT. Traffic Monitoring and Analysis Business Process. Traffic Forecast and Analysis
Section, Minnesota Department of Transportation, 2011.
—. "Using Weigh-In-Motion (WIM) Systems for Screening Prior to Weight Enforcement."
August 2013.

53
Mn/DOT. Virtual Weigh Station Demonstration: Minnesota Statewide Commercial Vehicle
Weight Compliance Strategic Plan. St. Paul: Minnesota Department of Transportation,
2007.
MS2. "http://www.ms2soft.com/trafficcountdata.aspx." 2013.
NATMEC. "Improving Traffic Data Collection, Analysis, and Use." Seatle: Transportation
Research Board, 2010.
NCHRP. "Vehicle Size and Weight Management (VSW) Technology Transfer/ Best Practices."
20-07/Task 254, 2010.
Norman, O. K., and R. C. Hopkins. Weighing vehicles in motion. Highway Research Board,
National Research Council, 1952.
NORPASS. Last accessed September 2013. http://www.norpass.net/.
Nova Teck. Traffic Monitoring Acoustic Sensors. September 26, 2013. http://nova-
teck.com/traffic_monitoring_acoustic_sensors.html.
ODOT. Last accessed September 2013.
http://www.oregon.gov/ODOT/MCT/Pages/GREEN.aspx.
Papagiannakis, A. T., R. Quinley, and S. R. Brandt. High Speed Weigh-in-motion System
Calibration Practices - NCHRP Synthesis 386. Washington D.C.: Transportation
Research Board, 2008.
Regan, Amelia, Minyoung Park, Srinivas Nandiraju, and Choon-Heon Yang. Strategies for
Succesfull Implementation of Virtual Weigh and Complience Systems in California.
Sacramento: The California Department of Transportation Division of Research and
Innovation, 2006.
Sayyady, F., Y. Fathi, G. F. List, and J. R. Stone. "Locating Traffic Sensors on a Highway
Network: Models and Algorithms." TRB 92nd Annual Meeting Compendium of Papers.
Washington D.C.: Transportation Research Board, 2013.
Sluss, J. J., J. P. Haylicek, T. Runolfsson, and M. P. Tull. Advanced Weigh-in-Motion. Oklahoma
Department of Transportation, 2007.
Starr, R., R. S. Brewer, R. Hille, and D. E. Shamo. "Virtual Weigh Station Demonstration
Project in Minnesota." 15th World Congress on Intelligent Transportation Systems and
ITS America's 2008 Annual Meeting. 2008. 8.

54
Stephens, Jerry, and Jodi Carson. Follow-On Evaluation of the Montana Department of
Transportation's State Truck Activities Reporting System. Helena: Montana Department
of Transporation, 2005.
Stone, J., et al. Development of Traffic Data Input Resources for the Mechanistic Emperical
Pavement Design Process. North Carolina Department of Transportation, 2011.
Strathman, James G. The Oregon DOT Slow-speed Weigh-in-motion (SWIM) Project, Final
Report. Salem: Oregon Department of Transportation, 1998.
Taniguchi, E., and Y. Imanishi. "Methodology and Effects of Heavy Vehicle Transport
Management in Urban Areas." Proceedings of International Conference on Heavy
Vehicles. Paris, 2008.
The Conneticut Academy of Science and Engineering. A Study of Weigh Station Technologies
and Practices. Conneticut Department of Transportation, 2008.
Traffic Data Systems GmbH. August 2013. http://www.traffic-data-systems.net/en/weigh-in-
motion-wim/weigh-in-motion-enforcement-wim-e.html (accessed August 2013).
USDOT. ITS Research Fact Sheets. 2013. http://www.its.dot.gov/factsheets/dsrc_factsheet.htm
(accessed August 2013).
WisDOT. "Use of WIM Sites for Commercial Vehicle Enforcement." 2013.
Zhang, Lixin, Carl Hass, and Susan L. Tighe. "Evaluating Weigh-in-motion Sensing Technology
for Traffic Data Collection." Annual Conference of the Transportation Association of
Canada. Saskatoon, 2007.

A-1
APPENDIX A
For each responded questionnaire, the answers in green are the information filled in by
the research team and verified/updated by each state, those in black are responses from each
state, and those in red are clarified information through follow-up phone interviews or emails.

A-2
North Dakota’s Survey Response
Part I Preliminary Questions 1. General size of your current WIM and ATR traffic data collection program
a. Number of WIM sites: 13 Number of functioning WIM sites: 7 – remaining sites will be repaired in 2013/2014
b. Number of ATR sites: 50 Number of functioning ATR sites: 49
c. Number of WIMs or ATRs owned or operated by data sharing partners outside of your DOT: (i.e. MPOs, cities, etc.): 2
d. What other technologies are you currently using to collect traffic data year-round? (i.e. cameras, infrared sensors, in-road pucks such as Groundhogs, etc.)? Miovision Video Camera Technology
2. Management and operation of your current traffic program a. Staffing composition and organizational structure of the traffic data
collection unit in your DOT.
If possible, please provide a chart showing the organizational structure and size of the traffic collection unit in your DOT.
Staffing composition and organizational structure is comprised of; o 1- FTE Section Leader, office personnel o 2- FTE traffic/WIM data analysis/quality control etc, office personnel o 2- FTE traffic data collection crew members, field personnel o 1- FTE traffic data collection crew member (field personnel) but only 50%
of their time is utilized for traffic data collection duties.
b. Number of personnel involved Indicate the number of FTEs responsible for each of the following WIM and ATR functions. If the work is contracted out, check the “Contracted out” box:
Functions # of FTEs if done in house
Check the cell if contracted out
Installation x
Maintenance 8
Repair x
Calibration 8

A-3
Indicate number of FTEs responsible for processing, QCing, and analyzing WIM and ATR data: 2 Please check this box if these services are contracted out: Maintenance and Calibration are separate Divisions/Departments from the Traffic Data Collection Division/Department
c. WIM calibration Please indicate how your WIMs are calibrated, even it is contracted out: Method: several calibration runs are made over the site with a (known weight) 5 axle semi-tractor/trailer loaded between 76,000 and 80,000lbs We make enough calibration runs with the calibration vehicle until we are satisfied that the site can’t be calibration any further or that the results can get any better so the threshold will vary and so we really have no threshold. Cycle: yearly Typically every fall or late summer. We are in fact starting next week with the calibration.
d. Annual ATR and WIM program costs. If these services are contracted out,
please indicate if the contract is a set fee per year or by the volume of data or number of sites, etc. Services and Duties Annual Cost ($)
Done in house Contracted out
Installation N/A depends on the number of sites being installed, but this work is bid out
Maintenance See Traffic data collection from WIM and ATR’s below
Repair N/A depends on the number of sites being repaired, but this work is bid out
Calibration $10,000
Traffic data collection from WIM and ATRs (i.e telephone, power, etc.)
This is an estimate only $35‐$40k but includes Maintenance from above
Traffic data analysis $110,000
Distribution (i.e. compiling/printing of monthly, annual publications, etc.)
This is an estimate only < $5000
permanent installation costs of those sites only and not a cost for portable (short term sites) data
3. Program planning/prioritization
Please explain a. How were the locations of your current WIM and ATR sites determined?
Since 2006, ATR sites have been determined using a long range or ITS Deployment Plan based on traffic volume needs for design, growth, gaps in

A-4
coverage. Original 12 WIM sites were placed near our static weigh stations as these weigh stations were closed or open during limited times only.
b. What methodology will you use for planning/prioritization of future WIM/ATR sites? Based on needs, growth etc. If possible, please provide documentation on your process. Will continue to use and update the ITS Deployment Plan, listen to our stakeholder, customers.
Part II Data Collection Technology
1. Current deployed WIM/ATR technologies (Brand, sensor type, communications, etc.)
PEEK portable ADR and road tubes Diamond Traffic portable volume counters and road tubes Miovision Video technology IRD WIM electronics and Kistler piezo sensors PEEK permanent models ADR and loop and/or AXOR K piezo sensors
Communication technology varies some fiber optic, some hard line telephone, some cellular. This fall we will be trying a test project at several WIM locations of IP addressable communications
2. Are you testing any WIM/ATR technologies or are you aware of new technologies you would like to test but currently can’t due to funding or resource limitations? Yes, a traffic data sensor study is being performed by our Advanced Traffic Analysis Center (ATAC) which is a branch of the NDDOT and the North Dakota State University
Part III Traffic Data Collection, Analysis, and Presentation
1. Types of traffic data currently being collected through WIM/ATR? WIM – GVW/axle weights, spacing, number, speed, date/time. ATR – class, speed, date/time
2. What format is your WIM and ATR collected in? (i.e. binned or individual vehicle records): PVR – per vehicle record and binned
3. Types of analysis performed on the traffic data collected (i.e. weight trend analysis, average speed by time of day, day of week, etc.): Weight trends, front axle and GVW weight, some speed analysis, time of day, day of week, class, volume
4. How are the traffic data displayed/presented and accessed by users? (i.e. is your data available on the DOT’s website? Upon request? etc.) Yes, all portable traffic counts are available on NDDOT website no other traffic data Not at this time. On our website the user can view the traffic data. We serve our other customer’s with traffic data ‐ provided in several types of formats depending on their needs. Some examples are ArcGis/ArcMap shape files, pdf’s, Excel

A-5
5. What are your future goals regarding data collection, analysis, and presentation in
regards to your WIM and ATR program? Maintain/repair/upgrade of ATR and WIM network
Part IV Traffic Data Users
1. Current traffic data users: Please indicate which of the following are current users of your traffic data: Internal Users: Planning staff Yes Traffic Operations Yes Traffic Safety Yes Highway Design Yes Weight Enforcement Yes Speed Enforcement Others not listed: Camera images for traveler information system – this camera system that I believe you are referring to does not collect traffic data – the images available on our website are from our Environmental Sensor Station ESS or RWIS – road weather information camera/sites External users: FHWA Yes Colleges/Universities Yes Research Institutes Yes Consulting companies Yes Realty companies Yes Others not listed:
2. Unmet data needs Are you aware of any unmet needs of your data users? (i.e. enforcement customers needing speed data in a format or structure that you are not currently able to provide or quality vehicle classification data on certain roadways?) If so, please indicate the unmet data need and provide the reason you are not currently able to meet this need. none at this time

A-6
South Dakota’s Survey Response
Part I Preliminary Questions 4. General size of your current WIM and ATR traffic data collection program
a. Number of WIM sites: 15 Number of functioning WIM sites: 14
b. Number of ATR sites: 62 Number of functioning ATR sites: 62 Number of WIMs or ATRs owned or operated by data sharing partners outside of your DOT: (i.e. MPOs, cities, etc.) none
c. What other technologies are you currently using to collect traffic data year-round? (i.e. cameras, infrared sensors, in-road pucks such as Groundhogs, etc.): WIM: using load cells, bending plates and Kister quart piezo. ATR: using Peek ADR 6000 system, piezo, wavetronic radar sensors and loops.
5. Management and operation of your current traffic program a. Staffing composition and organizational structure of the traffic data
collection unit in your DOT: Transportation Division----Highways Section-----Traffic Monitoring Program 6 permanent employees and 1 supervisor
If possible, please provide a chart showing the organizational structure and size of the traffic collection unit in your DOT.
b. Number of personnel involved - Indicate the number of FTEs responsible for each of the following WIM and ATR functions. If the work is contracted out, check the “Contracted out” box:
Functions # of FTEs if done in house
Check the cell if contracted out
Installation 7 (maybe 1% of a working year)
Maintenance 7 (maybe 1% of a working year)
Repair 7 (maybe 1% of a working year)
Calibration 7 (maybe 1% of a working year)
Indicate number of FTEs responsible for processing, QCing, and analyzing WIM and ATR data:

A-7
1 collecting, 1 analyzing (50% of a working year) Please check this box if these services are contracted out:
c. WIM calibration Please indicate how your WIMs are calibrated, even it is contracted out: Method: Contracted with IRD for repairs and calibration using a SDDOT supplied class 9 semi (following the ASTM standard procedure, load cells (the most expensive, ±10%, bending plates ± 15%)) Cycle: Yearly during Summer time, doing it right now. Since at winter, the load frame doesn’t work very well due to the frozen soil
d. Annual ATR and WIM program costs. If these services are contracted out, please indicate if the contract is a set fee per year or by the volume of data or number of sites, etc. Services and Duties Annual Cost ($)
Done in house Contracted out
Installation Combined cost of all the service and duties is estimated as the 5% of the total traffic monitoring staff salary, $15/hr, it is around 10,000.
Maintenance
Repair
Calibration
Traffic data collection from WIM and ATRs (i.e telephone, power, etc.)
WIM calibration costs around $20,000 yearly
Traffic data analysis
Distribution (i.e. compiling/printing of monthly, annual publications, etc.)
Note: since the permanent sites are operated automatically, most of the hrs and labor of traffic monitoring staff are spend on short-term traffic data collection, e.g. driving around the state to date collection sites.
6. Program planning/prioritization Please explain
a. How were the locations of your current WIM and ATR sites determined? Using FHWA TMG
b. What methodology will you use for planning/prioritization of future WIM/ATR sites? If possible, please provide documentation on your process. Using FHWA TMG Will add 1 more WIM site next year, then the permanent data collection system is well done, no plan to add more sites in the foreseen future. DOT is satisfied with the current system, which meets all the needs
Part II Data Collection Technology 3. Current deployed WIM/ATR technologies (Brand, sensor type, communications,
etc.) WIM: using IRD load cells, bending plates and Kistler quartz piezo. ATR: using Peek ADR 6000 system, piezo, Wavetronix radar sensors and loops. All the permanent sites have telephone line, and DOT use vendor specified software for data transmission or communication.

A-8
4. Are you testing any WIM/ATR technologies or are you aware of new technologies you would like to test but currently can’t due to funding or resource limitations? No
Part III Traffic Data Collection, Analysis, and Presentation
6. Types of traffic data currently being collected through WIM/ATR? ATR - Traffic counting and classifying data WIM - Weight
7. What format is your WIM and ATR collected in? (i.e. binned or individual vehicle records) WIM: individual vehicle records ATR: binned
8. Types of analysis performed on the traffic data collected (i.e. weight trend analysis, average speed by time of day, day of week, etc.) Yes
9. How are the traffic data displayed/presented and accessed by users? (i.e. is your data available on the DOT’s website? Upon request? etc.) Yes Reports are available for download in pdf format.
10. What are your future goals regarding data collection, analysis, and presentation in regards to your WIM and ATR program? Yes No intention to incorporate GIS for data display/presentation (only have GIS for internal use) , considering that the maintenance fee is expensive and that may limit the number of external users (if the users don’t have GIS system)
Part IV Traffic Data Users
3. Current traffic data users: Please indicate which of the following are current users of your traffic data: Internal Users: Planning staff Yes Traffic Operations Yes Traffic Safety Yes Highway Design Yes Weight Enforcement No Speed Enforcement No Others not listed: Note: state legislation doesn’t allow DOT to use weight data for weight enforcement, due to the strong farming and trucking lobby in SD. Even highway patrol is interested in weight data, but DOT is not allowed to provide such data. Since the FHWA does not require speed data, DOT doesn’t pay much attention to speed data, not real-time speed data for traveler information system. External users: FHWA Yes Colleges/Universities Yes

A-9
Research Institutes Yes Consulting companies Yes Realty companies Yes Others not listed:
4. Unmet data needs Are you aware of any unmet needs of your data users? (i.e. enforcement customers needing speed data in a format or structure that you are not currently able to provide or quality vehicle classification data on certain roadways?) If so, please indicate the unmet data need and provide the reason you are not currently able to meet this need. No

A-10
Maine’s Survey Response
Part I Preliminary Questions 7. General size of your current WIM and ATR traffic data collection program
a. Number of WIM sites: 16 Number of functioning WIM sites: 9
b. Number of ATR sites: 69 Number of functioning ATR sites: 66
c. Number of WIMs or ATRs owned or operated by data sharing partners outside of your DOT: (i.e. MPOs, cities, etc.): 2
d. What other technologies are you currently using to collect traffic data year-round? (i.e. cameras, infrared sensors, in-road pucks such as Groundhogs, etc.): Radar Cameras
8. Management and operation of your current traffic program Staffing composition and organizational structure of the traffic data collection unit in your DOT. If possible, please provide a chart showing the organizational structure and size of the traffic collection unit in your DOT.
a. Number of personnel involved
Indicate the number of FTEs responsible for each of the following WIM and ATR functions. If the work is contracted out, check the “Contracted out” box:
Functions # of FTEs if done in house
Check the cell if contracted out
Installation 1
Maintenance 1
Repair 1
Calibration
We have one Technician who is responsible for installation, maintenance and repair of all volume and classification sites. There is one Senior Technician who oversees the WIM program. He performs some maintenance and repair work, but contracts out most of this as well as all installation activities.
Indicate number of FTEs responsible for processing, QCing, and analyzing WIM and ATR data

A-11
Please check this box if these services are contracted out: The data analysis is done in Transportation Analysis Division, not by traffic monitoring program. No FTEs are assigned to WIM data analysis, they all have other duties.
b. WIM calibration Please indicate how your WIMs are calibrated, even it is contracted out: Method: Calibrated truck Cycle: once per year It’s done in‐house. We use a Class 9 truck weighing 80,000 pounds; the threshold for error is 5%. Calibration is done in late fall or early spring due to availability of the truck
c. Annual ATR and WIM program costs. If these services are contracted out, please indicate if the contract is a set fee per year or by the volume of data or number of sites, etc. Services and Duties Annual Cost ($)
Done in house Contracted out
Installation ATR‐$60,000 Wim $85‐150,000 per site
Maintenance ATR‐$30,000 Wim‐$35,000
Repair ATR‐$10,000
Wim‐$25,000
Calibration Wim‐$30,000
Traffic data collection from WIM and ATRs (i.e telephone, power, etc.)
ATR ‐ $35,000Wim‐$15,000
Traffic data analysis
Distribution (i.e. compiling/printing of monthly, annual publications, etc.)
ATR‐$2,500Wim‐$1000
9. Program planning/prioritization
Please explain a. How were the locations of your current WIM and ATR sites determined?
The majority of the volume sites were located on the higher Federal Functional Classes and concentrated in the higher volume cities/towns. High priority was given to the Interstate System. Most of the 16 counties were given at least one site. The permanent classification sites were placed in areas where the Bureau of Planning requested based on the major trucking routes and recreational traffic. Wim locations were selected to give a broad cross section of the interstate truck traffic using both major and minor routed highways. What methodology will you use for planning/prioritization of future WIM/ATR sites? If possible, please provide documentation on your process. New sites are generally based on the needs of the Bureau of Planning and on areas where significant development has occurred. New WIM sites are selected based on the Bureau of Planning, and commercial weight law changes.

A-12
Part II Data Collection Technology 5. Current deployed WIM/ATR technologies (Brand, sensor type, communications,
etc.) ATR Volume – Peek ADR counters, inductance loops ATR Classification – Peek ADT counters, Wavetronics Smart IQ Radar sensor, Measurement Specialties Brass Lingini Class 2 piezo sensors and inductance loops Communication – landlines (dial up @ 9600 Baud) and cellular communication Wim Equipment Primarly consists of Ecm Hestia 2 and 6 lane systems using Kistler instrument Quartz sensors, We also have 2 Mettlor Toledo systems using kistler sensors
6. Are you testing any WIM/ATR technologies or are you aware of new technologies you would like to test but currently can’t due to funding or resource limitations? We are testing the Aldis Gridsmart camera for volume counting. No additional Wim system tests at this time.
Part III Traffic Data Collection, Analysis, and Presentation
11. Types of traffic data currently being collected through WIM/ATR? Traffic volumes, vehicle classification, speed, vehicle weights
12. What format is your WIM and ATR collected in? (i.e. binned or individual vehicle records) All ATR data is collected in binned data; all WIM data is collected in individual vehicle records
13. Types of analysis performed on the traffic data collected (i.e. weight trend analysis, average speed by time of day, day of week, etc.) AADT, Weekly Group Mean Factors is done by Traffic Monitoring within the Traffic Engineering Division. The majority of the analysis is accomplished by the Transportation Analysis Division of the Bureau of Planning. Please contact Ed Hanscom (207)624-3320 for further information. The analysis of WIM data is mainly for pavement design, including the calculation of ESALs for traditional design method, and developing seasonal variation and truck load distribution by vehicle type for MEPDG. (Mike Morin, (207)624-3285)
14. How are the traffic data displayed/presented and accessed by users? (i.e. is your data available on the DOT’s website? Upon request? etc.) Develop yearly images of traffic count data; the latest annual traffic count report by county and by Municipality is available online for download in pdf format. Data is scanned into the Department’s electronic filing system and is available by request.
15. What are your future goals regarding data collection, analysis, and presentation in regards to your WIM and ATR program? Hopefully, to develop a comprehensive software system to collect, analyze and store all types of data. Currently, in-house programs utilizing Microsoft Acces/Excel and Visual Basic Programming are used to process and store data. We would like to provide more information to the public online; AADT data would be available on a GIS system for easy retrieval.
Part IV Traffic Data Users
5. Current traffic data users: Please indicate which of the following are current users of your traffic data:

A-13
Internal Users: Planning staff Yes Traffic Operations Yes Traffic Safety Yes Highway Design Yes Weight Enforcement Yes (share weight data with state police to facilitate enforcement) Speed Enforcement Others not listed: Provides real time speed, highway images, and traffic condition map on major highways and turnpike for Traveler Information System External users: FHWA Yes Colleges/Universities Yes Research Institutes Yes Consulting companies Yes Realty companies Yes Others not listed: Other State Agencies, Legislative Branch
6. Unmet data needs
Are you aware of any unmet needs of your data users? (i.e. enforcement customers needing speed data in a format or structure that you are not currently able to provide or quality vehicle classification data on certain roadways?) If so, please indicate the unmet data need and provide the reason you are not currently able to meet this need. Bureau of Planning needs more classification data in urban areas. Currently, there are few technologies that are able to provide this data and are expensive. The new federal requirements for speed data will create problems as we have no method for processing that data.


