
RYD-MS14
Molten Salt Pyrolysis of Waste Polystyrene
A Major Qualifying Project Report Submitted to the Faculty of the
WORCESTER POLYTECHNIC INSTITUTE in Partial Fulfillment of the Requirements for the
Degree of Bachelor of Science in Chemical Engineering
By
_____________________
Abdulaziz Alamer
_____________________
Muteb Awaji
April 30, 2014
Approved by:
_________________________________
Professor Ravindra Datta, Advisor Chemical Engineering Department, WPI
_________________________________
Professor Michael Timko, Co-Advisor Chemical Engineering Department, WPI

ABSTRACT
In recent decades, the world has been concerned about the environmental impact of waste
plastic, and researchers have been focusing on developing new methods to recycle plastic waste.
The most common are mechanical recycling techniques, but they fail to treat the majority of waste
plastics. Thus, recent studies focus on monomer recovery via thermal pyrolysis. The goal of this
project was to develop a novel single pot pyrolysis technique by employing molten salts to attain
good yields at varied conditions. The effects of temperature, salt composition and catalyst were
studied, and the yield and the composition of liquid products were analyzed. The best temperature
and salt composition that result in the highest liquid yield, monomer recovery and monomer
selectivity, were identified.
“Certain materials are included under the fair use exemption of the U.S. Copyright Law and have been prepared according to the fair use guidelines and are restricted from further use."
TABLE OF CONTENTS ABSTRACT .................................................................................................................................... i
LIST OF FIGURES ..................................................................................................................... iv
LIST OF TABLES ....................................................................................................................... vi
ACKNOWLEDGEMENTS ....................................................................................................... vii
CHAPTER 1. INTRODUCTION ................................................................................................ 1
CHAPTER 2. LITERATURE REVIEW .................................................................................... 6
2.1 Polymers ............................................................................................................................... 6
2.1.1 Types of Polymers .......................................................................................................... 6
2.1.2 Polystyrene ..................................................................................................................... 9
2.2 Pyrolysis of Polystyrene ...................................................................................................... 9
2.2.1 Mechanism of Reaction ................................................................................................ 12
2.2.2 Catalytic Pyrolysis of Polystyrene ................................................................................ 14
2.3 Molten Salts ....................................................................................................................... 16
2.3.1 Eutectic Molten Salt ..................................................................................................... 17
CHAPTER 3. METHODOLOGY ............................................................................................. 19
3.1 Objectives ........................................................................................................................... 19
3.2 Reactor Layout .................................................................................................................. 20
3.2.1 Reactor Setup ................................................................................................................ 20
3.2.2 Reactor Design ............................................................................................................. 22
3.2.3 Furnace ......................................................................................................................... 23
3.3 Procedure ........................................................................................................................... 24
3.4 Types of Different Experiment Conducted ..................................................................... 24
3.4.1 Polystyrene Baseline Tests ........................................................................................... 25
3.4.2 Molten Salt Pyrolysis Temperature Tests ..................................................................... 25
3.4.3 Varying Chloride Eutectics Tests ................................................................................. 25
3.4.4 Testing Different Catalysts ........................................................................................... 27
3.5 GC/MS Procedure ............................................................................................................. 27
3.6 Safety Procedure ............................................................................................................... 28
CHAPTER 4. EXPERIMENTAL RESULTS AND DISCUSSION ....................................... 30
4.1 Effect of Final Temperature and Molten Salt ................................................................ 30
ii

4.2 Effect of Varying Chloride Eutectic ................................................................................ 36
4.3 Effect of Catalyst ............................................................................................................... 43
CHAPTER 5. CONCLUSIONS AND RECOMMENDATIONS ........................................... 46
5.1 Conclusions ........................................................................................................................ 46
5.2 Recommendations for Future Work ............................................................................... 47
5.2.1 Effect of Residence Time/Flow Rate............................................................................ 47
5.2.2 Gas Analysis ................................................................................................................. 47
5.2.3 Different Types of Salts ................................................................................................ 48
5.2.4 Different Types of Polymer/Commercial Plastic ......................................................... 48
REFERENCES ............................................................................................................................ 49
APPENDICES ............................................................................................................................. 53
A.1 Experimental Raw Data ................................................................................................... 53
A.2 GC/MS Results ................................................................................................................. 58
iii

LIST OF FIGURES Figure 1: MSW generation rates from 1960 to 2011 (Municipal Solid Waste in the United States, 2013). .............................................................................................................................................. 1 Figure 2: Overview of secondary recycling stages (Aznar et al., 2006). ........................................ 3 Figure 3: Mer structure of polyethylene (Wikipedia, 2014). .......................................................... 7 Figure 4: Mer structure of nylon 6,6 (Wikipedia, 2014). ................................................................ 7 Figure 5: Mer structure of polystyrene (Yikrazuul, 2008). ............................................................. 9 Figure 6: General mechanism of polymer degradation (Onwudili et al., 2009). .......................... 10 Figure 7: Theoretical model to predict the behavior of molecular weight over time at 623 K (Kruse et al., 2001). .................................................................................................................................. 10 Figure 8: Fluidized-bed reactor apparatus for polystyrene pyrolysis (Yirong et al., 2000).......... 11 Figure 9: Liquid yield as function of temperature. G1: monomer, G2: dimer, G3: trimer (Yirong et al., 2000). ...................................................................................................................................... 12 Figure 10: Initiation step (Levine et al., 2008). ............................................................................ 12 Figure 11: End-chain beta-scission (Levine et al., 2008). ............................................................ 13 Figure 12: Mid-chain beta-scission (Levine et al., 2008). ............................................................ 13 Figure 13: Hydrogen Abstraction (Levine et al., 2008). ............................................................... 14 Figure 14: Solid acid catalysts mechanism (Levine et al., 2008). ................................................ 15 Figure 15: Solid Base Catalysts Mechanism (Levine et al., 2008). .............................................. 16 Figure 16: Ternary phase diagram of chloride salts (Nitta et al., 2009). ...................................... 18 Figure 17: Semi-Batch reactor setup............................................................................................. 20 Figure 18: Reactor tube inside the furnace ................................................................................... 21 Figure 19: Schematic of the apparatus .......................................................................................... 22 Figure 20: Reactor Tube ............................................................................................................... 23 Figure 21: Lindburg/Blue tubular heater ...................................................................................... 23 Figure 22: Binary phase diagram of chloride salts (FactSage, 2014). .......................................... 26 Figure 23: Ternary phase diagram of chloride Salts (Nitta et al., 2009). ..................................... 27 Figure 24: WPI’s Godard Hall gas chromatography and mass spectrometry ............................... 28 Figure 25: Percent gravimetric liquid yield vs. temperature ......................................................... 31 Figure 26: Mass fraction of products vs. temperature .................................................................. 32 Figure 27: Selectivity of styrene to dimer vs. temperature ........................................................... 33 Figure 28: Selectivity of styrene dimer to alpha-methyl styrene .................................................. 34 Figure 29: Selectivity of styrene to alpha-methyl styrene ............................................................ 35 Figure 30: Mass fraction of liquid yield with different salts at 400℃ .......................................... 36 Figure 31: Mass fraction of products with different salts at 400℃ .............................................. 38 Figure 32: Styrene monomer yield with different salts at 400℃ .................................................. 38 Figure 33: Selectivity of styrene monomer to dimer as a function of the mol fraction of ZnCl2 39 Figure 34: Selectivity of styrene monomer to dimer as a function of the mol fraction of NaCl .. 40 Figure 35: Selectivity of styrene monomer to dimer as a function of the mol fraction of KCl .... 41 Figure 36: Slectivity of styrene monomer to dimer as a function of the mol fraction of LiCl ..... 41
iv

Figure 37: Selectivity of styrene monomer to dimer as a function of the mol ratio of LiCl to NaCl....................................................................................................................................................... 42 Figure 38: Mass percent liquid yield with different catalysts at 350℃ ........................................ 43 Figure 39: Mass fraction of compounds with different catalysts at 350℃ ................................... 44 Figure 40: Styrene monomer yield with different catalysts at 350℃ ........................................... 44 Figure 41: GC/MS spectrum for sample 20 .................................................................................. 58 Figure 42: GC/MS spectrum for sample 21 .................................................................................. 59 Figure 43: GC/MS spectrum for sample 22 .................................................................................. 59 Figure 44: GC/MS spectrum for sample 23 .................................................................................. 59 Figure 45: GC/MS spectrum for sample 24 .................................................................................. 59 Figure 46: GC/MS spectrum for sample 25 .................................................................................. 59 Figure 47: GC/MS spectrum for sample 26 .................................................................................. 59 Figure 48: GC/MS spectrum for sample 27 .................................................................................. 59 Figure 49: GC/MS spectrum for sample 28 .................................................................................. 59 Figure 50: GC/MS spectrum for sample 29 .................................................................................. 59 Figure 51: GC/MS spectrum for sample 30 .................................................................................. 59 Figure 52: GC/MS spectrum for sample 31 .................................................................................. 59 Figure 53: GC/MS spectrum for sample 32 .................................................................................. 59 Figure 54: GC/MS spectrum for sample 33 .................................................................................. 59 Figure 55: GC/MS spectrum for sample 34 .................................................................................. 59 Figure 56: GC/MS spectrum for sample 35 .................................................................................. 59 Figure 57: GC/MS spectrum for sample 36 .................................................................................. 59 Figure 58: GC/MS spectrum for sample 37 .................................................................................. 59 Figure 59: GC/MS spectrum for sample 38 .................................................................................. 59 Figure 60: GC/MS spectrum for sample 39 .................................................................................. 59 Figure 61: GC/MS spectrum for sample 43 .................................................................................. 59 Figure 62: GC/MS spectrum for sample 44 .................................................................................. 59 Figure 63: GC/MS spectrum for sample 45 .................................................................................. 59 Figure 64: GC/MS spectrum for sample 46 .................................................................................. 59 Figure 65: GC/MS spectrum for sample 47 .................................................................................. 59 Figure 66: GC/MS spectrum for sample 48 .................................................................................. 59 Figure 67: GC/MS spectrum for sample 56 .................................................................................. 59 Figure 68: GC/MS spectrum for sample 57 .................................................................................. 59 Figure 69: GC/MS spectrum for sample 58 .................................................................................. 59 Figure 70: GC/MS spectrum for sample 59 .................................................................................. 59
v

LIST OF TABLES Table 1: Total plastics in MSW by resin (Municipal Solid Waste in The United States, 2013). ... 3 Table 2: Experiments table with temperatures and liquid yield ................................................... 53 Table 3: Experiments table with salts mole fraction and additives .............................................. 54 Table 4: Mass fraction .................................................................................................................. 55 Table 5: Styrene yield ................................................................................................................... 56
vi

ACKNOWLEDGEMENTS
The team would like to first thank Professor Ravindra Datta, the project advisor, and
Professor Michael Timko, the project co-advisor, for all the support and guidance they provided.
They both helped the team manage the project and overcome obstacles. The team would also like
to thank Mr. Douglas White, machine shop manager, for helping the team with lab equipment
issues; as well as Felicia Vidito, the Chemical Engineering administrative assistant, for
maintaining project purchase orders and budget, and Alex Magg, graduate student, for helping the
team analyze the results using GC/MS.
vii

CHAPTER 1. INTRODUCTION
With the world’s current population producing about 1.3 billion tons of solid waste yearly,
management of Municipal Solid Waste (MSW) is becoming a major issue. In 2011, the MSW
generated in the United Sates was more than 250 million tons, with plastics making up 12.7% of
it, and only 8.3% was recovered while the remaining was discarded in landfills. Since the
development of plastic in the early 1900s, it has become a very popular material used in everyday
life. Plastic is used due to its cheap price, light weight, ease of fabrication and durability. However,
the unique properties that make plastics attractive for use in consumer products are also the main
concerns in the processing of their waste management, especially their being non-biodegradable,
and requiring an ultra-violate light to break down. Figure 1 below shows a graph of yearly total
MSW generation rates in the United States (Municipal Solid Waste in The United States, 2013).
Figure 1: MSW generation rates from 1960 to 2011 (Municipal Solid Waste in the United States, 2013).
88.1104.4
121.1 127.8
151.6166.3
208.3217.3
243.5253.7 250.4
0
50
100
150
200
250
300
1960 1965 1970 1975 1980 1985 1990 1995 2000 2005 2011
Tota
l MSW
Gen
erat
ion
(mill
ion
tons
)
Years
1

Due to its low density, plastics are used in applications where low weight is needed such
as food containers; therefore, plastics are very commonly used. With 91.7% of plastics being
discarded every year, finding disposal space is becoming very difficult. Plastics also have very
long shelf life, and it would take them hundreds of years to naturally decompose. The disposal of
plastic waste in landfills is not a method that is sustainable; instead more effort should be put into
improving the available recycling methods. Currently, there are four main recycling methods,
namely, primary, secondary, tertiary, and quaternary methodologies (Elsayed, 2003).
Primary recycling, also known as re-extrusion recycling, is a mechanical process in which
plastics with similar features are extruded to produce products that are similar to the original
products. This process require the materials to have similar properties and be partially clean, e.g.,
plastic bottles with processing defects, which makes processing postconsumer items difficult using
this method. However, primary recycling is a suitable method for use with industrial plastic scrap
(Al-Salem et al., 2009).
Secondary recycling is physically processing postconsumer items into a product of a lesser
value than the original product, for example plastic bottles can be recycled into fibers that can be
later used in carpets. This method of recycling can only be used with items made from the same
polymer; hence plastic identification codes are used. The plastic waste is usually extruded after
being milled and washed. Figure 2 outlines the stages of secondary recycling (Aznar et al., 2006).
2
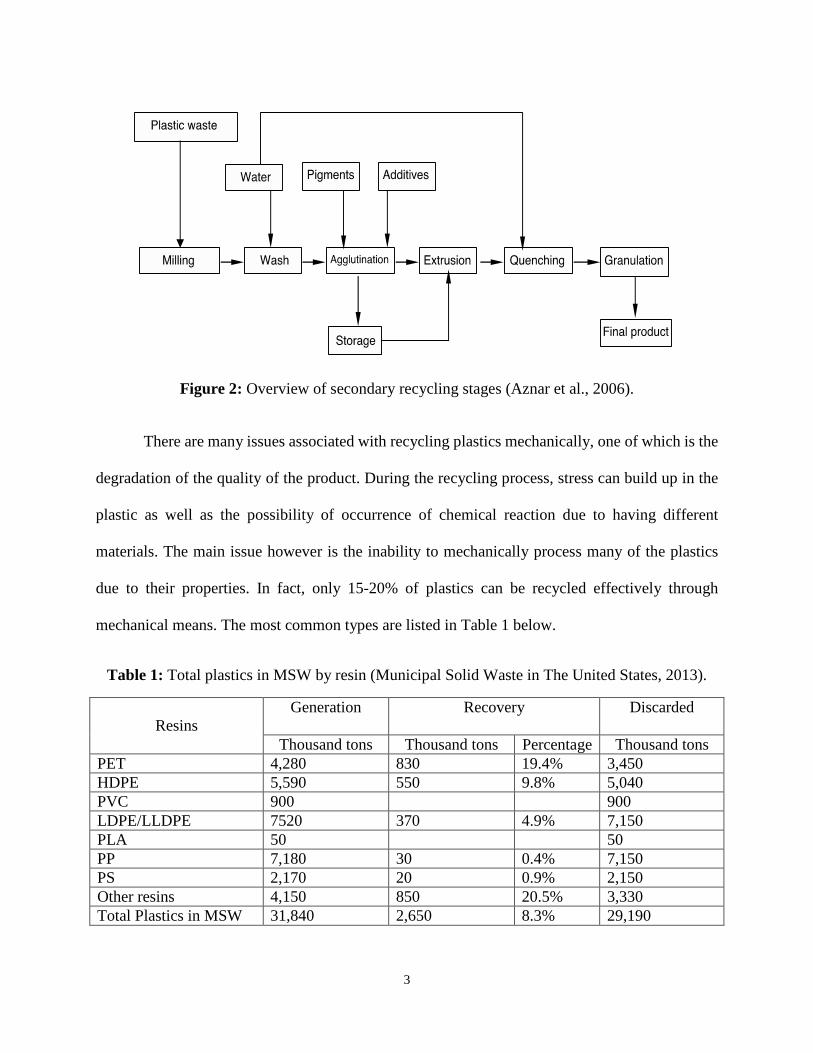
Figure 2: Overview of secondary recycling stages (Aznar et al., 2006).
There are many issues associated with recycling plastics mechanically, one of which is the
degradation of the quality of the product. During the recycling process, stress can build up in the
plastic as well as the possibility of occurrence of chemical reaction due to having different
materials. The main issue however is the inability to mechanically process many of the plastics
due to their properties. In fact, only 15-20% of plastics can be recycled effectively through
mechanical means. The most common types are listed in Table 1 below.
Table 1: Total plastics in MSW by resin (Municipal Solid Waste in The United States, 2013).
Resins
Generation
Recovery
Discarded
Thousand tons Thousand tons Percentage Thousand tons PET 4,280 830 19.4% 3,450 HDPE 5,590 550 9.8% 5,040 PVC 900 900 LDPE/LLDPE 7520 370 4.9% 7,150 PLA 50 50 PP 7,180 30 0.4% 7,150 PS 2,170 20 0.9% 2,150 Other resins 4,150 850 20.5% 3,330 Total Plastics in MSW 31,840 2,650 8.3% 29,190
3

Tertiary recycling is the process of breaking the polymer chain into lighter hydrocarbons
and high value fuel feedstock through chemical depolymerization or thermal depolymerization.
Chemical depolymerization is reversing the polymerization reaction to reduce the polymer into
monomers. Only polymers that are produced by step-growth polymerization reactions, such as
polyester, can be chemically depolymerized. However, the majority of plastic are produced by
chain-growth polymerization and for this reason, chemical depolymerization is not considered an
ideal way to treat plastic waste. Thermal depolymerization is a process of breaking down the
complex hydrocarbon into light crude oil in a pressurized, heated and oxygen free environment.
This process usually operates at a high temperature and it only breaks down long chain
hydrocarbons, such as plastics (Elsayed, 2003).
Quaternary recycling is a process which converts plastic waste directly into energy source,
such as electricity. This process is called incineration and it requires a very high temperature. One
kilogram of plastic waste can generate 11,000 Kcal of energy whereas one liter of oil can only
generate 10,200 Kcal (Elsayed, 2003). The exact amount energy generated by plastic waste
depends on the type of plastic. For example: polystyrene can produce 16,082 kcal/kg while
polyethylene can generate 18,720 kcal/kg (Elsayed, 2003). However, this form of recycling
generates gases and some hazardous compounds which could result in air pollution.
Due to the fact that waste management has become a major issue in today’s society
especially with the limited landfills, research has turned its focus to different recycling methods.
Improving the available recycling methods will help reduce air pollution as well reproduce newer
products from plastics. Therefore, the purpose of this project was to develop a new method of
ternary recycling plastic waste. This new method relies on improving the currently studied
pyrolysis of polystyrene by using molten salt, specifically chloride salt. The experiment in this
4

project was conducted at moderate temperature in order to break down polystyrene polymer into
lighter hydrocarbons. The obtained results showed that using molten salt increases the liquid yield
and the selective production of styrene monomer.
This report starts with a literature review that focuses on the types and mechanisms of
polymers, pyrolysis of polystyrene, and molten salts. This background research was then used to
determine an appropriate procedure and experiment setup for each test done in this project. Since
all of the tests were conducted in a Semi-Batch reactor, located in WPI’s Goddard Hall Reaction
Engineering Lab 222, then a layout of the reactor and its component were identified. Later, the
results obtained from all of the tests were presented and discussed. Finally, conclusions based on
the project’s results were drawn, and a recommendation for future projects was presented.
5

CHAPTER 2. LITERATURE REVIEW
2.1 Polymers
Plastics are organic materials with very large molecules that consist of a repeated unit
called mer. There are two main types of plastics, thermosets and thermoplastics. The molecule
chains in thermosets are cross-linked together through primary covalent bonds. When heated,
thermosets decompose and cannot be molded again, so they are molded while still in the gel stage
of the polymerization reaction. Examples of thermosets include epoxy, which is used as a coating
material. Thermoplastics are more common than thermosets and they are typically used for
packaging. Some common types of thermoplastics are polystyrene, polyvinyl chloride, and
polyethylene. The chains of thermoplastics are connected together by secondary bonds, so when
heated, thermoplastics melt. Further heating will cause them to decompose into monomers and
lighter hydrocarbons. Thermoplastics are molded or extruded from their resin form, i.e., after the
polymerization reaction is complete (Sperling, 2006).
2.1.1 Types of Polymers
Thermoplastics can be broken down into two categories, vinyls and non-vinyls plastics,
based on the mer structure. Two carbons connected by a single covalent bond make the main chain
of the mer of vinyl plastics. Figure 3 Shows the mer structure of polyethylene; a typical vinyl
polymer. The mer structure of non-vinyl polymers on the other hand can have many different
forms. The functional group of the main chain contributes to most of the properties of the material,
such as polarity and crystallinity. Figure 4 shows the mer structure of nylon 6,6, which has amide
as the functional group (Sperling, 2006).
6

Figure 3: Mer structure of polyethylene (Wikipedia, 2014).
Figure 4: Mer structure of nylon 6,6 (Wikipedia, 2014).
The process in which monomers are linked via covalent bonds to make a large polymer
molecule is called polymerization reaction. There are several types of polymerization reactions,
the two most common types of polymerization reactions are addition polymerization, also known
as chain growth polymerization, and condensation polymerization, which is known as step growth
polymerization (Sperling, 2006).
Generally, addition polymerization is used to produce vinyl polymers. In this process, a
free radical initiator such as benzoyl peroxide or an ionic compound is used to produce active
growth sites where monomers link together. This step of the process is called the initiation step.
The next step is called propagation, in which the molecules link together and grow rapidly. Finally,
when the desired size is reached, the reaction is terminated. Ionic compounds can also be used as
reaction initiators (Sperling, 2006).
7

In condensation polymerization, usually two different types of monomers combine to make
a non-vinyl polymer without the need of using a free radical initiator. The process is slower than
addition polymerization, and final molecular weight of polymer is much lower, but all polymer
chains are close in molecular weight as opposed to polymers produced by addition polymerization,
which generally vary in sizes especially in commercial plastics (Sperling, 2006).
There are many different methods to calculate the average molecular weight of polymer.
The two most common methods are number average molecular weight, Mn, and weight average
molecular weight, Mw. The calculations for both of the methods is shown below.
Mn = ∑ NiMii∑ Nii
(1)
Mw = ∑ NiMi2
i∑ NiMii
(2)
In the equations above, Ni represents the number of molecules that have the molecular
weight Mi. The number average molecular weight gives an equal value for all molecules.
Nevertheless, the weight average molecular weight gives a bigger value for bigger molecules since
they contribute more to the properties of the polymer. The ratio of the weight average molecular
weight to the number average molecular weight is called the polydispersity index, PDI, which
shows how uniform size of the chains is. PDI with a value of 1 indicates that all the chains have
the same size, which is a very rare case.
8

2.1.2 Polystyrene
Polystyrene is a vinyl thermoplastic synthesized from the monomer styrene. Generally,
polystyrene is considered an amorphous polymer, and therefore it has a relatively low melting
point at approximately 200 C. This also allows it to be extruded easily making it one of the most
widely used polymers. It is used in food packaging, foam packaging, electronics, and insulation.
Figure 5 shows the mer structure of polystyrene (Yikrazuul, 2008).
Figure 5: Mer structure of polystyrene (Yikrazuul, 2008).
2.2 Pyrolysis of Polystyrene
Pyrolysis is the process of rabidly heating a polymer in the absence of oxygen to break the
polymer chains into lighter hydrocarbons. There are three main products that can be formed,
styrene monomer, styrene dimer, and oligomers. Styrene monomer and dimer constitute the
majority of the product. Nonetheless, further cracking of those two products will also result in
gases and secondary products such as benzene, toluene, alpha- Methylstyrene, and ethylbenzene.
Oligomers (waxes) typically break to from trimers, dimers, and monomers. Arabiourrutia et al.
proposed an overall mechanism for the degradation of polymers in a sprouted bed reactor, which
is shown in Figure 6.
9

Figure 6: General mechanism of polymer degradation (Onwudili et al., 2009).
The pyrolysis of polystyrene is largely a temperature dependent process. The molecular
weight of the polymer starts to decrease at temperatures higher than its melting point, which is
about 200℃ (Grassie et al., 1957). A typical molecular weight as function of time at a given
pyrolysis temperature is shown in Figure 7. The graph is a theoretical model developed by Kruse
et al. in 2001 to predict the change in the number average and weight average molecular weight of
polystyrene over time at a given temperature. Initially, the change in the molecular weight of the
polymer is rapid, but it starts to level toward the end when polymer has lost the majority of the
mers.
Figure 7: Theoretical model to predict the behavior of molecular weight over time at 623 K (Kruse et al., 2001).
10

Liquid yields of pyrolysis of polystyrene as high as 97% were obtained by Yirong and
collogues at 450℃ in a fluidized bed reactor shown in Figure 8. Yirong and collogues observed
that the main components of the liquid product were styrene monomer, dimer and trimer as well
as some secondary components such as benzene, toluene, ethylbenzene, and alpha-Methyl styrene.
They also observed that the monomer yield increases with temperature until it reaches its
maximum at 600℃, where it starts to decline. The yield of the dimer however stayed constant
while the yield of trimer decreased as the temperature increased as shown in Figure 9. Overall, the
liquid yield increased with temperature until it reached its maximum at 450℃ after which it starts
to decline, while both the cracking gas and the coke increase with temperature (Yirong et al., 2000).
Figure 8: Fluidized-bed reactor apparatus for polystyrene pyrolysis (Yirong et al., 2000).
11

Figure 9: Liquid yield as function of temperature. G1: monomer, G2: dimer, G3: trimer (Yirong et al., 2000).
2.2.1 Mechanism of Reaction
The thermal depolymerization of polystyrene is a very complex process. There are many
different mechanisms via which the polymer chain can break into lighter hydrocarbons. Generally,
the first step in the reaction is called the initiation step. In this step, the polymer chain breaks at a
random location to form a radical end as shown in Figure 10. This reaction is reversible, so it is
possible for the chains to recombine and possibly form a branched chain.
Figure 10: Initiation step (Levine et al., 2008).
The reaction could then proceed via many different mechanisms. One of these is the so-
called chain unzipping or end-chain beta-scission in which the mers at the end of the chain break
12

to from monomers as shown in Figure 11 below. This mechanism is considered by many to be the
dominating mechanism for the thermal decomposition of polystyrene and explains the high styrene
monomer yield (Kruse et al., 2001).
Figure 11: End-chain beta-scission (Levine et al., 2008).
Another common mechanism is intermolecular or intramolecular head radical transfer
followed by mid-chain beta-scission. When the scission occurs at the third position, styrene dimer
is formed and when it occurs at the fifth position, a trimer is formed as shown in Figure 12 (Levine
et al., 2008).
Figure 12: Mid-chain beta-scission (Levine et al., 2008).
Another common mechanism, which has a great importance in this study of molten salt
pyrolysis, is the carbon-hydrogen bond fission, or hydrogen abstraction, which is also considered
13

as an initiation step. In this reaction, hydrogen is removed from a random location on the chain to
form a proton and a radical as shown in Figure 13 below (Kruse et al., 2001).
Figure 13: Hydrogen Abstraction (Levine et al., 2008).
2.2.2 Catalytic Pyrolysis of Polystyrene
The use of catalysts for thermal degradation of polymers can also provide many benefits.
One of the greatest benefits is improving the kinetics of the reaction without the need of using high
reaction temperatures (Ohkita et al., 1993). The use of catalysts can also improve the selectivity of
the desired product. Lee and colleagues have found that by using zeolites, the selectivity of
aromatic compounds can be increased to 99% (Lee et al., 2002).
Many have studied the use of acidic catalyst in the pyrolysis of polymers, and it showed to
have a great potential in improving the yield of the pyrolysis. A study that was done in 1995 by
Zhang et al. on the pyrolysis of polystyrene over solid acids showed that it is indeed possible to
increase the cracking of polystyrene by using solid acids. They proposed a mechanism that
explained how the acid catalyst affects the catalyst, which is shown in Figure 14 below. Essentially,
the acids add protons to chains that have not formed a radical end, which will disrupt the C-C
bond, making the fission easier. Nevertheless, Zhang et al. concluded that solid acids reduce the
yiled of liquid product, but increase the yield of gases and char due to sever cracking of styrene
(Zhang et al, 1995).
14

Figure 14: Solid acid catalysts mechanism (Levine et al., 2008).
Some of the common acid catalysts used by Zhang et al. are zeolites, which are a three-
dimensional crystalline aluminosilicate with uniform pores that act as a molecular sized sieve.
Zeolites also have ions exchange properties, which make them very attractive for a wide range of
applications (Čejka, 2007). Zeolites consist of tetrahedral SiO4 and AlO4- which give the zeolite a
-1 charge. By controlling the ratio of aluminum to silicon, the number and size of the Brønsted
acid sites, which have proton donating properties (Davis, 1991). One of the most popular types of
zeolites is ZSM-5. Zeolites have been studied extensively as catalysts in the pyrolysis of polymers
due to their Brønsted acid properties combined with large surface area. Nonetheless, it is usually
found that zeolites results in decreasing the liquid yield and increasing the gas and char yield when
used in polystyrene pyrolysis due to sever cracking caused by the acidic properties (Williams et
al., 2004). Other types of acid catalysts that could prove useful in the pyrolysis of polystyrene are
heteropoly acids, such as phosphotungstic acid. Heteropoly acids are strong Brønsted acids. They
have been studied as catalysts for Friedel–Crafts reactions, but not for thermal pyrolysis of
polymers. The main advantage of heteropoly acids over zeolites is the fact that they do not become
deactivated during the reaction. Zeolites on the other hand, could get deactivated due to blockage
of their acid sites (Kaur et al., 2002).
15

In 1995, Zhang et al. also studied the effect of using solid bases catalysts in the pyrolysis
of polystyrene. They concluded that solid bases work even better than solid acids. The reaction
time was reduced from 90 minutes with solid acids to only 20 minutes with solid bases. They
proposed a similar mechanism that explained how base catalysts affect the reaction. In this
mechanism, the base catalysts promote the hydrogen abstraction by absorbing a proton into the
base site as shown in Figure 15 (Zhang et al., 1995).
Figure 15: Solid Base Catalysts Mechanism (Levine et al., 2008).
2.3 Molten Salts
Molten salts are salts that are heated above their melting temperature. One of the biggest
challenges associated with thermal pyrolysis of polystyrene is the high viscosity of the melt, and
the poor heat transfer (Madras et al., 1997). Molten salts, such as metal chlorides, have low
viscosity and they also have catalytic properties similar to those of solid acid catalysts. Thus, the
use of molten salts for polystyrene pyrolysis provide an excellent heat transfer medium with low
viscosity, and reactive ionic properties with the capabilities of solid Lewis acid catalysts. In
addition, Brønsted acids, such as heteropoly acids, and bases such as, Ni(OH)2, can be easily be
dissolved in molten salts. With these properties, molten salts are expected to promote initiation.
This phenomenon was analyzed in polymer waste pyrolysis in molten salt studied done by
16

Chambers et al. in 1984. The feed consisted of rubber-rich polymers from automobile shredders.
Seven different metal chloride salts were studied, LiCl, KCl, CuCl, ZnCl2, NaCl, SnCl2, and AlCl3
at temperatures ranging from 380℃ to 570℃ in a Semi-Batch reactor. Chambers et al. concluded
that rate of reaction was greater than that of thermal pyrolysis, even when performed in a fluidized
bed. The liquid yield was also increased, with the highest percent conversion in the presence of
ZnCl2 (Chambers et al., 1984).
Another study regarding the use of molten salt pyrolysis was done in 1987 by Bertolini et
al. The salts that were used in this study were NaOH and Na2CO3 at 450℃ to 480℃. The liquid
yield from the molten salt pyrolysis of polystyrene was 98% with styrene composting 71.4%
(Bertolini et al., 1987). Also, previous research at WPI on the use of molten salts in pyrolysis of
biomass showed that molten salts do in fact improve the selective production of the desired
products. Overall, the use of molten salts for polymer pyrolysis looks promising.
2.3.1 Eutectic Molten Salt
Since individual salts have very high melting points, it is important to utilize eutectic
systems in order to lower the melting point of the salts. Through the use of a phase diagram, like
the one shown in Figure 16, it is possible to choose the compositions of the salts that will result in
a molten-salt at a reaction temperature lower than the melting point of the individual salts.
17

Figure 16: Ternary phase diagram of chloride salts (Nitta et al., 2009).
The chloride molten salts were chosen for this study since previous studies at WPI showed
that in biomass pyrolysis, metal chloride melts were the most effective compositions.
Furthermore, metal chlorides, such as ZnCl2, are Lewis acid catalysts. In addition to studying the
effect of chloride salts, the ideal reaction temperature and the effect of different additional catalysts
were also studied in this project in order to produce high styrene yield.
18

CHAPTER 3. METHODOLOGY
3.1 Objectives
The objectives of this MQP project include:
• A study the effect of different chloride eutectics in the pyrolysis reaction of polystyrene,
especially the yield of liquid and selectivity of monomer produced. These salts are:
o Zinc Chloride (ZnCl2)
o Sodium Chloride (NaCl)
o Potassium Chloride (KCl)
o Lithium Chloride (LiCl)
• Determination of the ideal temperature for pyrolysis reaction of polystyrene.
• Determination of the best chloride eutectics which would produce the highest liquid yield.
• Determination the best chloride eutectic which would maximize monomer recovery and
minimize secondary products.
• Testing the effect of different catalysts, namely:
o Nickel (II) Hydroxide (Ni(OH)2)
o Phosphotungstic Acid (H3PW12O40)
o Zeolite Socony Moblie-5 (ZSM-5)
19

3.2 Reactor Layout
3.2.1 Reactor Setup
In this project, the molten salt polystyrene pyrolysis reactions were conducted in a Semi-
Batch reactor, the setup is shown in Figure 17, which is located in WPI’s Goddard Hall Reaction
Engineering Lab 222. A compressed helium tank was used to provide inert gas flow to the reactor
tube, which was placed inside a furnace as shown in Figure 18. The helium gas removed volatile
compounds as well as gases produced, and it was used due to its properties as an inert gas.
Figure 17: Semi-Batch reactor setup
20

Figure 18: Reactor tube inside the furnace
The helium flow was controlled using two needle valves, and the products removed by
helium gas were condensed using three cold traps that were immersed in an ice bath. The
condensed liquid were collected using a graduate pipette while any permanent gases produced
were ventilated. Also, a J-type thermocouple was installed inside the reactor to accurately measure
temperature inside the reactor. Figure 19 below shows a schematic of the apparatus used in this
project.
21

Figure 19: Schematic of the apparatus
3.2.2 Reactor Design
The reactor tube that was used in this project was a 14 inches long stainless steel tube with
a ¾ inch diameter. The top of the reactor connected to a ¾-¼ of an inch diameter Swagelok
reducing union with a heat exchanger tee, while the bottom of the reactor was sealed by a ¾ of an
inch ferrule cap shown in Figure 20. The top of the reactor was attached to the helium inlet line,
which delivered gas into the reactor, through a 15 inch long stainless steel tube with a ⅛ inch
diameter. This was done in order to ensure that the vapors produced were directly carried out of
the reactor.
22

Figure 20: Reactor Tube
3.2.3 Furnace
The furnace used to heat the reactor is a Lindburg/Blue Mini-Miite TF55030A Tubular
Heater shown in Figure 21. The furnace uses PID controller to control the set point temperature
and the heating rate. It has a maximum temperature of 1100℃, with a heating rate up to 60℃ /min.
The heating tube inside the furnace is well insulated to reduce heat losses to the surrounding. The
furnace could be oriented vertically or horizontally; however, in this project it was utilized in a
horizontal configuration at a 30 degree angle.
Figure 21: Lindburg/Blue tubular heater
23

3.3 Procedure
In this project, we developed and followed a specific and consistent procedure during each
experiment. The procedure steps are highlighted below:
1. A specific amount of chloride salts and polystyrene were measured and mixed using a
mortar and a pestle.
2. The mixture was added to the reactor tube, and the reactor ends and the threads of the cap
and reducing union were lubricated then sealed using a wrench.
3. Then, the helium inlet was attached to the reactor and sealed. The reactor was then placed
at an angle of 30 degree inside the inclined furnace.
4. After the system was completely sealed, it was flushed with helium for roughly 20 minutes
to ensure no oxygen was present.
5. Then, the furnace was turned on to the temperature of 150℃ for 30 minutes in order to dry
off water.
6. Once the water was dried, the temperature was then raised at 60℃ /min to the desired
temperature, typically 400℃, for an hour and a half.
7. After an hour and a half, the furnace was turned off and the produced liquid was collected
from the flasks into vials and weighed.
8. Once the reactor cooled down, the reactor was cleaned and any solid product remaining in
the reactor was weighed.
9. Finally, the reactor was reassembled and used for the next experiment.
3.4 Types of Different Experiment Conducted
To achieve the objectives of this project listed above, different experiments were
conducted. These experiments are: 1) Polystyrene baseline tests, 2) Molten salt pyrolysis
24

temperature tests, 3) Varying chloride eutectic tests and 4) Effects of different catalysts. A
description of each of these set of experiments is presented below.
3.4.1 Polystyrene Baseline Tests
In order to study the effect of temperature on polystyrene without any salt or catalyst, it
was necessary to test polystyrene by itself at different temperatures. Two grams of polystyrene
were charged into the reactor and allowed to undergo thermal pyrolysis for almost two hours. Five
different experiments were conducted at the same heating rate of 60℃ /min with final temperatures
of 250℃, 300℃, 350℃, 400℃ and 450℃.
3.4.2 Molten Salt Pyrolysis Temperature Tests
To determine the effect of final temperature of the molten salt pyrolysis before testing
different chloride eutectics, it was necessary to test the same chloride eutectics with the same end
temperatures as the baseline tests. A 10:1 eutectic to polystyrene molar ratio was used, because it
is the minimum amount of salt that would cover the two grams of polystyrene. The chloride
eutectic consisted of 60% mole of zinc chloride, 20% mole of sodium chloride, and 20% mole of
potassium chloride. This specific combination of chloride eutectic was chosen since it has a
melting temperature of 237℃, which is lower than the lowest temperature that was used in the
baseline thermal tests.
3.4.3 Varying Chloride Eutectics Tests
Following the testing of the effect of molten salt pyrolysis final temperature, different
chloride eutectics were tested to determine which chloride composition produce the highest liquid
yield. To minimize operating cost, cheaper salts such as NaCl were tested and compared to the use
of more expensive salts such as KCl and LiCl in order to see if they could be used interchangeably.
The specific amount of each salt was selected in a way that the mixture would melt below operating
25
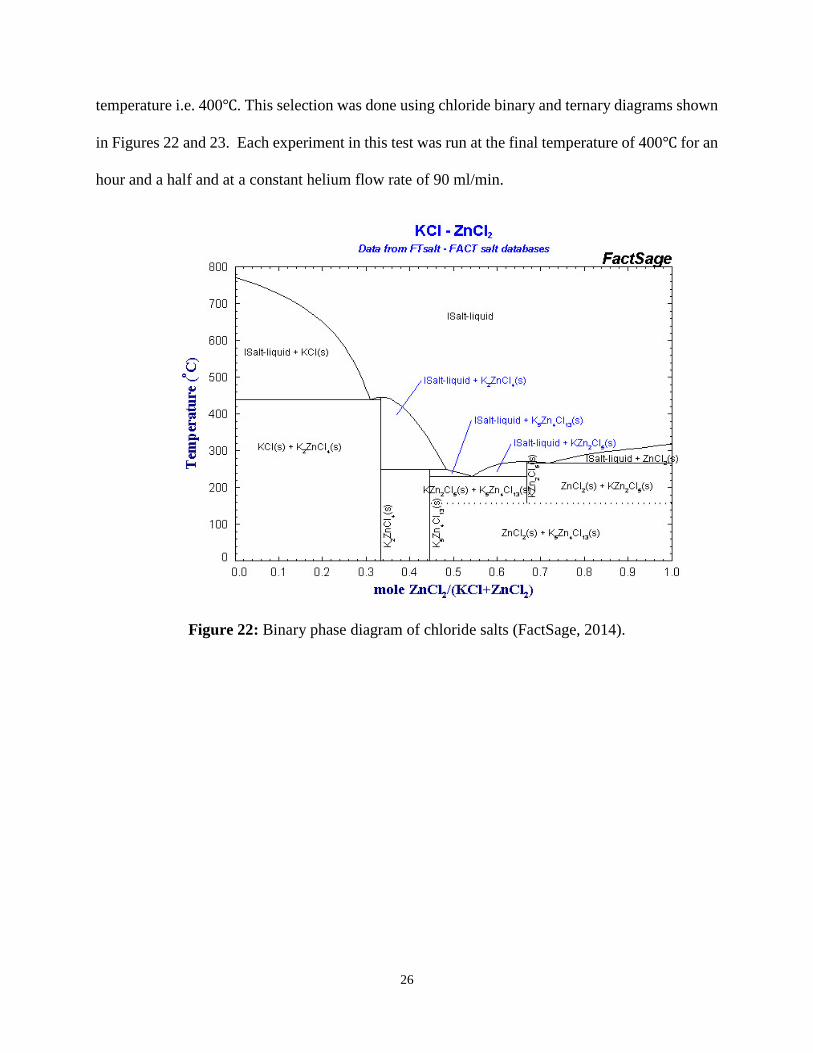
temperature i.e. 400℃. This selection was done using chloride binary and ternary diagrams shown
in Figures 22 and 23. Each experiment in this test was run at the final temperature of 400℃ for an
hour and a half and at a constant helium flow rate of 90 ml/min.
Figure 22: Binary phase diagram of chloride salts (FactSage, 2014).
26

Figure 23: Ternary phase diagram of chloride Salts (Nitta et al., 2009).
3.4.4 Testing Different Catalysts
In order to know if the same liquid yield could be produced at a lower temperature, testing
different catalysts was necessary. Three experiments were run using Zeolite, Nickel hydroxide,
and Phosphotungstic Acid. These experiments were run at 350℃ for an hour and a half. One gram
of each catalyst was mixed with two grams of polystyrene, 40% mole of zinc chloride, 50% mole
lithium chloride, and 10% mole of potassium chloride.
3.5 GC/MS Procedure
To understand how changing different variables changes the composition of the liquid
product, a Gas Chromatography and Mass Spectrometry (GC/MS) shown in Figure 24 was used
to analyze the liquid product. The instrument is made by SHIMADZU (model: GCMS-QP2010
SE), and the installed capillary column used in this project, SHRXI-5MS, is also supplied by
27

SHIMADZU (model: 30 m _ 0.25 mm i.d., 0.25 mm film thickness). In this project, the GC/MS
was set by the following temperature programming: initial oven temperature was 40 ℃, held for
2 min; then the temperature was raised to 250℃ at 5 ℃/min, and held for 6 min. Helium was used
as a carrier gas with a constant flow rate of 38.9 ml/min. The amount of injection was 0.5 µl at
split mode (split ratio, 20:1). The MS was operated in the electron impact mode, the ion source
temperature was 230℃ and electron energy was 70 eV. The mass range from 35 m/z to 500 m/z
was scanned. The obtained liquids were diluted in acetone before injection to ensure that the GC
would not be overloaded with concentrated samples.
Figure 24: WPI’s Godard Hall gas chromatography and mass spectrometry
3.6 Safety Procedure
During the course of this project, the MQP team had to deal with some hazardous chemicals
and very high temperature. Latex gloves and safety goggles were worn all the time in the lab. Also,
it was necessary to wear heat resistant gloves when handling any component which was heated by
28

the furnace. The chemical wastes were separated carefully into municipal and hazardous wastes to
ensure proper disposal of chemicals. A fume hood was placed above the furnace, in order to ensure
that no gas produced would escape to the lab.
29

CHAPTER 4. EXPERIMENTAL RESULTS AND DISCUSSION
4.1 Effect of Final Temperature and Molten Salt
The first part of this project was to determine the desired final temperature of polystyrene
pyrolysis, and study the effects of molten salt on the pyrolysis. This was done using the procedure,
described in section 3.3. During the experiment, the final set temperature was varied from 250℃
to 450℃, i.e., by increments of 50℃ all with 60℃ /min heating rate. The blue line in Figure 25
shows the mass percent liquid yield of polystyrene at different temperatures via thermal pyrolysis,
while the red line indicates the mass percent liquid yield of polystyrene with molten salt pyrolysis
at different final temperatures. For polystyrene baseline pyrolysis, the minimum percent liquid
yield of 25% was obtained at 250℃ and 300℃ , while the maximum percent liquid yield of 80%
was obtained at the temperature of 450℃.
As seen is Figure 25, there is an increase of the liquid yield from 25% to 60% when the
temperature is increased from 300℃ to 350℃. At 350℃, the liquid yield increases by 10% for
every 50℃ rise in temperature, reaching the maximum liquid yield of 80% at 450℃. For the molten
salt pyrolysis, it is clearly seen that the salt increases the overall liquid yield at a given temperature
relative to the case of pyrolysis without salt. At temperatures of 250℃ and 300℃, the relative
liquid yield increases by 5 % to 30% liquid yield. The maximum relative increment of liquid yield
is achieved at temperatures of 400℃ and 450℃, where the yield increases by 10% reaching 80%
and 90 %, respectively. Nevertheless, the minimum increment of 5% is obtained at 350℃.
30

Figure 25: Percent gravimetric liquid yield vs. temperature
Using CMS, the obtained liquids from all the experiments were analyzed and their main
product concentrations were determined. The main compounds identified by GC/MS are toluene,
alpha-methyl styrene, styrene monomer, and styrene dimer. These four primary compounds make
up about 85 wt. % of the obtained liquids on average. The other 15 wt. % consisted of xylene,
ethylbenzene, bibenzyl, ethylene, and other unidentified compounds. Figure 26 shows the weight
fraction of the four main compounds at different temperatures. It is clear from the graph that as
temperature increases, the weight fraction of styrene, which is the primary product, increases. On
the other hand, at 300℃, the weight fraction of styrene decreases and that of styrene dimer, another
primary product, increases. At a temperature of 400℃, the primary products are maximized,
whereas at 250℃ the primary products are minimized and the secondary products reach the
maximum.
10%
20%
30%
40%
50%
60%
70%
80%
90%
100%
200 250 300 350 400 450 500
Liqu
id Y
eild
(%)
Temperature, oC
Liq Yeild % vs Tmep (C)-PS
Liq Yeild % vs Tmep- PS +Salts
31

Also, Figure 26 shows the effect of molten salt on the production of the primary and
secondary products. In general, the molten salt increases the styrene monomer, alpha-methyl
styrene, and toluene, but decreases dimer and other products. At a temperature of 400℃, all of the
products are increased except for the alpha-methyl styrene. At 450℃, all of the products are almost
constant with a big increment in styrene monomer compared to its weight fraction at 400℃.
Overall, the effect of molten salt on styrene monomer production is minimized at high temperature,
and the molten salt has the same effect on the styrene recovery as simply increasing the
temperature.
Figure 26: Mass fraction of products vs. temperature
Figure 27 shows the effect of temperature and molten salt on the selectivity of the two
primary product of polystyrene pyrolysis, styrene monomer to styrene dimer. The blue squares
represent the selectivity of styrene to dimer in dry pyrolysis of styrene, and the orange squares
0
0.1
0.2
0.3
0.4
0.5
0.6
0.7
0.8
0.9
1
250 250 (salt) 300 300 (salt) 350 350 (salt) 400 400 (salt) 450 450 (salt)
Mas
s Fra
ctio
n of
Pro
duct
s
Temperature, oC
styrene dimer toluene alpha methyl styrene others
32

represent the selectivity of styrene when molten salt is used at different temperatures. In general,
the selectivity of styrene increases with increasing the temperature, and it reaches the highest
selectivity value of almost six for thermal pyrolysis at the temperature of 450℃. Also, the molten
salt has a strong effect of increasing selectivity of styrene, especially at 450℃ where the selectivity
reaches the highest value of eighteen. This indicates that the styrene monomer is favorable over
the styrene dimer at high temperature, and it is more favorable when molten salt is used. It is
possible that dimer is converted further into monomer at higher temperatures and in the presence
of molten salts, i.e., it is an intermediate (rather than parallel) product of polystyrene pyrolysis.
Figure 27: Selectivity of styrene to dimer vs. temperature
The graph in Figure 28 shows the selectivity of primary to secondary products, styrene
dimer to alpha-methyl styrene. The graph shows two sets of data for dimer selectivity, the blue
squares represent the selectivity without using molten salt, and the orange squares represent the
selectivity with adding molten salt. The blue squares pattern indicates that the selectivity of dimer
0
2
4
6
8
10
12
14
16
18
20
200 250 300 350 400 450 500
Sele
ctiv
ity
Temperature, oC
styrene/ dimer (no salt)
styrene/dimer ( salt)
33

decreases as temperature increases; however, at 300℃, the selectivity inexplicably increases
sharply reaching the highest value of nineteen. Furthermore, the orange squares for molten salt
pyrolysis show that the dimer selectivity follows the same trend as the one observed for the blue
squares, reaching the highest selectivity value of 2.6 at temperature of 300℃. This demonstrates
that the molten salt decreases the selectivity of dimer to alpha-methyl styrene, which means the
salt helps the dimer to crack further and produce secondary product, alpha-methyl styrene. In other
words, the dimer is an intermediate product in the production of alpha-methyl styrene as well.
Figure 28: Selectivity of styrene dimer to alpha-methyl styrene
The selectivity of styrene to alpha-methyl styrene for polystyrene pyrolysis thermal and
molten salt pyrolysis of polystyrene is shown in Figure 29. The blue squares represent the styrene
selectivity for thermal pyrolysis, and the orange squares represent the selectivity for the molten
salt pyrolysis. The blue squares show that the selectivity of styrene to alpha-methyl styrene
increases with increasing temperature except at 300℃, where the selectivity drops reaching the
0
2
4
6
8
10
12
14
16
18
20
0 100 200 300 400 500
Sele
ctiv
ity
Temperature, oC
dimer/alpha methylstyrene (no salt)
dimer/ alpha methylstyrene (salt)
34

lowest value of 5.9. Moreover, the orange squares illustrate that adding molten salt increases the
selectivity of styrene compared to its selectivity without molten salt. On the other hand, the overall
selectivity of styrene in the molten salt pyrolysis decreases as the temperature increases, reaching
the lowest value of fourteen at 450℃. This implies that at higher temperatures the monomer is
converted into further products.
Figure 29: Selectivity of styrene to alpha-methyl styrene
0
5
10
15
20
25
200 250 300 350 400 450 500
Sele
ctiv
ity
Temperature, oC
styrene/ alpha methylestyrene (no salt)
styrene/ alpha methylstyrene (salt)
35

4.2 Effect of Varying Chloride Eutectic
For the study of varying eutectic compositions, the temperature of choice was 400℃ for two
reasons. First, it allowed the team to study any eutectic with melting temperature below 400℃.
Second, the difference in liquid yield between thermal pyrolysis and molten salt pyrolysis at 400
℃ was bigger than that of any temperature below that, which means that the effect of molten salt
will be more desirable at that temperature. ZnCl2 was used in most of the eutectics because it had
the lowest melting point of any of the salts, so it helped bring down the melting temperature of the
eutectic. Furthermore, it is a Lewis acid, which could be enhancing effectiveness of the molten
salt. The results for varying the salt compositions are shown in Figure 30.
Figure 30: Mass fraction of liquid yield with different salts at 400℃
0
0.1
0.2
0.3
0.4
0.5
0.6
0.7
0.8
0.9
1
Mas
s Fra
ctio
n of
Liq
uid
Salt Composition
36

All the experiments were conducted under the same conditions; the temperature was 400℃,
the helium flow rate was roughly 90 mL/min, the mole ratio of the salt to the polystyrene mer units
was 10 to 1, and two identical stainless steel reactors were used. The uncertainty in the procedure,
0.0303, was calculated by repeating one of the runs 4 times and obtaining the standard deviation
of the five data points. The highest liquid yield obtained was 94.7 ± 3.03 wt % by using 40 mol%
ZnCl2, 30 mol% NaCl, and 30 mol% LiCl. The second highest liquid yield was 92.6± 3.03 wt %,
which was obtained by using 40 mol% ZnC l2, 30 mol% KCl and 30 mol% LiCl. By visually
inspecting the quality of products it was observed that when all the samples that used eutectic that
contained NaCl were darker in color than the rest of the samples, especially when used with LiCl.
Also, eutectics containing NaCl provided inconsistent yields. Eutectics containing a combination
of LiCl and KCl provided excellent yields with good visual quality of product overall. The salt
composition of 40% ZnCl2, 10% KCl, and 50% LiCl had the liquid product with the best visual
quality with an acceptable yield, 87.1±3.03 wt%, and therefore, this eutectic was chosen for the
subsequent catalyst study.
The data was analyzed using GC/MS in order to obtain the mass fraction of the major
components in each of the samples. The results are shown in Figure 31. Overall, the styrene
monomer accounts for the majority product, with lowest being 58.6 wt% with the salt combination
40 mol% ZnCl2, 10 mol% NaCl, and 50 mol% LiCl, while the eutectic, 40 mol% ZnCl2, 30 mol%
NaCl, and 30 mol% LiCl, provided the highest monomer percent at 77.6 wt%. The highest
monomer yield was 73.5±2.35 wt% as shown in Figure 32. This figure also shows an interesting
pattern which is, when keeping ZnCl2 constant at 40 mol% and varying the other two salts, the
monomer recovery approaches the highest value when the ratio of two salts is closest to 1.
37

Figure 31: Mass fraction of products with different salts at 400℃
Figure 32: Styrene monomer yield with different salts at 400℃
00.10.20.30.40.50.60.70.80.9
1M
ass F
ract
ion
of P
rodu
cts
Salt Composition
Toluene Styrene monomer Alpha-Methyl Dimer Other
0
0.1
0.2
0.3
0.4
0.5
0.6
0.7
0.8
Mas
s Fra
ctio
n of
Sty
rene
Salt Composition
38

In order to see which of the salts has the biggest effect on the mechanism of the reaction,
the selectivity of styrene monomer to dimer was plotted as a function of mole fraction for each of
the four salts that were tested. Figure 33 shows the selectivity of styrene monomer to dimer as a
function of mol fraction of ZnCl2.
Figure 33: Selectivity of styrene monomer to dimer as a function of the mol fraction of ZnCl2
The graph above shows a strong positive trend. The selectivity of styrene increases as the
amount of ZnCl2 in the salt mixture increases. This means that production of styrene monomer is
more becomes more favorable in the presence ZnCl2. Figure 34 below shows the selectivity of
styrene monomer to dimer as a function of the mol fraction of NaCl.
0
2
4
6
8
10
12
14
16
18
0 0.2 0.4 0.6 0.8 1 1.2
Sele
ctiv
ity
Mole Fraction of ZnCl2
39

Figure 34: Selectivity of styrene monomer to dimer as a function of the mol fraction of NaCl
The effect of NaCl on the selectivity is uncertain. It seems that the selectivity fluctuates as
the mol fraction of NaCl increases, but overall it has an almost constant trend. Nonetheless, this
could be because the behavior changes depending on the nature of the other two salts. Figure 35
and Figure 36 represent the selectivity of styrene as a function of the mole ratio KCl and LiCl,
respectively. Both data sets behave similarly to that of NaCl, with selectivity fluctuating but have
an overall constant trend.
0
1
2
3
4
5
6
7
8
9
10
0 0.1 0.2 0.3 0.4 0.5 0.6
Slec
tivity
Mole Fraction of NaCl
40
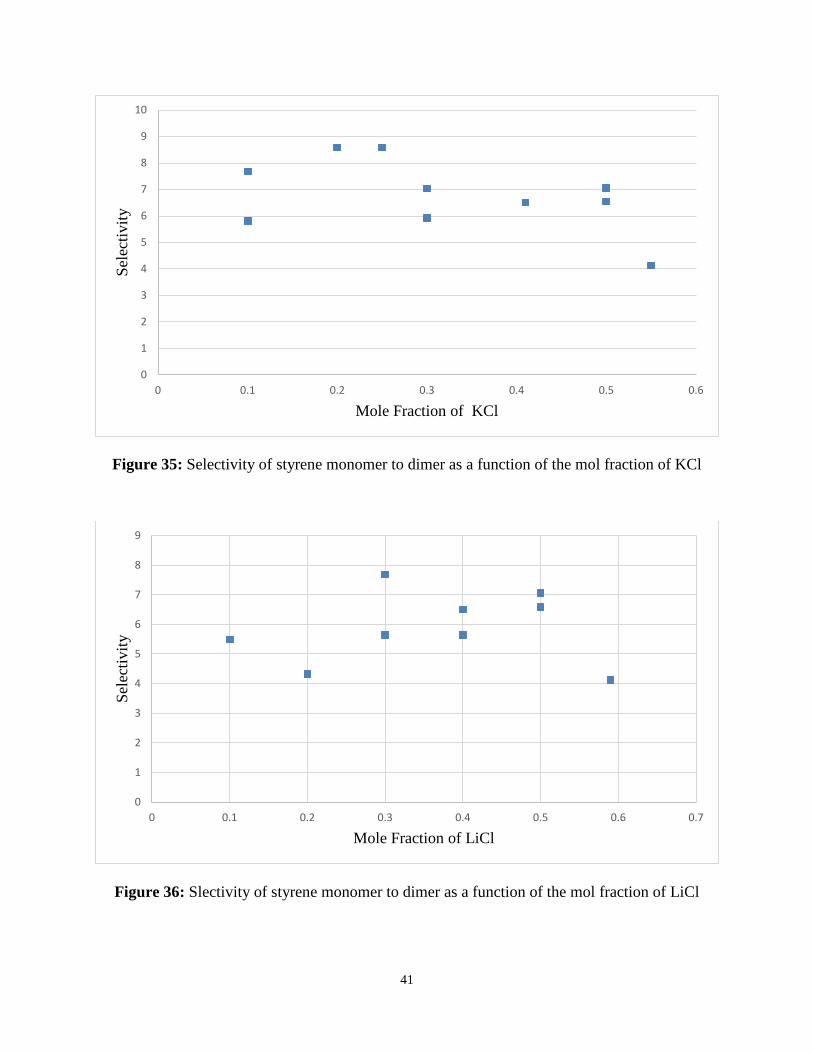
Figure 35: Selectivity of styrene monomer to dimer as a function of the mol fraction of KCl
Figure 36: Slectivity of styrene monomer to dimer as a function of the mol fraction of LiCl
0
1
2
3
4
5
6
7
8
9
10
0 0.1 0.2 0.3 0.4 0.5 0.6
Sele
ctiv
ity
Mole Fraction of KCl
0
1
2
3
4
5
6
7
8
9
0 0.1 0.2 0.3 0.4 0.5 0.6 0.7
Sele
ctiv
ity
Mole Fraction of LiCl
41

In order to obtain a more clear understanding of how a combination of salt affect the
behavior of the selectivity of styrene monomer to dimer, Figure 37 was plotted. In this figure,
selectivity is a represented as a function of the mole ratio LiCl to NaCl. From the graph it can be
seen that the selectivity can in fact increase with increasing LiCl/NaCl ratio.
Figure 37: Selectivity of styrene monomer to dimer as a function of the mol ratio of LiCl to NaCl
Among the salts that were studied, ZnCl2 had the strongest effect on the liquid yield and
selectivity of styrene. This could be caused by its Lewis acidic nature which promote hydrogen
transfer and electrophilic aromatic substitution. The nature of the other salts appear to matter less,
although the visual quality of the product decline when NaCl is used, so a eutectic of 40 mol%
ZnCl, 30 mol% LiCl, and KCl mol%, should be used since it gave the second highest yield at
92.6±3.03 wt%, with 66.7±2.31 wt% monomer yield.
0
1
2
3
4
5
6
7
0 1 2 3 4 5 6
Sele
ctiv
ity
LiCl/NaCl Mole Ratio
42

4.3 Effect of Catalyst
The composition chosen for the catalysts study is 40 mol% ZnCl2, 50 mol% LiCl, and 10
mol% KCl, because it provided a liquid yield with good visual quality and acceptable quantity.
The temperature chosen was 350℃, and the catalysts that were studied are Ni(OH)2, ZSM-5, and
phosphotungstic acid. The results for the liquid yield, product composition, and styrene yield are
shown below in Figure 38-40.
Figure 38: Mass percent liquid yield with different catalysts at 350℃
0
10
20
30
40
50
60
70
80
90
Thermal Pyrolysis MSP MSP+ Ni(OH)2 MSP+ ZSM5 MSP+Phosphotungsticacid
Liqu
id Y
ield
%
Catalyst
43

Figure 39: Mass fraction of compounds with different catalysts at 350℃
Figure 40: Styrene monomer yield with different catalysts at 350℃
00.10.20.30.40.50.60.70.80.9
1M
ass F
ract
ion
Catalyst
styrene dimer toluene alpha-methyl styrene others
0
10
20
30
40
50
60
Liqu
id Y
ield
%
Catalyst
44

From the figures above, it can be seen that the acidic catalyst, ZSM-5 and phosphotungstic
acid, reduced the liquid yield significantly, but resulted in the formation of char. This was caused
by the sever cracking due the strong Brønsted acidic properties of those two catalyst, which agrees
with many of the literature studies. On the other hand, Ni(OH)2 increased the liquid yield to
80.5±3.03% compared to 73.3±3.03% for the molten salt pyrolysis of polystyrene, and 60 ±3.03%
for the thermal pyrolysis. As a base, Ni(OH)2, had a different effect than the acid catalyst. This
could be explained by the mechanism proposed in 1995 by Zhang et al, which means that Ni(OH)2
enhanced the hydrogen abstraction mechanism that resulted in increasing the rate of the reaction
(Zhang et al., 1995).
45

CHAPTER 5. CONCLUSIONS AND RECOMMENDATIONS
5.1 Conclusions
After the analysis and discussion of all experimental results above, several conclusions can
be made regarding the temperature of the reaction, the effect of molten salts, and the effect of
catalysts on the pyrolysis of polystyrene. First, it can be concluded that 400℃ provide the highest
monomer recovery for the thermal pyrolysis of polystyrene, so it could be considered the ideal
reaction temperature at least in the absence of salts. Nonetheless, this temperature was also used
for molten salt pyrolysis.
Second, 40 mol percent zinc chloride, 30 mol percent sodium chloride, and 30 mol percent
lithium chloride provided both the highest liquid yield, at 94.7 mass percent, and the highest
styrene monomer recovery at, 77.6 mass percent, compared to 70 mass percent liquid yield and
62.6 mass percent styrene monomer recovery for the thermal pyrolysis of polystyrene. This
translates into a styrene yield of 73.5% for best molten salt pyrolysis result as compared with
43.8% for best thermal pyrolysis results, which is a significant increase. The percent of secondary
products was greatly reduced from 21.3 mass percent to only 8.63 mass percent using the same
salt composition.
Third, zinc chloride had the strongest effect on the selectivity of styrene monomer to dimer,
which could be attributed to its Lewis acid nature, which promotes hydrogen transfer and
electrophilic aromatic substitution. Fourth, the acid catalysts, ZSM-5 and phosphotungstic acid,
reduced the liquid yield due to their strong cracking capabilities when used in combination with
the molten salts, which resulted in higher char, secondary liquid products and gases. Nickel (II)
hydroxide, on the other hand, increased the liquid yield by 7 percent, but reduced the monomer
recovery and the selectivity of styrene monomer to dimer. In summary, it is possible to produce
46

styrene monomer at high yields through molten salt pyrolysis of polystyrene, and these results
show that the monomer yield can be significantly enhanced via molten salt pyrolysis as compared
to thermal pyrolysis. Clearly, this process warrants further investigation and optimization.
5.2 Recommendations for Future Work
The results of using molten salts to aid the process of polystyrene pyrolysis look promising.
However, more studies and further optimization should be performed before this process can be
used commercially.
5.2.1 Effect of Residence Time/Flow Rate
Inert gas flow rate study should be done in the molten salt pyrolysis process in order to
understand how the residence time affects the formation and selectivity of different products. At
high flow rates and short residence time, the expected product would be mostly composed of
heavier hydrocarbons, while at low flow rate and long residence time, the product is expected to
be composed of gases, lighter hydrocarbons, and char. The flow rate should be optimized to
maximize the styrene monomer selective production, and minimize styrene from further cracking
into secondary products and gases.
5.2.2 Gas Analysis
Although the reaction of gas product was relatively small, the gas produced from
polystyrene pyrolysis should be captured and analyzed. This might help perform a more accurate
mass balance around the entire system, which will also help future teams to further understand the
mechanism of the process. Also, it would be beneficial to know the composition of the gas product
in order to see if any of the gases can be recycled and used in the process or used in a different
process.
47

5.2.3 Different Types of Salts
Different types of salts should be studied in order to have a better understanding of the
effect molten salts have on pyrolysis. In particular, basic salts should be studied as they might have
a more positive effect on pyrolysis of polystyrene than chloride, due to their behavior as base
catalysts which was explained in chapter 2, Section 2.2.2. An example is NaOH-KOH eutectic,
which has a low melting point.
5.2.4 Different Types of Polymer/Commercial Plastic
Ideally, this process should be suitable to treat a mixture of different types of commercial
plastics, it is not always possible to separate the waste into different categories. In order to use this
process commercially, a study should be performed to understand which types of polymers can be
treated together in this way, and how the behavior of molten salts changes with the type of polymer
being treated and the additives in the polymer.
48

REFERENCES
Abdel-Bary, Elsayed, ed. Handbook of plastic films. iSmithers Rapra Publishing, 2003.
Al-Salem, S. M., P. Lettieri, and J. Baeyens. "Recycling and recovery routes of plastic solid
waste (PSW): A review." Waste Management 29, no. 10 (2009): 2625-2643.
Arabiourrutia, M., G. Lopez, G. Elordi, M. Olazar, R. Aguado, and J. Bilbao. "Product
distribution obtained in the pyrolysis of tyres in a conical spouted bed reactor." Chemical
Engineering Science 62, no. 18 (2007): 5271-5275.
Aznar, María P., Miguel A. Caballero, Jesús A. Sancho, and E. Francés. "Plastic waste
elimination by co-gasification with coal and biomass in fluidized bed with air in pilot
plant." Fuel Processing Technology 87, no. 5 (2006): 409-420.
Bagri, Ranbir, and Paul T. Williams. "Catalytic pyrolysis of polyethylene." Journal of Analytical
and Applied Pyrolysis 63, no. 1 (2002): 29-41.
Bertolini, Gerard E., and Jacques Fontaine. "Value recovery from plastics waste by pyrolysis in
molten salts." Conservation & recycling 10, no. 4 (1987): 331-343.
Čejka, Jiří. Introduction to zeolite science and practice. 3rd rev. ed. Amsterdam: Elsevier, 2007.
Chambers, Carey, John W. Larsen, Walter Li, and Bob Wiesen. "Polymer waste reclamation by
pyrolysis in molten salts." Industrial & Engineering Chemistry Process Design and
Development 23, no. 4 (1984): 648-654.
Chambers, Carey, John W. Larsen, Walter Li, and Bob Wiesen. "Polymer waste reclamation by
pyrolysis in molten salts." Industrial & Engineering Chemistry Process Design and
Development 23, no. 4 (1984): 648-654.
49

CRCT, École Polytechnique de Montréal. "FACT salt database - list of systems and phases.”
Accessed April 30, 2014.
http://www.crct.polymtl.ca/fact/documentation/FTsalt/FTsalt_list.htm.
Davis, Mark E. "Zeolites and molecular sieves: not just ordinary catalysts." Industrial &
engineering chemistry research 30, no. 8 (1991): 1675-1683.
Grassie, N., and W. W. Kerr. "The thermal depolymerization of polystyrene. Part 1.—The
reaction mechanism." Transactions of the Faraday Society 53 (1957): 234-239.
Kaur, Jaspalne, K. Griffin, B. Harrison, and I. V. Kozhevnikov. "Friedel–Crafts acylation
catalysed by heteropoly acids." Journal of Catalysis 208, no. 2 (2002): 448-455.
Kruse M., Todd, Oh Sang Woo, and Linda J Broadbelt. "Detailed mechanistic modeling of
polymer degradation: application to polystyrene." Chemical engineering science 56, no. 3
(2001): 971-979.
Lee, Seung-Yup, Jik-Hyun Yoon, Jong-Ryeul Kim, and Dae-Won Park. "Degradation of
polystyrene using clinoptilolite catalysts." Journal of analytical and applied pyrolysis 64,
no. 1 (2002): 71-83.
Levine, Seth E., and Linda J. Broadbelt. "Reaction pathways to dimer in polystyrene pyrolysis: a
mechanistic modeling study." Polymer Degradation and Stability 93, no. 5 (2008): 941-
951.
Liu, Yirong, Jialin Qian, and Jianqiu Wang. "Pyrolysis of polystyrene waste in a fluidized-bed
reactor to obtain styrene monomer and gasoline fraction." Fuel Processing Technology
63, no. 1 (2000): 45-55.
50

Madras, Giridhar, J. M. Smith, and Benjamin J. McCoy. "Thermal degradation kinetics of
polystyrene in solution." Polymer degradation and stability 58, no. 1 (1997): 131-138.
Unknown. Mer structure of nylon 6,6. Digital image. Wikipedia. N.p., 13 Dec. 2005. Web.
Unknown. Mer structure of polyethylene. Digital image. Wikipedia. N.p., n.d. Web.
Nitta, Koji, Toshiyuki Nohira, Rika Hagiwara, Masatoshi Majima, and Shinji Inazawa.
"Physicochemical properties of ZnCl2–NaCl–KCl eutectic melt." Electrochimica Acta
54, no. 21 (2009): 4898-4902
Ohkita, Hironobu, Ryuji Nishiyama, Yoshihisa Tochihara, Takanori Mizushima, Noriyoshi
Kakuta, Yoshio Morioka, Akifumi Ueno, Yukihiko Namiki, and Susumu Tanifuji. "Acid
properties of silica-alumina catalysts and catalytic degradation of polyethylene."
Industrial & engineering chemistry research 32, no. 12 (1993): 3112-3116.
Onwudili, Jude A., Nagi Insura, and Paul T. Williams. "Composition of products from the
pyrolysis of polyethylene and polystyrene in a closed batch reactor: effects of
temperature and residence time." Journal of Analytical and Applied Pyrolysis 86, no. 2
(2009): 293-303.
Sperling, L. H.. Introduction to physical polymer science. 4th ed. Hoboken, N.J.: Wiley, 2006.
US Environmental Protection Agency. "Municipal Solid Waste in the United States: Facts and
Figures | Municipal Solid Waste | Wastes | US EPA." Accessed April 30, 2014.
http://www.epa.gov/waste/nonhaz/municipal/msw99.htm.
51

Williams, Paul T., and Ranbir Bagri. "Hydrocarbon gases and oils from the recycling of
polystyrene waste by catalytic pyrolysis." international journal of energy research 28,
no. 1 (2004): 31-44.
Yikrazuul. Polystyrene. Digital image. Wikipedia. N.p., 21 May 2008. Web.
Zhang, Zhibo, Tamaki Hirose, Suehiro Nishio, Yoshio Morioka, Naoto Azuma, Akifumi Ueno,
Hironobu Ohkita, and Mitsunori Okada. "Chemical recycling of waste polystyrene into
styrene over solid acids and bases." Industrial & engineering chemistry research 34, no.
12 (1995): 4514-4519.
52

APPENDICES A.1 Experimental Raw Data
Table 2: Experiments table with temperatures and liquid yield
EXP PS He flow Temp Liquid Yield liquid yield % 20 2.0 g 94.3 mL/m 400 C 1.4 g 70% 21 2.0 g 95.2 mL/m 350 C 1.2 g 60% 22 2.0 g 95.2 mL/m 250 C 0.5 g 25% 23 2.0 g 95.2 mL/m 300 C 0.5 g 25% 24 2.0 g 88.3 mL/m 450 c 1.6 g 80% 25 2.0 g 95.2 mL/m 250 C 0.6 g 30% 26 2.0 g 95.2 mL/m 300 C 0.6 g 30% 27 2.0 g 89.4 mL/m 350 C 1.3 g 65% 28 2.0 g 95.2 mL/m 400 C 1.6 g 80% 29 2.0 g 88.4 mL/m 450 C 1.8 g 90% 30 2.0 g 95.2 mL/m 400 C 1.199 g 60.0% 31 2.0 g 92.4 mL/m 400 C 1.715 g 85.8% 32 2.0 g 95.2 mL/m 400 C 1.437 g 71.9% 33 2.0 g 92.1 mL/m 400 C 1.73 g 86.5% 34 2.0 g 95.1 mL/m 400 C 1.48 g 74.0% 35 2.0 g 95.2 mL/m 400 C 1.776 g 88.8% 36 2.0 g 95.2 mL/m 400 C 1.894 g 94.7% 37 2.0 g 95.2 mL/m 400 C 1.639 g 82.0% 38 2.0 g 95.2 mL/m 400 C 1.14 g 57.0% 39 2.0 g 95.2 mL/m 400 C 1.77 g 88.5% 43 2.0 g 90.2 mL/m 400 C 1.851 g 92.6% 44 2.0 g 95.2 mL/m 400 C 1.533 g 77.0% 45* 2.0 g 90.2 mL/m 400 C 1.741 g 87.1% 46 2.0 g 95.2 mL/m 400 C 1.669 g 83.5% 47 2.0 g 91.4 mL/m 400 C 1.78 g 89.0% 48 2.0 g 95.2 mL/m 400 C 1.255 g 62.8% 49* 2.0 g 90.2 mL/m 400 C 1.7173 g 85.9% 52* 2.0 g 90.6 mL/m 400 C 1.715 g 85.8% 53* 2.0 g 90.6 mL/m 400 C 1.647 g 82.4% 54* 2.0 g 90.1 mL/m 400 C 1.8306 g 91.5% 56 2.0 g 90.4 mL/m 350 C 1.466 g 73.3% 57 2.0 g 90.4 mL/m 350 C 1.609 g 80.5% 58 2.0 g 90.4 mL/m 350 C 0.549 g 27.5% 59 2.0 g 90.4 mL/m 350 C 0.269 g 13.5% 63 2.0 g 89.3 mL/m 400 C 0.9 g 45.0%
53

Table 3: Experiments table with salts mole fraction and additives
EXP Salts Mol fractions Additives
20 0 0 0 0 21 0 0 0 0 22 0 0 0 0 23 0 0 0 0 24 0 0 0 0 25 0.6 ZnCl2 0.2 NaCl 0.2 KCl 0 26 0.6 ZnCl2 0.2 NaCl 0.2 KCl 0 27 0.6 ZnCl2 0.2 NaCl 0.2 KCl 0 28 0.6 ZnCl2 0.2 NaCl 0.2 KCl 0 29 0.6 ZnCl2 0.2 NaCl 0.2 KCl 0 30 1.0 ZnCl2 0 31 0.4 ZnCl2 0.3 NaCl 0.3 KCl 0 32 0.4 ZnCl2 0.1 NaCl 0.5 KCl 0 33 0.4 ZnCl2 0.5 NaCl 0.1 KCl 0 34 0.5 ZnCl2 0.25 NaCl 0.25 KCl 0 35 0.4 ZnCl2 0.4 LiCl 0.2 KCl 0 36 0.4 ZnCl2 0.3 LiCl 0.3 NaCl 0 37 0.41 KCl 0.59 LiCl 0 38 0.45 ZnCl2 0.55 NaCl 0 39 0.45 ZnCl2 0.55 KCl 0 43 0.4 ZnCl2 0.3 LiCl 0.3 KCl 0 44 0.4 ZnCl2 0.2 LiCl 0.4 NaCl 0 45* 0.4 ZnCl2 0.5 LiCl 0.1 KCl 0 46 0.4 ZnCl2 0.4 LiCl 0.2 NaCl 0 47 0.4 ZnCl2 0.1 LiCl 0.5 KCl 0 48 0.4 ZnCl2 0.5 LiCl 0.1 NaCl 0 49* 0.4 ZnCl2 0.5 LiCl 0.1 KCl 0 52* 0.4 ZnCl2 0.5 LiCl 0.1 KCl 0 53* 0.4 ZnCl2 0.5 LiCl 0.1 KCl 0 54* 0.4 ZnCl2 0.5 LiCl 0.1 KCl 0 56 0.4 ZnCl2 0.5 LiCl 0.1 KCl 0 57 0.4 ZnCl2 0.5 LiCl 0.1 KCl 1.00 g Ni(OH)2 58 0.4 ZnCl2 0.5 LiCl 0.1 KCl 1.00 g ZSM-5 59 0.4 ZnCl2 0.5 LiCl 0.1 KCl 1.00 g Phosphotungstic acid 63 0.4 ZnCl2 0.3 MgCl2 0.3 KCl
54

Table 4: Mass fraction
Sample Mass Fraction
toluene styrene alpha-methyle styrene dimer Others
20 0 0.62671934 0.04000640 0.16288460 0.17038967
21 0 0.48779242 0.02993711 0.14400066 0.33826980
22 0 0.31571644 0.02568793 0.18606850 0.47252712
23 0 0.13887808 0.02368994 0.44685421 0.39057776
24 0.00218707 0.62465849 0.03417369 0.11187844 0.22710231
25 0.00593981 0.62062571 0.03198035 0.06778279 0.27367133
26 0.00564323 0.62134613 0.03205573 0.08470036 0.25625455
27 0.00632200 0.64097628 0.03367270 0.07503850 0.24399053
28 0.00618411 0.64206626 0.03594832 0.08059220 0.23520910
29 0.02907662 0.65931516 0.04705674 0.03677163 0.22777985
30 0.0164364 0.7200822 0.0517608 0.0430712 0.1686494
31 0.0059126 0.7710305 0.0353878 0.1095518 0.0781173
32 0.0028724 0.7803802 0.0310126 0.1192058 0.0665291
33 0.0025664 0.6516678 0.0283418 0.1118872 0.2055367
34 0.0073305 0.7400932 0.039885 0.0861947 0.1264966
35 0.0049733 0.7048434 0.0314736 0.1082459 0.1504638
36 0.0088321 0.7764004 0.0352012 0.1372749 0.0422915
37 0 0.6502999 0.0260282 0.1573124 0.1663595
38 0.0010375 0.7009593 0.0335732 0.139959 0.1244711
39 0.0012323 0.6141044 0.0299156 0.1037864 0.2509613
43 0.0067957 0.7199082 0.0312204 0.0937053 0.1483705
44 0.0001679 0.7179118 0.0358025 0.1660867 0.080031
45 0.004064 0.6878963 0.0321998 0.0973334 0.1785065
55

46 0.0058448 0.6627297 0.0340951 0.1174393 0.179891
47 0 0.6336534 0.0271658 0.1153918 0.223789
48 0 0.5864856 0.0314974 0.0890928 0.2929242
56 0.0121097 0.7437306 0.0401015 0.1050354 0.0990227
57 0.0089728 0.6671153 0.0467599 0.1734192 0.1037328
58 0.001245 0.6068834 0.0503288 0.0526719 0.2888708
59 0 0.3189575 0.0329235 0.0476363 0.6004827
Table 5: Styrene yield
Sample Styrene Yield Error
20 0.438703538 0.0189896
21 0.292675452 0.0147801
22 0.078929110 0.0095662
23 0.034719520 0.0042080
24 0.499726792 0.0189272
25 0.186187713 0.0188050
26 0.186403839 0.0188268
27 0.416634582 0.0194216
28 0.513653008 0.0194546
29 0.593383644 0.0199772
30 0.43204935 0.0189896
31 0.66154418 0.023362
32 0.561093371 0.023646
33 0.563692687 0.019746
34 0.547668969 0.022425
56

35 0.625900948 0.021357
36 0.735251182 0.023525
37 0.533245903 0.019704
38 0.399546784 0.021239
39 0.543482378 0.018607
43 0.666634964 0.021813
44 0.552792083 0.021753
45 0.599157681 0.020843
46 0.553379286 0.020081
47 0.563951504 0.0192
48 0.36831297 0.017771
56 0.545154531 0.022535
57 0.537027791 0.020214
58 0.166892946 0.018389
59 0.04305926 0.009664
57

A.2 GC/MS Results
Figure 41: GC/MS spectrum for sample 20
58

Figure 42: GC/MS spectrum for sample 21
59

Figure 43: GC/MS spectrum for sample 22
60

Figure 44: GC/MS spectrum for sample 23
61

Figure 45: GC/MS spectrum for sample 24
62

Figure 46: GC/MS spectrum for sample 25
63

Figure 47: GC/MS spectrum for sample 26
64

Figure 48: GC/MS spectrum for sample 27
65

Figure 49: GC/MS spectrum for sample 28
66

Figure 50: GC/MS spectrum for sample 29
67

Figure 51: GC/MS spectrum for sample 30
68

Figure 52: GC/MS spectrum for sample 31
69

:
Figure 53: GC/MS spectrum for sample 32
70

Figure 54: GC/MS spectrum for sample 33
71
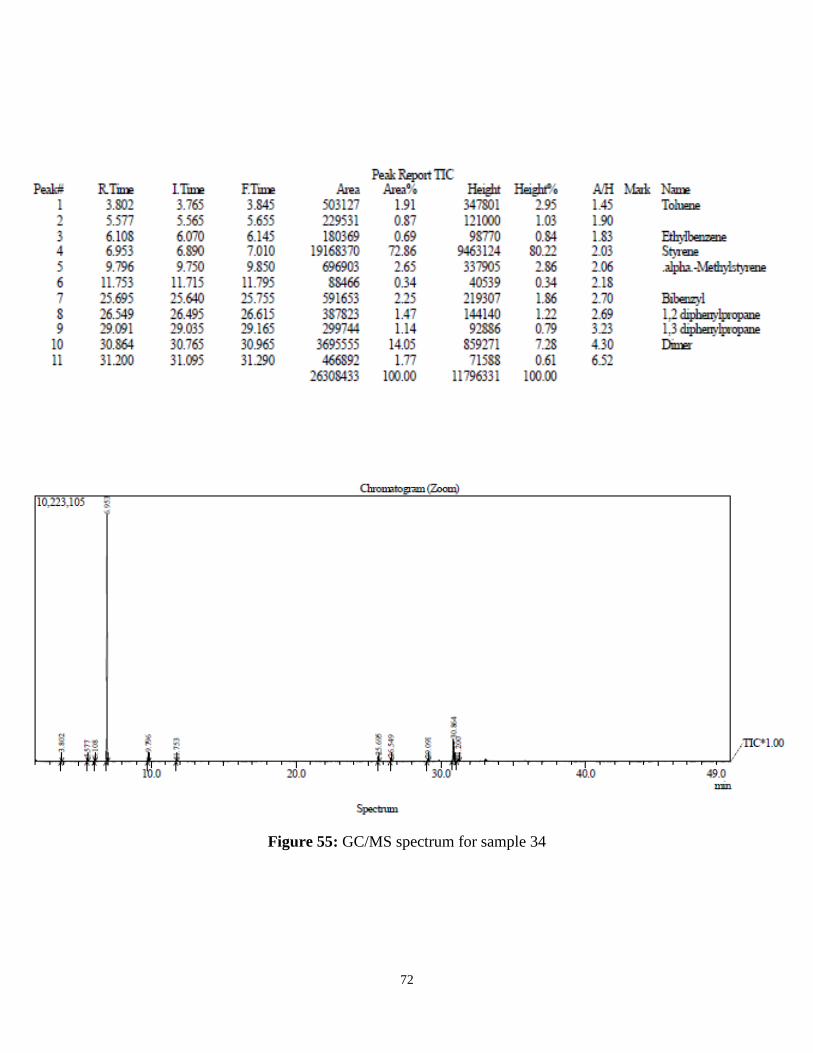
Figure 55: GC/MS spectrum for sample 34
72

Figure 56: GC/MS spectrum for sample 35
73

Figure 57: GC/MS spectrum for sample 36
74

Figure 58: GC/MS spectrum for sample 37
75

Figure 59: GC/MS spectrum for sample 38
76

Figure 60: GC/MS spectrum for sample 39
77
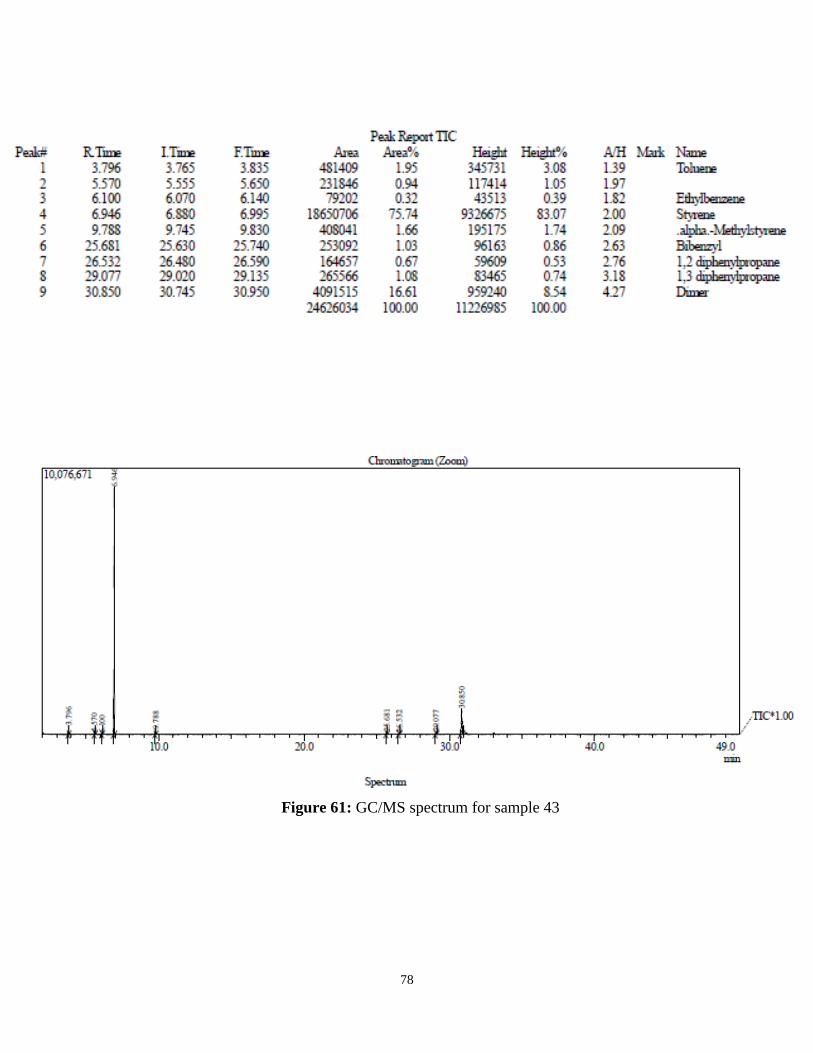
Figure 61: GC/MS spectrum for sample 43
78

Figure 62: GC/MS spectrum for sample 44
79

Figure 63: GC/MS spectrum for sample 45
80

Figure 64: GC/MS spectrum for sample 46
81

Figure 65: GC/MS spectrum for sample 47
82

Figure 66: GC/MS spectrum for sample 48
83

Figure 67: GC/MS spectrum for sample 56
84

Figure 68: GC/MS spectrum for sample 57
85

Figure 69: GC/MS spectrum for sample 58
86

Figure 70: GC/MS spectrum for sample 59
87


